Abstract
Cosmogenic nuclide exposure dating is an important technique for reconstructing glacial histories. Many of the most commonly applied cosmogenic nuclides are extracted from the mineral quartz, meaning sampling of felsic (silica-rich) rock is often preferred to sampling of mafic (silica-poor) rock for exposure dating studies. Fieldwork in remote regions such as Antarctica is subject to time constraints and considerable logistical challenges, making efficient sample recovery critical to successful research efforts. Remote sensing offers an effective way to map the geology of large areas prior to fieldwork and expedite the sampling process. In this study, we assess the viability of multispectral remote sensing to distinguish felsic from mafic rock outcrops at visible-near infrared (VNIR) and shortwave infrared (SWIR) wavelengths using both the Advanced Spaceborne Thermal Emission and Reflection Radiometer (ASTER) and very high-resolution Worldview-3 (WV-3) imagery. We applied a combination of spectral mapping and ground truth from spectral measurements of 17 rock samples from Mount Murphy in the Amundsen Sea sector of West Antarctica. Using this approach, we identified four dominant rock types which we used as a basis for felsic–mafic differentiation: felsic granites and gneisses, and mafic basalts and fragmental hydrovolcanic rocks. Supervised classification results indicate WV-3 performs well at differentiating felsic and mafic rock types and that ASTER, while coarser, could also achieve satisfactory results and be used in concert with more targeted WV-3 image acquisitions. Finally, we present a revised felsic–mafic geological map for Mt Murphy. Overall, our results highlight the potential of spectral mapping for preliminary reconnaissance when planning future cosmogenic nuclide sampling campaigns in remote, unvisited areas of the polar regions.
1. Introduction and Rationale
Rock outcrops that are presently exposed above the ice sheet surface in Antarctica can provide direct evidence for past ice thickness by using cosmogenic nuclide surface exposure dating of their surfaces [1,2,3]. Quartz is often the preferred target mineral for extraction of cosmogenic nuclides because the most commonly measured cosmogenic nuclides (e.g., 10Be, 26Al, 14C) are produced within quartz. Felsic rocks are typically preferred over mafic rocks for cosmogenic nuclide exposure dating studies because felsic rocks are silica rich and often contain minerals such as quartz, feldspars and micas, whereas mafic rocks are iron and magnesium-rich and generally contain little or no quartz. There is, however, potential for extraction of cosmogenic nuclides from other minerals, including those common in mafic rocks such as olivine (in situ 14C; [4]) and pyroxene (10Be; [5]). Developing the ability to remotely differentiate felsic from mafic rocks would enable identification of areas where bedrock lithologies are likely to be favourable for application of a specific target mineral and/or nuclide, permitting forward planning for future exposure dating field campaigns. The geology of the polar regions, especially Antarctica is, however, often sparsely mapped, and many outcrops are extremely challenging to access [6]. Thus, in some areas, virtually nothing is known about the composition of the outcropping rocks.
Remote sensing is an effective alternative way to characterise the geology of such areas because it is capable of covering large areas and can be undertaken both rapidly and safely in regions where it is logistically challenging to conduct fieldwork [7]. It therefore has the potential to be used to make a preliminary determination of an area’s suitability for retrieval of samples suitable for cosmogenic nuclide analysis. However, remote sensing in polar regions faces numerous challenges, including steep topography combined with low elevation sun angles [8], limited and varied exposure of rock outcrops, and persistent cloud cover [7]. Despite these challenges, medium-resolution imagery acquired from the Antarctic Peninsula by the Advanced Spaceborne Thermal Emission and Reflection Radiometer (ASTER) has demonstrated that remote sensing can refine existing geological knowledge in sparsely mapped polar regions [9,10]. The launch of the very high-resolution Worldview-3 (WV-3) satellite in 2014 permits mapping at a spectral resolution that rivals ASTER, but in much better spatial resolution at both visible-near infrared (VNIR) and shortwave infrared (SWIR)—1.24/3.7 metres per pixel [11], enabling more detailed lithologic mapping of smaller nunataks that previously could not be well-resolved using lower resolution ASTER imagery (VNIR/SWIR—15/30 metres per pixel).
In this study, we focus on Mount Murphy, a large volcanic edifice located in the Amundsen Sea Sector of the West Antarctic Ice Sheet (WAIS) adjacent to Pope Glacier (Figure 1a). This peak comprises lithologies ranging from felsic to mafic and covers an area of ~35 × 45 km [12]. Mt Murphy was visited in 2015–16 for a cosmogenic nuclide sampling campaign [2] and much of its geology is well-described from earlier visits [13,14,15,16], providing reliable ground truth for this study. Some areas of the Mt Murphy massif, however, remain sparsely mapped, providing an opportunity to refine existing geological knowledge. This study therefore aims to assess the potential of spectral mapping for characterising the suitability of unvisited outcrops for cosmogenic nuclide exposure dating and improve our existing knowledge of Mt Murphy’s geology. Its objectives are fourfold:
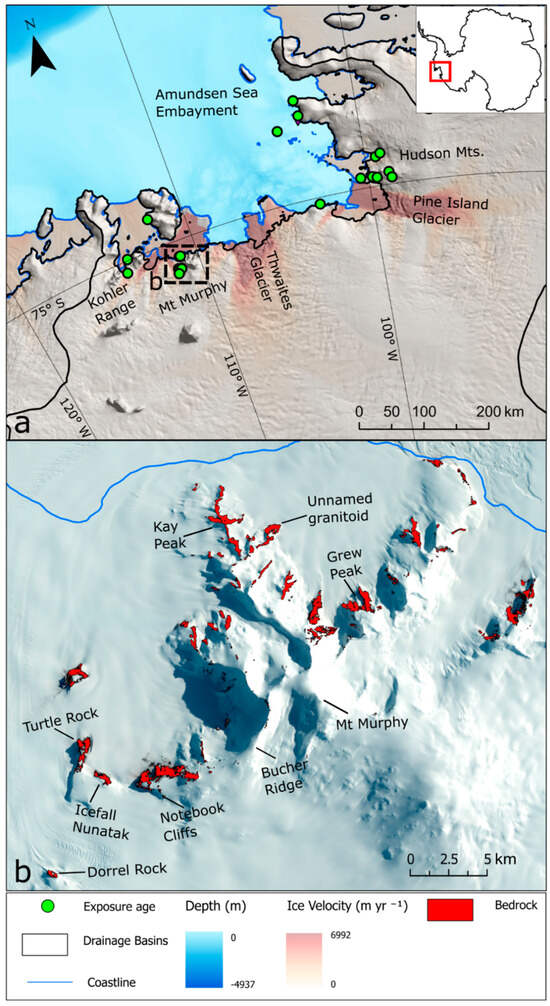
Figure 1.
(a) Map showing locations of major glaciers and nunataks previously visited on cosmogenic nuclide sampling campaigns. Green dots indicate the locations of samples collected on previous fieldwork which have provided exposure ages. Hillshade is derived from the Reference Elevation Model of Antarctica (REMA) [17]. Regional bathymetry from [18] and Antarctic coastline sourced from the Antarctic Digital Database (ADD), v 7.7. Black lines depict ice sheet drainage basins and grounding line position [19]. Map of Antarctica (inset) showing location of Amundsen Sea Embayment. (b) Landsat-9 image of Mt Murphy highlighting exposed rock outcrops (shown in red), along with key locations mentioned in the text. Rock outcrop extents are from the ADD [20].
- (i)
- Obtain spectral reflectance measurements from previously collected rock samples from Mt Murphy to provide ground truth for satellite-based spectral mapping results.
- (ii)
- Investigate the capabilities of ASTER and WV-3 imagery for spectral geological analysis, with focus on specific areas of Mt Murphy.
- (iii)
- Assess supervised classification techniques for felsic-mafic rock separation at Mt Murphy using endmembers extracted from the imagery and from laboratory spectra.
- (iv)
- Produce a revised felsic-mafic geological map of Mt Murphy through integration of supervised classification, manual mapping techniques and existing ground truth.
2. Background
2.1. Remotely Sensed Datasets
ASTER VNIR-SWIR and WV-3 VNIR and SWIR datasets were selected for this study due to their proven superior spectral coverage and spectral resolution over SWIR wavelengths compared to other optical satellites such as Landsat-9 and Sentinel-2 [11,21,22].
ASTER is a polar orbiting imaging system aboard the Terra spacecraft, with a 60 km image swath with three subsystems operating in VNIR, SWIR and Thermal Infrared (TIR). It possesses three bands in the VNIR wavelength region with a spatial resolution of 15 m, six bands in the SWIR region at 30 m spatial resolution, and five bands in the TIR region at 90 m spatial resolution (Table 1). Since its launch in 1999, ASTER has been used routinely for lithologic mapping [21,23,24,25,26], including in remote polar regions [10,24,27]. ASTER has also proven effective for separating felsic intrusive and extrusive rock types from more mafic and sedimentary lithologies, improving existing geological mapping coverage [9,10,27]. However, these previous geological mapping studies relied on the full suite of ASTER instruments including the TIR which is not feasible for mapping smaller (<100 m) rock exposures. Sub-pixel techniques have had some success in classifying felsic (Al-rich) minerals in polar regions at VNIR-SWIR wavelengths, but resolving Fe3+, Fe2+ and Mg-rich mafic pixels has proven more challenging [24].

Table 1.
Characteristics and wavelengths detectable by the Advanced Spaceborne Thermal Emission and Reflection Radiometer. After [28].
WorldView-3 (owned by Maxar and launched in 2014) is a very-high resolution sensor (Table 2 and Table S1) supplying commercial imagery, with a narrow 13 km swath. WV-3’s capabilities include at nadir 1.24 m per pixel spatial resolution in eight VNIR bands and 3.7 m per pixel resolution in eight SWIR bands (often re-sampled to 2 m and 7.5 m per pixel resolution, respectively). VNIR bands of both ASTER and WV-3 sensors are positioned to resolve spectral absorption features of minerals containing ferric (Fe3+) iron, such as goethite, and ferrous (Fe2+) iron, such as chlorite (see Figure S4). In addition, Al-OH, Fe/Mg-OH and CO32− spectral absorption features can be discriminated across several narrow SWIR wavelengths enabling differentiation of the minerals muscovite, epidote, chlorite, and calcite [11,21,22]. One key spectral difference between the two sensors is the position of the WV-3 SWIR band 1 at 1.2 μm (Table 2), effective for identifying minerals with Fe2+ absorption features [29]. Assessments of spectral mapping capabilities of WV-3 have validated its potential for discriminating between lithological units based on their Fe3+, Fe2+, Al-OH, Fe/Mg-OH and CO32− absorption [11,22]. WV-3 VNIR-SWIR imagery has been used in commercially focused mineral mapping studies at mid-low latitudes [30,31], but WV-3 imagery has not been used extensively in polar environments because commercial prospecting is either not permitted there (Antarctica) or is less common. Worldview VNIR imagery has, however, been applied in Antarctica to delineate land cover areas such as snow/ice, water bodies and landmass, and for vegetation mapping [8,32] and mapping of glacial landforms [33].
Table 2.
Characteristics and wavelength ranges detectable by WorldView-3. After [11].
In summary, using ASTER in conjunction with WV-3 SWIR is a useful approach. ASTER’s 60 km swath and open-source imagery mean it can be applied cheaply to map large areas but lacks the spatial resolution to discern smaller outcrops. WV-3 has a narrow 13 km swath and is only commercially available, but its high spatial resolution means it can be deployed to acquire targeted spectral information which may be challenging to extract from an ASTER image.
2.2. Geology of Mount Murphy
This study focuses on Mount Murphy, a volcano located on the eastern periphery of Marie Byrd Land in the Amundsen Sea sector of West Antarctica. Marie Byrd Land comprises a ~50 km thick attenuated continental lithosphere [34] and is one of several uplifted crustal blocks intersected by the West Antarctic Rift system, which together make up the geologically complex region of West Antarctica [35]. During the Palaeozoic, regional convergence of oceanic and continental crust and resultant subduction led to several pulses of granitoid magmatism and metamorphism within Marie Byrd Land [14,36]. More recent Cenozoic magmatism formed Mt Murphy and 17 other large volcanoes distributed over a 500 × 800 km volcanic dome at the centre of Marie Byrd Land [37].
Mt Murphy consists of a main volcanic edifice emplaced over a north sloping block of much older pre-volcanic basement [15]. The site has been mapped and described in previous work focused on Mt Murphy’s eruptive and tectonic history [12,13,15,16,37] and more recently with focus on its glacial history [2,38,39,40]. Observations from field expeditions associated with these studies provide a good measure of Mt Murphy’s general geological characteristics. Mt Murphy’s northern section, including Kay Peak (Figure 1b), consists of a pre-volcanic metamorphosed basement and at least one large granitoid intrusive [14]. Outcrops surrounding Mt Murphy on its west and southwest flanks (Hedin Nunatak, Turtle Rock, Icefall Nunatak and Notebook Cliffs; Figure 1b) are all composed of mafic basalt lava flows and hydrovolcanic fragmental rocks, formed during volcanic eruptions dating from 9.5–0.6 Myr ago [12]. An additional large mafic intrusive to the south of Mt Murphy, Dorrel Rock, is composed of Oligocene gabbro [16]. Several smaller mafic parasitic cones formed of tuff and scoria are also present at the site [15]. The upper reaches of Mt Murphy (above 1900 m elevation) are comprised of volcanic rocks of intermediate-to-felsic composition [12,37]. However, much of the edifice remains sparsely mapped, especially at higher elevations, where many outcrops have never been visited and whose observation has previously relied on binocular observations.
2.3. Reference Geological Framework
We now describe mineral absorption and emissivity features, how they are discernible to the satellite sensors used in this study, and how these factors influenced our approach to compiling a reference geological map to validate remote sensing-based results. The mineral quartz (desirable for cosmogenic nuclide exposure dating; Section 1) is directly detectable by spectral absorption features at TIR wavelengths (8–14 μm) caused by asymmetric Si-O stretching vibrations within the mineral lattice [41]. However, the high latitude of Mt Murphy (>75°S) results in a weak emissivity signal, leading to TIR images with poor signal-to-noise ratio (SNR). As such, discrimination of quartz by the ASTER and WV-3 sensors is restricted to characterising felsic rock (silica/quartz-rich) at VNIR-SWIR wavelengths.
Felsic minerals such as muscovite can be distinguished at VNIR-SWIR wavelengths due their high reflectance and the vibrational transition of hydroxyl (OH− ions) resulting in an Al-OH absorption feature at 2.2 μm [42]. Conversely, mafic rocks display low albedo because they are composed largely of dark coloured minerals such as olivine, amphibole/hornblende, pyroxene, chlorite, and biotite which have distinct absorption features at VNIR-SWIR wavelengths. Chlorite and epidote can be detected by their ferrous iron (Fe2+) absorption due to crystal field effects [9]. Chlorite, epidote, and hornblende also display an absorption feature at a wavelength of 2.33 μm, centred on ASTER band 8 [21] and WV-3 SWIR band 8 [11]. Additionally, a charge transfer feature enables detection of ferric iron (Fe3+) at VNIR wavelengths from 0.5 to 0.7 μm [43]. Iron oxides and hydroxides are associated with weathering of both felsic and mafic minerals and can help identify weathered mafic rocks based on their high iron content [44].
To provide an effective validation tool for lithologic differentiation based on ASTER and WV-3 VNIR-SWIR imagery, we compiled a reference geological map (Figure 2) based on a geological map updated from field observations and previous studies [2,13,14,15,37]. We simplified current understanding of Mt Murphy’s geology into two fundamental classes: felsic (silica-rich) and mafic (silica-poor). We follow a felsic-mafic classification scheme to categorise rock types based on their percentage silica content where we separate felsic rock types which are ≥65% silica content (basement lithologies) and/or >58% (Mt Murphy felsic-intermediate volcanics) from mafic rock types ≤ 45% silica content. Our felsic-mafic classification scheme is a useful metric because felsic and mafic minerals can be discriminated from each other based on their spectral properties [42,45]. Rock types at Mt Murphy that fall into the felsic class include previously mapped basement rocks such as granite and gneiss, and previously mapped felsic-intermediate volcanic rocks such as trachyte, which is mostly found at high elevations (>1900 m asl). The mafic class broadly contains igneous rocks with higher ferromagnesian mineral content (Fe, Mg) including volcanics such as basalts and hyaloclastites, pyroclastic cones consisting of scoria and tuff, and mafic intrusive rocks such as gabbro. We classified unvisited outcrops or those not previously identified as felsic or mafic as a third category.
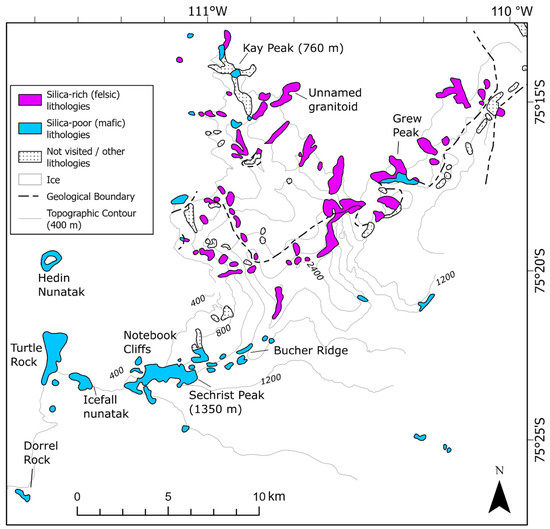
Figure 2.
Mount Murphy reference geological map which represents ground truth at Mt Murphy, serving as a basis for remote sensing results in the present study. Nomenclature has been adapted and simplified to differentiate silica-rich (felsic) from silica-poor (mafic) lithologies using spectral mapping techniques in the VNIR-SWIR range (0.4–2.5 μm). Rock polygons downloaded from ADD. Contours (400 m) generated using the REMA [17]. Some geological units previously distinguished separately as evolved volcanic rocks and pre-volcanic basement are here combined as silica-rich (felsic) units.
We focused our spectral mapping predominantly on two areas of Mt Murphy: Kay Peak and an un-named granitoid outcrop to the north, and the area of Notebook-Icefall-Turtle Rock to the southwest of the main edifice (Figure 2). The motivation for selecting these areas for more detailed spectral analysis is twofold: (1) there is full cover of medium resolution ASTER and very-high resolution WV-3 VNIR and SWIR imagery across these areas, and (2) the case study locations have been the subject of previous fieldwork (Figure 3). Rock samples from these locations already exist, and they can be measured for spectral reflectance to validate remote sensing observations without the need for additional fieldwork. The Kay Peak area is lithologically complex, comprising felsic, intermediate and mafic rock types including intrusive granite and gneiss basement, a yellow diamict and basalt emplaced over lighter felsic basement rock (Figure 3a). The gneiss (Figure 3b) is also intersected by microgranite sheets [14]. To the southwest of the main Mt Murphy volcanic edifice, the mafic nunataks Turtle Rock, Icefall Nunatak and Notebook Cliffs (Figure 3) have been well mapped by previous fieldwork [13,15]. Mafic rocks are challenging to distinguish from each other and other rock types with low albedo (including sedimentary rocks) using remote sensing-based techniques [10,46]. From field observations [15] and field photos (Figure 3c,d) we know there are sequences of basalt and fragmental hydrovolcanic rocks present in the study area, and so we also investigated the feasibility of differentiating these two lithologies at VNIR-SWIR wavelengths.
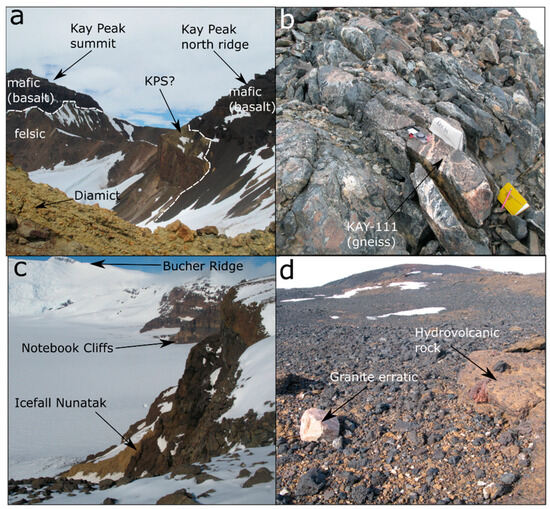
Figure 3.
Field photos of Mt Murphy showing Kay Peak (a,b) and Turtle Rock, Icefall Nunatak and Notebook Cliffs areas (c,d). (a) Kay Peak viewed facing south from the ridge extending northward from Kay Peak showing darker mafic/basalt volcanic rock emplaced over lighter felsic/gneiss basement; contact is indicated by white dashed lines. (b) Outcrop of felsic gneiss at Kay Peak ridge (north), including sample KAY-111. (c) View from Icefall Nunatak (foreground) looking eastwards to Notebook Cliffs and Bucher Ridge. Distinctive light orange bands visible at Notebook Cliffs are similar to hydrovolcanic/hyaloclastite deposits described elsewhere [47] (d) Summit of Notebook Cliffs showing a mixture of light-orange hyaloclastite breccia, darker basalt, and a granite erratic. Images from ANiSEED 2015–2016 Field Report [2].
3. Methods
3.1. Reflectance Spectroscopy of Mount Murphy Rock Samples
Directly measuring the reflectance properties of rock samples recovered from Mt Murphy provides ground truth to inform spectral analysis of both ASTER and WV-3 imagery. We acquired reflectance spectra of 17 rock samples from Mt Murphy (Figure 4). We selected rock samples representative of Mt Murphy’s previously described geology which had been collected on previous field expeditions to Mt Murphy in the 2015–16 and 1990–91 field seasons as part of the ANiSEED and SPRITE projects [2,14,15]. Most samples (n = 13) had been collected during the ANiSEED project with the position of each sample recorded using a Trimble 5700 GPS receiver set at the same height as the sample’s upper surface. Our rock samples consisted of granites, gneisses, and basalts, and a fourth group incorporating tuffs and hyaloclastite, which we broadly grouped as ‘fragmental hydrovolcanic’ rocks.
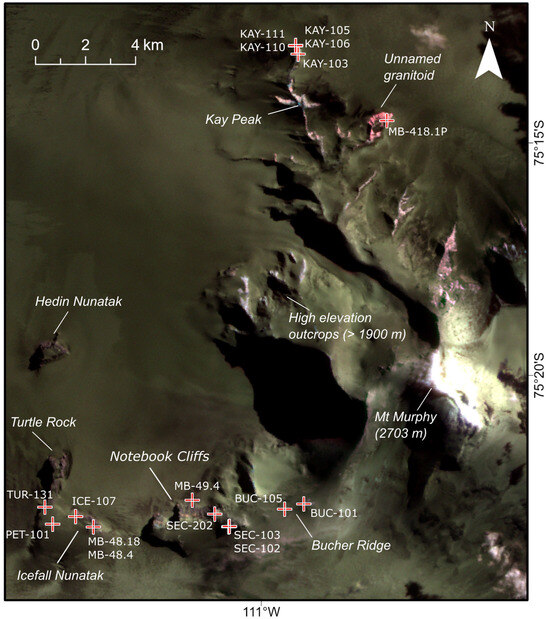
Figure 4.
Locations of Mt Murphy rock samples measured for spectral reflectance (red crosses) overlain on ASTER SWIR false colour composite (468). Field locations discussed in the text are also indicated.
We measured rock sample reflectance spectra using a Spectral Evolution PSR 3500+ spectroradiometer [48] in a dark optical calibration laboratory at the NERC (Natural Environment Research Council) Field Spectroscopy Facility (FSF). The PSR 3500+ provides a high-resolution spectral range from 0.35 to 2.5 μm and is compatible with ASTER and WV-3 VNIR and SWIR band coverage (for detailed methods see Supplement S1). We performed post-processing of laboratory spectra using SpectraGryph v1.2.15—Optical Spectroscopy Software [49] and Python 3—Jupyter Notebooks, generating 17 reflectance profiles which were compiled into a new spectral library for Mt Murphy [50]. To provide mineralogic context for rock spectra, we inspected thin-section photomicrographs of selected samples in plane-polarised and cross-polarised light to identify the mineralogical composition of each sample, which also served as further validation for our satellite-based observations. Finally, we convolved the spectral profiles of Mt Murphy samples to the system response functions of both the ASTER VNIR/SWIR and WV-3 VNIR/SWIR band passes, permitting analysis of characteristic mineral absorption features from the Mt Murphy laboratory spectra visible to the WV-3 and ASTER sensors.
3.2. Multispectral Image Pre-Processing
We purchased commercial WV-3 L2a VNIR and SWIR imagery from DigitalGlobe products, © WorldView-3 DigitalGlobe, Inc. (London, UK), a Maxar company, Westminster, Colorado. WV-3 VNIR imagery was acquired from the DigitalGlobe archive and WV-3 SWIR imagery was specifically tasked. We downloaded open-source ASTER 07XT crosstalk corrected surface reflectance imagery from the online Data Pool courtesy of the NASA EOSDIS Land Processes Distributed Active Archive Center (LP DAAC), USGS Earth Resources Observation and Science (EROS) Center, Sioux Falls, South Dakota [51]. Image metadata including image acquisition dates are specified in Table S1. Image pre-processing steps, delineation of rock outcrops and subsequent techniques applied to ASTER 07XT and WV-3 L2a VNIR and SWIR imagery are outlined in Figure 5. We performed image pre-processing using ENVI and ArcGIS Pro v3.3 software. A detailed description of the image pre-processing steps can be found in Supplement S1.
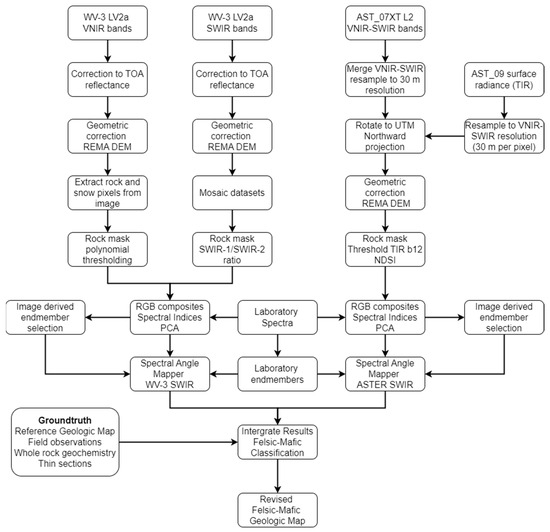
Figure 5.
Flow chart summarising pre-processing steps and spectral analysis of laboratory spectra, WV-3 and ASTER datasets for mafic-felsic classification and mapping of Mt Murphy. Spectral mapping and classification techniques are explained in Section 3.3 and in detail in Supplement S1.
3.3. Spectral Mapping and Classification Methods
Following pre-processing, we used spectral mapping techniques to identify felsic-mafic endmember pixels from the imagery before correlating these pixels to our geolocated laboratory spectra. Spectral mapping refers to a set of statistical and algebraic methods used to classify and extract different classes of materials in an image based on their image spectral signature [7]. When using ‘broad band’ imagery such as WV-3 and ASTER VNIR-SWIR, such classification is limited to discrimination of lithologies based on distinct spectral absorption features caused by major mineral groups, most of which are wavelength dependent. Prior to spectral mapping, we applied a linear contrast enhancement to stretch image pixel values and make use of the full data value range for each image. Subsequent spectral mapping techniques included commonly adopted image processing techniques such as colour composites, applying spectral indices including Relative absorption Band Depth (RBD) [11,21] and Principal Component Analysis (PCA) [23]. A detailed explanation of the spectral mapping techniques applied in this study is provided in Supplement S1.
To classify image pixels with similar spectral signatures in ASTER and WV-3 imagery, we applied the Spectral Angle Mapper (SAM) algorithm [52] to the previously identified endmember felsic (granite, gneiss) and mafic (basalt, hydrovolcanic) reference spectrum. SAM is a supervised classification technique that determines the spectral similarity between two spectra by calculating the angle between them, permitting the rapid mapping of image spectra to reference spectra. The SAM algorithm utilises the vector direction and not the length of the vector to determine its classification (Figure S2), resulting in spectral classifications that are less impacted by variations in absolute illumination (sun angle/slope/detector/off-nadir angle or shading) than classifications made using other spectral matching algorithms [53]. Output class images, representing spectral angular similarity between reference and target spectra, were generated using both endmember pixels extracted from the image and endmember laboratory reflectance spectra.
4. Results
4.1. Mount Murphy Reflectance Spectroscopic Analysis
First, we describe the spectral profiles of rock samples previously collected from the Mt Murphy study area (Figure 4 and Figure 6, Supplement S4) which provide ground validation for remotely sensed results and interpretations. Photomicrographs of thin sections from selected samples provide additional context for interpretation of mineral assemblages (Figure 7). The spectra we derived from felsic rocks from Mt Murphy, such as granite sample MB.418.1P and the granite/aplite KAY-103, display high to moderate albedo, indicating the presence of felsic minerals, and a strong Al-OH absorption feature at 2.2 μm associated with the mineral muscovite (Figure 6a, Supplement S4). Muscovite occurs in association with quartz and plagioclase in MB-418.1P (Figure 7c,d), with some mineral grains displaying evidence of alteration. In the spectra of gneisses, KAY-106 and KAY-111, a steep increase in reflectance from 1.2 to 1.8 μm wavelength is associated with a broad ferrous (Fe2+) charge transfer feature. Spectra from these samples also display moderate absorption features at 2.33 μm and 2.4 µm (Figure 6b). The spectral profile of KAY-111 closely resembles biotite from 0.5 to 1.9 μm, which exhibits a relatively steep increasing slope from 1.2 to 1.8 μm, and so we attribute the Fe2+ charge transfer feature to numerous dark brown biotite crystals observed in thin sections of sample KAY-111 (Figure 7a,b). The presence of biotite is also consistent with previous observations describing Kay Peak ridge gneiss as a biotite gneiss (see Figure 3b). The Fe/Mg-OH absorption feature observed at 2.33 μm in the gneiss rock spectra could be associated with chloritization of primary biotite grains and the presence of hornblende (Figure 7a). The moderate absorption features at 2.33 μm and 2.4 µm also closely resemble the spectral profile of plagioclase [54]. Plagioclase is also observed in the gneiss thin sections (Figure 7a,b). Therefore, it is likely a combination of both biotite and plagioclase which contribute to the spectral signature of whole rock samples.
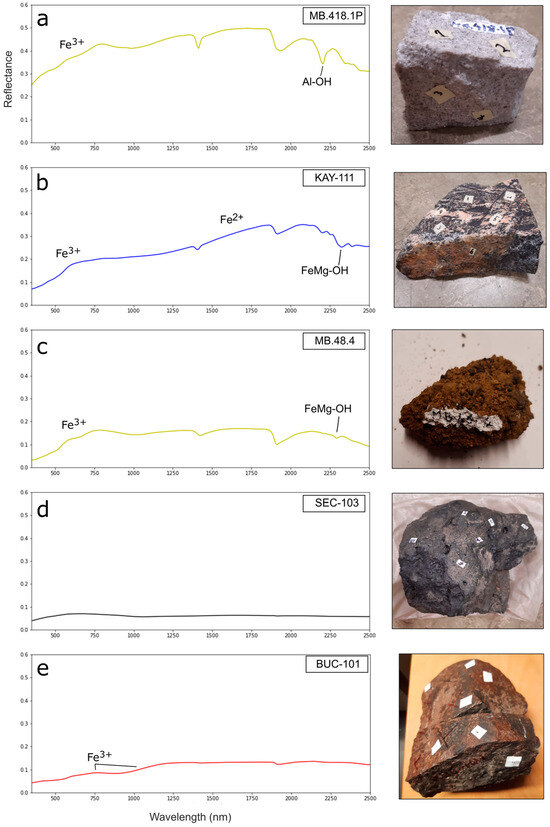
Figure 6.
Spectral profiles and sample photos of the main rock types identified at Mt Murphy highlighting key spectral features used for lithologic discrimination of granite (a), gneiss (b), hydrovolcanic rock (c), basalt (d), and weathered basalt (e). Spectral profiles and associated whole rock photos of all Mt Murphy specimens can be viewed in Supplement S4.
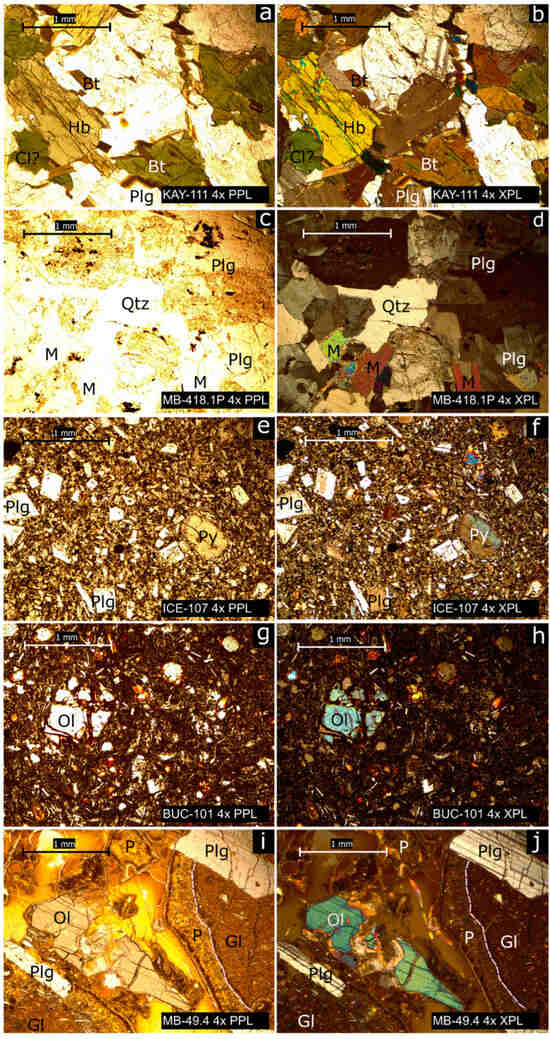
Figure 7.
Photomicrographs of Mt Murphy rock specimens: gneiss—KAY-111 (a,b), granite—MB-418.1P (c,d), basalt—ICE-107 (e,f), weathered basalt—BUC-101 (g,h), and fragmental hydrovolcanic rock—MB-49.4 (i,j) in plane-polarised (PPL) and cross-polarised light (XPL). Bt—biotite, Cl—chlorite, Gl—glass, Hb—hornblende, M—muscovite, Ol—olivine, P—palagonite, Plg—plagioclase, Py—pyroxene and Qtz—quartz. Sample name, polarisation and scale shown on each panel. The white dashed lines in panels (i,j) indicate the border between fresh glass (Gl) and altered glass/palagonite (P).
Rock spectra profiles of the basalt samples (SEC-103, SEC-102 and TUR-131) are flat and exhibit low albedo (Figure 6d) due to the relative abundance of darker mafic minerals including pyroxenes and olivine (Figure 7e,f). Basalt samples SEC-202 and ICE-107 show a moderate increase in reflectance from 0.5 to 0.7 µm wavelength, indicative of ferric iron (Fe3+) which is associated with oxidation products such as the mineral goethite. SEC-202 and ICE-107 are slightly weathered and have glacial striae on their surfaces, showing evidence of glacial polish. BUC-101—a heavily weathered basalt containing large fragmented olivine phenocrysts set within a reddish groundmass (Figure 7g,h)—displays a prominent stepped rise in reflectance from ~0.5 to 0.7 µm and from ~0.85 to 1.2 µm, indicative of more intense Fe3+ absorption in these parts of the spectrum. In the present study, the fragmental hydrovolcanic rock spectra exhibit a more marked rise in reflectance from VNIR to SWIR wavelengths than the fresh and weathered basalts. Our spectroscopy results also indicate that polished basalt samples have a spectral profile similar to that of fresh basalt (Figure S3). Fragmental hydrovolcanic spectra also display stronger absorption features at wavelengths of 1.4 μm and 1.9 μm. These are likely associated with the presence of hydrated minerals. Notably, sample MB 48.4 has an absorption feature at ~2.29 µm (Figure 6c), suggesting the presence of nontronite, an Fe-rich smectite [55]. This is consistent with petrographic examination of this hydrovolcanic sample, MB.49.4, which shows alteration of darker volcanic glass to orange-brown palagonite (Figure 7i,j), an alteration product of basalt which contains smectite [56]. For an in-depth discussion of the impact of weathering on spectral profiles of Mt Murphy samples, refer to Supplement S2.
Results of Convolving Mt Murphy Rock Spectra
Mt Murphy rock spectra were convolved to the ASTER and WV-3 waveband ranges to enable comparison of endmember spectra from Mt Murphy rock types (granite, gneiss, hydrovolcanic rocks, and basalt) at the resolution of ASTER and WV-3 sensors. Certain mineral absorption features and variations in albedo are resolved by ASTER and WV-3 wavebands (Al-OH absorption feature and overall brightness) and serve as a basis for discrimination of felsic and mafic endmember lithologies. When resampled to ASTER and WV-3 wavebands (Figure 8a,c), the granite, gneiss, fragmental hydrovolcanic rock, and basalt rock spectra are still distinguishable from one another (Figure 8b,d). The double absorption feature observed in the gneiss rock spectra when resampled to WV-3 wavelengths is visible as a decrease in reflectance at 2.2 μm, steepening at 2.3 μm (Figure 8c), while at ASTER wavelengths, it remains distinguishable as a single absorption feature (Figure 8d). The most notable feature in the gneiss spectrum, however, is the large Fe2+ charge transfer feature from 1.2 to 1.8 μm retained in WV-3 and to a lesser extent ASTER spectral profiles, indicating that gneiss samples from Kay Peak are iron-rich and that this is detectable in both the ASTER and WV-3 imagery. Discrimination of the mafic endmember lithologies (basalt and hydrovolcanic rock) is more challenging because they display similar absorption features at WV-3 and ASTER wavelengths. The broad rise in reflectance from 0.5 to 0.7 μm in moderately weathered basalt (SEC-202, ICE-107) and 0.85 to 1.2 μm in heavily weathered basalt (BUC-101) is well-resolved in the convolved WV-3 spectral profiles due to the relatively high spectral resolution of the WV-3 sensor at VNIR wavelengths. The moderate absorption feature at 2.29 μm associated with Fe-rich phyllosilicates such as smectite [55] is discernible as a broadband Fe/Mg-OH absorption feature in broadband WV-3 imagery and can potentially serve as a means to discriminate fragmental hydrovolcanic rock from basalt.
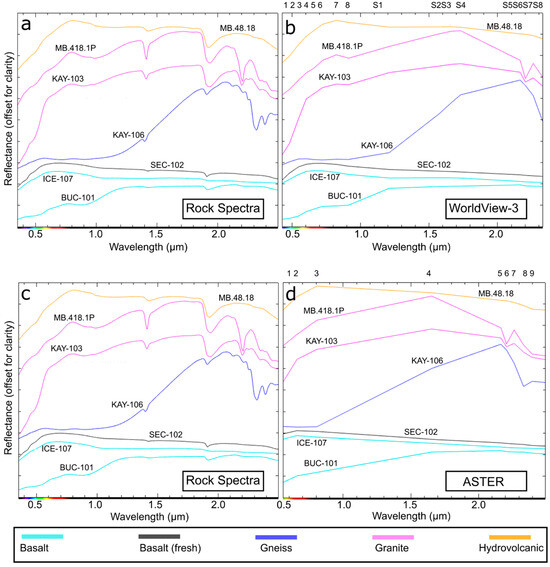
Figure 8.
Mt Murphy sample rock spectra profiles (a,c) resampled to VNIR-SWIR Worldview-3 sensor bandpass (b) and ASTER bandpass (d). Panel (a) and Panel (c) show the same spectral profiles to make comparisons to WV-3 and ASTER convolved spectra clearer.
In summary, our observations from the resampled spectral rock profiles have the following implications for remote mapping of Mt Murphy rock types using WV-3 and ASTER multispectral imagery:
- (i)
- Spectral discrimination of granitic rock from mafic rock is achievable due to the high albedo of granitoids and the Al-OH mineral absorption feature at 2.2 µm, associated with muscovite.
- (ii)
- Gneiss can be detected using its increased reflectance at 1.2–1.8 μm wavelengths, associated with increased Fe2+ absorption (produced by the presence of biotite) and a broadband Fe/Mg-OH absorption feature at 2.33 μm, which implies the presence of chlorite and hornblende (both minerals are common in gneissic rocks).
- (iii)
- Basalt has low reflectance in general, but weathered basalt exhibits raised reflectance at 0.5–0.7 μm associated with increased Fe3+, and so can be distinguished from fresh/polished basalt.
- (iv)
- Combined mapping of Fe3+ at VNIR wavelengths and detection of Fe-rich smectite (nontronite) ~2.29 µm as a broadband Fe/Mg-OH absorption feature provide a basis for successful differentiation of basalt and fragmental hydrovolcanic rock.
4.2. Mount Murphy Spectral Mapping Case Studies
To identify endmember pixels suitable for spectral classification, we applied spectral mapping techniques to ASTER and WV-3 VNIR/SWIR imagery from two sites at Mt Murphy: Kay Peak and Turtle Rock (see Figure 1 and Figure 4). These techniques included generating targeted colour composites, spectral indices such as RBD ratios, and PCA (see Supplement S1 for detailed methods).
4.2.1. Case Study 1: Kay Peak and Granitoid Outcrop
Here, we describe remote sensing results from the Kay Peak study area, consisting of Kay Peak, its surrounding ridges and an unnamed granitoid outcrop 3 km southeast of Kay Peak (see Figure 4). Contrast-enhanced red-green-blue (RGB) composites helped identify the main lithologic groups in the Kay Peak study area. The most useful RGB colour composites were WV-3 VNIR 732 and WV-3 SWIR 368 false colour composites (FCC) and ASTER SWIR 468 FCC. Band ratios were useful for displaying the intensity of ferric (Fe3+) and ferrous (Fe2+) absorption, and targeted RBD ratios pinpointed Al-OH and Fe/Mg-OH absorption features at 2.2 μm and 2.33 μm, respectively (Figure 9 and Figure 10).
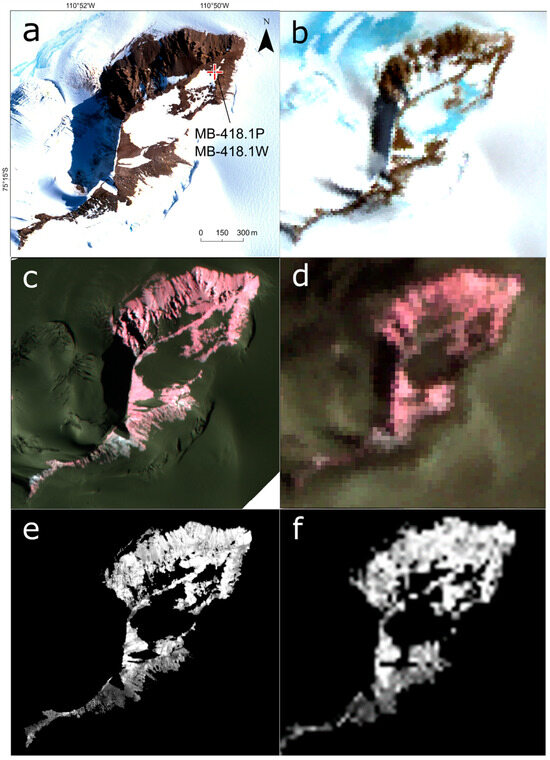
Figure 9.
(a) WV-3 VNIR 532 contrast-enhanced true colour composite showing approximate GPS location (red cross) of MB-418.1P and MB-418.1W. (b) ASTER VNIR 321 image (15 m resolution). (c) WV-3 SWIR 368 false colour composite (contrast-enhanced). (d) ASTER 468 false colour composite showing equivalent to (c) at ASTER spatial resolution; the pink tone in both images is associated with intense hydrated mineral absorption from the Al-OH bond stretch. (e) WV-3 Al-OH RBD index (bS5 + bS7)/bS6, bright pixels indicate intense absorption at 2.2 μm associated with muscovite. (f) ASTER Al-OH RBD index (b5 + b7)/b6 showing equivalent to (e) at ASTER 30 m spatial resolution.
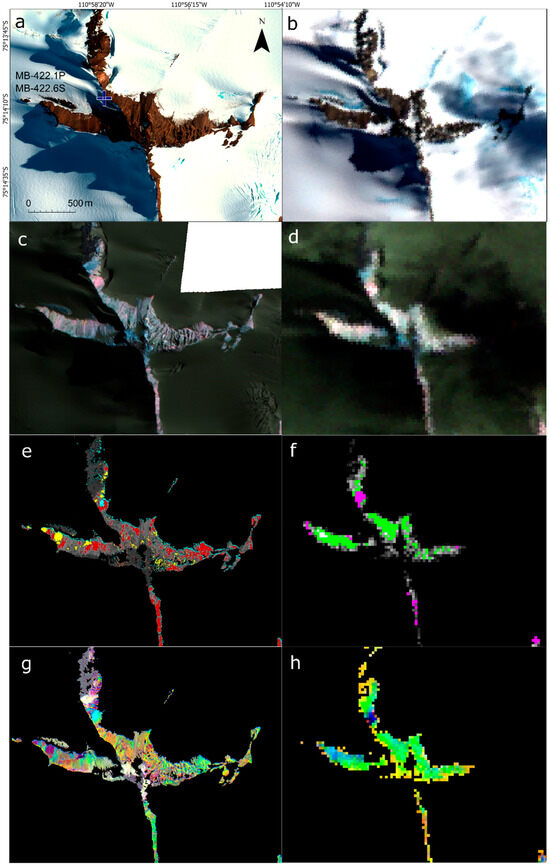
Figure 10.
Kay Peak composite including (a) WV3-VNIR 732 FCC, displaying scale and approximate GPS location of rock sample (blue cross) for which whole rock geochemical analysis has been performed in a previous study. (b) ASTER 321 FCC. (c) WV3-SWIR 368 FCC. (d) ASTER 468 FCC (showing hydrated minerals in pink tones and mafic rocks in blue tones). (e) WV-3 SWIR spectral index composite (thresholded to show 90th percentile) of Al-OH (red), Fe/Mg-OH (yellow) and hydrated minerals with absorption centred around 2.16 µm (blue). (f) ASTER spectral index composite (thresholded to show 90th percentile) of hydrated minerals (pink) and ferrous minerals (green). (g) WV-3 SWIR PCA composite of PCs 568 (Table S4) and (h) ASTER FCPS image (bands 1469) targeting smectite/kaolinite (Tables S6 and S7).
Spectral mapping of the unnamed granitoid reveals that the outcrop exhibits high albedo, especially in the SWIR wavelength range, and strong Al-OH absorption (Figure 9). Remote sensing observations are consistent with lab spectroscopy results, which also show strong Al-OH absorption (sample MB-418.1P, previously collected from the outcrop) and the presence of muscovite, quartz, and feldspar in sample thin section. The geology of Kay Peak is more complex, with evidence for a variety of mafic and felsic rock types (Figure 10). The northernmost section of the ridge extending north from Kay Peak is characterised by very high reflectance, Fe/Mg-OH absorption (Figure 10e) and high Fe2+ spectral index values (Figure 10f). The combined spectral signatures of high Fe2+ values and Fe/Mg-OH absorption indicate the presence of biotite and Fe and Mg-rich hydrated secondary mafic minerals, such as chlorite and hornblende, consistent with the mineralogy of gneiss photomicrographs (Figure 7). Previous whole rock geochemistry results from Kay Peak reveal that the silica content of gneiss varies from felsic to intermediate, and that there is evidence of other mafic rock such as diorite/gabbro (Table S3 from [14]). The ridges running west and south from Kay Peak are visible in WV-3 VNIR imagery as distinct light-brown orange banding indicative of goethite Fe3+ iron absorption (Figure 10a), which coincides with very strong Al-OH absorption in WV-3 SWIR imagery (Figure 10c,d). However, it is unclear if Al-OH absorption detected in broadband SWIR imagery from ridges extending south and west from Kay Peak is due to the presence of primary muscovite or secondary clay alteration minerals.
North of Kay Peak, a distinct conglomeration of bright pixels is visible in both WV-3 and ASTER VNIR-SWIR imagery, hereby referred to as the Kay Peak spot (KPS). Reflectance values of the KPS at SWIR wavelengths are the highest at Mt Murphy, increasing to 60% reflectance in the 1.4–1.7 μm wavelength range. Field observations and photos indicate the presence of a yellow diamict in the vicinity of the KPS which is unique to this part of Mt Murphy (see Figure 3a). A targeted RBD expression (see Section 3.3) highlighted an absorption feature in WV-3 SWIR imagery centred at 2.16 μm and Al-OH absorption at 2.2 μm (Figure 10e). This double absorption feature is indicative of other Al-rich clay minerals such as kaolinite and alunite [11], and WV-3 and ASTER PC images suggest the KPS is spectrally distinct from the unnamed granitoid (Figure 10g,h). For a detailed breakdown of PCA results see Supplement S3.
To summarise, the composition of the unnamed granitoid is well characterised by strong Al-OH absorption corresponding to muscovite, high albedo and high silica content and serves as a good endmember for supervised classification. In contrast, spectral analysis of WV-3 SWIR and ASTER imagery indicate the lithological variation of ridges neighbouring Kay Peak is complex, comprising a mixture of felsic and intermediate to mafic rock types (Figure 10, Table S3). Felsic lithologies at Kay Peak with strong Al-OH absorption such as granites and aplites can be distinguished from mafic rocks which exhibit low albedo such as the basalt at Kay Peak summit. Despite a relatively high silica content (Table S3), felsic gneiss is challenging to classify at VNIR-SWIR wavelengths, as it lacks an Al-OH absorption feature. Instead, gneiss displays strong Fe2+ and Fe/Mg-OH absorption at ~2.33 μm, akin to more mafic rocks, making differentiation using VNIR-SWIR imagery challenging in areas where ground truth is poor.
4.2.2. Case Study 2: Turtle Rock, Icefall Nunatak and Notebook Cliffs
We used subtle differences in spectral profiles of fresh/polished basalt, weathered basalt and hydrovolcanic rock (Figure S3) as a basis for spectral mapping of the mafic outcrops, Turtle Rock, Icefall Nunatak and Notebook Cliffs. The Turtle Rock, Icefall Nunatak and Notebook Cliffs outcrops are all low albedo (Figure 11 and Figure S6), indicating that these outcrops contain an abundance of fresh and polished basalt, which is consistent with lab spectroscopy results (see Figure 6 and Supplement S4). A contrast-enhanced WV-3 368 FCC SWIR image also revealed zones of comparatively higher reflectance at SWIR wavelengths at all three outcrops relative to the low reflectance of fresh/polished basalt (Figure S5). Applying a WV3-VNIR 5/2 band ratio to WV-3 imagery indicates an Fe3+ signature that is suggestive of the presence of goethite, an Fe3+ rich mineral associated with basalt weathering. The remote sensing-based observations of the spatial distribution of Fe3+ at Icefall Nunatak are consistent with GPS locations of fresh and weathered basalt samples (Figure 5 and Figure 11). For instance, sample ICE-107, which exhibits glacial polish and slight-moderate weathering, was collected from an area lacking an Fe3+ signature in WV-3 imagery (Figure 11a).
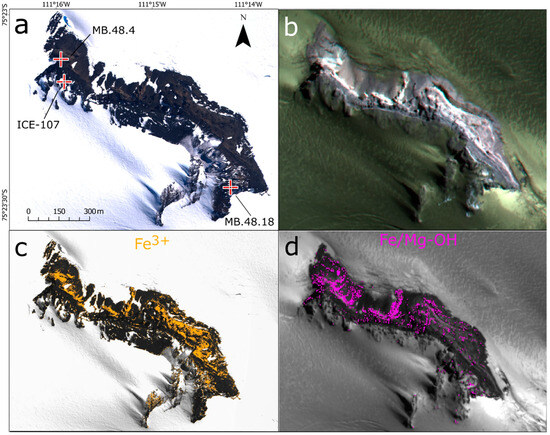
Figure 11.
Icefall Nunatak (a) WV-3 VNIR 732 FCC showing GPS locations of Mt Murphy spectra (red crosses) collected from Icefall Nunatak. (b) WV-3 SWIR 368 false colour composite (contrast-enhanced) showing VNIR Fe-O dominated pixels are consistent with uniform high SWIR band reflectance. (c) WV3-VNIR band 5 overlaid with upper 90th percentile thresholded pixels from 5/2 (red/blue) Fe-O ratio (orange). (d) Upper 90th percentile thresholded pixels SWIR Fe/Mg-OH index overlaid on greyscale image of WV-3 SWIR band 1 (purple).
To discriminate fragmental hydrovolcanic rock from basalt we applied a b6/(b7+b8) RBD index to WV-3 SWIR imagery, which revealed strong Fe/Mg-OH absorption overlapping with Fe3+ rich zones at both Icefall Nunatak and Notebook Cliffs (Figure 11 and Figure S6). We interpret zones of corresponding Fe3+ and strong Fe/Mg-OH absorption as evidence of Fe-rich smectite (nontronite). This is based on evidence from hydrovolcanic rock spectra (Figure 6) which show absorption at 2.29 µm (appearing as an Fe/Mg-OH absorption at broadband WV-3 wavelengths) and supported by thin sections of Icefall Nunatak and Notebook Cliff samples showing that volcanic glass has been palagonitized (Figure 7). Areas of overlapping Fe3+ and Fe/Mg-OH absorption are most prominent at Notebook Cliffs (Figure S6, Supplement S3) and are supported by previous field observations and the GPS location of fragmental hydrovolcanic rock samples (MB 48.4, Figure 6). At Turtle Rock, areas of increased Fe3+ on the upper Turtle Rock platform also indicate the presence of goethite associated with basalt weathering. However, it is challenging to differentiate hydrovolcanic rocks from weathered basalt at Turtle Rock because geometric correction has distorted some image pixels, leading to incidences of extreme reflectance values. In addition, the vertical viewing angle of the satellite emphasises the capping lava while the underlying fragmental hydrovolcanic rock visible in the field is partially obscured.
In summary, our assessment of ASTER and WV-3 spectral mapping capabilities at the mafic outcrops; Notebook Cliffs, Icefall Nunatak and Turtle Rock, establishes that areas of increased Fe3+ signal distinguish both hydrovolcanic rock and weathered basalt from fresh basalt. Hydrovolcanic rock at Notebook Cliffs and Icefall Nunatak is mapped separately from weathered basalts using the combined spectral signals of Fe/Mg-OH absorption and increased Fe3+ absorption. Gneiss also exhibits broadband Fe/Mg-OH absorption due to the presence of chlorite and hornblende (Figure 10), but in conjunction with increased Fe2+ absorption from biotite rather than increased Fe3+ due to weathering of mafic minerals. Fe-rich smectite in hydrovolcanic rocks can therefore be mapped manually, but this may be more challenging if there is a lack of geological context from previous observations.
4.3. Supervised Felsic-Mafic Classification
We now describe felsic-mafic classification results using the spectral angle mapper (SAM) algorithm. The best classification results were achieved using endmember image pixels identified from spectral mapping at locations where rock samples had also been collected. SAM image-based classification using WV-3 correctly mapped the granite outcrop and areas of Kay Peak but required a spectral angle threshold of ~0.1 to achieve a high classification rate (Figure 12a). The requirement of a broader angle threshold points towards further potential mineralogical differences between the unnamed granitoid and other locations with strong Al-OH absorption such as the KPS (see Section 4.2.1). Using all four rock types (granite, gneiss, basalt, fragmental hydrovolcanic) as endmember image classifiers (see Figure S7) increased the amount of classified rock, particularly around Kay Peak and the ridge extending northward from Kay Peak (Figure 12c). A lower threshold angle of 0.04 radians was relatively consistent at classifying mafic rock for both WV-3 and ASTER SWIR imagery at Notebook-Icefall-Turtle Rock outcrops (Figure 13a,b). Classification of fragmental hydrovolcanic rock and basalt is, however, more difficult because the VNIR part of the spectrum (useful for discrimination of Fe3+) and SWIR part of the spectrum (useful for discriminating hydrated minerals, e.g., Fe/Mg-OH) exist as separate WV-3 datasets collected at different dates. Despite this, SAM successfully classified the portions of Icefall Nunatak and Notebook Cliffs corresponding to increased Fe3+ absorption and Fe/Mg-OH absorption as hydrovolcanic rock (Figure 13c).
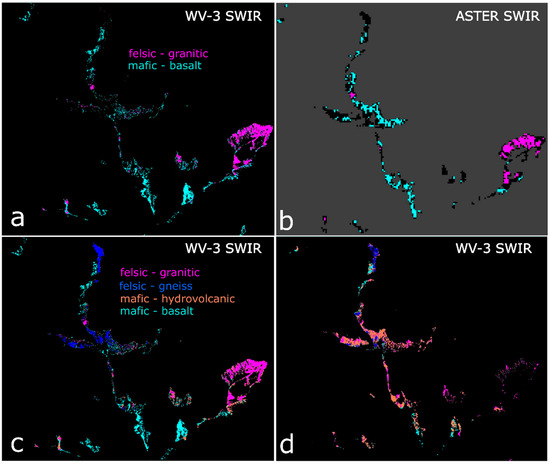
Figure 12.
Supervised classification of key lithological groups at Kay Peak showing (a) WV-3 image endmember derived felsic-mafic classification (0.1 rad). (b) ASTER image endmember derived felsic-mafic classification (0.04 rad). (c) WV-3 image derived endmembers; granite, gneiss, hydrovolcanic rock and basalt (0.1 rad), and (d) laboratory spectra derived classification with all 17 samples simplified to four endmember types (0.1 rad).
Figure 13.
Supervised classification of key lithological groups at Turtle Rock area showing (a) WV-3 image endmember derived felsic-mafic classification (0.04 rad). (b) ASTER image endmember derived felsic-mafic classification (0.03 rad). (c) WV-3 image derived endmembers; granite, gneiss, hydrovolcanic and basalt (0.1 rad) and (d) laboratory spectra derived classification using all Mt Murphy samples simplified to four endmember types (0.1 rad).
Simplified felsic-mafic classification results using ASTER SWIR imagery were cruder but displayed relatively good coverage (Figure 12b and Figure 13b). ASTER based classification captures more exposed rock at Mt Murphy using smaller angular thresholds of ~0.04. A larger pixel means spectral vectors are more likely to be apart from one another, i.e., the size of the spectral angle is larger, so despite the larger size of ASTER SWIR pixels (30 m), there is less spectral variation within them. Notably, the KPS, which amounts to a few pixels at ASTER-SWIR spatial resolution, is successfully classified as felsic, and pixels at scoria cone are classified as mafic (Figure 12b), demonstrating that medium resolution ASTER-SWIR imagery using endmembers extracted from the image as training data can achieve a broad mafic-felsic differentiation. Classifications produced using subsampled laboratory reflectance spectra measured from endmember samples (Figure 8d and Figure 12d) are less reliable (for further results see Supplement S3). However, the gneiss endmember is consistently classified on the well illuminated slope of Kay Peak north ridge using both image-derived and laboratory spectra as classification inputs (Figure 12c,d).
5. Discussion
5.1. Assessment of Mapping and Supervised Classification Performance
Differentiation of felsic and mafic lithologies at Kay Peak and the unnamed granitoid was possible due to the high albedo of paler felsic minerals such as quartz and feldspars, and detection of the Al-OH absorption feature at 2.2 μm associated with muscovite which is commonly found in granite. Gneiss is distinguishable at Kay Peak due to (i) the presence of biotite causing a rise in reflectance from 1.2 to 1.8 μm, and (ii) secondary alteration minerals such as chlorite and hornblende which manifest as an Fe/MgOH absorption feature at 2.33 μm. Differentiation of mafic rocks into fresh/polished basalt, weathered basalt, and fragmental hydrovolcanic rock at Icefall Nunatak and Notebook Cliffs is possible due to a combination of Fe3+ and Fe/Mg-OH absorption at 2.33 μm. Applying these assumptions to mapping mafic rock types in unvisited areas with no ground truth is more challenging, as mafic minerals such as chlorite and hornblende also display an Fe/Mg-OH mineral absorption signal. Spectral mapping of certain areas of Mt Murphy is impacted by illumination with sensors detecting anomalously high reflectance on sun facing slopes and low reflectance on shaded slopes, sometimes leading to a spectral signature that does not accurately reflect the true reflectance signature of the rock in question.
Following spectral mapping, we assessed the performance of SAM for classifying felsic-mafic rock types using (i) both ASTER-SWIR and WV-3 SWIR imagery based on endmember pixels identified from spectral mapping (see Section 4.2), and (ii) GPS locations of rock reflectance spectra profiles from Mt Murphy samples (see Section 4.1). SAM performs better at classifying poorly illuminated pixels than other algorithms [53] but may be prone to over-classification of basalt/hydrovolcanic rock pixels in our WV-3 scenes, especially when the spectral angle is relaxed. Laboratory endmembers performed poorly compared to image-based endmembers, which may be due to differences in overall spectral shape between image and laboratory spectra, particularly impacting the spectral profile of image derived relative to rock spectra derived basalt (Figure S7). Poorer spectral matching between ASTER SWIR imagery and laboratory spectra may also be due to differences in spectral shape due to a lack of pure endmember pixels because of ASTER’s 30 m spatial resolution but could also be due to limitations of the AST_07XT product associated aerosol model. The Antarctic atmosphere is clean, cold and dry with minimal aerosol levels [57], and a correction to top-of-atmosphere (TOA) reflectance has proven sufficient for obtaining robust SAM results in other studies [58]. Applying a TOA correction to ASTER L1T (Level 1 Precision Terrain Corrected Registered At-Sensor Radiance) imagery could therefore potentially yield better classification results.
The selection of training pixels for the image-based SAM classification approach combined a degree of reliable ground truth, validation, and pre-existing knowledge of the site in question. Differentiation of felsic-mafic rock types could feasibly rely on comparison of image spectra to known spectra from existing spectral libraries [24] including our new spectral library. However, differentiation of fragmental hydrovolcanic rock from basalt without ground truth would be more challenging [46]. SAM classifies pixels independent of albedo, but this can be disadvantageous in some cases, as relative albedos need to be considered when classifying different types of volcanic rock, i.e., trachyte (high albedo) vs. basalt (low albedo), which otherwise have a similar spectral profile at VNIR-SWIR wavelengths [54]. Despite these limitations, by applying the SAM algorithm at Mt Murphy, we were able to differentiate felsic-mafic endmember spectra on the ground in very-high-resolution WV-3 SWIR imagery and medium-resolution ASTER SWIR imagery. SAM can therefore be applied to classify felsic and mafic rock types in polar regions using WV-3 SWIR imagery and open-source medium-resolution ASTER imagery for larger outcrops.
5.2. Revised Geological Map of Mount Murphy
Our remote sensing-based mapping has enabled the differentiation of four principal rock types (granite, gneiss, fragmental hydrovolcanic rock, and basalt), which, along with ground truth and existing observations allows us to produce a revised felsic-mafic geological map of Mt Murphy (Figure 14). This map was produced by combining spectral classification (SAM) results with other metrics, including spectral absorption features and albedo. Where possible, we compared classified SAM pixels against GPS locations of our laboratory spectra and previous field observations to check their accuracy. Previous field expeditions observed minimal deposits of surficial glacial till and colluvium on Mt Murphy’s ridges and surrounding nunataks [2,15]. In addition, any erratic boulders and cobbles transported by ice and emplaced on bedrock are too sparse to impact the spectral signal from the underlying bedrock [2]. We therefore interpret spectral mapping and classification results to reflect signal from bedrock. Our new map is more comprehensive than existing published maps of Mt Murphy [12,37], refining and improving detail of the east, west and south ridges extending from one of the northern outcrops of the massif, Kay Peak, where supervised classification results are largely consistent with existing field observations (Figure 15). We also mapped the high elevation rock outcrops (>1900 m asl) adjacent to Mt Murphy summit and Grew Peak.
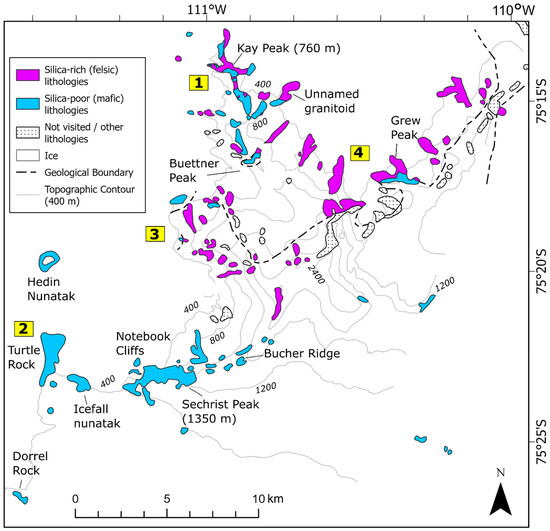
Figure 14.
Revised felsic-mafic geological map of Mount Murphy based on the original reference geological map (Figure 2), spectral mapping (Section 4.2), and SAM classification (Section 4.3) results using ASTER and WV-3 VNIR-SWIR imagery. Note that shadowed outcrops (75°20′S, 111°00′W) and outcrops east of Grew Peak could not be reclassified due to shadow or cloud cover and remain the same as in the original reference geological map. Numbered locations correspond broadly to areas: Kay Peak (1), Turtle Rock, Icefall Nunatak and Notebook Cliffs (2), high elevation rock outcrops (3) and Grew Peak (4). Nomenclature is the same as in the reference geological map (Figure 2).
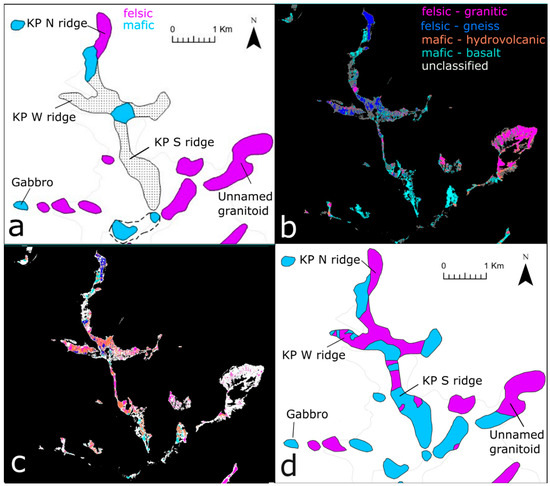
Figure 15.
Example of revised classification at Kay Peak based on WV-3 imagery showing (a) original reference felsic-mafic geological map (Figure 2). (b) SAM image endmembers (preferred classifier). (c) SAM laboratory endmembers with some clearly erroneous classifications, e.g., hydrovolcanic rock at Kay Peak (secondary classifier). (d) Revised felsic-mafic geological map based on new remote sensing observations. The boundary in panel (d) is removed because there is limited evidence for this based on our spectral mapping.
Based on remote sensing evidence (Figure 9 and Figure 12), ground truth (Figure 6 and Figure 7) and previous observations (Figure 2), the unnamed granitoid is mapped as felsic, supported by previous geochemical analysis of samples from this outcrop which are over 70% silica (Table S3 from [14]). The presence of gneiss at Kay Peak north ridge based on Fe2+ and Fe/Mg-OH absorption is also in agreement with the existing geological map, field observations, and laboratory spectra, as is the boundary between gneiss and basalt observed at the summit of Kay Peak and the ridge extending north from Kay Peak (see Figure 3a). Spectral classification results suggest that much of the Kay Peak south ridge may be composed of basalt (or another mafic lithology), potentially indicating more extensive emplacement of volcanic rock at Mt Murphy than previously thought. A large portion of Kay Peak west ridge is mapped as felsic-gneiss interspaced with areas of increased Al-OH absorption, potentially corresponding to previously described microgranite sheets [14]. Strong Fe/Mg-OH absorption observed at Kay Peak west ridge is indicative of gneiss with higher MgO content or diorite (Table S3 from [14]).
Classification results for Notebook-Icefall-Turtle Rock outcrops are consistent with existing observations that these outcrops are composed of mafic rock types [2,13,15]. The differentiation of basalt from fragmental hydrovolcanic rock using WV-3 imagery has permitted more detailed mapping of these nunataks, with remote mapping of their eruptive composition being broadly consistent with field observations [15]. These outcrops are simplified to mafic outcrops in the revised geological map and are consistent with the original reference geological map (Figure 2).
The KPS displays absorption at 2.16 μm and 2.2 μm indicating the presence of Al-rich clay minerals, potentially kaolinite or alunite. The yellow diamict observed in field photos (see Figure 3a) is distinct from the unnamed granitoid. The limited spectral resolution of the WV-3 sensor, however, means there is some confusion between alunite, kaolinite, and muscovite [11]. Diamict observed at the KPS could contain material from silicic boulders to phyllosilicates, making it challenging to specify its composition further without either hyperspectral imagery or dedicated geochemical analysis. Despite its classification as a felsic outcrop by SAM, we have mapped one outcrop as gabbro (Figure 15d), consistent with field mapping of the locality. The outcrop may have been misclassified by SAM, as it displays moderate Al-OH absorption and moderate albedo (Figure 15b).
The high elevation outcrops at Mt Murphy (see Figure 4, elevations > ~1900 m asl) consists of felsic-intermediate lava types (trachyte and benmoreite flows; [37]) and some basalt. However, summit outcrops are incorrectly classified by SAM as basalt (0.1; see Supplement S1), conflicting with our original reference map (Figure 2 and Figure S8). Trachyte exhibits a relatively flat spectral profile at SWIR wavelengths, but with higher reflectance values than basalt [54]. Therefore, it is unlikely an additional trachyte endmember would resolve SAM misclassification at the Mt Murphy summit, as its spectral profile and spectral angle are similar to basalt. We mapped Mt Murphy summit rocks as felsic, based on their relatively high albedo at SWIR wavelengths relative to basalt (see Figure 4), which is consistent with mapping of felsic intermediate lavas based on their relatively high reflectance values in previous studies [10]. Remaining outcrops at Mt Murphy summit which are in shadow, and for which there are no field observations, are mapped as unvisited.
Rock outcrops extending W-E from Kay Peak comprise an unnamed outcrop and Grew Peak (Figure 4). These outcrops are mapped as felsic in our revised geological map based on rock spectra-based SAM classification, minor Al-OH absorption, and high albedo consistent with the original reference geological map. All three outcrops exhibit high albedo and moderately weak Al-OH absorption features suggestive of felsic intrusive rock. The northern part of Grew Peak displays high albedo and Al-OH absorption, and the southern portion displays low albedo, in agreement with the geological boundary between felsic and mafic rock types of the original reference geological map (Figure 2). Image-based classification results were mixed, with some pixels classified as basalt. Laboratory spectra-based classification was, however, consistent with spectral mapping results in agreement with previous observations that these outcrops are felsic. The less consistent image-based endmember classification results around Grew Peak cannot be explained by SAM’s lack of sensitivity to albedo. We were unable to extend mapping east of Grew Peak due to cloud cover in the ASTER image and lack of WV-3 coverage, and so the lithology of these outcrops was not revised.
In summary, consistent spectral classification results (see Section 4.3) helped to both refine and extend mapping coverage of Kay Peak and surrounding ridges (area 1), with empirical division into mafic and felsic lithologies of particular use for planning cosmogenic nuclide exposure dating studies. Mapping of the Notebook-Icefall-Turtle Rock outcrops is also consistent with previous observations that this area consists solely of mafic outcrops. At both the high elevation outcrops adjacent to Mt Murphy summit (area 3) and outcrops extending eastwards to Grew Peak (area 4), there are minor inconsistencies between spectral classification results and the original reference geological map (Figure 2). The production of the revised felsic-mafic geological map was validated using sample reflectance spectra, photomicrographs, and whole rock geochemistry.
5.3. Implications for Future Cosmogenic Nuclide Sampling Campaigns
Our findings indicate remote sensing-based mapping can be applied as a preliminary site characterisation tool to discriminate outcrops of felsic bedrock (which are more likely to contain quartz needed to extract nuclides such as 10Be, 14C and 26Al) from mafic bedrock. Distinguishing between silica-rich and silica-poor rock types using VNIR-SWIR imagery can, however, be more nuanced because Al-OH absorption features associated with granitic-felsic rock types are also observed in diamict at Kay Peak ridge (Figure 3a and Figure 10e), a less optimal lithology for cosmogenic nuclide sampling. A preliminary differentiation of silica-rich and silica-poor rock types is useful for determining a site’s suitability for different types of cosmogenic nuclide sampling in unvisited areas, but can be improved by photo geological interpretation, which can help to distinguish less well consolidated Al-rich clay diamict from suitable felsic bedrock [7]. The remote differentiation of basalt from weathered basalt and hydrovolcanic rock (Figure 11 and Figure S6) can also aid future cosmogenic nuclide field sampling design. Existing capabilities to measure the stable nuclide 3He in olivine and pyroxene [59] and the potential to further develop extraction of in situ 14C from olivine [4] and 10Be from pyroxene [5] require well-preserved mineral crystals. Olivine and pyroxenes are typically less altered in fresh basalt (see Figure 7), making it useful to separate fresh and polished basalt from weathered basalt and hydrovolcanic rock, which we have demonstrated at Icefall Nunatak and Notebook Cliffs.
The remote sensing-based method presented here could also be used to aid in preliminary identification of suitable sites for recovery of subglacial bedrock cores by identifying the lithology of exposed ridges prior to field-based radar surveys to trace their subglacial extension [40]. Subglacial bedrock is increasingly being targeted for cosmogenic nuclide analysis, as it can provide insight into times when ice sheets were smaller than present [40]. However, poorly consolidated material such as frozen sediment and clay severely impedes bedrock core recovery [60]. Remote differentiation of fresh basalt from weathered basalt and hydrovolcanic rock is useful, as it can help determine if a potential site contains an abundance of weathered, degraded or predominantly clay-rich material. Future applications of our method to map areas potentially suitable for cosmogenic nuclide sampling and/or subglacial bedrock drilling can make use of a new publicly available spectral library of Mt Murphy rock samples [50], as well as existing rock and mineral spectra available from spectral libraries such as the USGS [54].
5.4. Study Considerations and Future Work
Our results show that the use of ASTER and Worldview-3 VNIR-SWIR imagery for mafic-felsic differentiation in polar regions is achievable but has some limitations which are described below.
- WV-3 VNIR and SWIR datasets were not acquired simultaneously, precluding combined spectral analysis from band ratios and PCA and limiting the use of the SAM classifier to either VNIR or SWIR wavelengths for WV-3 imagery. The use of only part of the VNIR-SWIR spectral profile negatively impacts automatic differentiation of basalt and hydrovolcanic rock, likely contributing to cases of misclassification of these two endmembers.
- ASTER 07XT imagery was supplied with a pre-applied atmospheric correction using a radiative transfer model, whilst WV-3 data were corrected to top-of-atmosphere (TOA) reflectance. Supervised classification of ASTER imagery yielded less consistent results than WV-3, perhaps due to WV-3’s superior spatial resolution, but potentially also due to artefacts introduced to ASTER imagery during atmospheric correction.
- We found ASTER TIR imagery had a poor signal-to-noise ratio at very high latitudes, and rock outcrops are often too small to be captured at the spatial resolution of this sensor (90 metres per pixel), so we could not use ASTER TIR imagery to directly detect quartz. Instead, albedo and the Al-OH absorption feature associated with the presence of muscovite served as proxies for distinguishing silica-rich and silica-poor rock.
- A new VNIR-SWIR hyperspectral sensor—Environmental Mapping and Analysis Program (EnMAP)—with medium spatial resolution (30 metres per pixel) has been launched since we acquired imagery for this study. EnMAP possesses much improved SNR relative to older hyperspectral sensors [61] so has the potential to resolve ambiguities classifying primary muscovites in granites from Al-rich clay diamict.
- Illumination differences due to low sun angles and the steep topography of Mt Murphy, particularly of shaded slopes, impacted spectral shape and therefore SAM classification. SAM addresses topographic induced differences in albedo, but shade dampens the reflectance signal and thus suppresses the true spectral shape of the rock being classified.
To resolve some of the limitations of the study described above, we make the following recommendations for future work:
- Where possible, use simultaneously acquired WV-3 VNIR and WV-3 SWIR datasets. For Antarctica, this requires specific joint VNIR-SWIR tasking requests, as WV-3 SWIR is not readily available to download from Digital Globe archives at high latitudes.
- Use L1T (Precision Terrain Corrected Registered At-Sensor Radiance) ASTER data and correct manually to top-of-atmosphere (TOA) reflectance for consistency with WV-3 image analysis. This may improve spectral classification (SAM) results using ASTER imagery.
- Future mapping would benefit from complementing the use of multispectral ASTER and Worldview-3 imagery with the new ENMAP hyperspectral sensor, especially to resolve ambiguities in mapping granitic bedrock and Al-rich clays. Resampling of the WV-3 imagery to the 30-metre spatial resolution of EnMAP would be a useful starting point for testing the effectiveness of this approach.
- Perform additional mineral analyses to better understand and distinguish the mineral composition of our samples and compare these results to petrography and spectral studies already undertaken.
6. Conclusions
In this study, we set out to remotely distinguish felsic (silica-rich) from mafic (silica-poor) rock types at VNIR and SWIR wavelengths to characterise suitable sites for future cosmogenic nuclide sampling campaigns. The primary conclusions of the study are as follows:
- There are four spectrally distinguishable lithologic groups at Mt Murphy: granites, gneisses, basalts, and fragmental hydrovolcanic rocks. A comparison of spectral profiles of fresh, polished, and weathered surfaces indicates rock surfaces that are glacially polished are spectrally similar to fresh rock surfaces.
- Spectral classification performs well for identifying and separating silica-rich rock at the mixed felsic-mafic Kay Peak study area, and for classifying mafic outcrops to the southwest of Mt Murphy (Turtle Rock, Icefall Nunatak, Notebook Cliffs). More ambiguous spectral classification results from other parts of Mt Murphy can be resolved by using spectral mapping techniques to identify areas of Al-OH absorption and high albedo, as well as photo geological interpretation of WV-3 panchromatic imagery.
- Separation of granite and biotite gneiss lithologies from mafic lithologies at VNIR-SWIR wavelengths can serve as a proxy for silica content. Strong Al-OH absorption and high albedo (average reflectance across the VIS-SWIR range) are useful for detecting granite, while Fe2+ and Fe/Mg-OH absorption features are useful for detecting biotite-rich gneiss, demonstrating that separation of these lithologies at VNIR-SWIR wavelengths can serve as a proxy for silica content. This is useful because the ASTER TIR sensor can directly detect silica, but its spatial resolution is too coarse to identify silica at many rock outcrops, and its signal-to-noise ratio is often poor at high polar latitudes.
- Altered fragmental volcanic rock can be differentiated from basalt using remote sensing due to the increased Fe3+ and Fe/Mg-OH absorption signature of Fe-rich smectite that is present in fragmental hydrovolcanic rock but absent in basaltic rocks.
- Differentiation of felsic and mafic rock outcrops can be achieved with broadband WV-3 SWIR imagery, and similar (though coarser) results can be achieved with medium-resolution ASTER SWIR imagery.
Overall, we demonstrate at Mt Murphy that remote sensing-based mapping using multispectral satellite imagery can be used to preliminarily identify suitable sites for future cosmogenic nuclide sampling prior to undertaking more targeted fieldwork.
Supplementary Materials
The following supporting information can be downloaded at: https://www.mdpi.com/article/10.3390/rs17020314/s1, Supplement S1, Detailed Methods; Supplement S2, Rock Weathering Studies; Supplement S3, Additional Spectral Mapping and Classification Results; Supplement S4, Spectral Profiles of Mount Murphy rock samples [62,63,64,65,66,67,68,69,70,71,72,73,74].
Author Contributions
Conceptualisation, J.R.A. and P.J.M.; methodology, J.R.A. and P.J.M.; software, J.R.A.; validation, J.R.A., J.L.S. and J.S.J.; formal analysis, J.R.A.; investigation, J.R.A.; resources, P.J.M., S.J.R., D.H.R., J.L.S. and J.S.J.; data curation, J.R.A.; writing—original draft preparation, J.R.A. and P.J.M.; writing—review and editing, J.R.A., P.J.M., S.J.R., D.H.R., J.L.S., K.A.N., J.W. and J.S.J.; visualization, J.R.A.; supervision, P.J.M., S.J.R., D.H.R. and J.S.J.; project administration, J.R.A., P.J.M., S.J.R., D.H.R. and J.S.J.; funding acquisition, D.H.R., J.W. and J.S.J. All authors have read and agreed to the published version of the manuscript.
Funding
This research was funded with support from Natural Environment Research Council (NERC: grant NE/S006710/1, NE/S006753/1 and NE/K012088/1).
Data Availability Statement
Laboratory spectral reflectance data of Mount Murphy rock samples used to ground truth remote sensing data for this study can be freely accessed from the UK Polar Data Centre [50].
Acknowledgments
We appreciate the support of Andrew Gray and Robbie Ramsey at the NERC Field Spectroscopy Facility for their assistance with spectral measurements. I also acknowledge Laura Gerrish, Louise Ireland, Aliaksandra Skachkova and Peter Fretwell of the Mapping and GIS (MAGIC) Team for help with satellite imagery acquisition. I also acknowledge Alex Burton-Johnson, formerly of British Antarctic Survey, for helpful advice and assistance. We thank the anonymous reviewers for their constructive feedback which helped improve the manuscript, and we also thank the assistant editor Hattie He for their dedicated service. This work is from the “Geological History Constraints” GHC project, a component of the International Thwaites Glacier Collaboration (ITGC). Logistics were provided by NSF-U.S. Antarctic Program and NERC-British Antarctic Survey. This is ITGC contribution number ITGC:139.
Conflicts of Interest
The authors declare no conflicts of interest.
References
- Stone, J.O.; Balco, G.A.; Sugden, D.E.; Caffee, M.W.; Sass, L.C.; Cowdery, S.G.; Siddoway, C. Holocene Deglaciation of Marie Byrd Land, West Antarctica. Science 2003, 299, 99–102. [Google Scholar] [CrossRef] [PubMed]
- Johnson, J.S.; Roberts, S.J.; Rood, D.H.; Pollard, D.; Schaefer, J.M.; Whitehouse, P.L.; Ireland, L.C.; Lamp, J.L.; Goehring, B.M.; Rand, C.; et al. Deglaciation of Pope Glacier Implies Widespread Early Holocene Ice Sheet Thinning in the Amundsen Sea Sector of Antarctica. Earth Planet. Sci. Lett. 2020, 548, 116–501. [Google Scholar] [CrossRef]
- Balco, G. Contributions and Unrealized Potential Contributions of Cosmogenic-Nuclide Exposure Dating to Glacier Chronology, 1990–2010. Quat. Sci. Rev. 2011, 30, 3–27. [Google Scholar] [CrossRef]
- Pigati, J.S.; Lifton, N.A.; Timothy Jull, A.J.; Quade, J. Extraction of in Situ Cosmogenic 14C from Olivine. Radiocarbon 2010, 52, 1244–1260. [Google Scholar] [CrossRef]
- Bergelin, M.; Balco, G.; Corbett, L.B.; Bierman, P.R. Production Rate Calibration for Cosmogenic 10Be in Pyroxene by Applying a Rapid Fusion Method to 10Be-Saturated Samples from the Transantarctic Mountains, Antarctica. Geochronology 2024, 6, 491–502. [Google Scholar] [CrossRef]
- Kennicutt, M.C.; Kim, Y.D.; Rogan-Finnemore, M.; Anandakrishnan, S.; Chown, S.L.; Colwell, S.; Cowan, D.; Escutia, C.; Frenot, Y.; Hall, J.; et al. Delivering 21st Century Antarctic and Southern Ocean Science. Antarct. Sci. 2016, 28, 407–423. [Google Scholar] [CrossRef]
- Drury, S.A. Image Interpretation in Geology, 3rd ed.; Nelson Thornes: Cheltenham, UK, 2001; ISBN 9780748764990. [Google Scholar]
- Jawak, S.D.; Luis, A.J. A Spectral Index Ratio-Based Antarctic Land-Cover Mapping Using Hyperspatial 8-Band WorldView-2 Imagery. Polar Sci. 2013, 7, 18–38. [Google Scholar] [CrossRef]
- Haselwimmer, C.E.; Riley, T.R.; Liu, J.G. Assessing the Potential of Multispectral Remote Sensing for Lithological Mapping on the Antarctic Peninsula: Case Study from Eastern Adelaide Island, Graham Land. Antarct. Sci. 2010, 22, 299–318. [Google Scholar] [CrossRef]
- Haselwimmer, C.E.; Riley, T.R.; Liu, J.G. Lithologic Mapping in the Oscar II Coast Area, Graham Land, Antarctic Peninsula Using ASTER Data. Int. J. Remote Sens. 2011, 32, 2013–2035. [Google Scholar] [CrossRef]
- Kruse, F.A.; Baugh, W.M.; Perry, S.L. Validation of DigitalGlobe WorldView-3 Earth Imaging Satellite Shortwave Infrared Bands for Mineral Mapping. J. Appl. Remote Sens. 2015, 9, 096044. [Google Scholar] [CrossRef]
- Wilch, T.I.; McIntosh, W.C.; Panter, K.S. Marie Byrd Land and Ellsworth Land: Volcanology. In Volcanism in Antarctica: 200 Million Years of Subduction, Rifting and Continental Break-Up; The Geological Society of London: London, UK, 2021; Volume 55, ISBN 0000000329. [Google Scholar] [CrossRef]
- LeMasurier, W.E.; Harwood, D.M.; Rex, D.C. Geology of Mount Murphy Volcano: An 8-m.y. History of Interaction between a Rift Volcano and the West Antarctic Ice Sheet. Geol. Soc. Am. Bull. 1994, 106, 265–280. [Google Scholar] [CrossRef]
- Pankhurst, R.J.; Weaver, S.D.; Bradshaw, J.D.; Storey, B.C.; Ireland, T.R. Geochronology and Geochemistry of Pre-Jurassic Superterranes in Marie Byrd Land, Antarctica. J. Geophys. Res. 1998, 103, 2529–2547. [Google Scholar] [CrossRef]
- Smellie, J.L. Lithofacies Architecture and Construction of Volcanoes Erupted in Englacial Lakes: Icefall Nunatak, Mount Murphy, Eastern Marie Byrd Land, Antarctica. In Volcaniclastic Sedimentation in Lacustrine Settings; John Wiley & Sons, Ltd.: Hoboken, NJ, USA, 2001; pp. 7–34. ISBN 9781444304251. [Google Scholar]
- Wilch, T.I.; McIntosh, W.C. Lithofacies Analysis and 40Ar/39Ar Geochronology of Ice-Volcano Interactions at Mt. Murphy and the Crary Mountains, Marie Byrd Land, Antarctica. Geol. Soc. Spec. Publ. 2002, 202, 237–253. [Google Scholar] [CrossRef]
- Howat, I.M.; Porter, C.; Smith, B.E.; Noh, M.-J.; Morin, P. The Reference Elevation Model of Antarctica. Cryosphere 2019, 13, 665–674. [Google Scholar] [CrossRef]
- Dorschel, B.; Hehemann, L.; Viquerat, S.; Warnke, F.; Dreutter, S.; Tenberge, Y.S.; Accettella, D.; An, L.; Barrios, F.; Bazhenova, E.; et al. The International Bathymetric Chart of the Southern Ocean Version 2. Sci. Data 2022, 9, 275. [Google Scholar] [CrossRef]
- Rignot, E.; Mouginot, J.; Scheuchl, B. Antarctic Grounding Line Mapping from Differential Satellite Radar Interferometry. Geophys. Res. Lett. 2011, 38, L10504. [Google Scholar] [CrossRef]
- Burton-Johnson, A.; Black, M.; Fretwell, P.T.; Kaluza-Gilbert, J. An Automated Methodology for Differentiating Rock from Snow, Clouds and Sea in Antarctica from Landsat 8 Imagery: A New Rock Outcrop Map and Area Estimation for the Entire Antarctic Continent. The Cryosphere 2016, 10, 1665–1677. [Google Scholar] [CrossRef]
- Rowan, L.C.; Mars, J.C. Lithologic Mapping in the Mountain Pass, California Area Using Advanced Spaceborne Thermal Emission and Reflection Radiometer (ASTER) Data. Remote Sens. Environ. 2003, 84, 350–366. [Google Scholar] [CrossRef]
- Mars, J.C. Mineral and Lithologic Mapping Capability of Worldview 3 Data at Mountain Pass, California, Using True- and False-Color Composite Images, Band Ratios, and Logical Operator Algorithms. Econ. Geol. 2018, 113, 1587–1601. [Google Scholar] [CrossRef]
- Bishop, C.A.; Liu, J.G.; Mason, P.J. Hyperspectral Remote Sensing for Mineral Exploration in Pulang, Yunnan Province, China. Int. J. Remote Sens. 2011, 32, 2409–2426. [Google Scholar] [CrossRef]
- Pour, A.B.; Sekandari, M.; Rahmani, O.; Crispini, L.; Läufer, A.; Park, Y.; Kuk Hong, J.; Pradhan, B.; Hashim, M.; Shawkat Hossain, M.; et al. Identification of Phyllosilicates in the Antarctic Environment Using ASTER Satellite Data: Case Study from the Mesa Range, Campbell and Priestley Glaciers, Northern Victoria Land Identification of Phyllosilicates in the Antarctic Environmen. Remote Sens. 2021, 13, 38. [Google Scholar] [CrossRef]
- Mars, J.C.; Rowan, L.C. Regional Mapping of Phyllic- and Argillic-Altered Rocks in the Zagros Magmatic Arc, Iran, Using Advanced Spaceborne Thermal Emission and Reflection Radiometer (ASTER) Data and Logical Operator Algorithms. Geosphere 2006, 2, 161–186. [Google Scholar] [CrossRef]
- Cŕosta, A.P.; De Souza Filho, C.R.; Azevedo, F.; Brodie, C. Targeting Key Alteration Minerals in Epithermal Deposits in Patagonia, Argentina, Using ASTER Imagery and Principal Component Analysis. Int. J. Remote Sens. 2003, 24, 4233–4240. [Google Scholar] [CrossRef]
- Bedini, E. Mineral Mapping in the Kap Simpson Complex, Central East Greenland, Using HyMap and ASTER Remote Sensing Data. Adv. Space Res. 2011, 47, 60–73. [Google Scholar] [CrossRef]
- Fujisada, H.; Ono, A. Observational Performance of ASTER Instrument on EOS-AM1 Spacecraft. Adv. Space Res. 1994, 14, 147–150. [Google Scholar] [CrossRef]
- Ye, B.; Tian, S.; Ge, J.; Sun, Y. Assessment of WorldView-3 Data for Lithological Mapping. Remote Sens. 2017, 9, 1132. [Google Scholar] [CrossRef]
- Bedini, E. Application of WorldView-3 Imagery and ASTER TIR Data to Map Alteration Minerals Associated with the Rodalquilar Gold Deposits, Southeast Spain. Adv. Space Res. 2019, 63, 3346–3357. [Google Scholar] [CrossRef]
- Sun, Y.; Tian, S.; Di, B. Extracting Mineral Alteration Information Using WorldView-3 Data. Geosci. Front. 2017, 8, 1051–1062. [Google Scholar] [CrossRef]
- Jawak, S.D.; Luis, A.J.; Fretwell, P.T.; Convey, P.; Durairajan, U.A. Semiautomated Detection and Mapping of Vegetation Distribution in the Antarctic Environment Using Spatial-Spectral Characteristics of WorldView-2 Imagery. Remote Sens. 2019, 11, 1909. [Google Scholar] [CrossRef]
- Newall, J.C.H.; Dymova, T.; Serra, E.; Blomdin, R.; Fredin, O.; Glasser, N.F.; Suganuma, Y.; Harbor, J.M.; Stroeven, A.P. The Glacial Geomorphology of Western Dronning Maud Land, Antarctica. J. Maps 2020, 16, 468–478. [Google Scholar] [CrossRef]
- Ritzwoller, M.H.; Shapiro, N.M.; Levshin, A.L.; Leahy, G.M. Crustal and Upper Mantle Structure beneath Antarctica and Surrounding Oceans. J. Geophys. Res. Solid Earth 2001, 106, 30645–30670. [Google Scholar] [CrossRef]
- Jordan, T.A.; Riley, T.R.; Siddoway, C.S. The Geological History and Evolution of West Antarctica. Nat. Rev. Earth Environ. 2020, 1, 117–133. [Google Scholar] [CrossRef]
- Siddoway, C.S.; Fanning, C.M. Paleozoic Tectonism on the East Gondwana Margin: Evidence from SHRIMP U-Pb Zircon Geochronology of a Migmatite-Granite Complex in West Antarctica. Tectonophysics 2009, 477, 262–277. [Google Scholar] [CrossRef]
- LeMasurier, W. Shield Volcanoes of Marie Byrd Land, West Antarctic Rift: Oceanic Island Similarities, Continental Signature, and Tectonic Controls. Bull. Volcanol. 2013, 75, 726. [Google Scholar] [CrossRef]
- Johnson, J.S.; Bentley, M.J.; Gohl, K. First Exposure Ages from the Amundsen Sea Embayment, West Antarctica: The Late Quaternary Context for Recent Thinning of Pine Island, Smith, and Pope Glaciers. Geology 2008, 36, 223–226. [Google Scholar] [CrossRef]
- Adams, J.R.; Johnson, J.S.; Roberts, S.J.; Mason, P.J.; Nichols, K.A.; Venturelli, R.A.; Wilcken, K.; Balco, G.; Goehring, B.; Hall, B.; et al. New 10Be Exposure Ages Improve Holocene Ice Sheet Thinning History near the Grounding Line of Pope Glacier, Antarctica. The Cryosphere 2022, 16, 4887–4905. [Google Scholar] [CrossRef]
- Balco, G.; Brown, N.; Nichols, K.; Venturelli, R.A.; Adams, J.; Braddock, S.; Campbell, S.; Goehring, B.; Johnson, J.S.; Rood, D.H.; et al. Reversible Ice Sheet Thinning in the Amundsen Sea Embayment during the Late Holocene. The Cryosphere 2023, 17, 1787–1801. [Google Scholar] [CrossRef]
- Ninomiya, Y.; Fu, B.; Cudahy, T.J. Detecting Lithology with Advanced Spaceborne Thermal Emission and Reflection Radiometer (ASTER) Multispectral Thermal Infrared “Radiance-at-Sensor” Data. Remote Sens. Environ. 2005, 99, 127–139. [Google Scholar] [CrossRef]
- Hunt, G.R. Near-Infrared (1.3-2.4 Μm) Spectra of Alteration Minerals; Potential for Use in Remote Sensing. Geophysics 1979, 44, 1974–1986. [Google Scholar] [CrossRef]
- Morris, R.V.; Lauer, H.V.; Lawson, C.A.; Gibson, E.K.; Nace, G.A.; Stewart, C. Spectral and Other Physicochemical Properties of Submicron Powders of Hematite (Alpha-Fe2O3), Maghemite (Gamma-Fe2O3), Magnetite (Fe3O4), Goethite (Alpha-FeOOH) and Lepidocrocite (Gamma-FeOOH). J. Geophys. Res. 1985, 90, 3126–3144. [Google Scholar] [CrossRef]
- Zhou, K.; Wang, S. Spectral Properties of Weathered and Fresh Rock Surfaces in the Xiemisitai Metallogenic Belt, NW Xinjiang, China. Open Geosci. 2017, 9, 322–339. [Google Scholar] [CrossRef][Green Version]
- Clark, R.N.; King, T.V.V.; Klejwa, M.; Swayze, G.A. High Spectral Resolution Reflectance Spectroscopy of Minerals. J. Geophys. Res. 1990, 95, 653–665. [Google Scholar] [CrossRef]
- Waske, B.; Benediktsson, J.A.; Arnason, K.; Sveinsson, J.R. Mapping of Hyperspectral AVIRIS Data Using Machine-Learning Algorithms. Can. J. Remote Sens. 2009, 35, S106–S116. [Google Scholar] [CrossRef]
- Smellie, J.L. Basaltic Subglacial Sheet-like Sequences: Evidence for Two Types with Different Implications for the Inferred Thickness of Associated Ice. Earth-Sci. Rev. 2008, 88, 60–88. [Google Scholar] [CrossRef]
- Spectral Evolution. Available online: https://spectralevolution.com/product/psr/ (accessed on 28 November 2024).
- Menges, F. SpectraGryph-Optical Spectroscopy Software, Version 1.2.15, 2020. Available online: https://www.effemm2.de/spectragryph/ (accessed on 20 April 2024).
- Adams, J.R.; Johnson, J.S.; Roberts, S.J.; Mason, P.J.; Rood, D.H.; Ramsay, R. Laboratory Spectral Reflectance Measurements at VNIR-SWIR Wavelengths of 17 Rock Samples from Mount Murphy, West Antarctica (Version 1.0) [Data Set], NERC EDS UK Polar Data Centre. 2024. Available online: https://data.bas.ac.uk/full-record.php?id=GB/NERC/BAS/PDC/01918 (accessed on 2 March 2024).
- NASA/METI/AIST/Japan Spacesystems and U.S./Japan ASTER Science Team ASTER On-Demand L2 Surface Reflectance VNIR and SWIR Crosstalk-Corrected [AST_07XT.003]. NASA EOSDIS Land Processes Distributed Active Archive Center. Sioux Falls, South Dakota, USA. Available online: https://lpdaac.usgs.gov/products/ast_07xtv003/ (accessed on 2 March 2024).
- Kruse, F.A.; Lefkoff, A.B.; Boardman, J.W.; Heidebrecht, K.B.; Shapiro, A.T.; Barloon, P.J.; Goetz, A.F.H. The Spectral Image Processing System (SIPS)-Interactive Visualization and Analysis of Imaging Spectrometer Data. Remote Sens. Environ. 1993, 44, 145–163. [Google Scholar] [CrossRef]
- Dennison, P.E.; Halligan, K.Q.; Roberts, D.A. A Comparison of Error Metrics and Constraints for Multiple Endmember Spectral Mixture Analysis and Spectral Angle Mapper. Remote Sens. Environ. 2004, 93, 359–367. [Google Scholar] [CrossRef]
- Kokaly, R.F.; Clark, R.N.; Swayze, G.A.; Livo, K.E.; Hoefen, T.M.; Pearson, N.C.; Wise, R.A.; Benzel, W.M.; Lowers, H.A.; Driscoll, R.L.; et al. USGS Spectral Library Version 7; US Geological Survey: Reston, VA, USA, 2017. [Google Scholar]
- Bishop, J.L.; Lane, M.D.; Dyar, M.D.; Brown, A.J. Reflectance and Emission Spectroscopy Study of Four Groups of Phyllosilicates: Smectites, Kaolinite-Serpentines, Chlorites and Micas. Clay Miner. 2008, 43, 35–54. [Google Scholar] [CrossRef]
- Johnson, J.S.; Smellie, J.L. Zeolite Compositions as Proxies for Eruptive Paleoenvironment. Geochem. Geophys. Geosyst. 2007, 8, Q03009. [Google Scholar] [CrossRef]
- Bindschadler, R.; Vornberger, P.; Fleming, A.; Fox, A.; Mullins, J.; Binnie, D.; Jean, S.; Granneman, B.; Gorodetzky, D. Remote Sensing of Environment The Landsat Image Mosaic of Antarctica. Remote Sens. Environ. 2008, 112, 4214–4226. [Google Scholar] [CrossRef]
- Fretwell, P.T.; Phillips, R.A.; Brooke, M.d.L.; Fleming, A.H.; McArthur, A. Using the Unique Spectral Signature of Guano to Identify Unknown Seabird Colonies. Remote Sens. Environ. 2015, 156, 448–456. [Google Scholar] [CrossRef]
- Blard, P.H.; Farley, K.A. The Influence of Radiogenic 4He on Cosmogenic 3He Determinations in Volcanic Olivine and Pyroxene. Earth Planet. Sci. Lett. 2008, 276, 20–29. [Google Scholar] [CrossRef]
- Braddock, S.; Venturelli, R.A.; Nichols, K.; Moravec, E.; Boeckmann, G.V.; Campbell, S.; Balco, G.; Ackert, R.; Small, D.; Johnson, J.S.; et al. Lessons Learned from Shallow Subglacial Bedrock Drilling Campaigns in Antarctica. Ann. Glaciol. 2025, 65, e18. [Google Scholar] [CrossRef]
- Kruse, F.A.; Boardman, J.W.; Huntington, J.F. Comparison of Airborne Hyperspectral Data and EO-1 Hyperion for Mineral Mapping. IEEE Trans. Geosci. Remote Sens. 2003, 41, 1388–1400. [Google Scholar] [CrossRef]
- Milton, E.J.; Schaepman, M.E.; Anderson, K.; Kneubühler, M.; Fox, N. Progress in Field Spectroscopy. Remote Sens. Environ. 2009, 113, S92–S109. [Google Scholar] [CrossRef]
- Haselwimmer, C.E. Lithological Mapping on the Antarctic Peninsula Using Advanced Spaceborne Thermal Emission and Reflection Radiometer (ASTER) Data. Ph.D. Thesis, Imperial College London, London, UK, 2010. [Google Scholar]
- Kuester, M. Radiometric Use of WorldView—3 Imagery Technical Note 1 WorldView-3 Instrument WorldView-3 Relative Radiance Response. Digit. Globe 2016, 1–12. [Google Scholar]
- Thuillier, G.; Hersé, M.; Labs, D.; Foujols, T.; Peetermans, W.; Gillotay, D.; Simon, P.C.; Mandel, H. The Solar Spectral Irradiance from 200 to 2400 Nm as Measured by the SOLSPEC Spectrometer from the ATLAS and EURECA Missions. Sol. Phys. 2003, 214, 1–22. [Google Scholar] [CrossRef]
- Iwasaki, A.; Tonooka, H. Validation of a Crosstalk Correction Algorithm for ASTER/SWIR. IEEE Trans. Geosci. Remote Sens. 2005, 43, 2747–2751. [Google Scholar] [CrossRef]
- Cracknell, A.P. Review Article Synergy in Remote Sensing-What’s in a Pixel? Int. J. Remote Sens. 2010, 19, 2025–2047. [Google Scholar] [CrossRef]
- Crowley, J.K.; Brickey, D.W.; Rowan, L.C. Airborne Imaging Spectrometer Data of the Ruby Mountains, Montana: Mineral Discrimination Using Relative Absorption Band-Depth Images. Remote Sens. Environ. 1989, 29, 121–134. [Google Scholar] [CrossRef]
- Zhang, J.; Rivard, B.; Sánchez-Azofeifa, A. Spectral Unmixing of Normalized Reflectance Data for the Deconvolution of Lichen and Rock Mixtures. Remote Sens. Environ. 2005, 95, 57–66. [Google Scholar] [CrossRef]
- Campbell, I.B.; Claridge, G.G.C. Antarctica: Soils, Weathering Processes and Environment; Elsevier: Amsterdam, The Netherlands, 1987; ISBN 008086984X. [Google Scholar]
- Kanamaru, T.; Suganuma, Y.; Oiwane, H.; Miura, H.; Miura, M.; Okuno, J.; Hayakawa, H. The Weathering of Granitic Rocks in a Hyper-Arid and Hypothermal Environment: A Case Study from the Sør-Rondane Mountains, East Antarctica. Geomorphology 2018, 317, 62–74. [Google Scholar] [CrossRef]
- Salvatore, M.R.; Mustard, J.F.; Head, J.W.; Cooper, R.F.; Marchant, D.R.; Wyatt, M.B. Development of Alteration Rinds by Oxidative Weathering Processes in Beacon Valley, Antarctica, and Implications for Mars. Geochim. Cosmochim. Acta 2013, 115, 137–161. [Google Scholar] [CrossRef]
- Stroncik, N.A.; Schmincke, H.U. Palagonite—A Review. Int. J. Earth Sci. 2002, 91, 680–697. [Google Scholar] [CrossRef]
- Farrand, W.H.; Wright, S.P.; Glotch, T.D.; Schröder, C.; Sklute, E.C.; Dyar, M.D. Spectroscopic Examinations of Hydro- and Glaciovolcanic Basaltic Tuffs: Modes of Alteration and Relevance for Mars. Icarus 2018, 309, 241–259. [Google Scholar] [CrossRef]
Disclaimer/Publisher’s Note: The statements, opinions and data contained in all publications are solely those of the individual author(s) and contributor(s) and not of MDPI and/or the editor(s). MDPI and/or the editor(s) disclaim responsibility for any injury to people or property resulting from any ideas, methods, instructions or products referred to in the content. |
© 2025 by the authors. Licensee MDPI, Basel, Switzerland. This article is an open access article distributed under the terms and conditions of the Creative Commons Attribution (CC BY) license (https://creativecommons.org/licenses/by/4.0/).