1. Introduction
Remote sensing provides a powerful means of studying planetary surfaces, enabling researchers to detect, monitor, and model change across vast spatial and temporal scales [
1,
2]. Traditionally, planetary image analysis relied on pixel-based classification—assigning values based solely on spectral differences at the individual pixel level—techniques, which were well suited for coarse-resolution imagery but faltered with high-resolution or off-nadir data [
3,
4,
5]. Such approaches often struggle to resolve morphologically complex or overlapping features like ice layers, dunes, or craters, particularly when spatial resolution exceeds pixel size [
2,
6]. Object-based image analysis (OBIA) addresses these limitations by segmenting imagery into spatially coherent objects and analyzing them with respect to size, shape, texture, spectral signature, and spatial context [
1,
2,
7].
The roots of OBIA extend back to Colwell’s 1965 work, which emphasized the importance of spatial homogeneity, tone, texture, shape, and pattern recognition in aerial photo interpretation [
8]. The methodology evolved into Geographic Object-Based Image Analysis (GEOBIA) in the late 1990s and early 2000s with the development of platforms such as Trimble eCognition, which enabled multi-resolution segmentation, hierarchical rule sets, and knowledge-driven classification systems [
1,
2,
7]. Over the last two decades, OBIA has become a standard tool in terrestrial remote sensing applications—ranging from agriculture and forestry [
3] to urban planning [
5,
9] and to coastal and vegetation change detection [
1,
2]. These applications benefit from OBIA’s ability to analyze spatial relationships, object boundaries, and shape metrics in ways that per-pixel methods cannot. Despite the availability of high-resolution planetary imagery from instruments like HiRISE and HRSC, OBIA remains underutilized in planetary science [
4,
6]. However, this is beginning to change. For example, a study presented at LPSC 2024 applied OBIA techniques to delineate impact craters from HRSC digital elevation models. By segmenting based on morphometric parameters and crater rim geometries, the researchers demonstrated that object-based methods can handle large-scale, 3D planetary terrain analysis [
10].
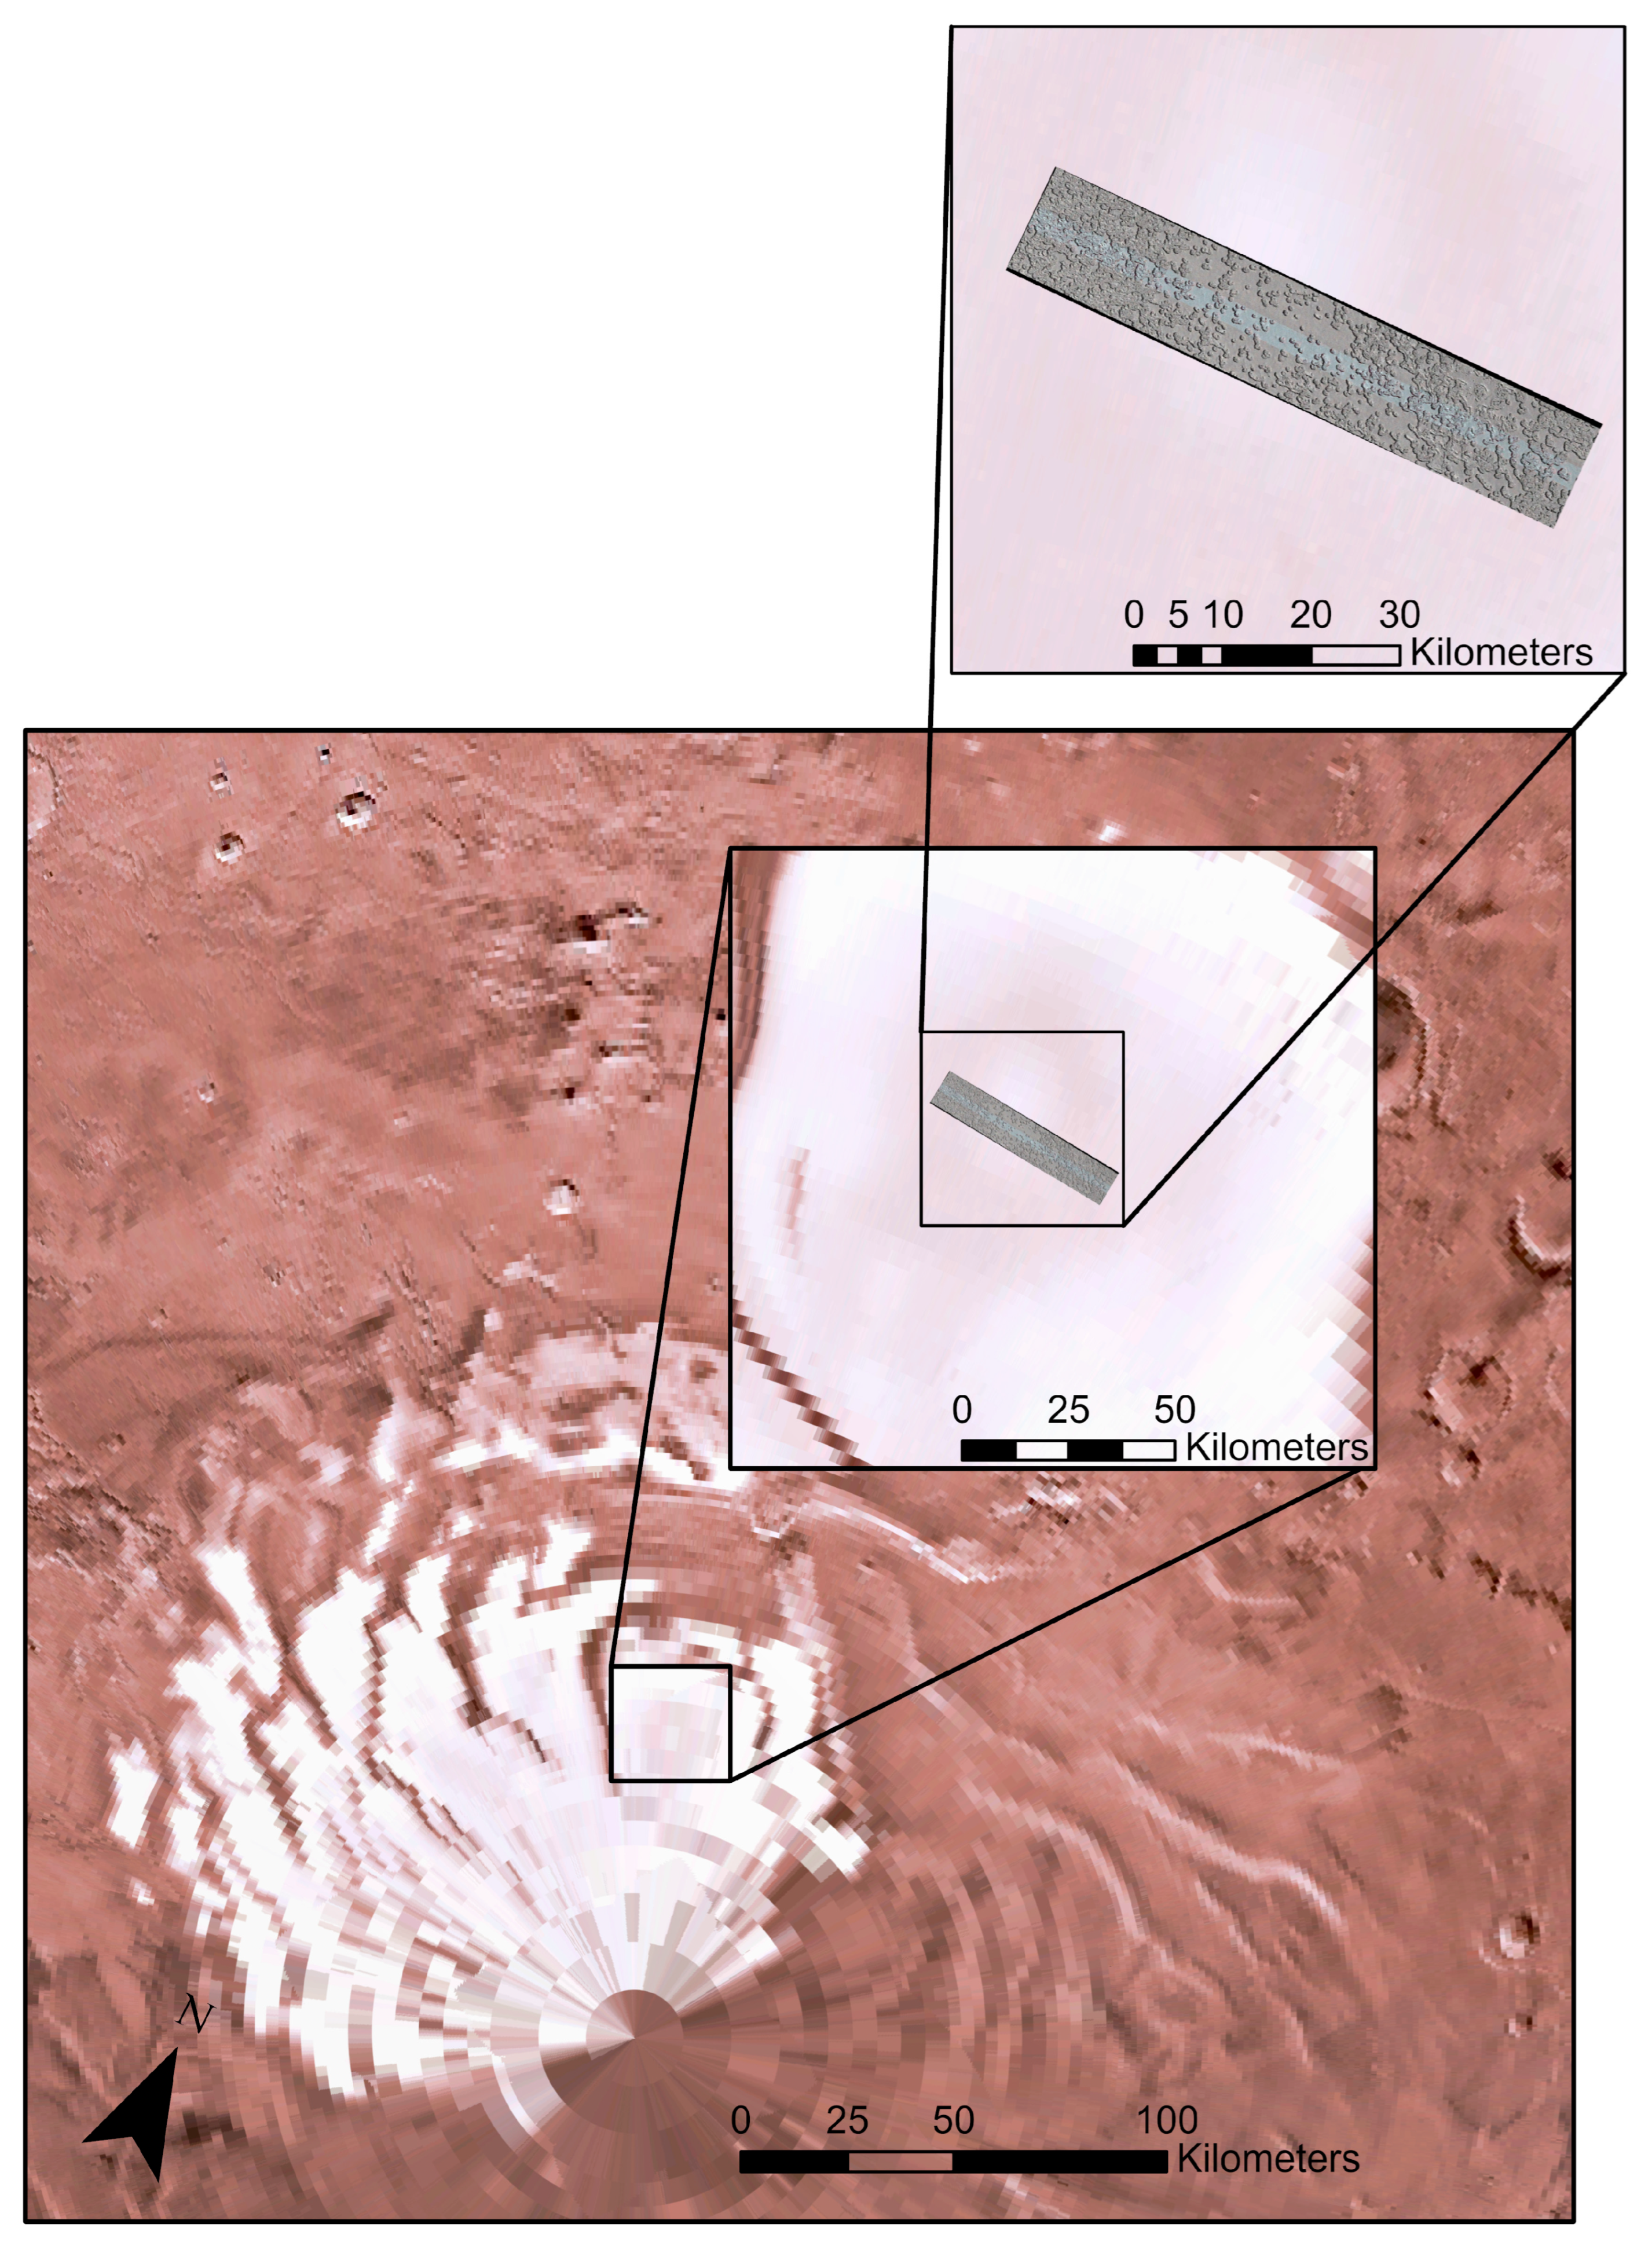
One class of planetary landforms that particularly benefits from OBIA’s capabilities is Mars’ South Polar Swiss cheese features (SCFs). These quasi-circular sublimation pits form in the South Polar Residual Cap (SPRC), a permanent CO
2 ice deposit with an estimated volume of ~380 km
3 [
11] (
Figure 1). This cap persists through the summer due to Mars’ axial tilt of 25° and unique orbital characteristics, which influence the annual deposition and sublimation of CO
2 frost [
12,
13,
14]. Unlike the North Pole, which sublimates its entire CO
2 layer, leaving an H
2O-rich residual cap, the South Pole retains a CO
2-rich cap year-round [
15,
16,
17]. These differences were initially characterized in Viking and MOC data, with later refinements from Mars Global Surveyor, Mars Odyssey, and Mars Reconnaissance Orbiter [
12,
16,
18]. SCFs were first formally described by Thomas et al. (2000), who noted their circularity, flat-topped mesas, and steep-walled pits [
16]. Subsequent studies used MOC and HiRISE data to estimate their average depth at ~8 m using shadow measurements [
19] and found that individual stratigraphic layers within the SPRC can be 1–2 m thick [
19,
20].
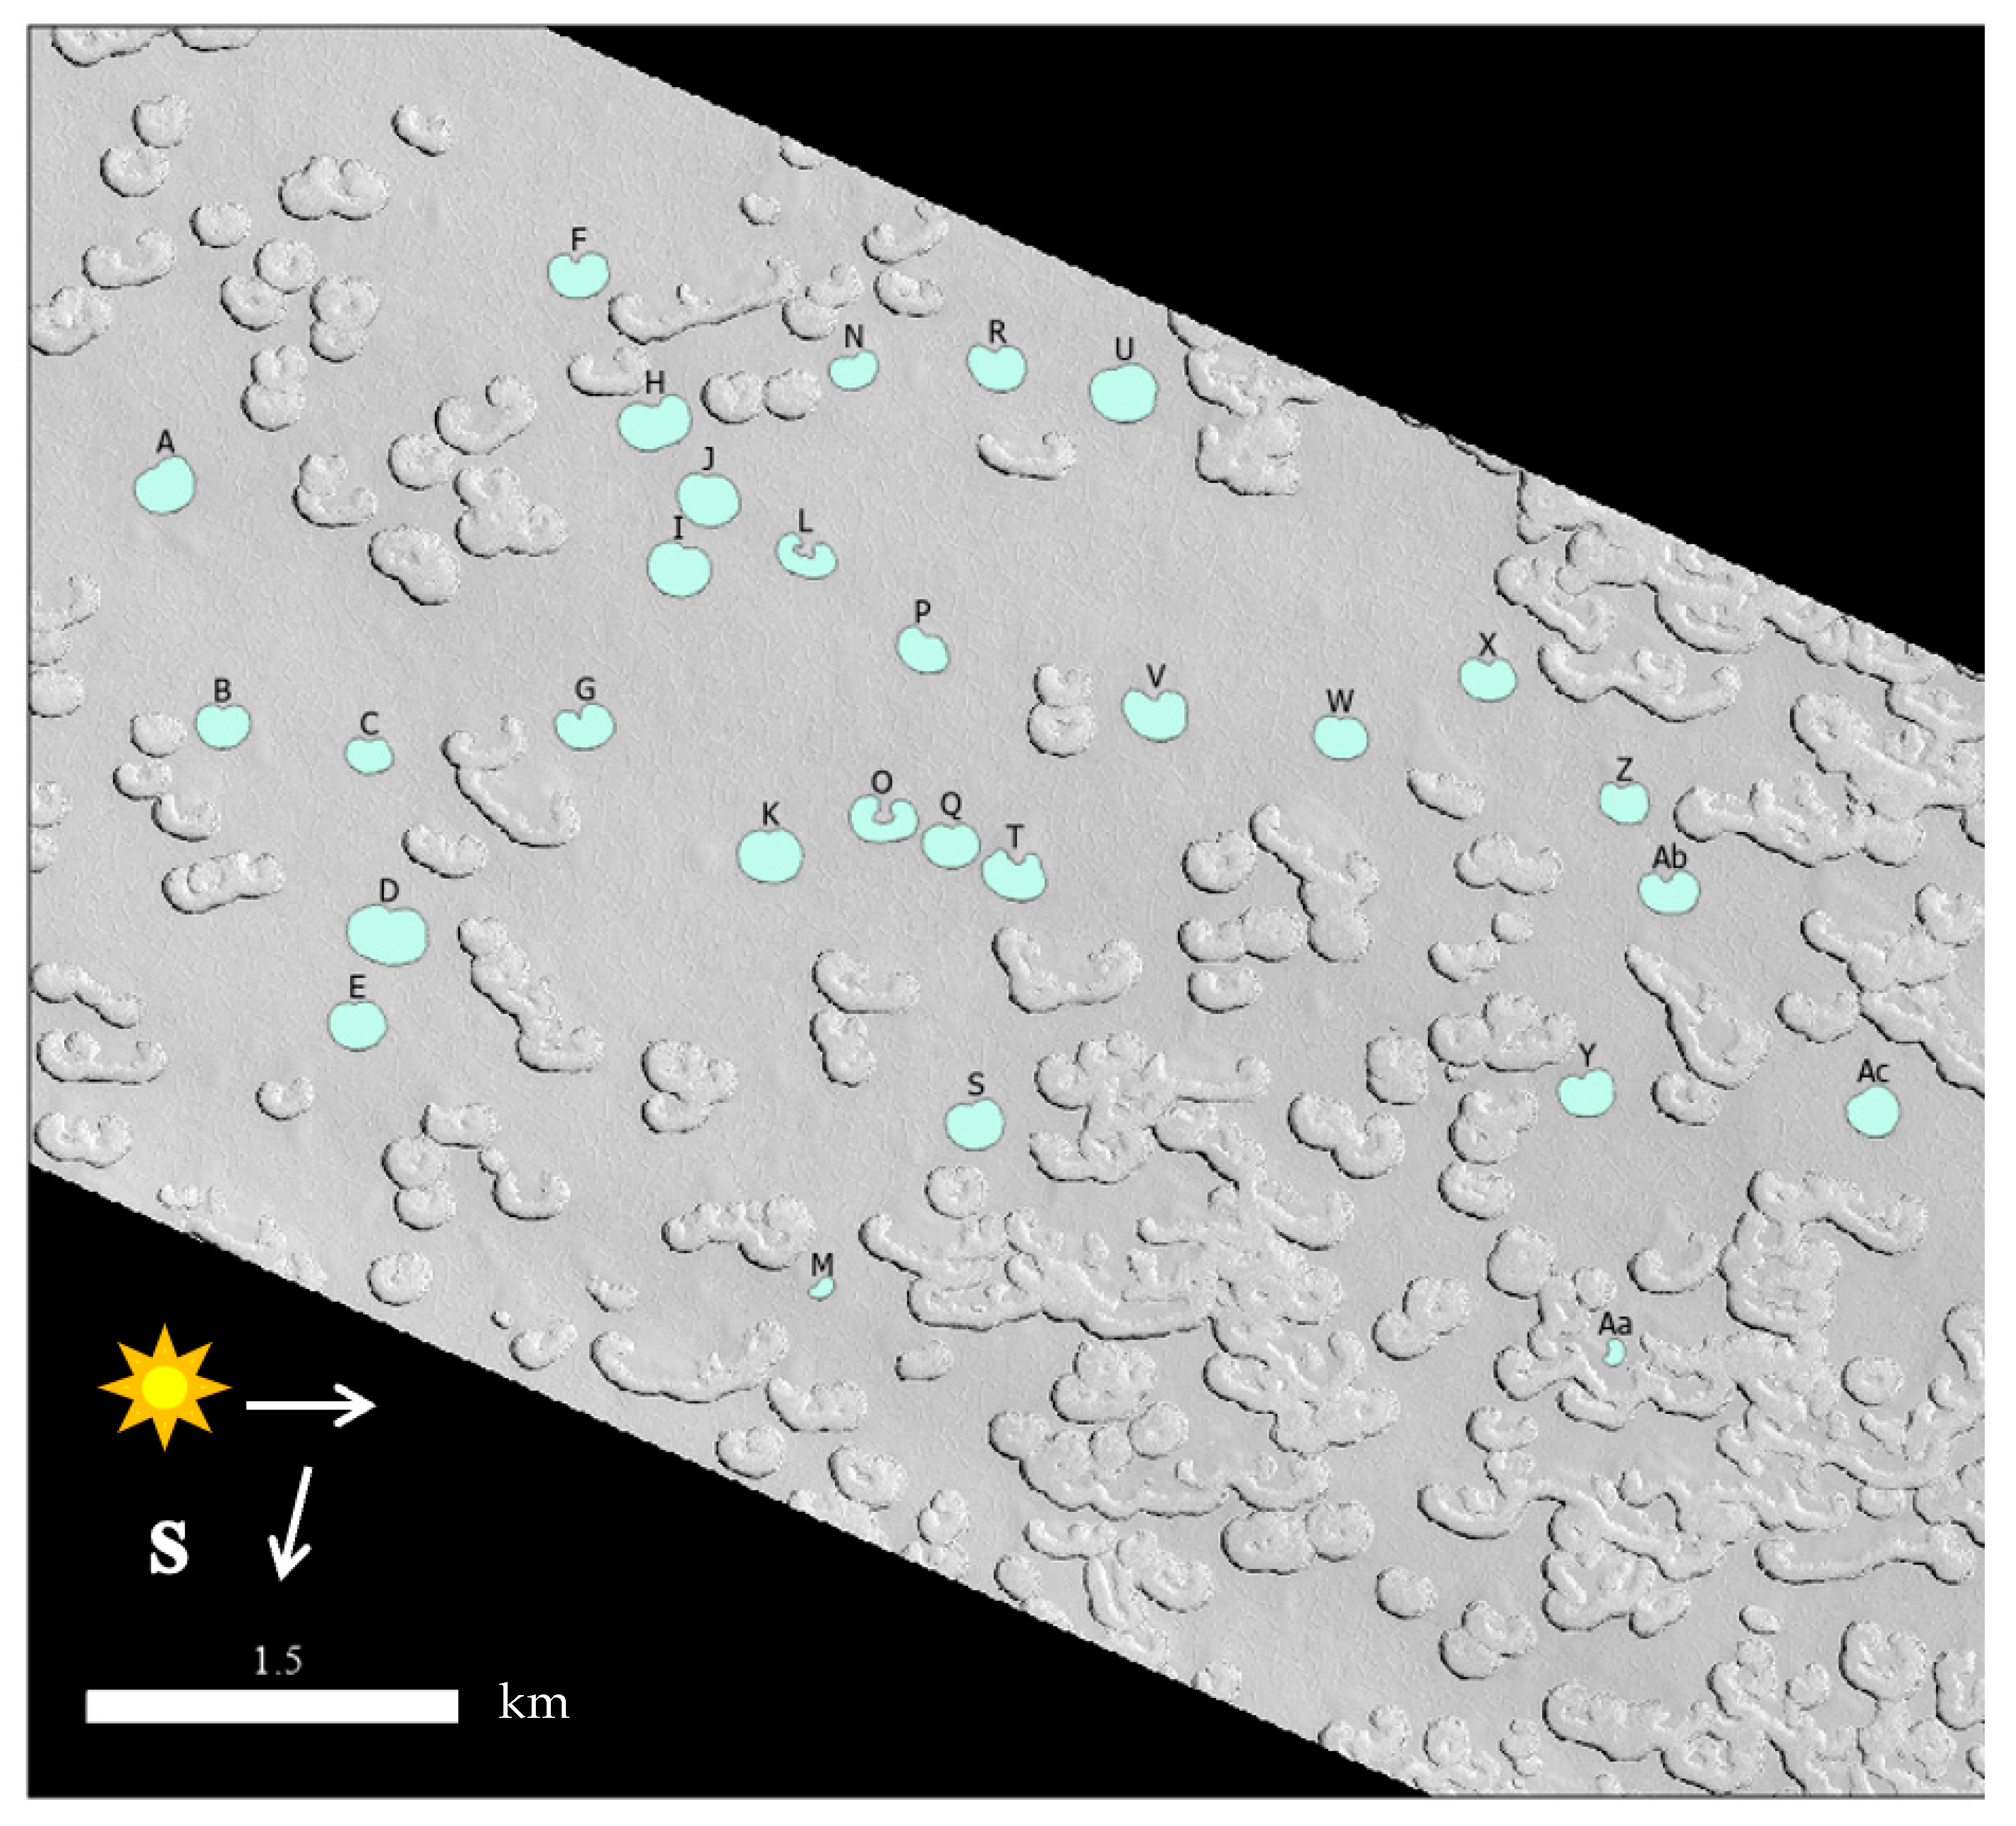
The seasonal formation and retreat of SCFs is driven by solar insolation, which causes CO
2 sublimation at the edges of the pits during spring and summer (
Figure 2) [
2,
3,
14]. Byrne and Ingersoll (2003) modeled this process and concluded that pit growth occurs through lateral sublimation at pit walls, driven by the angle of solar incidence [
21]. The sublimation of these pits contributes to seasonal atmospheric changes, influencing as much as a quarter of the Martian atmospheric CO
2 budget [
9]. As such, SCFs serve as key indicators of polar stability and are critical for understanding long-term volatile transport and the Martian climate system [
3,
12]. Yet most prior SCF mapping efforts have used manual digitization, threshold-based segmentation, or pixel-level classification—methods that are time-intensive, difficult to reproduce, and impractical for processing large volumes of HiRISE imagery [
10,
12].
In this study, we present a semi-automated OBIA framework designed to measure SCF evolution over five Martian years using HiRISE imagery. By segmenting pits as individual objects and quantifying their morphometric attributes (e.g., area, perimeter, circularity, and convexity), we produce consistent, objective measurements of pit retreat and growth over time. Our goal is to bridge the gap between planetary science and OBIA by demonstrating a workflow that is scalable, reproducible, and interpretable. This approach enables robust change detection across multiple time steps and offers a practical foundation for future object-based analyses of dynamic planetary landforms—both on Mars and elsewhere in the solar system.
2. Materials and Methods
To determine the evolution of sublimation pits on the south residual polar cap, we used high-resolution images collected by the High-Resolution Imaging Science Experiment (HiRISE), a camera onboard the Mars Reconnaissance Orbiter (MRO). The altitude of MRO varies between 200–400 km. This directly impacts the spatial resolution of the imagery it collects. HiRISE is a linear array push broom scanner with a width of ~6 km and length of up to ~60 km. HiRISE captures images through three main spectral filters, with 14 parallel CCD (Charged-Coupled Device) detectors, with 10 CCDs in the red band, 2 in the blue/green bands, and 2 in the near infrared band. The nominal spatial resolution of HiRISE is ~0.25 m/pixel at a 300 km altitude [
22].
Trimble eCognition 10.2 was used to develop and implement the object-based image analysis (OBIA) workflow applied in this study (
Figure 3). A hierarchical design was adopted, structured through a ruleset framework as defined within the eCognition software environment [
1,
3,
4]. The ruleset integrates multiple scale parameters, including polygonal shape recognition, object-based homogeneity metrics, and minimum albedo thresholds, allowing for a multi-level, non-linear classification strategy.
Object-based image analysis (OBIA) differs fundamentally from traditional pixel-based classification by aggregating adjacent pixels into spatially contiguous, spectrally and texturally homogeneous objects. These objects, rather than individual pixels, become the primary units of analysis. This methodological shift is particularly advantageous when delineating irregular or morphologically complex surface features, such as Swiss cheese features (SCFs), where spatial coherence, edge continuity, and internal variance are critical parameters [
23]. eCognition facilitates this workflow through a sequence of image segmentation, feature extraction, and context-based object refinement, incorporating both internal object properties and external relational metrics (e.g., adjacency, proximity, and border relationships) [
9].
For this study, we developed a structured object-based image analysis (OBIA) workflow implemented in Trimble eCognition. The workflow consists of five key stages: (1) multi-resolution segmentation to generate objects, (3) object reshaping to refine edges, (4) noise control and merging of small fragments, (5) classification based on object metrics, and (6) export of the final pit vectors to a GIS for measurement. A flow diagram of the complete process is presented in
Figure 3.
Segmentation constitutes the initial step, wherein the image is partitioned into discrete, polygonal objects based on thresholds in spatial and spectral homogeneity [
2,
5]. In this study, segmentation parameters were optimized to isolate relevant features, including non-pit mesa surfaces, merged pit complexes, and inner shadow regions. Variables such as object shape, size, texture, and spatial location were used to guide the segmentation process.
Contextual reshaping operations were subsequently applied, leveraging a nearest neighbor analysis to refine object boundaries and enhance classification accuracy [
7]. Concurrently, noise control mechanisms merged smaller homogeneous fragments into larger, adjacent objects based on relational border percentage thresholds, with automatic re-segmentation performed where criteria were unmet. This multi-scale object-based framework aligns with recent best practices in planetary landform extraction [
24,
25].
Following segmentation and reshaping, image objects were classified into three thematic categories: pits, non-pits, and merged pits. This classification scheme reflects the established morphological types of Swiss cheese features described in previous studies, which distinguish between isolated depressions, flat mesa surfaces, and compound pits resulting from coalescence [
11,
12,
16]. The classification process employed a decision rule framework based on object-level attributes, including gray-level co-occurrence matrix (GLCM) homogeneity, mean brightness, polygonal shape descriptors (e.g., compactness and elongation), and size metrics. To account for scene-specific differences in illumination and seasonal contrast, image-specific OBIA parameters were defined and applied during both segmentation and classification stages. Objects were assigned to one of the three classes based on threshold values set within the ruleset, allowing for selective export of individual categories or grouped outputs for further analysis.
Final classified polygons were subsequently imported into ArcGIS Pro 3.4.0 for areal measurements and spatial statistical analyses.
3. Results
An accuracy assessment was conducted to validate the object-based image analysis (OBIA) method against manual digitization of three arbitrarily selected pits from HiRISE image PSP_004687_0930. As shown in
Table 1, the areas derived from OBIA differed from manually digitized areas by less than 1% for all three pits. Pit O showed a difference of 0.98%, Pit Q differed by 0.24%, and Pit T differed by 0.99%. These minimal differences confirm that the OBIA methodology reliably captures pit boundaries with high precision, enabling its application for broader temporal analysis. The coefficient of determination (R
2) quantifies how well the linear regression model explains the variability in pit area as a function of estimated formation time. In this study, R
2 values ranging from 0.918 to 0.991 indicate that the linear models captured a strong and consistent relationship between pit growth and time, with over 91% to 99% of the observed variation in area explained by the model.
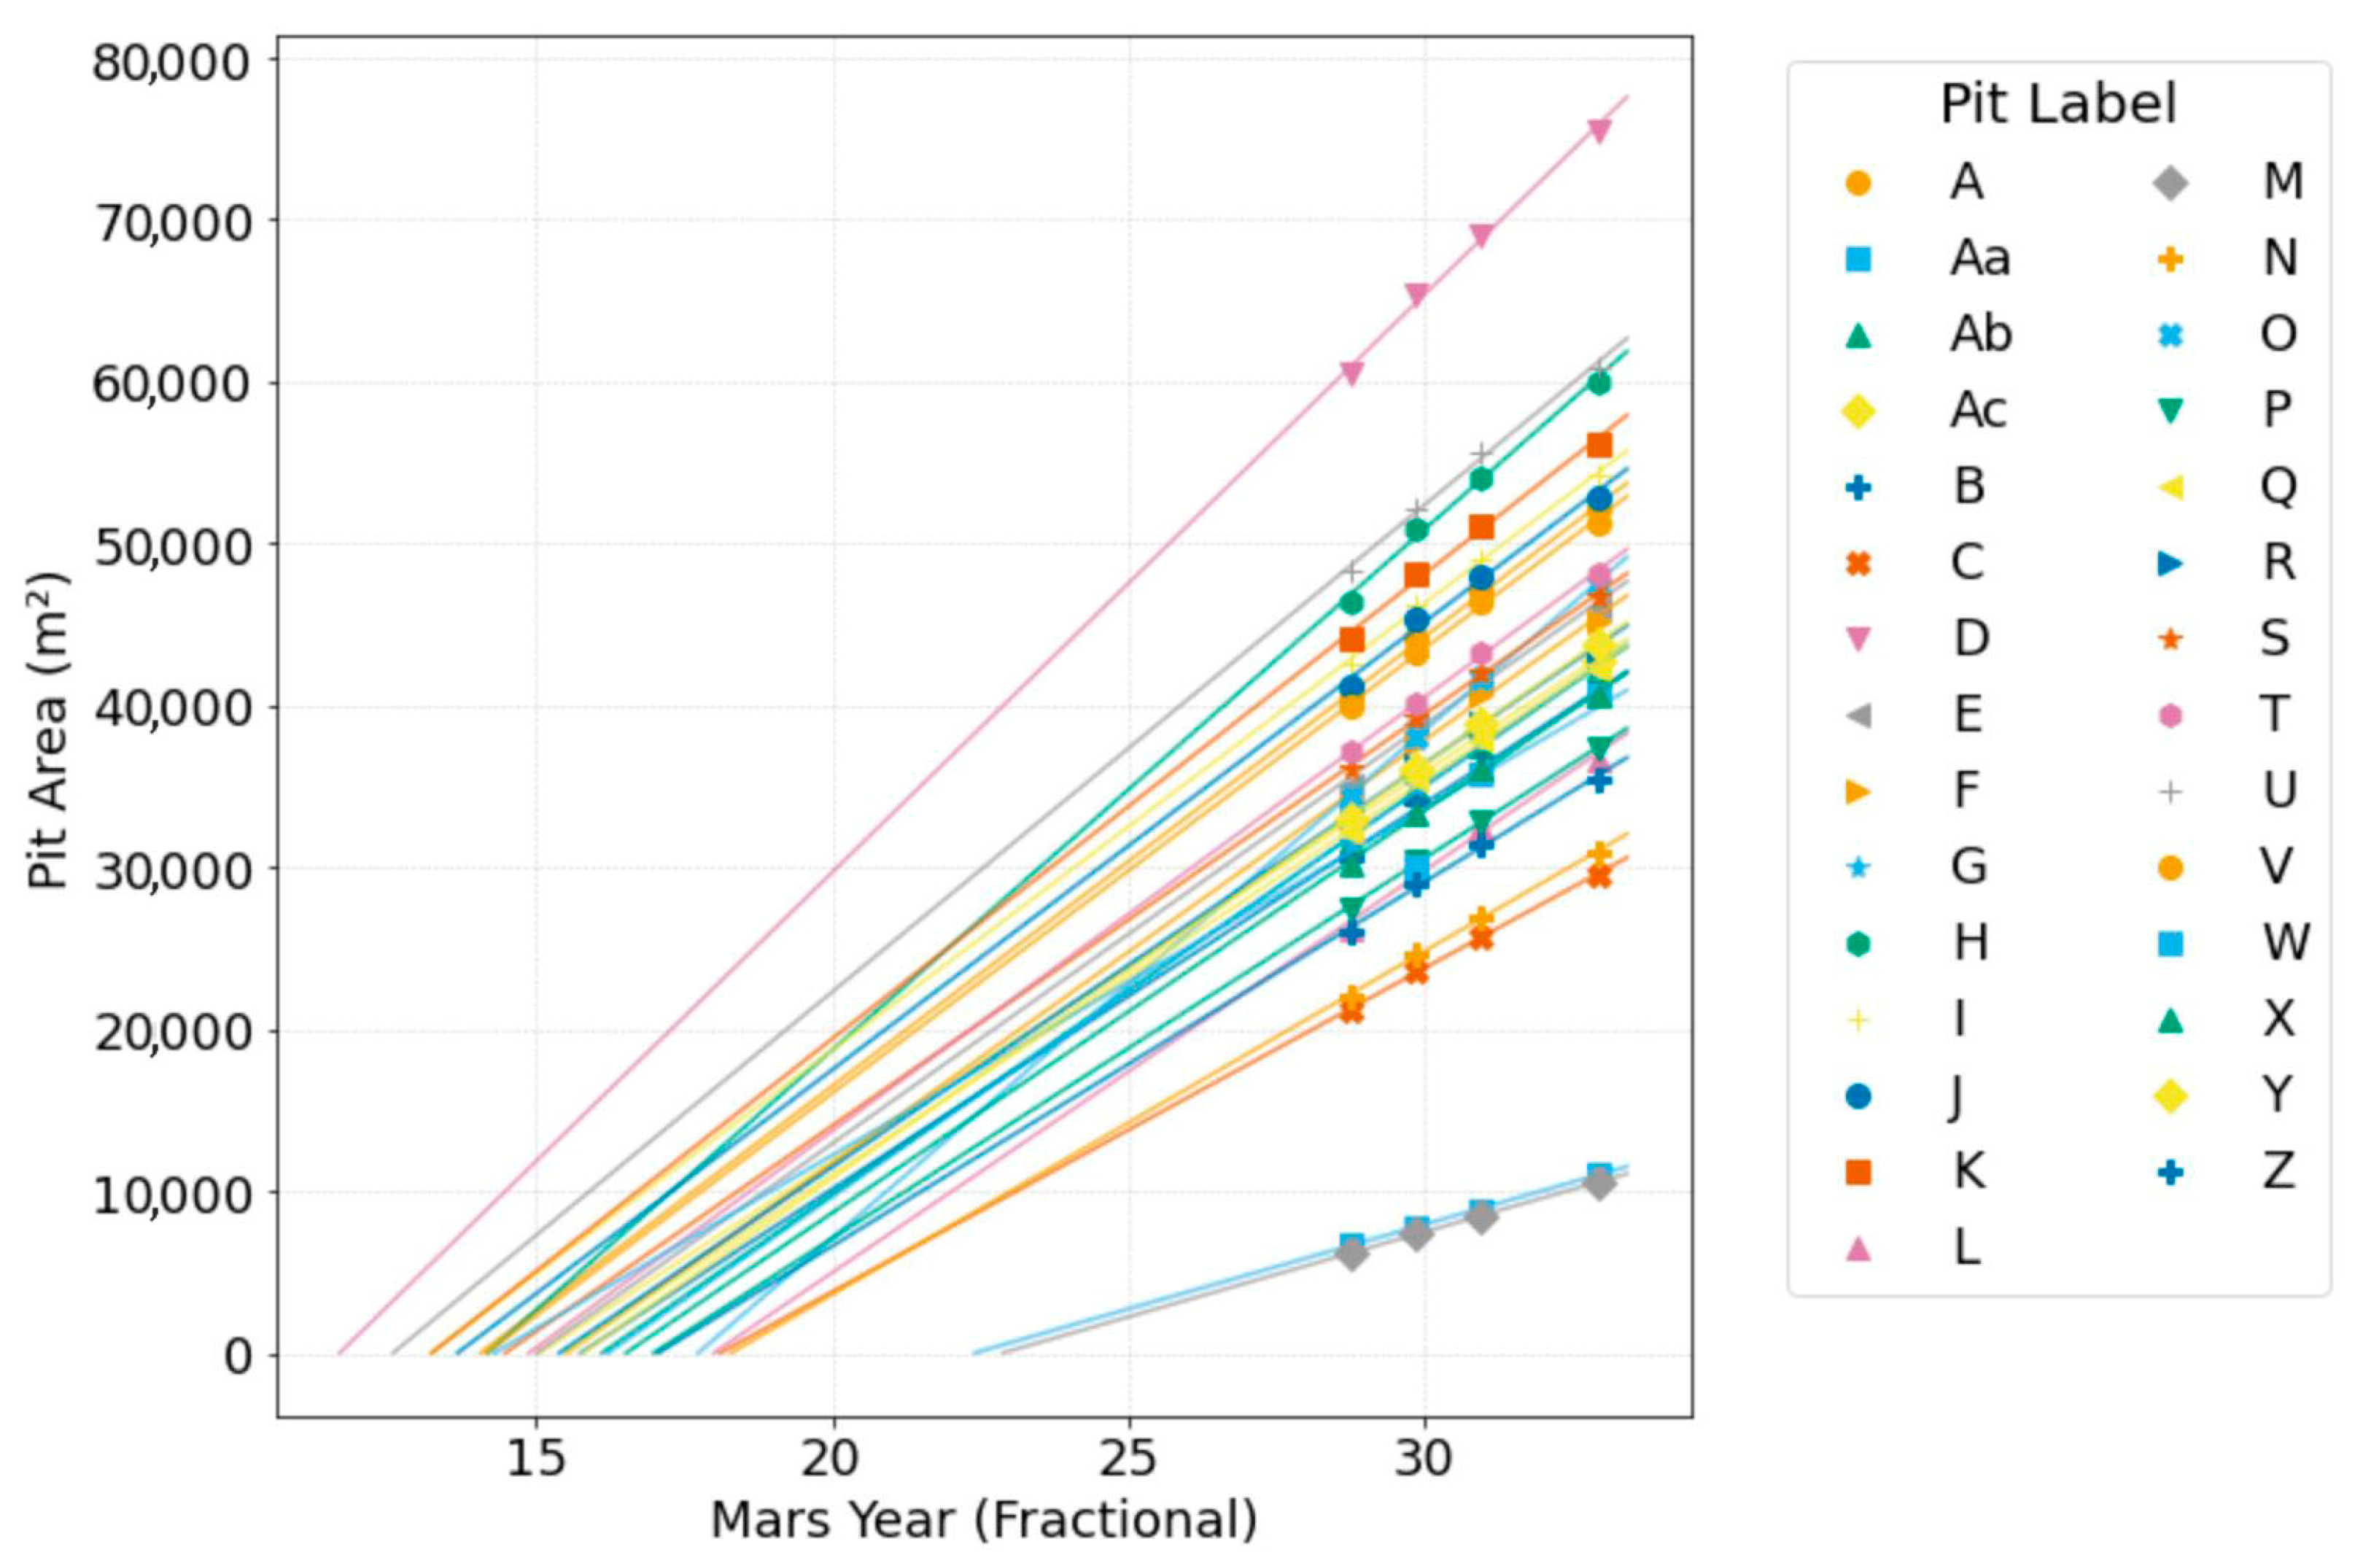
Following validation, pit areas were measured across 4 HiRISE images collected over a span of five Martian years, from MY 27 to MY 33. Measurements consistently demonstrated an increase in pit area over time. As shown in
Figure 4, a near-linear relationship is evident between pit area and fractional Martian year for all pits.
Across all 29 pits shown in
Figure 5, the average growth rate was approximately 2499.24 m
2 per Martian year, with individual rates ranging from 1043 to 3566 m
2/MY. Despite this variability, the regression models consistently showed strong linear fits, with an average R
2 value of 0.98, indicating that sublimation-driven pit expansion generally followed a linear trend throughout the study interval. These results validate the use of linear modeling to estimate pit formation timing and support the broader interpretation of SCF evolution as a sustained, ongoing process.
Extrapolation of the linear regression models allows for an estimation of when each pit reached a near-zero area, interpreted as the likely beginning of pit formation. For example, regression lines project backward to formation points at approximately Martian year 18.4 for Pit O, MY 16.2 for Pit Q, and MY 15.6 for Pit T. These estimates were derived from linear models of pit area versus fractional Martian year, calculated as the sum of the Mars year and the solar longitude (Ls) divided by 360. This method provides a sub-annual, temporal resolution, allowing for the precise alignment of measurements taken at different points in the Martian seasonal cycle. Model fit was assessed using the coefficient of determination (R2). The consistently high R2 values indicate that pit growth is well-approximated by a linear trend over the observed time span.
While the regression fits are strong (0.98 R2 average for all pits), it is important to note that extrapolation assumes a constant sublimation rate over time. This approach does not explicitly account for local topographic effects, interannual climate variability, or shifts in insolation caused by changes in Mars’ obliquity. Nevertheless, the near-linear growth trends and agreement across independently measured pits provide plausible support for the inferred timelines.
4. Discussion
The extended regression lines in
Figure 5 indicate that these SCFs currently observed on Mars’ South Polar Residual Cap likely began forming between Martian years 7 and 16. These estimates were derived by extrapolating pit area growth trends backward to the point at which the pit area approaches zero. While fractional Martian years were used in the regression analysis to preserve sub-annual precision, final formation estimates were rounded to the nearest Mars year for interpretability. This formation window suggests that the observed SCFs are geologically young features, formed within the last 20 to 30 Martian years, under ongoing sublimation-driven processes.
To independently validate these formation estimates, we also calculated the Earth year of pit (
E) formation using the following equation [
26]:
where
R represents the acquisition year of the most recent HiRISE image used in this study, 2015. In this equation, the Martian pit age (variable
A, in Mars years–MY) is multiplied by 687 (
L, the number of Earth days in a Martian year) and divided by 365.2425 (
D, the length of an Earth year in Earth days under the Gregorian calendar system). This method introduces only minor uncertainty, as the effects of leap year corrections are incorporated within the 365.2425 divisor. Additional adjustments for accumulated leap days would account for only a few months’ difference over the timescales analyzed, falling within the overall margin of error. Applying this method to all 29 pits in the dataset yields an estimated Earth-year formation range between approximately 1976 and 1998.
Calculating the approximate Earth year of pit formation provides a meaningful cross-planetary temporal context that complements the Martian-year-based analysis. This is not meant to imply a precise Earth-age correlation but rather to anchor Martian surface evolution in terms familiar to climate science and geologic time on Earth. For example, Byrne and Ingersoll (2003) estimated that Swiss cheese features (SCFs) began forming between Earth years 1600 and 1920 based on modeling sublimation rates and observed cap retreat [
21]. By translating our modeled formation ages into Earth years, we enabled a direct comparison to this earlier work, which was expressed entirely in Earth calendar terms [
7]. The broad consistency of our results with their proposed timeline supports the idea that SCF formation is ongoing and that the pits analyzed in this study are representative of the most recent generation of polar activity. Additionally, expressing ages in Earth years helps connect Mars’ volatile-driven surface changes to broader solar insolation trends or historical orbital configurations that are often cataloged in Earth years [
27].
The rapid lateral expansion of SCFs observed in this study further supports the conclusion that these features are geologically young (
Figure 5). Byrne and Ingersoll (2003) [
21] demonstrated, based on Mars Orbiter Camera (MOC) observations, that individual pits could form within approximately 100 to 200 Earth years under a constant sublimation-driven expansion. Subsequent measurements by Thomas et al. (2005) [
19] confirmed active pit growth between successive imaging campaigns, highlighting the ongoing and dynamic nature of SCF formation. Later reviews by Byrne (2009) [
18] reinforced the interpretation that SCFs are among the youngest geomorphological features on Mars, dynamically evolving under present-day climate conditions. Together, these findings align closely with the rates calculated in this study.
Byrne and Ingersoll (2003) proposed a sublimation model suggesting that the CO
2 ice layer, approximately 8 m thick, is being etched away, revealing underlying water ice [
21]. This model is supported by thermal infrared data indicating the presence of water ice beneath the CO
2 layer [
17,
21,
22]. Additionally, the angle of sunlight during the Martian summer causes the walls of these pits to receive more intense sunlight than the floors, leading to increased sublimation at the walls and a gradual enlargement of the pits [
12,
15,
16,
21]. Over time, this process contributes to the dynamic and ever-changing landscape of the SPRC [
11,
15,
19,
21,
28,
29].
However, the process of estimating the age of CO
2 sublimation pits based on their growth rate is more complex than a straightforward linear relationship. Several factors, such as the size of the pits, the rate of sublimation, seasonal variations, and atmospheric changes, are likely to influence the growth patterns. A larger pit would likely experience greater exposure to solar radiation, which would accelerate sublimation at its edges [
12,
17]. In contrast, a smaller pit might grow more slowly [
17,
19]. The sublimation rate may not be constant over time; it could increase as the pit grows larger, because a larger area would expose more CO
2 ice to the atmosphere [
17,
30]. Additionally, a pit’s size and depth influence the amount of material that can sublimate, making the growth rate non-linear rather than strictly linear as the pits evolve [
17,
19,
30]. Modeling sublimation using in situ analogs and thermophysical layering improves predictions of pit morphology over time [
29].
At the poles, the atmosphere condenses into the seasonal caps, where CO
2 and water vapor freeze out of the atmosphere and accumulate as ice. High-resolution climate models now incorporate CO
2 cloud microphysics that reveal greater spatial variability in polar sublimation rates [
31]. These seasonal caps, which grow and recede with the changing seasons, are strongly influenced by the global Hadley cells that govern Martian atmospheric circulation (
Figure 1). The Hadley cells drive the movement of air from the equator toward the poles, with warm air rising at low latitudes and cooler air sinking near the poles. This circulation pattern not only dictates the distribution of atmospheric pressure but also plays a key role in the exchange of gases between the atmosphere and the polar caps [
17,
30,
32,
33,
34]. Notably, these cells reverse direction between Martian seasons, with the northern hemisphere experiencing a shift in wind patterns during the winter as opposed to the summer [
12,
17,
30,
33,
34]. This seasonal atmospheric reversal contributes to changes in the rate of CO
2 sublimation and condensation, affecting the dynamics of the polar ice caps and, by extension, the pits observed in this study. By analyzing the growth patterns of the pits over time, it becomes evident that the seasonal exchange between sublimated CO
2 and the atmosphere is a key factor in the observed pit growth, with the Hadley cells likely influencing the rate and extent of sublimation during each Martian year [
12,
14,
17,
19,
30]. Recent numerical simulations of pit growth under varying obliquity cycles suggest that present-day rates are relatively high due to orbital forcing [
35].
Differences in the estimated start year may result from several factors, including spatial resolution differences, data volume, and the number of features analyzed. Byrne and Ingersoll (2003) [
21] utilized both MOC imagery, with spatial resolutions down to tens of meters per pixel, and Thermal Emission Imaging System (THEMIS) data at a ~100 m/pixel resolution. In contrast, this study relied exclusively on HiRISE imagery, with a resolution of approximately 0.25 m/pixel, allowing for more precise delineation of individual SCFs. Additionally, the sample sizes differ substantially; Byrne and Ingersoll (2003) analyzed approximately 370 features, whereas this investigation tracked a smaller set of features over a longer temporal baseline of nine Earth years [
21]. A larger number of features typically results in a broader range of estimated formation ages due to the inclusion of morphologically diverse examples. In situ validation through rover-based imaging remains a future goal but may build on analog OBIA methods tested in Earth deserts [
6].
Although research on Swiss cheese feature evolution remains a specialized topic, numerous studies since the early 2000s have examined SCF formation, growth rates, and related processes on the RSPC. These features are unusual in that they evolve over timescales of a few hundred years, unlike most geological processes typically studied over thousands to millions of years. These studies contribute to a broader understanding of Martian paleoclimate, as the growth and retreat of polar deposits offer a time-resolved signal of atmospheric evolution [
13].


