Abstract
A timely and accurate distribution of crop types and cropping patterns provides a crucial reference for the management of agriculture and food security. However, accurately mapping crop types and cropping patterns in subtropical hilly and mountainous areas often face challenges such as mixed pixels resulted from fragmented patches and difficulty in obtaining optical satellites due to a frequently cloudy and rainy climate. Here we propose a crop type and cropping pattern mapping framework in subtropical hilly and mountainous areas, considering multiple sources of satellites (i.e., Landsat 8/9, Sentinel-2, and Sentinel-1 images and GF 1/2/7). To develop this framework, six types of variables from multi-sources data were applied in a random forest classifier to map major summer crop types (singe-cropped rice and double-cropped rice) and winter crop types (rapeseed). Multi-scale segmentation methods were applied to improve the boundaries of the classified results. The results show the following: (1) Each type of satellite data has at least one variable selected as an important feature for both winter and summer crop type classification. Apart from the endmember variables, the other five extracted variable types are selected by the RF classifier for both winter and summer crop classifications. (2) SAR data can capture the key information of summer crops when optical data is limited, and the addition of SAR data can significantly improve the accuracy as to summer crop types. (3) The overall accuracy (OA) of both summer and winter crop type mapping exceeded 95%, with clear and relatively accurate cropland boundaries. Area evaluation showed a small bias in terms of the classified area of rapeseed, single-cropped rice, and double-cropped rice from statistical records. (4) Further visual examination of the spatial distribution showed a better performance of the classified crop types compared to three existing products. The results suggest that the proposed method has great potential in accurately mapping crop types in a complex subtropical planting environment.
1. Introduction
Hilly and mountain agriculture plays an important role in ensuring regional food security and supporting rural livelihoods [1], especially in many developing countries where a significant portion of the population depends on sloped lands for subsistence farming [2]. The diverse climatic conditions and elevation gradients in hilly and mountainous areas support a wide variety of crop types and mixed farming systems [3]. However, this agricultural diversity, combined with highly fragmented land parcels and frequent cloud cover, especially in subtropical and tropical mountainous regions, poses significant challenges for accurately mapping crop types and patterns. The spectral similarity between different crops, along with variable planting times and rotating practices, further complicates the development of robust and transferable classification algorithms in these regions.
In recent years, the increasing availability of satellite data, combined with the advancement of cloud computing, has offered new opportunities for crop mapping using remote sensing technologies. Remote sensing technology, as an efficient Earth observation tool, offers large-scale spatial and temporal data, maintaining both time-efficiency and cost-effectiveness, making it suitable for large-scale crop mapping and monitoring. MODIS imagery with a moderate spatial resolution has been widely applied in large-area crop classification research [4]. Though this sensor has a high temporal resolution (daily), due to its coarse spatial resolution, imagery in mountainous areas is prone to mixed pixels, leading to high commission and omission errors in crop classification. In recent years, the successful launch and application of satellites such as Landsat 8, Landsat 9, and Sentinel-2 (including satellites a, b, and c) have significantly improved the spatial resolution of optical Earth observation data (10–30 m), providing valuable and freely accessible datasets for high-precision crop mapping [5]. However, due to the relatively low temporal resolution of individual satellites or sensors (10–16 days), and the frequent interference of clouds and rain in mountainous regions, it remains challenging to distinguish spectrally similar crops based on phenological information [6]. The integration of multi-source optical remote sensing data can substantially enhance the frequency of monitoring and more accurately capture the phenological characteristics of different crops, making it an effective approach to improving the accuracy of high spatial resolution crop classification.
However, the quality of optical imagery is susceptible to cloud cover and shadows, particularly in mountainous regions with frequent cloud and rain, making it difficult to obtain high-quality data. Synthetic Aperture Radar (SAR) data, such as Sentinel-1, can penetrate cloud cover and perform continuous imaging, enabling it to better capture crops’ phenological variables [7]. Therefore, the integration of optical and SAR data can effectively overcome the limitations in quality of optical data during the rainy season, enhance the frequency of monitoring of crop types during this period, and consequently improve the accuracy in distinguishing between different but spectrum-similar crop types [8,9,10]. For instance, Demarez et al. (2019) discovered that the combination of optical and SAR data enhanced to an 0.89 Kappa Coefficient the early classification of irrigated crops (sunflower and maize) in temperate regions [11]. Chakhar et al. (2021) demonstrated that the combination of Sentinel-1 (VV and VH backscatter) and Sentinel-2A (NDVI) data performed well in complex crop (e.g., wheat, barley, maize, etc.) classification in Southeast Spain, with an F1 score of 0.93 [12]. Blickensdörfer et al. (2022) utilized Landsat 8, Sentinel-2, and Sentinel-1 imagery to produce crop (e.g., winter wheat, rapeseed, silage maize, etc.) maps in Germany under varying weather conditions; the overall accuracy ranged between 78% and 80%. These maps showed a high level of agreement with the field data, demonstrating that multi-source data approaches offer a higher classification accuracy than single-sensor methods in complex climates [13]. In addition, digital elevation models (DEMs) have been shown to significantly improve the performance of crop classification [14,15], particularly in mountainous regions with complex cropping patterns and tropical/subtropical areas prone to persistent cloud cover [16,17]. While the integration of multi-source data can enhance the classification accuracy, more data does not always lead to better results. Redundant input features may increase the computational burden [18] and even reduce the classification’s effectiveness [19]. Therefore, the selection of input features is essential for optimizing classification performance [20].
Rapeseed and rice are important economic and staple crops in mountainous agriculture. At the national scale, many scholars have already published spatial distribution data for these two types of crops. For instance, Qiu et al. (2024) generated a map of the major rice cultivation regions in Southern China using Sentinel-1 and Sentinel-2 data, achieving an overall accuracy of 91.92% [21]. Zang et al. (2023) produced a China rapeseed map with a 20 m resolution for the period from 2017 to 2021 based on Sentinel-2 data, with an average accuracy of 94.90% [22]. Liu et al. (2024) produced a 30 m resolution national rapeseed map from 2000 to 2022 based on Landsat imagery, meteorological data, existing land cover products, and topographic data, with average F1 scores of 0.87 for winter rapeseed and 0.97 for spring rapeseed [23]. Liu et al. (2024) produced national maps of major food crops, including single-cropped and double-cropped rice, from 1985 to 2020 based on long-term Landsat imagery, achieving an overall accuracy of 93.57% [24]. Shen et al. (2023) produced national maps of the distribution of single-cropped rice with a spatial resolution of 10 m and 20 m by integrating optical and Synthetic Aperture Radar imagery, achieving an overall accuracy of 85.23% [25]. Although these publicly available datasets have demonstrated a reasonably good validation accuracy at the national scale, they still suffer from many misclassifications and omissions in hilly and mountainous regions. Furthermore, these products are all generated at the pixel level, and their boundaries often do not align well with the actual field parcel boundaries [26]. Hence, there is a pressing need for combining an object segmentation method using high spatial resolution imagery with existing crop classification methods on hilly and mountainous regions.
In subtropical hilly and mountainous regions, the complex terrain, fragmented cultivated land, and frequent cloudy and rainy weather pose considerable challenges for the classification of crop types for cropping pattern recognition due to an unstable optical image quality. To tackle these issues, this study integrates multi-source optical data (Landsat 8/9, Sentinel-2, GF-1/2/7) and SAR data (Sentinel-1), focusing on a typical subtropical hilly area in China, to carry out a detailed classification of crop types and cropping patterns. The objectives of this study are (1) to improve crop parcel boundaries using multi-scale segmentation; (2) to build a robust classification method for winter crops and summer crops based on multi-source data; and (3) to achieve cropping pattern mapping with reliable accuracy in subtropical hilly areas.
2. Study Area and Data Source
2.1. Overview of the Study Sites
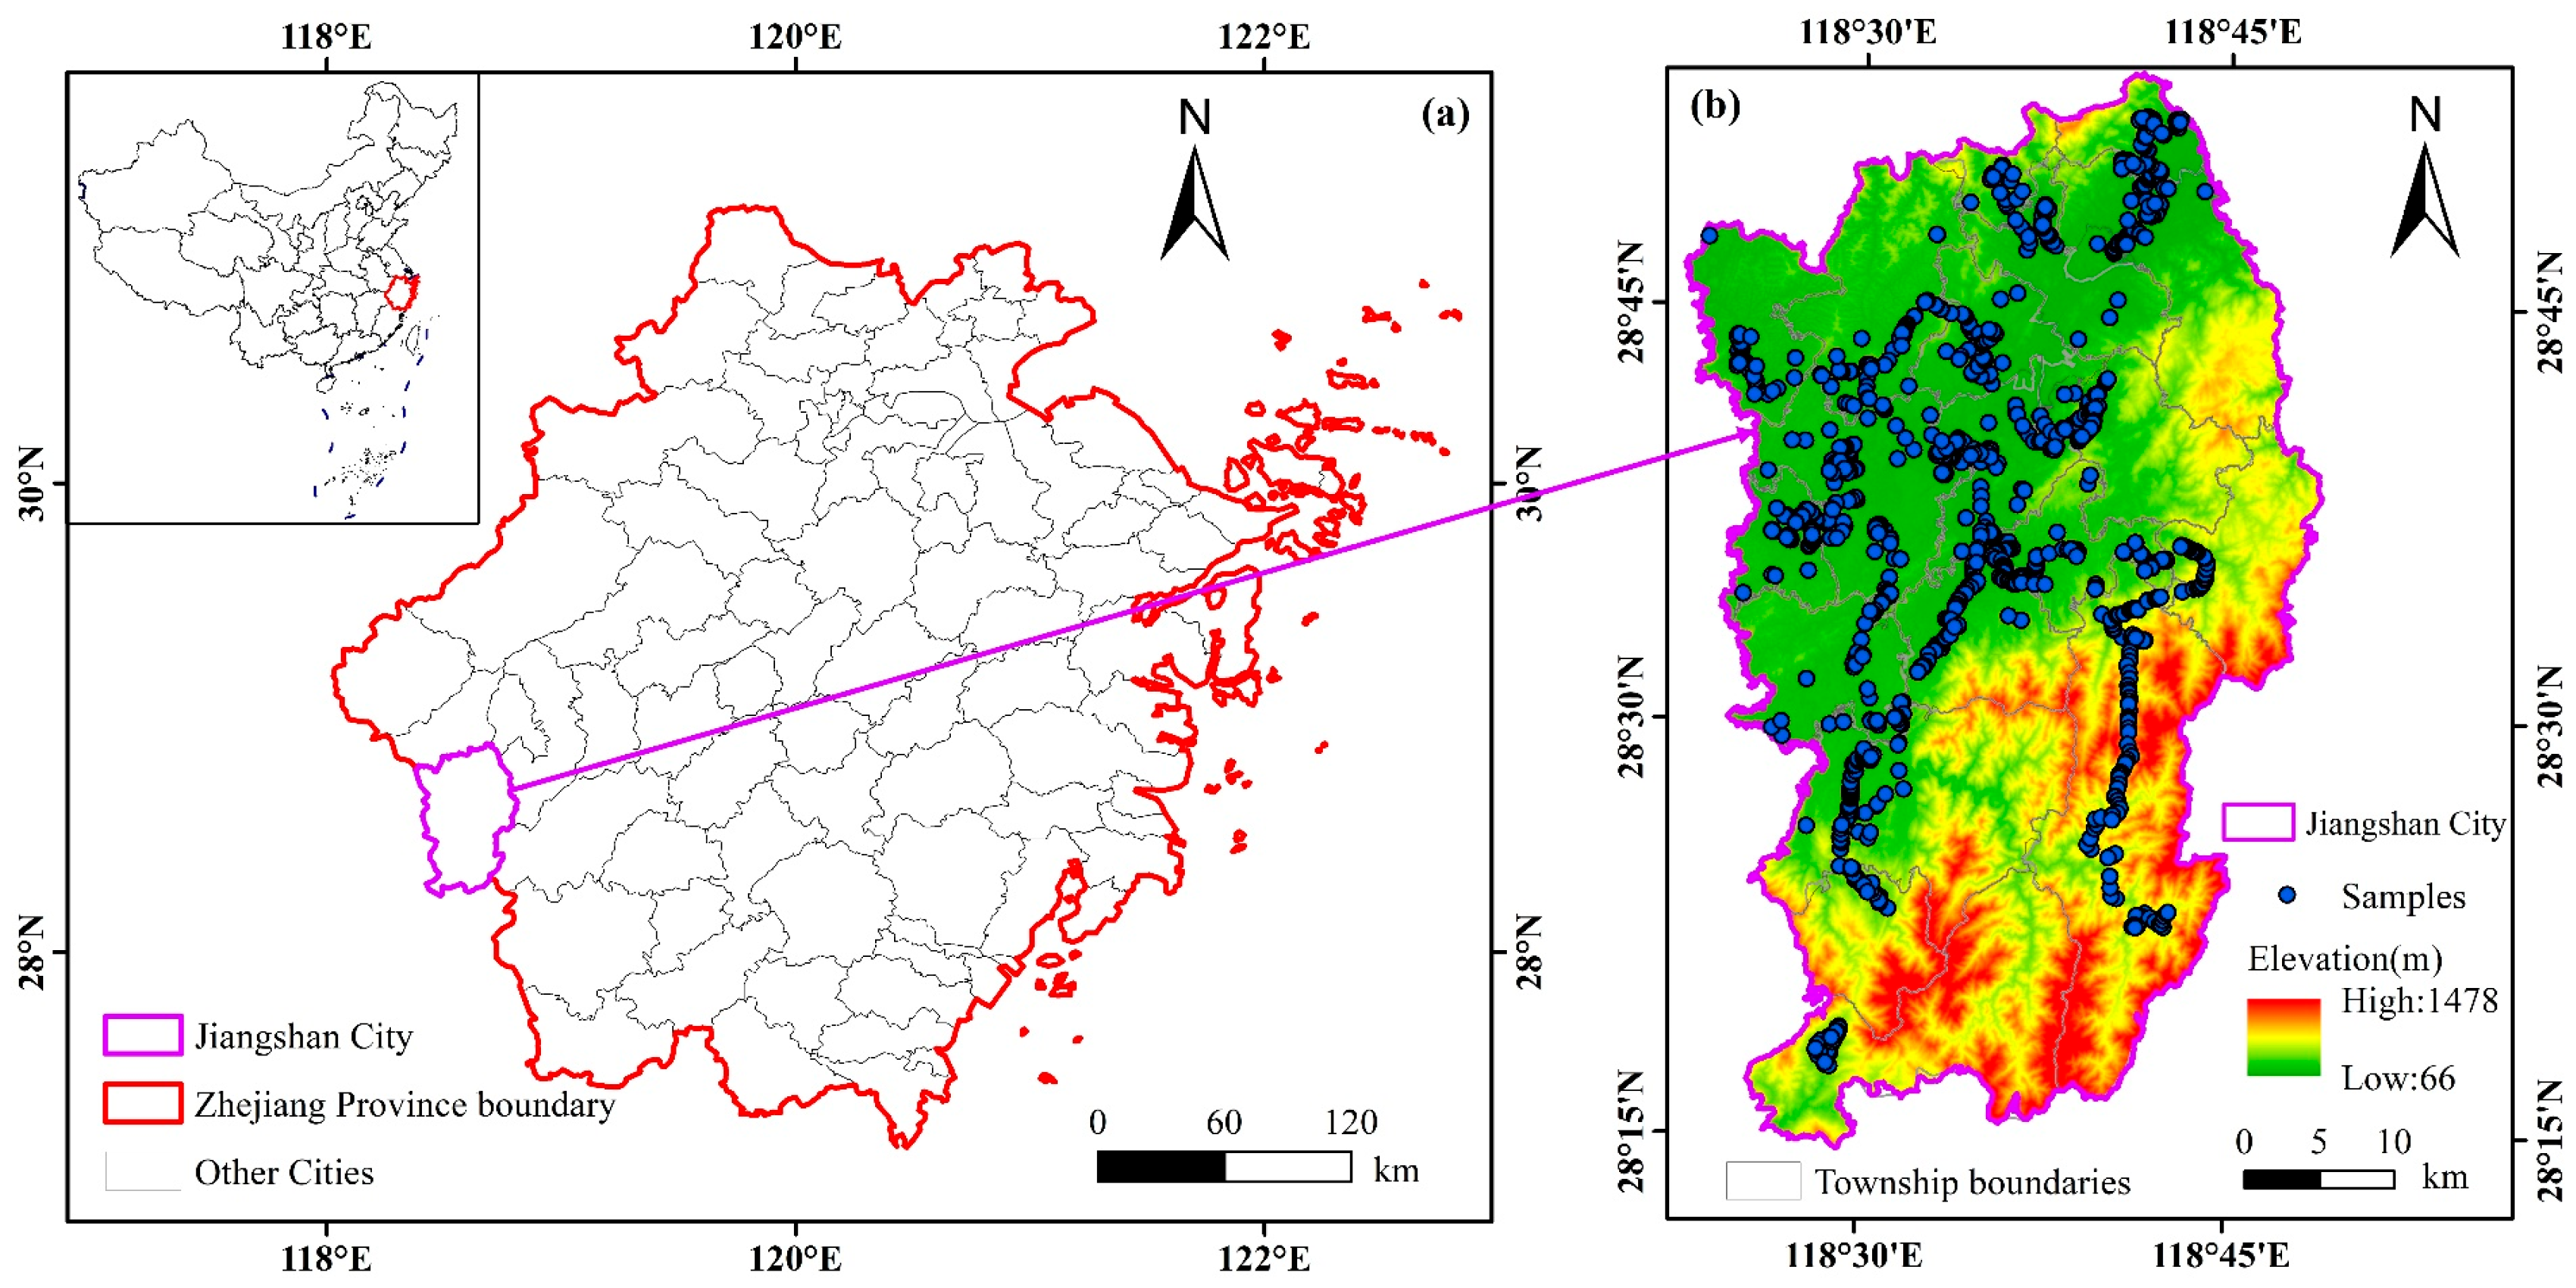
Jiangshan, a county-level city of Zhejiang province, was selected as the study area. It is located at the junction of Zhejiang, Fujian, and Jiangxi provinces, with geographic coordinates ranging from 118°22′37″ to 118°48′48″E longitude and 28°15′26″ to 28°53′27″N latitude (Figure 1). The region has a humid subtropical monsoon climate with a high average monthly temperature greater than 35 °C in summer and a low average monthly temperature less than 10 °C in winter. Rainfall is unevenly distributed throughout the year, primarily concentrated during the plum rain season (May to June), as well as during summer thunderstorms and the typhoon season (July to September). The average annual precipitation is approximately 1600 mm. The terrain is dominated by plains, hills, and mountains. The elevation gradually decreases from the southwest to the northwest, with the central, northern, and western parts characterized by gentle hills. The southwestern region, in contrast, is primarily mountainous, with significant topographical variation. The total arable land area is approximately 26,377.03 hectares, of which the paddy field area accounts for around 23,264.94 hectares, and the dry land area totals about 3112.09 hectares. The largest portion of arable land is located on slopes greater than 2 degrees, accounting for about 58.89% of the total arable land area. Among this, the area of arable land on slopes greater than 5 degrees accounts for 26.96%.
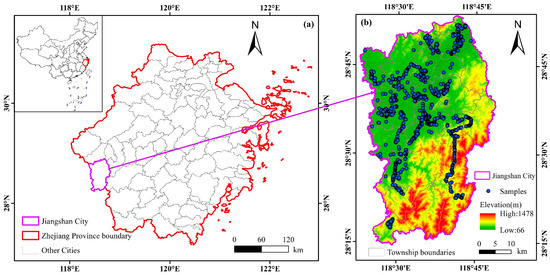
Figure 1.
Location of the study area and distribution of field samples. (a) Location map of the study area; (b) enlarged view showing the digital elevation model (DEM) and classification sample points.
The crop cultivation in the study region is diverse, encompassing both traditional staple crops and specialty economic crops. Paddy rice is the primary food crop, with extensive planting areas mainly distributed across plains and low hills. There are three cultivation types: single-cropped rice, early-cropped rice, and late-cropped rice. The main growing period for single-cropped rice is from May to September. Early-cropped rice grows from April to July, and late-cropped rice has a growing cycle from August to November. Rapeseed is one of the important economic crops in the study region, with cultivation spanning plains, hills, and mountainous areas, resulting in a relatively large planting area. Local farmers commonly utilize fallow fields during the winter season for rapeseed cultivation, sowing in October and harvesting in May of the following year.
2.2. Satellite Data and Preprocessing
Three types of satellite data were used in this study, including optical satellite, microwave satellite, and topographic data. The optical data included imagery from the Landsat 8, Landsat 9, Sentinel-2A, GF-1, GF-2 and GF-7 satellites. Microwave data were obtained from Sentinel-1 imagery, while topographic data were derived from Shuttle Radar Topography Mission (SRTM) 30 m spatial resolution digital elevation data. Surface reflectance products of Collection 2, Tier 1 were used for Landsat 8 and 9, and Surface reflectance products Level-2A were used for Sentinel-2. For optical data, images with a cloud percentage below 20% were used. Detailed information on the used satellite dataset was summarized in Table 1. The original satellite data used in this study were in the WGS_1984 geographic coordinate system and were uniformly reprojected to the WGS_1984_UTM_Zone_50N coordinate system to ensure spatial consistency.

Table 1.
Satellite data used in this study.
The same preprocessing steps, including time and cloud screening, cloud removal, and median synthesis, were performed for Landsat 8, Landsat 9, and Sentinel-2A. The preprocessing of Sentinel-l data mainly included natural value conversion and boundary removal. To define and remove noise boundaries from SAR imagery, we followed the method used in the Wetland Extent Tool 2.0 (https://github.com/NASA-DEVELOP/WET2.0) (accessed on 28 June 2025), in which pixels with VV values less than 0.005 and VH values less than 0.008 are identified and removed as noise boundaries. The processing of GF data includes the calibration of radiation, atmospheric correction, orthorectification, image fusion, and image enhancement. To spatially match the data from different data sources, all the data were reprojected based on Sentinel-2. The preprocessing of Landsat 8, Landsat 9, Sentinel-2, and Sentinel-1 was conducted on the Google Earth engine (GEE) platform, while that of the GF data was conducted at a local workstation.
2.3. Field Samples
Two classification systems were established for winter and summer crops, respectively. The winter land cover types include rapeseed, other crops, forests, shrubs, water bodies, and impervious surfaces. The summer land cover types include single-cropped rice (SC-Rice), double-cropped rice (DC-Rice), other crops, forests, shrubs, water bodies, and impervious surfaces. Field samples were mainly obtained from two sources: (1) samples derived from a manual visual interpretation of high-resolution Google Earth images; (2) samples obtained from field surveys. There were 382 training samples and 163 validation samples for classification of winter crops, and 930 training samples and 398 validation samples for the classification of summer crops (Table 2 and Figure 1). A stratified random sampling method was implemented, with 70% of the samples from each category used for training and the remaining 30% reserved for validation.
Table 2.
Samples used in this study.
3. Methods
3.1. Classification Framework
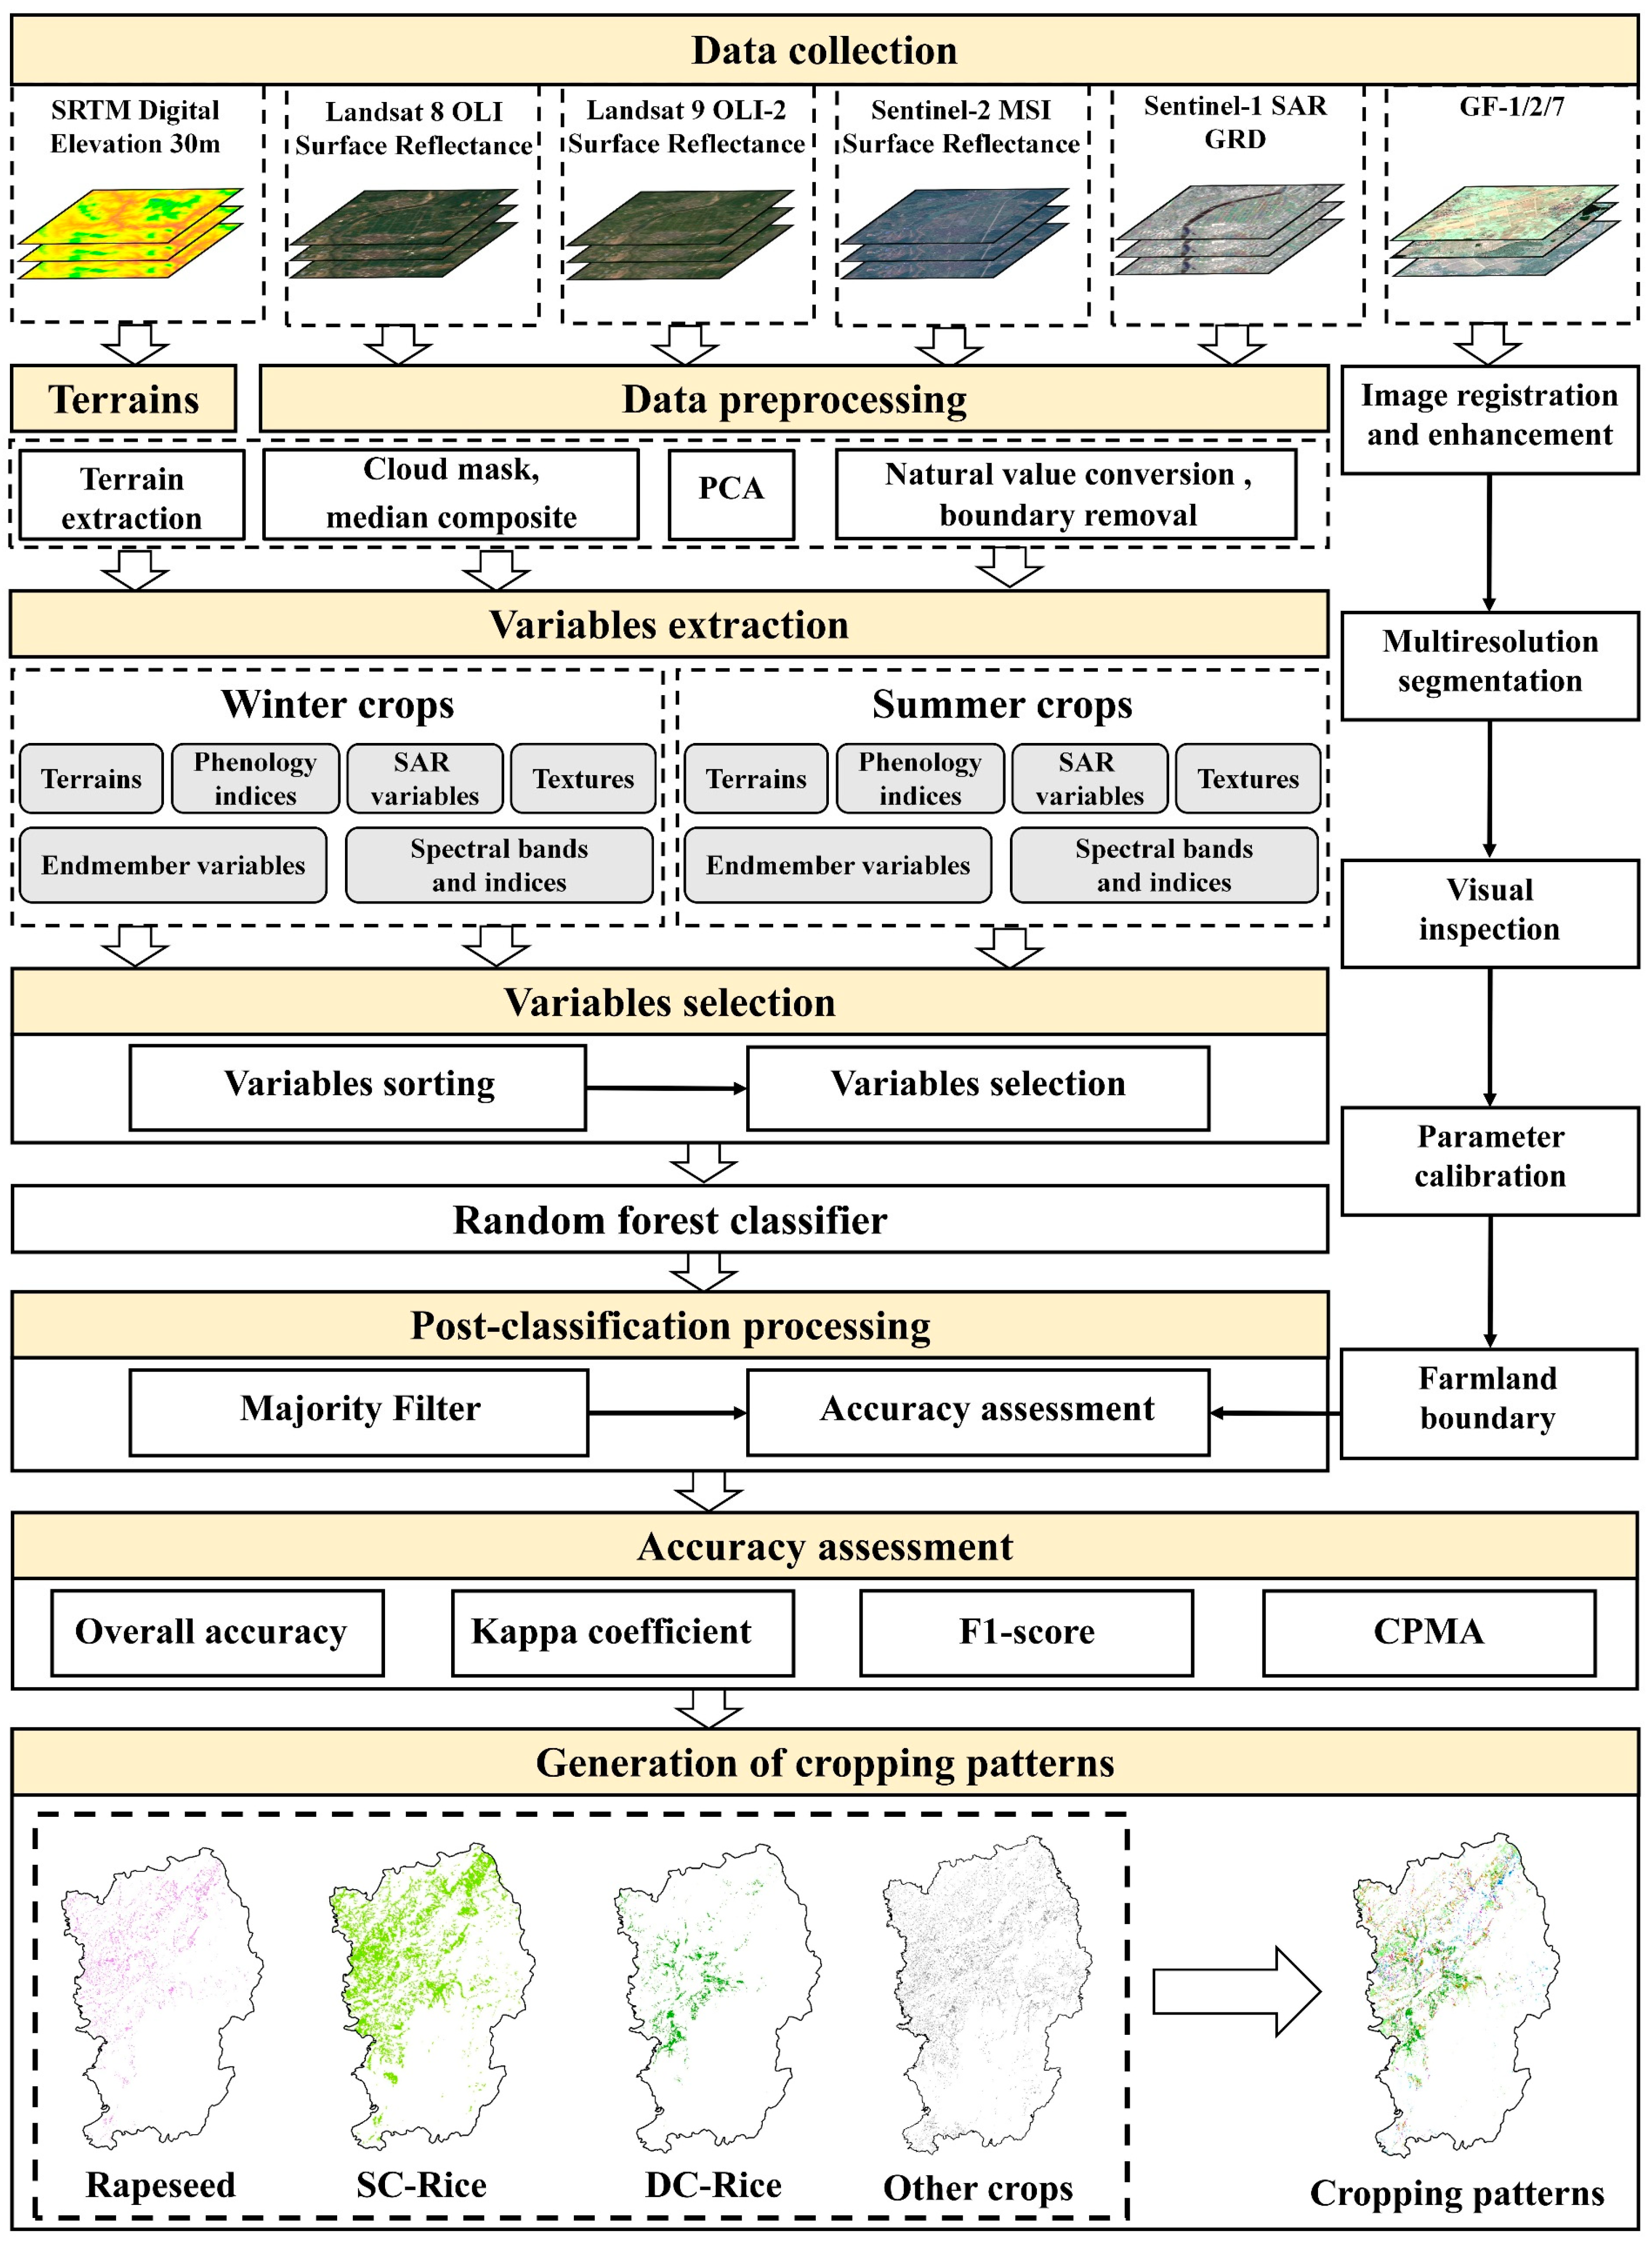
The framework of this study is presented in Figure 2. This framework includes four major parts: (1) data collection and preprocessing, including cloud removal for optical images, noise filtering for SAR data, reprojection, pixel resampling, and co-registration (with Sentinel-2 as the spatial reference); (2) variable extraction and selection, including the computation of input variables and feature selection based on random forest variable importance; (3) crop type classification and post-classification processing, including using a random forest classifier followed by spatial filtering based on majority rule for contextual correction; (4) the classification’s evaluation and the generation of cropping patterns, including an accuracy assessment and the identification of cropping patterns.
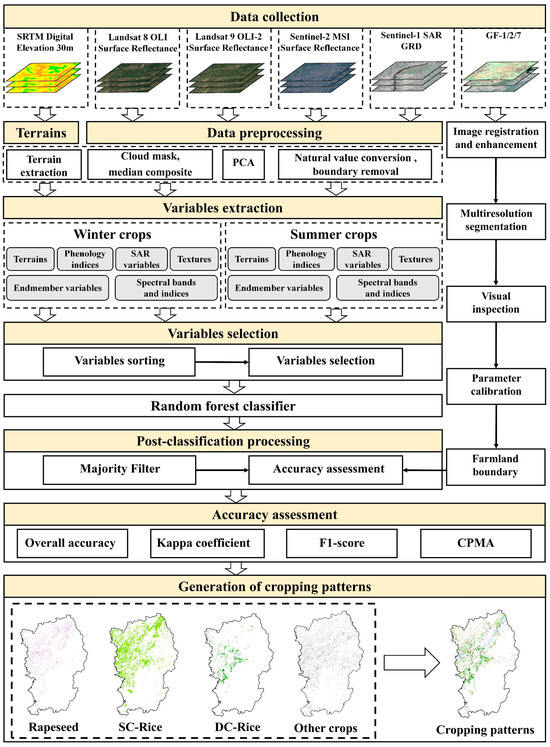
Figure 2.
Research flow chart.
3.2. Variables’ Extraction and Selection
3.2.1. Variables’ Extraction
Six kinds of variable types were included in this study: spectral bands, spectral indices, dynamic phenology indices, textures, endmember variables, SAR variables and terrains.
- (1)
- Spectral bands and indices
Spectral bands consist of three visible bands (red, green, and blue) and one near-infrared band (NIR) from Landsat 8, Landsat 9, and Sentinel-2 and four red-edge bands from Sentinel-2.
The spectral indices used in the classification include the Enhanced Vegetation Index (EVI), Modified Normalized Difference Water Index (MNDWI), Winter Rapeseed Index (WRI), and Normalized Difference Built-up Index (NDBI). Calculation formulas for all the spectral indices used in this study are provided in Table 3.
Table 3.
Spectral indices used in research.
- (2)
- Phenology indices
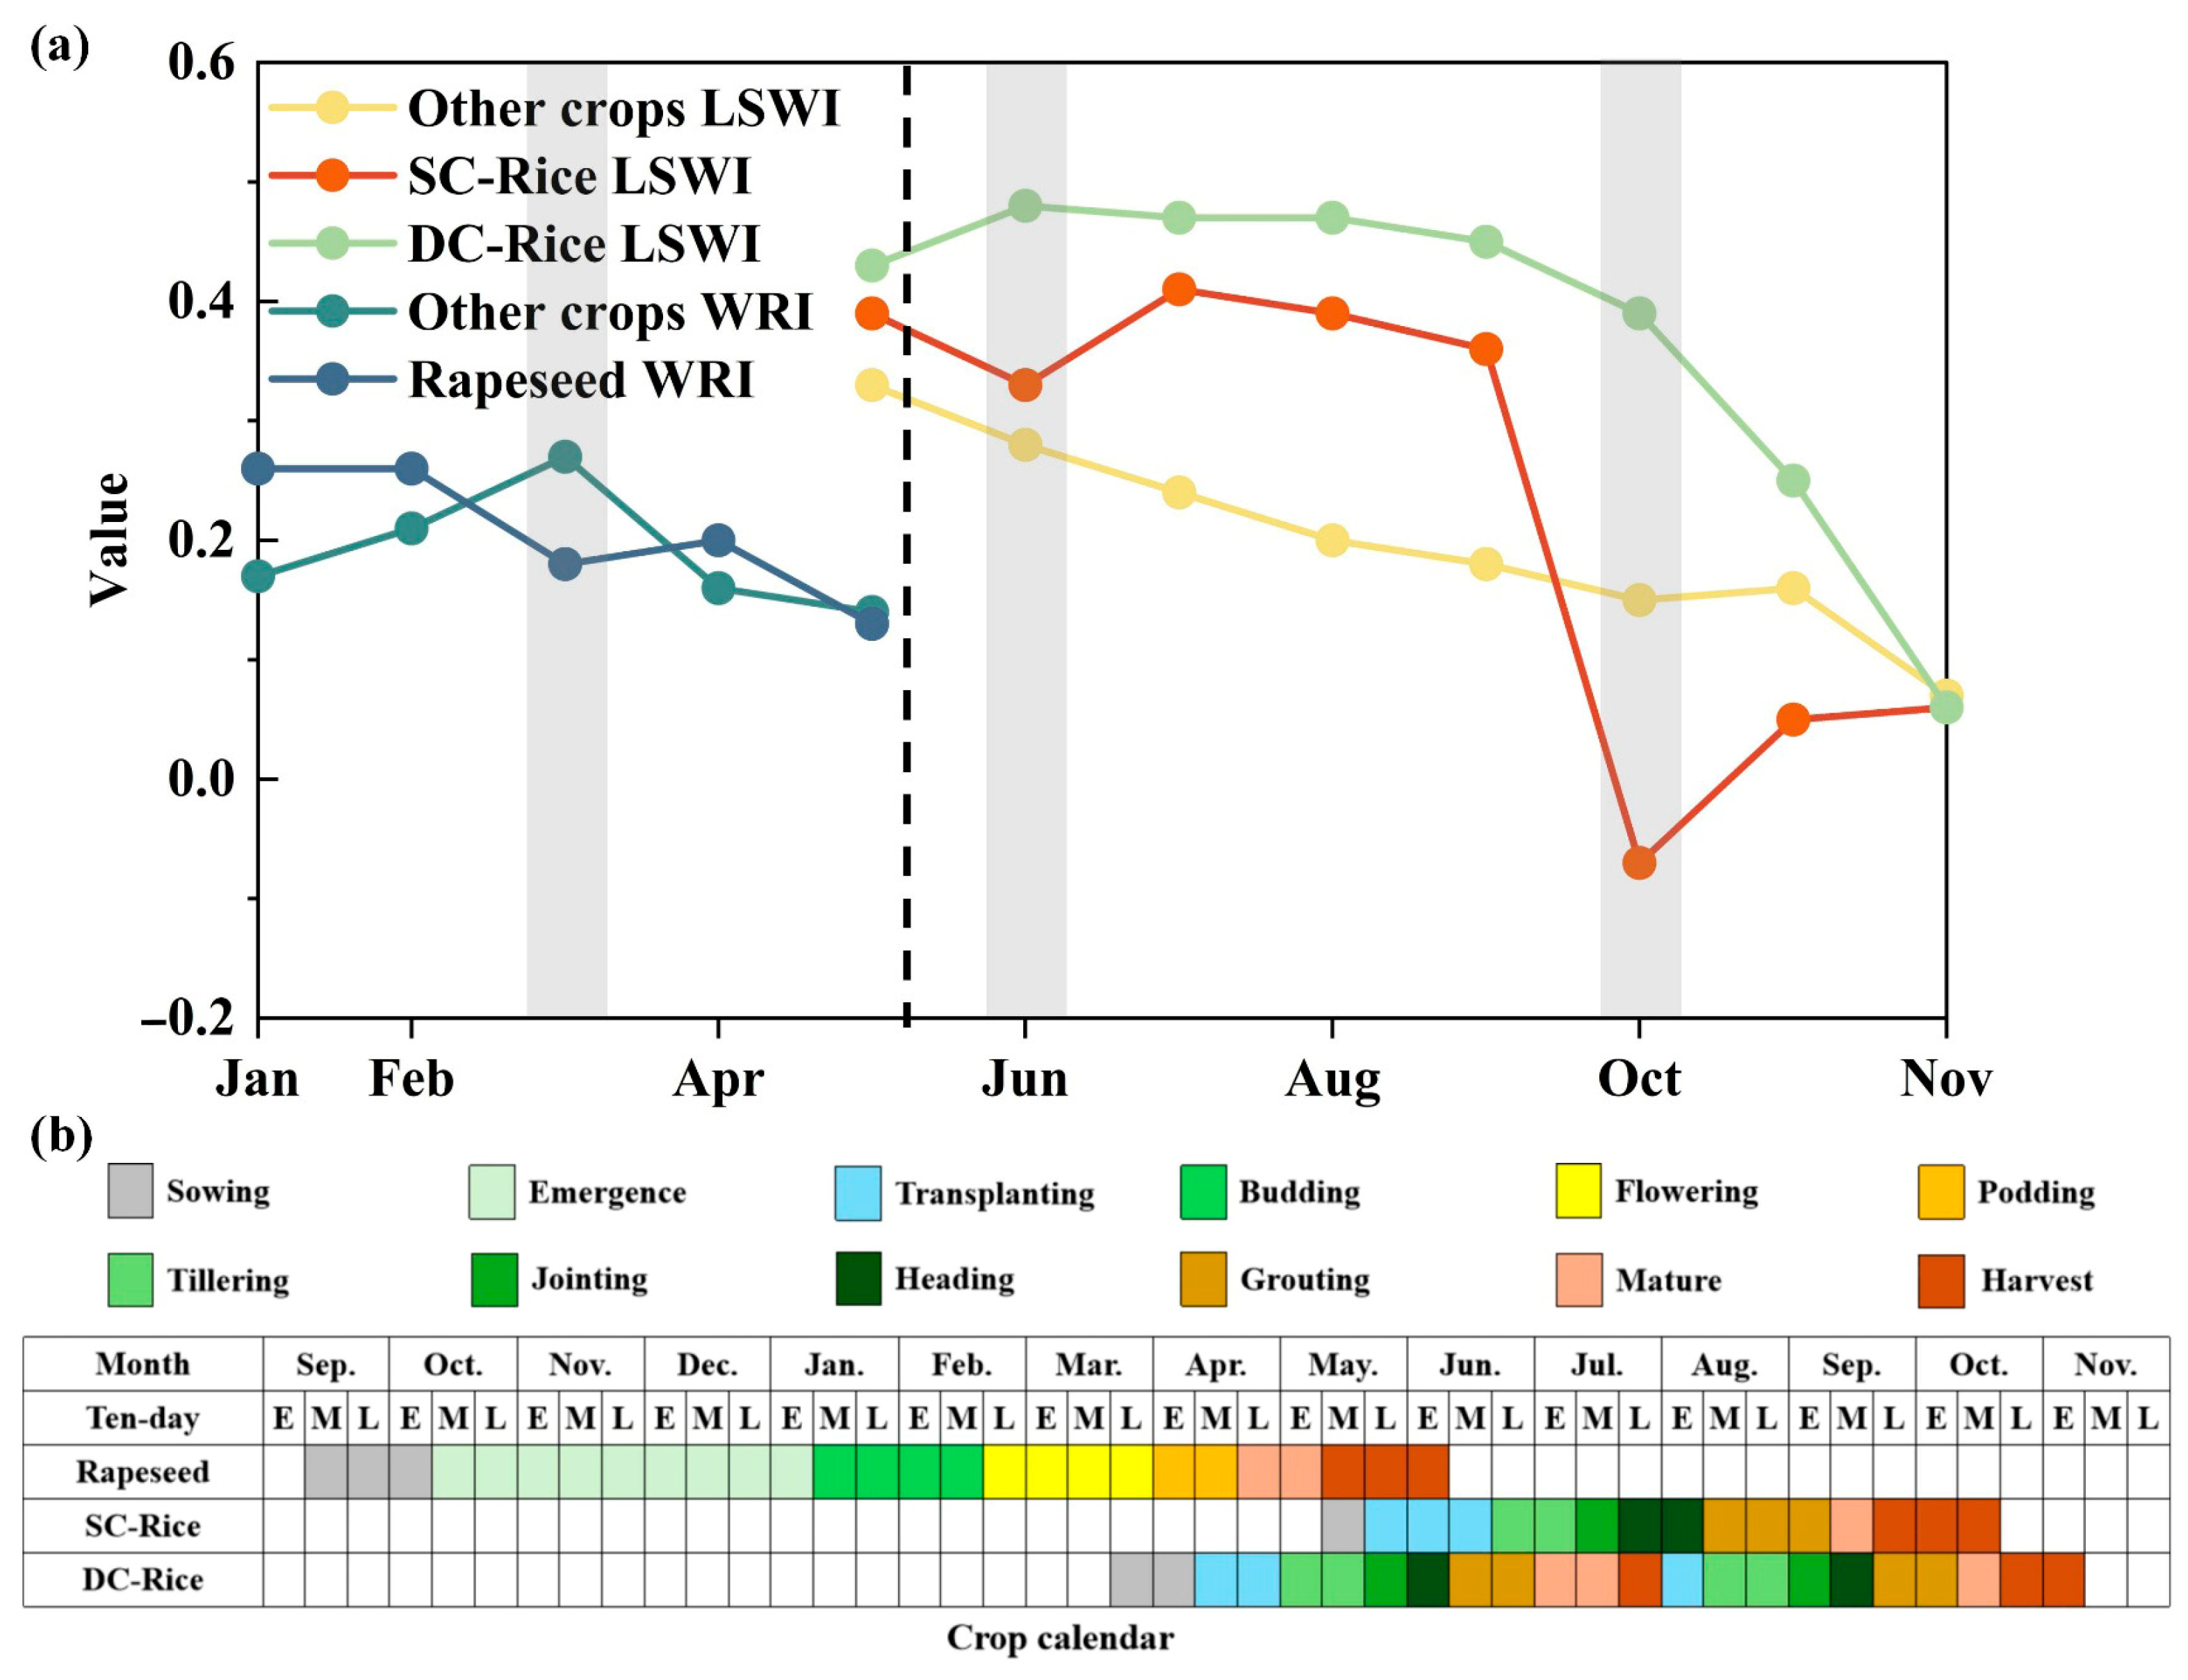
Different crops in the study area exhibit distinct growth phenologies. Therefore, phenological indices are crucial for distinguishing between various crop types. According to the phenological calendar of major crops obtained from prior research [22,33] and field surveys (Figure 3b), rapeseed, as a winter crop, is typically sown in late October to early November and harvested in May of the following year. Hence, this study focuses on classification during its growing period (January to May). Notably, rapeseed blooms in March, with a relatively long flowering period (generally 3 to 4 weeks), during which its Winter Rapeseed Index (WRI) shows significant differences from other crops (Figure 3a). Therefore, the WRI derived from median-value composites in March is selected as a key phenological variable for rapeseed classification in this study:
where S represents Landsat 8, Landsat 9, and Sentinel-2 data, and WRIMar represents the WRI calculated using images in March.

Figure 3.
Monthly spectral indices (a) and phenological calendar (b) of different crops.
Rice, as a summer crop, is categorized into two planting modes: single-cropped rice and double-cropped rice. Single-cropped rice is generally transplanted in June and harvested in October. As double-cropped rice, its first season is typically transplanted at the end of April and harvested in July, while its second season is transplanted in August and harvested in November. Hence, this study focuses on rice classification from May to November. The Land Surface Water Index (LSWI) has been shown by previous research to effectively extract the phenological characteristics of rice [34,35,36]. In this study, significant LSWI differences among other crops, single-cropped rice, and double-cropped rice was also observed in June and October (Figure 3a). The difference was especially obvious during the transplanting period of single-cropped rice, the germination stage of the second season of double-cropped rice, the harvesting period of single-cropped rice, and the maturity phase of the second season of double-cropped rice (Figure 3b). In order to better distinguish between single-cropped and double-cropped rice, we utilized the monthly median composite LSWI on June and October as the phenological variable for rice.
where S represents Landsat 8, Landsat 9, and Sentinel-2 data, while LSWIJun and LSWIOct represent the LSWI on June and October, respectively.
- (3)
- Textures
Using the monthly median composite of Sentinel-2 imagery, the first principal component was extracted through principal component analysis (PCA). Then, the Gray-Level Co-Occurrence Matrix (GLCM) method [37] was implemented to extract texture variables based on a 3 × 3 texture window. The extracted textures include Sum Average (SAVG), Angular Second Moment (ASM) for measuring the number of repeating pairs, Contrast (CONTRAST) for assessing local image contrast, Correlation (CORR) for evaluating the relationship between pixel pairs, and Entropy (ENT) for quantifying homogeneity. Textures were extracted for winter and summer crops using different months. For rapeseed, the peak flowering period in March was selected as the texture time window. For single-cropped rice and double-cropped rice, May (the transplanting period for double-cropped rice, when single-cropped rice has not been planted) and July (the maturity period for double-cropped rice, with single-cropped rice in its germination stage) were selected as the texture time windows.
- (4)
- Endmember variables
Endmember variables, derived from the mixed pixel decomposition of Landsat 8, include soil and vegetation endmembers, which were used to differentiate vegetation from soil.
- (5)
- SAR variables
Polarization variables were derived from SAR data (Sentinel-1), including the co-polarized VV (vertical–vertical), cross-polarized VH (vertical–horizontal), and polarization ratio VV/VH (ratio).
- (6)
- Terrains
Terrains were derived from the 30 m spatial resolution SRTM DEM, including slope, aspect, and elevation.
3.2.2. Variables Selection
The selection of an optimal set of variables is crucial for a well-performed crop type classification. In this study, importance ranking from the random forest classifier was implemented to analyze and compare the significance of different remote sensing variables in mapping summer and winter crops. The Gini coefficient was used as the importance evaluation index to measure the contribution of each variable within the random forest. In this study, the variables in the set were ranked by importance from high to low. To determine the optimal number of variables required for the highest classification accuracy, an iterative classification and validation process was conducted using the training and validation sample data. The process started with 10 variables, and 1 additional variable was added in each iteration, up to a maximum of 35 variables. The number of variables that resulted in the highest final classification accuracy was then used for classification across the entire study area.
3.3. Random Forest Classifier
Random forest was selected as the classifier in this study. It is a decision tree-based classifier with a typical Bagging ensemble algorithm [38]. It constructs a series of decision trees using subsets of training samples and input variables, where each tree is trained as an independent classifier. In this way, N trees yield N different classification results. Composed of these decision trees, random forest integrates all the results and outputs the final classification through majority voting. The parameters of the random forest include the number of decision trees (numberOfTrees), the number of variables per split (variablesPerSplit), the minimum number of training nodes (minLeafPopulation), the bag fraction for each tree (bagFraction), and the maximum number of leaf nodes per tree (maxNodes). To achieve the best accuracy while maintaining computational efficiency, this study selected a moderate number of decision trees, setting numberOfTrees to 150. The default values provided by GEE were used for variablesPerSplit, minLeafPopulation, bagFraction, and maxNodes, corresponding to the square root of the number of input variables, 1.0, 0.5, and unrestricted, respectively.
3.4. Post-Classification Processing
3.4.1. Majority Filter
To minimize the salt-and-pepper effect in the classification results, this study implemented a majority filter for post-processing, with a square filter and a 3 × 3 window size.
3.4.2. Parcel Boundaries’ Improvement Using Multiresolution Segmentation
The majority filter can eliminate some isolated, fragmented pixels and reduce the salt-and-pepper effect to a certain extent. However, it does not address the mismatch between classification patches and actual parcel boundaries. The multi-scale segmentation algorithm can provide accurate parcel boundaries to further eliminate the salt-and-pepper effect [39]. To ensure the consistency of the field boundaries with the actual boundaries, multi-scale segmentation based on GF-1, GF-2, and GF-7 was implemented to extract parcel boundaries using eCognition 10.3 software. Specifically, all the bands of the GF satellite (i.e., red, green, blue, and near-infrared bands) were used in the multi-scale segmentation. Four key parameters were carefully selected and tested: weight of each band, scale of segment, weight of color and shape, and weight of compactness and smoothness. The effectiveness of each segmentation was visually evaluated. The results showed that the optimal scale (Scale Parameter) was 220, 220, and 300 for GF-1, GF-2, and GF-3, respectively. The shape weighting (Shape Weighting) and compactness (Compactness) were 0.4 and 0.5, respectively. To improve the data alignment, the segmentation results were resampled to a 10 m spatial resolution using Sentinel-2 data as the reference.
Then, overlay analysis was conducted between the segmentation result and the classification result. The area proportions of each crop type within the individual segmentation units were calculated. The final crop type belonging to the segmented unit was determined as the crop type with an area proportion not less than 50%. This method was implemented to optimize the classification results of rapeseed, single-cropped rice, double-cropped rice, and other crops. The cropping pattern map was then produced by overlaying the winter crop and the summer crop maps.
3.5. Accuracy Assessment
To evaluate the accuracy of the crop type classification results, accuracy assessment metrics based on the confusion matrix, including overall accuracy (OA), Kappa Coefficient (Kappa) [40], and F1 score (F1) [41], were used. The F1 score accounts for both precision and recall in the classification model.
where F1 represents the F1 score; TP represents the number of true positives; FP represents the number of false positives; and FN represents the number of false negatives.
We also introduced crop plantation mapping accuracy (CPMA) [42] to better evaluate the classification accuracy for each crop. CPMA was implemented to separately assess rapeseed, single-cropped rice, and double-cropped rice. Its formula is as follows:
where PA and UA are the producer and user accuracy, respectively.
4. Results
4.1. Contribution of Different Remote Sensing Variables
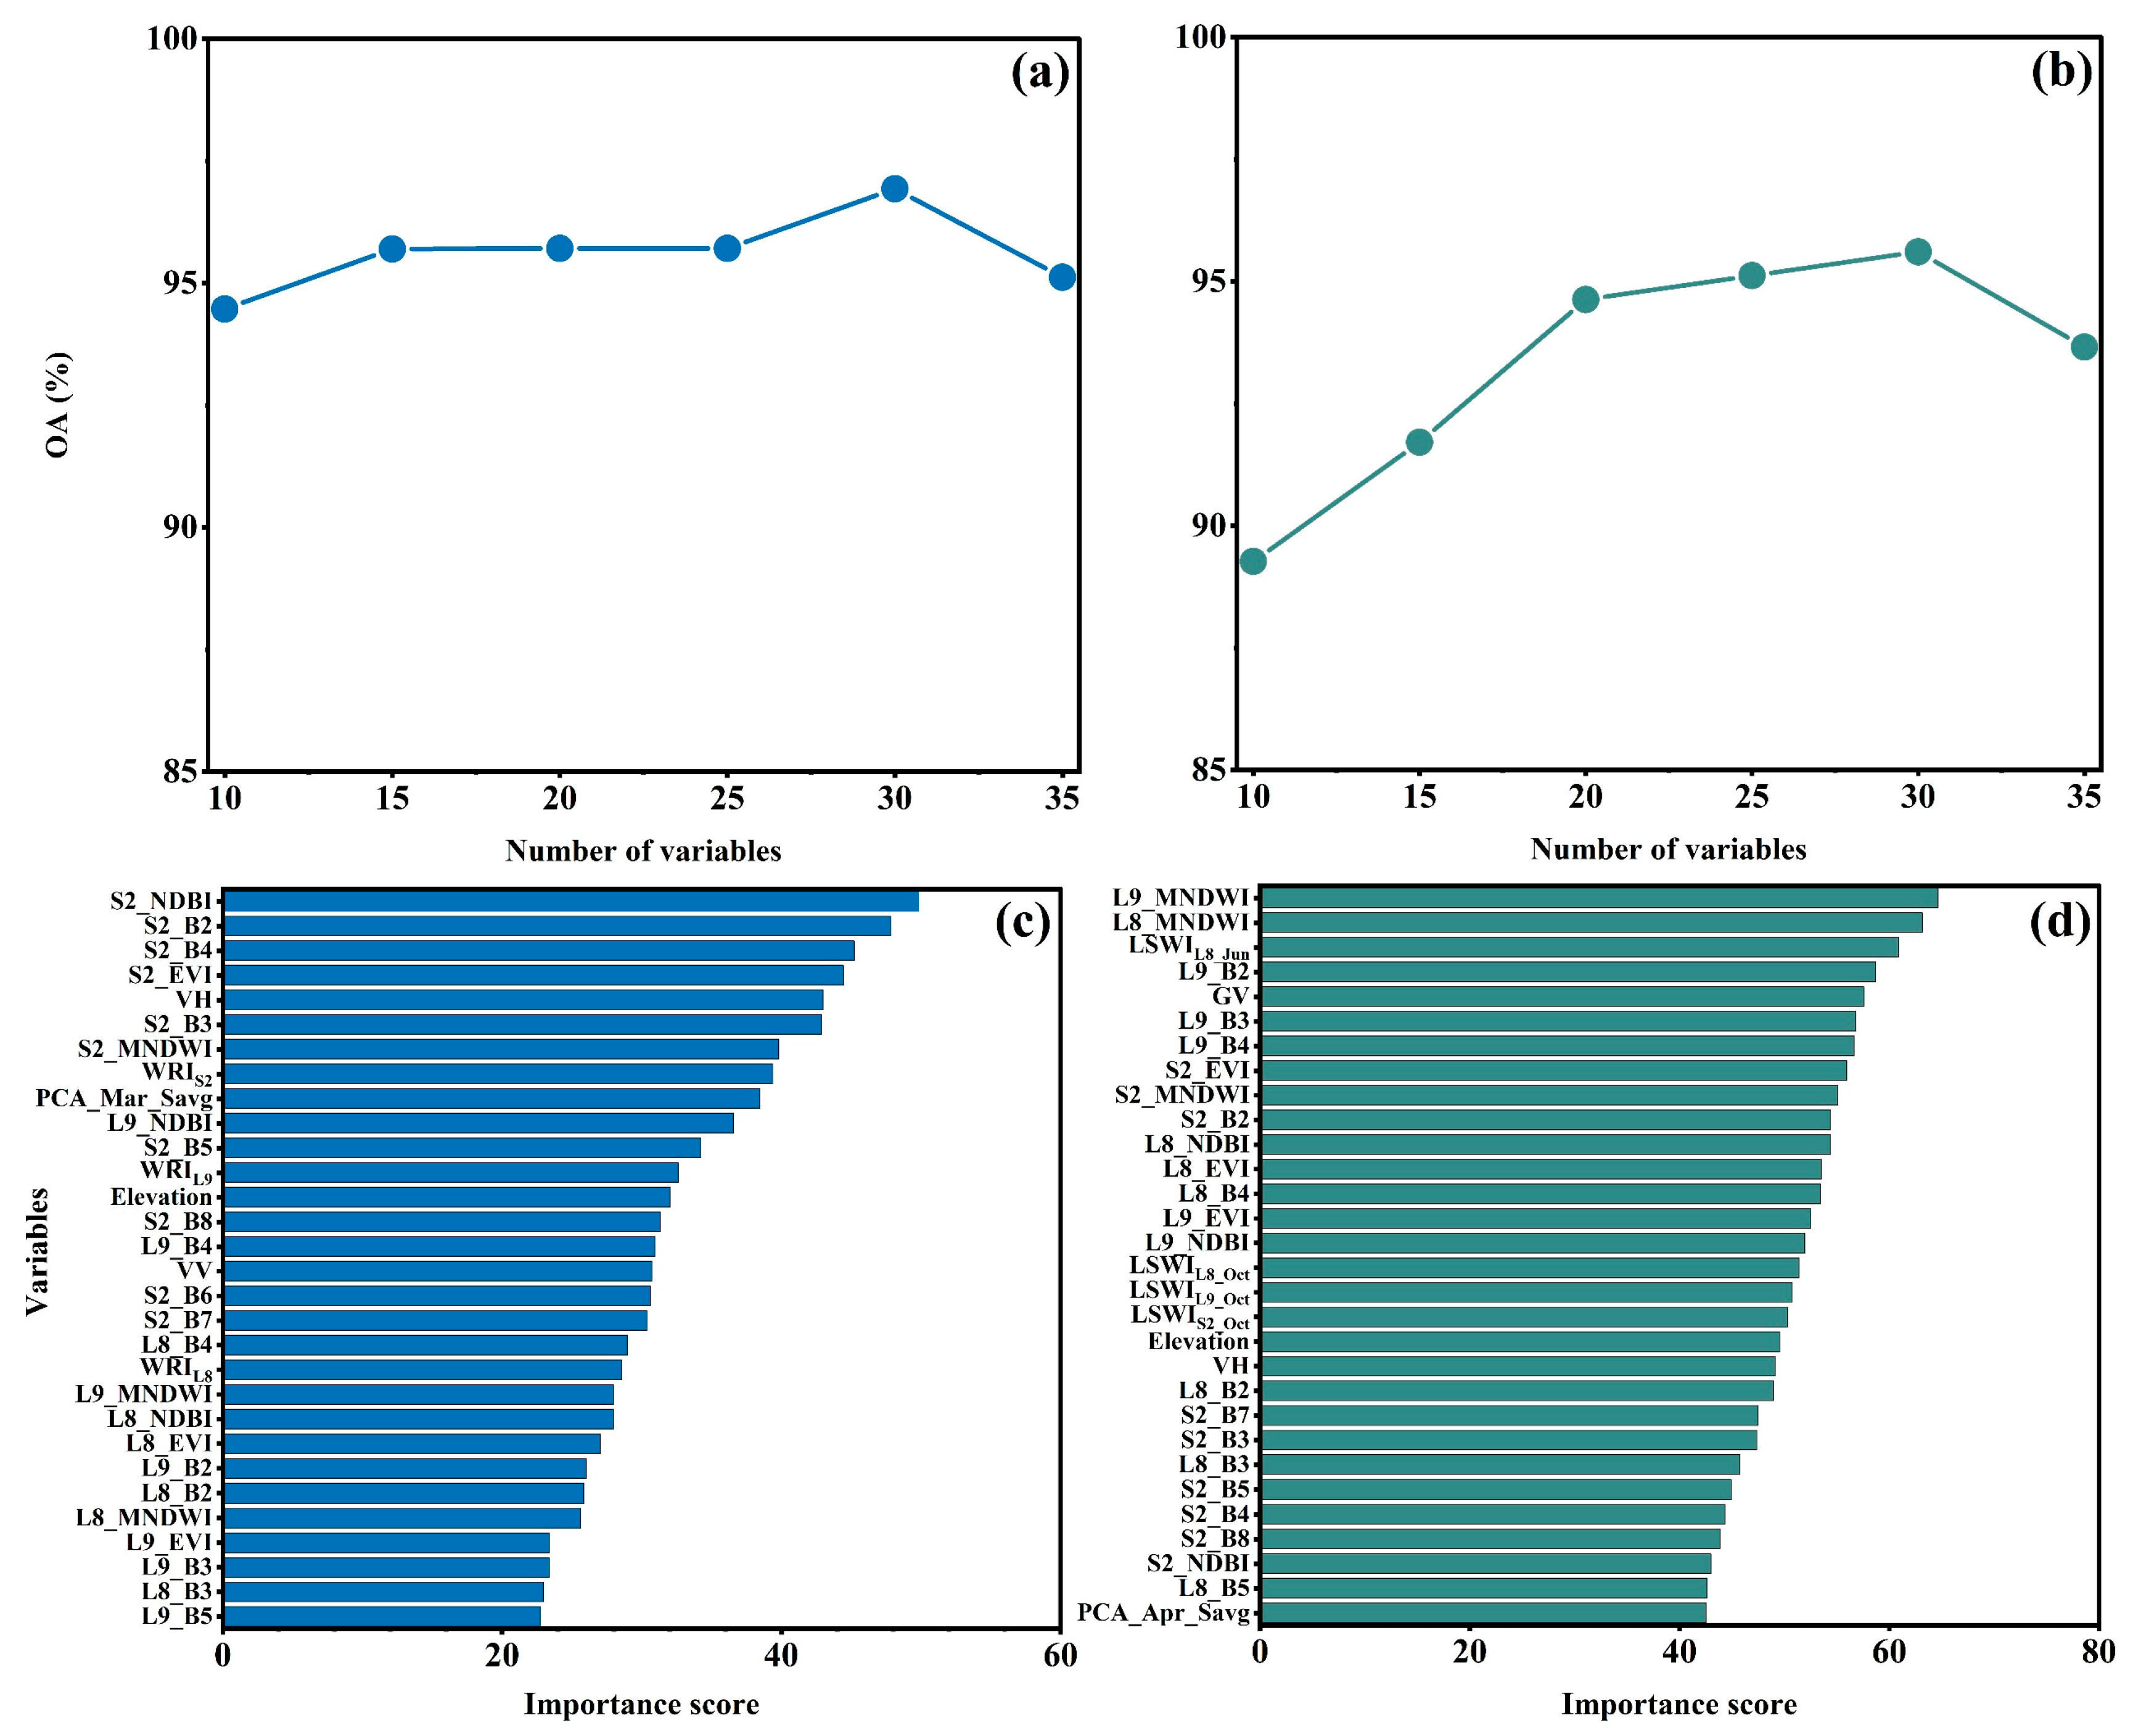
The variable selection results (Figure 4a,b) show that the classification accuracy of random forest followed a trend of initially increasing and then decreasing as the number of input variables increased. The RF classifier did not reach optimal accuracy when using only 10 input features. The number of variables with the optimal classification accuracy for both winter and summer crops peaked at 30 variables. Notably, the classification accuracy started to decrease when the number of input variables continued to increase after it reached the best result. This highlights the importance of variables’ selection.
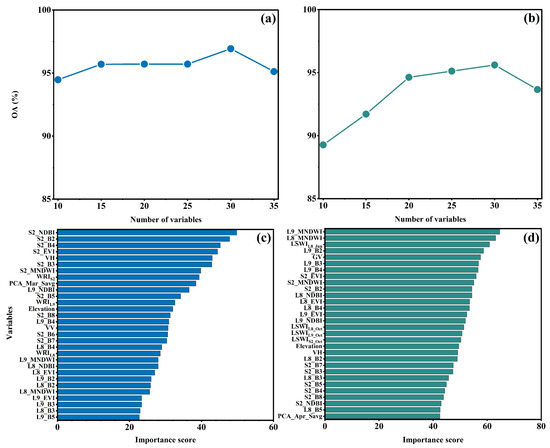
Figure 4.
Classification accuracy of different numbers of variables (a,b) and importance score of selected variables (c,d), winter crop classification (a,c), summer crop classification (b,d).
The variable importance ranking for the optimal variable combinations in the classification of winter and summer crops (Figure 4c,d) showed that variables derived from both optical and SAR imagery were selected by the RF classifier, suggesting that the inclusion of multi-source variables is crucial to a robust crop type classification result. Apart from the endmember variables, the other five extracted variable types were selected by the RF classifier for both winter and summer crop classifications. Although endmember variables were not selected for the classification of winter crops, the GV band from the endmember variables was selected as a key variable in the classification of summer crops, ranking fifth. The WRI ranked in the top 10 for the classification of winter crops, indicating its critical role in identifying rapeseed. The LSWI ranked third in classification of summer crops, showing its potential in the identification of rice. The rank of WRI and LSWI also demonstrates the great contribution of phenological variables in crops’ classification. Additionally, the visible bands were essential for the classification of both winter and summer crops, ranking in the top ten for both. Textures had a considerable influence on the classification of winter crops, ranking in the top ten, while their importance was lower in the classification of summer crops, ranked toward the back. SAR variables played a more important role in the classification of winter crops, with VH ranked 5th, while their importance was lower in the classification of summer crops, ranking 20th. Elevation, as a terrain variable, was also selected for both winter and summer crops’ classification, ranking in the top 20 for both.
4.2. Classification Performance of Crop Types and Cropping Patterns
4.2.1. Performance of Multi-Scale Segmentation
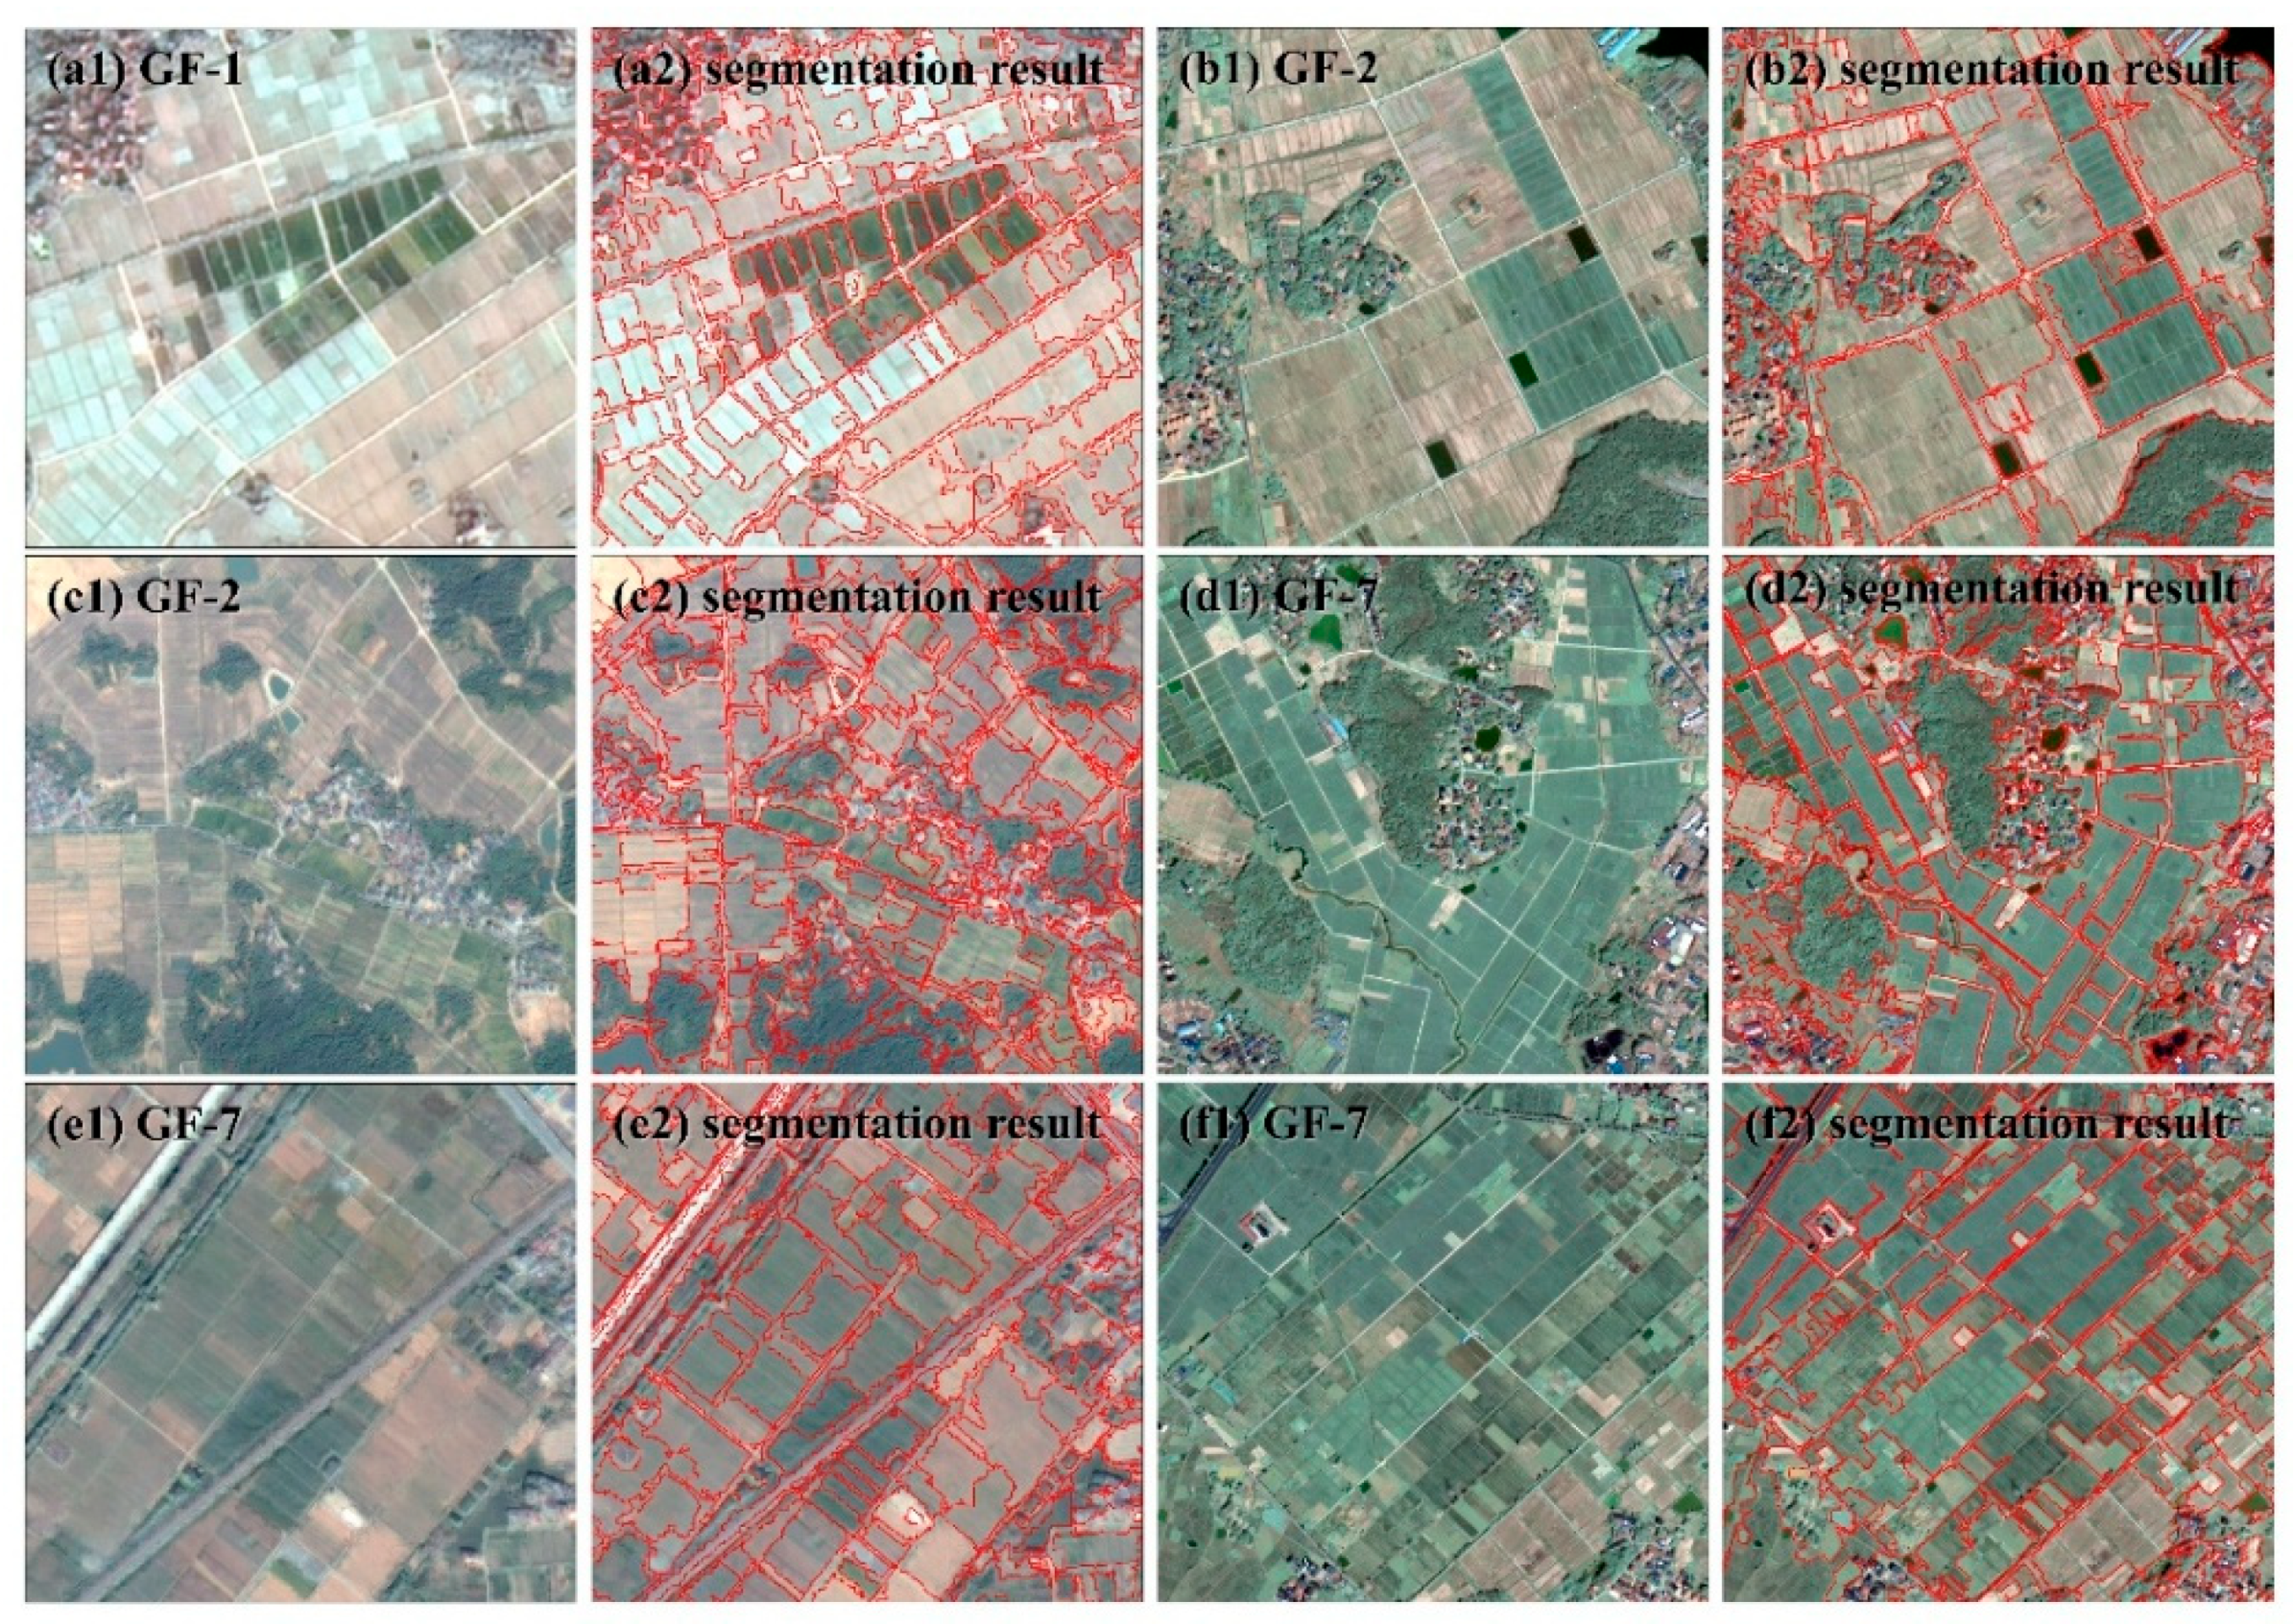
Examination of the multi-scale segmentation results with Google Earth images shown in Figure 5 indicates the good performance of the multi-scale segmentation for GF-1, GF-2, and GF-7 data. GF-7 data, with its higher spatial resolution (0.65 m) compared to GF-1 (2 m) and GF-2 (1 m), yielded better segmentation results and smoother boundaries. Specifically, the segmentation can clearly distinguish the boundary between cropland and forest (Figure 5(d2)), and the boundary between cropland and impermeable surfaces (such as buildings, Figure 5(c2)), especially in segmenting large buildings and even accurately separating small roads within large areas of farmland (Figure 5(f2)). The segmentation results also showed clear boundaries between farmland and small water bodies (Figure 5(a2)). Overall, the multi-scale segmentation results offer clear and relatively accurate cropland boundaries.
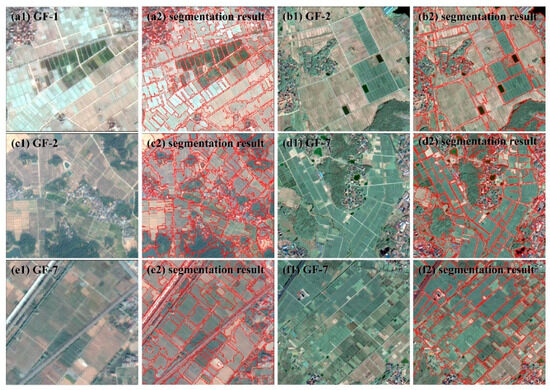
Figure 5.
Visual examination of multi-scale segmentation result of GF-1, GF-2, and GF-7 imagery using Google Earth images. (a1) shows the original GF-1 image; (b1,c1) are original GF-2 images; and (d1,e1,f1) are original GF-7 images. Panels a2 through (f2) present the corresponding segmentation results for each of the above images.
4.2.2. Performance of Mapped Crop Types
The classification accuracy of winter and summer crops for 2022 is shown in Table 4. It can be observed that the overall accuracy (OA) of both crop types exceeded 95%, and their Kappa values were greater than 0.95, indicating the good performance of the proposed crop type classification framework in hilly and mountainous areas. Specifically, data classification with the inclusion of SAR data showed that the F1 score for the main winter crop, rapeseed, was 96.55%, and the CPMA was 96.96%. Compared to the classification with SAR data excluded, the F1 score and CPMA were slightly improved (by less than 0.30%). For the main summer crops, for data classification with SAR included, the OA increased by 4.13%. For single-cropped rice and double-cropped rice, the F1 scores were 92.31% and 96.83%, with a CPMA of 92.37% and 96.83%, respectively. Compared to the classification with SAR data excluded, the F1 scores increased by 0.74% and 0.88%, and the CMPA increased by 0.74% and 0.72%. It is worth noting that the classification accuracy of rapeseed was slightly higher than that of single-cropped rice and double-cropped rice. This may be reasonable, as the number of crop types that need to be distinguished in winter (only rapeseed and other crops) is smaller than that in summer (single-cropped rice, double-cropped rice, and other crops). In addition, among the winter crops, rapeseed exhibits distinctive phenological characteristics that make it easier to identify compared to other crops. In contrast, among the summer crops, single-cropped rice, double-cropped rice, and other crops may share a similar growth phenology, making them slightly difficult to distinguish.
Table 4.
Crop type classification accuracy verification and area statistics in Jiangshan City in 2022.
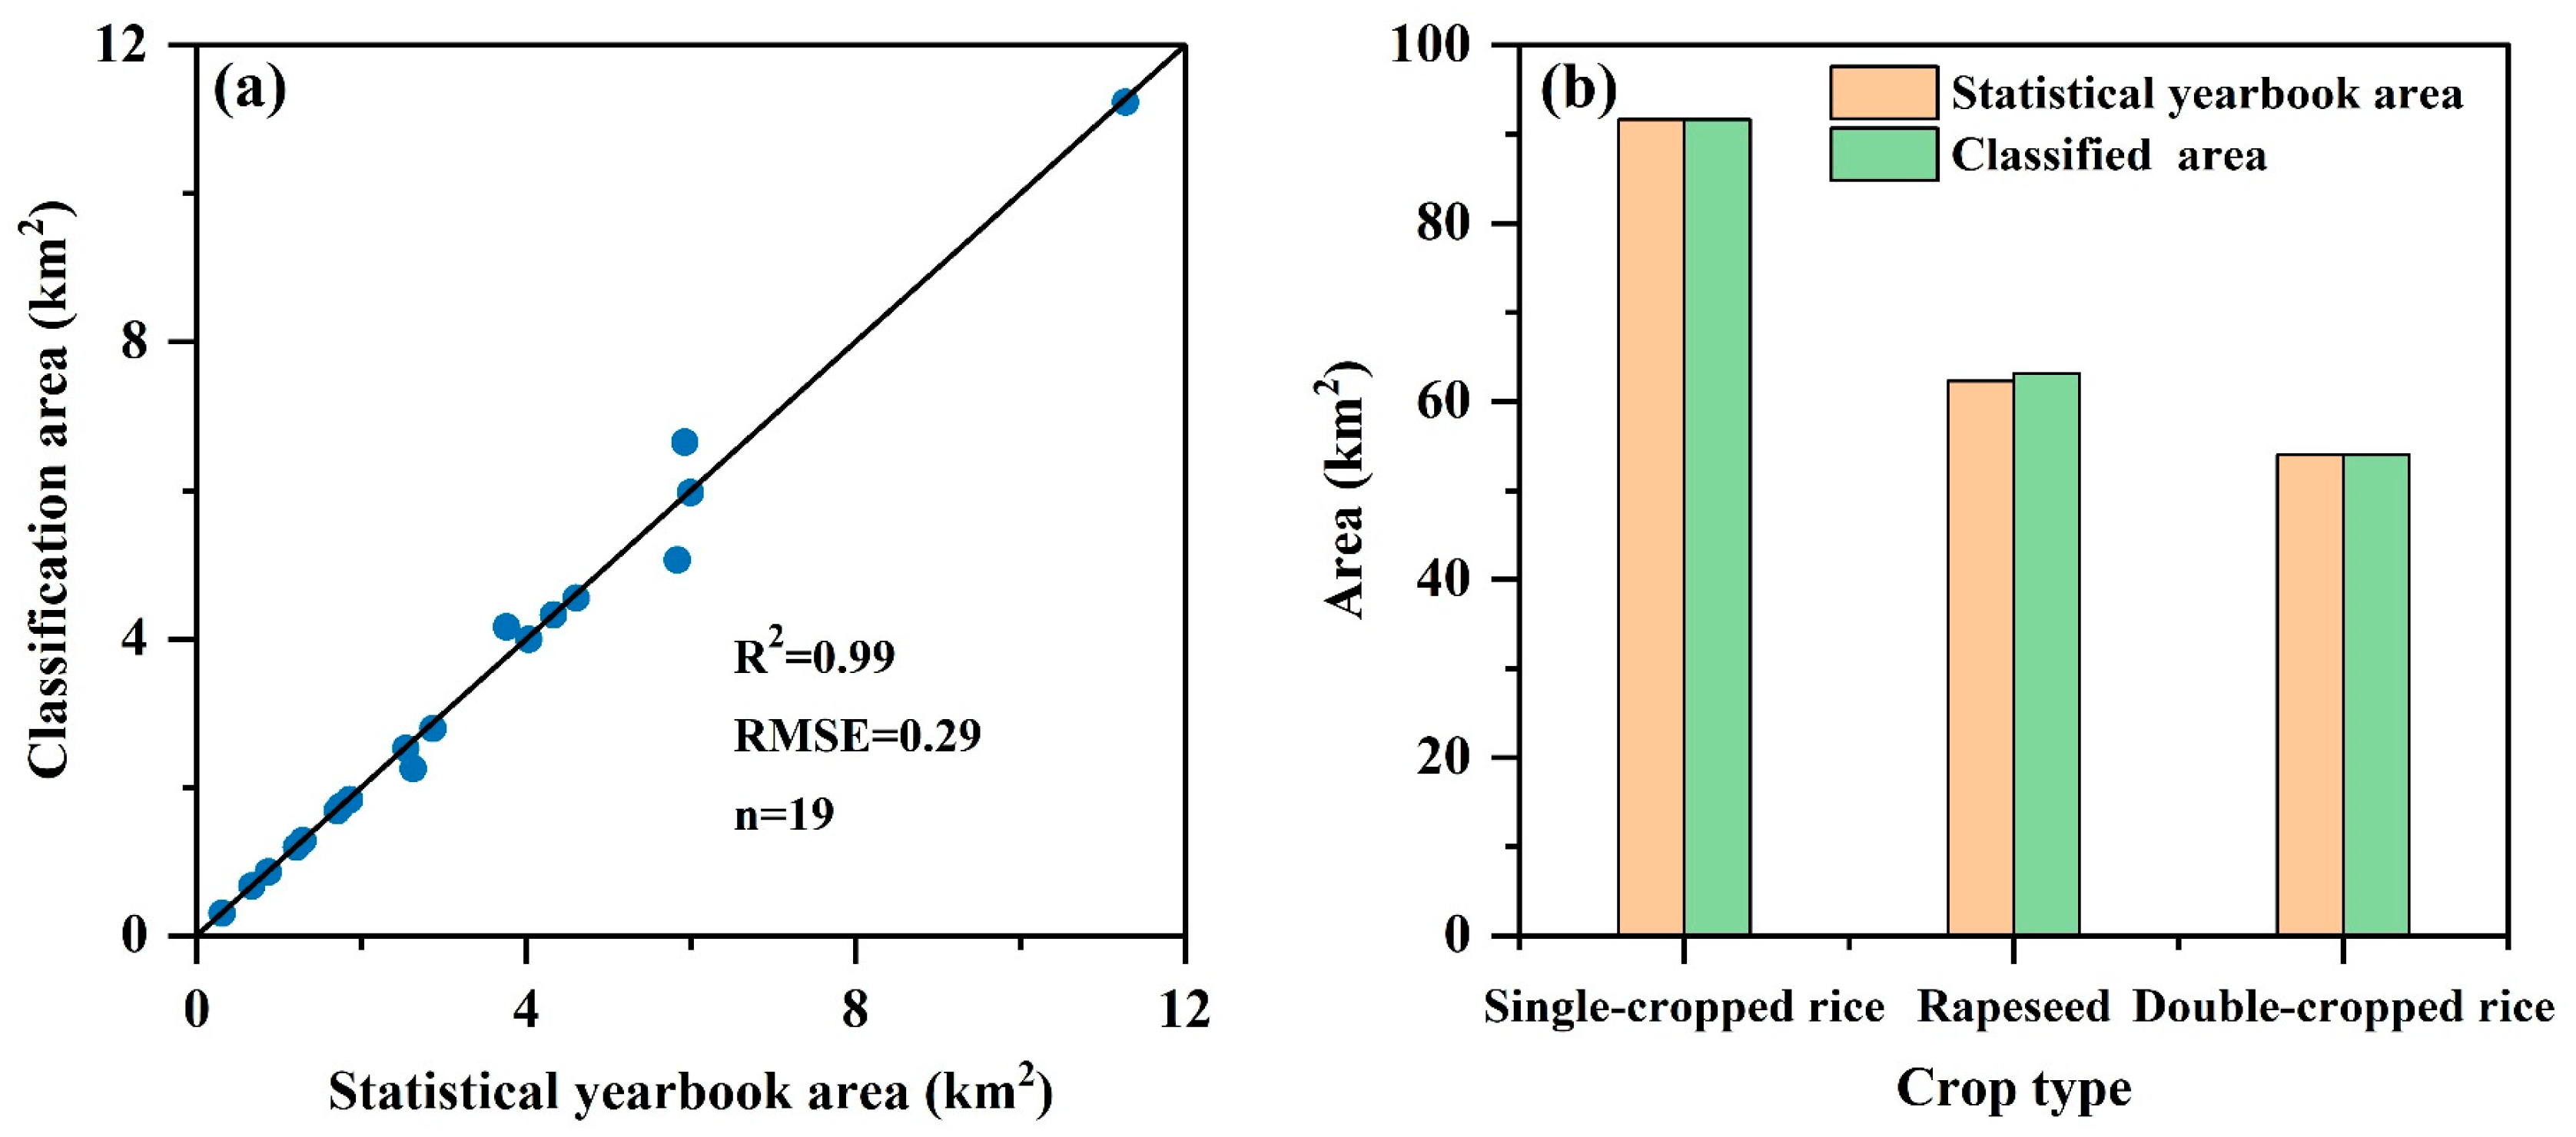
The area of mapped crop types was validated with the local statistical yearbook data (Figure 6). The classified area of rapeseed, single-cropped rice, and double-cropped rice in 2022 was 63.09, 91.63, and 53.99 km2, respectively, which is very close to the corresponding planting area (63.50, 92.98, and 55.97 km2, respectively) (Figure 6a). Among the three crop types, rapeseed had the lowest estimated error, with a relative bias ratio of 0.65%. The relative bias ratio of single-cropped rice and double-cropped rice was 1.45% and 3.54%, respectively. This further confirms the better performance of rapeseed’s classification than that of classifications for single-cropped rice and double-cropped rice. The additional validation of the classified area of rapeseed at the township level (Figure 6a) shows a high R-square of 0.99 and low root mean square error (RMSE) of 0.29 km2, further indicating the good performance of our proposed framework for mapping winter crops in the study area. At the county level (Figure 6b), the classified area of single-cropped rice was 91.63 km2, matching the value reported in the 2022 statistical yearbook. The classified areas of double-cropped rice and rapeseed were 53.98 and 62.26 km2, respectively, with discrepancies of less than 0.2 km2 from the values in the statistical yearbook.
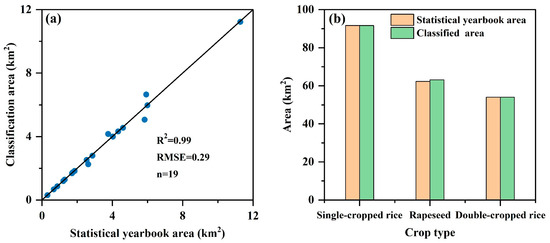
Figure 6.
Evaluation of crop classification areas: (a) rapeseed at the township level; (b) three major crop types at the county level.
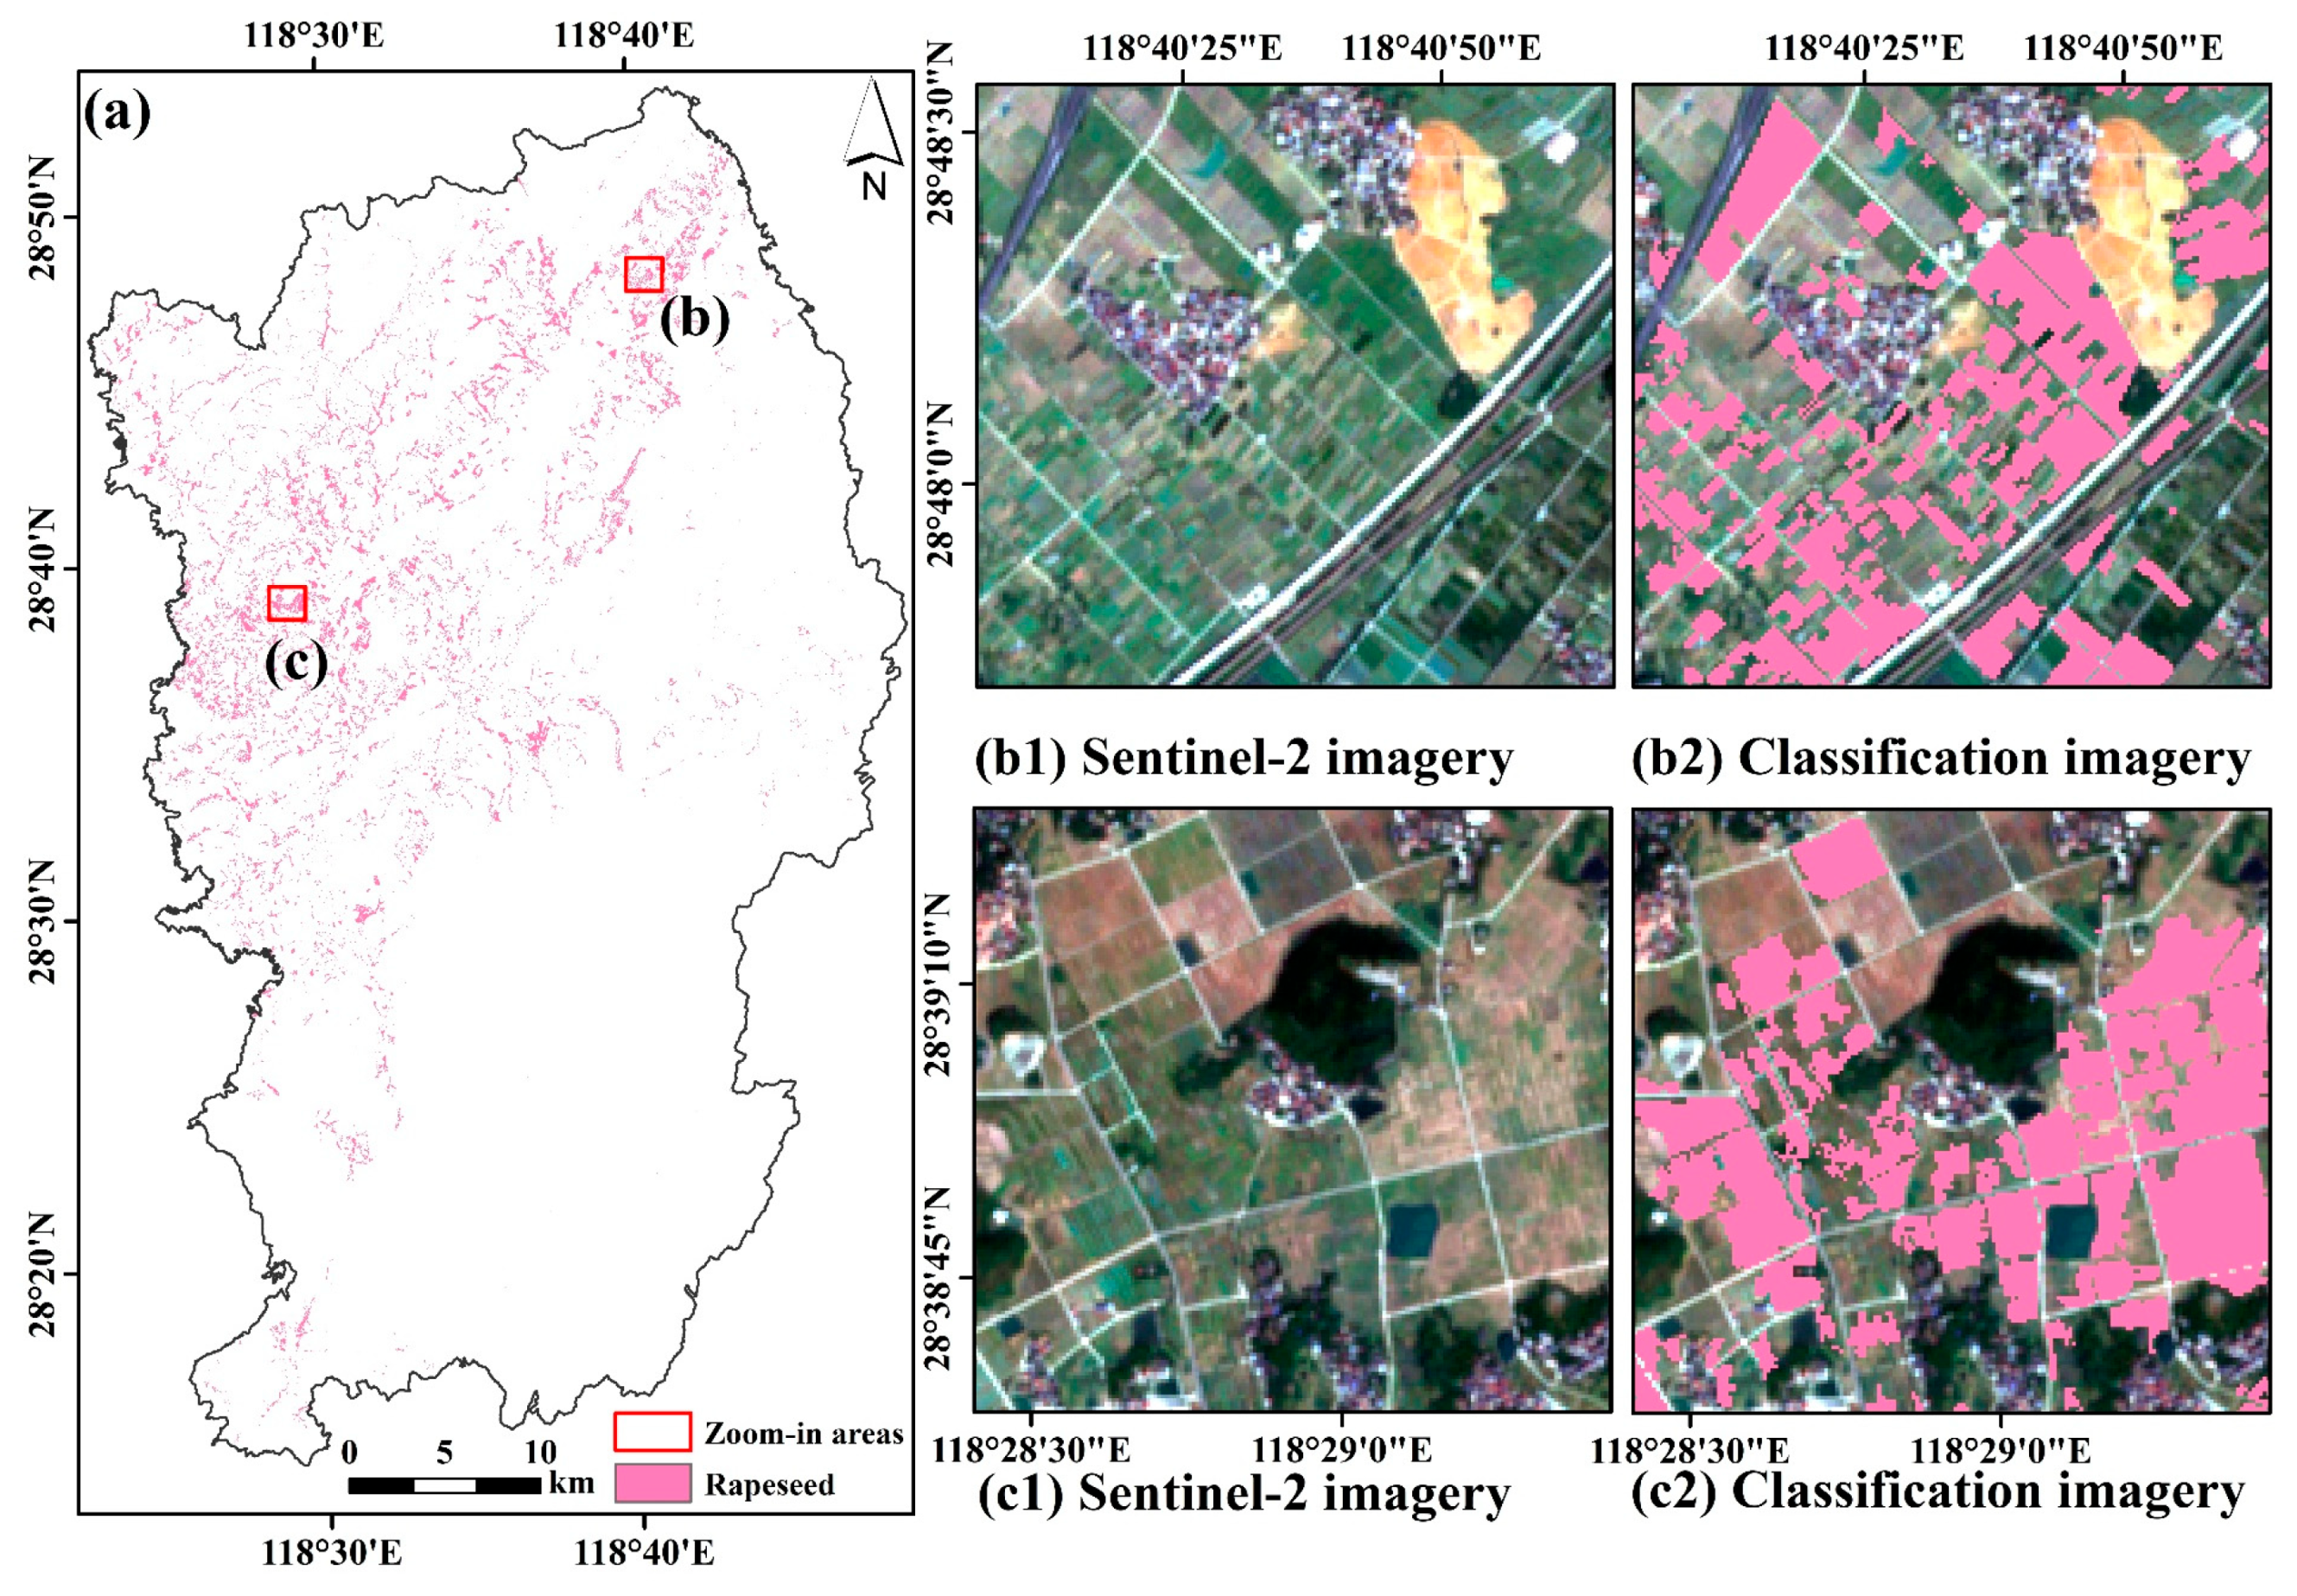
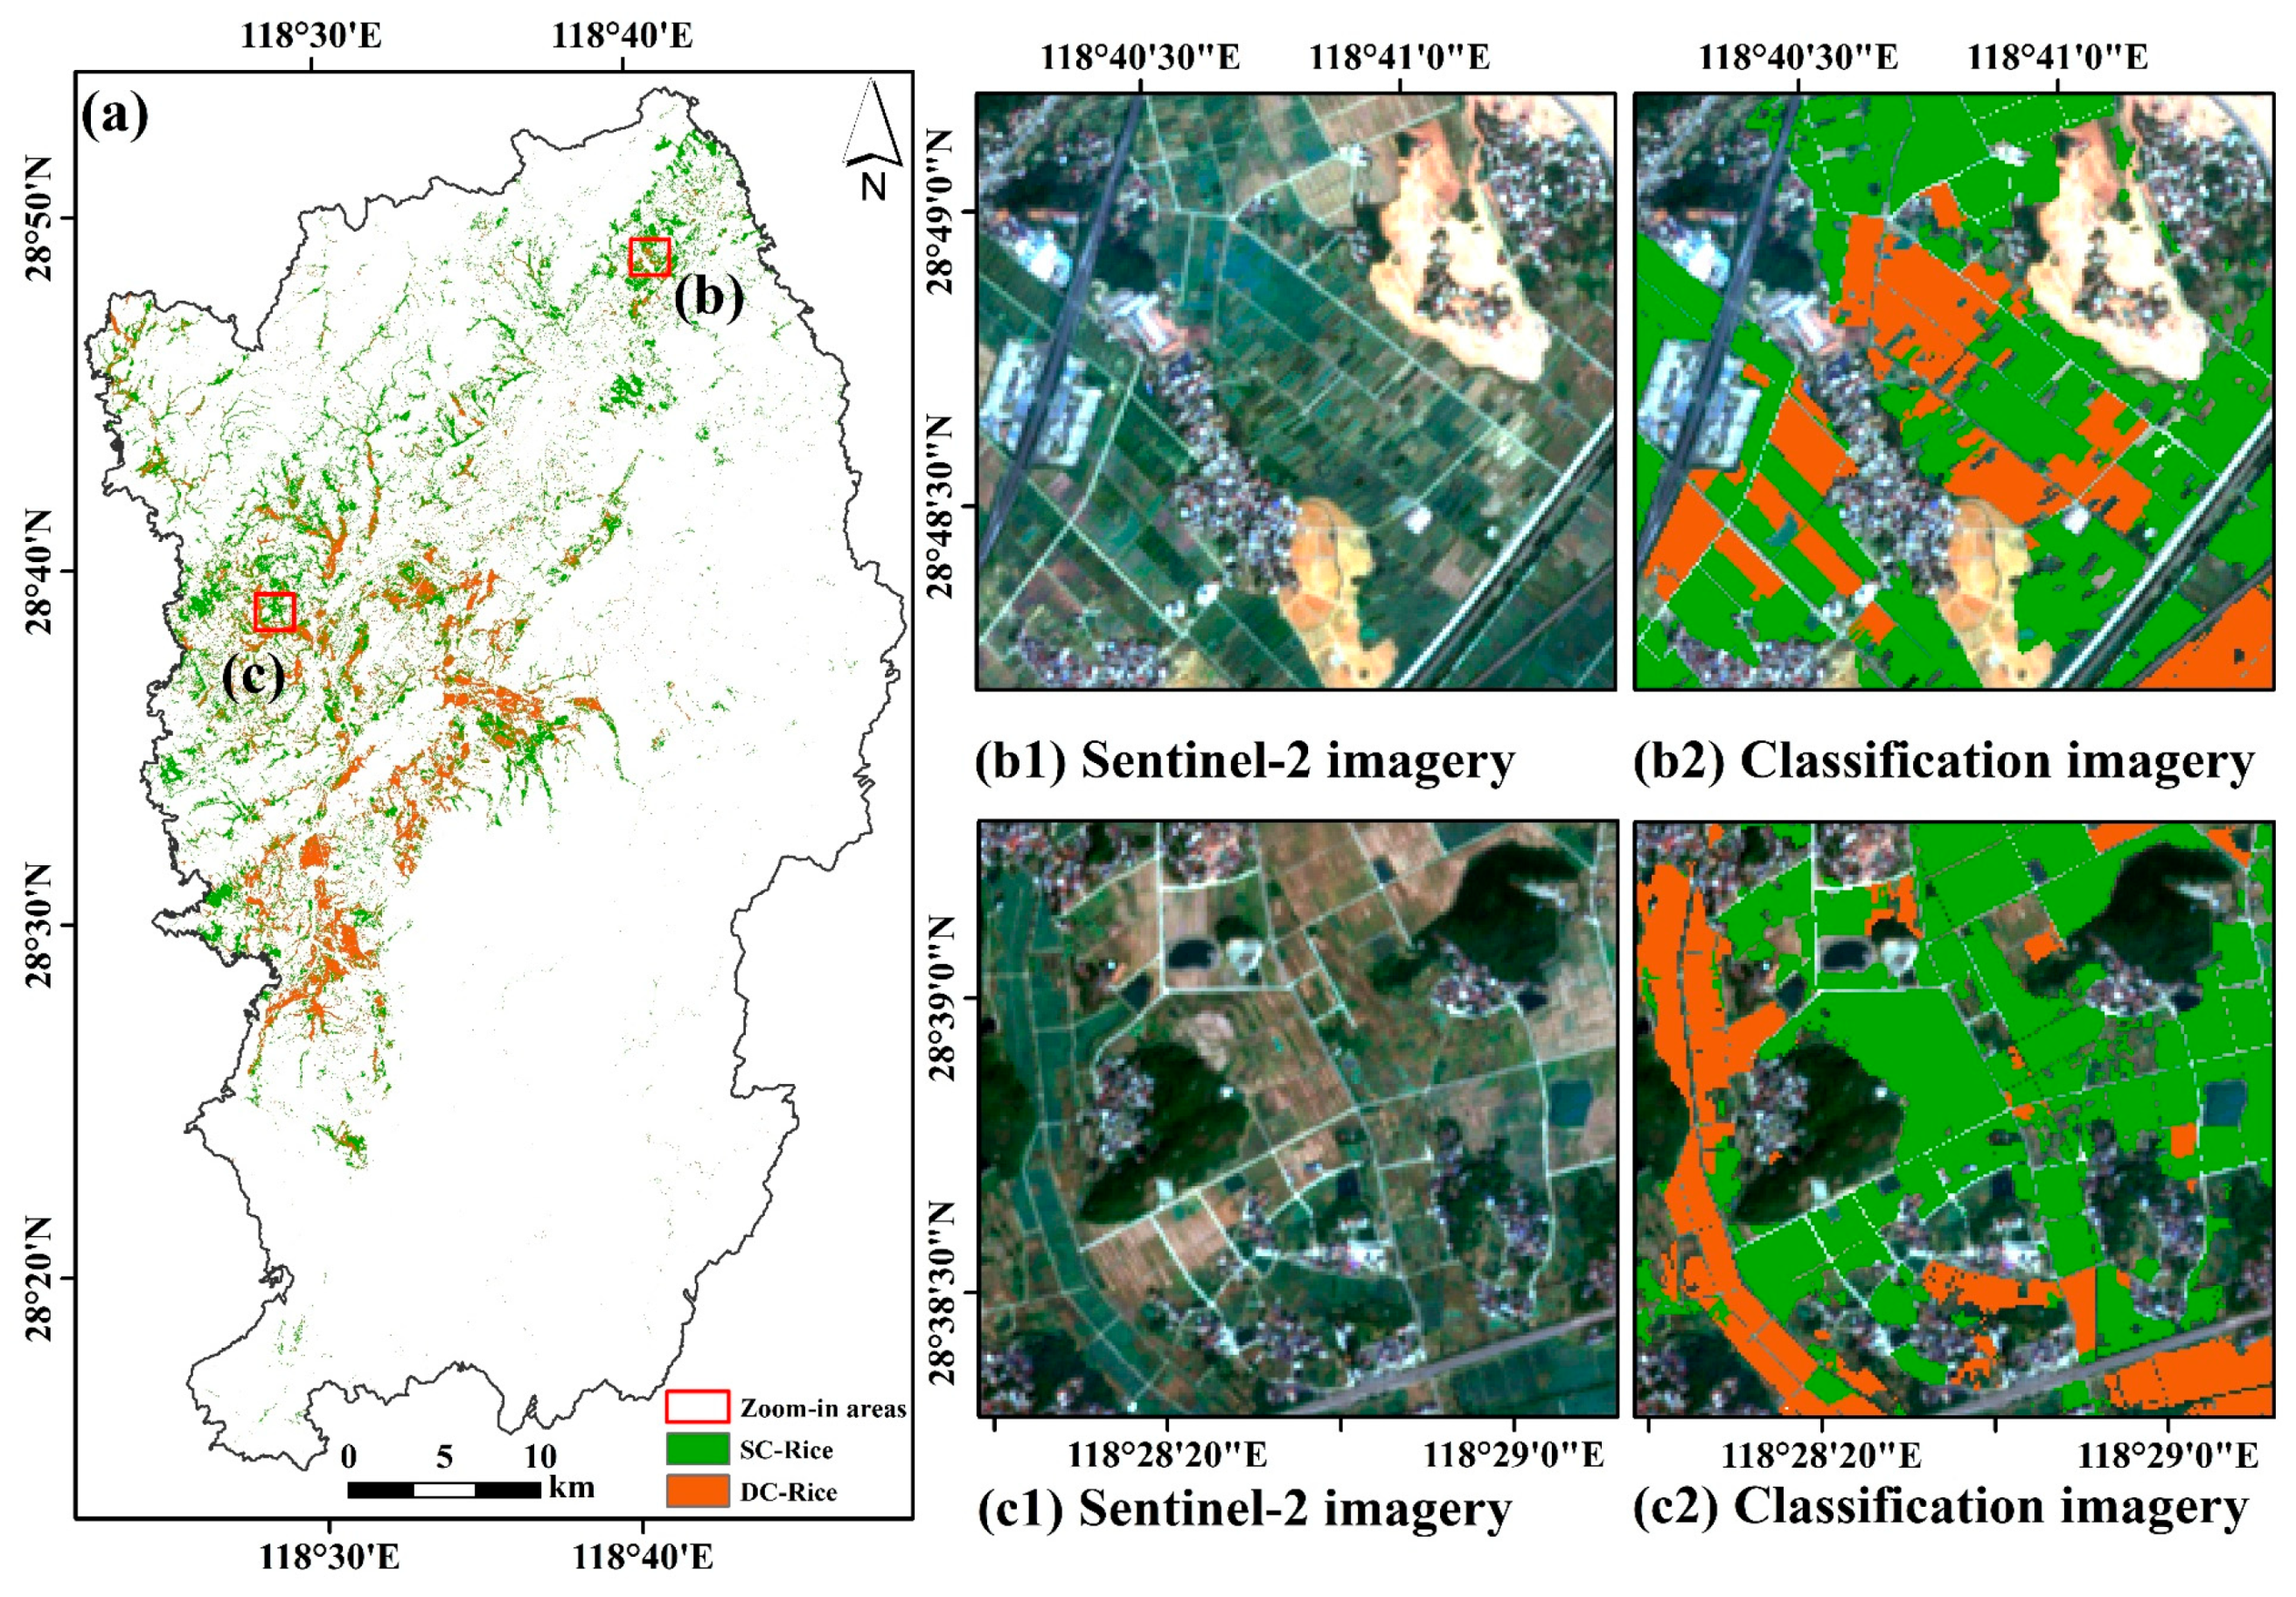
A further spatial examination of the mapped winter and summer crops showed a high spatial consistency of the classified rapeseed, single-cropped rice, and double-cropped rice distribution with the actual satellite imagery (Figure 7 and Figure 8). It can be observed that the spatial distribution of the classified rapeseed parcels is clear at the boundaries of fragmented fields and contiguous blocks, with a few misclassifications and omissions. The spatial distribution of single-cropped and double-cropped rice shows a good spatial consistency with the original Sentinel-2 imagery, although some confusion areas exist between the two. Overall, the spatial distribution of classified winter and summer crops is reliable according to the visual check based on field survey and high spatial images.
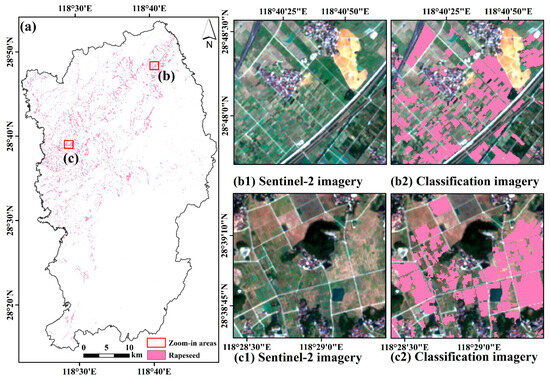
Figure 7.
Spatial distribution of rapeseed for the study area in 2022 (a), zoom-in areas (b,c), and the corresponding Sentinel-2 imagery and classification results (b1,b2,c1,c2).
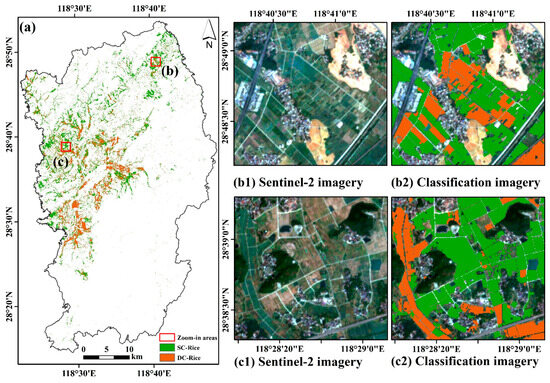
Figure 8.
Spatial distribution of single-cropped rice and double-cropped rice for the study area in 2022 (a), zoom-in areas (b,c), and the corresponding Sentinel-2 imagery and classification results (b1,b2,c1,c2).
4.2.3. Comparison with Existing Products
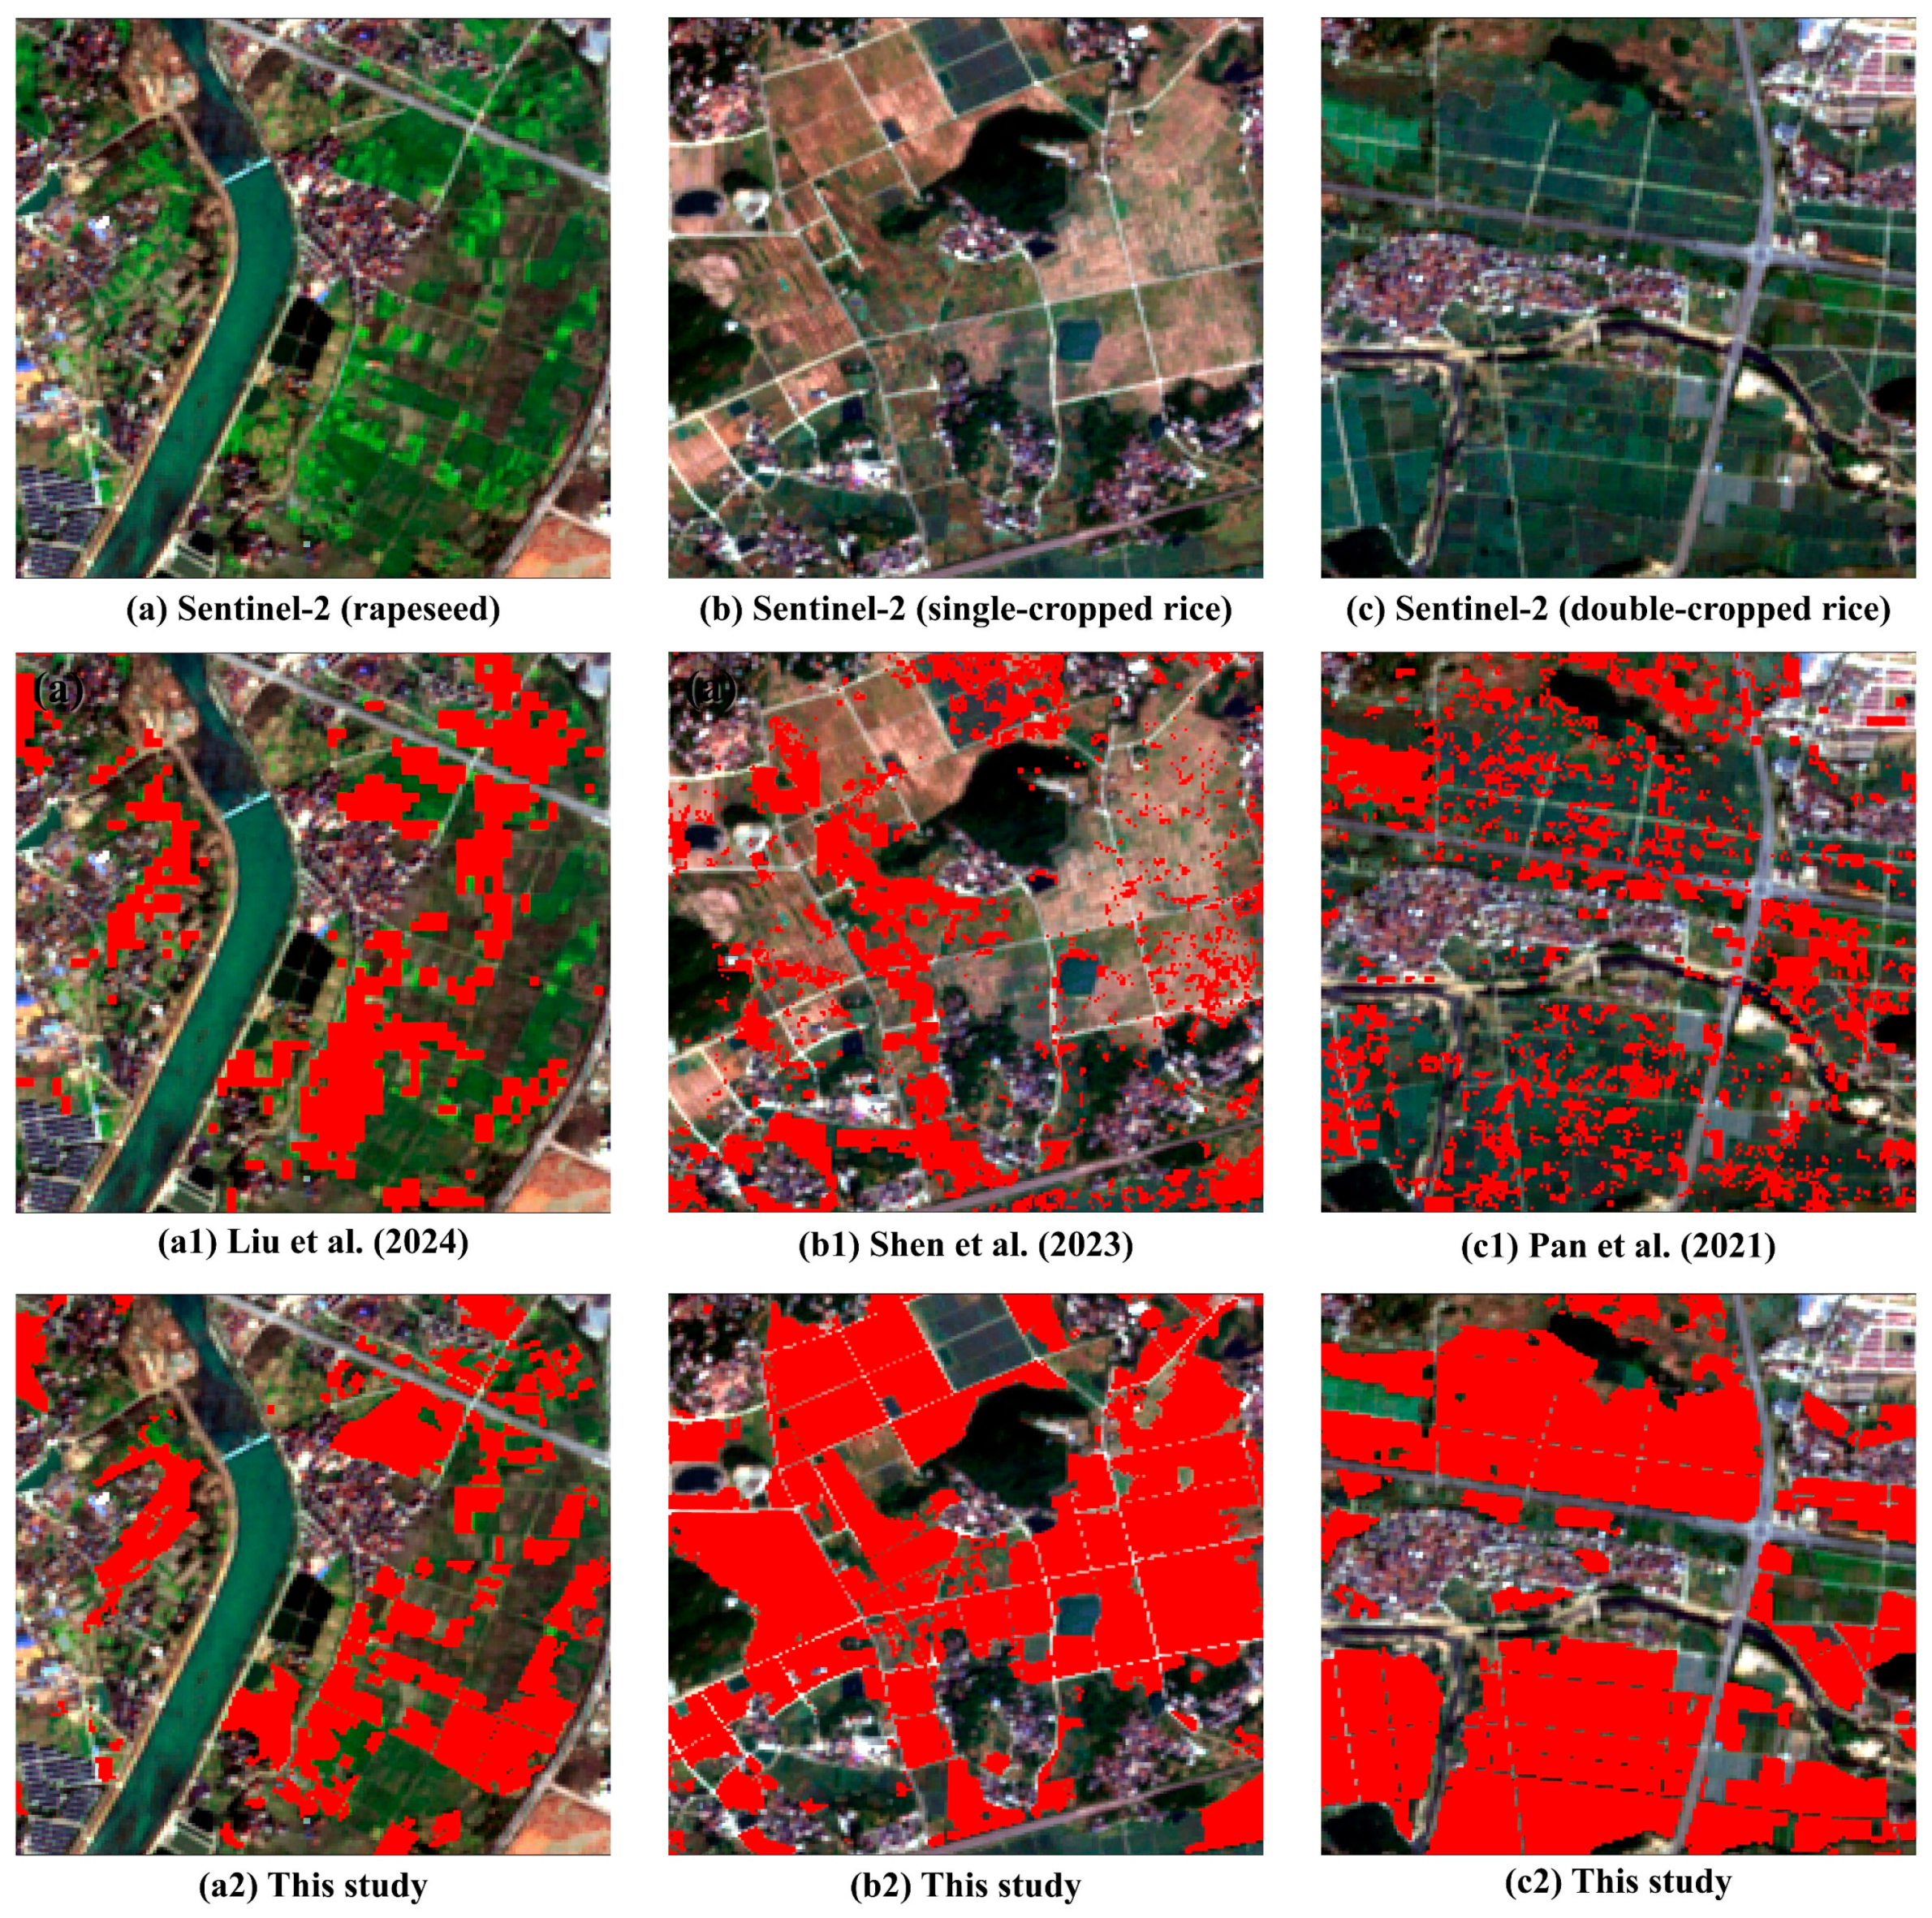
To further verify the reliability of the crop classification results, our results were compared with three existing products, including a 30 m resolution rapeseed dataset released by Liu et al. (2024) [23], which includes annual maps of rapeseed in China from 2000 to 2022, with a maximum average F1 score of 0.97; a 10 m resolution single-cropped rice dataset released by Shen et al. (2023) [25], which includes annual maps of single-cropped rice in China from 2017–2022, with an overall accuracy of 85.23%; and a 10 m resolution double-cropped rice dataset released by Pan et al. (2021) [43], which includes annual maps of double-cropped rice in China from 2016 to 2022, with both producer and user accuracies exceeding 87%. From the comparison results (Figure 9), our classified crop parcels appear more complete, with clearly defined boundaries between fields. In contrast, the existing product shows a more fragmented classification, with considerable salt-and-pepper noise. Moreover, the omission of crop areas is noticeably severe in the existing product. A comparison with statistical yearbook data reveals varying degrees of accuracy across different crop mapping products (Table 5). The rapeseed area derived from Liu et al. (2024) [23] is 34.64 km2, which underestimates the yearbook value of 63.50 km2 by 28.86 km2. In contrast, in single-cropped rice, Shen et al. (2023) [25] slightly overestimated the area by 0.46 km2, whereas our classification result underestimated it by 1.35 km2. In the case of double-cropped rice, Pan et al. (2021) [43] reported an area that was 7.51 km2 lower than the yearbook, while the corresponding difference in our study was only 1.98 km2.
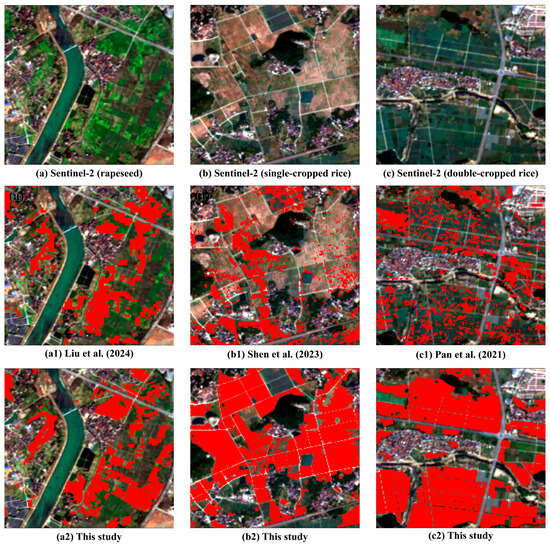
Figure 9.
Comparison of the classification results of this study with existing products. Sentinel-2 imagery of selected regions for (a) rapeseed, (b) single-cropped rice, and (c) double-cropped rice planting areas. Panels (a1–c1) show the corresponding crop classification datasets from Liu et al. (2024) [23], Shen et al. (2023) [25], and Pan et al. (2021) [43], respectively. Panels (a2–c2) present the classification results generated in this study.
Table 5.
Comparison of existing products’ crop areas and yearbooks for Jiangshan City in 2022.
4.3. Spatial Distribution of Crop Types and Cropping Patterns
It can be observed that the spatial distribution of rapeseed in the study area is relatively scattered (Figure 7). This is mainly due to two reasons: first, the rapeseed is primarily cultivated by smallholder farmers, resulting in a dispersed planting pattern; second, the hilly and mountainous terrain of the region hinders agricultural mechanization and the consolidation of farmland into large contiguous plots. From the spatial distribution of rice (Figure 8), single-cropped rice is dominant across the study area, with large-scale distribution observed in various regions. In contrast, double-cropped rice was mainly concentrated in the relatively flat central and southern areas. According to interviews with local farmers, double-cropped rice is primarily grown for commercial purposes, and cultivation in flatter areas facilitates mechanized production. In comparison, single-cropped rice is mostly cultivated by local farmers for subsistence purposes, leading to a more scattered distribution. Overall, single-cropped rice occupied the largest planting area in the study region, accounting for 33.32% of the cultivated land area, followed by rapeseed at 22.94%. Double-cropped rice had the smallest area ratio, accounting for 19.64%. The remaining crop types in the study area were more diverse, including upland crops such as maize, soybean, and various vegetables. These crops were cultivated in a highly scattered manner and typically covered small areas; therefore, this study did not classify them individually.
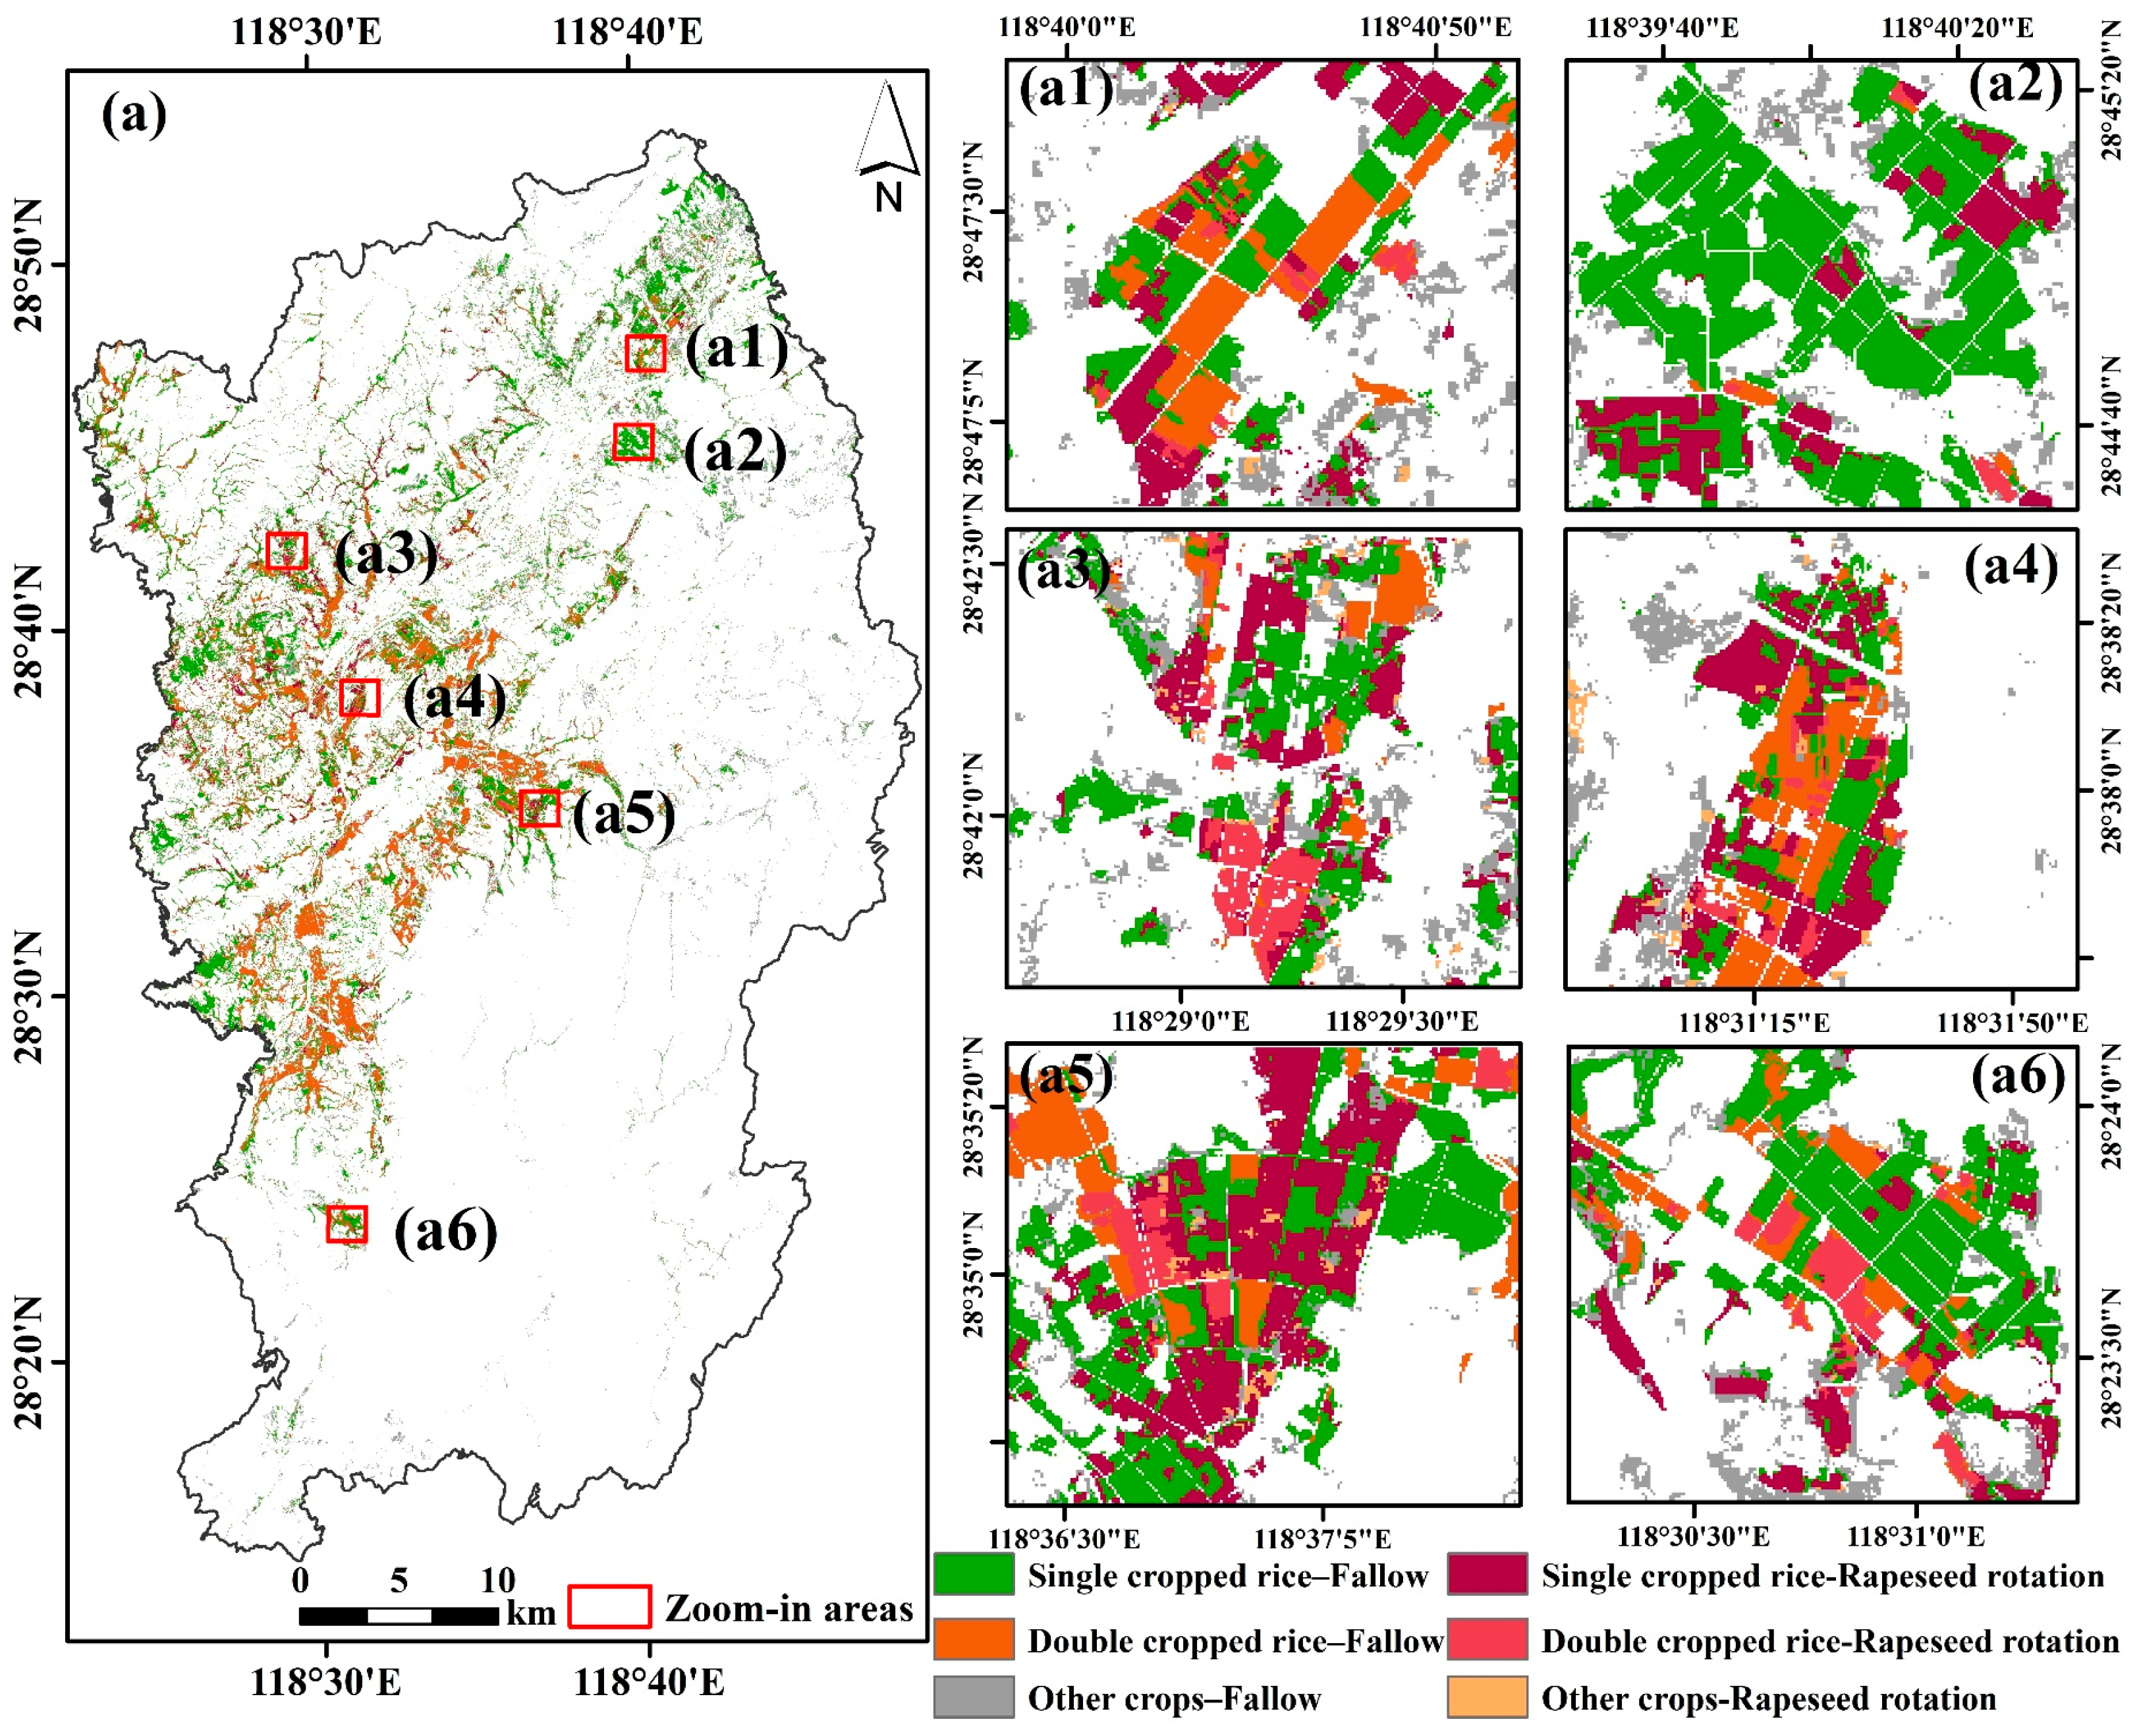
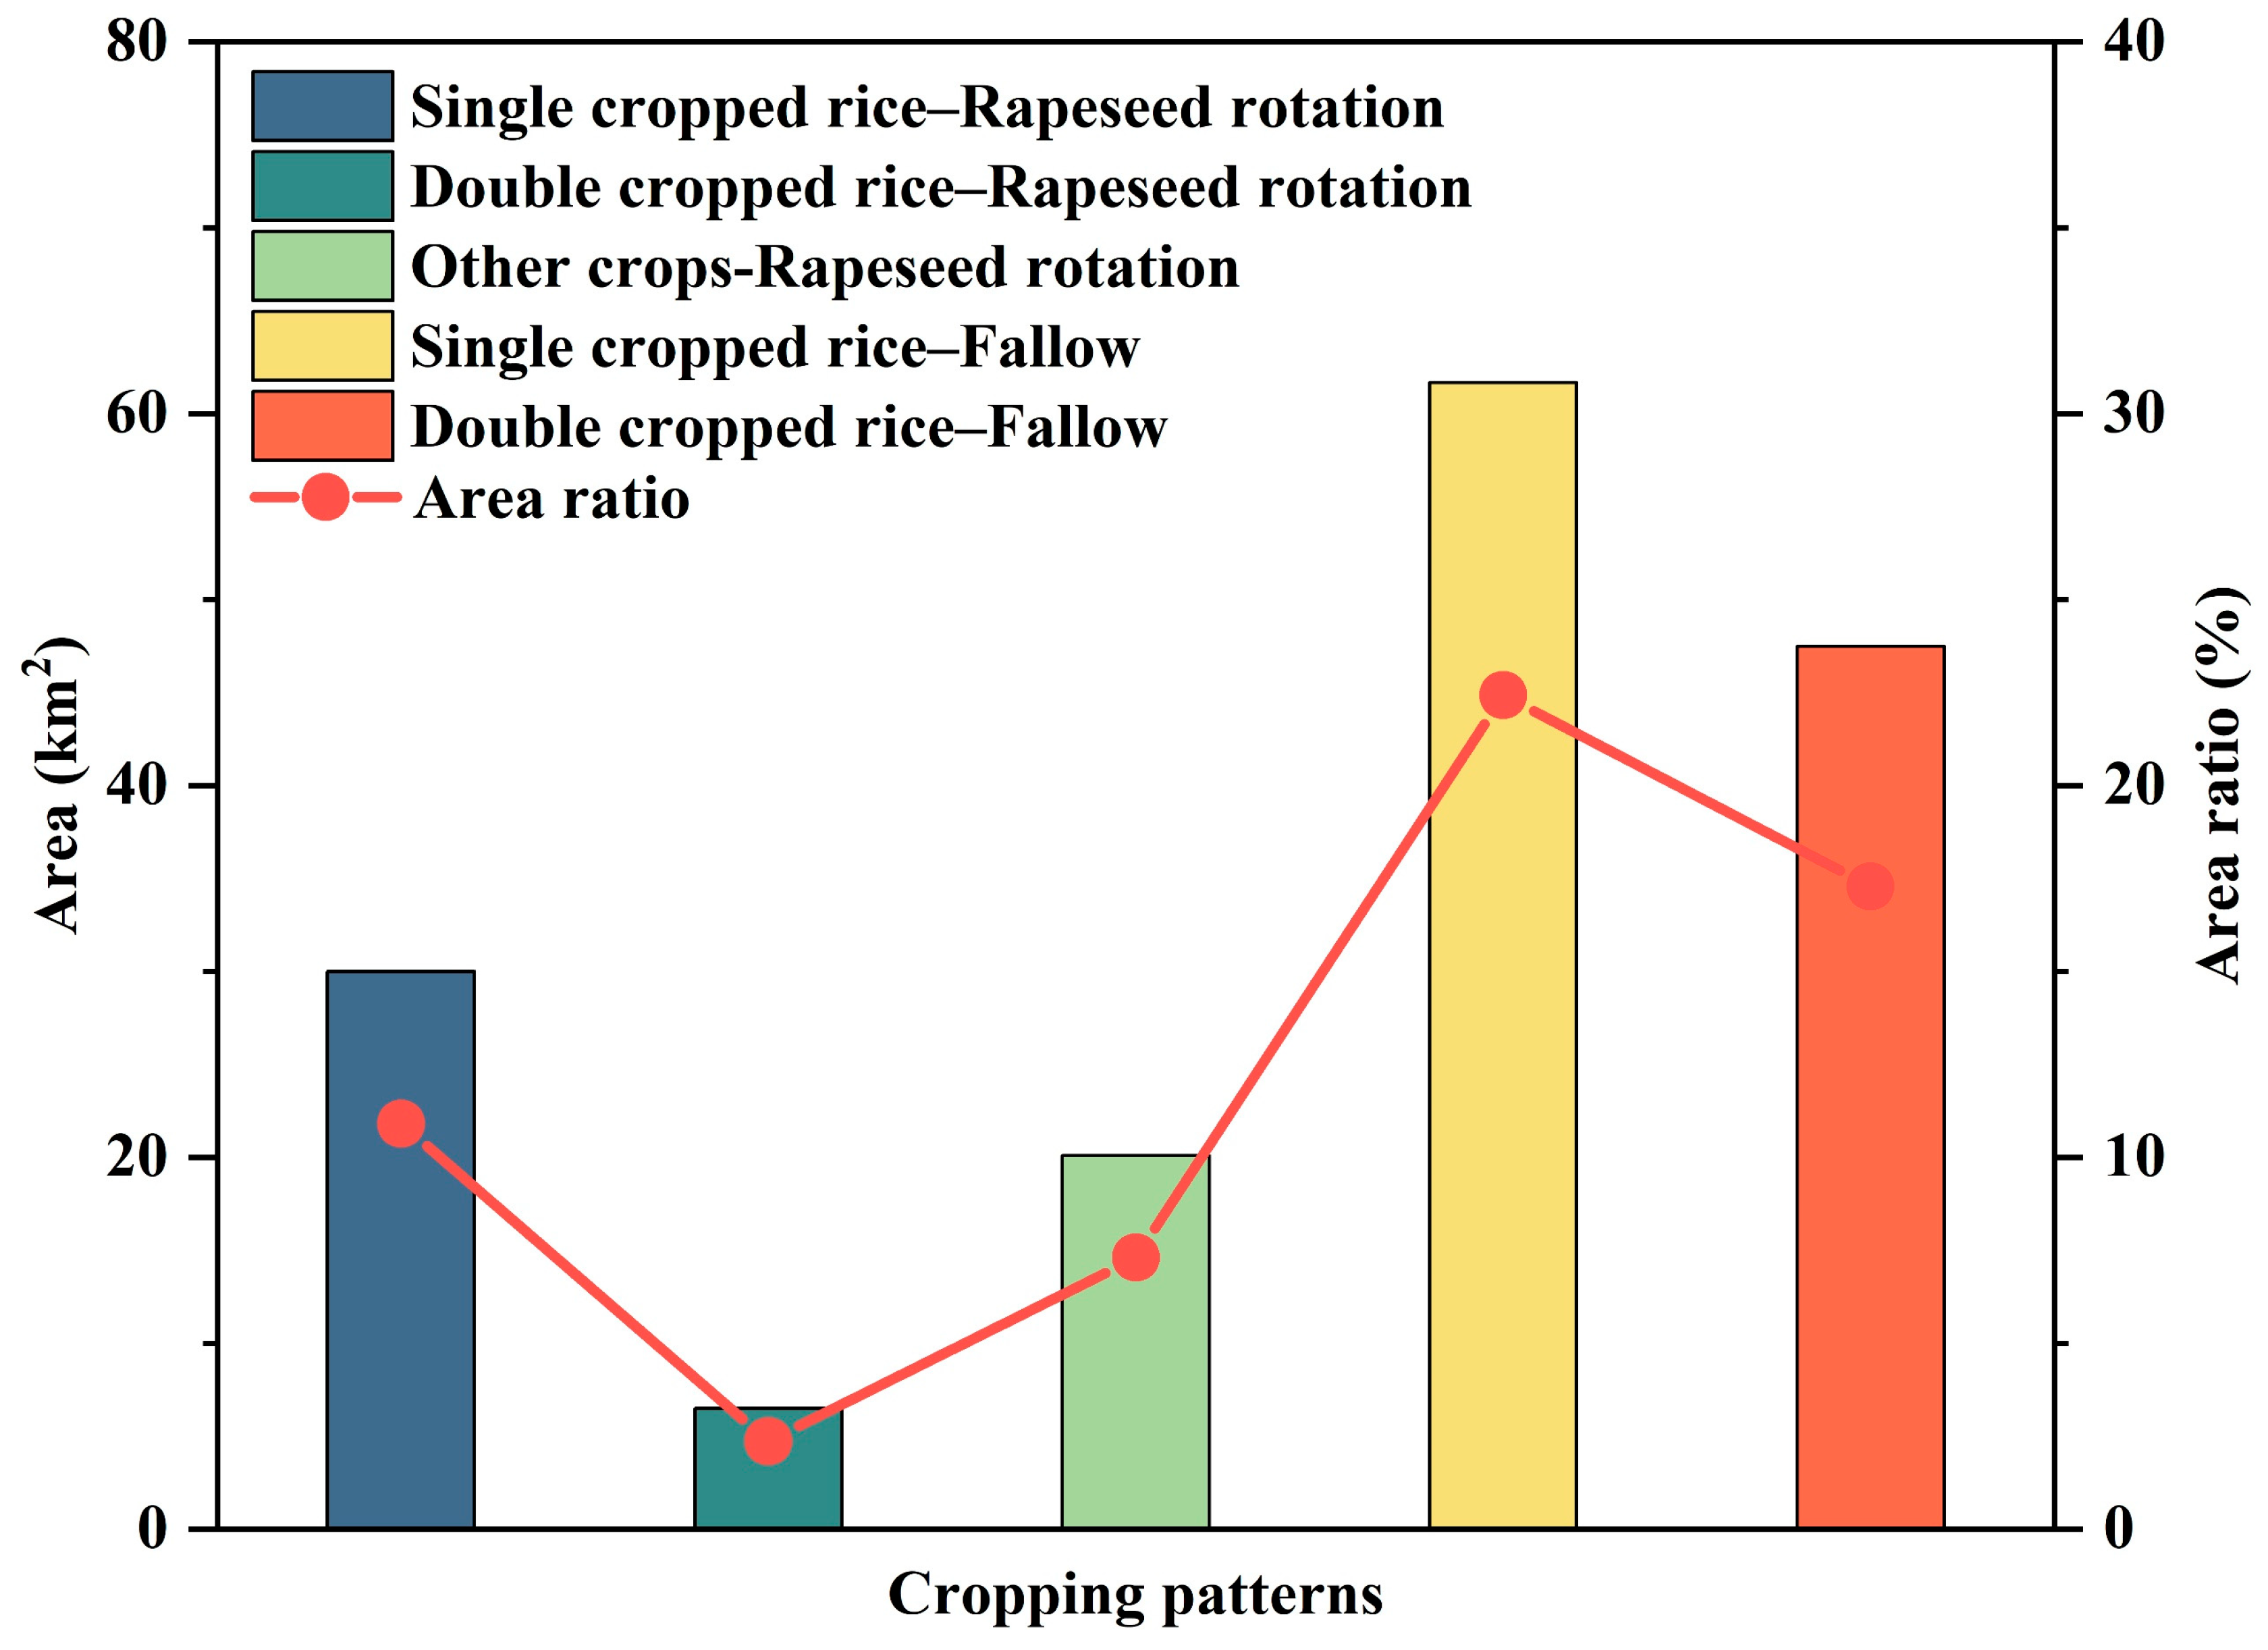
According to the cropping pattern map (Figure 10) and the area statistics (Figure 11), the dominant cropping pattern in the study area was single-cropped rice–fallow, with a planting area of 61.67 km2, accounting for 22.43% of the cultivated land area. This was followed by double-cropped rice–fallow, covering 47.50 km2, accounting for 17.28%. The area under single-cropped rice–rapeseed rotation was 29.99 km2, accounting for 10.91%. Other crops–rapeseed rotation occupied 20.09 km2, accounting for 7.31%, while double-cropped rice–rapeseed rotation had the smallest area at only 6.49 km2, accounting for 2.36%.

Figure 10.
Spatial distribution of cropping patterns for the study area in 2022 (a), and the corresponding classification results of zoom-in areas (a1–a6).
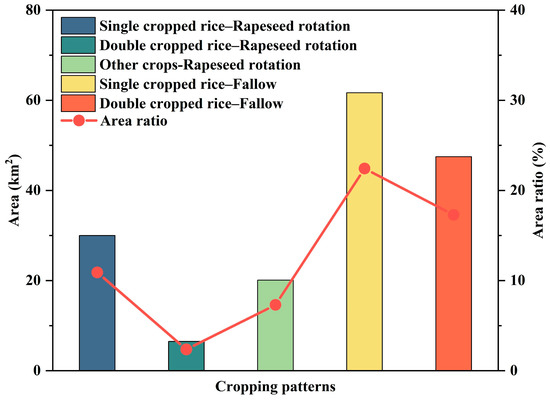
Figure 11.
Planting area of the main cropping patterns in the study area in 2022.
Overall, rice held an overwhelmingly dominant position in the agriculture of the study area, with the fallow–single-cropped rice and double-cropped rice–fallow systems being the most prevalent cropping patterns. Spatially, rice cultivation was mainly concentrated in the central and northern plains. This high concentration improves agricultural efficiency but also increases the vulnerability of rice-growing areas to extreme weather events (e.g., floods and droughts) and natural disasters (e.g., pest outbreaks). In contrast, the hilly and mountainous areas in the southern and southeastern parts present greater challenges for cultivation. In these regions, cropland was scattered and situated on steeper slopes, resulting in simpler cropping patterns dominated by drought-tolerant crops such as rapeseed.
5. Discussions
5.1. Potential of Combining Multi-Source Data in Crop Type Classification
The use of remote sensing technology for the high-precision identification of crop types and cropping patterns has been a long-standing focus in agricultural production and decision-making [44]. However, high-quality optical data is limited in subtropical hilly and mountainous areas, where frequent cloud and rain make it very challenging to obtain temporally continuous spectral information at large scales [45]. This problem may result in missing critical time windows for some crops, impacting the classification accuracy. On the other hand, to accurately identify planting patterns, information about crops growing in different seasons needs to be extracted, which significantly increases the difficulty and data costs of the classification. While the fusion of multi-source optical remote sensing data can help mitigate the aforementioned limitations [46], frequent cloud cover in subtropical hilly regions affected by monsoon climates often undermines the consistency and quality of optical imagery. In this context, Synthetic Aperture Radar (SAR) data—capable of all-weather, all-day imaging—can effectively supplement low-quality optical observations. By increasing the observation frequency and capturing key phenological characteristics of crops, SAR data’s fusion contributes to an enhanced robustness and reliability in classification performance.
In contrast to optical data, SAR data is much less affected by cloudy or rainy weather and can theoretically act as an effective alternative when optical data is unavailable [47]. As a result, this study assessed the potential of combining Sentinel-1 data (including VV, VH, and the VH/VV ratio) with optical data for the classification of winter and summer crops using the selection of variables. The results show SAR features are selected by the RF classifier in both winter and summer crops’ classifications. For the classification of winter crops, in the best feature combination, VV and VH are ranked 16th and 5th in importance, respectively. For the classification of summer crops, although VH is included in the optimal feature combination, its importance is ranked lower, at 20th.
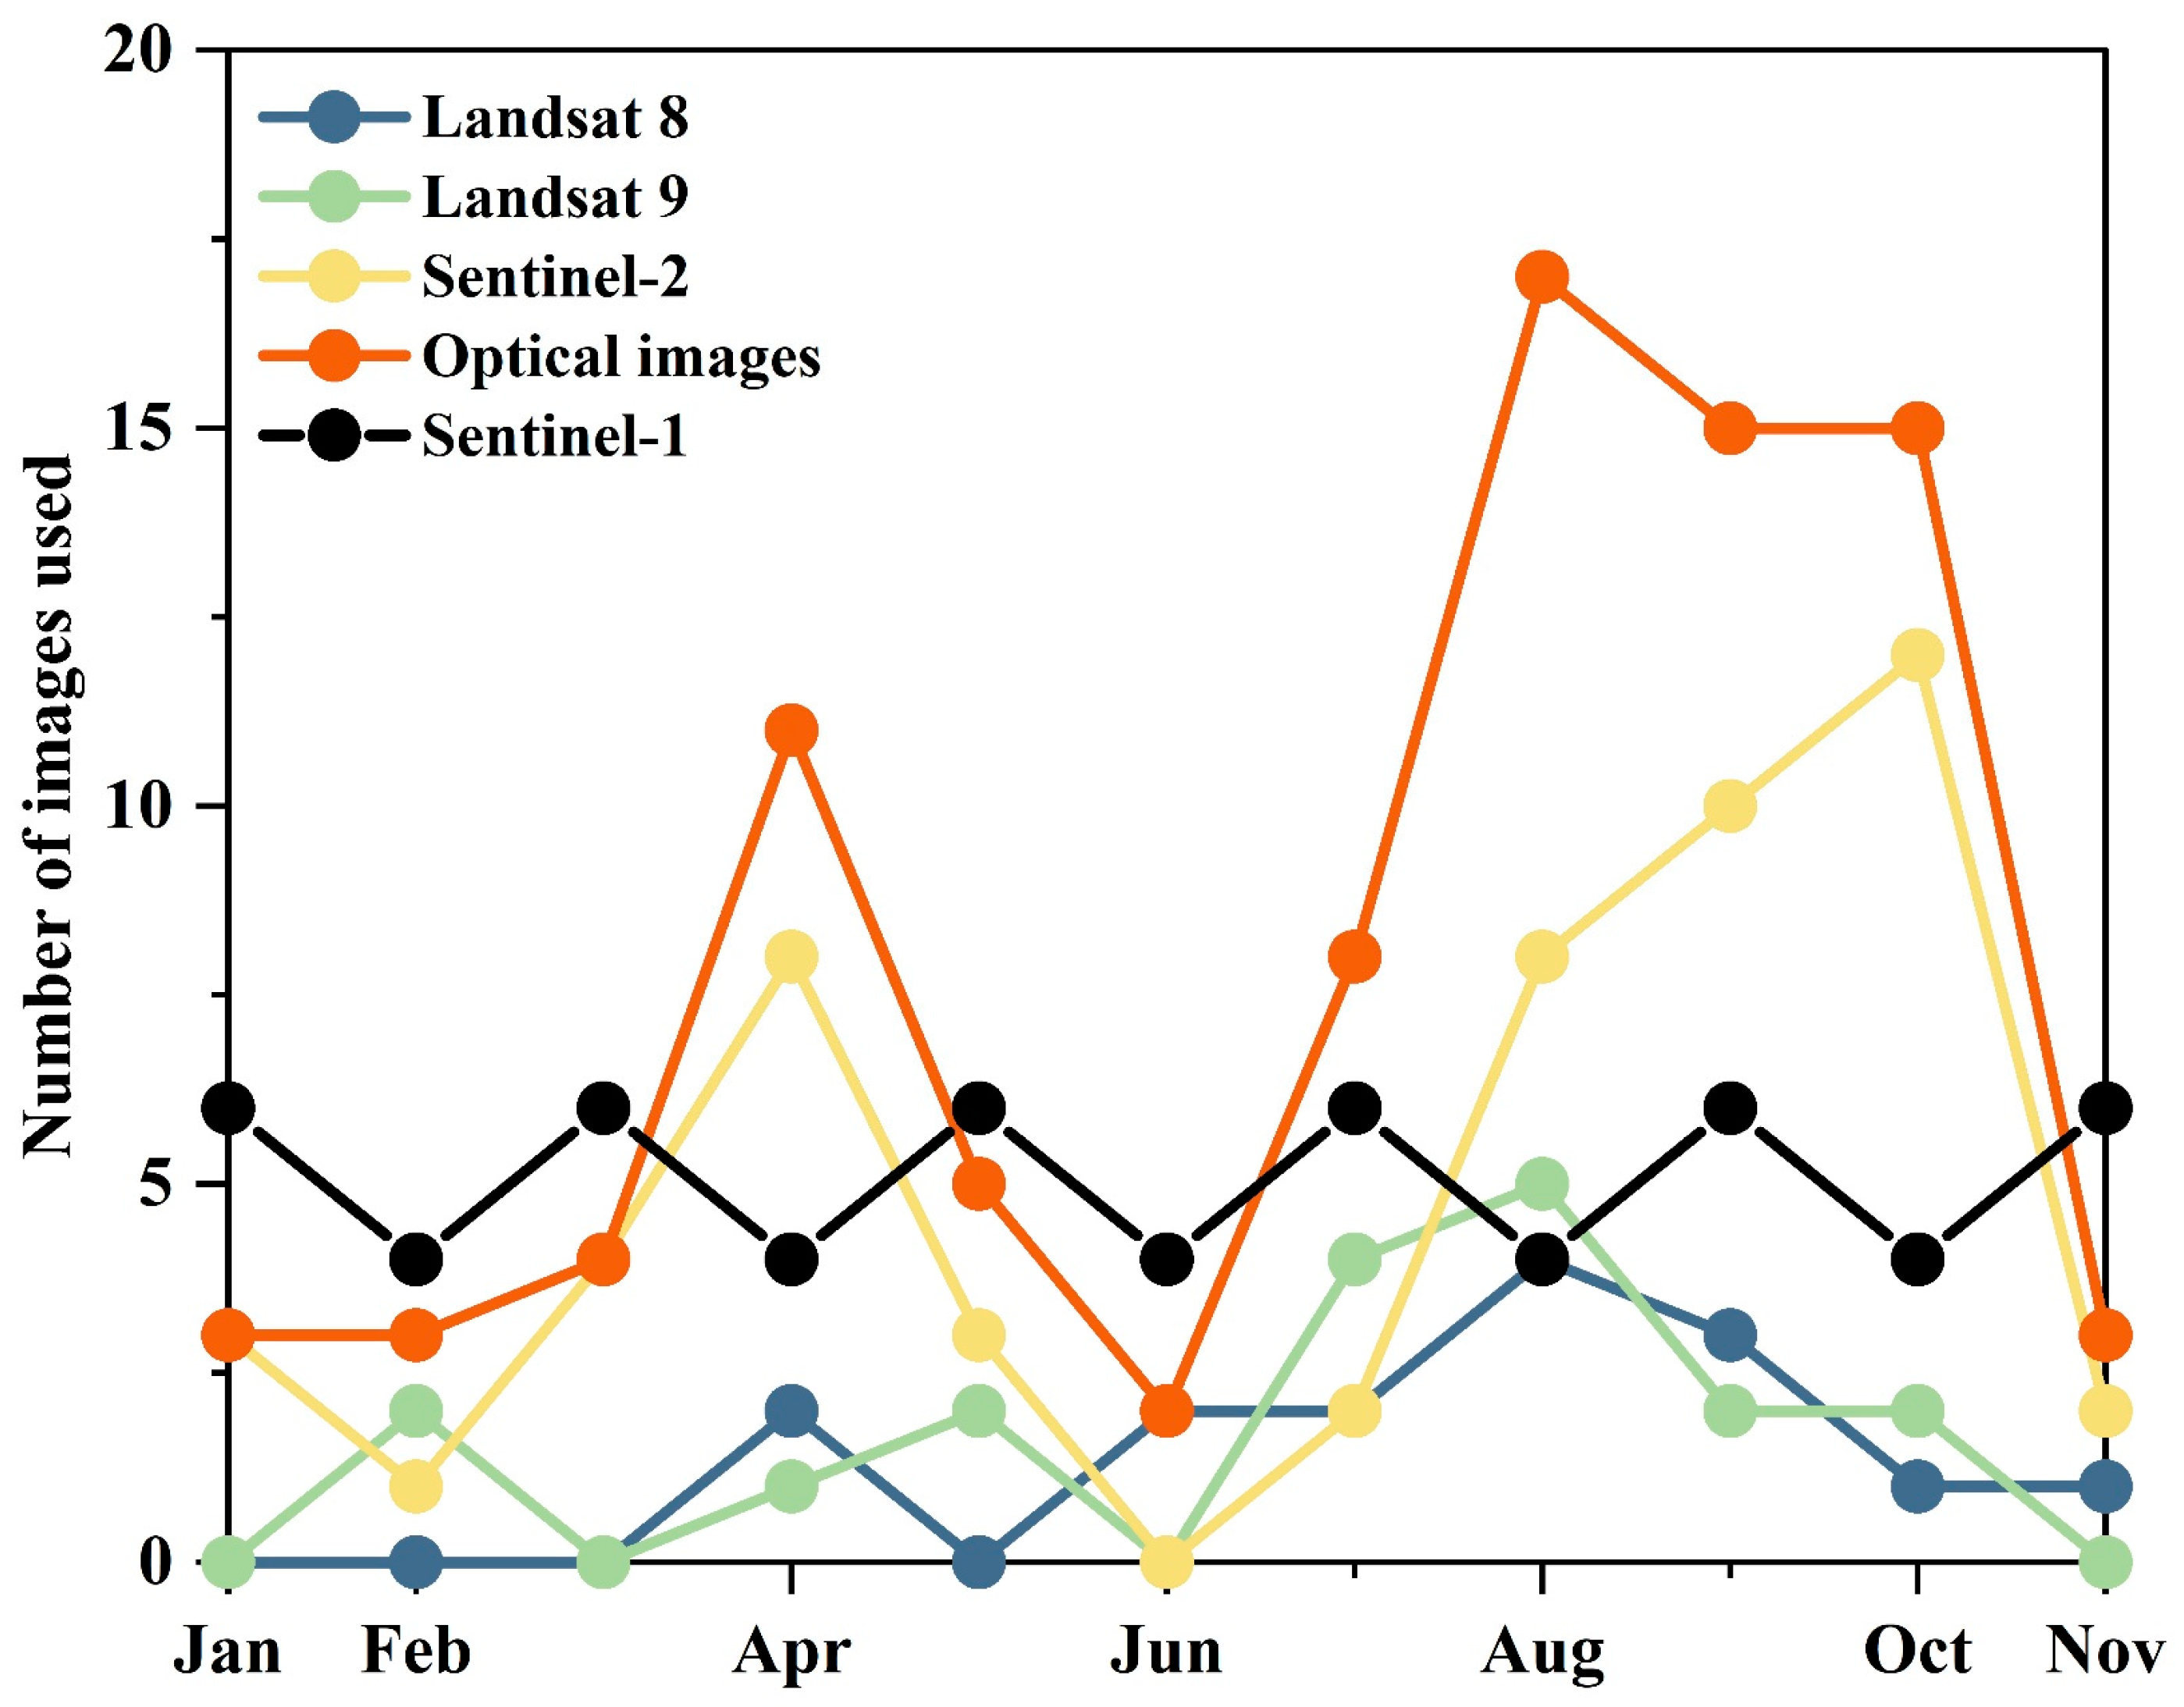
Additionally, in an analysis of the number and distribution of input images used in this study (Figure 12), we found that during the winter crop classification window (January to May), the number of usable optical images with a 20% cloud cover threshold is only 26 scenes. In the summer classification window (May to November), the number of high-quality optical images is higher, with 60 usable optical images at the 20% cloud cover threshold. Our results show that when the availability of optical images is low, the inclusion of SAR images can effectively enhance crop classifications’ accuracy, indicating SAR data plays an indispensable role in the classification of subtropical crop types. Lastly, the phenological information provided by optical imagery is critical for the classification, with importance scores ranking in the top 50% for both winter and summer crops’ classifications.

Figure 12.
Number of used images in the study area in 2022.
5.2. Classification Algorithm’s Selection
The choice of classification algorithm is crucial for the reliability of crop classification methods. Decision trees (DTs), Support Vector Machines (SVMs), Classification and Regression Trees (CARTs), and random forests (RFs) are machine learning algorithms that have been widely applied in crop classification [48]. RF has been used in crop classification in various regions and scales [49]. For example, Zhou et al. (2022) classified maize and soybeans in Canada using the RF algorithm with time-series Sentinel-1 imagery, achieving an accuracy of 96.66% [50]. Fei et al. (2022) evaluated the applicability of RF, SVM, and Artificial Neural Networks (ANNs) in the classification of cotton at the county scale in China, finding that the RF algorithm provided a higher classification accuracy and stability [51]. Li et al. (2023) developed the first national crop map of China at a 10 m resolution using the RF algorithm and Sentinel-2 imagery, achieving an accuracy of 92% [52]. Due to its adaptability to multivariable classification scenarios, good generalization ability, and resistance to overfitting, the RF algorithm was chosen as the classifier for this study.
5.3. Shortcomings and Prospects
This study provides a framework for the classification of crop types and cropping patterns in subtropical hilly and mountainous areas and has been proved to have a good performance. However, the classification accuracy is still subjected to uncertainties due to the number and quality of images, field parcel fragmentation, and the complexity of the planted crop types. First, in subtropical hilly regions, optical imagery is frequently affected by cloudy and rainy weather, resulting in a limited number of high-quality images [53]. This can significantly impair the ability of the proposed method to capture key crop phenological stages. For instance, the transplanting period of single-cropped rice often coincides with the East Asian monsoon (Mei-yu) season [54], during which the availability of cloud-free optical images is extremely low. Although SAR imagery can provide complementary information for crop classification [55], it may still lead to the misclassification of other crop types as single-cropped rice. Second, field parcel fragmentation has a direct impact on classification accuracy. Given the 10 m resolution of the classification map used in this study, small parcels (e.g., household-managed plots) are subject to severe mixed-pixel effects, making it difficult for the proposed method to classify them accurately. In subtropical hilly and mountainous areas, the shape and size of farmland parcels are strongly constrained by topography, leading to significant fragmentation [56]. Lastly, the use of more data does not necessarily lead to an improved information gain. The potential risk of data redundancy has not been systematically assessed, and the optimal number of input datasets required for achieving the best classification performance has not been quantitatively evaluated. These issues introduce a degree of uncertainty into the study.
Although this study incorporates multi-scale segmentation boundaries to mitigate some of the edge-related errors, it cannot fully address misclassifications caused by spectral confusion. Finally, the complexity of crop types in the study area directly affects the overall classification accuracy [57]. The number of crop types is a key determinant of classification performance: fewer crop types typically yield better classification results. Crop diversity is closely related to the agricultural economy and land-use structure. In the subtropical mountainous regions of China, smallholder farming is prevalent, often leading to a large number of crop types [58]. Accurately distinguishing each of them poses a considerable challenge. In this study area, the major crops include single-cropped rice, double-cropped rice, rapeseed, maize, and various vegetables. Due to the highly fragmented nature of maize and vegetable plots and the irregularity of their planting schedules, the method proposed in this study struggles to accurately identify these crop types.
Future research should focus on the following aspects. First, to address the distortion of optical imagery caused by frequent cloud cover and rainfall in subtropical hilly regions, one potential solution is to incorporate additional data sources such as other SAR datasets, soil type information, and fine-scale land management data. These auxiliary data can help improve the classification accuracy of certain crop types [49].
Second, to mitigate classification errors resulting from farmland fragmentation, a possible approach is to integrate high-resolution imagery for multi-scale segmentation prior to classification, followed by an object-based classification method. However, this approach requires not only a high spatial resolution but also high temporal resolution, which is currently difficult to achieve. With the future deployment of satellite constellations capable of providing frequent high-resolution observations, this strategy is expected to become more feasible.
Third, advancements in computing power have significantly enhanced the application of deep learning in remote sensing, particularly for extracting complex spatial structures and spectral patterns. Architectures such as Convolutional Neural Networks (CNNs), Recurrent Neural Networks (RNNs), and ResNet are well-suited for learning the spatiotemporal dynamics of crop growth and integrating multi-source remote sensing data, thereby improving classifications’ accuracy and robustness [59]. Deep learning thus presents a substantial potential for crop classification. Future research could further explore the use of temporal neural networks in conjunction with time-series satellite imagery to capture crop phenology, enabling the dynamic mapping of crop types and the identification of cropping patterns.
Fourth, the classification framework proposed in this study was designed specifically for crop type and cropping pattern identification in the year 2022. However, its temporal generalizability remains uncertain. The long-term monitoring of crop dynamics is essential for supporting agricultural production and informed policy-making. Future research should therefore focus on evaluating the framework’s transferability across different years and refining its structure to support crop classification over extended time periods.
Finally, a crucial pathway toward the accurate classification of all crop types lies in the identification of key discriminative variables for each crop [60]. Therefore, detailed land-use surveys and crop calendar investigations in the study area are essential components for achieving comprehensive and accurate multi-type crop classifications.
6. Conclusions
This study proposed a crop type and cropping pattern mapping framework in subtropical hilly and mountainous areas. It combined SAR data with various optical datasets (Landsat 8, Landsat 9, Sentinel-2, GF-1, GF-2, and GF-7) and used a random forest (RF) classifier along with multi-scale segmentation techniques, successfully producing maps of major winter and summer crop types. The results show that each type of satellite data has at least one variable selected as an important feature for both winter and summer crop type classifications. SAR data can significantly improve the accuracy of summer crop types. The overall accuracy of both summer and winter crop type mapping exceeded 95%, with clear and relatively accurate cropland boundaries, a small bias in area evaluation using statistical records, and a better performance in terms of spatial distribution compared to three existing products. By combining multi-scale segmentation methods, the salt-and-pepper effect from pixel classification can be effectively mitigated, and crop boundaries can be significantly optimized, which helps achieve a more detailed crop classification. The integration of multi-source data can help solve the issue of an unstable optical image data quality, and it holds great potential for crop type and cropping pattern recognition in subtropical hilly and mountainous regions. Future work should be to explore more source data to find more important variables for small crop types and implement temporal segmentation to improve the crops’ field parcel boundaries.
Author Contributions
Y.C.: Writing—original draft, Visualization, Validation, Software, Methodology, Investigation, Funding acquisition, Formal analysis, Conceptualization. Z.X. (Zhiying Xu): Visualization, Software, Methodology, Writing—review and editing. H.X.: Visualization, Software, Methodology, Writing—review and editing. D.W.: Visualization, Software, Methodology, Writing—review and editing. X.Y.: Visualization, Software, Methodology. Z.X. (Zhihong Xu): Writing—original draft, Supervision, Resources, Methodology, Investigation, Funding acquisition, Conceptualization. All authors have read and agreed to the published version of the manuscript.
Funding
The authors thank the anonymous reviewers for their valuable comments and suggestions. This work is supported by the National Natural Science Foundation of China (grant number 42277450).
Data Availability Statement
The data presented in this study are available on request from the corresponding author.
Conflicts of Interest
The authors declare no conflicts of interest.
References
- Bisht, I.S.; Mehta, P.S.; Negi, K.S.; Verma, S.K.; Tyagi, R.K.; Garkoti, S.C. Farmers’ rights, local food systems, and sustainable household dietary diversification: A case of Uttarakhand Himalaya in north-western India. Agroecol. Sustain. Food Syst. 2018, 42, 77–113. [Google Scholar] [CrossRef]
- Alemu, M.M. Sustainable land management. J. Environ. Prot. 2016, 7, 502–506. [Google Scholar] [CrossRef]
- Zhang, Z.; Zheng, L.; Yu, D. Non-Grain Production of Cultivated Land in Hilly and Mountainous Areas at the Village Scale: A Case Study in Le’an Country, China. Land 2023, 12, 1562. [Google Scholar] [CrossRef]
- Chen, Y.; Lu, D.; Moran, E.; Batistella, M.; Dutra, L.V.; Sanches, I.D.A.; da Silva, R.F.B.; Huang, J.; Luiz, A.J.B.; de Oliveira, M.A.F. Mapping croplands, cropping patterns, and crop types using MODIS time-series data. Int. J. Appl. Earth Obs. 2018, 69, 133–147. [Google Scholar] [CrossRef]
- Song, X.-P.; Huang, W.; Hansen, M.C.; Potapov, P. An evaluation of Landsat, Sentinel-2, Sentinel-1 and MODIS data for crop type mapping. Sci. Remote Sens. 2021, 3, 100018. [Google Scholar] [CrossRef]
- Dash, P.; Sanders, S.L.; Parajuli, P.; Ouyang, Y. Improving the Accuracy of Land Use and Land Cover Classification of Landsat Data in an Agricultural Watershed. Remote Sens. 2023, 15, 4020. [Google Scholar] [CrossRef]
- Schlund, M.; Erasmi, S. Sentinel-1 time series data for monitoring the phenology of winter wheat. Remote Sens. Environ. 2020, 246, 111814. [Google Scholar] [CrossRef]
- Villa, P.; Stroppiana, D.; Fontanelli, G.; Azar, R.; Brivio, P.A. In-Season Mapping of Crop Type with Optical and X-Band SAR Data: A Classification Tree Approach Using Synoptic Seasonal Features. Remote Sens. 2015, 7, 12859–12886. [Google Scholar] [CrossRef]
- Chen, J.; Zhang, Z. An improved fusion of Landsat-7/8, Sentinel-2, and Sentinel-1 data for monitoring alfalfa: Implications for crop remote sensing. Int. J. Appl. Earth Obs. 2023, 124, 103533. [Google Scholar] [CrossRef]
- Qiu, B.; Lin, D.; Chen, C.; Yang, P.; Tang, Z.; Jin, Z.; Ye, Z.; Zhu, X.; Duan, M.; Huang, H.; et al. From cropland to cropped field: A robust algorithm for national-scale mapping by fusing time series of Sentinel-1 and Sentinel-2. Int. J. Appl. Earth Obs. 2022, 113, 103006. [Google Scholar] [CrossRef]
- Demarez, V.; Helen, F.; Marais-Sicre, C.; Baup, F. In-Season Mapping of Irrigated Crops Using Landsat 8 and Sentinel-1 Time Series. Remote Sens. 2019, 11, 118. [Google Scholar] [CrossRef]
- Chakhar, A.; Ortega-Terol, D.; Hernández-López, D.; Ballesteros, R.; Ortega, J.F.; Moreno, M.A. Assessing the Accuracy of Multiple Classification Algorithms for Crop Classification Using Landsat-8 and Sentinel-2 Data. Remote Sens. 2020, 12, 1735. [Google Scholar] [CrossRef]
- Blickensdörfer, L.; Schwieder, M.; Pflugmacher, D.; Nendel, C.; Erasmi, S.; Hostert, P. Mapping of crop types and crop sequences with combined time series of Sentinel-1, Sentinel-2 and Landsat 8 data for Germany. Remote Sens. Environ. 2022, 269, 112831. [Google Scholar] [CrossRef]
- Howard, D.M.; Wylie, B.K.; Tieszen, L.L. Crop classification modelling using remote sensing and environmental data in the Greater Platte River Basin, USA. Int. J. Remote Sens. 2012, 33, 6094–6108. [Google Scholar] [CrossRef]
- Shrestha, D.P.; Zinck, J.A. Land use classification in mountainous areas: Integration of image processing, digital elevation data and field knowledge (application to Nepal). Int. J. Appl. Earth Obs. 2001, 3, 78–85. [Google Scholar] [CrossRef]
- Lebourgeois, V.; Dupuy, S.; Vintrou, É.; Ameline, M.; Butler, S.; Bégué, A. A Combined Random Forest and OBIA Classification Scheme for Mapping Smallholder Agriculture at Different Nomenclature Levels Using Multisource Data (Simulated Sentinel-2 Time Series, VHRS and DEM). Remote Sens. 2017, 9, 259. [Google Scholar] [CrossRef]
- Tian, X.; Chen, Z.; Li, Y.; Bai, Y. Crop Classification in Mountainous Areas Using Object-Oriented Methods and Multi-Source Data: A Case Study of Xishui County, China. Agronomy 2023, 13, 3037. [Google Scholar] [CrossRef]
- Yang, S.; Gu, L.; Li, X.; Jiang, T.; Ren, R. Crop Classification Method Based on Optimal Feature Selection and Hybrid CNN-RF Networks for Multi-Temporal Remote Sensing Imagery. Remote Sens. 2020, 12, 3119. [Google Scholar] [CrossRef]
- Löw, F.; Michel, U.; Dech, S.; Conrad, C. Impact of feature selection on the accuracy and spatial uncertainty of per-field crop classification using Support Vector Machines. ISPRS J. Photogramm. 2013, 85, 102–119. [Google Scholar] [CrossRef]
- Hu, Q.; Sulla-Menashe, D.; Xu, B.; Yin, H.; Tang, H.; Yang, P.; Wu, W. A phenology-based spectral and temporal feature selection method for crop mapping from satellite time series. Int. J. Appl. Earth Obs. 2019, 80, 218–229. [Google Scholar] [CrossRef]
- Qiu, B.; Yu, L.; Yang, P.; Wu, W.; Chen, J.; Zhu, X.; Duan, M. Mapping upland crop–rice cropping systems for targeted sustainable intensification in South China. Crop J. 2024, 12, 614–629. [Google Scholar] [CrossRef]
- Zang, Y.; Qiu, Y.; Chen, X.; Chen, J.; Yang, W.; Liu, Y.; Peng, L.; Shen, M.; Cao, X. Mapping rapeseed in China during 2017-2021 using Sentinel data: An automated approach integrating rule-based sample generation and a one-class classifier (RSG-OC). Gisci. Remote Sens. 2023, 60, 2163576. [Google Scholar] [CrossRef]
- Liu, W.; Li, S.; Tao, J.; Liu, X.; Yin, G.; Xia, Y.; Wang, T.; Zhang, H. CARM30: China annual rapeseed maps at 30 m spatial resolution from 2000 to 2022 using multi-source data. Sci. Data 2024, 11, 356. [Google Scholar] [CrossRef] [PubMed]
- Liu, S.; Wang, L.; Zhang, J. The dataset of main grain land changes in China over 1985–2020. Sci. Data 2024, 11, 1430. [Google Scholar] [CrossRef]
- Shen, R.; Pan, B.; Peng, Q.; Dong, J.; Chen, X.; Zhang, X.; Ye, T.; Huang, J.; Yuan, W. High-resolution distribution maps of single-season rice in China from 2017 to 2022. Earth Syst. Sci. Data 2023, 15, 3203–3222. [Google Scholar] [CrossRef]
- Waldner, F.; Diakogiannis, F.I.; Batchelor, K.; Ciccotosto-Camp, M.; Cooper-Williams, E.; Herrmann, C.; Mata, G.; Toovey, A. Detect, Consolidate, Delineate: Scalable Mapping of Field Boundaries Using Satellite Images. Remote Sens. 2021, 13, 2197. [Google Scholar] [CrossRef]
- Rouse, J.W.; Haas, R.H.; Schell, J.A.; Deering, D.W. Monitoring vegetation systems in the Great Plains with ERTS. NASA Spec. Publ. 1974, 351, 309. [Google Scholar]
- Zha, Y.; Gao, J.; Ni, S. Use of normalized difference built-up index in automatically mapping urban areas from TM imagery. Int. J. Remote Sens. 2003, 24, 583–594. [Google Scholar] [CrossRef]
- Xu, H. Modification of normalised difference water index (NDWI) to enhance open water features in remotely sensed imagery. Int. J. Remote Sens. 2006, 27, 3025–3033. [Google Scholar] [CrossRef]
- Zhong, L.; Gong, P.; Biging, G.S. Efficient corn and soybean mapping with temporal extendability: A multi-year experiment using Landsat imagery. Remote Sens. Environ. 2014, 140, 1–13. [Google Scholar] [CrossRef]
- Zhang, H.; Liu, W.; Zhang, L. Seamless and automated rapeseed mapping for large cloudy regions using time-series optical satellite imagery. ISPRS J. Photogramm. 2022, 184, 45–62. [Google Scholar] [CrossRef]
- Didan, K.; Munoz, A.B.; Solano, R.; Huete, A. MODIS vegetation index user’s guide (MOD13 series). Univ. Ariz. Veg. Index Phenol. Lab 2015, 35, 2–33. [Google Scholar]
- Yang, J.; Hu, Q.; Li, W.; Song, Q.; Cai, Z.; Zhang, X.; Wei, H.; Wu, W. An automated sample generation method by integrating phenology domain optical-SAR features in rice cropping pattern mapping. Remote Sens. Environ. 2024, 314, 114387. [Google Scholar] [CrossRef]
- Zhu, A.X.; Zhao, F.-H.; Pan, H.-B.; Liu, J.-Z. Mapping Rice Paddy Distribution Using Remote Sensing by Coupling Deep Learning with Phenological Characteristics. Remote Sens. 2021, 13, 1360. [Google Scholar] [CrossRef]
- Meng, L.; Li, Y.; Shen, R.; Zheng, Y.; Pan, B.; Yuan, W.; Li, J.; Zhuo, L. Large-scale and high-resolution paddy rice intensity mapping using downscaling and phenology-based algorithms on Google Earth Engine. Int. J. Appl. Earth Obs. 2024, 128, 103725. [Google Scholar] [CrossRef]
- Zhao, Z.; Dong, J.; Zhang, G.; Yang, J.; Liu, R.; Wu, B.; Xiao, X. Improved phenology-based rice mapping algorithm by integrating optical and radar data. Remote Sens. Environ. 2024, 315, 114460. [Google Scholar] [CrossRef]
- Haralick, R.M.; Shanmugam, K.; Dinstein, I. Textural Features for Image Classification. IEEE t. Syst. Man. Cybern. 1973, SMC-3, 610–621. [Google Scholar] [CrossRef]
- Breiman, L. Random Forests. Mach. Learn. 2001, 45, 5–32. [Google Scholar] [CrossRef]
- Huang, Z.; Jing, H.; Liu, Y.; Yang, X.; Wang, Z.; Liu, X.; Gao, K.; Luo, H. Segment Anything Model Combined with Multi-Scale Segmentation for Extracting Complex Cultivated Land Parcels in High-Resolution Remote Sensing Images. Remote Sens. 2024, 16, 3489. [Google Scholar] [CrossRef]
- Foody, G.M. Status of land cover classification accuracy assessment. Remote Sens. Environ. 2002, 80, 185–201. [Google Scholar] [CrossRef]
- Dice, L.R. Measures of the amount of ecologic association between species. Ecology 1945, 26, 297–302. [Google Scholar] [CrossRef]
- Chen, Y.; Zhao, S.; Xie, Z.; Lu, D.; Chen, E. Mapping multiple tree species classes using a hierarchical procedure with optimized node variables and thresholds based on high spatial resolution satellite data. Gisci. Remote Sens. 2020, 57, 526–542. [Google Scholar] [CrossRef]
- Pan, B.; Zheng, Y.; Shen, R.; Ye, T.; Zhao, W.; Dong, J.; Ma, H.; Yuan, W. High Resolution Distribution Dataset of Double-Season Paddy Rice in China. Remote Sens. 2021, 13, 4609. [Google Scholar] [CrossRef]
- Khanal, S.; Kc, K.; Fulton, J.P.; Shearer, S.; Ozkan, E. Remote Sensing in Agriculture—Accomplishments, Limitations, and Opportunities. Remote Sens. 2020, 12, 3783. [Google Scholar] [CrossRef]
- Li, Z.; Shen, H.; Weng, Q.; Zhang, Y.; Dou, P.; Zhang, L. Cloud and cloud shadow detection for optical satellite imagery: Features, algorithms, validation, and prospects. ISPRS J. Photogramm. 2022, 188, 89–108. [Google Scholar] [CrossRef]
- Chen, B.; Huang, B.; Xu, B. Multi-source remotely sensed data fusion for improving land cover classification. ISPRS J. Photogramm. 2017, 124, 27–39. [Google Scholar] [CrossRef]
- Xu, S.; Zhu, X.; Chen, J.; Zhu, X.; Duan, M.; Qiu, B.; Wan, L.; Tan, X.; Xu, Y.N.; Cao, R. A robust index to extract paddy fields in cloudy regions from SAR time series. Remote Sens. Environ. 2023, 285, 113374. [Google Scholar] [CrossRef]
- Wang, X.; Zhang, J.; Xun, L.; Wang, J.; Wu, Z.; Henchiri, M.; Zhang, S.; Zhang, S.; Bai, Y.; Yang, S. Evaluating the effectiveness of machine learning and deep learning models combined time-series satellite data for multiple crop types classification over a large-scale region. Remote Sens. 2022, 14, 2341. [Google Scholar] [CrossRef]
- Mpakairi, K.S.; Dube, T.; Sibanda, M.; Mutanga, O. Fine-scale characterization of irrigated and rainfed croplands at national scale using multi-source data, random forest, and deep learning algorithms. ISPRS J. Photogramm. 2023, 204, 117–130. [Google Scholar] [CrossRef]
- Zhou, X.; Wang, J.; He, Y.; Shan, B. Crop Classification and Representative Crop Rotation Identifying Using Statistical Features of Time-Series Sentinel-1 GRD Data. Remote Sens. 2022, 14, 5116. [Google Scholar] [CrossRef]
- Fei, H.; Fan, Z.; Wang, C.; Zhang, N.; Wang, T.; Chen, R.; Bai, T. Cotton Classification Method at the County Scale Based on Multi-Features and Random Forest Feature Selection Algorithm and Classifier. Remote Sens. 2022, 14, 829. [Google Scholar] [CrossRef]
- Li, H.; Song, X.-P.; Hansen, M.C.; Becker-Reshef, I.; Adusei, B.; Pickering, J.; Wang, L.; Wang, L.; Lin, Z.; Zalles, V.; et al. Development of a 10-m resolution maize and soybean map over China: Matching satellite-based crop classification with sample-based area estimation. Remote Sens. Environ. 2023, 294, 113623. [Google Scholar] [CrossRef]
- Chen, Y.; Li, X.; Liu, X.; Ai, B. Analyzing land-cover change and corresponding impacts on carbon budget in a fast developing sub-tropical region by integrating MODIS and Landsat TM/ETM+ images. Appl. Geogr. 2013, 45, 10–21. [Google Scholar] [CrossRef]
- Yin, Z.; Song, X.; Zhou, B.; Jiang, W.; Chen, H.; Wang, H. Traditional Meiyu–Baiu has been suspended by global warming. Natl. Sci. Rev. 2024, 11, nwae166. [Google Scholar] [CrossRef] [PubMed]
- Wang, Y.; Fang, S.; Zhao, L.; Huang, X.; Jiang, X. Parcel-based summer maize mapping and phenology estimation combined using Sentinel-2 and time series Sentinel-1 data. Int. J. Appl. Earth Obs. 2022, 108, 102720. [Google Scholar] [CrossRef]
- Yu, Z.; Kuang, L.; Jiang, Y.; Li, W.; Zhang, J.; Zhou, Y.; Guo, X.; Ye, Y. Soil attributes are more important than others in shaping the diversity of cultivated land quality types, southern China. Ecol. Indic. 2024, 166, 112472. [Google Scholar] [CrossRef]
- Mahlayeye, M.; Darvishzadeh, R.; Nelson, A. Cropping Patterns of Annual Crops: A Remote Sensing Review. Remote Sens. 2022, 14, 2404. [Google Scholar] [CrossRef]
- Cui, Z.; Zhang, H.; Chen, X.; Zhang, C.; Ma, W.; Huang, C.; Zhang, W.; Mi, G.; Miao, Y.; Li, X.; et al. Pursuing sustainable productivity with millions of smallholder farmers. Nature 2018, 555, 363–366. [Google Scholar] [CrossRef]
- Attri, I.; Awasthi, L.K.; Sharma, T.P.; Rathee, P. A review of deep learning techniques used in agriculture. Ecol. Inform. 2023, 77, 102217. [Google Scholar] [CrossRef]
- Aduvukha, G.R.; Abdel-Rahman, E.M.; Sichangi, A.W.; Makokha, G.O.; Landmann, T.; Mudereri, B.T.; Tonnang, H.E.Z.; Dubois, T. Cropping Pattern Mapping in an Agro-Natural Heterogeneous Landscape Using Sentinel-2 and Sentinel-1 Satellite Datasets. Agriculture 2021, 11, 530. [Google Scholar] [CrossRef]
Disclaimer/Publisher’s Note: The statements, opinions and data contained in all publications are solely those of the individual author(s) and contributor(s) and not of MDPI and/or the editor(s). MDPI and/or the editor(s) disclaim responsibility for any injury to people or property resulting from any ideas, methods, instructions or products referred to in the content. |
© 2025 by the authors. Licensee MDPI, Basel, Switzerland. This article is an open access article distributed under the terms and conditions of the Creative Commons Attribution (CC BY) license (https://creativecommons.org/licenses/by/4.0/).