Article

Investigating the Mechanisms of Hyperspectral Remote Sensing for Belowground Yield Traits in Potato Plants

1
Carbon-Water Research Station in Karst Regions of Northern, Guangdong Provincial Key Laboratory of Urbanization and Geo-simulation, School of Geography and Planning, Sun Yat-Sen University, Guangzhou 510275, China
2
Huizhou Institute of Agricultural Science, Huizhou 516023, China
3
Key Laboratory of Plant Nutrition and Fertilizer in South Region, Ministry of Agriculture and Rural Affairs, Guangdong Key Laboratory of Nutrient Cycling and Farmland Conservation, National Agricultural Experimental Station for Soil Quality, Guangzhou, Institute of agricultural resources and environment, Guangdong Academy of Agricultural Sciences, Guangzhou 510640, China
*
Author to whom correspondence should be addressed.
These authors contributed equally to this work.
Remote Sens. 2025, 17(12), 2097; https://doi.org/10.3390/rs17122097
Submission received: 26 April 2025 / Revised: 11 June 2025 / Accepted: 13 June 2025 / Published: 19 June 2025

Abstract

:
Potatoes, as the world’s fourth-largest staple crop, are vital for global food security. Efficient methods for assessing yield and quality are essential for policy-making and optimizing production. Traditional yield assessment techniques remain destructive, labor-intensive, and unsuitable for large-scale monitoring. While remote sensing has offered a promising alternative, current approaches largely depend on empirical correlations rather than physiological mechanisms. This limitation arises because potato tubers grow underground, rendering their traits invisible to aboveground sensors. This study investigated the mechanisms underlying hyperspectral remote sensing for assessing belowground yield traits in potatoes. Field experiments with four cultivars and five nitrogen treatments were conducted to collect foliar biochemistries (chlorophyll, nitrogen, and water and dry matter content), yield traits (tuber yield, fresh/dry weight, starch, protein, and water content), and leaf spectra. Two approaches were developed for predicting belowground yield traits: (1) a direct method linking leaf spectra to yield via statistical models and (2) an indirect method using structural equation modeling (SEM) to link foliar biochemistry to yield. The SEM analysis revealed that foliar nitrogen exhibited negative effects on tuber fresh weight (path coefficient b = −0.57), yield (−0.37), and starch content (−0.30). Similarly, leaf water content negatively influenced tuber water content (0.52), protein (−0.27), and dry weight (−0.42). Conversely, chlorophyll content showed positive associations with both tuber protein (0.59) and dry weight (0.56). Direct models (PLSR, SVR, and RFR) achieved higher accuracy for yield (R2 = 0.58–0.84) than indirect approaches (R2 = 0.16–0.45), though the latter provided physiological insights. The reduced accuracy in indirect methods primarily stemmed from error propagation within the SEM framework. Future research should scale these leaf-level mechanisms to canopy observations and integrate crop growth models to improve robustness across environments. This work advances precision agriculture by clarifying spectral–yield linkages in potato systems, offering a framework for hyperspectral-based yield prediction.

1. Introduction

Potatoes (Solanum tuberosum) are the world’s fourth-largest staple food crop and play an indispensable role in the human diet due to their rich nutritional profile [1]. As global population growth drives increased demand for staple foods, enhancing crop production has become a priority. Accurately assessing crop yield and quality is important for addressing food security, supporting agricultural policy-making, and enabling timely responses to food shortages. These assessments bridge scientific understanding with societal needs, ensuring sustainable food production to meet global demands [2]. Traditional survey of potato yield and quality mainly relies on field sampling of physical traits such as tuber weight, tuber size, starch content, and dry matter for potatoes [3,4]. However, these methods are laborious and time-consuming, making them inefficient for large-scale or real-time assessments.
Remote sensing enables large-scale, non-destructive, and cost-effective monitoring of crop yield and quality with high temporal resolution. Most current studies focus on directly establishing statistical relationships between spectral data and crop yield or quality, a method referred to as “direct inversion” [5,6,7,8,9,10,11,12,13,14,15,16,17,18]. For instance, Bala and Islam (2009) [6] developed a linear regression model linking potato tuber yield to the MODIS-derived normalized difference vegetation index (NDVI), achieving an average validation error of 15%. To utilize a broader range of spectral information, some studies have employed partial least squares regression (PLSR) to correlate tuber yield with hyperspectral reflectance [5,12,13]. For example, Liu et al. [5] examined the performance of three spectral regions—VNIR (i.e., 400–1300 nm), SWIR (i.e., 1300–2500 nm), and full-spectrum (i.e., 400–2500 nm)—for potato tuber yield estimation using PLSR. Their findings revealed that full-spectrum models provided the highest accuracy, with VNIR and SWIR spectrum models performing comparably. Guan et al. [14] expanded the scope by integrating remote sensing data from visible to microwave spectral ranges and applying PLSR to estimate maize yield in the American Corn Belt, significantly enhancing monitoring capabilities for both crop growth and yield.
To address the nonlinear relationships between spectra and crop yield traits, nonlinear approaches have been increasingly utilized, including random forest regression (RFR) [8,15], k-nearest neighbor (k-NN) [7], support vector machines (SVMs) [7,11,15], ridge regression [15], and artificial neural networks (ANNs) [16,18]. In one study, Sagan et al. [18] demonstrated that deep learning models could predict soybean yields at the field scale using spectral indices and textures obtained from high-resolution satellite data. Ebrahimy et al. [17] utilized synthetic data derived from multi-source satellite data, including MODIS, Sentinel-1, and Sentinel-2, along with climate variables, for predicting potato yield with deep neural networks at the county level. Although these methods demonstrated a better prediction accuracy than linear regression models, a large sample size is generally required to overcome the overfitting problem.
Recent advances in tuber crop yield demonstrate methodological progress while revealing persistent limitations in physiological interpretation. Tedesco et al. combined RFR and k-NN model approaches, incorporating the Green NDVI and SAVI for sweet potato yield prediction (Mean Absolute Error, MAE = 2.66–3.45 t·ha−1), though the framework remains fundamentally empirical without mechanistic foundations [19]. Similarly, Rattanasopa et al. established strong correlations between cassava yield and canopy structural parameters (i.e., canopy height and crown area) (R2 = 0.87), while Njane et al. reported exceptionally high correlations (R2 = 0.96–0.99) between potato yield and vegetation metrics derived from drone-based canopy height models (CHMs) and spectral reflectance. While statistically robust, these vegetation proxies exhibit strong crop- and environment-specific dependencies that constrain their broader applicability [20,21]. More sophisticated machine learning approaches, such as gradient boosting regression and deep neural networks (DNNs), outperformed SVMs and RF in accuracy, while providing limited insight into underlying physiological processes [22,23]. Singh enhanced yield prediction using ensemble methods like XGBoost and random forest, with the latter excelling in feature selection and accuracy [24].
Complementing these data-driven approaches, recent studies have investigated the capability of process-based models to predict yield traits. For example, Wellens achieved excellent agreement (R2 = 0.94, RMSE = 2.37 t DM·ha−1) when validating the AquaCrop model for cassava tuber growth after careful calibration [25]. Fan developed a novel semi-physical hierarchical linear model (HLM) incorporating key environmental drivers (solar radiation, temperature, and soil moisture) to simultaneously predict tuber growth (R2 = 0.57) and starch accumulation (R2 = 0.60), with the NRMSE consistently below 25% [26]. In comparative studies, Wang demonstrated AquaCrop’s superior performance over DSSAT-SUBSTOR for both dry (NRMSE ≤ 12.21%) and fresh yield (NRMSE ≤ 12.02%) prediction under varied irrigation regimes [27]. Similarly, Li’s validation of the APSIM potato model showed robust simulation of total dry matter (RRMSE = 26%) and fresh yield (RRMSE = 22.5%) across diverse growing conditions [28].
Recently, the indirect inversion approach has been proposed to estimate vegetation parameters that are otherwise inaccessible to direct observation by sensors [29,30,31,32]. Indirect inversion generally involves two steps: (1) using spectra to estimate leaf components with distinct absorptions, including leaf chlorophyll, equivalent water thickness (EWT), and leaf mass per area (LMA); (2) linking these leaf components to parameters that sensors cannot directly observe, such as photosynthesis traits. For instance, Lopatin et al. (2019) employed structural equation modeling (SEM) to establish ecological relationships between remotely sensed vegetation characteristics—including biomass, plant height, and plant compositions—and subsurface carbon stocks that cannot be directly detected by remote sensors [33]. Dechant [30] demonstrated that Vcmax and Jmax can be inferred through their strong biochemical relationships with leaf nitrogen content, which itself can be estimated from spectral reflectance. This approach leverages the fact that nitrogen is a fundamental component of photosynthetic enzymes, including Rubisco, which drives Vcmax, and proteins associated with the electron transport chain, which influences Jmax. These studies have demonstrated that indirect inversion generally achieves higher prediction accuracy than direct inversion and better capability to explore the mechanism underlying the remote sensing retrieval of vegetation parameters inaccessible to direct observation by sensors. Despite its potential, indirect inversion has not yet been applied to predict potato yield traits.
Current approaches to remote sensing of crop yield remain largely empirical, with limited integration of physiological mechanisms. Our study addresses this limitation by (1) implementing the first indirect inversion framework for potato yield prediction; (2) developing a flexible estimation approach that accommodates varying data scenarios while accounting for physiological constraints; and (3) employing structural equation modeling to quantify the pathways connecting leaf traits to yield traits. The overall objective of this research is to investigate the mechanisms underlying the hyperspectral remote sensing retrieval of potato yield traits. Specifically, we aim to (1) analyze the effects of nitrogen application and cultivar selection on potato vegetation attributes, including both aboveground foliar traits and belowground yield traits, and (2) compare the direct and indirect methods for estimating potato yield traits.

2. Field Experiment and Data Collection

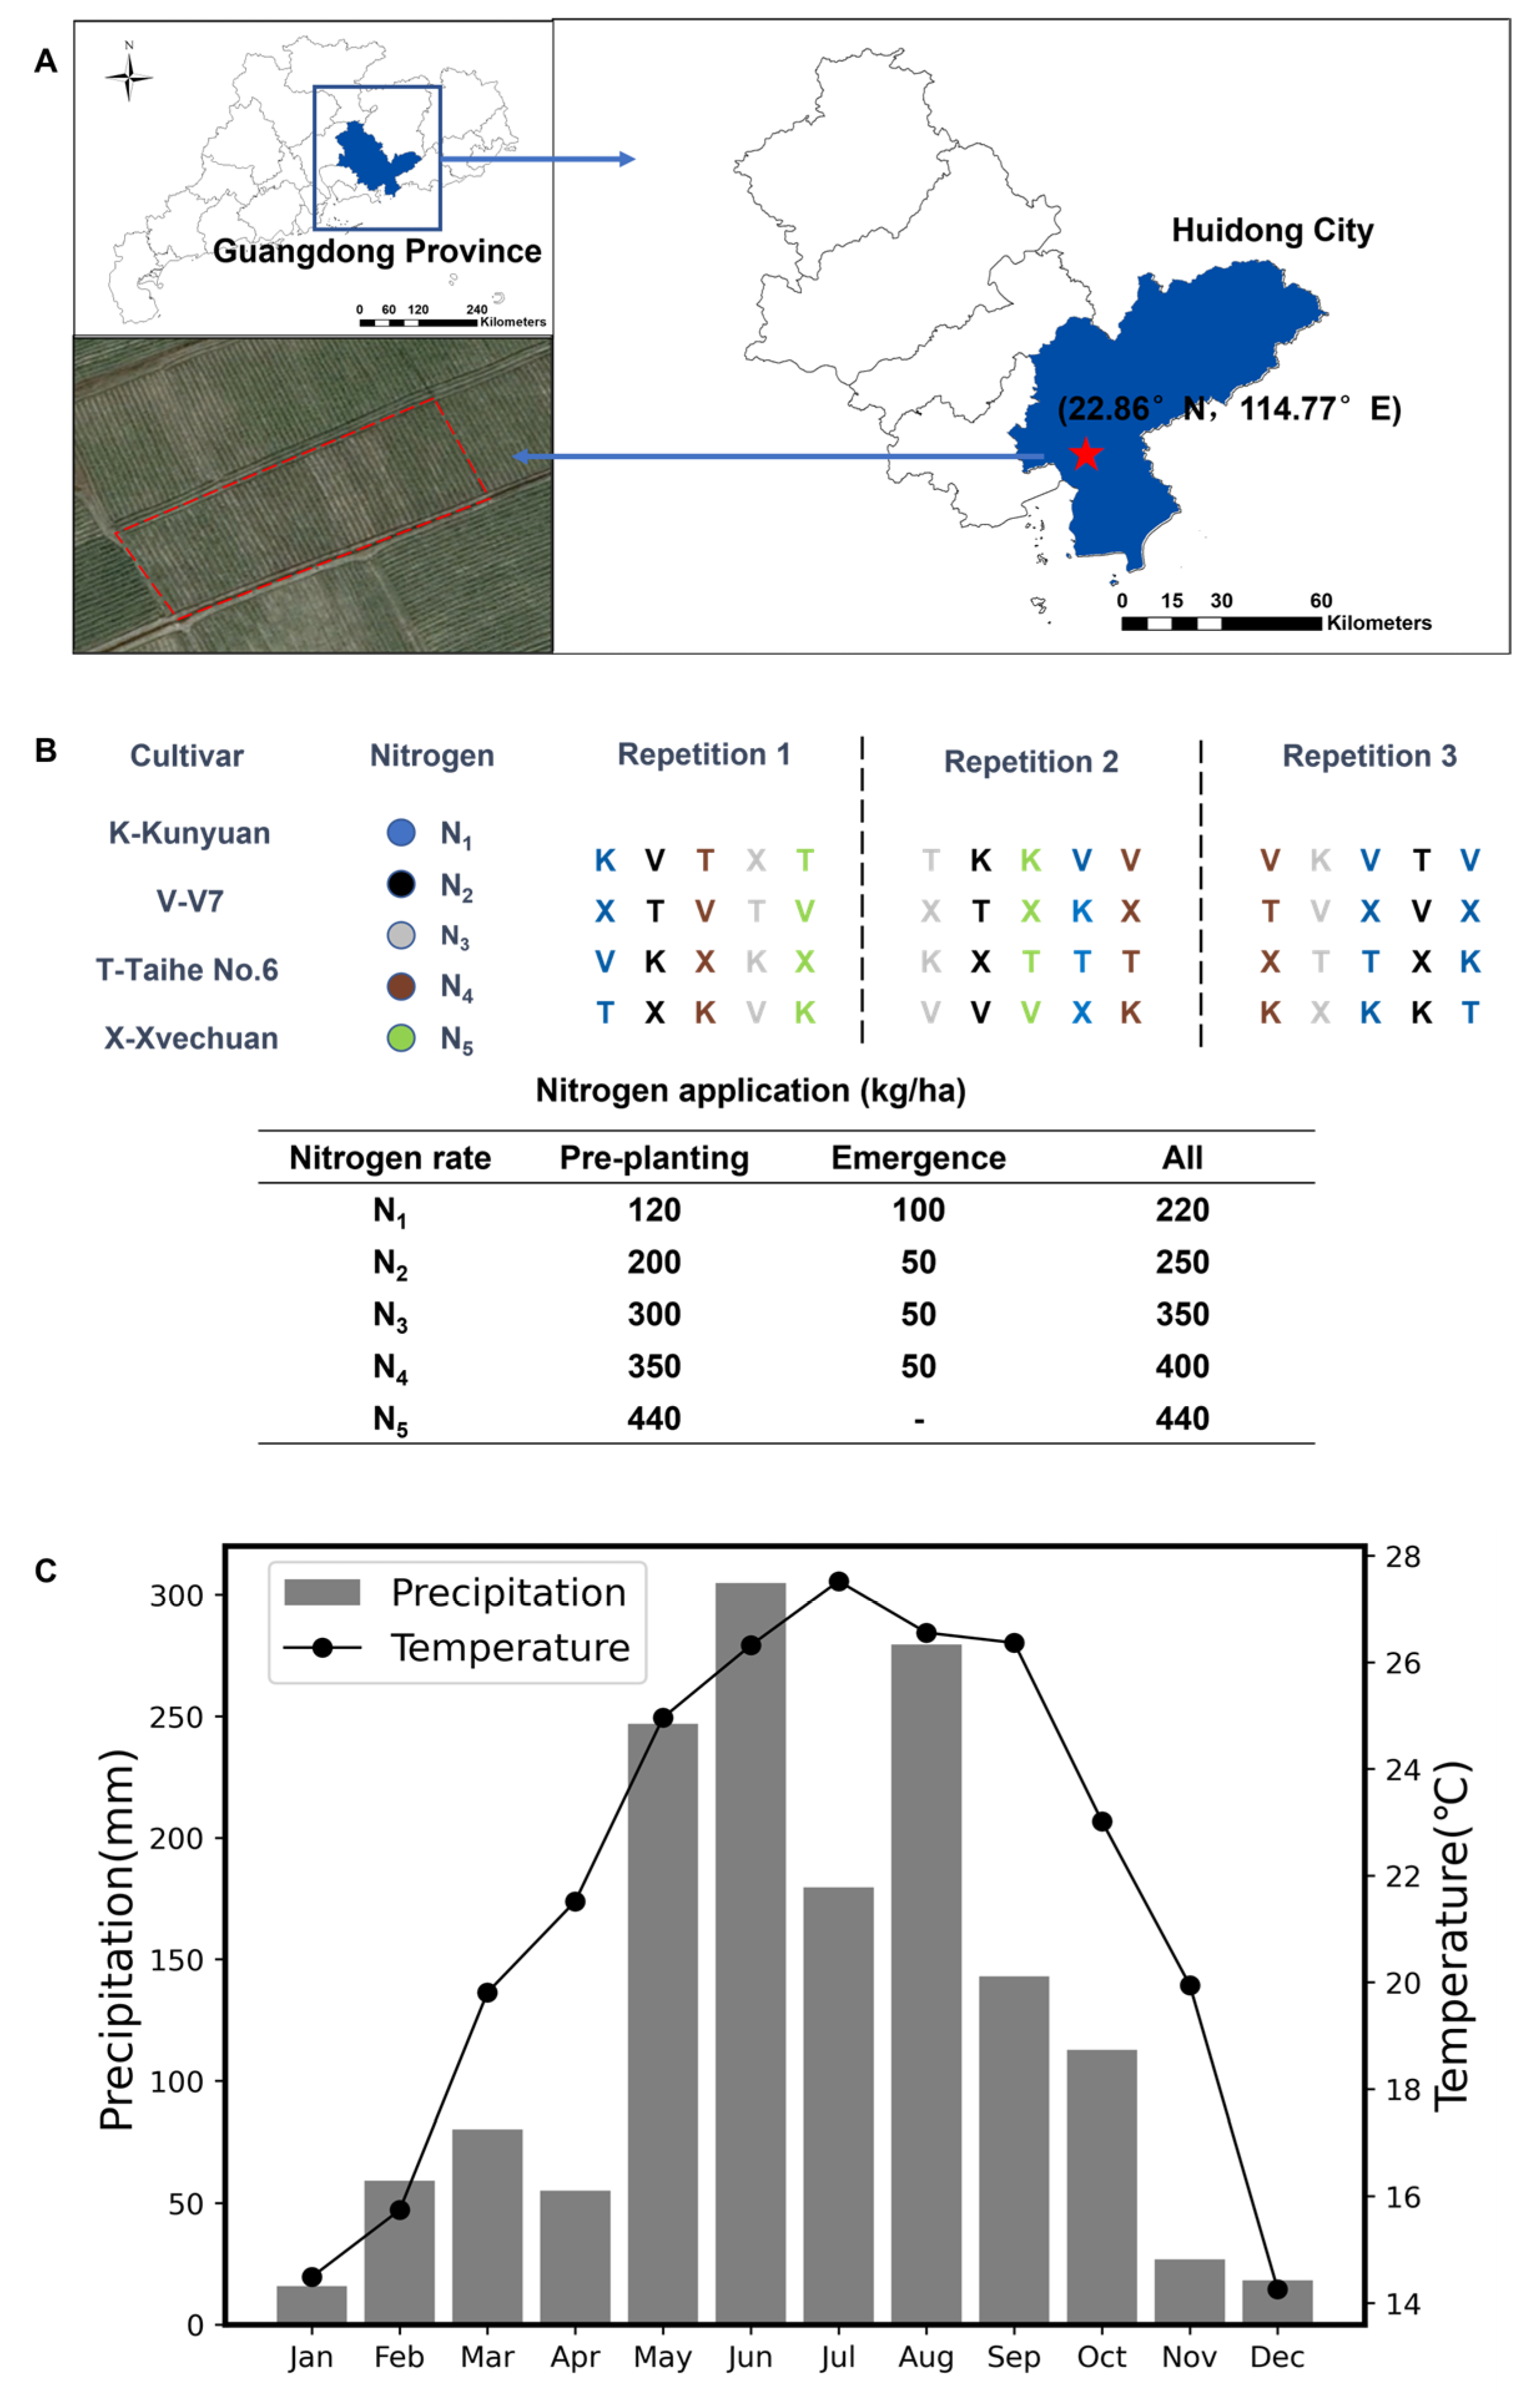
2.1. Field Experiment

Field experiments were conducted from November 2023 to April 2024 in Laokeng Village (114.77° E, 22.86° N, Figure 1A), Huidong County, Huizhou, Guangdong, China. This region is located in the eastern part of Huizhou City and experiences a subtropical monsoon climate. The climate is characterized by abundant solar radiation, moderate rainfall, and mild winter temperatures. These conditions provide optimal growing environments for winter potato cultivation. During the winter planting period, average temperatures were approximately 17 °C, with a total precipitation of 20 mm (Figure 1C). The local soil is primarily red soil, featuring high clay content and rich nutrient availability.
The study was conducted in 60 experimental plots with three replications, focusing on four potato varieties: Kunyuan, Taihe No. 6, V7, and Xuechuan. Each plot was assigned one of the five nitrogen applications: 220, 250, 350, 400, and 440 kg·ha−1·N (N1–5, Figure 1B). To reduce edge effects, protected rows at least 2 m wide were established at both ends of the sample area, and a 1 m wide isolation buffer strip was retained between the different treatment zones. Other agronomic practices, including weed control and irrigation, were maintained according to local potato production guidelines.

2.2. Data Collection

We collected three categories of datasets: (1) aboveground foliar biochemistries, including leaf chlorophyll-a and -b content, nitrogen content, EWT, and LMA (Table 1A); (2) belowground yield traits, including total yield per plant, fresh and dry weights per tuber, number of tubers, tuber water, sugar, and protein and starch contents (Table 1B); and (3) leaf spectra.
Foliar samples were collected from 10 representative plants per plot. Spectral reflectance was measured with an SVC HR-1024i spectroradiometer (400–2500 nm range at 1 nm intervals) configured with a leaf clip, reflectance probe, and external light source (2 sec integration). To minimize spectral noise caused by environmental variability, measurements were conducted under stable irradiance conditions (10:00–14:00 local time). A spectratron white panel reference calibration was performed prior to collecting leaf reflectance for each plot. For each plot, 20 reflectance spectra were collected from 10 representative plants (2 spectra per plant), targeting the third fully expanded leaf from the top of the plant to minimize positional bias. Leaf surfaces were gently cleaned with lint-free wipes to remove dust, and midribs were avoided to minimize specular reflectance. The spectra were averaged to derive the representative leaf spectra for each plot. During the spectra measurement process, we ensured the consistency of controlled illumination and incident angle.
Five foliar samples were frozen in liquid nitrogen and later spectrophotometric quantification of chlorophyll-a and -b (Cab, in mg·cm−2) concentration using Youke UV2356 chromatography (UNICO Instrument CO., LTD., Shanghai, China). The remaining foliar samples were stored in a refrigerator to prevent degradation and subsequently processed for biophysical trait analysis: (1) fresh weight (FW, in g) measured to 0.0001 g precision using a digital scale; (2) leaf area (A, in cm2) determined via a high-resolution flatbed scanning (600 dpi); (3) dry leaf weight (DW, in g) determined after being oven-drying at 65 °C to constant mass; (4) EWT (in g·m−2) and LMA (in g·m−2) calculated as FW-DW)/A and DW/A, respectively; (5) nitrogen content (Nleaf, in g·kg−1) determined via the Kjeldahl method.
Tuber samples were harvested from three plants in each plot. The total yield (Yield, in kg) was determined using a digital scale with a precision of 1 g. The fresh weight per tuber (FWtuber, in g) was determined as Yield/Count. Then, tuber samples were diced into 5 mm cubes, thoroughly mixed, and a 20 g subsample was randomly selected for component analysis. Starch content (Starchtuber, in g·kg−1) was quantified using the anthrone colorimetric method. Protein content (Proteintuber, in g·kg−1) was determined using a Coomassie UV spectrophotometer. Another 20 g of tuber cubes were dried to constant mass, allowing for the calculation of tuber dry matter (DMtuber, in %) and water content (Watertuber, in %).

3. Methods

Two inversion approaches, direct and indirect, were investigated for predicting belowground yield traits from leaf spectra (Figure 2). The direct inversion approach established a straightforward relationship between belowground yield traits and leaf spectra through statistical modeling. In contrast, the indirect inversion method employed a two-step process: (1) key foliar traits—such as leaf chlorophyll, water, dry matter and nitrogen contents—were estimated from leaf spectra (“Direct inversion” in Figure 2); (2) these foliar traits were associated with belowground yield traits using a structural equation model (SEM) (“Indirect inversion” in Figure 2).

3.1. The Direct Inversion Approach

For the direct inversion, we constructed three statistical models—PLSR, SVR, and RFR—to establish relationships between yield traits and leaf spectra. The raw dataset was partitioned into calibration and validation subsets in a 3:1 ratio. Model parameters were optimized via a 4-fold cross-validation with 25 repeats applied to the calibration data (Table 2). This process generated 100 prediction models for each statistical approach. These models were then evaluated on the validation dataset, with the final prediction for each data point derived by averaging the predictions from the 100 models.

3.2. The Indirect Inversion Approach

PLSR, SVR, and RFR models were developed to establish relationships between foliar biochemistries and leaf spectra. Following the methodology outlined in Section 3.1, a k-fold cross-validation with 25 repeats was used for model calibration. This process resulted in 100 prediction models for each statistical approach. These models were then evaluated on the validation dataset, with the final prediction for each data point derived by averaging the outputs from the 100 models.
The relationships between aboveground foliar biochemistries and belowground yield traits were built using structural equation modeling (SEM). SEM was chosen for its capacity to (1) quantify relationship networks among dependent and independent variables, and (2) capture both direct and indirect pathways.
The initial model was constructed based on established principles of plant physiology (Figure 3). The model incorporated observable aboveground vegetation parameters (Nitrogenleaf, Chlorophyllab, EWT, LMA, and LAI) and belowground yield traits (Watertuber, DMtuber, Starchtuber, Proteintuber, FWtuber, DWtuber, Yield, and Count). It specified several physiological relationships: foliar dry matter content (LMA) directly influences tuber dry weight (DWtuber) and protein content (Proteintuber); leaf nitrogen content (Nitrogenleaf) affects protein accumulation (Proteintuber) and starch synthesis (Starchtuber); foliar water content (EWT) was hypothesized to regulate tuber water content (Watertuber); foliar chlorophyll content (Chlorophyllab) affected tuber yield (Yield) and fresh weight (FWtuber). Additionally, tuber yield traits were assumed to be intercorrelated, including tuber dry matter content (DMtuber)—tuber dry weight (DWtuber); tuber water content (Watertuber)—tuber fresh weight (FWtuber); and tuber dry weight (DWtuber)—fresh weight (FWtuber).
The SEM framework, implemented using the Lavaan package in R (https://cran.r-project.org/web/packages/lavaan/index.html, accessed on 1 June 2024), integrates both direct and indirect effects across variables through path coefficients and covariance matrices, enabling multi-level predictions of dependent variables such as tuber yield and dry weight. A core advantage of this approach lies in its ability to disentangle complex, hierarchical causal relationships that traditional regression models cannot capture, particularly when accounting for indirect pathways. Iterative adjustments were made by adding or removing causal pathways and fine-tuning parameters to achieve an acceptable goodness-of-fit. Finally, foliar traits predicted from leaf spectra were input into the SEM to predict yield traits.

3.3. Model Evaluation

Model performance was evaluated with three statistical metrics, including the coefficient of determination (R2), root mean square error (RMSE), and normalized RMSE (NRMSE):
R 2 = 1 i = 1 n y i y ^ i 2 i = 1 n y i y ¯ 2
R M S E = 1 n i = 1 n y i y ^ i 2
N R M S E = R M S E y ¯ × 100 %
where n is the sample size; y i is the yield trait measurement of the i-th sample; y ^ i is the predicted yield trait of the i-th sample; and y ¯ is the mean of the measurements.

4. Results

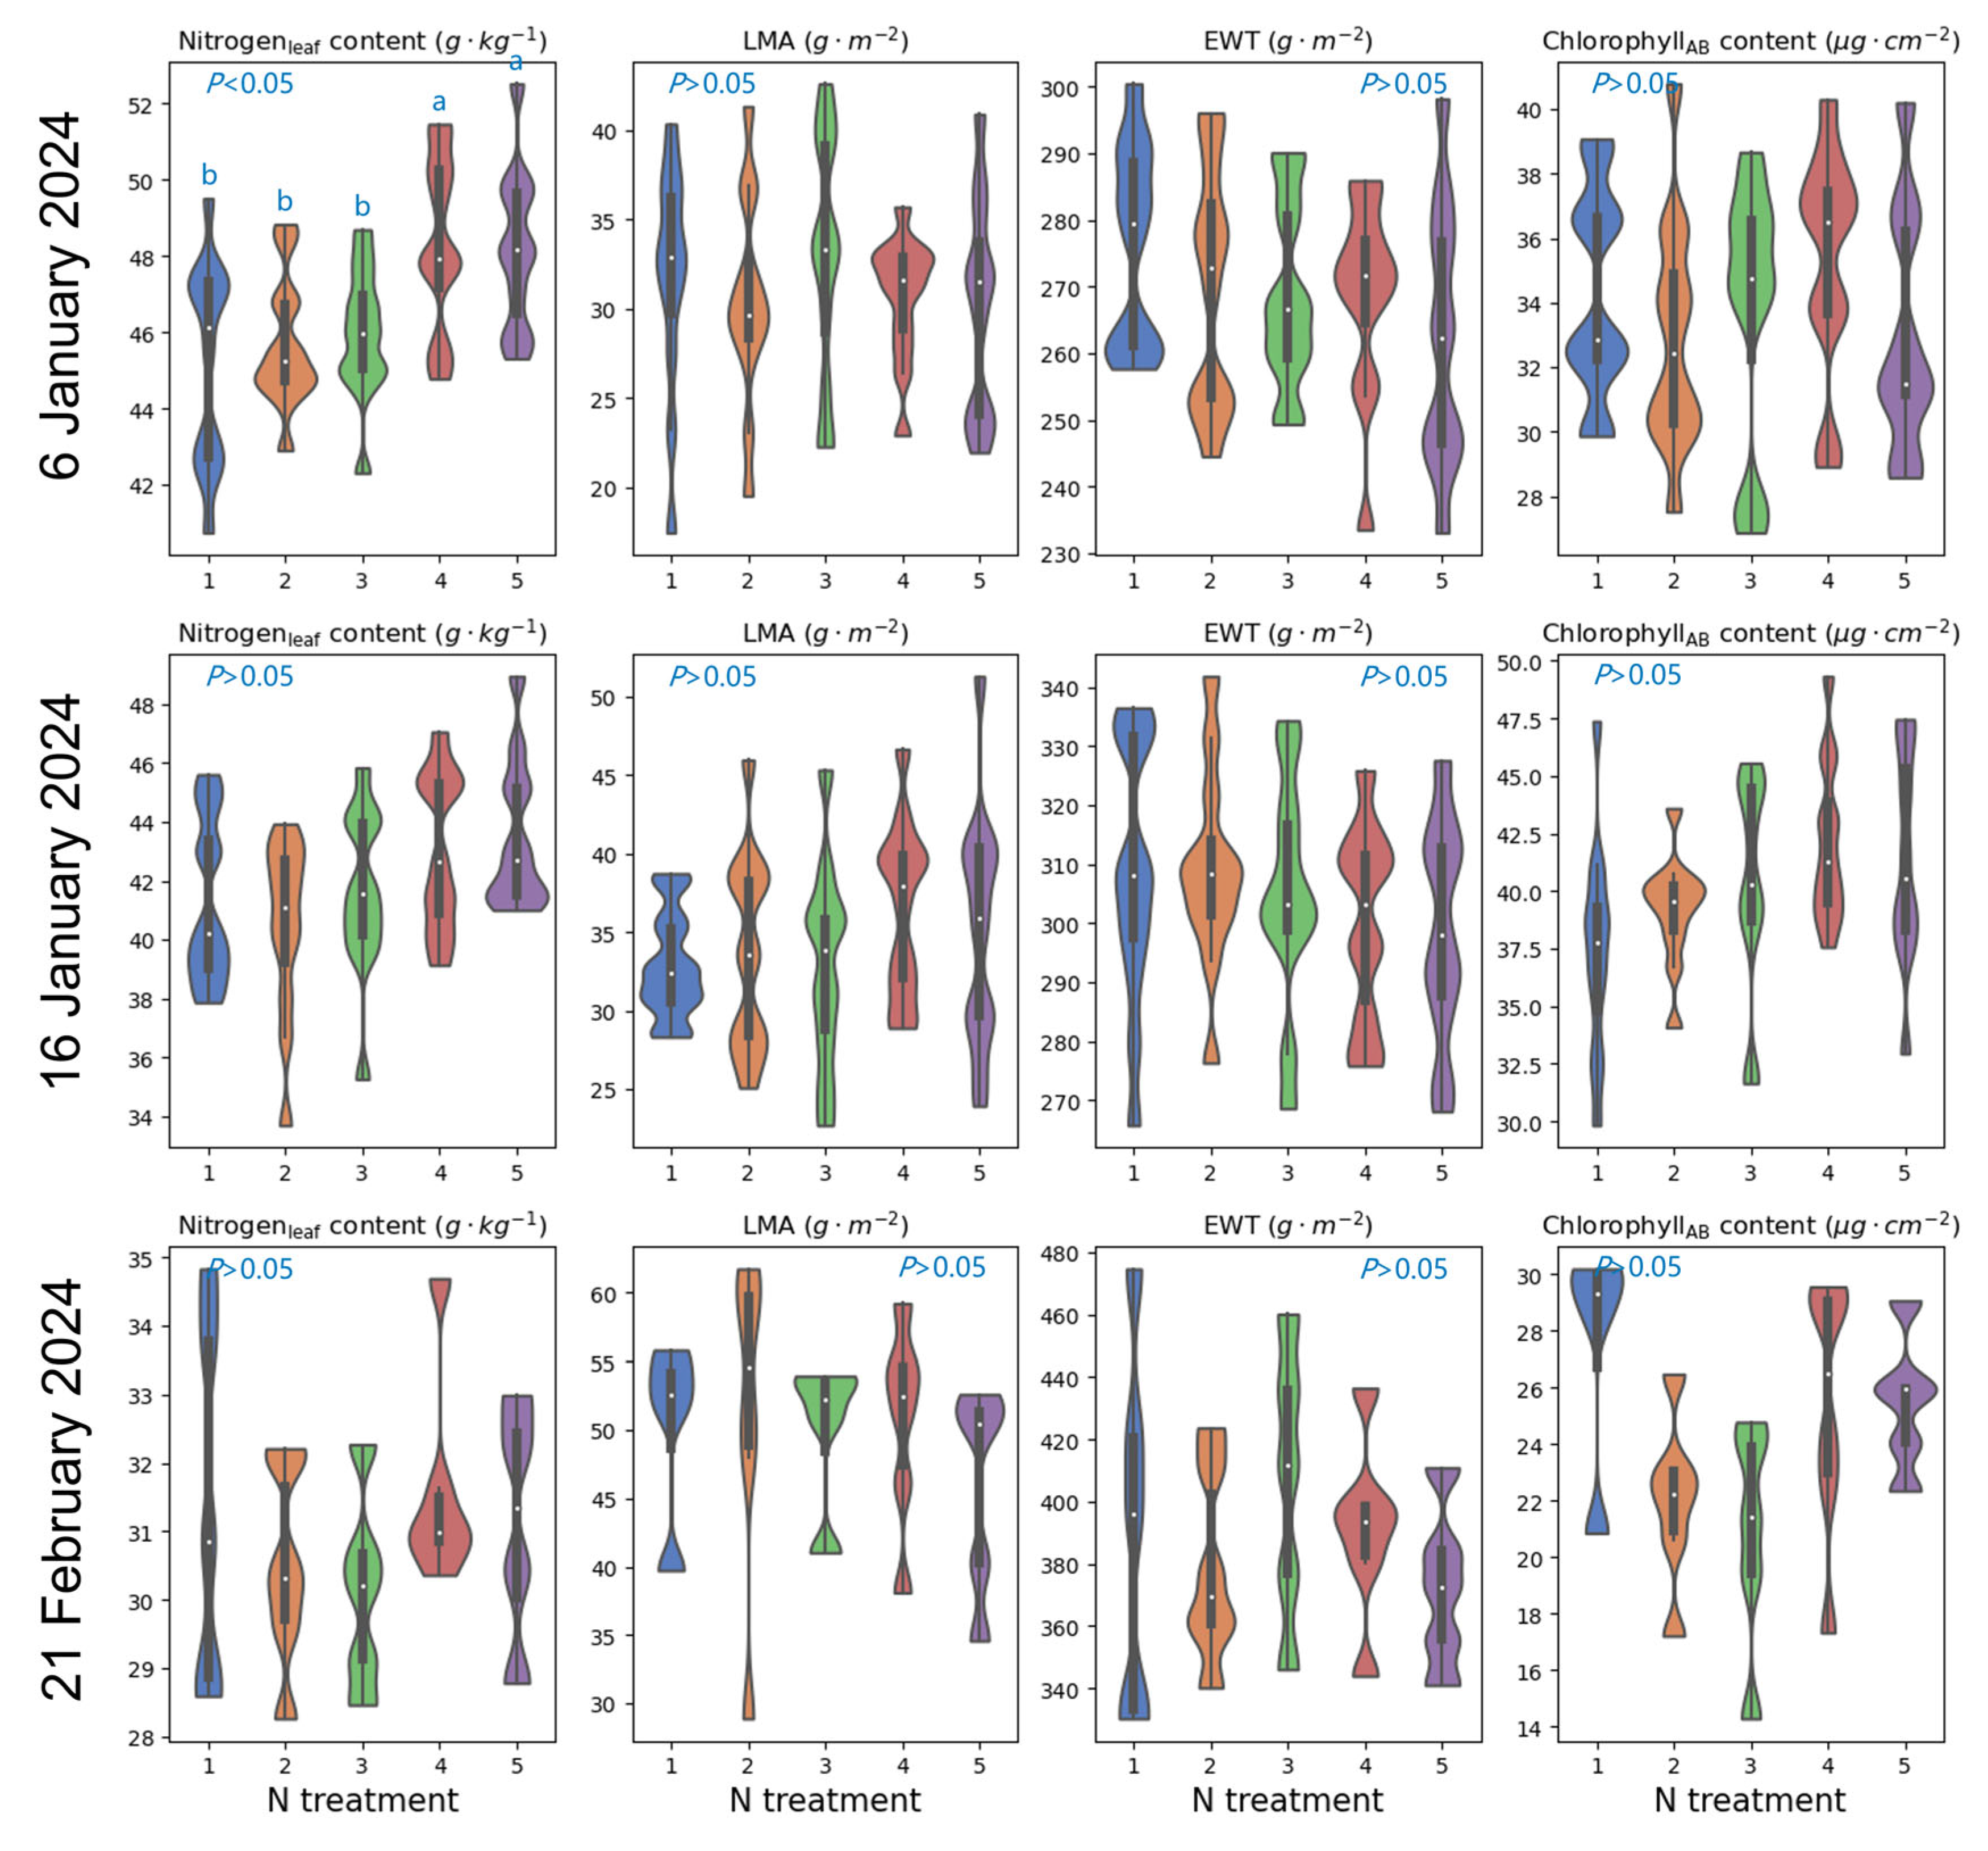
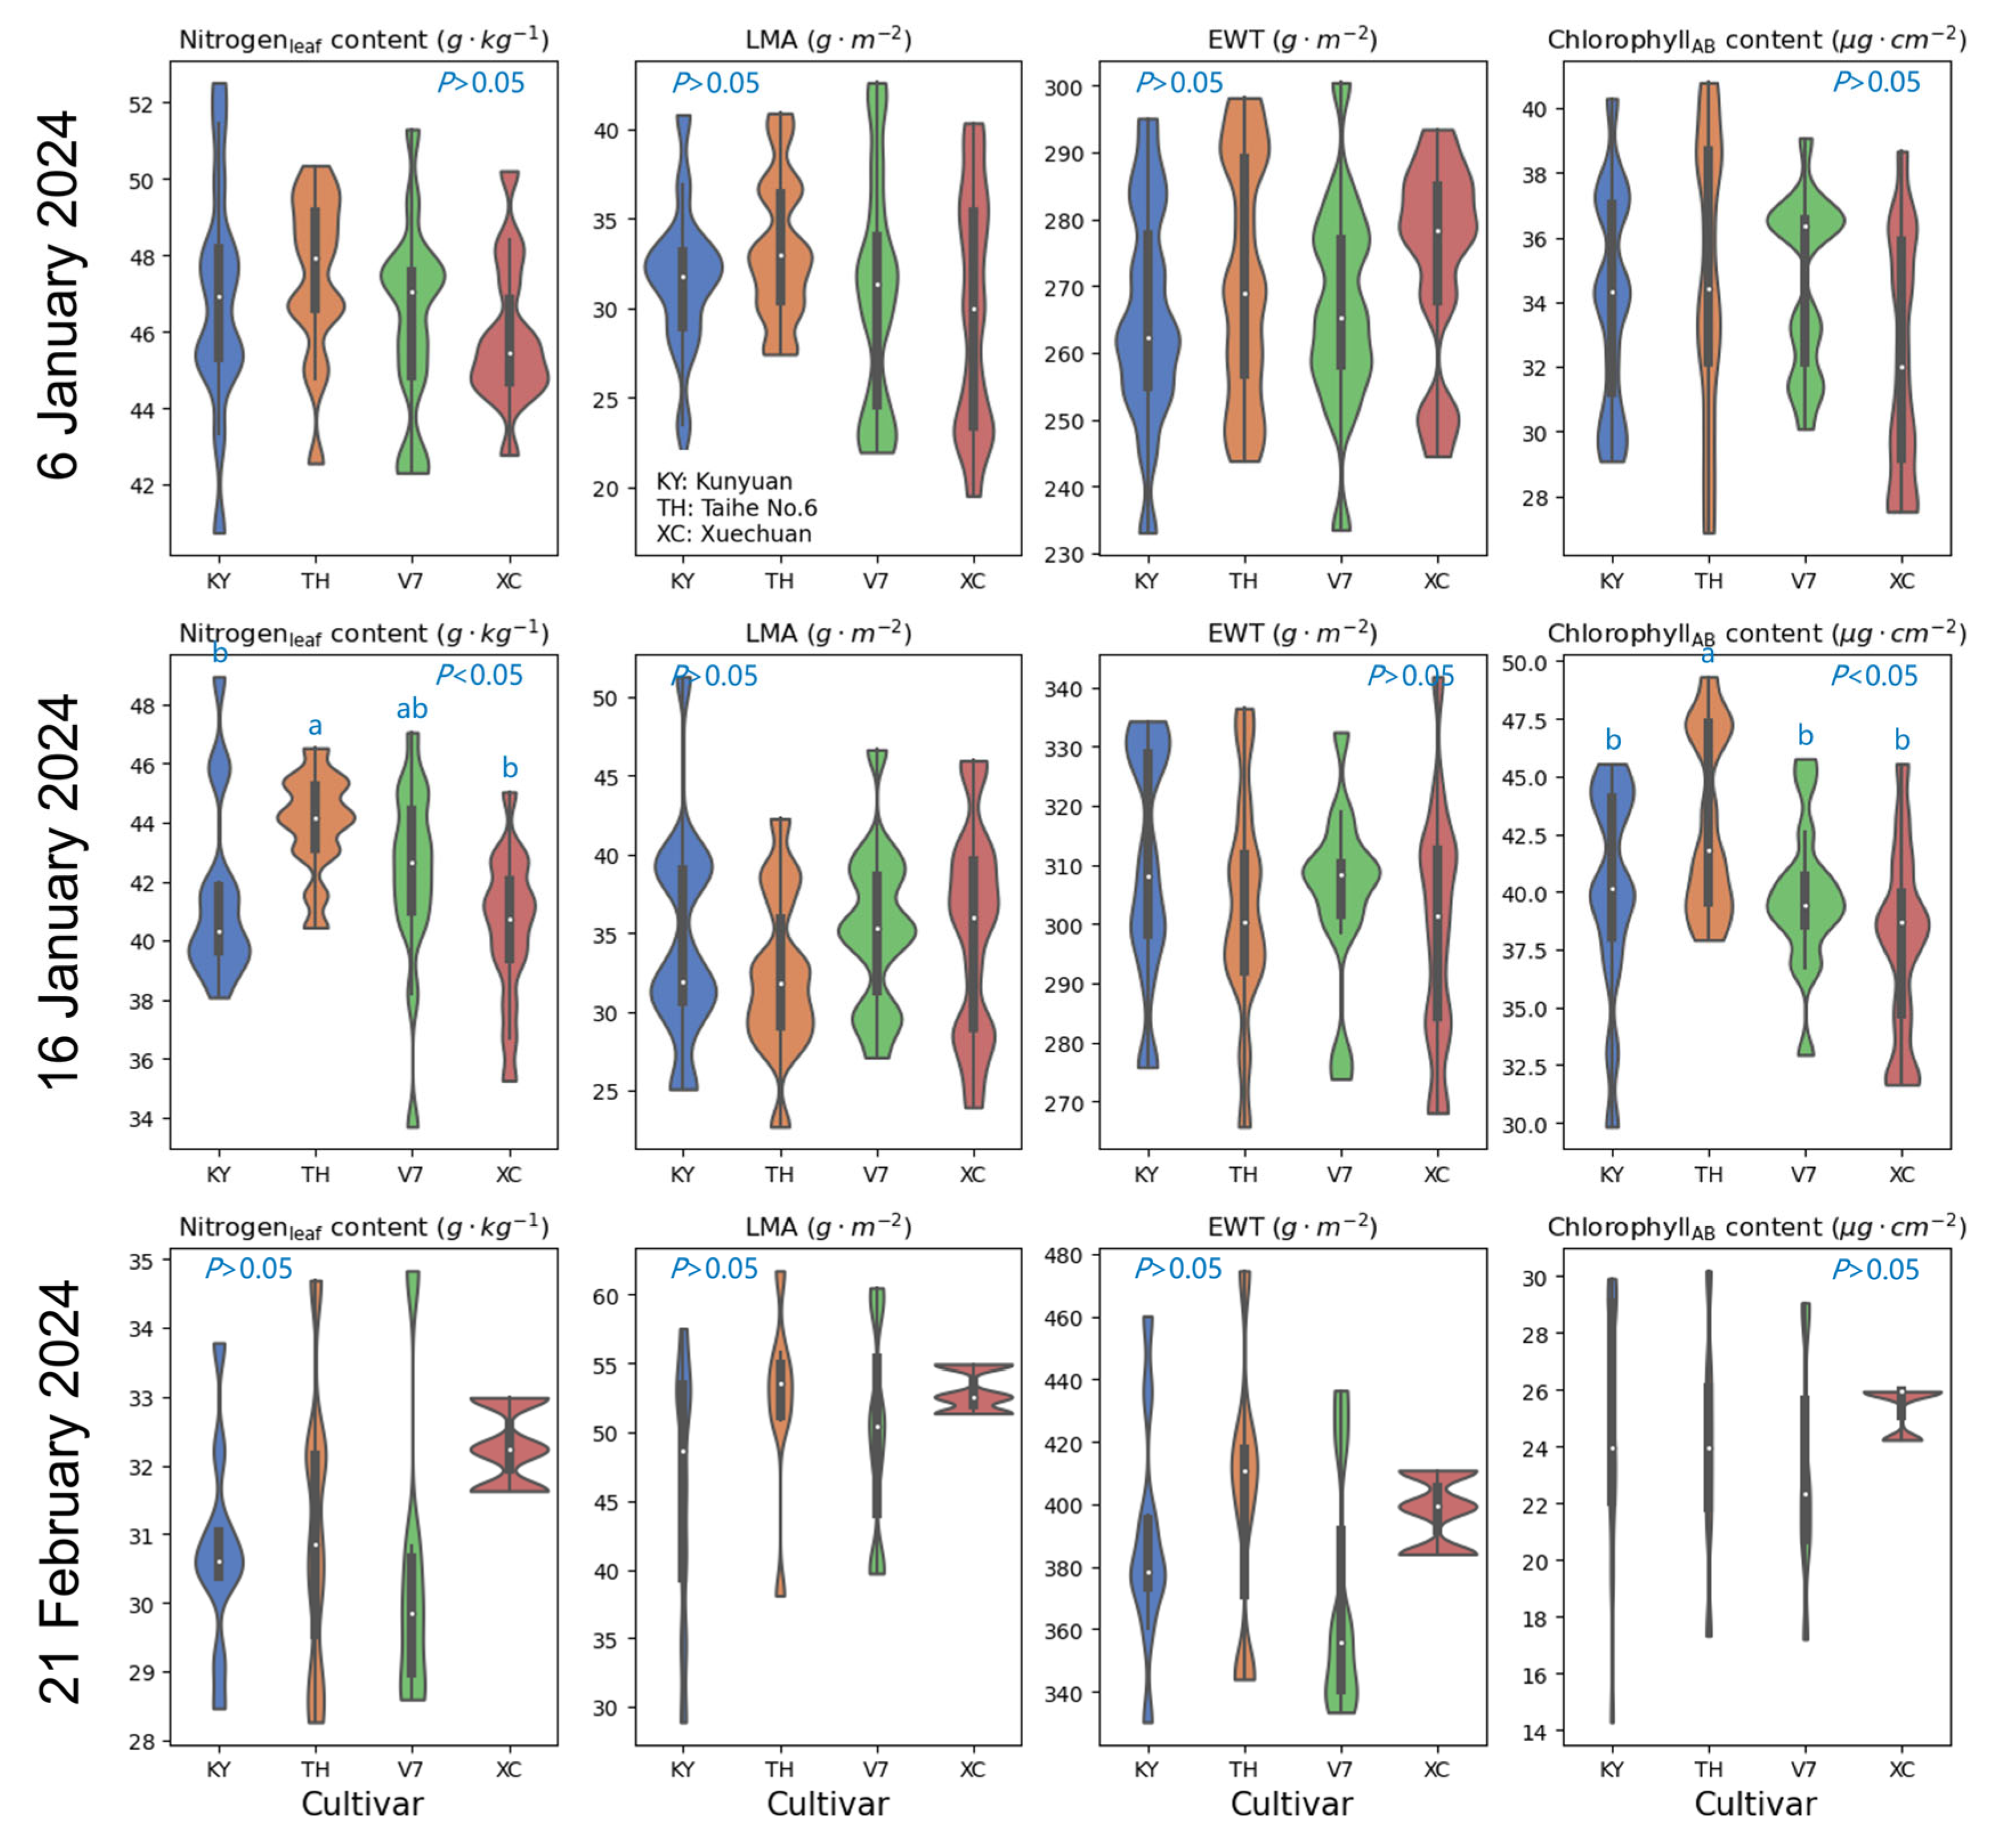
4.1. Influence of Nitrogen Application Rates and Cultivar Selection on Foliar Biochemistries

Figure 4 compares foliar biochemistries across five nitrogen application rates at three growth stages of potato plants. Nitrogen rates only significantly (one-way ANOVA, p < 0.05) affected foliar nitrogen content during tuber formation. High nitrogen treatments (N4 and N5) exhibited higher leaf nitrogen content (mean: 48.2–49.6 g·kg−1) compared to the medium- and low-nitrogen treatments (mean: 44.1–45.8 g·kg−1) (p < 0.05). From tuber formation to maturity, leaf nitrogen content declined by 33.4% (from 46.65 to 31.05 g·kg−1), reflecting shifts in nitrogen demand and use efficiency. In contrast, chlorophyll content showed no significant differences among nitrogen application rates, though a slight increasing trend with high nitrogen application was observed.
Figure 5 presents a comparison of the aboveground foliar biochemistries among four potato cultivars at three growth stages of potato plants. Significant differences (one-way ANOVA, p < 0.05) in foliar biochemistry were observed only for foliar nitrogen and chlorophyll content during tuber expansion. During tuber expansion, Kunyuan and Xuechuan exhibited significantly lower leaf nitrogen content (mean: 40.50–41.47 g·kg−1) compared to Taihe and V7 (mean: 42.24–45.07 g·kg−1) (p < 0.05). In contrast, Taihe showed the highest chlorophyll content (mean: 43.75 μg·cm−2), exceeding Kunyuan by 3.9%, Xuechuan by 15.8%, and V7 by 10.1% (p < 0.05).

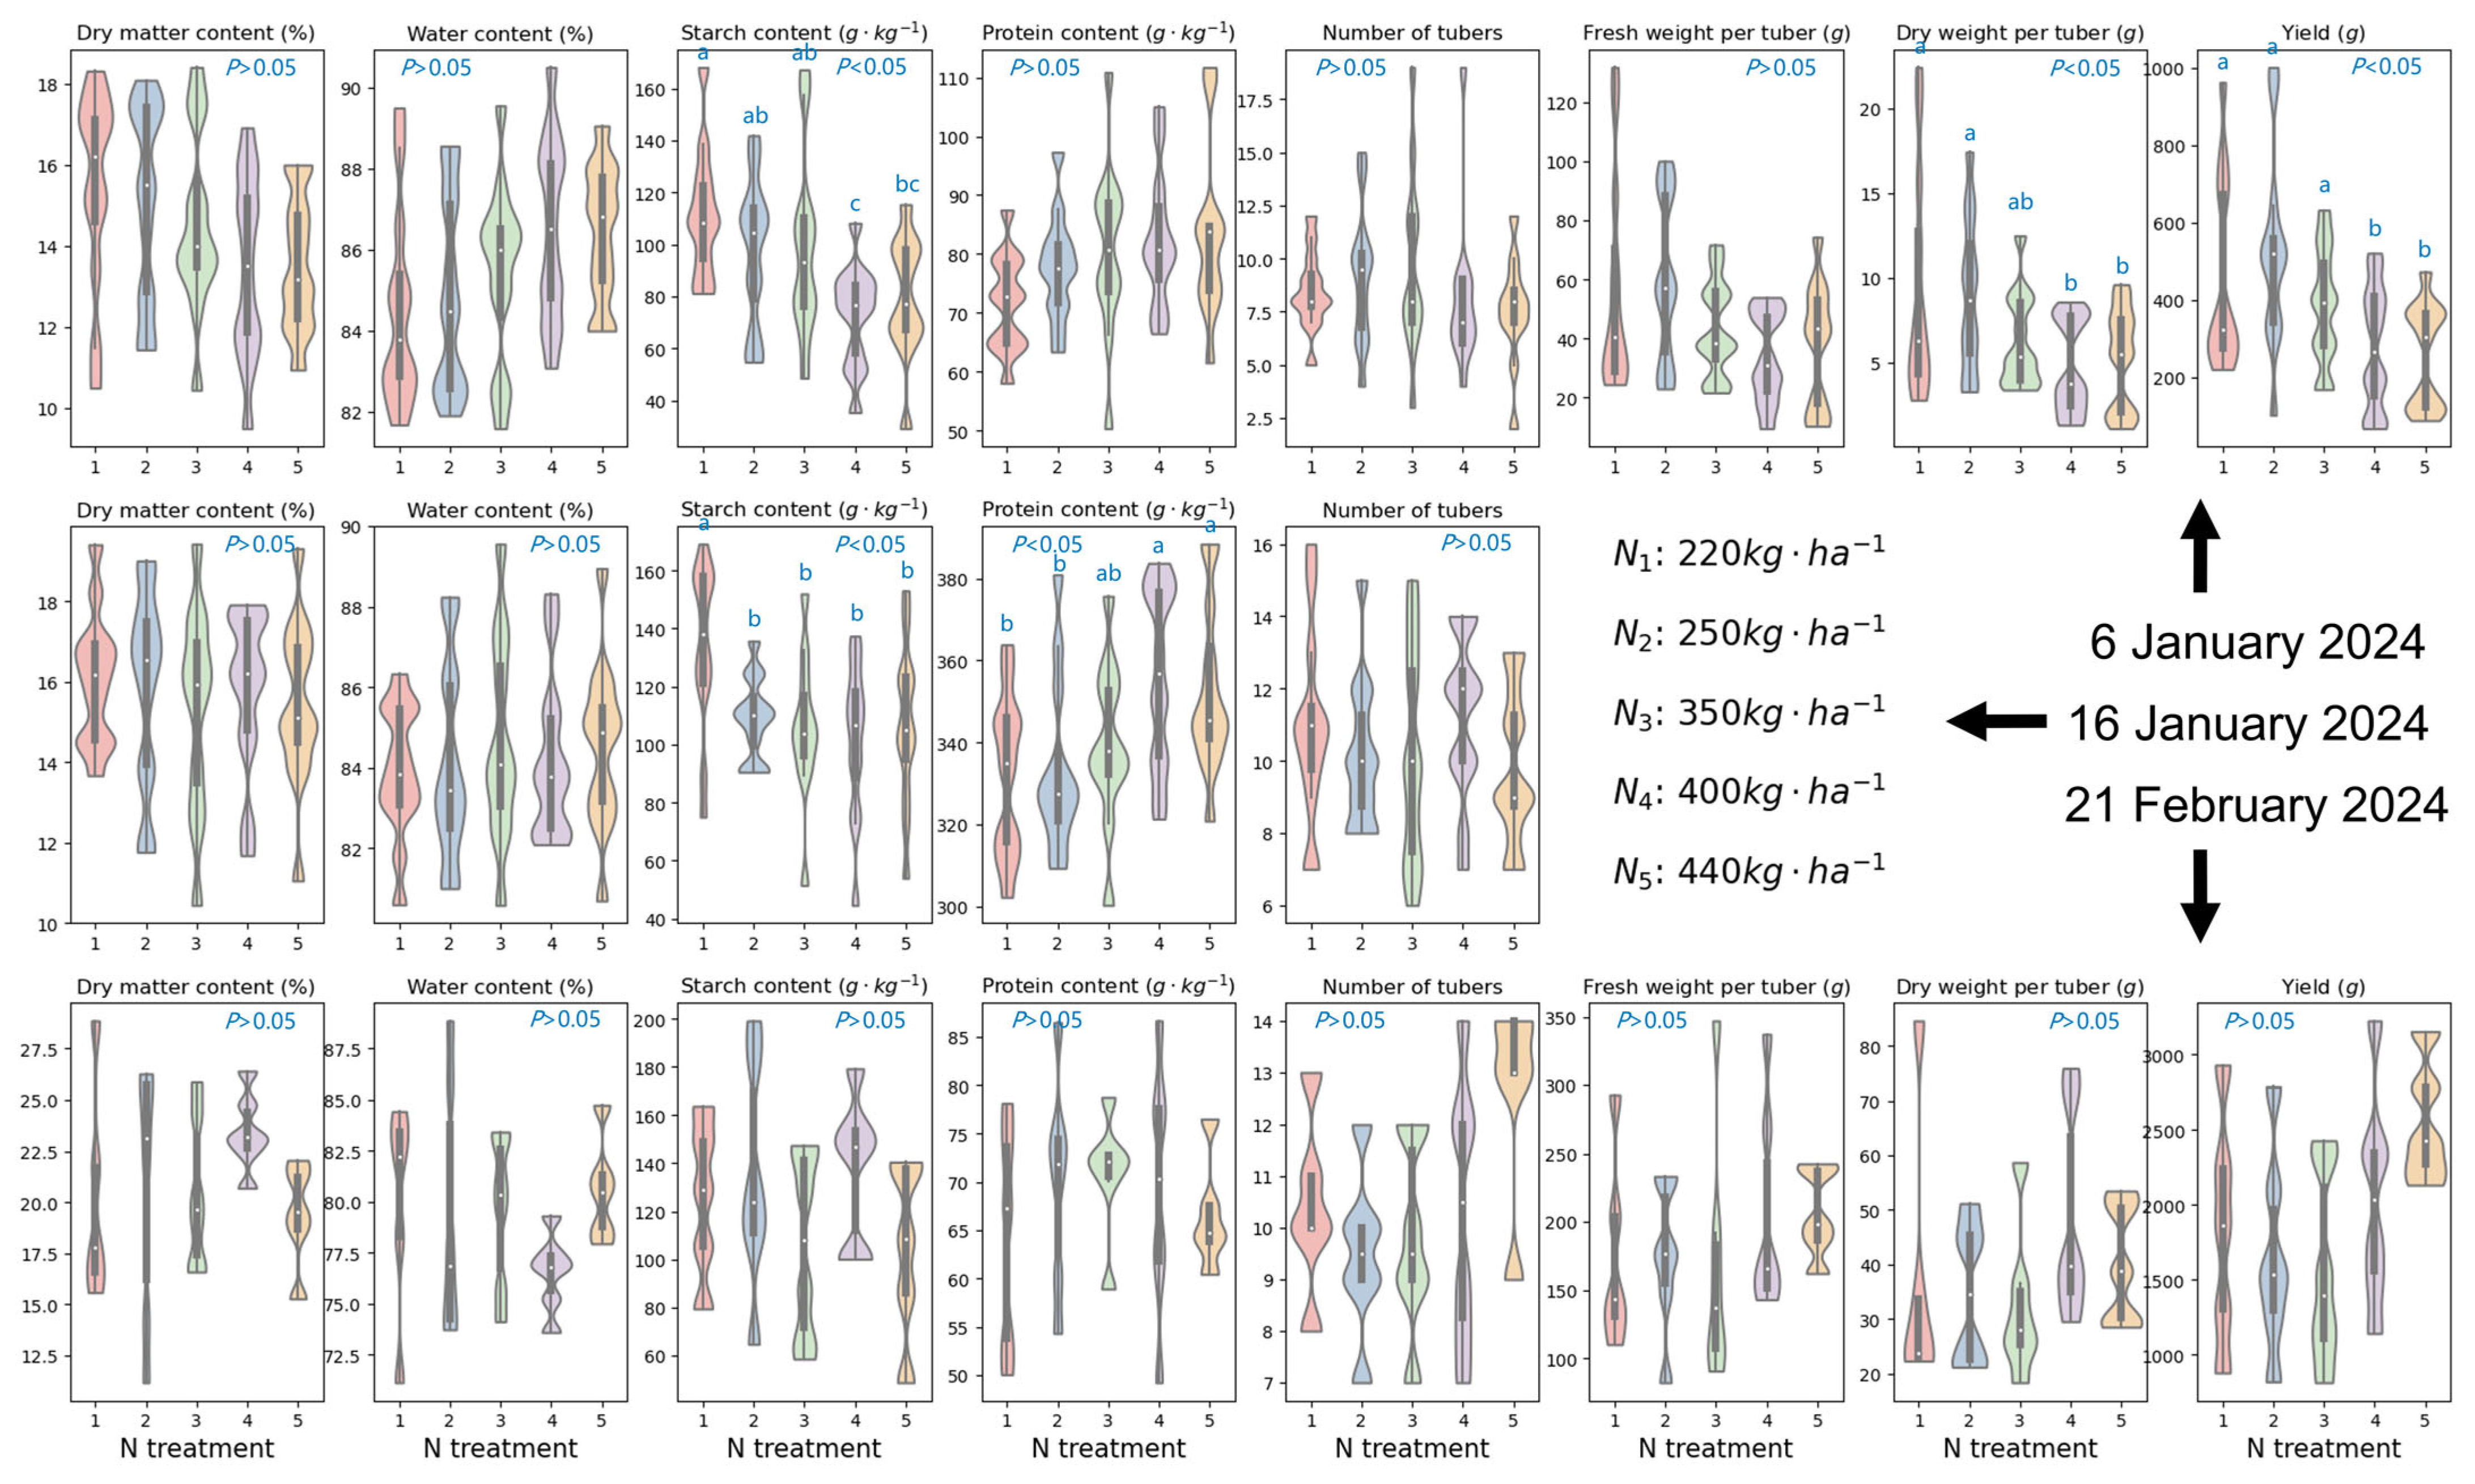
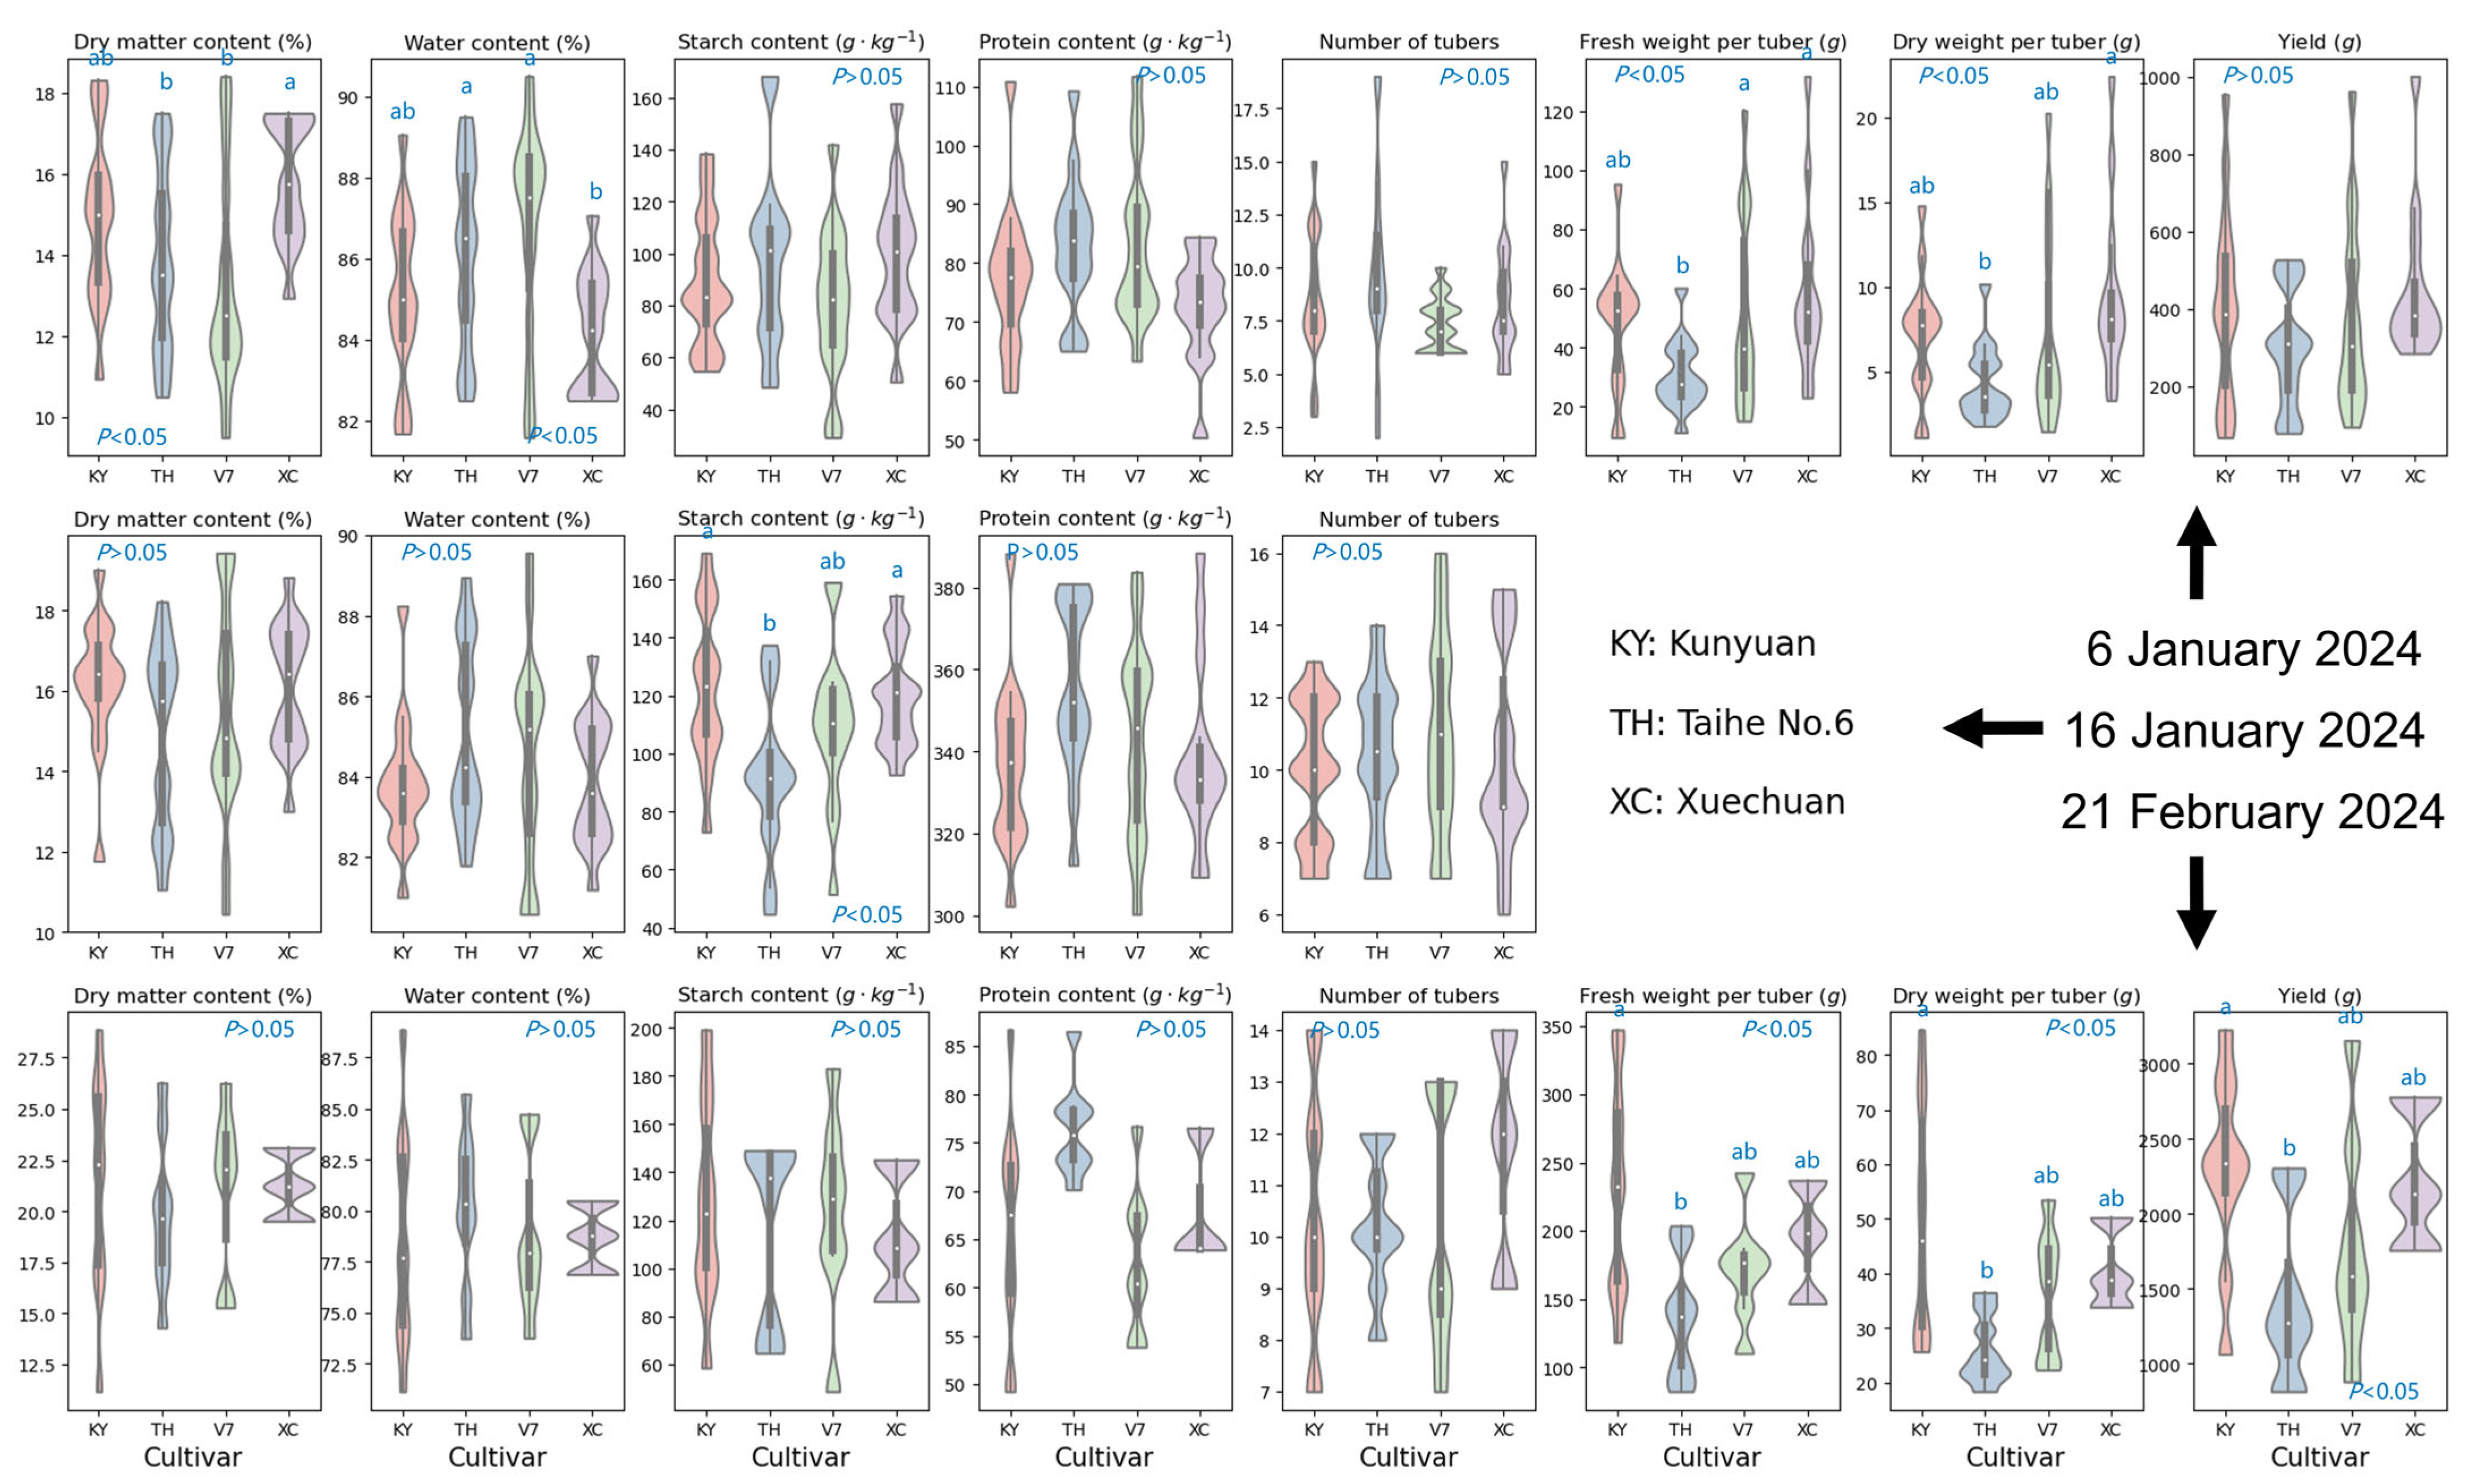
4.2. Influence of Nitrogen Application Rates and Cultivar Selection on Yield Traits

Figure 6 compares yield traits across five nitrogen application rates at three growth stages of potato plants. At the tuber formation stage, nitrogen application rates significantly (one-way ANOVA, p < 0.05) influenced starch content, dry weight per tuber, and yield. Generally, higher nitrogen levels were associated with lower starch content and reduced dry weight per tuber and yield. The differences in tuber starch content, dry weight, and yield between the highest and lowest nitrogen treatments were 53.9%, 91.8%, and 101.4%, respectively. Although not significant, water and protein content tended to increase with higher nitrogen rates, while dry matter content and the number of tubers showed a decreasing trend with increasing nitrogen application rates. As the potatoes progressed through the tuber expansion stage, significant differences (p < 0.05) in yield traits among five nitrogen rates were observed only for starch and protein content. Generally, starch content decreased with increasing nitrogen rates, while protein content increased. The differences in tuber starch and protein content between the highest and lowest nitrogen treatments were 31.99% and 7.3%, respectively. The trends for dry matter and water content remained consistent with those observed at the tuber formation stage. At the tuber maturity stage, none of these yield traits showed significant differences among nitrogen rates. However, an overall trend of increased number of tubers, fresh weight per tuber, dry weight per tuber, and yield was observed with higher nitrogen rates.
Figure 7 compares yield traits across four potato cultivars at three growth stages of potato plants. At the tuber formation stage, variety selection significantly (one-way ANOVA, p < 0.05) affected dry matter and water, fresh weight per tuber, and dry weight per tuber. Taihe and V7 exhibited higher water (86.1–86.7%) and protein (83.0–83.3 g·kg−1) content compared to Kunyuan (water: 85.1%, protein: 77.2 g·kg−1) and Xuechuan (water: 84.2%, protein: 72.7 g·kg−1). In contrast, their dry matter content (13.3–13.9%), fresh weight per tuber (30.7–50.9 g) and dry weight per tuber (4.4–7.2 g) were lower than those of the other cultivars (fresh weight per tuber: 47.2–58.1 g, dry weight per tuber: 7.1–9.3 g). At the tuber expansion stage, only starch content was significantly (p < 0.05) different among the four cultivars. Kunyuan and Xuechuan demonstrated significantly higher starch accumulation in tubers (120.0–123.2 g·kg−1) than Taihe No. 6 (92.3 g·kg−1) and V7 (110.3 g·kg−1), with Taihe No. 6 showing the lowest starch content among the tested cultivars. At the tuber mature stage, cultivar variability significantly (p < 0.05) affected fresh weight per tuber, dry weight per tuber, and yield. Specifically, Kunyuan exhibited the highest yield (mean: 2303.3 g), fresh weight per tuber (mean: 231.2 g), and dry weight per tuber (mean: 49.5 g), while Taihe had the lowest values (yield: 1420.8 g; fresh weight per tuber: 136.8 g; dry weight per tuber: 26.2 g). The relative differences between the highest and lowest performers were 62.1% for fresh weight, 69.0% for dry weight, and 89.0% for yield, respectively. In addition, Appendix A provides the correlation analysis between spectra and aboveground foliar traits.

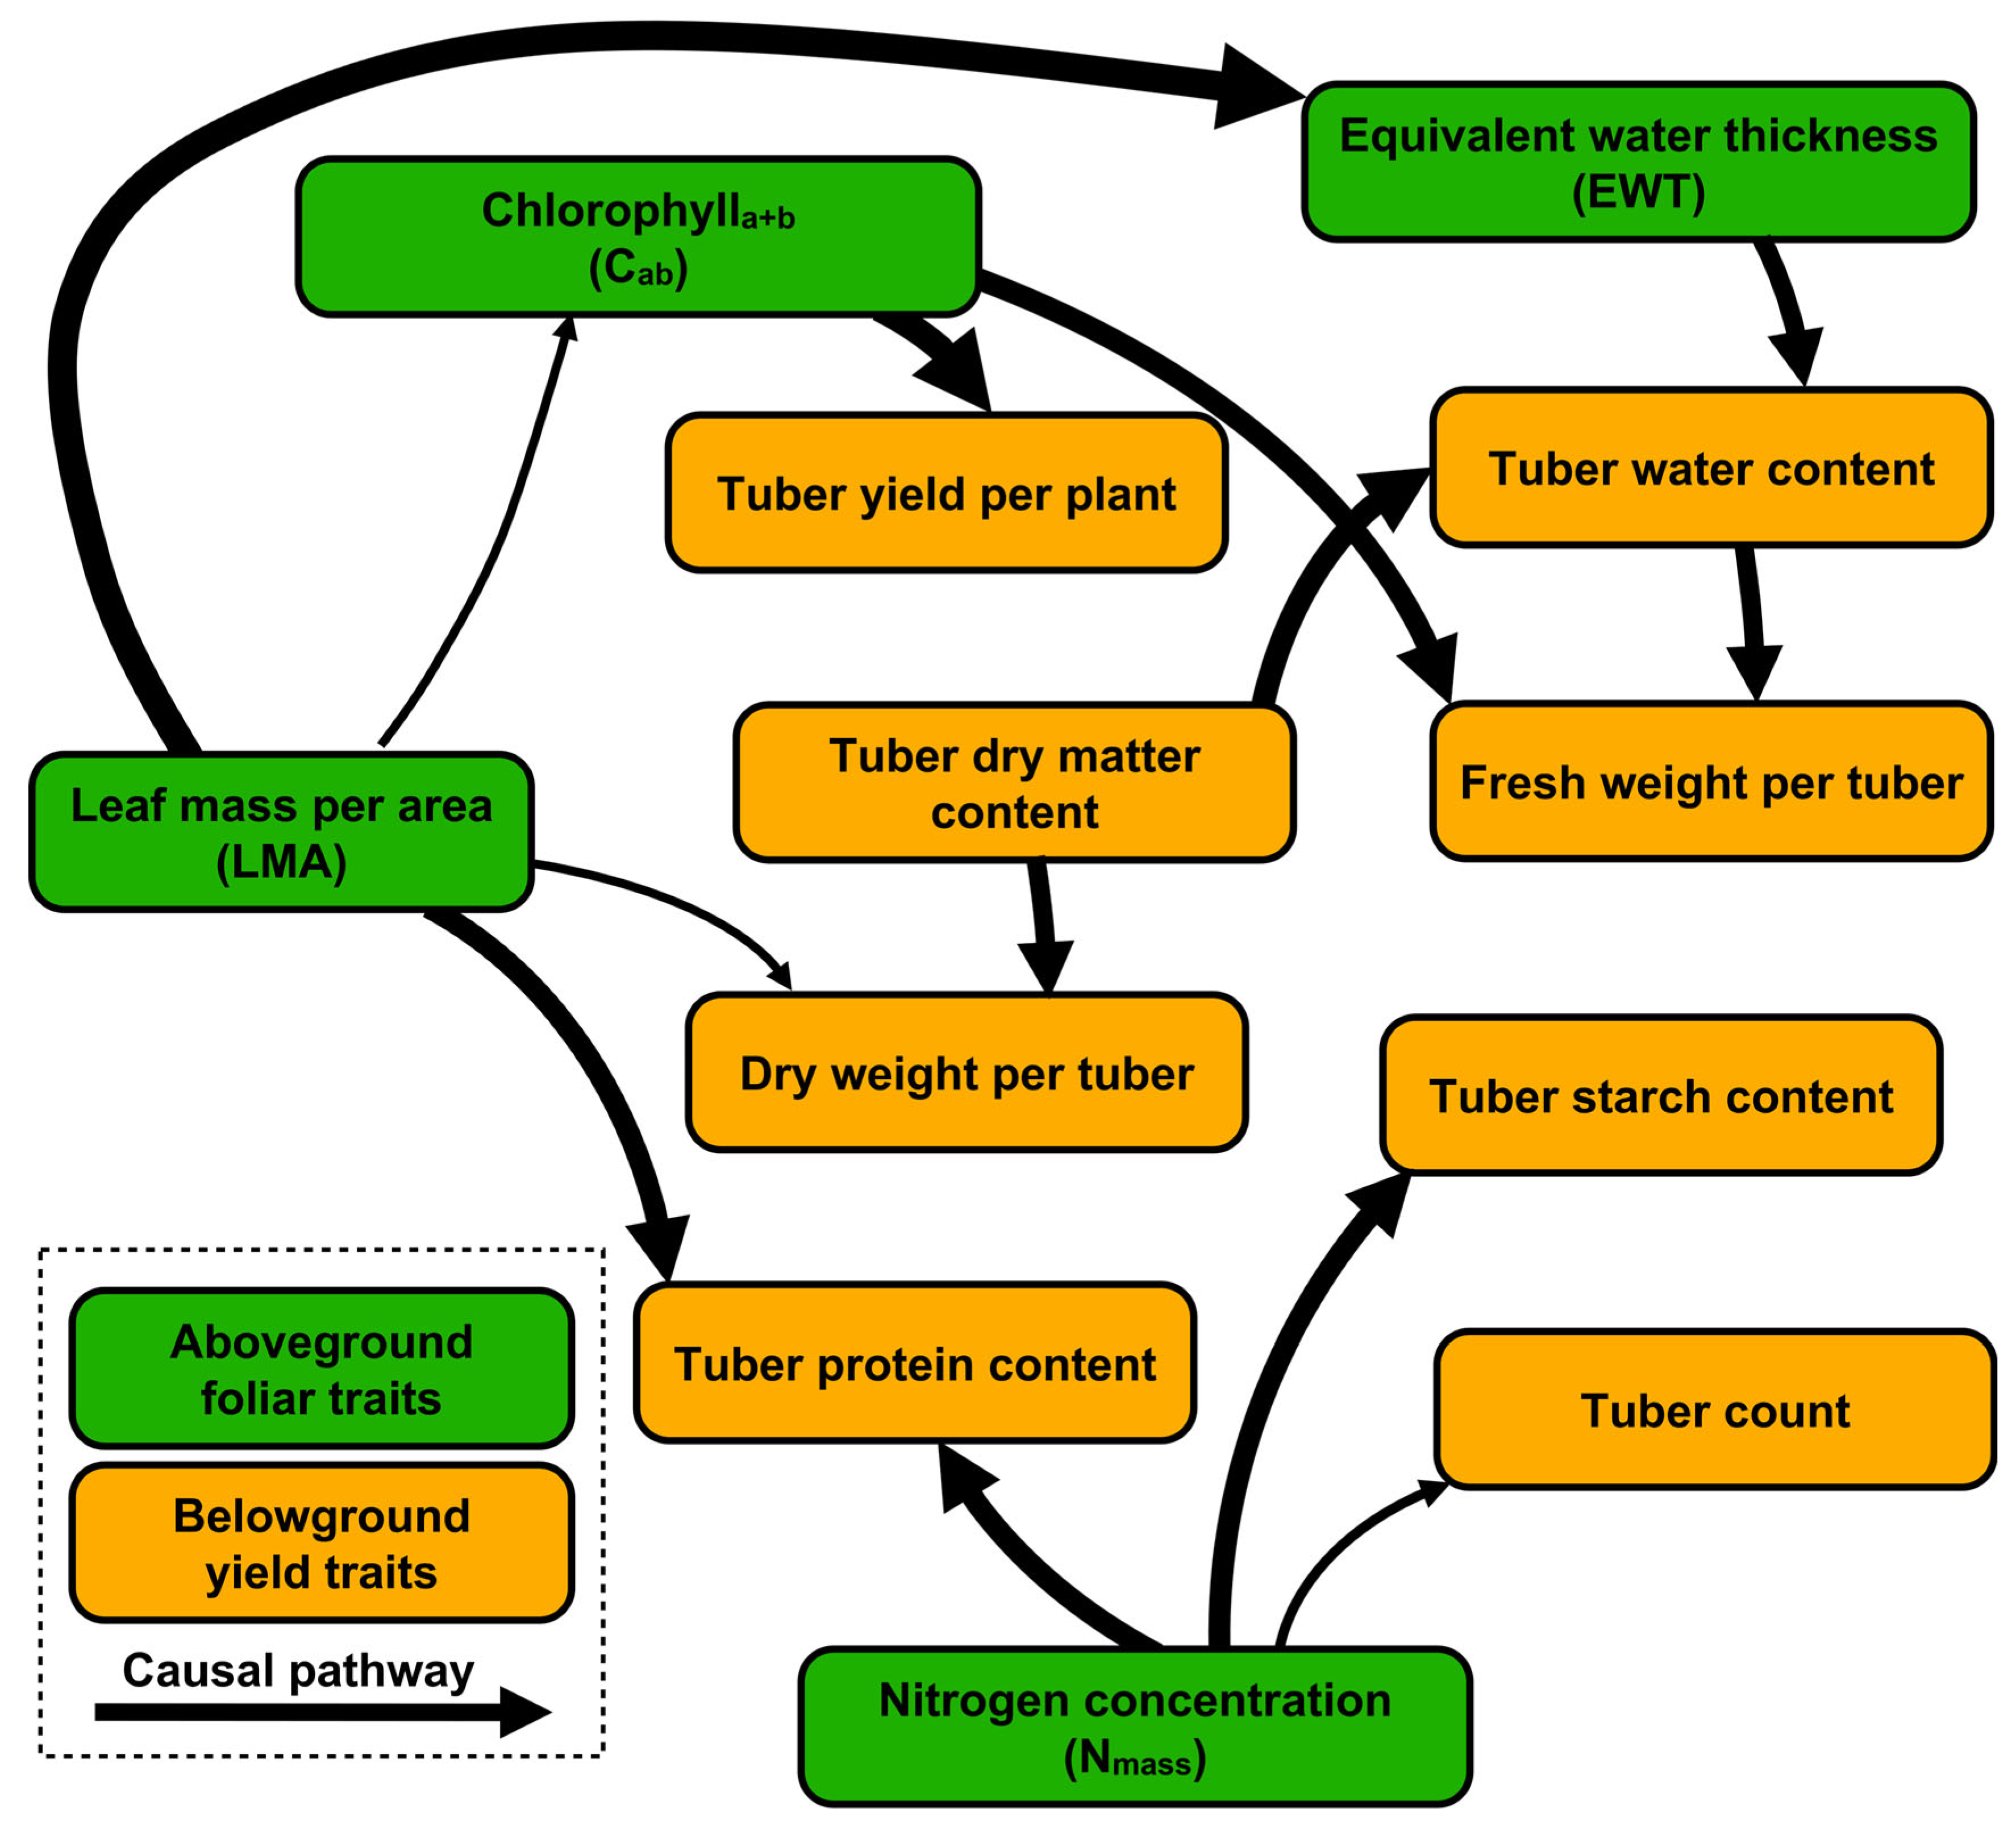
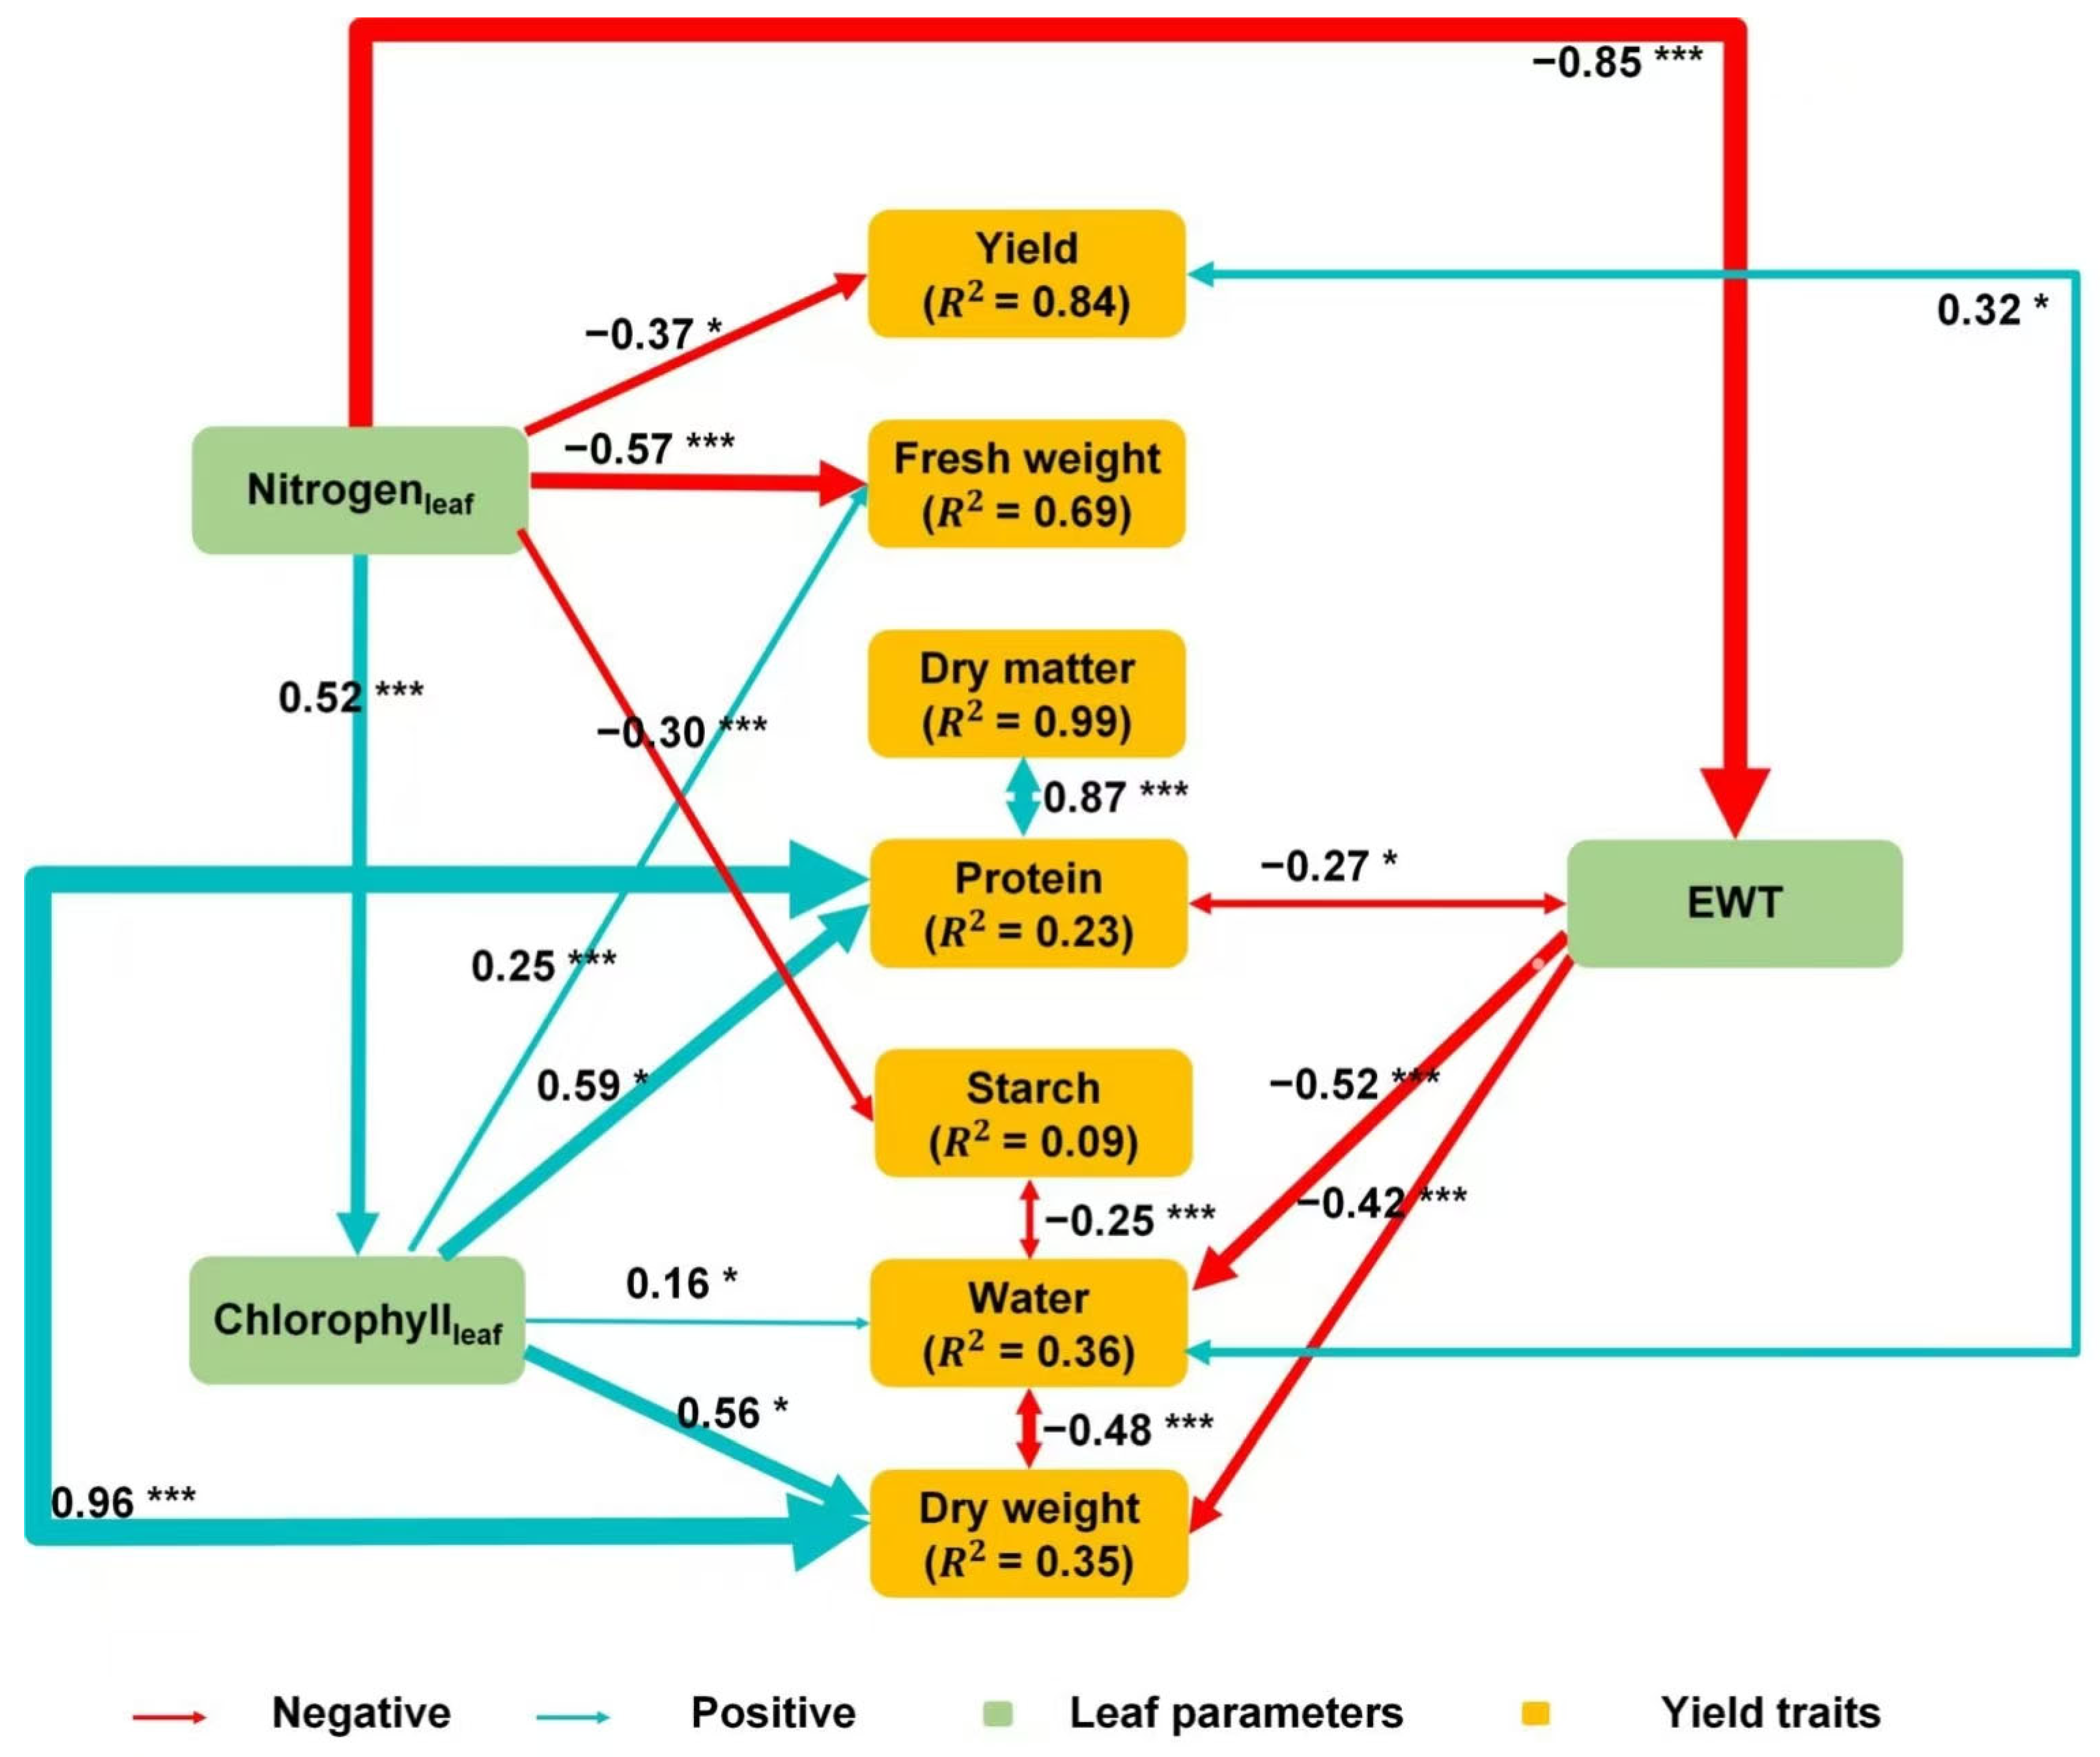
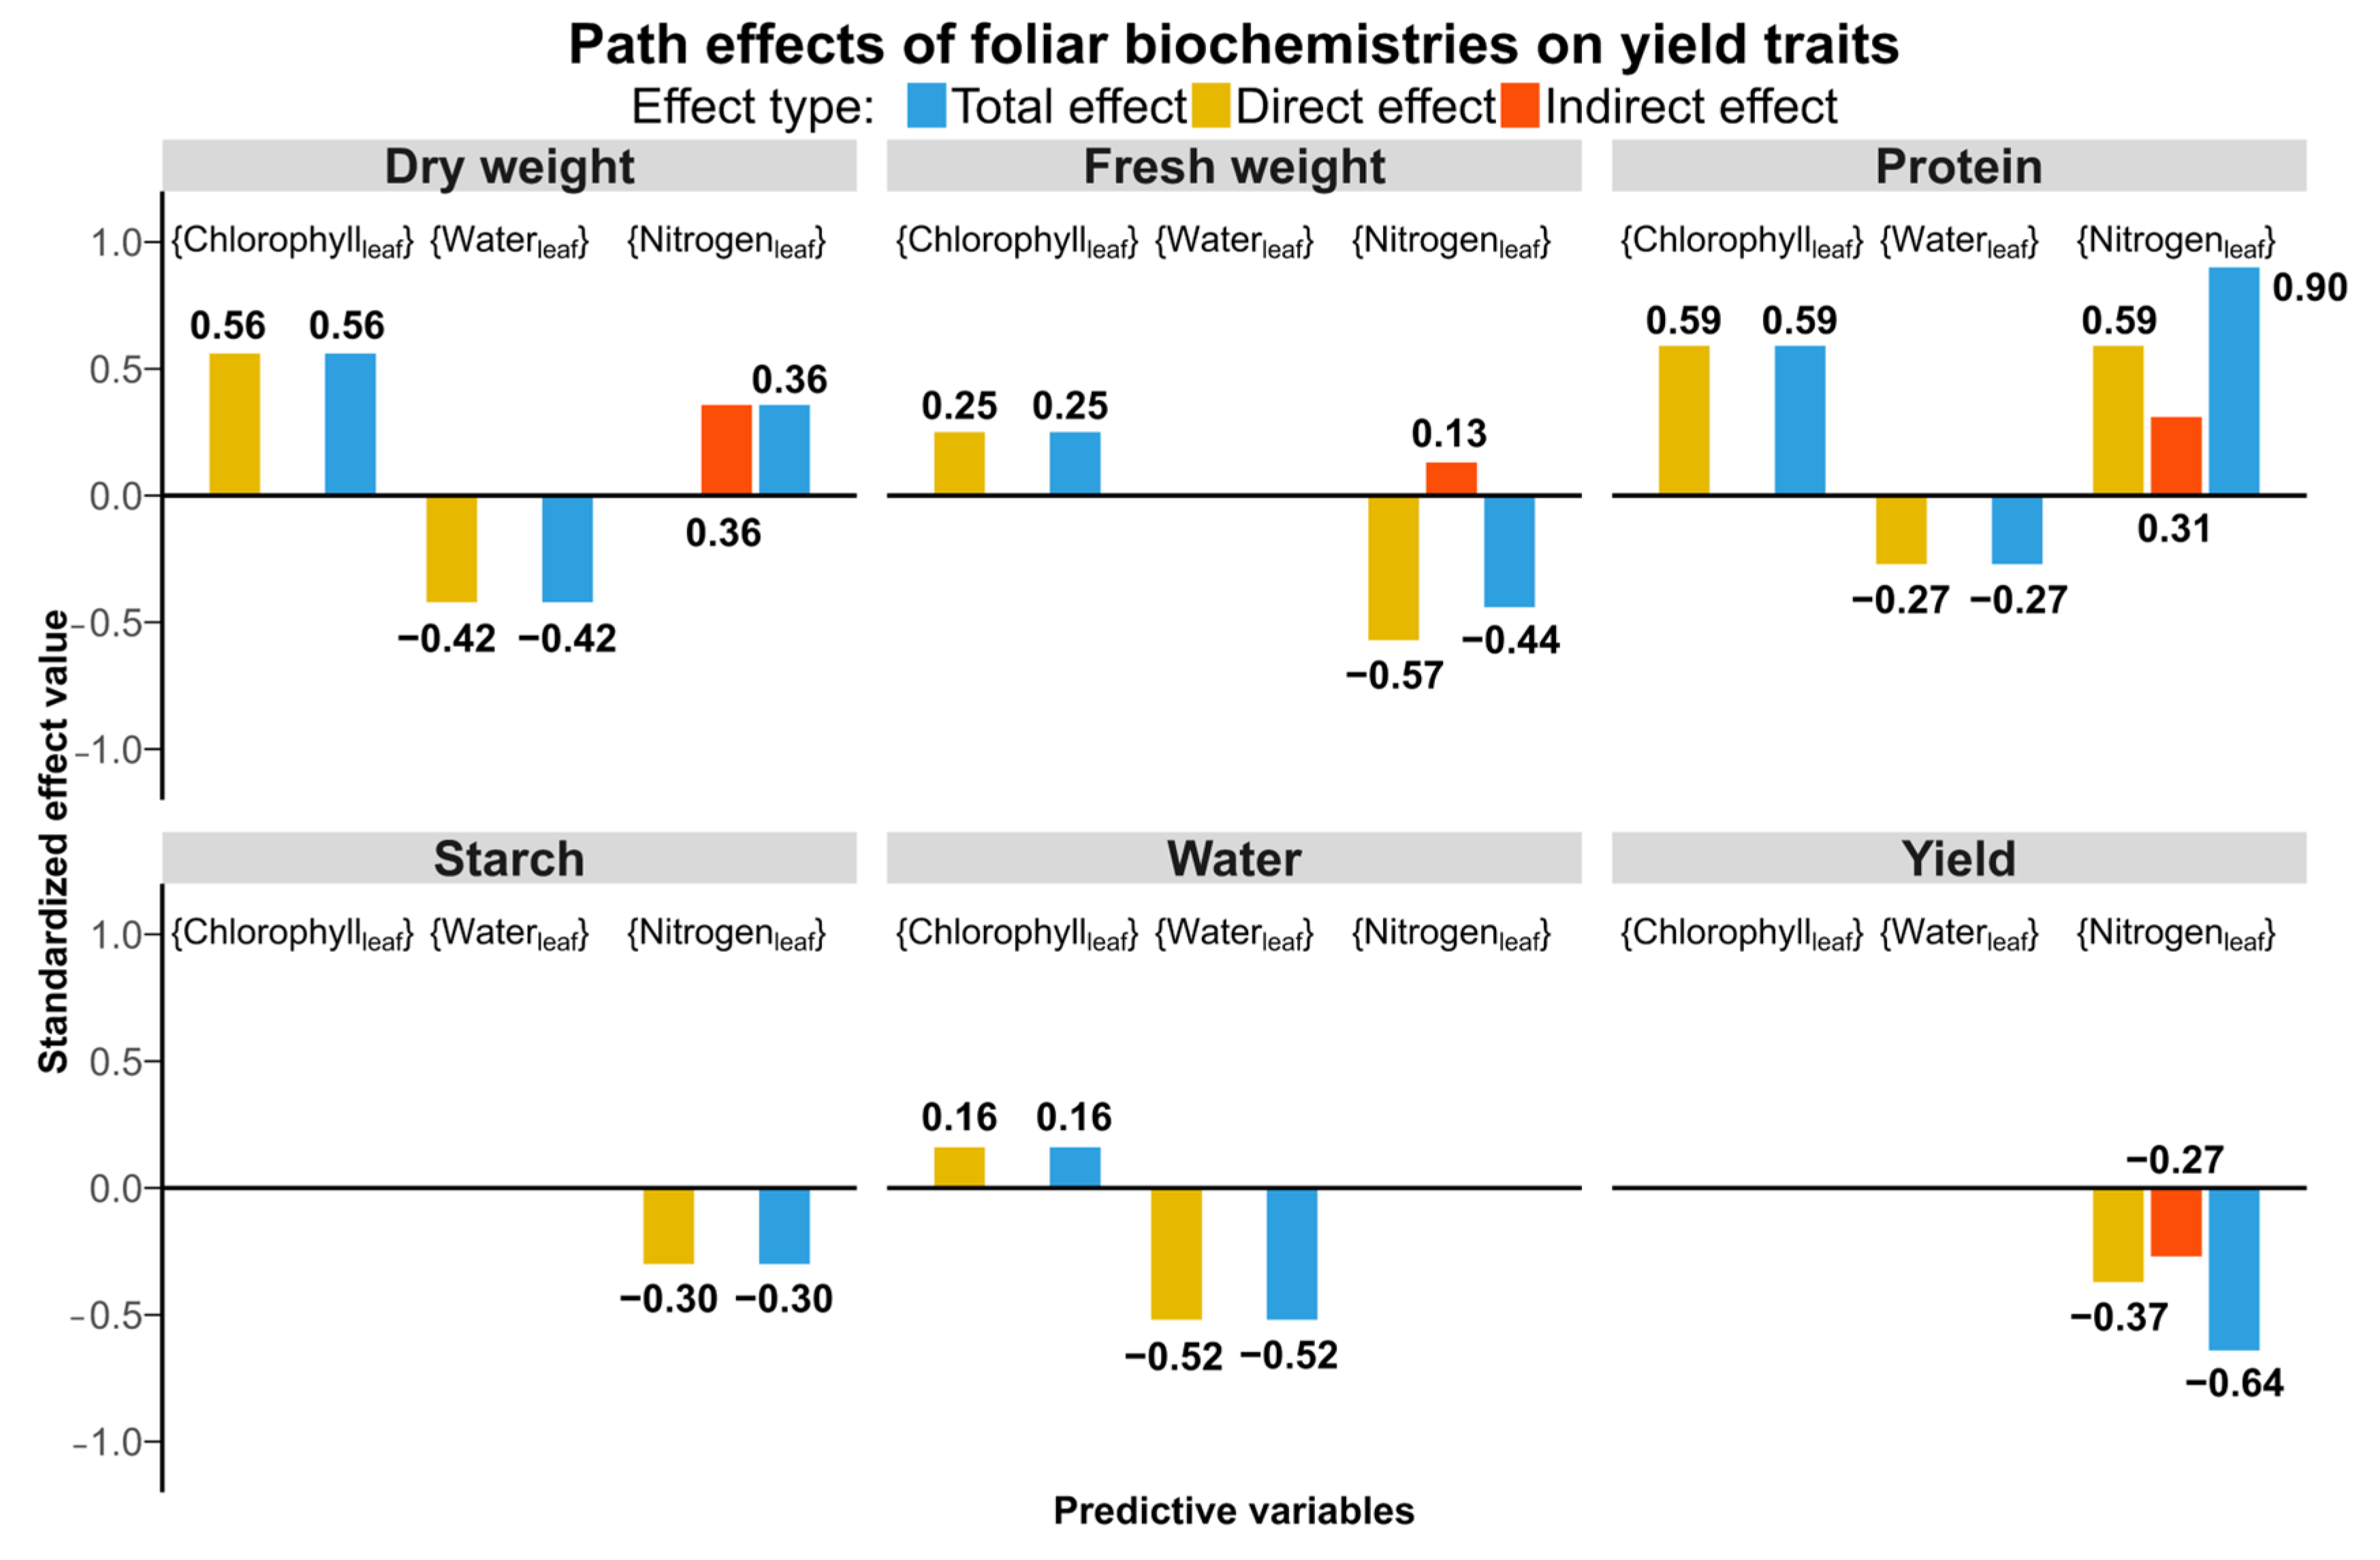
4.3. Relationships Between Aboveground Foliar Traits and Belowground Yield Traits

Table 3 presents the goodness-of-fit of the SEM for evaluating the relationships between aboveground foliar traits and belowground yield traits in potato plants (Figure 8). The model demonstrated good fit, with an RMSEA of 0.041, a χ2/df of 1.245, a TLI of 0.996, a CFI of 0.999, a NFI of 0.993, and an IFI of 0.999. The AIC and BIC were 613.276 and 747.229, respectively. All indices met the criteria for a well-fitting model, confirming the robustness of the SEM.
Figure 8 presents the relationships between aboveground foliar biochemicals and belowground yield traits, as revealed by the structural equation model (SEM). The SEM explained 99% of the variation in tuber dry matter content, 84% in tuber yield, and 69% in fresh weight. Moderate accuracy was observed for water content and dry weight (R2 = 0.35), while tuber protein and starch content exhibited lower explanatory power, with R2 values of 0.23 and 0.09, respectively.
The direct relationships between aboveground foliar traits and belowground yield traits varied in strength (Figure 8). Weak to moderate negative direct links were found between foliar nitrogen content and tuber yield (path coefficient b = −0.37), foliar nitrogen content and starch content (b = −0.30), leaf water content and tuber protein content (b = −0.27), and leaf water content and dry weight per tuber (b = −0.42). Stronger negative links were found between foliar nitrogen content and fresh weight per tuber (β = −0.57) and between foliar water content and tuber water content (b = −0.52). In contrast, weak positive links were detected between foliar chlorophyll content and tuber water content (b = 0.16) and between foliar chlorophyll content and fresh weight per tuber (b = 0.25). Strong positive links emerged between foliar chlorophyll content and both dry weight per tuber (b = 0.56) and tuber protein content (b = 0.59).
Indirect relations between aboveground foliar traits and belowground yield traits were identified (Figure 8). In the pathway of “Nitrogenleaf β = 0.52 Chlorophyllleaf β = 0.59 Proteintuber”, foliar nitrogen exerted an indirect effect on tuber protein via chlorophyll, with an indirect effect of 0.307 (= 0.52 × 0.59). Similarly, foliar nitrogen indirectly influenced tuber fresh weight, water content, and dry weight via leaf chlorophyll, with effects of 0.13, 0.08, and 0.29, respectively. Foliar nitrogen indirectly influenced tuber protein content, water content, and dry weight via leaf water, with effects of 0.23, 0.44, and 0.36, respectively.
Figure 9 illustrates the total effects (i.e., the sum of direct and indirect path coefficients) of the aboveground foliar biochemical traits on the belowground yield components. The total effects on tuber dry weight followed: leaf chlorophyll content (total effect coefficient b = 0.56) > leaf water content (b = −0.42) > leaf nitrogen content (b = 0.36). Tuber fresh weight was primarily affected by leaf nitrogen content (b = −0.44), followed by leaf chlorophyll (b = 0.25). For tuber protein content, the order of effects was leaf nitrogen (b = 0.90) > leaf chlorophyll (b = 0.59) > leaf water content (b = −0.27). Tuber water content was primarily affected by leaf water content (b = −0.52), followed by leaf chlorophyll (b = 0.16). Foliar nitrogen content was the only significant predictor for both tuber starch content (b = −0.30) and tuber yield (b = −0.64).

4.4. Direct Inversion of Belowground Yield Traits

Table 4 presents the performance of three direct inversion models—partial least squares regression (PLSR), support vector regression (SVR), and random forest regression (RFR)—in predicting belowground yield traits from leaf spectra. Overall, the models demonstrated strong predictive accuracy for tuber fresh weight (R2 = 0.60–0.63, RMSE = 47–53 g, RRMSE = 47–50%), tuber dry weight (R2 = 0.69–0.71, RMSE = 9–10 g, RRMSE = 45–48%), tuber yield (R2 = 0.58–0.69, RMSE = 507–591 g, RRMSE = 49–58%), and tuber protein content (R2 = 0.65–0.84, RMSE = 41–73%, RRMSE = 30–44%). Notably, the performance of PLSR, SVR, and RFR was comparable across these traits. However, prediction accuracy was considerably lower for other yield-related parameters, including tuber count, dry matter content, starch content, and water content, with an R2 < 0.3.

4.5. Indirect Inversion of Belowground Yield Traits

Table 5 presents the performance of three inversion models (i.e., PLSR, SVR, and RFR) in predicting aboveground foliar biochemistries from leaf spectra. Among these, SVR demonstrated the poorest performance (R2 < 0.1). Therefore, it was excluded from subsequent belowground yield trait inversion analyses. PLSR and RFR showed comparable and better performance than SVR across all biochemical parameters. Specifically, for chlorophyll estimation, both PLSR and RFR achieved moderate accuracy (R2 = 0.29–0.30) with similar error metrics (RMSE: 6.99–7.00 g·cm−2; NRMSE: 17%). Nitrogen content was predicted with high accuracy (R2 = 0.76 for both models) and low errors (RMSE: 3.15–3.34 g·kg−1; NRMSE: 14%). EWT predictions were similarly strong (R2: 0.75–0.78; RMSE: 26.55–29.10; NRMSE: 13–14%). LMA estimation showed moderate performance, with an R2 of 0.46–0.47, RMSE of 6.98–7.24, and NRMSE of 19%.
Table 6 presents the performance of indirect models in predicting belowground yield traits. The indirect approach (PLSR + SEM and RFR + SEM) integrated the statistical models (PLSR and RFR, see Table 5) of foliar biochemistries with the structural equation model (SEM) of foliar biochemistry–yield trait relationships (see Section 4.3). Compared to direct inversion approaches, the indirect method showed reduced predictive accuracy overall. Moderate prediction accuracy was achieved for tuber fresh weight (R2 = 0.31–0.36, RMSE = 28.37–33.75 g, NRMSE = 9–10%), tuber dry weight (R2 = 0.29–0.41, RMSE = 6.08–10.52 g, NRMSE = 8–14%), tuber yield (R2 = 0.43–0.45, RMSE = 494.04–538.21 g, NRMSE = 23–33%), tuber protein content (R2 = 0.16–0.19, RMSE = 22.82–35.33%, NRMSE = 7–11%), and water content (R2 = 0.29–0.35, RMSE = 36.03–38.80%, NRMSE = 244–263%). However, prediction accuracy was substantially lower for tuber count, dry matter content, and starch content, with R2 values below 0.2, indicating limited model performance for these traits.

5. Discussion

5.1. Effects of Aboveground Foliar Biochemistries on Belowground Yield Traits

The observed negative effect of leaf nitrogen accumulation on tuber yield parameters (i.e., fresh weight and yield, Figure 8 and Figure 9) arises from the metabolic and resource allocation processes within plants. As an essential component of chlorophyll, amino acids, and enzymatic proteins, nitrogen enhances Rubisco concentration and photosynthetic efficiency, thereby promoting stem and leaf growth [35]. However, these growth-promoting effects can disrupt the critical source–sink balance between aboveground tissues and belowground tubers. During vegetative growth, shoots and tubers compete directly for available nitrogen resources. This competition intensifies during tuber bulking, where excessive nitrogen application stimulates shoot growth but inhibits tuber development through multiple interconnected pathways [36]. For instance, stem growth preferentially directs photoassimilates toward aboveground tissues at the expense of tuber allocation. Also, excessive leaf expansion leads to canopy overcrowding, which reduces light penetration and overall photosynthetic efficiency. Nitrogen retention in vegetative tissues limits its remobilization to developing tubers, further constraining sink strength. Tuber yield formation depends fundamentally on two processes: continuous photosynthetic production and efficient assimilate partitioning to underground storage organs. Previous studies have shown that nitrogen translocation efficiency among plant organs directly governs carbon assimilate deposition in tubers. When stems and leaves retain disproportionate nitrogen shares, the assimilatory capacity of sink organs becomes significantly compromised, ultimately hindering yield formation [37,38,39]. Consequently, while elevated foliar nitrogen enhanced aboveground biomass, it ultimately reduced tuber productivity by disrupting the source–sink resource equilibrium.
The inverse relationship between leaf water content and tuber hydration status (Figure 8 and Figure 9) results from competing physiological demands in water transport and photosynthetic regulation. While water is fundamentally required for plant growth, excessive leaf water accumulation may cause multiple stress responses that ultimately compromise tuber development. For instance, excessive leaf hydration reduces root water uptake efficiency and limits water translocation to tubers. Impaired stomatal conductance under water-saturated conditions induces root hypoxia, promoting the accumulation of phytotoxic respiratory metabolites (ethanol, ethylene, and CO2) that directly inhibit tuber growth [40,41]. This hydraulic disruption follows a biphasic pattern in roots—an initial stimulation of tuber activity and volume is subsequently reversed, leading to reduced root and shoot biomass that further constrains tuber hydration. Elevated leaf water potential disrupts the osmotic gradient necessary for tuber cell expansion, as it interferes with the precise regulation of turgor pressure required for both stomatal function and photosynthetic efficiency [42,43]. These interacting mechanisms demonstrate how leaf water status can negatively impact tuber water content when exceeding optimal thresholds through complex hydroregulatory pathways.
The positive correlations between foliar traits (i.e., leaf chlorophyll and nitrogen content) and tuber quality (i.e., tuber protein content and dry weight) are not surprising. Higher leaf chlorophyll levels enhanced photosynthetic efficiency, thereby improving tuber quality—particularly protein content and dry weight—through increased energy supply and carbon assimilation [44]. Elevated chlorophyll not only stimulates photosynthetic product synthesis but also optimizes nitrogen utilization in key metabolic processes, including protein production. As chlorophyll is essential for light absorption and energy conversion in photosynthesis, leaves with greater chlorophyll content fix more carbon dioxide, generating higher triose phosphate levels [44]. This compound is primarily transported to the cytoplasm via the triose phosphate translocator (TPT) for sucrose synthesis, before being allocated to tubers as building blocks for protein. Consequently, the increased supply of photosynthetic products also raises tuber dry weight.

5.2. Comparison of Direct and Indirect Inversion Approaches

Both direct and indirect inversion approaches have distinct advantages and limitations. The direct inversion method demonstrated higher accuracy in predicting tuber yield, fresh/dry weight, and protein content (R2 = 0.58–0.84; Section 4.4) but did not explain the causal links between belowground yield traits and aboveground spectra. In contrast, the indirect inversion approach provided a mechanistic framework for estimating belowground traits from spectra by integrating two causal relationships: (1) the linkages between belowground yield components and foliar biochemistries (Section 4.3), and (2) the associations between the absorption of foliar biochemistries and leaf spectra (Section 4.5). However, this approach showed lower predictive accuracy compared to direct inversion (Section 4.5)—contrary to previous studies where indirect approaches typically performed better [29,30,31,32]. The reduced predictive accuracy of the indirect inversion approach primarily stemmed from error propagation in the structural equation modeling (SEM) framework. The total prediction error for belowground yield traits can be decomposed into two parts: (1) the inherent error in predicting belowground yield traits from foliar biochemistry using SEM and (2) the propagated error from leaf biochemical estimations through the SEM framework. These errors, when propagated through SEM, led to significant uncertainties in estimating belowground yield traits.
Recent data-driven approaches employing machine learning techniques (e.g., random forests and LSTM networks) with remote sensing data typically achieved prediction accuracies in the range of R2 = 0.43–0.79 [45,46,47]. While these methods demonstrate strong statistical performance, they fundamentally rely on empirical correlations without elaborating on the biological mechanisms governing yield formation. In contrast, our innovative integration of structural equation modeling with vegetation parameters establishes explicit causal pathways linking key physiological indicators (e.g., leaf chlorophyll, water, and nitrogen content) with yield traits. Although our hybrid (e.g., RFR + SEM and PLSR + SEM) approach showed slightly more modest accuracy metrics (R2 = 0.43–0.45) compared to previous data-driven models, it provides unprecedented mechanistic understanding of yield formation processes. This represents a significant conceptual advance beyond traditional black-box predictive modeling, offering both scientific insights and practical decision-support capabilities for precision agriculture applications.
The indirect approach remains valuable for two fundamental reasons. First, it offers better interpretability of the physiological mechanisms linking aboveground leaf traits (including chlorophyll, nitrogen, dry matter, and water content) with belowground yield formation. This mechanistic understanding is essential for advancing fundamental knowledge of tuber development processes. Second, these indirect models provide critical supplementary information that complements direct inversion methods, particularly for improving process-based potato growth models (e.g., SUBSTOR-potato, DSSAT, SOLANUM, APSIM, and AquaCrop) that simulate the physiological drivers of yield formation [48]. While we acknowledge the current challenges posed by error propagation in the indirect approach, we emphasize its continued importance for guiding agricultural practices such as precision nutrient management and optimized irrigation strategies. Future research directions should focus on reducing estimation errors in aboveground trait retrieval and minimizing their propagation through the structural equation models connecting foliar characteristics with ultimate yield outcomes.

5.3. Implications for Precision Agriculture

Our work distinguishes itself from previous research in this domain in several aspects. Most significantly, we demonstrated the successful application of indirect inversion techniques for potato yield trait prediction. Furthermore, our study represented a methodological advance through the incorporation of structural equation modeling (SEM) to explicitly quantify the physiological pathways linking leaf traits to ultimate yield formation—a critical analytical dimension that has been notably absent from prior investigations. This integrated approach provides both theoretical and practical advances by bridging the gap between conventional spectral analysis techniques and fundamental plant physiological mechanisms. The structural equation modeling framework provides transformative capabilities that address core challenges in contemporary agriculture through three interconnected dimensions: operational scalability, environmental sustainability, and economic efficiency. At the operational level, our methodology enables precise nitrogen management by establishing physiological links between observable foliar traits and final yield outcomes, allowing for stage-specific interventions throughout the crop cycle. This represents a significant advancement over conventional empirical approaches, as our system leverages high-resolution spectral data to produce spatially explicit yield predictions via remote sensing. The environmental benefits are particularly noteworthy. By quantifying the precise relationships between leaf nitrogen status and ultimate tuber yield, our model provides a solution to optimize fertilizer application, thereby reducing the environmental footprint of potato cultivation while maintaining productivity. This addresses the well-documented challenge of excessive nitrogen use, which not only diminishes nitrogen-use efficiency but also contributes to environmental degradation through nutrient runoff and greenhouse gas emissions [49]. From an economic perspective, the model’s ability to transform complex spectral data into actionable agronomic recommendations lowers the technological barrier for precision agriculture adoption. Farmers can utilize these insights to optimize input costs (e.g., fertilizers and water) by precisely matching application rates to crop requirements.
Looking forward, this framework allows for the incorporation of additional variables such as soil conditions (e.g., nitrogen and water content), water availability, and pest pressure [50]. This expandability, combined with the system’s capacity for continuous improvement through feedback loops between predictions and field outcomes, positions our approach as a platform for the evolution of precision agriculture. By maintaining physiological interpretability while delivering practical decision-support tools, our methodology effectively bridges the gap between advanced analytics and real-world farming applications.

5.4. Future Research

Future research can be conducted in the following two directions:
(1) Mechanisms of hyperspectral remote sensing for belowground potato yield traits at canopy scales. This study investigated the mechanisms of hyperspectral remote sensing for estimating belowground yield traits in potatoes, focusing on leaf-scale spectral data. We specifically examined the relationships between foliar biochemicals and belowground yield traits. However, to extend these findings to practical applications, future research requires scaling up to the canopy level. Transitioning to canopy-scale investigations introduces critical considerations regarding canopy structural influences. Key structural parameters such as leaf area index and biomass significantly modulate spectral signals [51,52] and correlate with yield traits [9,48], and thus must be incorporated into future analyses. We anticipate that explicitly integrating these canopy structural parameters into the structural equation modeling (SEM) framework will improve model performance.
(2) Integration of crop growth models into potato yield trait prediction. The current data-driven SEM approach showed limitations in predicting certain yield traits (e.g., tuber starch and water content). To address this, we propose incorporating process-based crop growth models (e.g., SUBSTOR-potato, DSSAT, SOLANUM, APSIM, and AquaCrop) that simulate physiological processes governing tuber development [48]. These mechanistic models offer distinct advantages for predicting yield traits across diverse growing conditions. However, their implementation requires careful consideration of additional input parameters (weather data, soil properties, and cultivar characteristics) and extensive field data for model calibration. A hybrid approach combining remote sensing data with crop growth model outputs may provide the most robust framework for yield prediction [48].

6. Conclusions

This study investigated the fundamental mechanisms governing hyperspectral remote sensing retrieval of potato yield traits. Our results demonstrated that both nitrogen application rates and cultivar selection significantly influence foliar biochemical composition and subsequent yield characteristics. By establishing and analyzing the causal relationships between foliar biochemistry and yield traits, we developed a framework for retrieving yield parameters from spectral data. The comparative evaluation revealed distinct advantages and limitations for both direct and indirect inversion approaches. The direct method demonstrated particular strengths in prediction accuracy, while the indirect approach provided greater mechanistic understanding by explicitly modeling the biochemical pathways linking spectral features to yield formation.

Author Contributions

Conceptualization, N.L.; methodology, W.C., Y.H. and N.L.; software, W.C., Y.H. and N.L.; validation, W.C., Y.H. and N.L.; formal analysis, W.C., Y.H. and N.L.; investigation, W.C., Y.H. and N.L.; data curation, W.C., Y.H., W.T., Y.D., C.Y., X.Z., J.S. and N.L.; writing—original draft preparation, W.T., Y.H. and N.L.; writing—review and editing, W.T., Y.H. and N.L.; visualization, W.T., Y.H. and N.L.; supervision, N.L.; project administration, N.L.; funding acquisition, N.L. All authors have read and agreed to the published version of the manuscript.

Funding

This research was funded by the Guangzhou Key Research and Development Program (2024B03J1266) and the Guangdong Basic and Applied Basic Research Foundation (2022A1515110575 and 2023A1515011406).

Data Availability Statement

Data could be shared upon request to the corresponding author.

Acknowledgments

We would like to express our gratitude for the valuable suggestions provided by two anonymous reviewers and the editor.

Conflicts of Interest

The authors declare no conflict of interest.

Appendix A

Yield exhibited distinct spectral correlations across growth stages: negative with shortwave infrared (SWIR, 1200–1600 nm) during tuber formation but positive with visible (VIS, 400–700 nm) during both tuber swelling and maturity stages. Dry matter content showed contrasting patterns—negative correlations with near-infrared (NIR, 1300–1500 nm) during formation, positive with visible-to-near-infrared (VNIR) at maturity, and negative with NIR during swelling. Moisture content demonstrated particularly strong negative correlations with SWIR (1400–1600 nm) during formation and maturity stages, while showing positive correlations with NIR (800–1000 nm) specifically during swelling.
Protein content revealed positive correlations with 400–500 nm during formation and negative correlations with 1700–2000 nm at maturity, though no significant relationships emerged during swelling. For biomass parameters, fresh weight correlated negatively with 1100–1400 nm at maturity and positively with 500–700 nm during swelling, while dry weight showed negative correlations with 1300–1500 nm during formation and positive correlations with 400–600 nm at maturity—neither displayed significant swelling-stage correlations.
Tuber number maintained positive correlations with 700–900 nm during formation and negative correlations with 1600–1800 nm at maturity, without swelling-stage significance. Starch content showed particularly strong positive correlations with 1700–1900 nm at maturity alongside negative swelling-stage correlations with 600–800 nm, while the formation stage showed no significant spectral relationships.
Figure A1. The relationship between yield traits (Yield, DMtuber, Watertuber, Proteintuber, FWtuber, DWtuber, Count, and Starchtuber) and leaf spectra at different growth stages.
Remotesensing 17 02097 g0a1

References

  1. FAO. A Guide to the International Day of Potato 2024; Foods and Agriculture Organization of the United Nations: Rome, Italy, 2024. [Google Scholar]
  2. Chivasa, W.; Mutanga, O.; Biradar, C. Application of Remote Sensing in Estimating Maize Grain Yield in Heterogeneous African Agricultural Landscapes: A Review. Int. J. Remote Sens. 2017, 38, 6816–6845. [Google Scholar] [CrossRef]
  3. Chang, D.C.; Hur, O.S.; Park, C.S.; Kim, S.Y. Field Performance, Yield Components and Nitrogen Utilization Efficiency of Potato Plants Grown from Hydroponic Small Tubers. Hortic. Environ. Biotechnol. 2011, 52, 369–375. [Google Scholar] [CrossRef]
  4. Kammlade, S.M. Potato Tuber Yield, Quality, Mineral Nutrient Concentration, Soil Health and Soil Food Web in Conventional and Organic Potato Systems. Master’s Thesis, Colorado State University, Fort Collins, CO, USA, 2015. [Google Scholar]
  5. Liu, N.; Townsend, P.A.; Naber, M.R.; Bethke, P.C.; Hills, W.B.; Wang, Y. Hyperspectral Imagery to Monitor Crop Nutrient Status Within and Across Growing Seasons. Remote Sens. Environ. 2021, 255, 112303. [Google Scholar] [CrossRef]
  6. Bala, S.K.; Islam, A.S. Correlation Between Potato Yield and MODIS-derived Vegetation Indices. Int. J. Remote Sens. 2009, 30, 2491–2507. [Google Scholar] [CrossRef]
  7. Gómez, D.; Salvador, P.; Sanz, J.; Casanova, J.L. Potato Yield Prediction Using Machine Learning Techniques and Sentinel 2 Data. Remote Sens. 2019, 11, 1745. [Google Scholar] [CrossRef]
  8. Li, B.; Xu, X.; Zhang, L.; Han, J.; Bian, C.; Li, G.; Liu, J.; Jin, L. Above-Ground Biomass Estimation and Yield Prediction in Potato by Using UAV-Based RGB and Hyperspectral Imaging. ISPRS J. Photogramm. Remote Sens. 2020, 162, 161–172. [Google Scholar] [CrossRef]
  9. Luo, S.; He, Y.; Li, Q.; Jiao, W.; Zhu, Y.; Zhao, X. Nondestructive Estimation of Potato Yield Using Relative Variables Derived from Multi-Period LAI and Hyperspectral Data Based on Weighted Growth Stage. Plant Methods 2020, 16, 150. [Google Scholar] [CrossRef]
  10. Nigon, T.J. Aerial Imagery and Other Non-Invasive Approaches to Detect Nitrogen and Water Stress in A Potato Crop; University of Minnesota: Minneapolis, MN, USA, 2012; ISBN 1-267-86282-3. [Google Scholar]
  11. Salvador, P.; Gómez, D.; Sanz, J.; Casanova, J.L. Estimation of Potato Yield Using Satellite Data at a Municipal Level: A Machine Learning Approach. Int. J. Geo-Inf. 2020, 9, 343. [Google Scholar] [CrossRef]
  12. Maimaitijiang, M.; Sagan, V.; Sidike, P.; Hartling, S.; Esposito, F.; Fritschi, F.B. Soybean Yield Prediction from UAV Using Multimodal Data Fusion and Deep Learning. Remote Sens. Environ. 2020, 237, 111599. [Google Scholar] [CrossRef]
  13. Torgbor, B.A.; Rahman, M.M.; Brinkhoff, J.; Sinha, P.; Robson, A. Integrating Remote Sensing and Weather Variables for Mango Yield Prediction Using a Machine Learning Approach. Remote Sens. 2023, 15, 3075. [Google Scholar] [CrossRef]
  14. Guan, K.; Wu, J.; Kimball, J.S.; Anderson, M.C.; Frolking, S.; Li, B.; Hain, C.R.; Lobell, D.B. The Shared and Unique Values of Optical, Fluorescence, Thermal and Microwave Satellite Data for Estimating Large-Scale Crop Yields. Remote Sens. Environ. 2017, 199, 333–349. [Google Scholar] [CrossRef]
  15. Sun, C.; Feng, L.; Zhang, Z.; Ma, Y.; Crosby, T.; Naber, M.; Wang, Y. Prediction of End-Of-Season Tuber Yield and Tuber Set in Potatoes Using In-Season UAV-Based Hyperspectral Imagery and Machine Learning. Sensors 2020, 20, 5293. [Google Scholar] [CrossRef] [PubMed]
  16. Abrougui, K.; Gabsi, K.; Mercatoris, B.; Khemis, C.; Amami, R.; Chehaibi, S. Prediction of Organic Potato Yield Using Tillage Systems and Soil Properties by Artificial Neural Network (ANN) and Multiple Linear Regressions (MLR). Soil Tillage Res. 2019, 190, 202–208. [Google Scholar] [CrossRef]
  17. Ebrahimy, H.; Wang, Y.; Zhang, Z. Utilization of Synthetic Minority Oversampling Technique for Improving Potato Yield Prediction Using Remote Sensing Data and Machine Learning Algorithms with Small Sample Size of Yield Data. ISPRS J. Photogramm. Remote Sens. 2023, 201, 12–25. [Google Scholar] [CrossRef]
  18. Sagan, V.; Maimaitijiang, M.; Bhadra, S.; Maimaitiyiming, M.; Brown, D.R.; Sidike, P.; Fritschi, F.B. Field-Scale Crop Yield Prediction Using Multi-Temporal WorldView-3 and PlanetScope Satellite Data and Deep Learning. ISPRS J. Photogramm. Remote Sens. 2021, 174, 265–281. [Google Scholar] [CrossRef]
  19. Tedesco, D.; Almeida Moreira, B.R.D.; Barbosa Júnior, M.R.; Papa, J.P.; Silva, R.P.D. Predicting on Multi-Target Regression for the Yield of Sweet Potato by the Market Class of Its Roots upon Vegetation Indices. Comput. Electron. Agric. 2021, 191, 106544. [Google Scholar] [CrossRef]
  20. Rattanasopa, K.; Saengprachatanarug, K.; Wongpichet, S.; Posom, J.; Saikaew, K.; Ungsathittavorn, K.; Pilawut, S.; Chinapas, A.; Taira, E. UAV-Based Multispectral Imagery for Estimating Cassava Tuber Yields. Eng. Agric. Environ. Food 2022, 15, 1–12. [Google Scholar] [CrossRef]
  21. Njane, S.N.; Tsuda, S.; Sugiura, R.; Katayama, K.; Goto, K.; Tsuchiya, S.; Tsuji, H. Phenotyping System for Precise Monitoring of Potato Crops during Growth. Eng. Agric. Environ. Food 2023, 16, 24–36. [Google Scholar] [CrossRef]
  22. Hoque, M.J.; Islam, M.S.; Uddin, J.; Samad, M.A.; De Abajo, B.S.; Vargas, D.L.R.; Ashraf, I. Incorporating Meteorological Data and Pesticide Information to Forecast Crop Yields Using Machine Learning. IEEE Access 2024, 12, 47768–47786. [Google Scholar] [CrossRef]
  23. Sharma, S.K.; Sharma, D.P.; Verma, J.K. Study on Machine-Learning Algorithms in Crop Yield Predictions Specific to Indian Agricultural Contexts. In Proceedings of the 2021 International Conference on Computational Performance Evaluation (ComPE), Shillong, India, 1 December 2021; pp. 155–166. [Google Scholar]
  24. Nnadozie, E.C.; Iloanusi, O.N.; Ani, O.A.; Yu, K. Detecting Cassava Plants under Different Field Conditions Using UAV-Based RGB Images and Deep Learning Models. Remote Sens. 2023, 15, 2322. [Google Scholar] [CrossRef]
  25. Wellens, J.; Raes, D.; Fereres, E.; Diels, J.; Coppye, C.; Adiele, J.G.; Ezui, K.S.G.; Becerra, L.-A.; Selvaraj, M.G.; Dercon, G.; et al. Calibration and Validation of the FAO AquaCrop Water Productivity Model for Cassava (Manihot Esculenta Crantz). Agric. Water Manag. 2022, 263, 107491. [Google Scholar] [CrossRef]
  26. Fan, Y.; Liu, Y.; Yue, J.; Jin, X.; Chen, R.; Bian, M.; Ma, Y.; Yang, G.; Feng, H. Estimation of Potato Yield Using a Semi-Mechanistic Model Developed by Proximal Remote Sensing and Environmental Variables. Comput. Electron. Agric. 2024, 223, 109117. [Google Scholar] [CrossRef]
  27. Singh, K.; Huang, Y.; Young, W.; Harvey, L.; Hall, M.; Zhang, X.; Lobaton, E.; Jenkins, J.; Shankle, M. Sweet Potato Yield Prediction Using Machine Learning Based on Multispectral Images Acquired from a Small Unmanned Aerial Vehicle. Agriculture 2025, 15, 420. [Google Scholar] [CrossRef]
  28. Wang, H.; Cheng, M.; Liao, Z.; Guo, J.; Zhang, F.; Fan, J.; Feng, H.; Yang, Q.; Wu, L.; Wang, X. Performance Evaluation of AquaCrop and DSSAT-SUBSTOR-Potato Models in Simulating Potato Growth, Yield and Water Productivity under Various Drip Fertigation Regimes. Agric. Water Manag. 2023, 276, 108076. [Google Scholar] [CrossRef]
  29. Li, Y.; Wang, J.; Tang, J.; Wang, E.; Pan, Z.; Pan, X.; Hu, Q. Optimum Planting Date and Cultivar Maturity to Optimize Potato Yield and Yield Stability in North China. Field Crops Res. 2021, 269, 108179. [Google Scholar] [CrossRef]
  30. Camino, C.; Araño, K.; Berni, J.A.; Dierkes, H.; Trapero-Casas, J.L.; León-Ropero, G.; Montes-Borrego, M.; Roman-Écija, M.; Velasco-Amo, M.P.; Landa, B.B.; et al. Detecting Xylella Fastidiosa in a Machine Learning Framework Using Vcmax and Leaf Biochemistry Quantified with Airborne Hyperspectral Imagery. Remote Sens. Environ. 2022, 282, 113281. [Google Scholar] [CrossRef]
  31. Dechant, B.; Cuntz, M.; Vohland, M.; Schulz, E.; Doktor, D. Estimation of Photosynthesis Traits from Leaf Reflectance Spectra: Correlation to Nitrogen Content as the Dominant Mechanism. Remote Sens. Environ. 2017, 196, 279–292. [Google Scholar] [CrossRef]
  32. Lopatin, J.; Kattenborn, T.; Galleguillos, M.; Perez-Quezada, J.F.; Schmidtlein, S. Using Aboveground Vegetation Attributes as Proxies for Mapping Peatland Belowground Carbon Stocks. Remote Sens. Environ. 2019, 231, 111217. [Google Scholar] [CrossRef]
  33. Watt, M.S.; Buddenbaum, H.; Leonardo, E.M.C.; Estarija, H.J.; Bown, H.E.; Gomez-Gallego, M.; Hartley, R.J.L.; Pearse, G.D.; Massam, P.; Wright, L.; et al. Monitoring Biochemical Limitations to Photosynthesis in N and P-Limited Radiata Pine Using Plant Functional Traits Quantified from Hyperspectral Imagery. Remote Sens. Environ. 2020, 248, 112003. [Google Scholar] [CrossRef]
  34. Hu, L.; Bentler, P.M. Cutoff Criteria for Fit Indexes in Covariance Structure Analysis: Conventional Criteria versus New Alternatives. Struct. Equ. Model. A Multidiscip. J. 1999, 6, 1–55. [Google Scholar] [CrossRef]
  35. Warren, C.R.; Dreyer, E.; Adams, M.A. Photosynthesis-Rubisco Relationships in Foliage of Pinus Sylvestris in Response to Nitrogen Supply and the Proposed Role of Rubisco and Amino Acids as Nitrogen Stores. Trees 2003, 17, 359–366. [Google Scholar] [CrossRef]
  36. Nurmanov, Y.T.; Chernenok, V.G.; Kuzdanova, R.S. Potato in Response to Nitrogen Nutrition Regime and Nitrogen Fertilization. Field Crops Res. 2019, 231, 115–121. [Google Scholar] [CrossRef]
  37. Schlüter, U.; Mascher, M.; Colmsee, C.; Scholz, U.; Bräutigam, A.; Fahnenstich, H.; Sonnewald, U. Maize Source Leaf Adaptation to Nitrogen Deficiency Affects Not Only Nitrogen and Carbon Metabolism But Also Control of Phosphate Homeostasis. Plant Physiol. 2012, 160, 1384–1406. [Google Scholar] [CrossRef] [PubMed]
  38. Xie, J.; Li, M.; Shi, M.; Kang, Y.; Zhang, R.; Wang, Y.; Zhang, W.; Qin, S. Effects of Potassium Fertilizer Base/Topdressing Ratio on Dry Matter Quality, Photosynthetic Fluorescence Characteristics and Carbon and Nitrogen Metabolism of Potato. Potato Res. 2024, 68, 835–853. [Google Scholar] [CrossRef]
  39. Xu, Y.; Zhang, K.; Li, S.; Zhou, Y.; Ran, S.; Xu, R.; Lin, Y.; Shen, L.; Huang, W.; Zhong, F. Carbon and Nitrogen Metabolism in Tomato (Solanum Lycopersicum L.) Leaves Response to Nitrogen Treatment. Plant Growth Regul 2023, 100, 747–756. [Google Scholar] [CrossRef]
  40. Loreti, E.; Van Veen, H.; Perata, P. Plant Responses to Flooding Stress. Curr. Opin. Plant Biol. 2016, 33, 64–71. [Google Scholar] [CrossRef]
  41. Patel, M.K.; Pandey, S.; Burritt, D.J.; Tran, L.-S.P. Plant Responses to Low-Oxygen Stress: Interplay between ROS and NO Signaling Pathways. Environ. Exp. Bot. 2019, 161, 134–142. [Google Scholar] [CrossRef]
  42. Mommer, L.; Visser, E.J.W. Underwater Photosynthesis in Flooded Terrestrial Plants: A Matter of Leaf Plasticity. Ann. Bot. 2005, 96, 581–589. [Google Scholar] [CrossRef]
  43. Peng, Y.; Zhou, Z.; Tong, R.; Hu, X.; Du, K. Anatomy and Ultrastructure Adaptations to Soil Flooding of Two Full-Sib Poplar Clones Differing in Flood-Tolerance. Flora 2017, 233, 90–98. [Google Scholar] [CrossRef]
  44. Sharkey, T.D. The End Game(s) of Photosynthetic Carbon Metabolism. Plant Physiol. 2024, 195, 67–78. [Google Scholar] [CrossRef]
  45. Li, D.; Miao, Y.; Gupta, S.K.; Rosen, C.J.; Yuan, F.; Wang, C.; Wang, L.; Huang, Y. Improving Potato Yield Prediction by Combining Cultivar Information and UAV Remote Sensing Data Using Machine Learning. Remote Sens. 2021, 13, 3322. [Google Scholar] [CrossRef]
  46. El-Kenawy, E.-S.M.; Alhussan, A.A.; Khodadadi, N.; Mirjalili, S.; Eid, M.M. Predicting Potato Crop Yield with Machine Learning and Deep Learning for Sustainable Agriculture. Potato Res. 2024, 68, 759–792. [Google Scholar] [CrossRef]
  47. Liu, Y.; Feng, H.; Fan, Y.; Yue, J.; Yang, F.; Fan, J.; Ma, Y.; Chen, R.; Bian, M.; Yang, G. Utilizing UAV-Based Hyperspectral Remote Sensing Combined with Various Agronomic Traits to Monitor Potato Growth and Estimate Yield. Comput. Electron. Agric. 2025, 231, 109984. [Google Scholar] [CrossRef]
  48. Lin, Y.; Li, S.; Duan, S.; Ye, Y.; Li, B.; Li, G.; Lyv, D.; Jin, L.; Bian, C.; Liu, J. Methodological Evolution of Potato Yield Prediction: A Comprehensive Review. Front. Plant Sci. 2023, 14, 1214006. [Google Scholar] [CrossRef]
  49. Wei, Q.; Yin, Y.; Tong, Q.; Gong, Z.; Shi, Y. Multi-Omics Analysis of Excessive Nitrogen Fertilizer Application: Assessing Environmental Damage and Solutions in Potato Farming. Ecotoxicol. Environ. Saf. 2024, 284, 116916. [Google Scholar] [CrossRef]
  50. Cooper, M.; Voss-Fels, K.P.; Messina, C.D.; Tang, T.; Hammer, G.L. Tackling G × E × M Interactions to Close On-Farm Yield-Gaps: Creating Novel Pathways for Crop Improvement by Predicting Contributions of Genetics and Management to Crop Productivity. Theor. Appl. Genet. 2021, 134, 1625–1644. [Google Scholar] [CrossRef]
  51. Lin, Y.; Liu, S.; Yan, L.; Yan, K.; Zeng, Y.; Yang, B. Improving the Estimation of Canopy Structure Using Spectral Invariants: Theoretical Basis and Validation. Remote Sens. Environ. 2023, 284, 113368. [Google Scholar] [CrossRef]
  52. Yang, P. Exploring the Interrelated Effects of Soil Background, Canopy Structure and Sun-Observer Geometry on Canopy Photochemical Reflectance Index. Remote Sens. Environ. 2022, 279, 113133. [Google Scholar] [CrossRef]
Figure 1. Study site and experimental design. (A) Location of the study site. (B) Field experimental design. (C) Monthly average temperature and cumulative precipitation at the study site.
Remotesensing 17 02097 g001
Figure 2. A conceptual framework illustrating the direct and indirect inversion approaches for predicting belowground yield traits.
Remotesensing 17 02097 g002
Figure 3. Conceptual structural equation model (SEM) depicting the relationship between foliar biochemistries and yield traits. Arrows indicate causal paths among variables, with arrow widths representing the magnitude of path coefficients.
Remotesensing 17 02097 g003
Figure 4. Comparison of aboveground foliar biochemistries among five nitrogen treatments (N1–5: 220, 250, 350, 400, and 440 kg·ha−1·N) across three growth stages (tuber formation (6 January 2024), expansion (16 January 2024), and maturity (21 February 2024). Measured foliar traits include leaf nitrogen content, LMA, EWT, and chlorophyll-a and -b content. For traits exhibiting statistically significant variation (p < 0.05), means were ranked in descending order using Tamhane’s T2 post hoc test (indicated by lowercase letters a, b).
Remotesensing 17 02097 g004
Figure 5. Comparison of aboveground foliar biochemistries among four potato cultivars (Kunyuan, Taihe, V7, and Xuechuan) across three growth stages (tuber formation (6 January 2024), expansion (16 January 2024), and maturity (21 February 2024)). Measured foliar traits include leaf nitrogen content, LMA, EWT, and chlorophyll-a and -b content. For traits exhibiting statistically significant variation (p < 0.05), means were ranked in descending order using Tamhane’s T2 post hoc test (indicated by lowercase letters a, b).
Remotesensing 17 02097 g005
Figure 6. Comparison of yield traits among five nitrogen treatments (N1–5: 220, 250, 350, 400, and 440 kg·ha−1·N) across three growth stages (tuber formation (6 January 2024), expansion (16 January 2024), and maturity (21 February 2024)). Potato yield traits include tuber dry matter, water, starch and protein contents, number of tubers per plant, fresh and dry weight per tuber, and yield per plant. For traits exhibiting statistically significant variation, values were ranked in descending order using Tamhane’s T2 post hoc test (indicated by lowercase letters a–c).
Remotesensing 17 02097 g006
Figure 7. Comparison of yield traits among four potato cultivars (Kunyuan, Taihe No. 6, V7 and Xuechuan) across three growth stages: tuber formation (6 January 2024), expansion (16 January 2024), and maturity (21 February 2024). Potato yield traits include tuber dry matter, water, starch and protein contents, number of tubers per plant, fresh and dry weight per tuber, and yield per plant. For traits exhibiting statistically significant variation (p < 0.05), values were ranked in descending order using Tamhane’s T2 post hoc test (indicated by lowercase letters a, b).
Remotesensing 17 02097 g007
Figure 8. The structural equation model (SEM) between aboveground foliar biochemistries (green rectangles) and belowground yield traits (yellow rectangles). Values along arrows are the direct effect (blue arrows: positive effect; red arrows: negative effect) coefficients between variables. R2 indicates the model’s prediction accuracy for belowground yield traits. Line width indicates the strength of causal effects or correlations among variables. *: p < 0.05; ***: p < 0.001.
Remotesensing 17 02097 g008
Figure 9. The direct (yellow bars), indirect (red bars), and total effects (blue bars) of aboveground foliar biochemistries (chlorophyll, water, and nitrogen contents) on belowground yield traits (dry weight per tuber, fresh weight per tuber, tuber protein content, starch content, water content, and tuber yield per plant).
Remotesensing 17 02097 g009
Table 1. Statistics of aboveground foliar biochemistries and belowground yield traits.
(A) Aboveground Foliar Biochemistries
ParametersAbbr.UnitMinMaxMeanStd.
Chlorophyll-a and -bChlorophyllabmg·cm−214.2894.2835.649.15
Equivalent water thicknessEWTg·m−2233.05474.59304.4948.95
Leaf mass per areaLMAg·m−217.4476.3136.079.81
Nitrogen contentNitrogenleafg·kg−128.2652.5241.986.24
(B) Belowground Tuber Yield Traits
ParametersAbbr.UnitMinMaxMeanStd.
Total yield per plantYieldg66.603224.50871.45849.41
Fresh weight per tuberFWtuberg9.51347.0091.0979.21
Dry weight per tuberDWtuberg1.1384.5517.0818.27
Number of tubersCount-2199.702.90
Water contentWatertuber%71.1490.5083.873.57
Dry matter contentDMtuber%9.5028.8616.133.57
Starch contentStarchtuberg·kg−129.11199.09105.5732.75
Protein contentProteintuberg·kg−149.23388.41184.51132.87
Table 2. The optimization ranges and settings of model parameters.
ModelsParametersOptimization Range/Setting
PLSRLatent variables1, 2, …, 30
SVRKernel functionRBF
Regularization parameter2−15, 2−14, …, 216
Kernel coefficient2−5, 2−4, …, 26
Penalty coefficient10−5, 10−4, …,104
RFRNumber of trees100
Number of regression features1, 6, 11, …, one third of the number of spectral bands
Maximum tree depth10, 20, …, 90
Table 3. Goodness-of-fit indices for the structural equation model evaluating the relationships between aboveground foliar traits and belowground yield traits in potato plants. RMSEA: root mean square error of approximation; χ2/df: chi-square to degrees of freedom ratio; TLI: Tucker–Lewis index; CFI: comparative fit index; NFI: normed fit index; IFI: incremental fit index; AIC: Akaike information criterion; BIC: Bayesian information criterion [34].
IndicesCriteria for Good FittingValue
RMSEA<0.050.041
χ2/df<31.245
TLI>0.90.996
CFI>0.90.999
NFI>0.90.993
IFI>0.90.999
AIC-613.276
BIC-747.229
Table 4. Performance of PLSR, SVR, and RFR models in predicting belowground yield traits, including fresh tuber weight (in g), dry tuber weight (in g), total yield (in g), tuber dry matter content (in %), tuber protein content (in g·kg−1), tuber starch content (g·kg−1), tuber water content (in %). RMSE: root mean square error; RRMSE: normalized RMSE (%).
ModelMetricsFresh WeightDry weightYieldCountDry MatterProteinStarchWater
PLSRR20.630.690.580.020.150.840.010.26
RMSE53.269.88591.432.873.4951.3437.613.39
NRMSE48.3048.3658.0931.5722.2030.8535.504.08
SVRR20.600.700.590.030.120.690.000.19
RMSE56.389.66588.132.733.5668.6233.173.51
NRMSE51.1245.4757.7630.0322.5841.3731.314.22
RFRR20.630.710.690.210.110.650.030.26
RMSE52.409.34507.852.503.3673.1236.943.40
NRMSE47.5245.7049.8827.5621.3744.7534.874.09
Table 5. Performance of PLSR, SVR, and RFR models in predicting leaf parameters, including leaf chlorophyll-a and -b (in mg·cm−2), leaf nitrogen content (in %), leaf equivalent water thickness (in g·m−2), and leaf mass per area (in g·m−2). RMSE: root mean square error; NRMSE: normalized RMSE (%).
ParametersPLSRSVRRFR
R2RMSENRMSER2RMSENRMSER2RMSENRMSE
Chlorophyll0.306.9917.000.028.3020.000.297.0017.00
Nitrogen0.763.1514.000.056.4228.000.763.3414.00
EWT0.7826.5513.000.0853.0826.000.7529.1014.00
LMA0.476.9819.000.019.6226.000.467.2419.00
Table 6. Performance of indirect models in predicting belowground yield traits, including fresh tuber weight (in g), dry tuber weight (in g), total yield (in g), tuber dry matter content (in %), tuber protein content (in g·kg−1), tuber starch content (g·kg−1), and tuber water content (in %). The indirect models integrated the statistical models (PLSR and RFR) of foliar biochemistries with the structural equation model (SEM) of foliar biochemistry–yield trait relationships (see Section 4.3). RMSE: root mean square error; NRMSE: normalized RMSE (%).
ModelMetricsFresh WeightDry WeightDry MatterYieldProteinStarchWater
PLSR + SEMR20.360.410.290.430.190.070.29
RMSE33.7510.5217.55494.0435.3320.3638.80
NRMSE10.0014.00119.0033.0011.0016.00263.00
RFR + SEMR20.310.290.350.450.160.040.35
RMSE28.376.087.85538.2122.82100.6136.03
NRMSE9.008.0053.0023.007.0077.00244.00
Disclaimer/Publisher’s Note: The statements, opinions and data contained in all publications are solely those of the individual author(s) and contributor(s) and not of MDPI and/or the editor(s). MDPI and/or the editor(s) disclaim responsibility for any injury to people or property resulting from any ideas, methods, instructions or products referred to in the content.

