Article

Modeling the 2023 Türkiye Earthquakes and Strain Accumulation Along the East Anatolian Fault Zone: Insights from InSAR, GNSS, and Small-Magnitude Seismicity, with Implications for the Seismic Potential at Rupture Terminations

by
Daniele Cheloni
1,*,
Nicola Angelo Famiglietti
2,
Aybige Akinci
1,
Riccardo Caputo
3 and
Annamaria Vicari
2
1
Istituto Nazionale di Geofisica e Vulcanologia, Via di Vigna Murata 605, 00143 Rome, Italy
2
Istituto Nazionale di Geofisica e Vulcanologia, Sezione Irpinia, 83035 Grottaminarda, Italy
3
Department of Physics & Earth Sciences, Ferrara University, 44121 Ferrara, Italy
*
Author to whom correspondence should be addressed.
Remote Sens. 2025, 17(13), 2270; https://doi.org/10.3390/rs17132270
Submission received: 18 April 2025 / Revised: 18 June 2025 / Accepted: 30 June 2025 / Published: 2 July 2025

Abstract

The 6 February 2023 MW 7.8 and MW 7.6 earthquakes in southeastern Türkiye ruptured more than 400 km of the East Anatolian Fault Zone (EAFZ), producing one of the most destructive seismic sequences in recent history. Here, we integrate InSAR data, a new GNSS velocity field, and small-magnitude earthquakes to investigate the coseismic deformation, rupture geometry, and interseismic strain accumulation along the EAFZ. Using elastic dislocation modeling with a variable-strike, multi-segment fault geometry, we constrain the slip distribution of the mainshocks, showing improved fits to the surface displacement compared to the planar fault model. The MW 7.8 event ruptured a number of fault segments over ~300 km, while the MW 7.6 event activated a more localized fault system with a peak slip exceeding 15 m. We also model two moderate events (MW 5.6 in 2020 and MW 5.3 in 2022) along the southwestern part of the Pütürge segment—an area not ruptured during the 2020 or 2023 sequences. GNSS-derived strain-rate and locking depth estimates reveal strong interseismic coupling and significant strain accumulation in this region, suggesting the potential for a future large earthquake (MW 6.6–7.1). Similarly, the Hatay region, at the southwestern termination of the 2023 rupture, shows a persistent strain accumulation and complex fault interactions involving the Dead Sea Fault and the Cyprus Arc. Our results demonstrate the importance of combining remote sensing and geodetic data to constrain fault kinematics, evaluate rupture segmentation, and assess the seismic hazard in tectonically active regions. Targeted monitoring at rupture terminations—such as the Pütürge and Hatay sectors—may be crucial for anticipating future large-magnitude earthquakes.

1. Introduction

Türkiye, located at the convergence of the African, Arabian, Eurasian, and Anatolian plates, is considered one of the regions with the highest seismic activity in the world. This tectonic setting leads to the existence of two major fault systems in Türkiye: the North Anatolian Fault Zone (NAFZ) and the East Anatolian Fault Zone (EAFZ). These fault systems account for most of the seismic hazards of the region. In particular, the ~1500 km long strike-slip NAFZ extends from the Marmara Sea in the W to Karliova in the E, accommodating about 18–25 mm/yr of right-lateral motion (e.g., [1]). The EAFZ is instead an ENE-striking ~600 km long left-lateral strike-slip fault, which accommodates the relative motion between the Arabian and Anatolian plates. This relative motion increased from 4 to 5 mm/yr in the southwest to approximately 10 mm/yr in the northeast (e.g., [1,2,3]). The EAFZ joins the NAFZ at the Karliova region, defining a triple junction (i.e., the Karliova triple junction). In regards to the EAFZ, which is the focus of our study, it consists of a major NE-trending transcurrent shear zone and a secondary E–W strand. As suggested by different authors (e.g., [4,5,6,7]), the former can be divided into a number of segments: from SW to NE they are the Amanos, Pazarcik, Erkenek, Pütürge, Palu, Ilica, and Karliova segments; while the major segments of the strand are, from W to E, the Savrun, Çardak, and Sürgü ones (Figure 1). Segment lengths vary, spanning from 30 km up to 100 km.
Many damaging earthquakes have been reported along both fault systems (e.g., [8]) over the past centuries as a result of the continuous interaction among the African, Arabian, Eurasian, and Anatolian plates. (Figure 1). While the NAFZ has been the source of many major surface-rupturing earthquakes, following a westward migration trend throughout the last hundred years (e.g., [5]), the EAFZ has experienced fewer such events (e.g., [8]). This difference in seismic activity between the North and East Anatolian Fault Zones can be attributed to several factors. One of the main reasons is that slip-rates along the NAFZ are significantly higher compared to the EAFZ, leading to a more rapid strain accumulation and more frequent releases associated with large earthquakes. Additionally, some studies have suggested that the EAFZ exhibits a more heterogeneous fault coupling (e.g., [9]), which may result in a more complex stress distribution and longer recurrence intervals for major earthquakes. For this reason, prior to the recent seismic sequences of Elazığ in 2020 (e.g., [10]) and the devastating Kahramanmaraş events in 2023 (e.g., [11,12,13,14,15,16,17,18,19,20,21,22,23,24]), some authors suggested the occurrence of significant seismic gaps along the EAFZ (e.g., [3,7,25]), including the 100 km long Amanos, the 80 km long Pazarcik, and the 95 km long Pütürge segments of the major strand, as well as the Sürgü (55 km long), Çardak (85 km long), and Savrun (60 km long) segments along the northern E–W strand (Figure 1). These gaps were considered potential sites for future large earthquakes, emphasizing the importance of ongoing monitoring to improve seismic hazard assessments.
The recent 2020 MW 6.8 Elazığ earthquake and the 2023 Kahramanmaraş doublet (MW 7.8 and MW 7.6) have ruptured almost all predicted segments of the EAFZ, except for the southwestern sector of the Pütürge segment (e.g., [10,12]). This unruptured section may still represent a seismic gap where accumulated stress could lead to a future earthquake, emphasizing the importance of further and more specific investigations. Historical earthquake studies indicate that large events have affected multiple segments of the EAFZ in the past. For instance, the Amanos segment experienced the 1822 M7.5 earthquake [26], the Pazarcık segment ruptured during the 1513 M7.4 event [27], the Erkenek segment was affected by the 1893 M7.2 earthquake [26], the Çardak segment on the northern strand experienced the 1544 M6.8 event [28], and the Palu segment experienced the 1789 M7.2 and the 1874 M7.1 earthquakes [26]. In contrast, the Pütürge segment may not have been fully ruptured by any linear morphogenic earthquake [29] in the last century, with only its eastern 45 km affected by the 2020 MW 6.8 Elazığ event [10]. The 2023 Kahramanmaraş seismic sequence also halted at the southwestern termination of the Pütürge segment (e.g., [12]), suggesting that this section could still store significant tectonic stress and remains a potential source for future seismic activity. In order to improve the evaluation of the seismic potential along the East Anatolian Fault Zone (EAFZ), it is therefore essential to define in detail the geometry of the rupture and the slip distribution from the 2020 Elazığ and 2023 Kahramanmaraş earthquakes, which have affected much of the EAFZ system, as these factors have a significant impact on ground motion amplitudes. Additionally, evaluating the strain accumulation and analyzing the recent seismicity in the area are essential steps for understanding its future seismic hazard.
In this study, we first examine a detailed dataset from Interferometric Synthetic Aperture Radar (InSAR) using ALOS-2 and Sentinel-1 satellite data and Global Navigation Satellite Systems (GNSSs) measurements to investigate the ground displacement field and to constrain, using elastic dislocation modeling, the geometry and slip distribution of the fault segments responsible for the main seismic events of the 2023 Kahramanmaraş seismic sequence. This analysis is validated by including data on the aftershock distribution and the known tectonic features of the region. Additionally, we examine two minor seismic events—the MW 5.6 earthquake on 4 August 2020 and the MW 5.3 earthquake on 9 April 2022—that occurred in the area between the February 2023 seismic sequence and the previous January 2020 MW 6.8 Elazığ earthquake. These smaller events were selected for analysis as they represent significant stress perturbations along the fault system yet notably did not trigger larger seismic events. By analyzing these earthquakes within the context of the 2020 and 2023 seismic sequences and evaluating the localized strain accumulation through interseismic velocity measurements from GNSS data, we aim to enhance our understanding of the region’s current seismotectonic behavior. This approach allows us to shed some light on how strain is accumulating along specific fault segments and provides insights into why certain segments, such as the Pütürge fault, may be particularly susceptible to future significant seismic events.
Figure 1. The seismotectonic setting of the study region. (a) The seismotectonic context prior to the 2020 Elazığ and 2023 Kahramanmaraş earthquake sequences. The solid lines represent the main fault segments of the East Anatolian Fault Zone (EAFZ), labeled as follows: (1) Amanos, (2) Pazarcık, (3) Erkenek, (4) Pütürge, (5) Palu, (6) Ilica, and (7) Çardak–Savrun (after [7]). Yellow stars indicate the epicenters of major historical earthquakes (M > 6.6), with labeled event dates [8,26,28]. Suggested seismic gaps are shown as ellipses: gray ellipses refer to gaps along the main strand of the EAFZ, while pink ellipses indicate gaps along its northern strand. White arrows indicate relative plate motion directions. (b) The recent seismic activity related to the 2020 and 2023 sequences. The solid red lines are the fault segments activated during the 2023 Kahramanmaraş seismic sequence [30], while the pink one depicts the segment ruptured during the 2020 Elazığ earthquake [10]. Seismicity: the blue circles are the relocated 2023 aftershock of the first month after the mainshock [31]; pink dots are the relocated 2020 Elazığ seismicity [32]; the red stars represent the location of the 2020–2023 main events provided by the AFAD and their moment tensor solutions (red beachballs). The dashed box highlights the area of the 2020 Elazığ earthquake. The inset shows the main fault systems in and around Türkiye (modified from [33]): NAFZ is the North Anatolian Fault Zone; EAFZ is the East Anatolian Fault Zone. Black arrows represent relative plate motions. The dashed box in the inset is the area of the main figure.
Remotesensing 17 02270 g001

2. Material and Methods

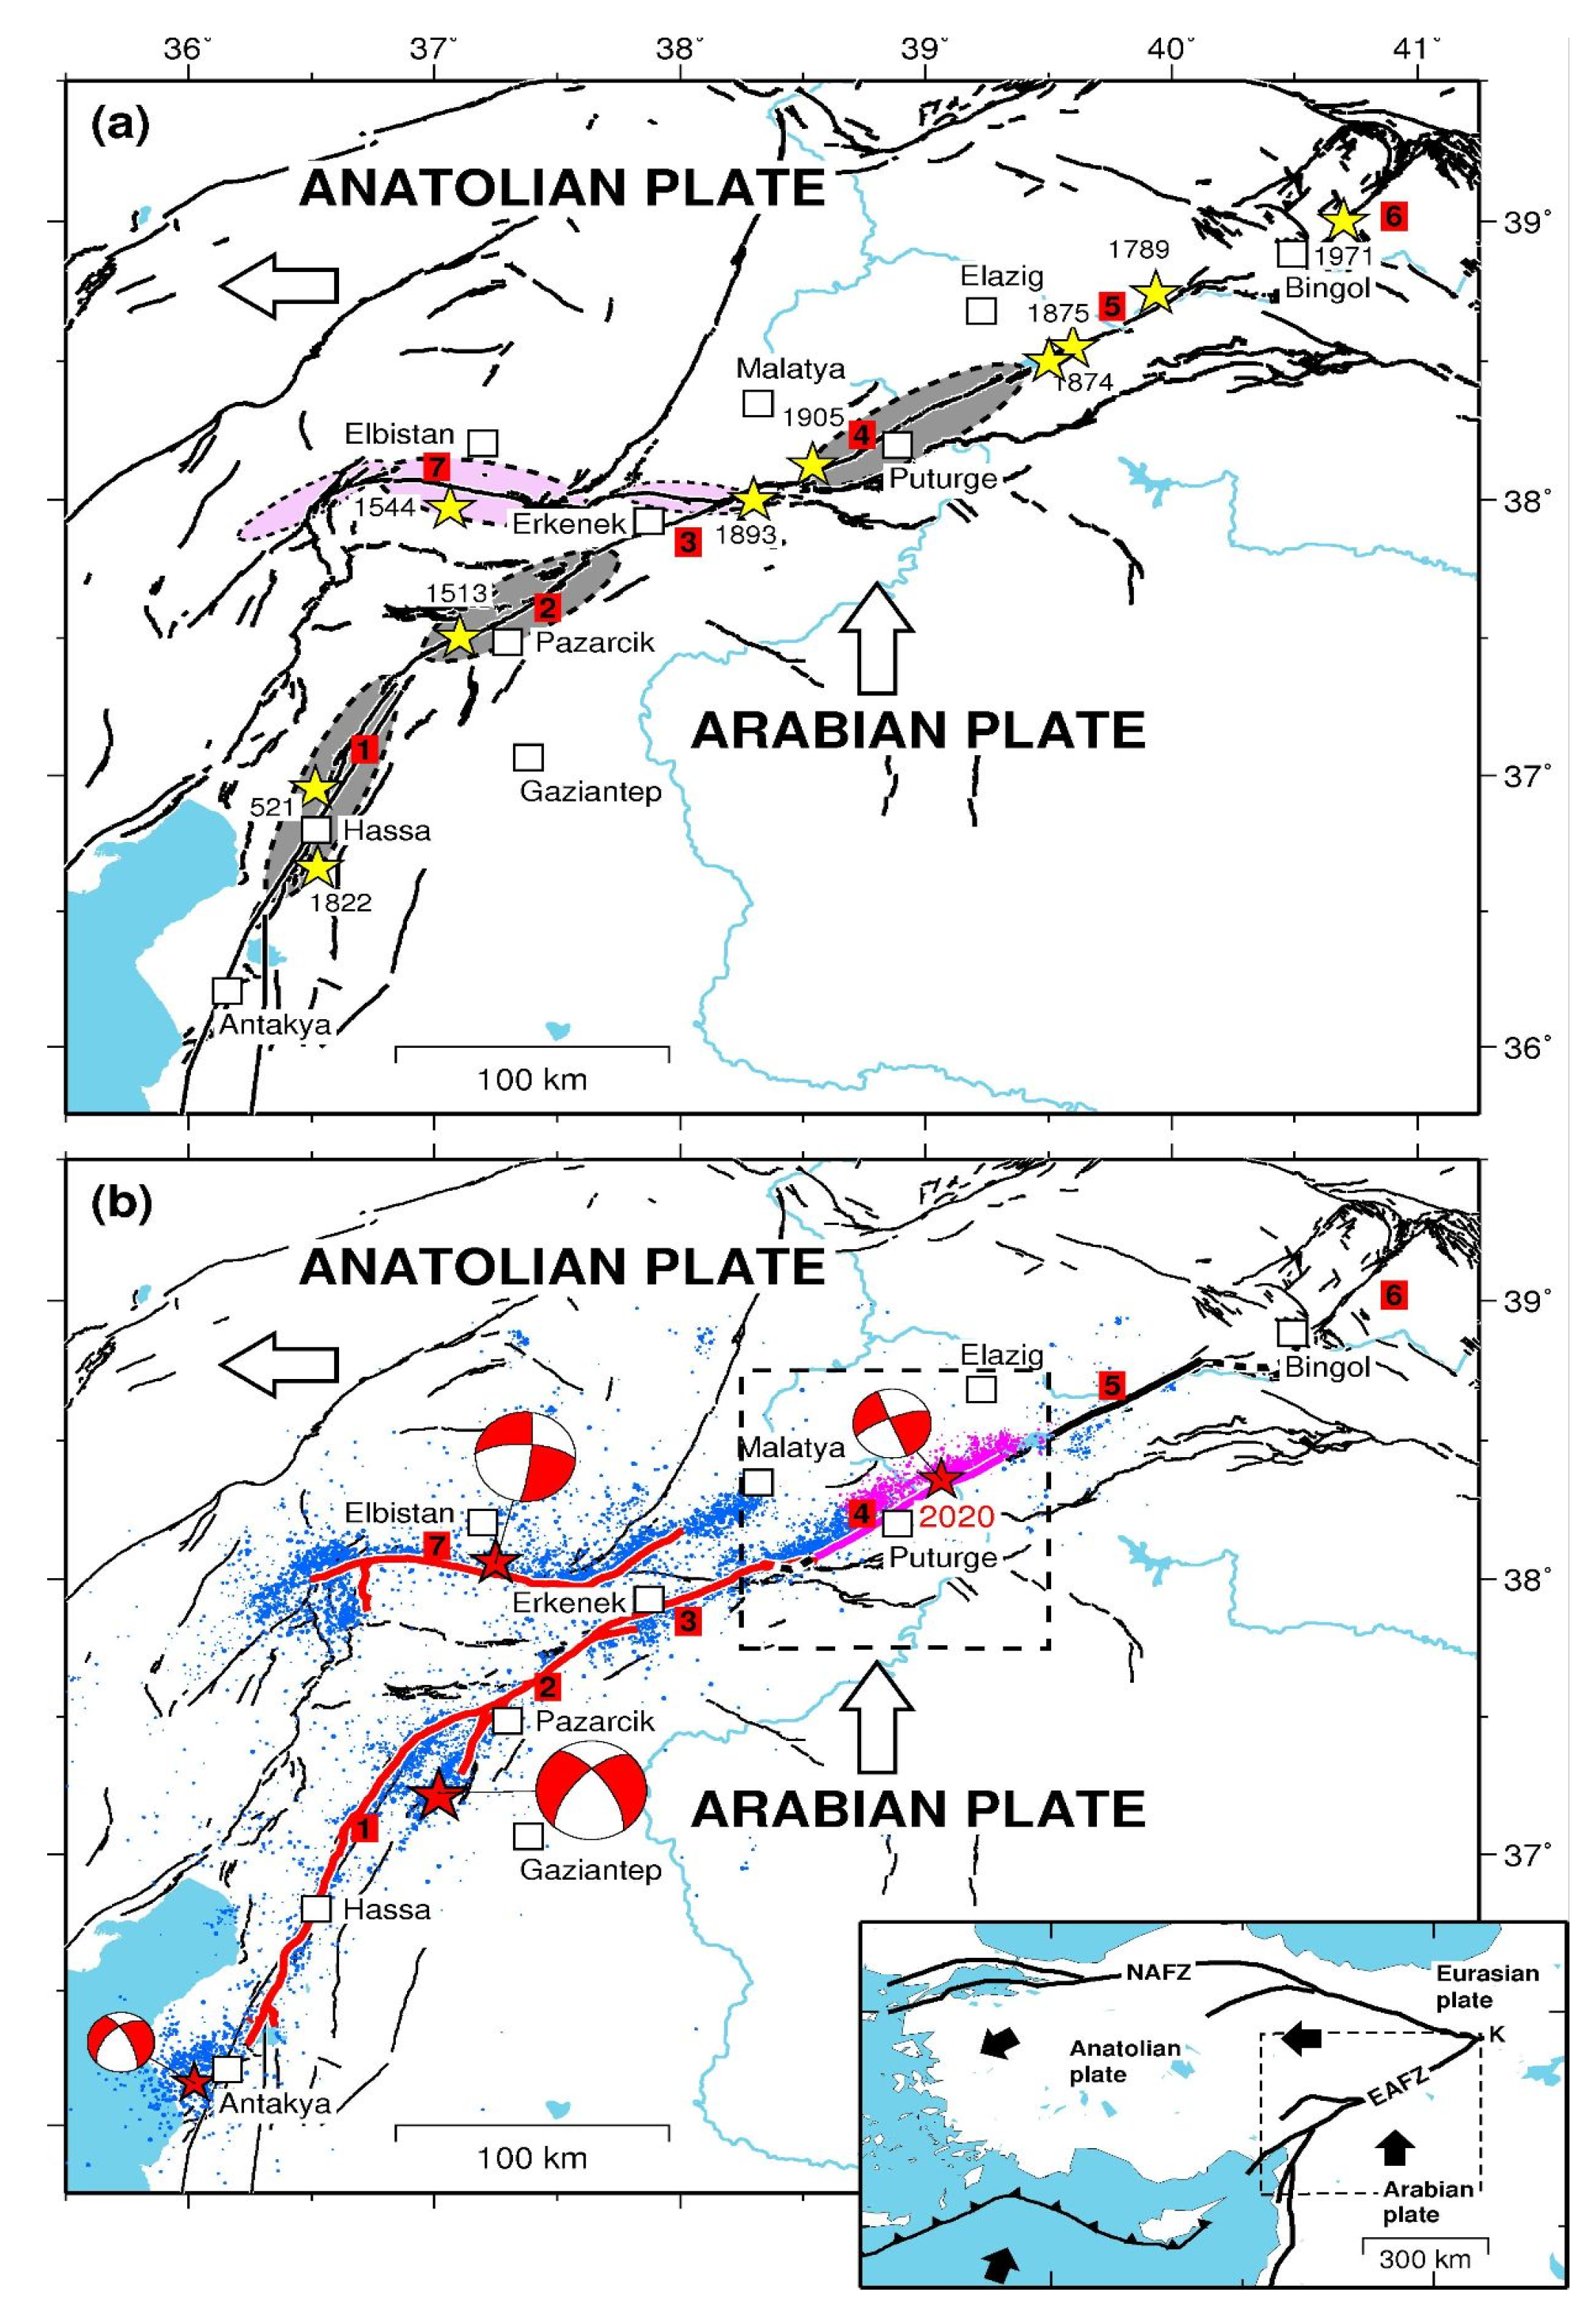
2.1. The 2020 MW 6.8 Elazığ and 2023 MW 7.8 and 7.6 Kahramanmaraş Seismic Sequences Along the EAFZ

The MW 6.8 Elazığ earthquake struck on 24 January 2020, at 17:55 UTC in eastern Türkiye, close to the town of Sivrice in Elazığ province. This earthquake was the first significant seismic event along the EAFZ in modern times to be recorded by advanced geodetic and seismological instruments, marking the end of a prolonged seismic quiescence on the main branch of the fault zone. It also partially filled one of the major seismic gaps previously identified by the authors (e.g., [7]) along the East Anatolian Fault’s main strand.
An intense sequence of aftershocks occurred following the mainshock [32], extending over a 50–60 km stretch of the EAFZ, from Sivrice to Pütürge, both ENE and WSW of the epicenter (Figure 1). Moment tensor solutions reveal left-lateral strike-slip faulting along a north–northwest dipping focal plane (Figure 1), which align with the relative movement between the Arabian and Anatolian plates, as shown by interseismic geodetic data [1,2,3]. Inversion of InSAR data (e.g., [10]) provided crucial information on the seismic source parameters of the mainshock: a left-lateral strike-slip fault with a 75°N–NW dip and a 242° ENE–WSW strike (50 km × 24 km), with an average coseismic slip of 1.3 m, corresponding to the Pütürge fault segment. The slip distribution (e.g., [10,32,34,35]) along the ~90 km long Pütürge segment reveals that the western part of the seismogenic fault did not rupture during the 2020 Elazığ seismic sequence. Moreover, this fault segment was subjected to positive stress as a result of the Coulomb stress increase following the MW 6.8 Elazığ mainshock [10].
The 2023 Kahramanmaraş seismic sequence began on 6 February at 01:17 UTC with a MW 7.8 earthquake in the Kahramanmaraş province of southeastern Türkiye, followed 9 h later by a MW 7.6 seismic event about 100 km to the north (Figure 1). These events caused significant casualties and widespread destruction in the areas around the epicenter. Both the earthquakes were reported to have occurred along the left-lateral strike-slip EAFZ (Figure 1). The epicenter of the MW 7.8 earthquake occurred near Pazarcık city in Kahramanmaraş province, approximately 35 km WNW of Gaziantep (Figure 1), with a focal depth ranging from 8 to 10 km (8.6 km according to AFAD and 10 km according to the United States Geological Survey, USGS). The epicenter of the MW 7.6 s large shock was located about 90 km to the north, near Elbistan city (Figure 1). Fault plane solutions for both mainshocks [36] indicate the activation of left-lateral strike-slip faults, consistent with the direction of crustal shear characterized by a rate of about 5–10 mm/yr in this sector of southeastern Türkiye (e.g., [1]). The subsequent aftershock sequence was extensive, with thousands of events, spreading bilaterally along a 300–400 km stretch from the Antakya–Hatay area to SW, to Pütürge to the ENE [31] (Figure 1). This suggests that multiple segments of the main branch of the EAFZ were ruptured and contributed to the overall seismic release.
The MW 7.6 Elbistan earthquake took place along the E–W trending northern branch of the EAFZ, rupturing the ~150 km long Çardak–Savrun fault segments (Figure 1). The spatial pattern of aftershocks follows the surface rupture [30,31], extending from the Goksun releasing bend in the W to the Nurdag fault complex. Fault plane solutions to the west of the Çardak segment show normal mechanisms, indicating a NE–SW oriented lineament parallel to the extension direction of the Goksun bend [36].
The largest aftershocks of the 2023 seismic sequence occurred on 6 and 20 February 2023, near Gaziantep and in the Antakya–Hatay region, respectively, with magnitudes of MW 6.7 and MW 6.4. The latter event occurred along the Antakya fault bordering to the north of the Amik basin, at the southwestern end of the 2023 seismic sequence. This is characterized by oblique-slip with left-lateral and extensional components (e.g., [37]).
The rupture plane and slip distribution of the 2023 Kahramanmaraş seismic sequences have been extensively analyzed through the inversion of both geodetic and seismological data (e.g., [11,12,13,14,15,16,17,18,19,20,21,22,23,24]), providing valuable information on the mainshocks’ seismic source parameters. Regarding the MW 7.8 mainshock, which initiated on the Narli Fault Zone, these studies highlight that the majority of the coseismic slip was concentrated within the top 20 km of the seismogenic zone, with slip increasing from SW to the NE ends of the first rupture. This rupture affected at least the three major vertical fault segments of the EAFZ (the Amanos, Pazarcık, and Erkenek faults) over a total length of approximately 300 km, propagating across geometric barriers, including bends and stepovers in the fault. The largest slip was observed on the Pazarcık segment, where it was up to 10 m (e.g., [12,19]). The area of significant slip extended to the NE, reaching the western edge of the Pütürge segment, and to the SW, towards the Hatay region.
Regarding the second mainshock, the MW 7.6 Elbistan earthquake—which occurred on the N-dipping, E–W trending Çardak–Savrun fault—caused a rupture along a total length of about 150 km. Previous studies (e.g., [11,12,13,14,15,16,17,18,19,20,21,22,23,24]) characterized this event as having a more concentrated slip distribution, with peak slip exceeding 10 m. Preliminary studies [11] suggested that the MW 7.6 earthquake also ruptured the entire Sürgü fault, linking the northern and the main strand of the EAFZ. However, aftershocks distributions [31], surface ruptures mapping [30], and subsequent inversion of geodetic data (e.g., [12,15,19]) reveal that the 2023 rupture did not extend to the eastern end of the Sürgü fault. Instead, the rupture abruptly changed strike at the easternmost sector of the MW 7.6 earthquake, propagating along a previously unknown structure parallel to the main strand of the EAFZ, positioned halfway between the northern Malatya fault and the Sürgü fault. At the western end of the MW 7.6 earthquake, the rupture also triggered a normal fault roughly perpendicular to the main E–W trending Çardak–Savrun fault.

2.2. The 4 August 2020 MW 5.6 and the 9 April 2022 MW 5.3 Events Along the Pütürge Segment

The region separating the two recent seismic sequences of 2020 and 2023 along the East Anatolian Fault Zone (EAFZ) is of particular interest, as it remained unruptured in both cases. This segment of the EAFZ, known as the Pütürge segment, had previously been identified as a potential seismic gap (e.g., [7]), capable of generating significant earthquakes. For this reason, it is crucial to analyze not only the recent seismic sequences that have partially affected this segment, but also the background seismicity and aftershocks from previous events that occurred in the area. This analysis will help us to better understand the mechanisms of seismic energy release within this region. Among the most significant events that occurred in this area between the two major sequences are the 4 August 2020 (MW 5.6) and 9 April 2022 (MW 5.3) earthquakes. These moderate-magnitude events produced detectable surface deformation, making them valuable for further analyses.
The 4 August 2020 MW 5.6 earthquake occurred at 09:37:37 UTC, approximately 20 km NNE of Sincik, in the Elazığ province. Moment tensor solutions reveal left-lateral strike-slip faulting along a high-angle north–northwest dipping focal plane (Figure 2). This event occurred at the WSW end of the Elazığ sequence, where a Coulomb stress increase had been calculated following the coseismic rupture of 2020 [10]. The 9 April 2022 MW 5.3 earthquake occurred at 14:02:15 UTC. Moment tensor solutions also reveal left-lateral strike-slip faulting along a high-angle north–northwest dipping focal plane (Figure 2). This event took place further to the WSW, and both events, with their left-lateral strike-slip kinematics and northward dipping focal planes, are in agreement with the activation of the Pütürge segment, particularly its SW sector, which was not activated during the Elazığ sequence.

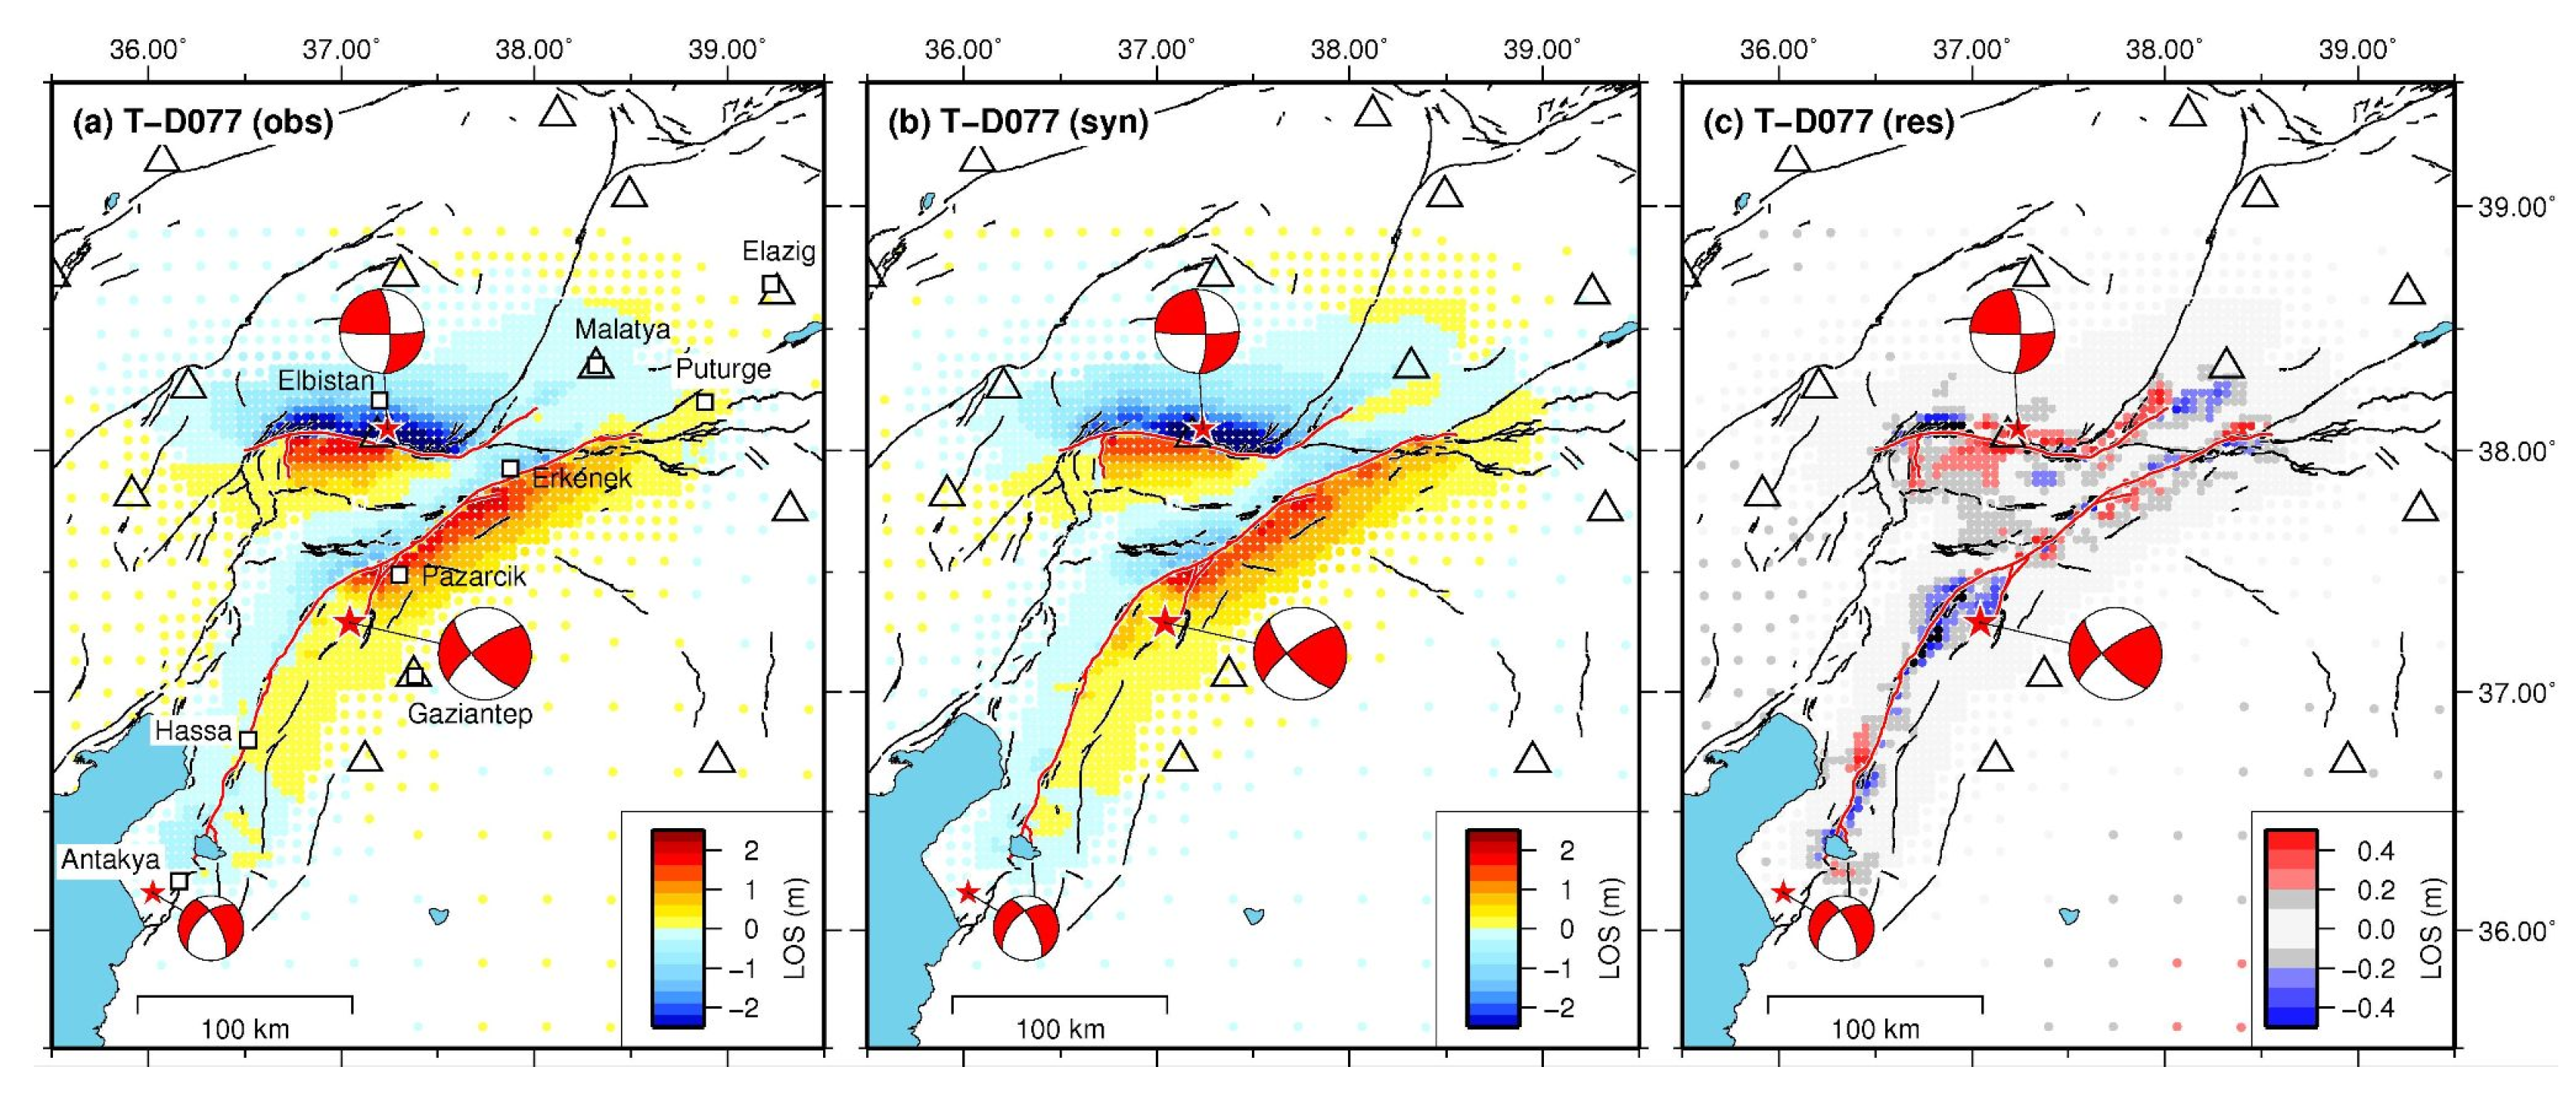
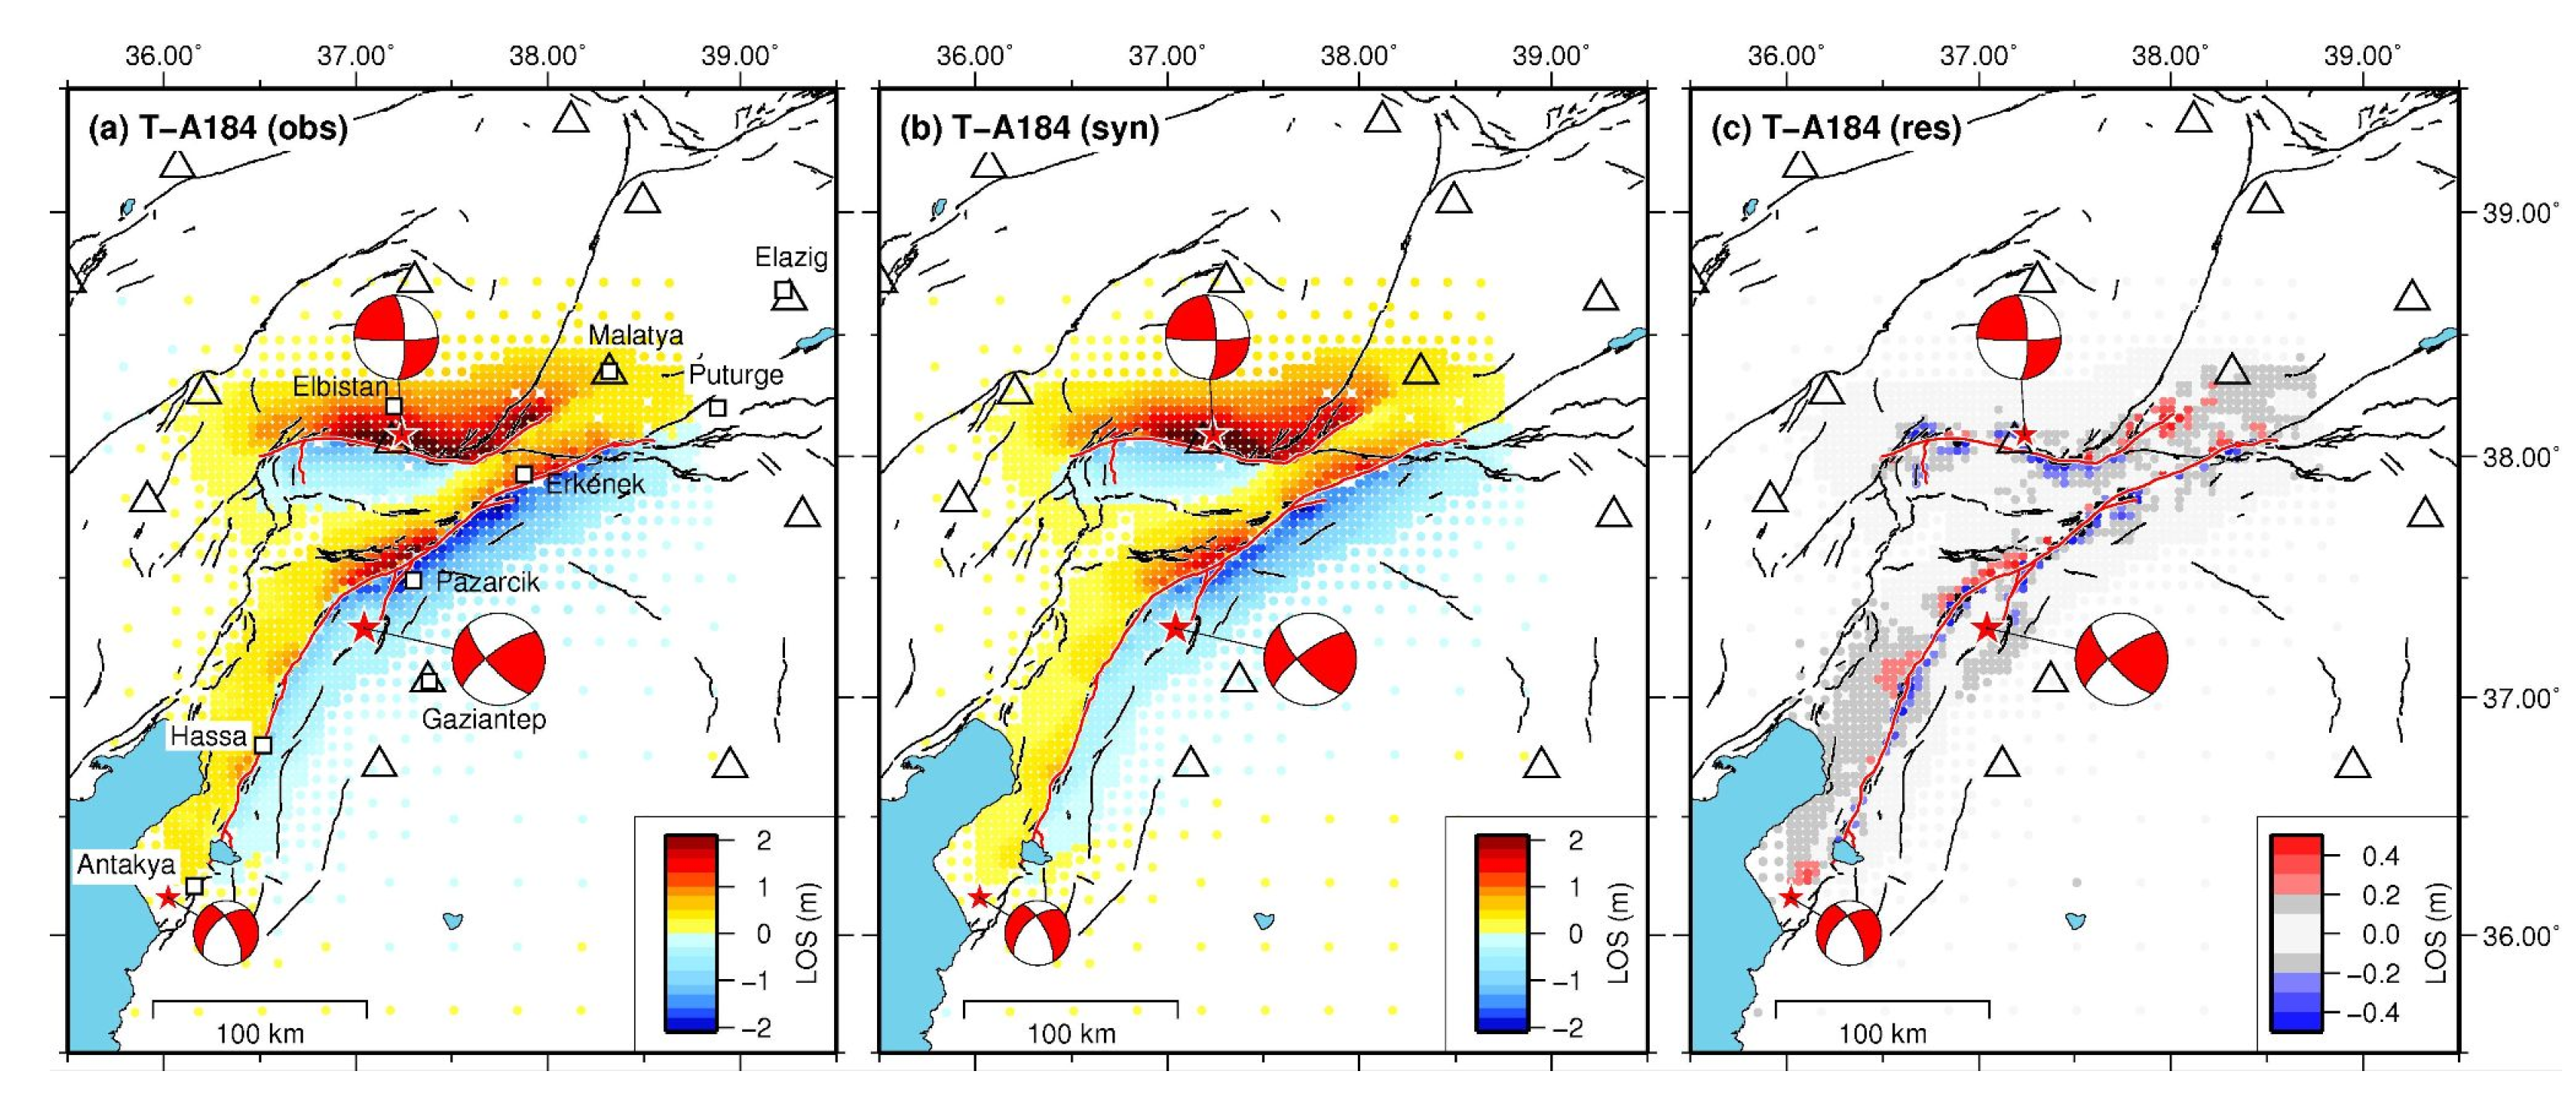
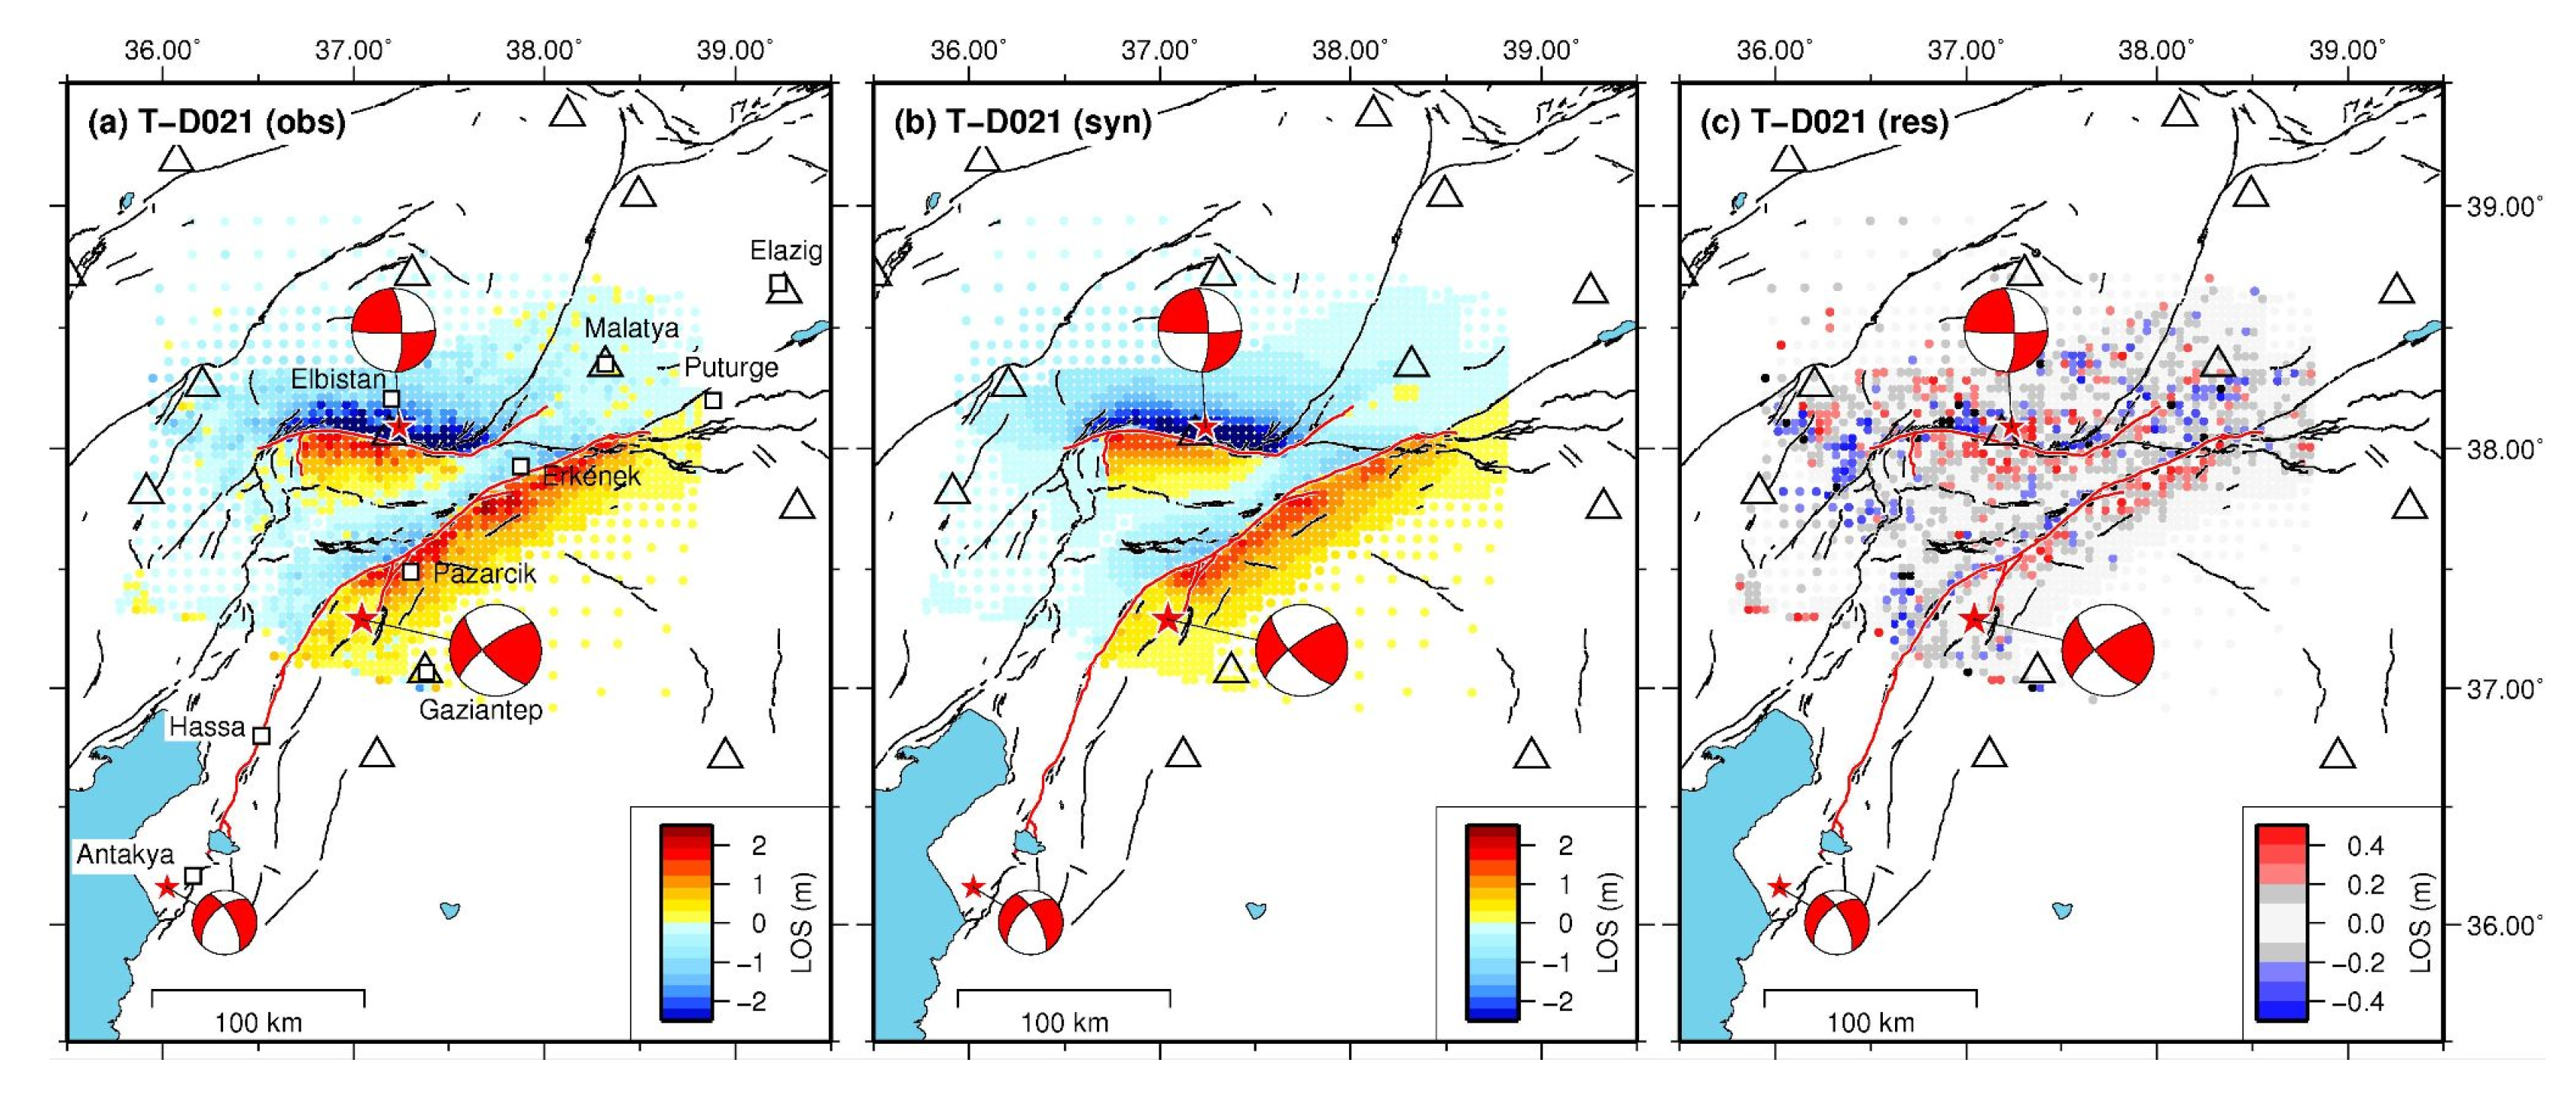
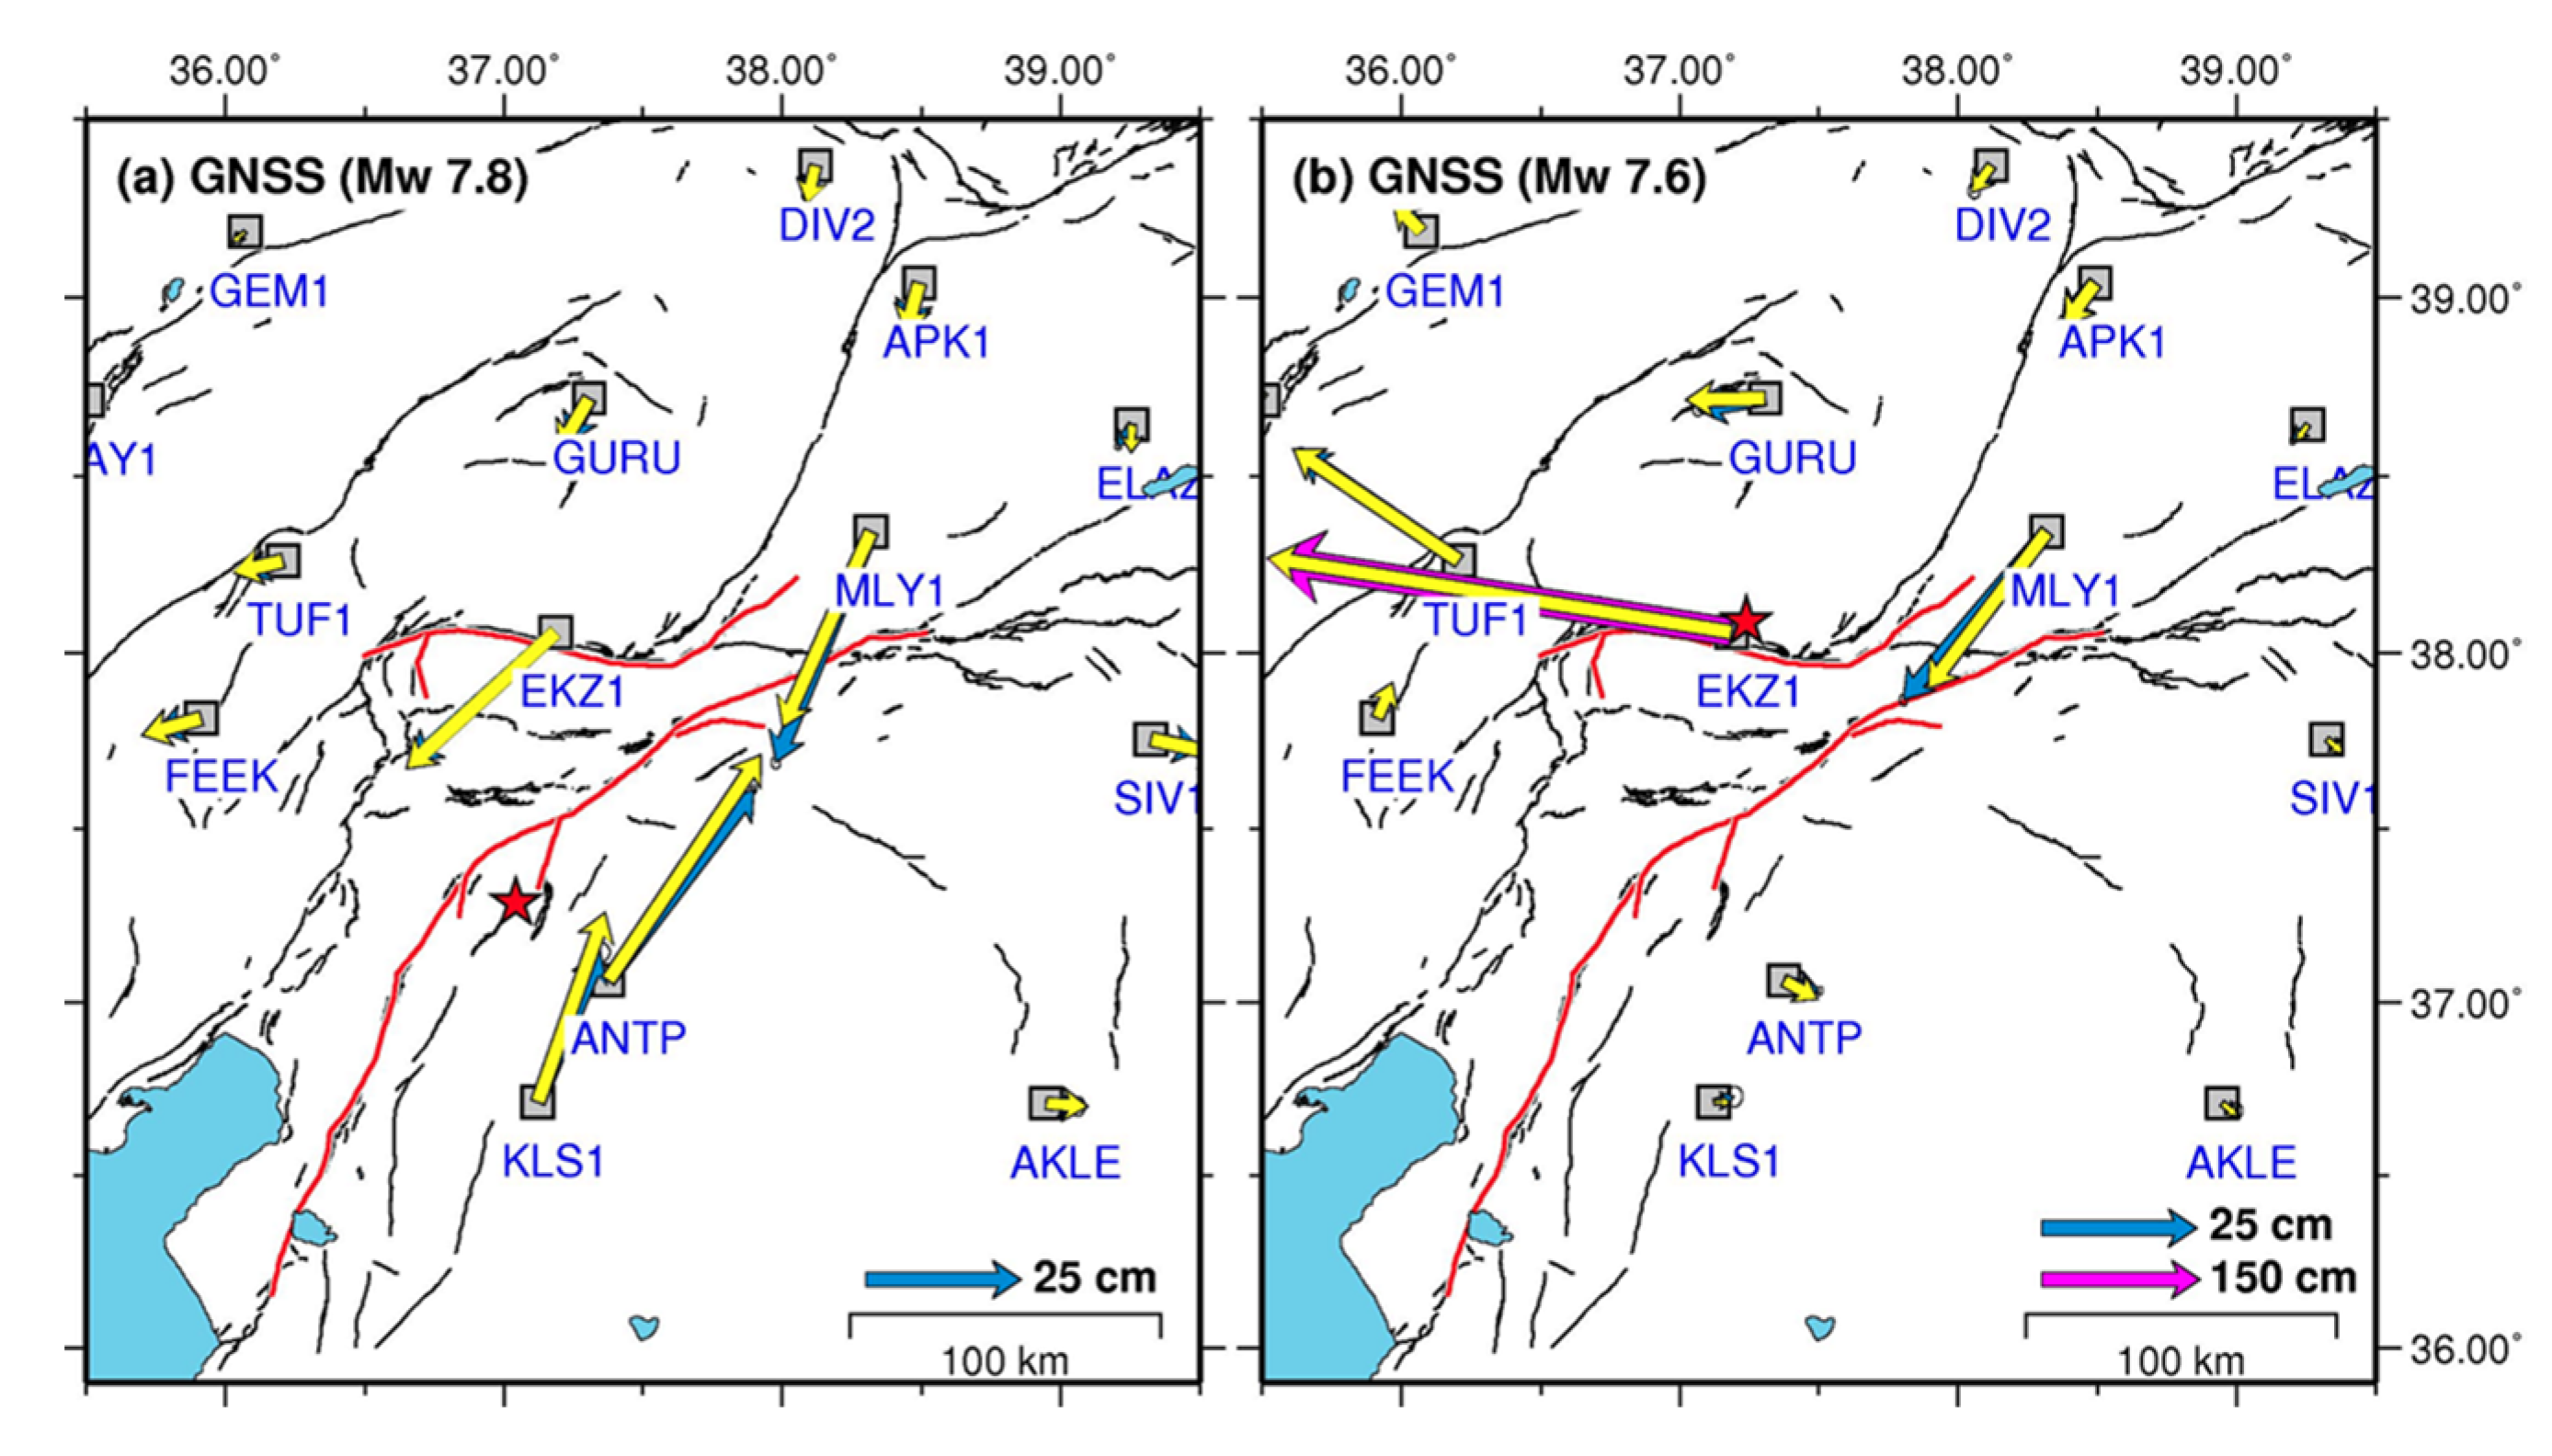
2.3. The Ground Deformation from InSAR and GNSS During the 2023 Kahramanmaraş Seismic Sequence

We employed InSAR data from multiple satellites to derive the coseismic displacement field related to the main events of the 2023 Kahramanmaraş seismic sequence. Specifically, we used both ascending and descending observations, exploiting the ALOS-2 (L-band, operated by the Japan Exploration Agency, JAXA) (Figure 3 and Figure 4) and the Sentinel-1 (C-band, operated by the European Space Agency, ESA) (Figure 5 and Figure 6) sensors, respectively, to quantify the cumulative surface displacement field related to both the MW 7.8 and 7.6 earthquakes. For the 20 February MW 6.4 Antakya aftershock we used Sentinel-1 InSAR phase.
Two pairs of ALOS-2 images, acquired along both descending and ascending orbits, were processed to generate coseismic displacement maps using the standard two-step InSAR approach [38], within the SARscape software (version 6.1.0), which is part of the ENVI package (version 6.1). The image pairs used for the coseismic analysis are as follows: the descending track 077 and the ascending track 184, which had the pre-event image acquisitions on 16 and 5 September 2022 and the post-event acquisitions on 17 and 20 February 2023, respectively, with a perpendicular baseline of 48 m and a temporal baseline of 154 days. The images were acquired in SCANSAR WD mode with HH polarization. A multilook factor of 2 × 15 was applied in both the range and azimuth directions, which yielded a final ground resolution of approximately 30 m × 30 m. The ALOS-3D Digital Elevation Model (30 m resolution) was used to subtract the topographic effect [39]. Goldstein filtering [40] with a 32-pixel window width was applied to enhance the visibility of coseismic fringes. To facilitate phase unwrapping, the coherence map was masked along the causative fault trace of the second seismic event (MW 7.6). The Minimum Cost Flow algorithm [41] was employed to unwrap the phase, and residual orbital phase errors were removed using quadratic polynomial fitting. A ramp correction was then applied to estimate and mitigate ionospheric effects, particularly obliquely oriented fringes, by analyzing a narrow Region of Interest located at the frame borders and distant from the expected displacement field. Finally, the unwrapped phase was transformed into displacement and geocoded in the WGS84 coordinate system.
In addition, we utilized InSAR data obtained from Sentinel-1 satellites, processed by [19]. Due to the high decorrelation of Sentinel-1 interferograms caused by the shorter wavelength compared to ALOS-2, which makes the unwrapping process of the earthquake doublet unreliable, they show the coseismic surface deformation using range pixel-offsets. These offsets were derived from both one ascending (track 116) and one descending (track 021) interferogram, acquired in TOPS mode. The pixel-offsets were calculated through cross-correlating the radar amplitude of full-resolution Single Look Complex (SLC) images acquired before and after the earthquake doublet.
The cumulative ground deformation of the earthquake doublet (MW 7.8 and 7.6) retrieved from the ALOS-2 unwrapped interferograms (Figure 3 and Figure 4) and Sentinel-1 pixel-offsets (Figure 5 and Figure 6) is characterized by the presence of deformation lobes located on either side of the EAFZ alignment, with maximum LOS (Line-Of-Sight) displacement of more than 3 m. The differences observed in the ascending and descending LOS maps indicate a combination of primarily horizontal movements, consistent with the left-lateral strike-slip kinematics of the EAFZ. The LOS displacements obtained align well with previous studies (e.g., [12,15,19]). The unwrapped Sentinel-1 interferograms related to the 20 February MW 6.4 Antakya aftershock highlight crustal deformation at the southwestern end of the MW 7.8 mainshock rupture (Figure 7), reaching a maximum LOS exceeding 10 cm.
In addition, we included GNSS data from the CORS network stations located near the epicenters, processed by the Nevada Geodetic Laboratory (NGL), to retrieve the full 3-D displacement field related to both the 6 February 2023 MW 7.8 and 7.6 mainshocks, thus allowing us to separate the contribution of the two individual earthquakes. Specifically, they derived three-component coseismic offsets for over 100 stations for both the two main events (Figure 8). Movement in opposite directions is seen from stations on opposite sides of the rupture fault traces, as expected from each of these strike-slip earthquakes. The most significant horizontal static displacements were observed at MLY1 site, with approximately 40 cm of displacement directed toward SSW measured during the first event (MW 7.8), and at EKZ1 site, where about 4.5 m towards WNW was calculated during the second event (MW 7.6) (Figure 8).

2.4. The Ground Deformation from InSAR During the 2020 MW 5.6 and the 2022 MW 5.3 Earthquakes

We analyzed Sentinel-1 InSAR imagery to determine the coseismic displacement fields of both the 2020 MW 5.6 and the 2022 MW 5.3 earthquakes that occurred on the EAFZ, situated between 2020 Elazığ and 2023 Kahramanmaraş seismic sequences. Also in this case, the interferograms were processed using the conventional two-step differential SAR interferometry approach. In particular, for the MW 5.6 earthquake we exploited four interferograms acquired around the time of the seismic event, on both ascending (track 116) and descending (track 021) orbits. For the MW 5.3 earthquake we processed descending (track 021) interferogram. Despite their moderate magnitudes, the interferograms reveal clear fringe patterns corresponding to coseismic ground displacements. The deformation maps derived from the unwrapped interferograms (Figure 9 and Figure 10) exhibit small deformation lobes oriented ENE–WSW, positioned across the EAFZ trace, with maximum LOS displacements of about several centimeters (Figure 9 and Figure 10), consistent with the strike-slip left-lateral kinematics of the EAFZ.

2.5. Geodetic Modeling

To reconstruct the fault geometry and slip distribution of the 2023 Kahramanmaraş seismic sequence, as well as the small events in the southwestern portion of the Pütürge segment, we employed fault slip modeling using rectangular dislocations embedded in an elastic, homogeneous, and isotropic half-space [42]. Prior to modeling, the InSAR displacement maps were down-sampled to reduce the number of data points from several million to a few thousand. This was achieved using a resolution-based resampling algorithm [43]. For the 2023 Kahramanmaraş MW 7.8 and 7.6 earthquake doublet the geodetic data is therefore inverted to determine the slip magnitude on each fault patch with a constant rake constraining the overall optimal fault geometry on the basis of the mapped surface traces [30], relocated aftershocks [31], and InSAR surface discontinuities (e.g., [12]) iterating over dips and rake angles of the fault planes jointly inverting InSAR LOS and range offsets and GNSS displacements. Relative weights were applied during the modeling process to appropriately integrate the different datasets, taking into account the significantly larger number of InSAR sampling points compared to the GNSS observations. Following the approach of [44,45], we determined the optimal weighting factors by analyzing the reduction in misfit for each dataset as a function of their relative weight (see Figure S1 in the Supplementary Material). Based on these tests, we found it reasonable to assign a higher weight to the GNSS data, adopting a GNSS-to-InSAR weighting ratio of 3. For the smaller events (the 2023 MW 6.4 aftershock and the 2020 MW 5.6 and 2022 MW 5.3 Pütürge events) we also performed non-linear inversions to constrain the geometry of the causative fault segments, following a standard two-step procedure (e.g., [46,47,48]). In the inversion process, we applied positivity constraints using a bounded-value weighted least-squares algorithm [49], which enforces non-negative slip values. Regularization was implemented through spatial smoothing to stabilize the linear inversion. Additionally, we included linear ramp terms for each InSAR dataset to mitigate the influence of residual long-wavelength orbital signals.

3. Results

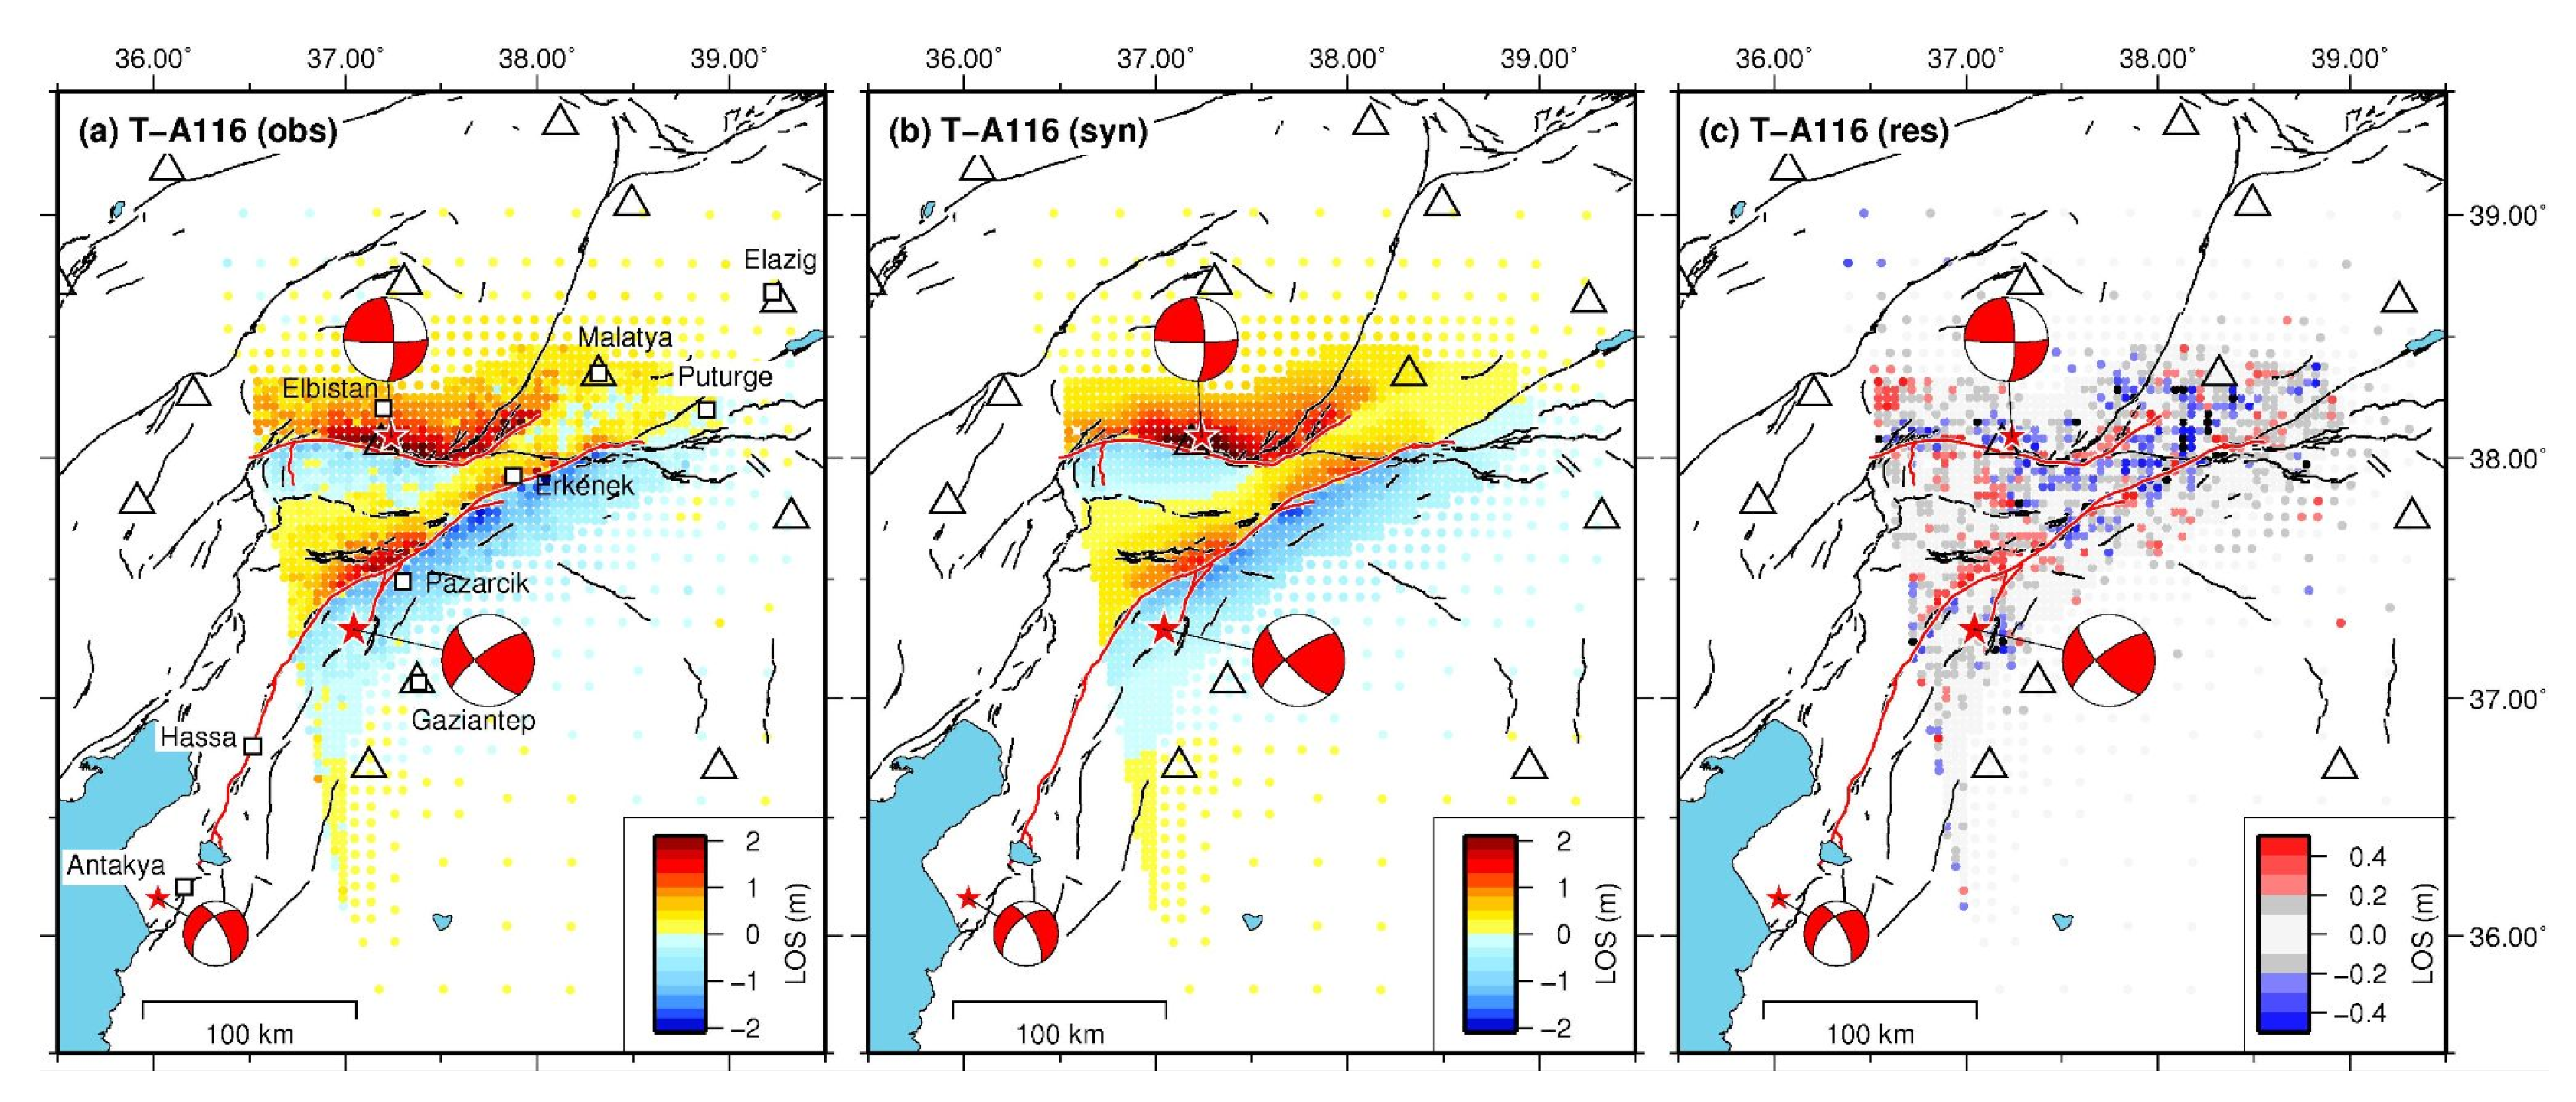
3.1. The 6 February 2023 MW 7.8 and 7.6 Kahramanmaraş Earthquake Doublet

The rupture surface trace of the earthquake pair was constrained by examining the displacement discontinuity in the near-field InSAR results, extending the fault planes to a depth of 20 km, passing through the relocated seismicity, and using vertical fault segments for the MW 7.8 mainshock and N-dipping faults (60–70°) for the MW 7.6 event. Unlike previous geodetic studies that assumed a constant geometry for the fault segments, we modeled the different fault segments with a variable strike to better match the surface expression of the EAFZ, as deduced from the surface deformation maps [30]. In particular, similar to previous geodetic studies (e.g., [12,19]), the followed inversion scheme considers three primary fault segments for the MW 7.8 mainshock: the Amanos (F1, 140 km-long), Pazarcık (F2, 75 km), and Erkenek (F3, 85 km) segments (Figure 11 and Figure 12). For the MW 7.6 earthquake, two primary segments were included: the Çardak–Savrun fault (F7, 110 km) and an eastward fault (F8, 60 km) located along the Nurdag complexity (Figure 11 and Figure 12). Additionally, we incorporated a fault segment (F4, 35 km-long) within the Narli Fault Zone, where the first mainshock nucleated [11], as well as the Pütürge segment (F5, 35 km), a 79° N-dipping fault located between the 2020 Elazığ earthquake sequence and the northeastern termination of the 2023 Kahramanmaraş earthquake. Furthermore, we included a small splay fault (F6, 20 km) between the Pazarcık and Erkenek segments, along with a normal fault (F9, 25 km) dipping 50° at the western end of the Çardak fault (Figure 11 and Figure 12). To ensure accuracy in our modeling, we divided the dislocation planes into small sub-faults of a uniform size and rake (left-lateral strike-slip), covering a total extent of 350 km × 20 km for the first earthquake and 175 km × 20 km for the second shock, resulting in a total of 1860 sub-faults.
The geodetic displacement inversion accurately reproduces both the observed SAR data—with RMSE values of about 18 cm and 20 cm for the ALOS-2 displacements and Sentinel-1 offsets, respectively (Figure 3, Figure 4, Figure 5 and Figure 6)—and the GNSS offset measurements, with an RMSE of about 2.5 cm (Figure 8). Some persistent residuals remain in the ALOS-2 displacement data, particularly along the fault traces of our preferred model (Figure 3 and Figure 4). These residuals may partly correspond to areas of interferometric incoherence. However, they may also reflect localized complexities, such as minor variations in the strike along the main fault, secondary structural features in the shallow portions of the fault system, and/or the topography effects that are not captured by the elastic modeling adopted in our simulations. Additionally, residual atmospheric noise in the ALOS-2 data may contribute to these patterns. In contrast, the residuals in the Sentinel-1 offset tracking results (Figure 5 and Figure 6) appear to be more spatially scattered and lack a clear correlation with the modeled fault geometry. This more random distribution is likely due to the lower resolution and precision of the offset tracking method compared to InSAR and to its higher sensitivity to noise from the image decorrelation and to surface changes unrelated to the earthquake-induced deformation.
The assumed coseismic slip model, based on the preferred fault network geometry, confirms the activation of several fault segments during the earthquake pair. In detail, the estimated magnitudes for each fault segment during the earthquake doublet vary, reflecting the localized slip distribution along the fault system. For the magnitude of MW 7.8, the rupture was characterized by varying magnitudes across different fault segments. The Amanos segment, with an estimated magnitude of MW 7.46, experienced a moderate slip, while the Pazarcık segment, with a magnitude of MW 7.52, exhibited the largest slip, reaching up to > 10 m. The Erkenek segment had a slightly lower magnitude of MW 7.39, indicating less displacement in comparison. The Narli segment, where the mainshock nucleated, experienced minimal slip, with a significantly lower magnitude of MW 6.49, in line with the reduced displacement observed in this area. The total geodetic moment, integrating these segmental magnitudes, corresponds to an overall magnitude of MW 7.80, which is consistent with previous studies (e.g., [11,12,19]).
The second earthquake, with a magnitude of MW 7.6, originated along the E–W trending Çardak–Savrun fault, propagating westward towards the Savrun fault and eastward into the Nurdag complexity. The rupture along the Çardak fault was particularly significant, with a maximum slip of up to 12 m, corresponding to an estimated magnitude of MW 7.59 for this segment. However, instead of following the expected E–W Sürgü segment, the rupture deviated northeastwards along an unmapped fault within the Nurdag complexity, between the Sürgü and Malatya faults. This previously unmapped fault thus represents a key structural element, revealing a more intricate and interconnected fault network than previously recognized in the region. Its presence suggests complex fault interactions, with multiple strands influencing the rupture pathways and seismic energy release. Such complexity can result in unexpected rupture deviations, multi-segment ruptures, and variable slip distributions, all critical factors for accurate seismic hazard assessments. These influences are evident in varying slip patterns observed in the area, including the Gök Hill–Söğüt segment, which experienced a magnitude of MW 7.17. The total geodetic moment for this second event corresponds to an overall magnitude of MW 7.64, which is consistent with previous studies (e.g., [11,12,19]).
In addition, we carried out a quantitative assessment of the model uncertainties by employing a Monte Carlo simulation based on 300 stochastic inversions of perturbed datasets. In each realization, we added Gaussian noise to the original datasets (5 mm for GNSS, 25 mm for InSAR) while keeping all inversion parameters fixed. This allowed us to compute the mean and standard deviation of the slip on each fault patch (Figure S2). Results show relatively low standard deviations (typically 15–20 cm) even in areas of large slip, with an average slip uncertainty exceeding 50:1, in agreement with previous studies [15]. This suggests that the inferred rupture characteristics are robust with respect to observational noise.

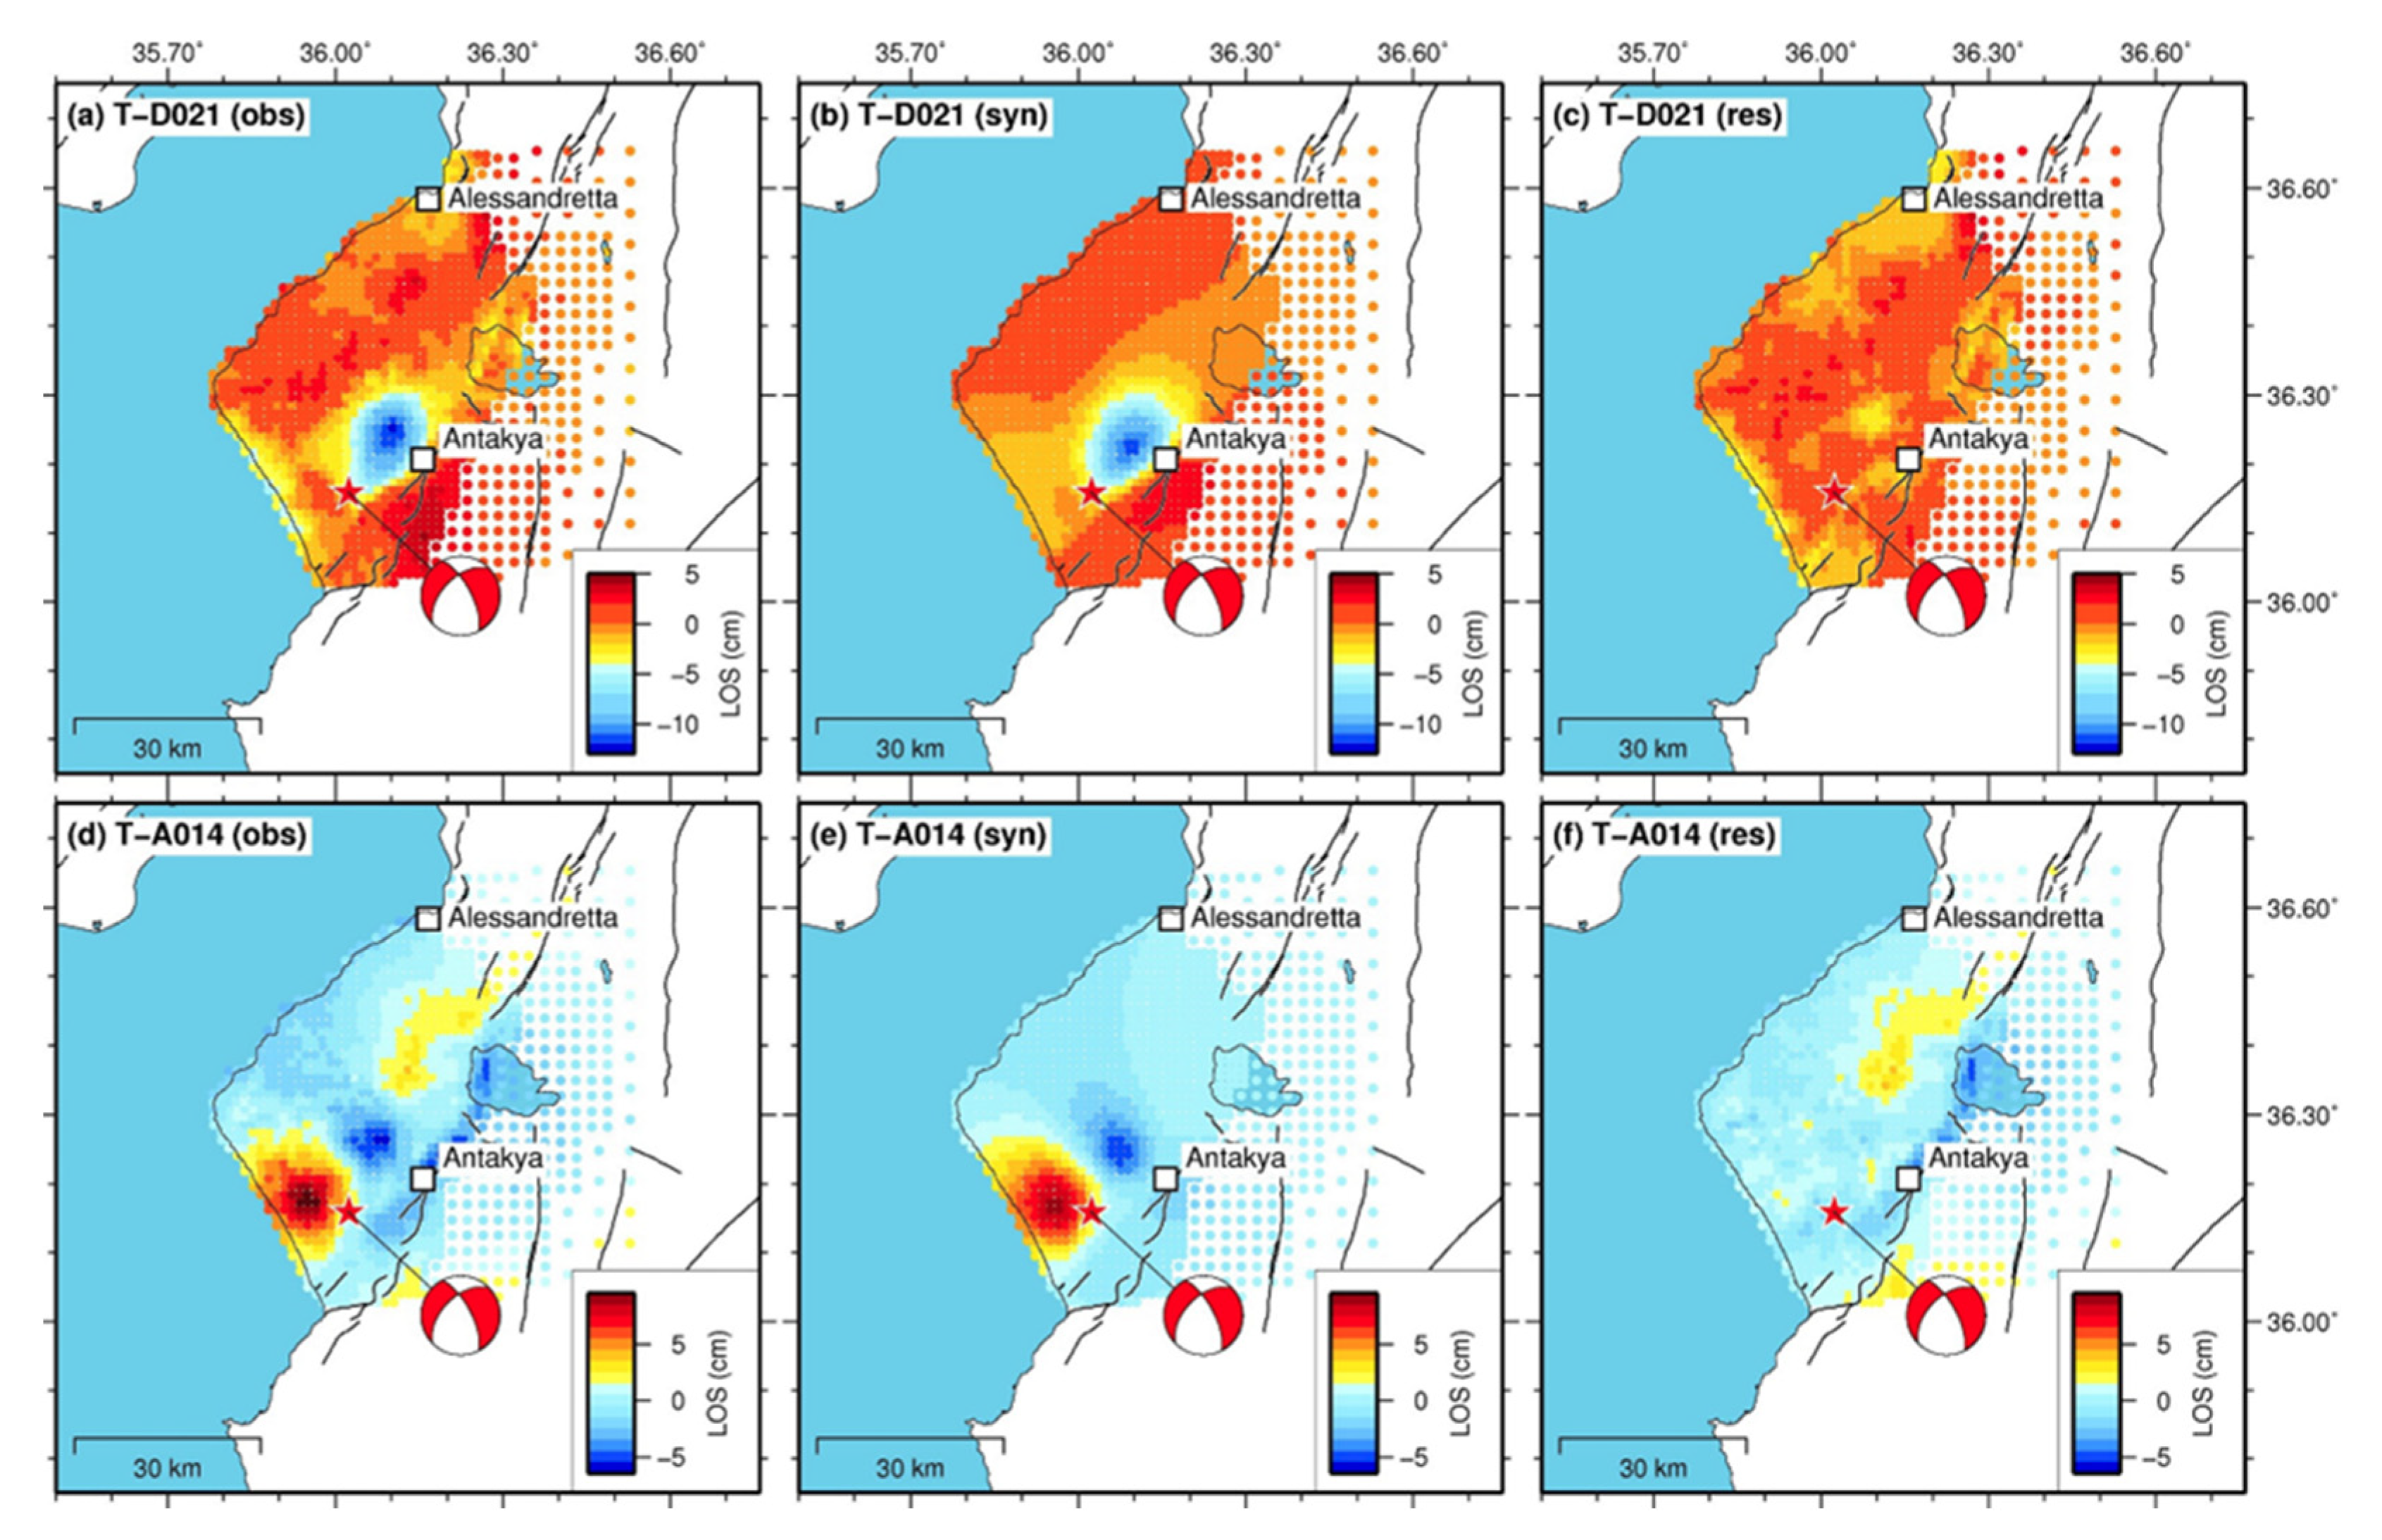
3.2. The 20 February 2023 MW 6.4 Antakya–Hatay Aftershock

In the first step for the 2023 MW 6.4 aftershock, we performed a non-linear optimization of the fault geometry responsible for the seismic event, employing a simulated annealing algorithm [50]. The optimal uniform slip solution corresponds to a 226° striking and 47° WNW-dipping fault (rake about −14°) with 14 km × 9 km dimensions (Figure 13), which is in good agreement with the seismological focal solution and a previous inversion of geodetic data (e.g., [12]). The average uniform slip is 0.7 m, and assuming a rigidity of 30 GPa, this results in an estimated geodetic moment of 2.88 × 10¹⁸ Nm, corresponding to a MW 6.3 earthquake. In the second step, we extend the uniform slip fault to encompass the area impacted by aftershocks (35 km × 25 km) and divide the fault into smaller patches. The optimal slip distribution on the extended fault plane is shown in Figure 13. The coseismic slip distribution reveals a major asperity with a peak slip of approximately 1 m, primarily located within the uniform-slip fault. In this case as well, the resulting magnitude is consistent with a MW 6.3 earthquake.

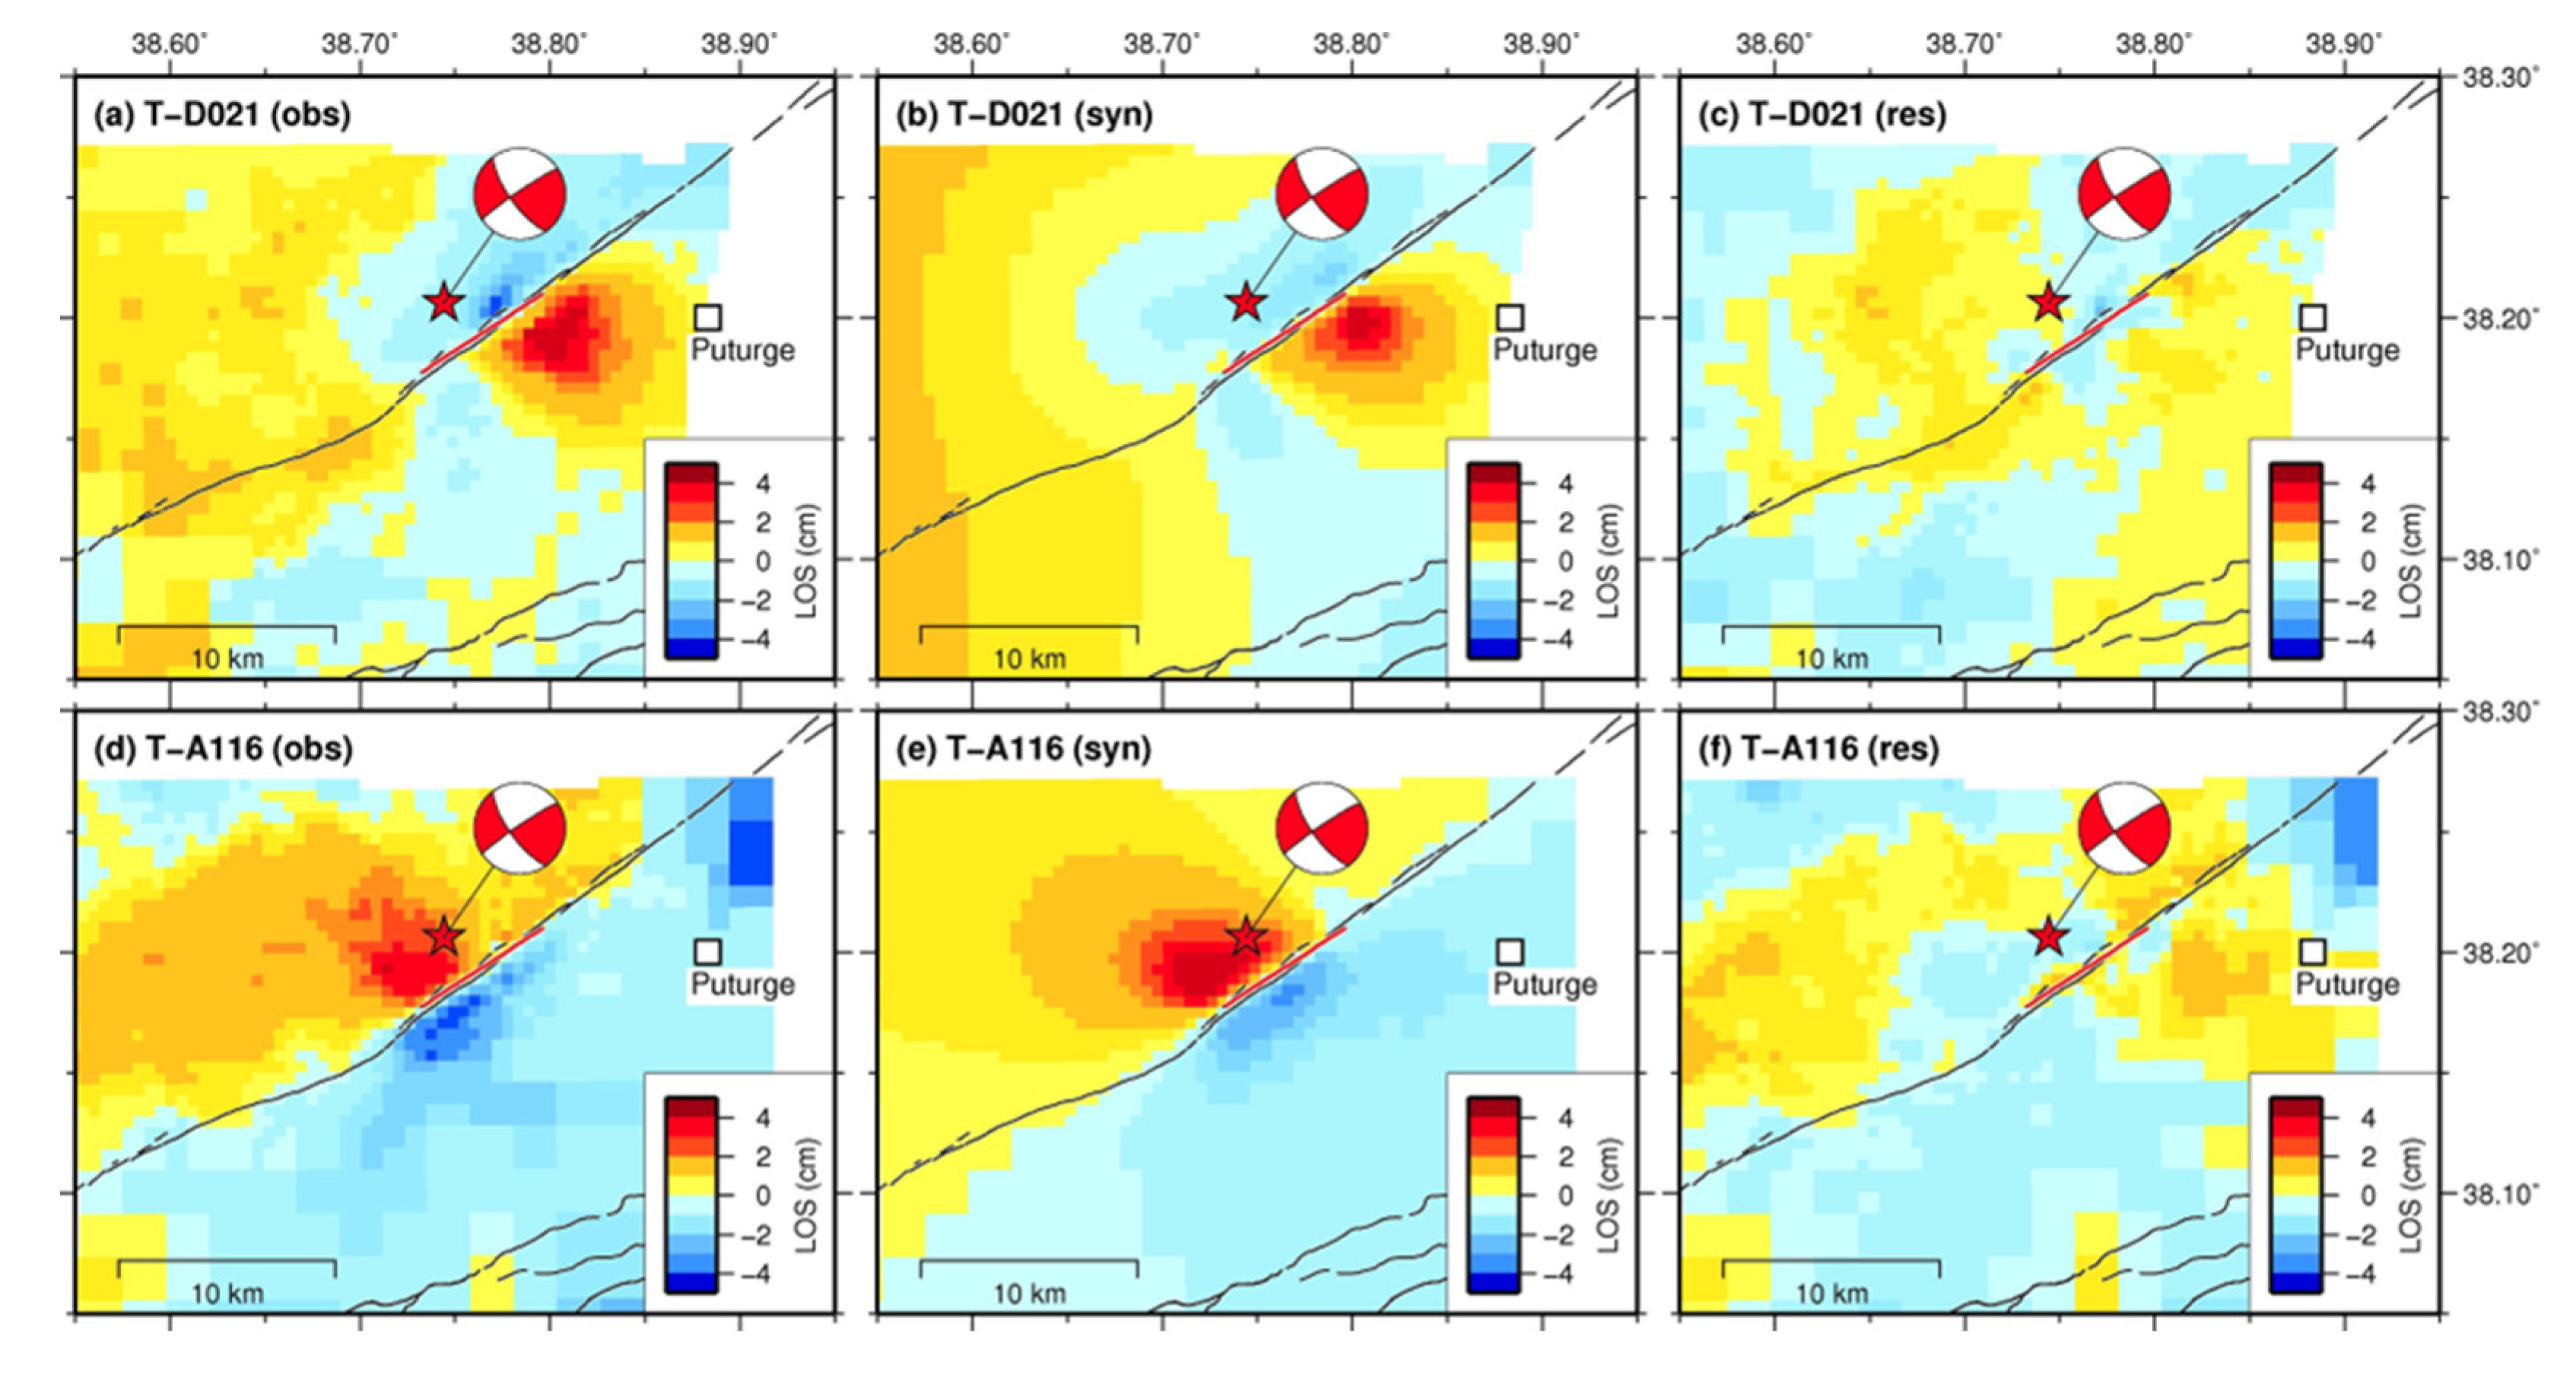
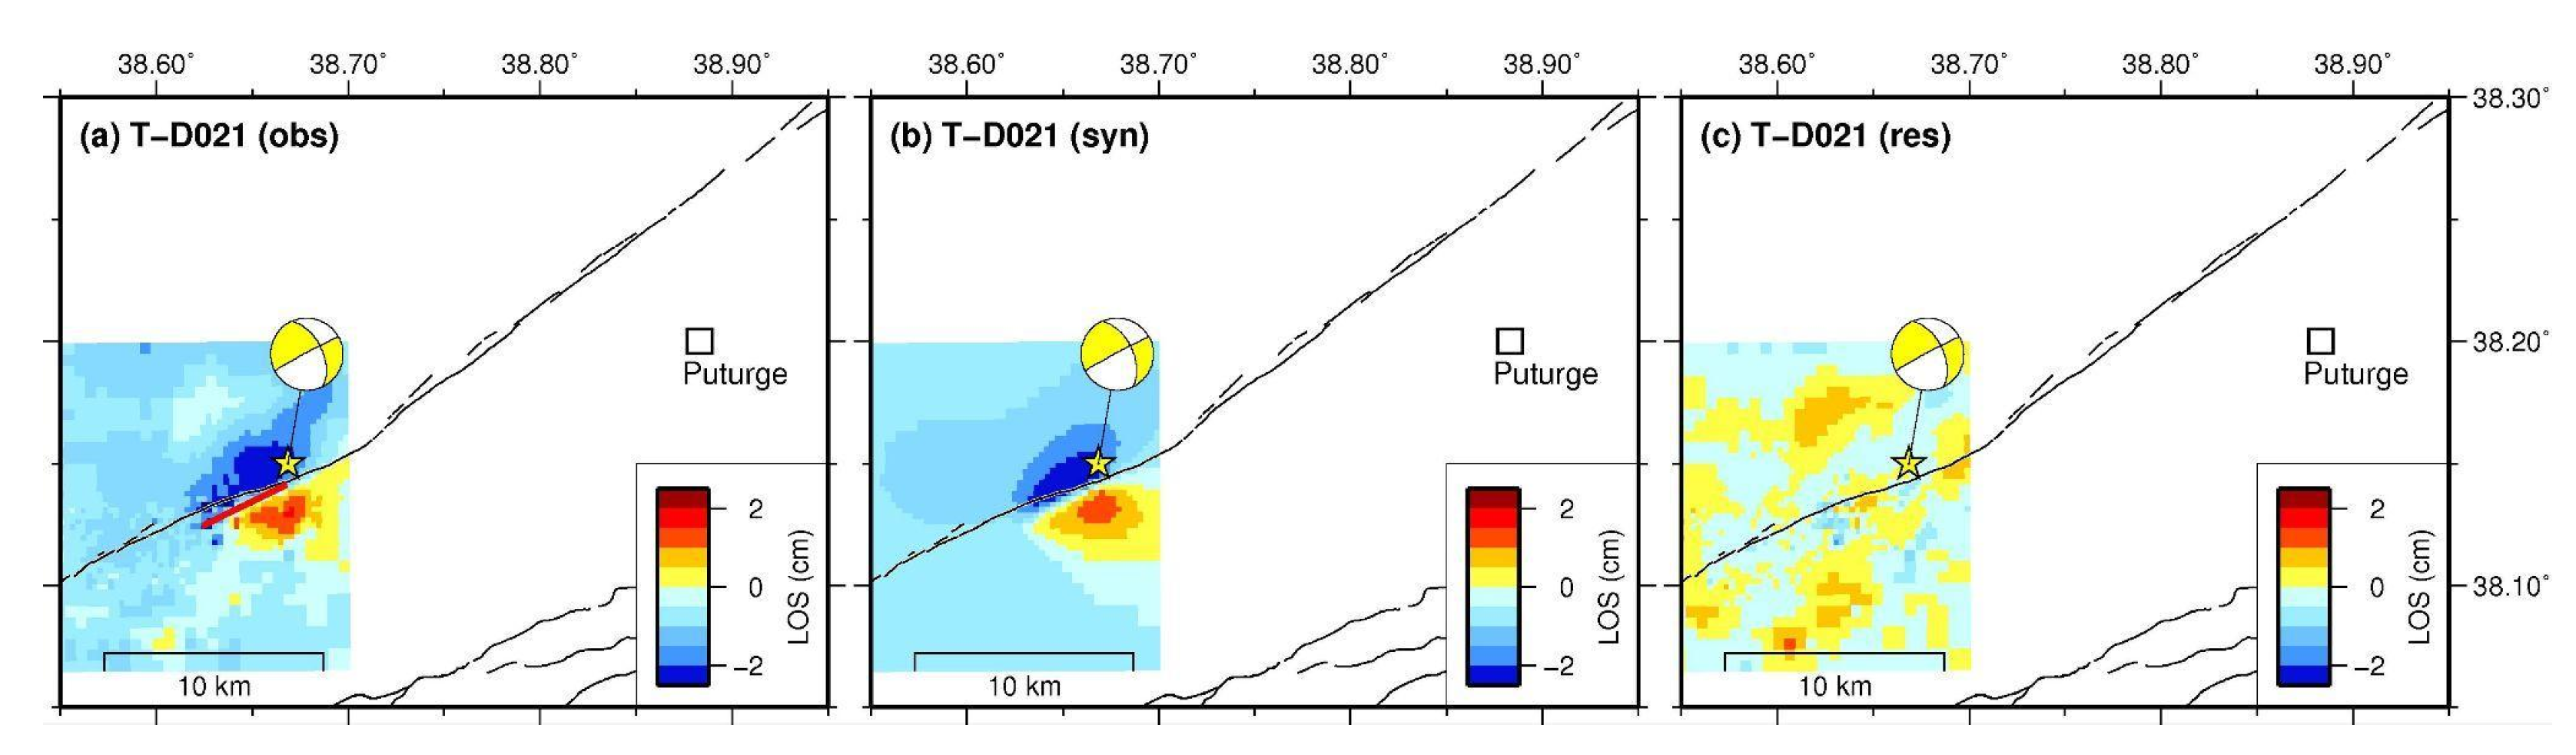
3.3. The Source Modeling of the Smaller Seismic Events Along the Pütürge Segment (2020 and 2022)

The inversion method applied for the smaller seismic events of 2020 and 2022 follows the same approach used in the previous section. The optimal uniform slip solution for the August 2020 MW 5.6 earthquake corresponds to a 237° striking and 89° WNE-dipping fault (rake about 0°) with 6.6 km × 5.3 km dimensions (Figure 14). The average uniform slip is 0.3 m, and assuming a rigidity of 30 GPa, this results in an estimated geodetic moment of 3.29 × 10¹⁷ Nm, corresponding to a MW 5.6 earthquake. For the April 2022 MW 5.3 earthquake, the optimal solution is represented by a 244° striking and 84° WNE-dipping fault (rake about −11°) with a 4.2 km × 5.9 km dimension (Figure 14). The average uniform slip is 0.12 m, and assuming a rigidity of 30 GPa, this results in an estimated geodetic moment of 0.92 × 10¹⁷ Nm, corresponding to a MW 5.3 earthquake. In both cases, the modeled fault planes align with predominantly pure left-lateral strike-slip kinematics, rupturing small shallow sections of the western part of the Pütürge segment. This area was positively stressed by the prior Elazığ earthquake [10].

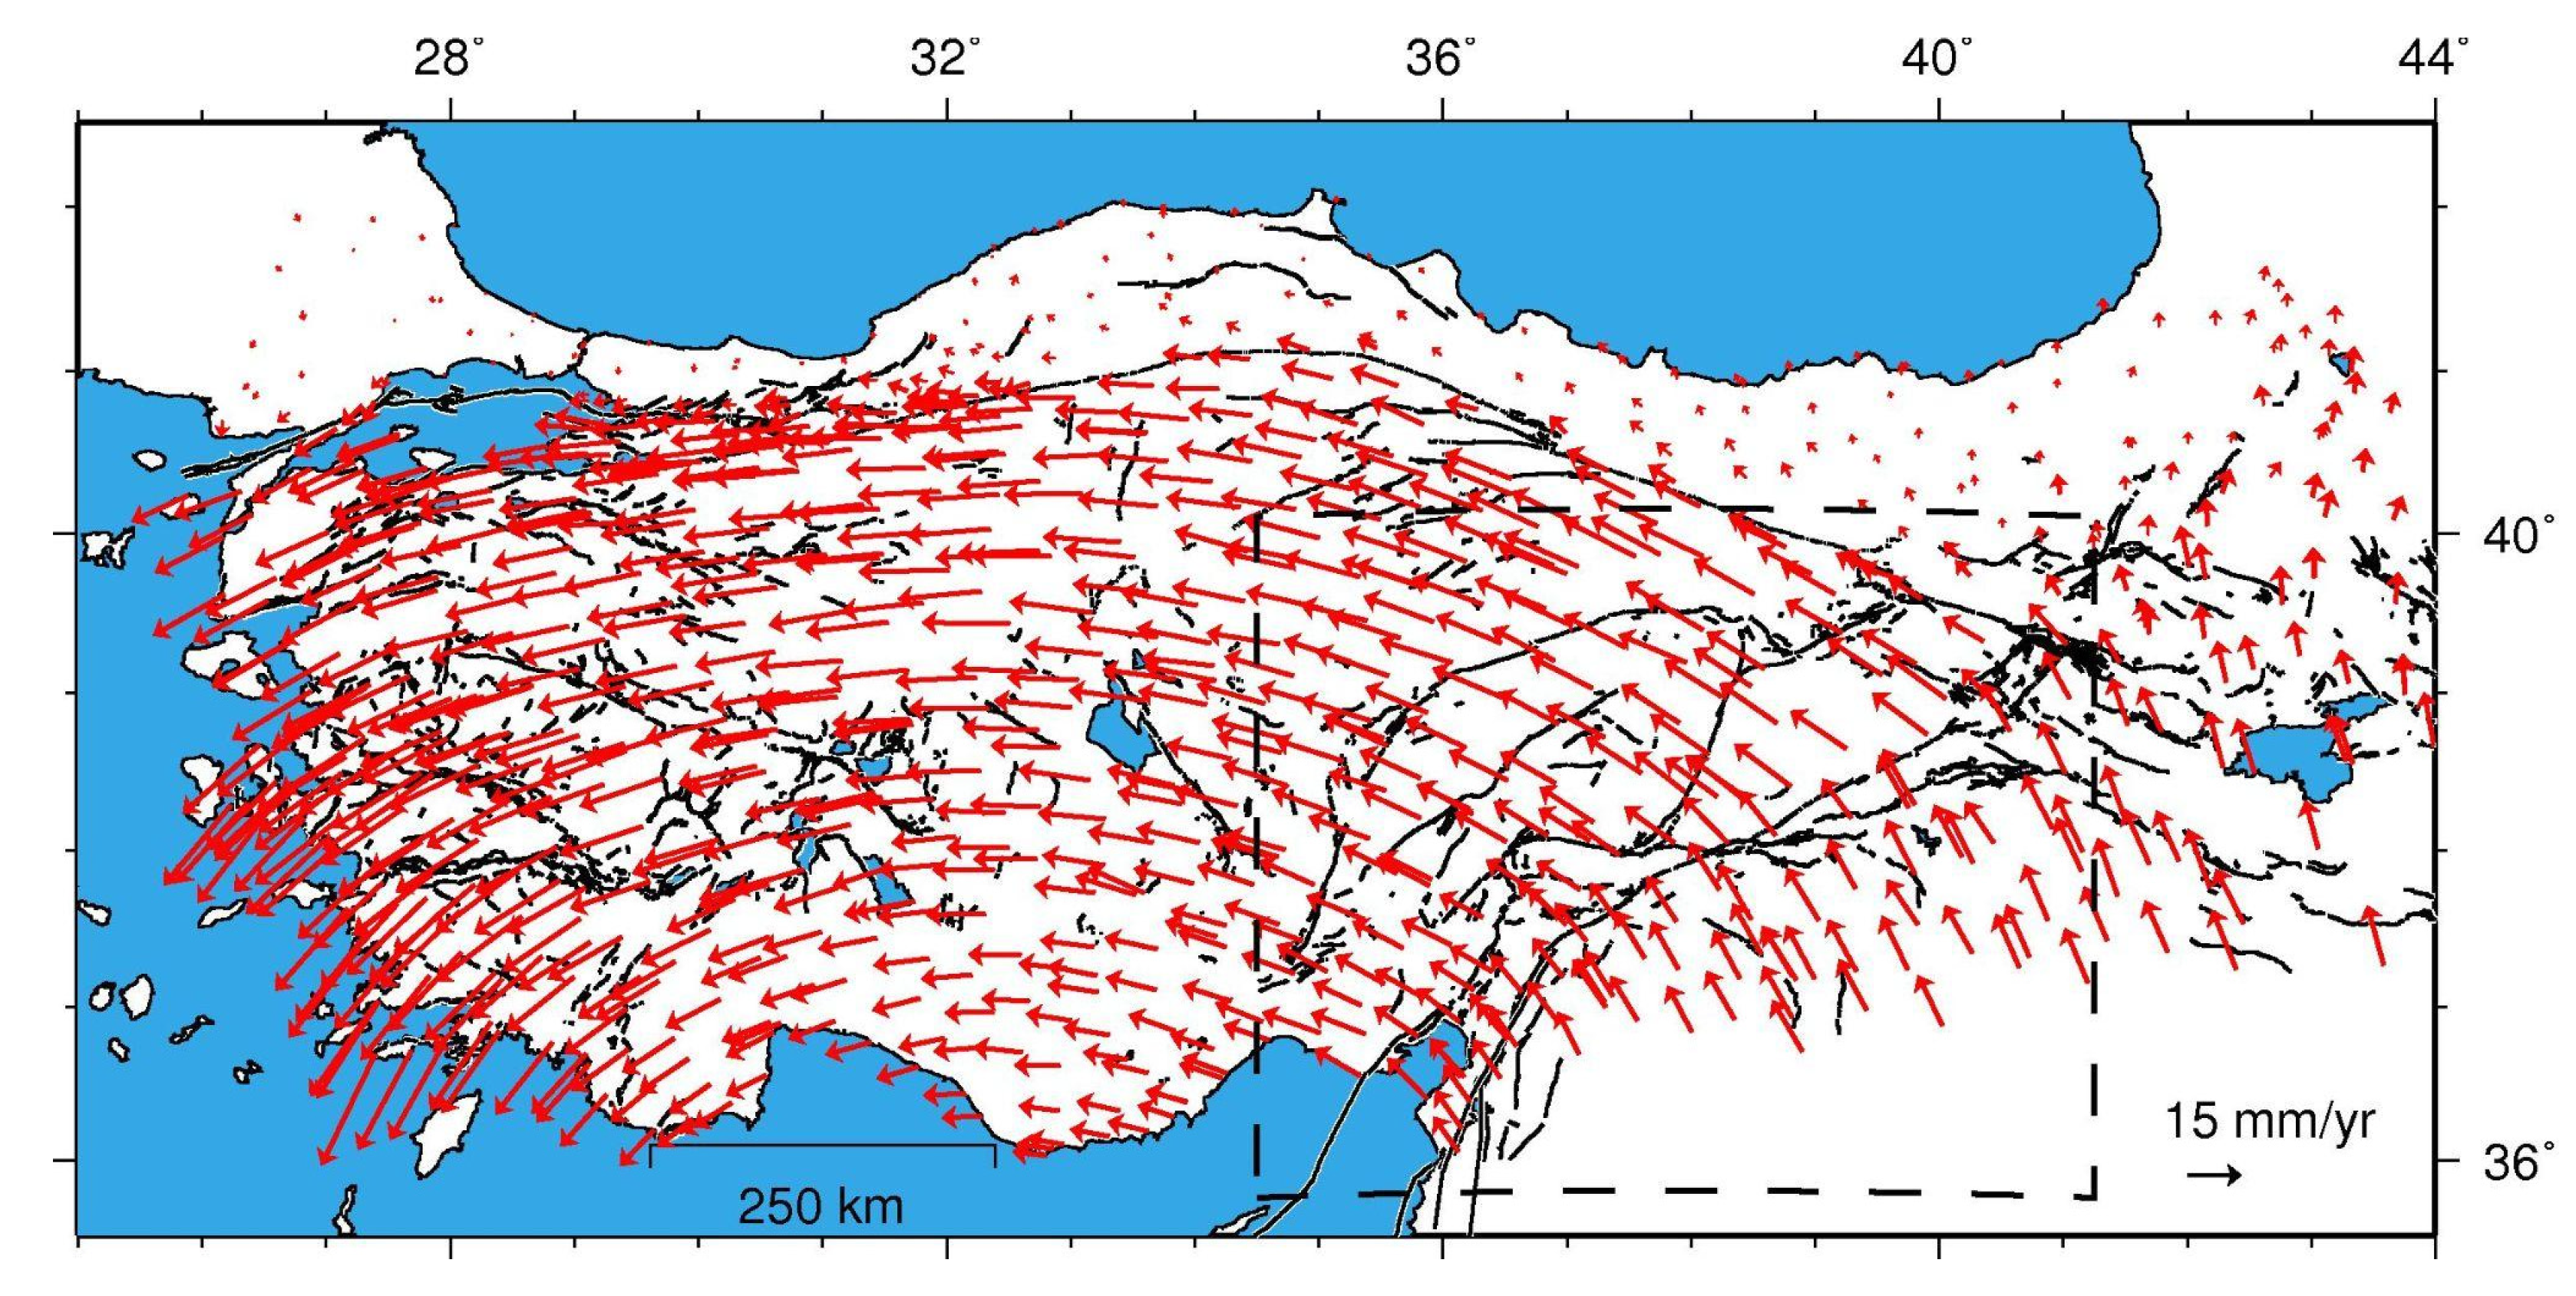
3.4. Strain-Rate Estimation and Dislocation Modeling from GNSS Data

Understanding the seismogenic potential of the EAFZ is essential for evaluating the seismic hazard in Türkiye and the broader Eastern Mediterranean region. Recent earthquakes, such as the 2020 Elazığ and the 2023 Kahramanmaraş sequences, highlight the importance of monitoring and modeling the strain accumulation along the EAFZ and neighboring structures, particularly in areas that have experienced decades of seismic quiescence. We aim to assess the seismogenic potential of the EAFZ by focusing on both the Pütürge fault segment at the NE termination and the region near the Dead Sea Fault (DSF) at the SW termination, employing a two-stage method. Firstly, we estimate the strain-rate field, followed by dislocation modeling to evaluate the interseismic locking depth and the rate of slip. In particular, the southwestern part of the Pütürge fault was not affected by coseismic ruptures during either the 2020 Elazığ seismic sequence [10] or the 2023 Kahramanmaraş sequence [12]. The strain-rate field reveals how the deformation is distributed across the fault zone, allowing us to identify areas of higher rates along the EAFZ, which may suggest significant strain accumulation. Dislocation modeling provides insight into the coupling degree of these segments and allows the estimation of key parameters such as the locking depth and rate of slip, which are essential for understanding the fault’s seismogenic potential.
To estimate the strain-rate field along the EAFZ, we analyzed GNSS data from a network of 836 stations [51], which offers enhanced spatial coverage of both near- and far-field areas compared to previous studies (Figure 15 and Figure 16) (e.g., [1,2,3,52]). In the Eurasian reference frame, the GNSS velocities south of the NAFZ show motions approximately directed in a WNW direction, highlighting the right-lateral kinematics characterizing the NAFZ (Figure 15).
Focusing on the study area, the strain-rate was obtained by applying the optimal interpolation of the spatially discretized geodetic data algorithm [53]. This method allowed us to generate a continuous strain field that clearly delineates the major fault zones in eastern Türkiye (Figure 16), in agreement with previous studies (e.g., [54]). Notably, the strike directions of the dextral minimum shear coincides with the NW-striking strike-slip fault segments of the NAFZ, and the strike directions of the sinistral maximum shear align well with the fault segments of the strike-slip EAFZ (Figure 16). High strain-rates, up to 120 nanostr/yr, were found across the NAFZ, and another region with rates up to 70 nanostr/yr was identified at the Karliova junction, where the NAFZ and EAFZ meet. Along the EAFZ, the strain-rates vary, with values of 50–70 nanostr/yr along the Palu and Pütürge segments, decreasing further SW across the Erkenek and Pazarcık segments (30–50 nanostr/yr), and transitioning to a trans-tensional regime in correspondence with the Amanos segment and the Hatay region. Along the northern EAFZ strand, where the MW 7.6 Elbistan earthquake occurred, shear strain-rates of 20–25 nanostr/yr have been interpolated (Figure 16).
The relatively lower strain accumulation we observe along the segments of the EAFZ compared to the NAFZ is in agreement with previous InSAR-based studies (e.g., [54,55]). Our results are also consistent with the findings of [56], who reported elevated strain-rates in the order of ~70 nanostr/yr and a marked east–west velocity gradient along the Pütürge segment, the portion of the EAFZ where the 24 January 2020 Mw 6.7 Elazığ earthquake occurred [10].
In the second step, we applied dislocation modeling to estimate the interseismic locking depth and the rate of slip along the identified segments of the EAFZ. To do this, the GNSS velocity field has been transformed into a reference frame defined by minimizing the residual horizontal velocities of stations situated on the Arabian plate, sufficiently far from the active EAFZ (gray squares in the Figure 17b). This reference frame allows us to examine the crustal motion across the EAFZ and identify areas of potential strain accumulation. Accordingly, the motion of stations across the main strand of the EAFZ shows a direction consistent with an average 8 mm/yr of cumulative left-lateral shear along the EAFZ (Figure 17b), which is consistent with previous studies (e.g., [54]).
We then constructed a series of profiles across the EAFZ, perpendicular to the various fault segments, by projecting the velocity vectors within a 70–80 km swath. These profiles extend over a length of 250 km to capture both near- and far-field data. By comparing the GNSS horizontal velocities with the topographic swath profiles, it is evident that the highest strain-rate is concentrated along the primary branch of the EAFZ, aligning with the seismic activity (M > 6.5) observed in this region (Figure 18). The observed horizontal velocities were also compared with the surface deformation resulting from the slip on a two-dimensional planar NNW-dipping vertical dislocation, locked at a specific depth. The simplest model geometry consists of five parameters: the horizontal and vertical positions of the dislocation tip (i.e., the locking depth), the dip angle, the fault slip-rate, and the rake. Rather than exploring the entire parameter space to minimize an assumed cost function, we fixed the location of the interseismic dislocations at the mapped trace of the EAFZ and tested different locking depths (2, 15 and 25 km). The chosen locking depths were selected based on prior geophysical and geological studies indicating that the seismogenic zone in the EAFZ typically extends within this depth range (e.g., [9]), with a maximum locking depth around 20–25 km that is supported by the observed distribution of aftershocks from the 2023 seismic sequence, which do not extend below this depth. This allowed us to assess how well the projected interseismic velocities along the profiles matched specific locking depths, a crucial parameter for evaluating their seismogenic potential, assuming sub-vertical north-dipping dislocations and a slip-rate of 10 mm/yr (a value consistent with the computed, ∼10–13 mm/yr interplate velocity suggested in previous studies for the EAFZ (e.g., [1,2,9,55])). Although we fixed the slip-rate at 10 mm/yr in the models presented here, variations in slip-rate within the range 8–12 mm/yr would proportionally affect the magnitude of the surface velocities without significantly altering the overall profile shape. Thus, while slip-rate uncertainties influence the velocity amplitude, the locking depth remains the dominant parameter controlling the velocity gradient and pattern.
Our analysis indicates that, on average, the EAFZ is subjected to aseismic slip at the base of the brittle (velocity-weakening) section of the fault at approximately 15–20 km depths (Figure 18b–d), except for the Hazar–Palu segment (Figure 18f). Specifically, the abrupt change in the interseismic fault-parallel velocity field observed in profile f suggests aseismic creep at the surface, in agreement with previous studies (e.g., [34,57]). Moving westward, the other profiles instead show a velocity gradient across the EAFZ, indicating that the fault segments (i.e., the Pütürge, Erkenek, Pazarcık, and Amanos) are locked below a certain depth. At the southwestern termination, in the Hatay region, additional complexities in fault behavior may be present. In fact, the EAFZ, the Cyprus Arc, and Dead Sea Fault intersect at the Hatay triple junction, which is a tectonically complex zone, with deformation partitioned along different fault segments. Additionally, the normal component of the rake increases in the southwestern profiles (profiles a and b) compared to the others, where a transcurrent kinematic dominates.
Our results are generally consistent with the findings of [9], who identified the most uncoupled shallow portion of the central EAFZ near Elazığ, coinciding with the pull-apart basin of Lake Hazar. Similarly, our model indicates a very shallow locking depth along the Hazar–Palu segment, suggesting aseismic behavior at or near the surface (Figure 18f). However, notable differences arise along the Pütürge segment, where [9] inferred a shallow coupling depth, whereas our results suggest a deeper locking depth of approximately 15 km (Figure 18e). This estimate aligns more closely with the coseismic slip distribution of the 2020 Elazığ earthquake [10] and the spatial pattern of aftershocks. Further west, along the Erkenek and Pazarcık segments, we also infer relatively deep locking depths (~15 km), which are broadly consistent with the coupling inferred by [9], although their model (limited only to a portion of the Erkenek segment) in this region is associated with high uncertainty, indicating the limited reliability in those estimates.
The geometry of the interseismic dislocations predicted by our preferred solutions aligns well with the distribution of the aftershock seismicity from 2020 and 2023, which is mostly located above the 20–25 km depth (Figure 18). It also matches our preferred 2023 coseismic planes and the 2020 Elazığ rupture (10), which are located near the upper edge of the interseismic dislocation model (Figure 18). This supports the hypothesis that the interseismic slip on the creeping dislocation leads to strain accumulation on the shallow, locked sections of the EAFZ, resulting in earthquakes similar to those of 2020–2023. Along profiles c and d, which intersect the northern branch of the EAFZ (i.e., the Çardak–Savrun fault, activated during the MW 7.6 Elbistan earthquake), we tested the addition of a secondary interseismic dislocation, in addition to the main one located along the principal strand of the EAFZ. This choice was motivated by the location of the MW 7.6 rupture, which nucleated near profile c. Our results show that, for profile c, including an additional dislocation accommodating ~2 mm/yr of slip improves the fit to the observed interseismic velocities. In contrast, for profile d, the inclusion of a second dislocation does not lead to a significant improvement, suggesting a more limited role of the northern strand in accommodating the interseismic deformation in that area.

4. Discussion

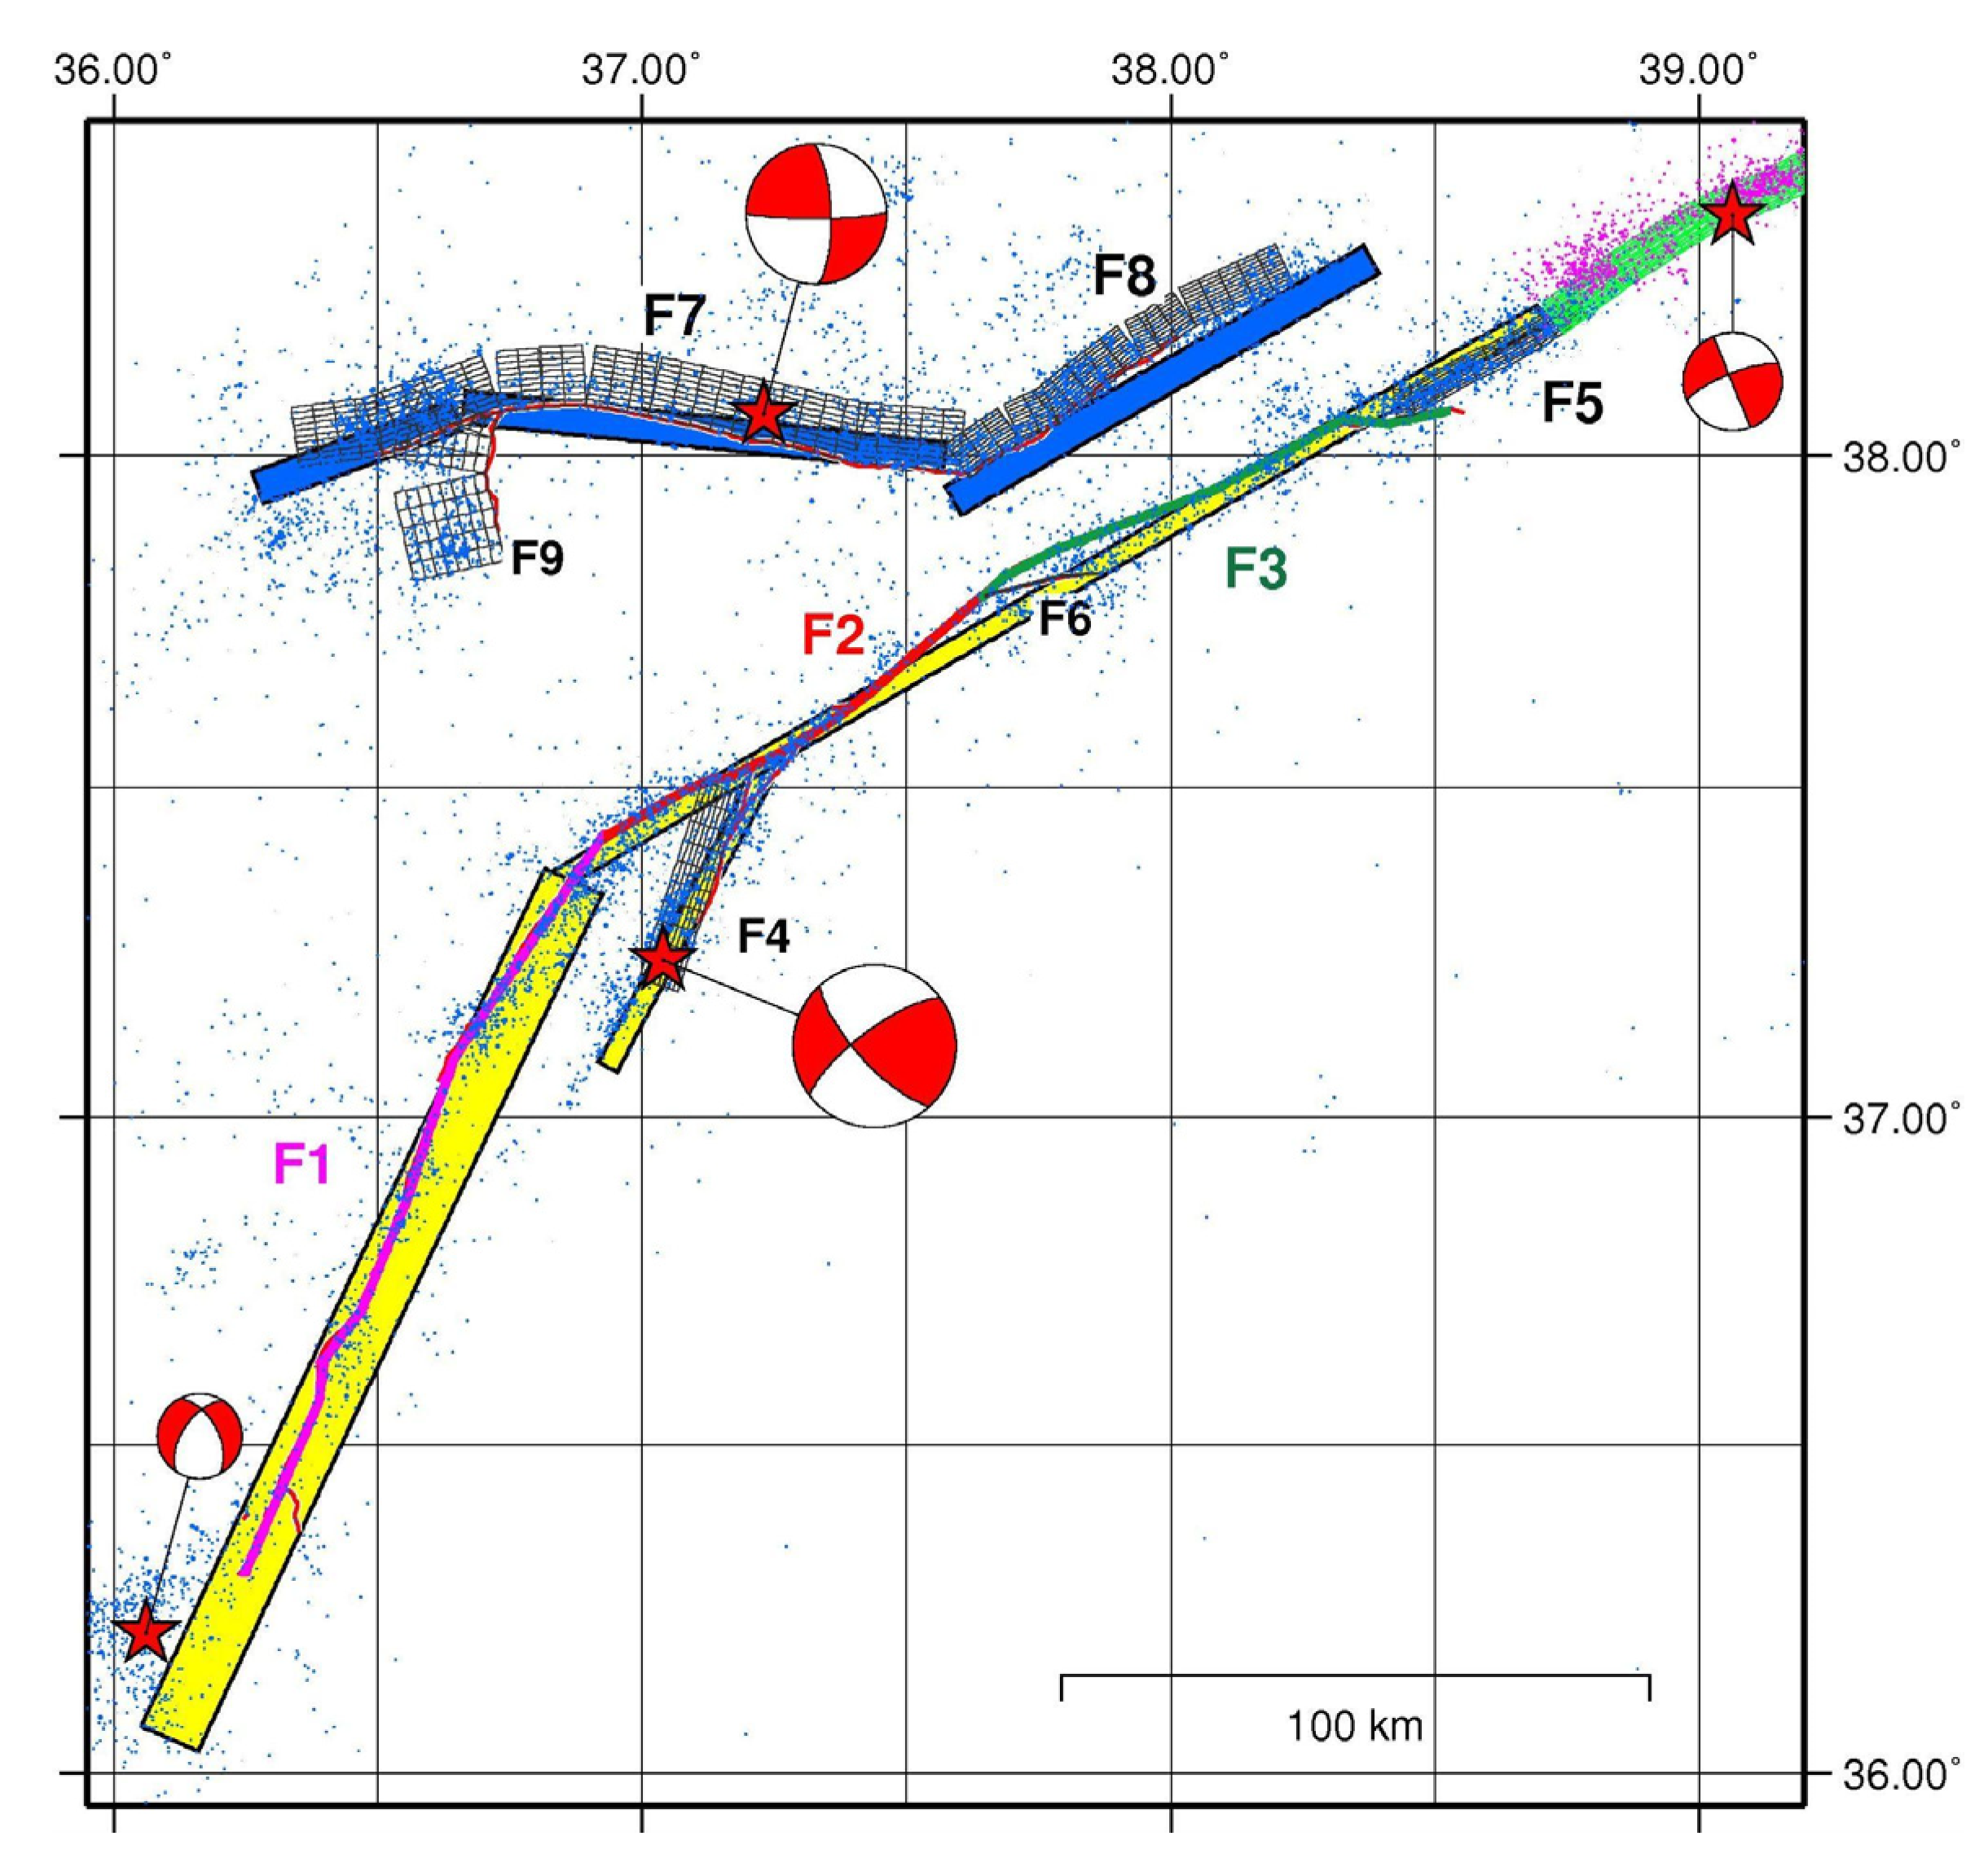
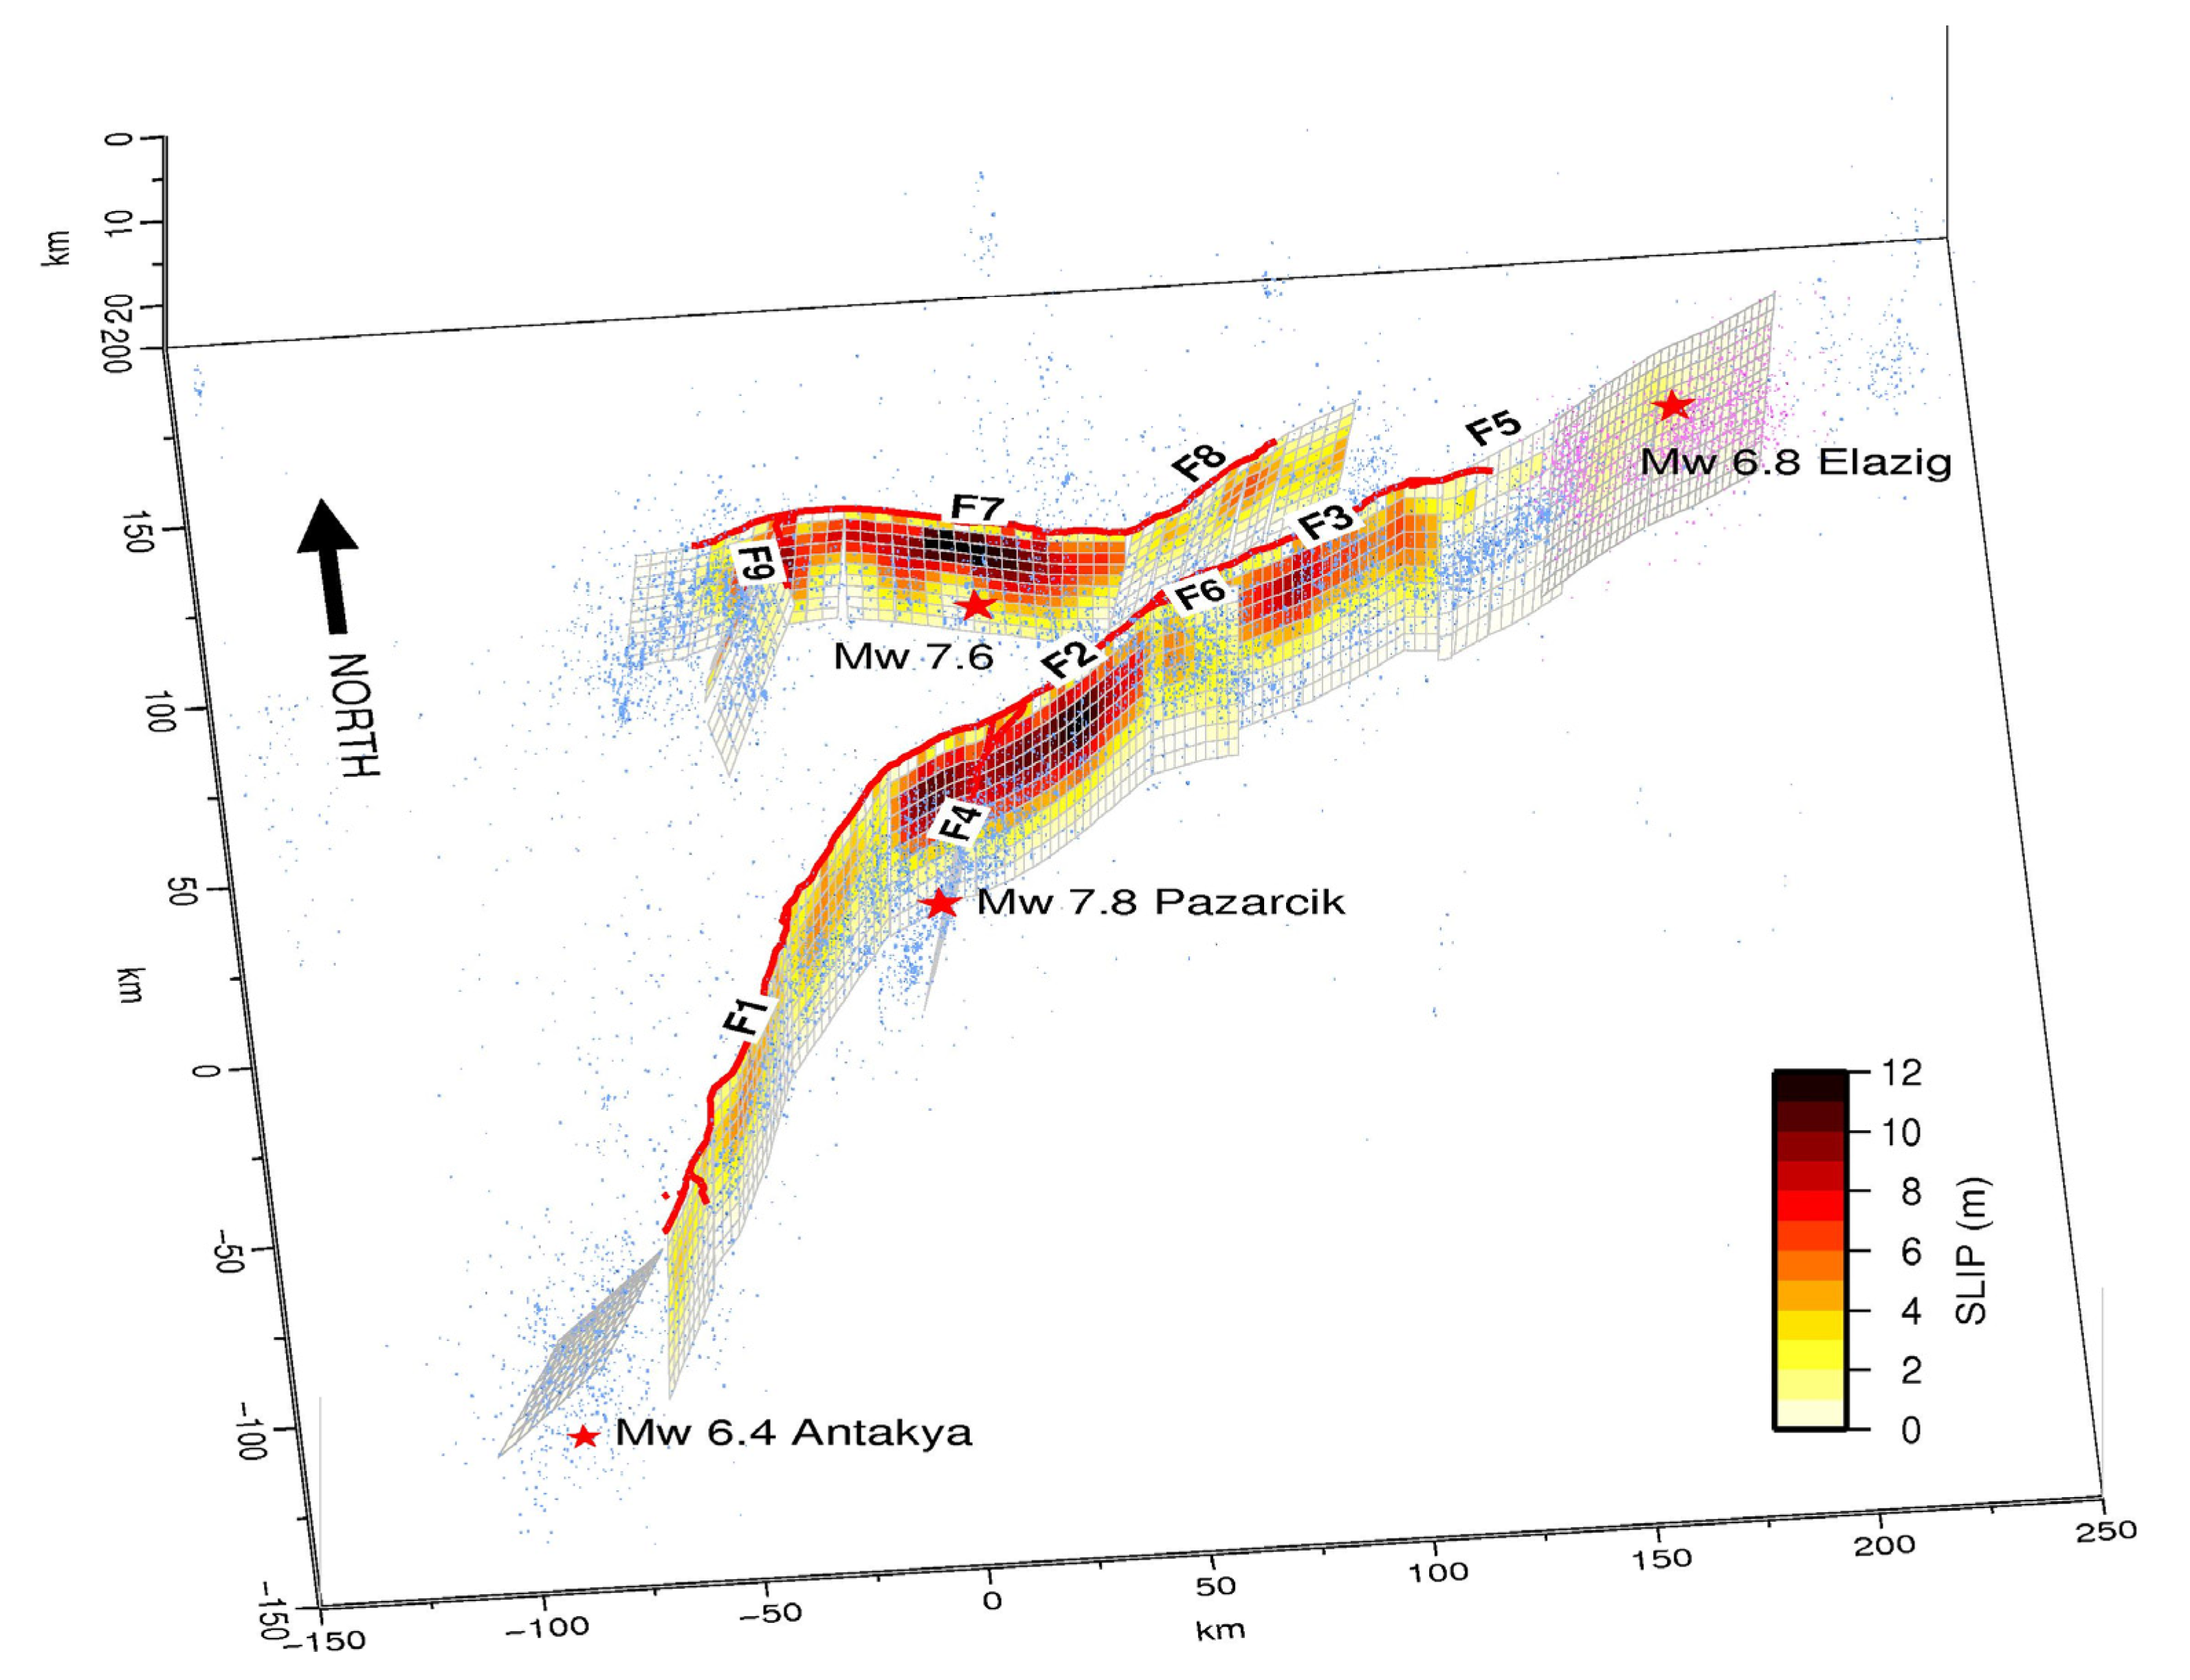
4.1. Source Modeling of the 6 February 2023 MW 7.8 and 7.6 Kahramanmaraş Earthquake Doublet

Our preferred best-fitting dislocation model of the first shock of the 2023 seismic sequence is composed of three primary vertical fault segments along the main branch of the EAFZ, releasing a total geodetic moment corresponding to an overall magnitude of MW 7.80. The second earthquake nucleated on the E–W trending Çardak–Savrun fault, located along the northern branch of the EAFZ, and released a total geodetic moment corresponding to a magnitude of MW 7.64. The fault locations and geometries are broadly consistent with those determined in previous geodetic inversion studies (e.g., [12,15,19]). Nevertheless, unlike earlier models, we implemented a variable strike for each fault segment, better capturing the surface expression of the EAFZ as inferred from surface deformation patterns and aftershock distribution.
Our slip model indicates that the maximum coseismic slip during the MW 7.8 event occurred on the Pazarcik segment, reaching a maximum slip of approximately 10 m. The area of significant slip extends northeastward onto the Erkenek segment (~8 m slip), tapering off toward the western tip of the Pütürge segment (Figure 12). In contrast, the Amanos segment southwest of Pazarcık shows a substantially lower average slip. During the second MW 7.6 event, the slip was strongly concentrated near the hypocentral patch of the Çardak–Savrun fault, with a peak slip of ~12 m (Figure 12). Toward both the western and eastern extremities of the rupture, the coseismic slip decreases sharply, likely due to significant changes in the fault strike. Notably, on the eastern side, the rupture does not extend along the Sürgü fault, which links the main branch of the EAFZ to its northern strand, but instead deviates along a previously unmapped structure within the tectonically complex Nurdag region.
Our slip distributions and rupture segmentation are in overall agreement with several recent models (e.g., [12,15,19]), particularly with respect to rupture lengths and slip gradients. However, in contrast to models such as [11,13,14], which tend to report lower peak slip values (~8–9 m) and smoother slip distributions due to coarser segmentation or kinematic averaging, our model resolves more localized high-slip patches, especially along the Çardak–Savrun fault. These findings are consistent with other studies (e.g., [12,15,19]) that report peak slip values of 12 m or more based on geodetic and/or seismological data along the same fault segment, confirming that our estimated maximum slip is within the plausible range supported by multiple datasets and methods. Similarly, while some studies [12,15,19] present comparable total moment releases, their fault geometries are simplified relative to ours, which explicitly includes the variable strike and curvature along nine fault segments. This higher geometric fidelity allows our model to more accurately capture the transition zones and segment boundaries, particularly at the southwestern and northeastern terminations of both mainshocks. Additionally, the shallow slip deficit noted, for example, by [12] is consistent with our model’s reduced slip at the surface along specific segments. Furthermore, regions with the highest slip correlate well with areas of elevated peak ground velocities and strong ground motions observed during the events [58]. Finally, our geodetic modeling of the MW 6.4 aftershock that occurred on February 20 indicates that the rupture affected a fault segment roughly 15 to 20 km in length, located at the southwestern tip of the February 6 MW 7.8 rupture (Figure 12). This segment lies along the southwestern most portion of the EAFZ, in the Hatay–Antakya region.

4.2. The Northeastern Termination of the 2023 Rupture: The Pütürge Segment

Our slip distribution, combined with the rupture model of the preceding 2020 MW 6.8 Elazığ earthquake [10], suggests that a potential 40–50 km long seismic gap remains at the southwestern termination of the Pütürge fault segment (Figure 12). Indeed, examining the slip distribution from both seismic sequences emphasizes that the southwestern segment of this fault did not experience significant coseismic slip. In contrast, the spatial distribution of the 2023 seismicity (blue circle in Figure 14) terminates closely to where the 2020 rupture and seismicity ends (pink dots in Figure 14). Moreover, previous studies show that the SW portion of the Pütürge segment has been stressed by both the 2020 Elazığ earthquake [10] and the 2023 seismic sequence [15]. This area draws particular attention due to the unresolved question surrounding the 1905 Ms 6.8 earthquake, whose rupture is debated to have occurred either along the Yarpuzlu restraining bend or further west on the Pütürge fault [8]. If the latter hypothesis proves incorrect, it would imply that the western section of the Pütürge segment has remained unruptured for centuries—pointing to a possible seismic gap and associated hazard.
To more accurately evaluate the seismic potential of this region and the deformation release mechanism, we conducted a detailed analysis of this segment, considering a number of moderate-size earthquakes (M 5.0–5.6) taking place along the western section of the Pütürge fault in recent years and observed by InSAR and a brand new GNSS interseismic velocity field [51] for the EAFZ region; focusing on the interseismic strain-rate analysis and dislocation modeling; and estimating the accumulation of the seismic moment on this segment of the fault system. In regard to the minor seismic events (MW 5.6 in August 2020 and MW 5.3 in April 2022), the modeled fault planes align with a predominantly pure left-lateral strike-slip faulting mechanism, rupturing only very small and shallow portions of the western part of the Pütürge fault, thus releasing a small amount of the seismic moment. The analysis of a brand new GNSS velocity field for the EAFZ region shows that along the EAFZ the strain-rates vary, with values of 50–70 nanostr/yr along the Palu and Pütürge segments, decreasing further SW across the Erkenek and Pazarcık segments, and transitioning to a transtensional regime in correspondence with the Amanos segment and the Hatay region (Figure 16). In particular, along the Pütürge segment, high strain-rate values (50–70 nanostr/yr) were observed, in agreement with previous studies suggesting an elevated strain-rate in this area [56]. To investigate how this deformation may be accommodated along the Pütürge segment, we subsequently performed dislocation modeling of interseismic GNSS velocities to estimate the slip-rate and interseismic locking depth on the different segments of the EAFZ. Our results indicate that the Pütürge segment is locked at approximately a 15–20 km depth (Figure 18), suggesting strong coupling across this segment and the potential accumulation of elastic energy along this portion of the EAFZ. This is consistent with prior studies that analyzed InSAR and GNSS data, which had suggested high coupling along the western section of the Pütürge segment, although their results were affected by significant uncertainties [9] and a clear east–west velocity gradient across the Pütürge segment.
For an individual fault, where the slip-rate, , is uniform over the depth, D, and the length, L, of the fault, the moment rate accumulation, , is [59]
= μ × × D × L
where μ is the assumed shear modulus. Using a shear modulus of 30 GPa, a locking depth of 15 km, a fault length of 40 km, and a uniform slip-rate of 10 mm/yr, we calculate a moment accumulation of 1.8 × 10¹⁷ Nm/yr (equivalent to a MW 5.4 earthquake/yr) for the western part of the Pütürge fault. If we assume that the 1905 Ms 6.8 event occurred on this segment, the accumulated seismic moment up to the present would correspond to 2.16 × 10¹⁸ Nm. Even if we subtract the contribution of the two smaller events that occurred in 2020 and 2022, with magnitudes of MW 5.6 and 5.3, respectively, most of the accumulated seismic moment should remain. Therefore, the fault retains the potential to generate an event exceeding MW 6.8 if all this energy is released in a single earthquake. Considering the variability in input parameters—specifically a locking depth between 10 and 20 km, a fault length between 40 and 50 km, and a slip-rate between 8 and 12 mm/yr—the total accumulated seismic moment since 1905 ranges from a minimum of 1.15 × 10¹⁸ Nm to a maximum of 4.32 × 10¹⁸ Nm. These values correspond to equivalent single-event magnitudes ranging from MW 6.61 to MW 7.12.
The ranges of the accumulated seismic moment and associated magnitudes presented above incorporate the variability in key input parameters such as the slip-rate, fault length, and locking depth. However, additional sources of uncertainty should be considered to fully characterize the reliability of these estimates. For example, varying the slip-rate between 8 and 12 mm/yr (±20%) results in a proportional change in the estimated moment accumulation rate of ±20%, given its linear relationship to the slip. Changing the locking depth from 10 to 20 km effectively doubles the fault area and, consequently, the moment rate, since the depth is a first-order control on the fault surface area. Similarly, a fault length variation between 40 and 50 km introduces a 25% difference in the moment accumulation, assuming a uniform slip and depth. When all parameters vary simultaneously within their respective plausible ranges, the combined uncertainty in the moment accumulation spans nearly a factor of four, corresponding to an estimated magnitude variation from MW 6.6 to MW 7.1. Altogether, these uncertainties do not invalidate the moment accumulation estimates but rather provide a realistic envelope around them.
It should be noted, however, that part of this accumulated energy could have been released aseismically through fault creep, thereby reducing the amount available for a possible seismic rupture. In this regard, previous studies [34,60] have suggested that the Pütürge segment exhibits both temporal and spatial variability in creep behavior. In particular, Refs. [34,60] highlight the presence of significant surface creep near the eastern termination of the 2020 Elazığ earthquake rupture, close to Lake Hazar, and further east along the Palu segment. In contrast, the western part of the fault appears to have experienced only a limited interseismic creep near the surface, both before and after the 2020 Elazığ event, leaving most of the fault likely unaffected by aseismic deformation. More recently, following the 6 February 2023 MW 7.8 earthquake, only about 10 cm of surface creep was observed within the following 8 months along the far southwestern section of the Pütürge segment [60]. Given our estimates of the interseismic locking along this segment and the limited evidence of aseismic creep in its western portion, we can reasonably conclude that a substantial portion of the accumulated strain is elastic and has probably not been released yet. This supports the hypothesis that the western Pütürge segment remains capable of generating a strong earthquake if the locked portion of the fault ruptures seismically in a single event.

4.3. The Southwestern Termination of the 2023 Rupture: The Hatay Region

Considering the complex structural characteristics of the Hatay region where the EAFZ interacts with the Dead Sea Fault Zone and the Cyprus Arc, therefore representing a triple junction, the seismogenic behavior of this area may differ from that of the more linear, strike-slip-dominated segments of the central EAFZ. In fact, this region appears to be an area of diffuse deformation, where the major faults are the termination of the EAFZ (i.e., the termination of the Pazarcik segment), the Amanos Fault (in the Karasu valley), the Karatas–Osmaniye Fault (KOF), and to the south, the onshore termination of the Cyprus Arc and the northernmost sector of the Dead Sea Fault.
To quantitatively assess the seismic potential of the fault segments in the Hatay region, located at the southwestern end of the 2023 rupture, we applied the same modeling approach adopted for the Pütürge segment, combining GNSS velocity data and fault geometry constraints to estimate the interseismic strain-rates and moment accumulation. Along the EAFZ, the strain-rates vary, with values of 50–70 nanostr/yr along the northeastern segments, decreasing further SW across the Erkenek and Pazarcık segments, and transitioning to a trans-tensional regime in correspondence to the Hatay region. Here the strain-rate appears to be distributed along different structures, and the interseismic GNSS observations show at least two velocity gradients across the Amanos and the KOF, respectively (see profile a in Figure 18), which is in agreement with the results in the literature (e.g., [61,62]). The dislocation modeling results of interseismic velocities indicate that both the Amanos and the KOF segments are locked at approximately a 15 km depth, with a higher slip-rate along the KOF segment compared to the Amanos fault. Specifically, the estimated slip-rate on the Amanos segment is about 4 mm/yr, while the KOF segment shows a higher value of about 6 mm/yr. Moreover, in agreement with previous studies (e.g., [62]), fully reproducing the observed GNSS velocities along this profile requires the inclusion of an additional dislocation located approximately midway between the Amanos and KOF segments. This suggests the presence of a secondary, potentially active structure that contributes to the overall strain accommodation in the region. The slip-rate along the Dead Sea Fault also varies geographically, ranging from approximately 2.8 mm/yr in its northernmost section to about 5 mm/yr toward the south (e.g., [63]). However, this fault is not covered by the interseismic velocity field used in this study, and therefore no direct modeling was performed for this structure.
This area has experienced several large historical earthquakes, highlighting its high seismic potential. Notable events include the M7.4 earthquake in 1513 along the KOF segment, the M7.4 in 1822 and the M7.2 in 1872 along the Amanos segment, and the M7.4 earthquake in 1408 along the Dead Sea Fault (e.g., [8]). Using a shear modulus of 30 GPa, a locking depth of 15 km, a fault length of 100 km, and a uniform slip-rate of 4 mm/yr, it is possible to calculate a moment accumulation of 1.8 × 10¹⁸ Nm/yr for the entire Amanos fault. Given that the estimated magnitude of the 2023 earthquake on the Amanos segment is approximately M7.5, which is comparable to the moment accumulated since the last major event in 1872, this suggests that this segment has released nearly all the strain accumulated over the past 150 years.
Given a fault length of 50–60 km, a locking depth of 15 km, and an average slip-rate ranging from 5 to 6 mm/yr, we estimate a moment rate accumulation along the KOF segment between 1.1 × 10¹⁸ and 1.6 × 10¹⁸ Nm/yr. Taking into account that the most recent significant earthquake on this fault occurred in 1513 (M7.4), the accumulated moment since then (~510 years) ranges between 5.7 × 10²⁰ and 8.3 × 10²⁰ Nm. This translates to a moment magnitude of approximately MW 7.77−7.88, suggesting that the fault may be approaching the end of its seismic cycle and is capable of generating another large event. It is also likely that, between the Amanos fault and KOF, there is an additional offshore structure that accommodates part of the deformation. This potential structure could be crucial in distributing the strain in the region, potentially reducing the stress accumulation on the onshore segments.
The entire Hatay region, which includes several active faults along with the northern segment of the Dead Sea Fault, has been significantly stressed by the 2023 seismic sequence. Historical records and numerical tsunami simulations have documented the occurrence of significant earthquake-induced tsunamis along the coasts of Hatay, Syria, and the Levantine Basin in the Eastern Mediterranean. Despite this, the 2023 seismic sequence did not trigger a major earthquake along the Dead Sea Fault or the Cyprus Arc. As a result, these areas likely represent potential sources for future large earthquakes, with the most recent major event on the Dead Sea Fault being the M7.4 earthquake of 1408.

5. Conclusions

In this study, we provided an in-depth analysis of the 2023 Kahramanmaraş earthquake sequence, focusing on the source modeling and the seismogenic behavior of the various involved segments. To better assess the seismic potential along the East Anatolian Fault Zone (EAFZ), it was essential to define in detail the rupture geometry and slip distribution, as these factors have a significant impact on ground motion amplitudes.
The occurrence of large peak ground velocities and strong ground motions is closely associated with areas of major slip, thus emphasizing the significance of the slip distribution in seismic hazard evaluations. The complexity of the fault slip during an earthquake contributes to the variability of the near-source ground motion and amplification, particularly at sites located directly above the fault plane, where damage tends to be more severe [58,64]. Understanding these relationships is essential for enhancing our knowledge of ground shaking behavior and the interaction between the causative fault and wave propagation in a seismically active region. In this context, evaluating the strain accumulation and analyzing recent seismicity are of utmost importance for assessing rupture characteristics and associated ground motion patterns.
Our results emphasize the complex and heterogeneous nature of the region’s faulting, with a distinct slip behavior and moment accumulation observed along the various segments of the EAFZ, particularly at the terminations of the 2023 and 2020 ruptures. Most segments of the EAFZ experience aseismic slip at the base of the brittle, velocity-weakening zone, at depths of approximately 15–20 km. Following the 2023 and 2020 seismic sequences, much of the EAFZ has likely released the seismic deformation accumulated since the previous major event. This release of strain has significantly impacted the distribution of the seismic energy in the region, potentially altering the stress patterns along various fault segments.
The Pütürge segment remains a region of significant interest, especially due to the potential seismic gap observed along its southwestern portion. Our results indicate that the western section of the Pütürge segment is strongly locked and may accumulate substantial strain, which could lead to a large earthquake if this portion of the fault ruptures in the future. The results point to a potentially high seismic hazard for this segment, with the accumulated seismic moment corresponding to magnitudes in the range of MW 6.6 to MW 7.1.
In the Hatay region, the fault behavior appears more complex. The Amanos fault likely released most of its accumulated strain during the 2023 rupture. In contrast, the KOF segment, with a higher slip-rate, has shown substantial moment accumulation since the 1513 M7.4 earthquake, suggesting a great potential for future seismic activity. The presence of a possible additional offshore structure between the Amanos fault and KOF could play a role in accommodating some of the region’s deformation, thus influencing distribution of the strain and of possible future ruptures. The Hatay region, where the EAFZ interacts with the Dead Sea Fault and the Cyprus Arc, remains an area of significant seismic hazard. Despite the large 2023 seismic sequence, the region did not experience major earthquakes along the Dead Sea Fault or the Cyprus Arc, which have historically been sites of large events, including the M7.4 earthquake of 1408. Given the historical record and the continuing accumulation of strain along these fault systems, as well as due to the local impact on the stress field (Coulomb effect) of the 2023 seismic sequence, this sector of the Middle East likely represents the source of future large-magnitude earthquakes.
Finally, the complexity of fault interactions, particularly the interplay between the EAFZ, Dead Sea Fault, and Cyprus Arc, underscores the need for continued monitoring and modeling efforts to better assess seismic risks in the region and refine our understanding of the seismic cycles in this tectonically complex and seismically active area.

Supplementary Materials

The following supporting information can be downloaded at https://www.mdpi.com/article/10.3390/rs17132270/s1: Figure S1: Relationship between RMS (in mm) data reduction and relative weighting factors; Figure S2: Slip uncertainty of the Türkiye earthquake doublet.

Author Contributions

Conceptualization, D.C.; Data curation N.A.F.; Formal analysis, D.C., N.A.F., A.A., R.C. and A.V.; Investigation D.C., N.A.F., A.A., R.C. and A.V.; Methodology D.C., N.A.F., A.A., R.C. and A.V.; Supervision, D.C.; Visualization, D.C., N.A.F., A.A., R.C. and A.V.; Writing—original draft, D.C.; Writing—review and editing, D.C., N.A.F., A.A., R.C. and A.V. All authors have read and agreed to the published version of the manuscript.

Funding

This research received no external funding.

Data Availability Statement

Relocated seismicity in this study is available in [zenodo data repository] at [https://zenodo.org/records/7699882 (accessed on 1 February 2024)]. GNSS offsets are found online (NGL, available at https://geodesy.unr.edu/news_items/20230213/us6000jllz_final5min.txt (accessed on 1 February 2024) and at https://geodesy.unr.edu/news_items/20230213/us6000jlqa_final5min.txt (accessed on 1 February 2024). The original data, i.e., down-sampled InSAR (ALOS-2 and Sentinel-1), presented in this study are openly available in [zenodo data repository] at [https://zenodo.org/records/15245231 (accessed on 19 April 2025)]. ALOS-2 PALSAR2 data are copyright of the Japan Aerospace Exploration Agency, JAXA (2023). Sentinel-1 data are copyright of Copernicus (2023).

Acknowledgments

We thank the Editor Nona Cai and three anonymous reviewers for their valuable suggestions that improved the manuscript. All the figures were created using GMT software version 5.4 [65].

Conflicts of Interest

The authors declare no conflicts of interest.

References

  1. Reilinger, R.; McClusky, S.; Vernant, P.; Lawrence, S.; Ergintav, S.; Cakmak, R.; Ozener, H.; Kadirov, F.; Guliev, I.; Stepanyan, R.; et al. GPS constraints on continental deformation in the Africa-Arabia-Eurasia continental collision zone and implications for the dynamics of plate interactions. J. Geophys. Res. 2006, 111, B05411. [Google Scholar] [CrossRef]
  2. McClusky, S.; Balassanian, S.; Barka, A.; Demir, C.; Ergintav, S.; Georgiev, I.; Gurkan, O.; Hamburger, M.; Hurst, K.; Kahle, H.; et al. Global Positioning System constraints on plate kinematics and dynamics in the eastern Mediterranean and Caucasus. J. Geophys. Res. 2000, 105, 5695–5719. [Google Scholar] [CrossRef]
  3. Aktung, B.; Ozener, H.; Dogru, A.; Sanbucu, A.; Turgut, B.; Halicioglu, K.; Yilmaz, O.; Havazli, E. Slip rates and seismic potential on the East Anatolian Fault System using an improved GPS velocity field. J. Geod. 2016, 94–95, 1–12. [Google Scholar] [CrossRef]
  4. Hempton, M.R.; Dewey, J.F.; Saroglu, F. The East Anatolian transform fault: Along strike variations in geometry and behavior. Eos Tran. Am. Geophys. Union 1981, 62, 393. [Google Scholar]
  5. Barka, A.A.; Kandinsky-Cade, K. Strike-slip fault geometry in Turkey and its influence in earthquake activity. Tectonics 1988, 7, 663–684. [Google Scholar] [CrossRef]
  6. Saroglu, F.; Emre, O.; Kuscu, O. The East Anatolian fault zone of Turkey. Ann. Tecton. 1992, 6, 99–125. [Google Scholar]
  7. Duman, T.Y.; Emre, O. The East Anatolian Fault: Geometry, segmentation and jog characteristics. Geol. Soc. Lond. Spec. Publ. 2013, 372, 495–529. [Google Scholar] [CrossRef]
  8. Ambraseys, N.N. Temporary seismic quiescence: SE Turkey. Geophys. J. Int. 1989, 96, 311–331. [Google Scholar] [CrossRef]
  9. Bletery, Q.; Cavalie, O.; Nocquet, J.-M.; Ragon, T. Distribution of interseismic coupling along the North and East Anatolian Faults inferred from InSAR and GPS data. Geophys. Res. Lett. 2020, 47, e2020GL087775. [Google Scholar] [CrossRef]
  10. Cheloni, D.; Akinci, A. Source modelling and strong ground motion simulations for the 24 January 2020, Mw 6.8 Elazığ earthquake, Turkey. Geophys. J. Int. 2020, 223, 1054–1068. [Google Scholar] [CrossRef]
  11. Melgar, D.; Taymaz, T.; Ganas, A.; Crowell, B.; Öcalan, T.; Kahraman, M.; Tsironi, V.; Yolsal-Çevikbilen, S.; Valkaniotis, S.; Irmak, T.S.; et al. Sub- and super-shear ruptures during the 2023 Mw 7.8 and Mw 7.6 earthquake doublet in SE Türkiye. Seismica 2023, 2, 1–10. [Google Scholar] [CrossRef]
  12. Barbot, S.; Luo, H.; Want, T.; Hamiel, Y.; Platibratova, O.; Javed, M.T.; Braitenberg, C.; Gurbuz, G. Slip distribution of the February 6, 2023 Mw 7.8 and Mw 7.6 Kahramanmaras, Turkey earthquake sequence in the East Anatolian Fault Zone. Seismica 2023, 2, 1–17. [Google Scholar] [CrossRef]
  13. Tong, X.; Wang, Y.; Chen, S. Coseismic Deformation of the 2023 Türkiye Earthquake Doublet from Sentinel-1 InSAR and Implications for Earthquake Hazard. Seismol. Res. Lett. 2023, 95, 574–583. [Google Scholar] [CrossRef]
  14. Liu, C.; Lay, T.; Wang, R.; Taymaz, T.; Xie, Z.; Xiong, X.; Irmak, T.S.; Kahraman, M.; Erman, C. Complex multi-fault rupture and triggering during the 2023 earthquake doublet in southeastern Türkiye. Nat. Commun. 2023, 14, 5564. [Google Scholar] [CrossRef] [PubMed]
  15. Xu, L.; Aoki, Y.; Wang, J.; Cui, Y.; Chen, Q.; Yang, Y.; Yao, Z. The 2023 Mw 7.8 and 7.6 Earthquake Doublet in Southeast Türkiye: Coseismic and Early Postseismic Deformation, Faulting Model, and Potential Seismic Hazard. Seismol. Res. Lett. 2023, 95, 562–573. [Google Scholar] [CrossRef]
  16. Wang, Z.; Zhang, W.; Taymaz, T.; He, Z.; Xu, T.; Zhang, Z. Dynamic Rupture Process of the 2023 Mw 7.8 Kahramanmaras Earthquake (SE Türkiye): Variable Rupture Speed and Implications for Seismic Hazard. Geophys. Res. Lett. 2023, 50, e2023GL104787. [Google Scholar] [CrossRef]
  17. Delouis, B.; van den Ende, M.; Ampuero, J.-P. Kinematic Rupture Model of the 6 February 2023 Mw 7.8 Türkiye Earthquake from a Large Set of Near-Source Strong-Motion Records Combined with GNSS Offsets Reveals Intermittent Supershear Rupture. Bull. Seismol. Soc. Am. 2023, 114, 726–740. [Google Scholar] [CrossRef]
  18. Okuwaki, R.; Yagi, Y.; Taymaz, T.; Hicks, S.P. Multi-Scale Rupture Growth With Alternating Directions in a Complex Fault Network During the 2023 South-Eastern Türkiye and Syria Earthquake Doublet. Geophys. Res. Lett. 2023, 50, e2023GL103480. [Google Scholar] [CrossRef]
  19. Jia, Z.; Jin, Z.; Marchandon, M.; Ulrich, T.; Gabriel, A.-A.; Fan, W.; Shearer, P.; Zou, X.; Resoske, J.; Bulut, F.; et al. The complex dynamics of the 2023 Kahramanmaras, Turkey, Mw 7.8-7.7 earthquake doublet. Science 2023, 381, 985–990. [Google Scholar] [CrossRef]
  20. Tung, S.; Sippl, C.; Shirzaei, M.; Taymaz, T.; Masterlark, T.; Medved, I. Structural Controls on Fault Slip Models of the 6 February 2023 Kahramanmaras, Türkiye Earthquake Doublet With Finite Element Analyses. Geophys. Res. Lett. 2024, 51, e2023GL107472. [Google Scholar] [CrossRef]
  21. Ren, C.; Wang, Z.; Taymaz, T.; Hu, N.; Zhao, Z.; Yue, H.; Song, X.; Shen, Z.; Xu, H.; Geng, J.; et al. Supershear triggering and cascading fault ruptures of the 2023 Kahramanmaras, Türkiye, earthquake doublet. Science 2024, 383, 305–311. [Google Scholar] [CrossRef] [PubMed]
  22. Zhou, J.; Xu, Y.; Zhang, Y.; Feng, W.; Taymaz, T.; Chen, Y.-T.; Xu, C.; Xu, B.; Wang, R.; Shi, F.; et al. Geometric barriers impacted rupture processes and stress releases of the 2023 Kahramanmaras, Turkiye, earthquake doublet. Commun. Earth Environ. 2025, 6, 56. [Google Scholar] [CrossRef]
  23. Liu, J.; Huang, C.; Zhang, G.; Shan, X.; Korzhenkov, A.; Taymaz, T. Immature characteristics of the East Anatolian Fault Zone from SAR, GNSS and strong motion data of the 2023 Turkiye-Syria earthquake doublet. Sci. Rep. 2024, 14, 10625. [Google Scholar] [CrossRef]
  24. Zhao, J.-J.; Chen, Q.; Yang, Y.-H.; Xu, Q. Coseismic Faulting Model and Post-Seismic Surface Motion of the 2023 Turkey-Syria Earthquake Doublet Revealed by InSAR and GPS Measurements. Remote Sens. 2023, 15, 3327. [Google Scholar] [CrossRef]
  25. Nalbant, S.S.; McCluskey, J.; Steacy, S.; Barka, A.A. Stress accumulation and increased seismic risk in eastern Turkey. Earth Planet. Sci. Lett. 2002, 195, 291–298. [Google Scholar] [CrossRef]
  26. Ambraseys, N.N.; Jackson, J.A. Faulting associated with historical and recent earthquakes in the Eastern Mediterranean region. Geophys. J. Int. 1998, 133, 390–406. [Google Scholar] [CrossRef]
  27. Herece, E. Dogu Anadolu Fayi (DAF) Atlasi. General Directorate of Mineral Research and Exploration; Serial Number, 14; Special Publications: Ankara, Turkey, 2008; p. 359. [Google Scholar]
  28. Kondorskaya, N.V.; Ulomov, V.I. Special Catalogue of Earthquakes of Northern Eurasia from Ancient Times Through 1995 (SECNE). 1999. Available online: http://seismo.ethz.ch/static/gshap/neurasia/nordasiacat.txt (accessed on 1 February 2024).
  29. Caputo, R. Ground effects of large morphogenic earthquakes. J. Geodyn. 2005, 40, 113–118. [Google Scholar] [CrossRef]
  30. Reitman, N.G.; Briggs, R.W.; Barnhart, W.D.; Hatem, A.E.; Jobe, J.A.T.; DuRoss, C.B.; Gold, R.D.; Mejstrik, J.D.; Collett, C.; Koehler, R.D.; et al. Rapid surface rupture mapping from satellite data: The 2023 Kahramanmaras, Turkey (Türkiye), earthquake sequence. Seism. Rec. 2023, 3, 289–298. [Google Scholar] [CrossRef]
  31. Lomax, A. Precise, NNL-SSST-Coherence Hypocenter Catalog for the 2023 Mw 7.8 and Mw 7.6 Turkey Earthquake Sequence, March 2023. 2023. Available online: https://zenodo.org/records/7699882 (accessed on 1 February 2024). [CrossRef]
  32. Melgar, D.; Ganas, A.; Taymaz, T.; Valkaniotis, S.; Crowell, B.W.; Kapetanidis, V.; Tsironi, V.; Yolsal-Cevikbilen, S.; Ocalan, T. Rupture kinematics of 2020 January 24 Mw 6.7 Doganyiol-Sivrice, Turkey earthquake on the East Anatolian Fault Zone imaged by space geodesy. Geophys. J. Int. 2020, 223, 862–874. [Google Scholar] [CrossRef]
  33. Cetin, H.; Guneyli, H.; Mayer, K. Paleoseismology of the Palu-Lake Hazar segment of the East Anatolian Fault Zone, Turkey. Tectonophysics 2003, 374, 163–197. [Google Scholar] [CrossRef]
  34. Cakir, Z.; Dogan, U.; Akoglu, A.M.; Ergintav, S.; Ozarpaci, S.; Ozdemir, A.; Nozadkhalil, T.; Cakir, N.; Zabci, C.; Ekoc, M.H.; et al. Arrest of the Mw 6.8 January 24, 2020 Elazig (Turkey) earthquake by shallow fault creep. Earth Planet. Sci. Lett. 2023, 608, 118085. [Google Scholar] [CrossRef]
  35. Pousse-Beltran, L.; Nissen, E.; Bergman, E.A.; Cambaz, M.D.; Gaudreau, E.; Karasozen, E.; Tan, F. The 2020 Mw 6.8 Elazig (Turkey) Earthquake Reveals Rupture Behavior of the East Anatolian Fault. Geophys. Res. Lett. 2020, 47, e2020GL088136. [Google Scholar] [CrossRef]
  36. Guvercin, S.E. 2023 Earthquake Doublet in Türkiye Reveals the Complexities of the East Anatolian Fault Zone: Insights from Aftershock Patterns and Moment Tensor Solutions. Seismol. Res. Lett. 2023, 95, 664–679. [Google Scholar] [CrossRef]
  37. Seyrek, A.; Demir, T.; Westway, R.; Guillou, H.; Scaillet, S.; White, T.S.; Bridgland, D.R. The kinematics of central-southern Turkey and northwest Syria revisited. Tectonophysics 2014, 618, 35–66. [Google Scholar] [CrossRef]
  38. Massonnet, D.; Feigl, K.L. Radar interferometry and its application to changes in the Earth’s surface. Rev. Geophys. 1998, 36, 441–500. [Google Scholar] [CrossRef]
  39. Takaku, J.; Tadono, T.; Tsutsui, K. Generation of high resolution global DSM from ALOS PRISM. Int. Arch. Photogramm. Remote Sens. Spat. Inf. Sci. 2014, XL-4, 243–248. [Google Scholar] [CrossRef]
  40. Goldstein, R.M.; Werner, C.L. Radar interferogram filtering for geophysical applications. Geophys. Res. Lett. 1998, 25, 4035–4038. [Google Scholar] [CrossRef]
  41. Costantini, M. A novel phase unwrapping method based on network programming. IEEE Trans. Geosci. Remote Sens. 1998, 36, 813–821. [Google Scholar] [CrossRef]
  42. Okada, Y. Surface deformation due to shear and tensile faults in a half-space. Bull. Seism. Soc. Am. 1985, 75, 1135–1154. [Google Scholar] [CrossRef]
  43. Lohman, R.B.; Simons, M. Some thoughts on the use of InSAR data to constrain models of surface deformation: Noise structure and data downsampling. Geochem. Geophys. Geosyst. 2005, 6, Q01007. [Google Scholar] [CrossRef]
  44. Cheloni, D.; De Novellis, V.; Albano, M.; Antonioli, A.; Anzidei, M.; Atzori, S. Geodetic model of the 2016 Central Italy earthquake sequence inferred from InSAR and GPS data. Geophys. Res. Lett. 2017, 44, 6778–6787. [Google Scholar] [CrossRef]
  45. Cheloni, D.; Falcucci, E.; Gori, S. Half-Graben Rupture Geometry of the 30 October 2016 Mw 6.6 Mt. Vettore-Mt. Bove Earthquake, Central Italy. J. Geophys. Res. 2019, 124, 4091–4118. [Google Scholar] [CrossRef]
  46. Atzori, S.; Hunstad, I.; Chini, M.; Salvi, S.; Tolomei, C.; Bignami, C.; Stramondo, S.; Trasatti, E.; Antonioli, A.; Boschi, E. Finite fault inversion of DInSAR coseismic displacement of the 2009 L’Aquila earthquake (Central Italy). Geophys. Res. Lett. 2009, 36, L15305. [Google Scholar] [CrossRef]
  47. Cheloni, D.; D’Agostino, N.; D’Anastasio, E.; Avallone, A.; Mantenuto, S.; Giuliani, R.; Mattone, M.; Calcaterra, S.; Gambino, P.; Dominici, D.; et al. Coseismic and initial post-seismic slip of the 2009 Mw 6.3 L’Aquila earthquake, Italy, from GPS measurements. Geophys. J. Int. 2010, 181, 1539–1546. [Google Scholar] [CrossRef]
  48. Cheloni, D.; Famiglietti, N.A.; Caputo, R.; Tolomei, C.; Vicari, A. A Composite Fault Model for the 2024 Mw 7.4 Hualien Earthquake Sequence in Eastern Taiwan Inferred From GNSS and InSAR data. Geophys. Res. Lett. 2024, 51, e2024GL110255. [Google Scholar] [CrossRef]
  49. Stark, P.B.; Parker, R.L. Bounded-values least-squares algorithm—An algorithm and implications. Comput. Stat. 1995, 10, 129–141. [Google Scholar]
  50. Corana, A.; Marchesi, M.; Martini, C.; Ridella, S. Minimizing multimodal functions of continuous variables with the “Simulated Annealing” algorithm. ACM Trans. Math. Softw. 1987, 13, 262–280. [Google Scholar] [CrossRef]
  51. Kurt, A.I.; Ozbakir, A.D.; Cingoz, A.; Ergintav, S.; Dogan, U.; Ozarpaci, S. Contemporary Velocity Field for Turkey Inferred from Combination of a Dense Network of Long Term GNSS Observations. Turk. J. Earth Sci. 2023, 32, 275–293. [Google Scholar] [CrossRef]
  52. Kremer, C.; Blewitt, G.; Klein, E.C. A geodetic plate motion and Global Strain Rate Model. Geochem. Geophys. Geosyst. 2014, 15, 3849–3889. [Google Scholar] [CrossRef]
  53. Shen, Z.-K.; Wang, M.; Zeng, Y.; Wang, F. Optimal Interpolation of Spatially Discretized Geodetic Data. Bull. Seism. Soc. Am. 2015, 105, 2117–2127. [Google Scholar] [CrossRef]
  54. Walters, R.J.; Parsons, B.; Wright, T.J. Constraining crustal velocity fields with InSAR for Eastern Turkey: Limits to the block-like behavior of Eastern Anatolia. J. Geophys. Res. 2014, 119, 5215–5234. [Google Scholar] [CrossRef]
  55. Cavalié, O.; Jonsson, S. Block-like plate movements in eastern Anatolia observed by InSAR. Geophys. Res. Lett. 2014, 41, 26–31. [Google Scholar] [CrossRef]
  56. Weiss, J.R.; Walters, R.J.; Morishita, Y.; Wright, T.J.; Lazecky, M.; Wang, H.; Hussain, E.; Hooper, A.J.; Elliott, J.R.; Rolling, C.; et al. High-Resolution Surface Velocities and Strain for Anatolia From Sentinel-1 InSAR and GNSS Data. Geophys. Res. Lett. 2020, 47, e2020GL087376. [Google Scholar] [CrossRef]
  57. Cetin, S.; Ergintav, S.; Dogan, U.; Cakir, Z.; Senturk, S.; Karabulut, H.; Saroglu, F.; Julaiti, W.; Ozener, H. Investigation of the Creep Along the Hazar-Palu Section of the East Anatolian Fault (Turkey) Using InSAR and GPS Observations. In Proceedings of the EGU General Assembly 2016, Vienna, Austria, 17–22 April 2016; Geophysical Research Abstracts. 2016; Volume 18, p. EGU2016-3938. Available online: https://meetingorganizer.copernicus.org/EGU2016/EGU2016-3938.pdf (accessed on 1 February 2024).
  58. Akinci, A.; Pitarka, P.; Artale, P.; De Gori, P.; Buttinelli, M. Impact of the Earthquake Rupture on Ground Motion Variability of the August 24, 2016 Mw6.2 Amatrice Earthquake, Italy. Bull. Seismol. Soc. Am. 2024, 114, 2823–2845. [Google Scholar] [CrossRef]
  59. Kostrov, V.V. Seismic moment and energy of earthquakes, and seismic flow of rock. Izv. Earth Phys. 1974, 1, 23–40. [Google Scholar]
  60. Funning, G.; Hofstetter, C.; Ozarpaci, S. Temporally variable creep behavior on the East Anatolian Fault and the arrest of the 2023 Pazarcik earthquake rupture. In Proceedings of the EGU General Assembly 2025, Vienna, Austria, 27 April–2 May 2025; Geophysical Research Abstracts. 2025; p. EGU25-15399. [Google Scholar] [CrossRef]
  61. Yildiz, S.S.; Ozkan, A.; Yavasoglu, H.H.; Masson, F.; Tiryakioglu, I.; Alkan, M.N.; Bilgi, S. Determination of recent tectonic deformations in the vicinity of Adana-Osmaniye-Hatay-Gaziantep triple junction region by half-space modeling. C. R. Geosci. 2020, 352, 225–234. [Google Scholar] [CrossRef]
  62. Ozkan, A.; Yavasoglu, H.H.; Masson, F. Present-day strain accumulations and fault kinematics at the Hatay Triple Junction using new geodetic constraints. Tectonophysics 2023, 854, 229819. [Google Scholar] [CrossRef]
  63. Li, X.; Jonsson, S.; Liu, S.; Ma, Z.; Castro-Perdomo, N.; Cesca, S.; Masson, F.; Klinger, Y. Resolving the slip-rate inconsistency of the northern Dead Sea Fault. Sci. Adv. 2024, 10, eadj8408. [Google Scholar] [CrossRef]
  64. Pitarka, A.; Akinci, A.; De Gori, P.; Buttinelli, M. Deterministic 3D ground-motion simulations (0–5 Hz) and surface topography effects of the 30 October 2016 Mw 6.5 Norcia, Italy, earthquake. Bull. Seism. Soc. Am. 2022, 112, 262–286. [Google Scholar] [CrossRef]
  65. Wessel, P.; Smith, W.H.F. New improved version of the generic mapping tools released. Eos Trans. Am. Geophys. Union 1998, 79, 579. [Google Scholar] [CrossRef]
Figure 2. A close view of the Pütürge segment along the EAFZ. Contouring lines (in cm) represent the major estimated coseismic slip regions of the 2020 MW 6.8 Elazığ earthquake [10]. The red stars are the locations of the 2020 Elazığ mainshock and of the 4 August 2020 MW 5.6 and the 9 April 2022 MW 5.3 seismic events along the southwestern termination of the Pütürge segment (violet solid line). Yellow stars are major historical events [8,26,28]. Pink dots represent the relocated 2020 Elazığ seismicity [32], while blue dots represent the relocated 2023 aftershocks [31].
Remotesensing 17 02270 g002
Figure 3. The ALOS-2 descending orbit displacement map relative to the 2023 MW 7.8 and 7.6 earthquake doublet. The data (a), model (b), and residual points (c) from the unwrapped interferogram depicting the coseismic displacement pattern. The red stars indicate the mainshock epicenters provided by the AFAD. White triangles represent the location of the GNSS stations.
Remotesensing 17 02270 g003
Figure 4. The ALOS-2 ascending orbit displacement map relative to the 2023 MW 7.8 and 7.6 earthquake doublet. The data (a), model (b), and residual points (c) from the unwrapped interferogram depicting the coseismic displacement pattern. The red stars indicate the mainshock epicenters provided by the AFAD. White triangles represent the location of the GNSS stations.
Remotesensing 17 02270 g004
Figure 5. Sentinel-1 descending orbit offset displacement maps relative to the 2023 MW 7.8 and 7.6 earthquake doublet. The data (a), model (b), and residual points (c) from the range offset interferograms depicting the coseismic displacement pattern. The red stars indicate the mainshock epicenters provided by the AFAD. White triangles represent the location of the GNSS stations.
Remotesensing 17 02270 g005
Figure 6. Sentinel-1 ascending orbit offset displacement maps relative to the 2023 MW 7.8 and 7.6 earthquake doublet. The data (a), model (b), and residual points (c) from the range offset interferograms depicting the coseismic displacement pattern. The red stars indicate the mainshock epicenters provided by the AFAD. White triangles represent the location of the GNSS stations.
Remotesensing 17 02270 g006
Figure 7. Sentinel-1 InSAR displacement maps relative to the 2023 MW 6.4 aftershock. The data (left panels), model (middle panels), and residual points (right panels) from the unwrapped interferograms depicting the coseismic displacement pattern from the Sentinel-1 descending (top panels) and ascending (bottom panels) tracks. The red star indicates the 20 February 2023 MW 6.4 aftershock epicenter provided by the AFAD.
Remotesensing 17 02270 g007
Figure 8. GNSS coseismic offsets relative to the 2023 MW 7.8 and 7.6 earthquake doublet. Observed (blue) and modeled (yellow) horizontal displacements: (a) for the MW 7.8 and (b) for the MW 7.6 earthquake, respectively. The red stars represent the mainshock epicenters (AFAD). Note that in panel (b) the scale of the displacement at the EKZ1 station, close to the Çardak fault trace, is different (violet arrow).
Remotesensing 17 02270 g008
Figure 9. Sentinel-1 InSAR displacement maps relative to the 4 August 2020 MW 5.6 earthquake. The data (left panels), model (middle panels), and residual points (right panels) from the unwrapped interferograms depicting the coseismic displacement pattern from the Sentinel-1 descending (top panels) and ascending (bottom panels) tracks. The red star indicates the MW 5.6 epicenter provided by the AFAD.
Remotesensing 17 02270 g009
Figure 10. Sentinel-1 InSAR displacement maps relative to the 9 April 2022 MW 5.3 earthquake. The data (a), model (b), and residual points (c) from the unwrapped interferograms depicting the coseismic displacement pattern from the Sentinel-1 descending track. The yellow star indicates the MW 5.3 epicenter provided by the AFAD.
Remotesensing 17 02270 g010
Figure 11. A map view of the proposed fault geometry network activated during the 2023 earthquake sequence. Red stars show the epicenter locations of the 2020 and 2023 main shocks, with their focal mechanism solutions. The relocated aftershocks from the 2023 sequence [31] and the 2020 Elazığ seismicity [32] are represented by blue and pink dots, respectively. The yellow and blue boxes indicate the USGS finite-fault models for the earthquake doublet. Solid lines along the main branch of the EAFZ represent our vertically modeled fault segments: violet for F1 (Amanos), red for F2 (Pazarcık), and green for F3 (Erkenek). Black boxes denote the NNW-dipping modeled segments corresponding to the Narli fault (F4), the Pütürge fault (F5), a small splay fault (F6) between F2 and F3, the Çardak–Savrun fault (F7), the fault associated with the Nurdag complexity (F8), and a normal fault (F9) located at the western end of the Çardak fault. The northeastern most light-green box is the eastern portion of the Pütürge fault segment that was involved in the 2020 Elazığ earthquake.
Remotesensing 17 02270 g011
Figure 12. A three-dimensional perspective view of the preferred slip model for the 2023 earthquake pair and the MW 6.4 aftershock. Red solid lines represent the fault traces of the EAFZ that ruptured during the 2023 seismic sequence. Red stars show the epicenter locations of the 2020 and 2023 main shocks. The blue dots represent the relocated aftershocks of the 2023 sequence [31], while the pink ones are related to the previous 24 January 2020 MW 6.8 Elazığ earthquake [32].
Remotesensing 17 02270 g012
Figure 13. The map view of the geodetic model of the 24 February 2023 MW 6.4 Hatay aftershock. Blue dots represent the relocated aftershocks from the 2023 sequence [31]. The red box indicates our optimal uniform slip solution. Other symbols as in Figure 1.
Remotesensing 17 02270 g013
Figure 14. The rupture geometry of the August 2020 MW 5.6 and April 2022 MW 5.3 earthquakes along the western part of the Pütürge segment and the 2020 MW 6.8 Elazığ earthquake. Red solid lines represent our best-fit uniform slip solutions (sub-vertical faults) of both the seismic events. The red and yellow stars located west of Pütürge represent the hypocenters of the August 2020 and April 2022 events, respectively, while the red star located above the slip distribution (colored area) corresponds to the 24 January 2020 MW 6.8 Elazığ earthquake. The blue dots represent the relocated aftershocks of the 2023 sequence [31], while the pink ones are related to the previous 24 January 2020, MW 6.8 Elazığ earthquake [32].
Remotesensing 17 02270 g014
Figure 15. The interseismic velocity field relative to the Eurasian plate (modified from [51]). The dashed box highlights the area shown in Figure 16 and Figure 17.
Remotesensing 17 02270 g015
Figure 16. A map of the second invariant of the strain-rate tensor along the EAFZ and part of the NAFZ. Red (compressional) and blue (extensional) bars represent the principal strain directions. Other symbols as in Figure 1.
Remotesensing 17 02270 g016
Figure 17. A detailed view of the GNSS horizontal velocity field across the EAFZ. (a) The GNSS velocity field in the reference frame fixed to Eurasia. (b) The GNSS velocity field across the EAFZ in the Arabian block-fixed reference frame. The boxes enclose velocities projected onto a direction perpendicular to the strike of each fault segment (lowercase letters indicate different velocity profiles). Red boxes highlight the cross-sections drawn across the Pütürge fault segment and the Hatay region, situated at the northeastern and southwestern terminations of the 2023 seismic sequence, respectively. The solid lines represent the main fault segments of the East Anatolian Fault Zone (EAFZ), labeled as follows: (1) Amanos, (2) Pazarcık, (3) Erkenek, (4) Pütürge, (5) Palu, (6) Ilica, and (7) Çardak–Savrun (after [7]).
Remotesensing 17 02270 g017
Figure 18. (af) Comparison of observed fault-parallel velocities, dislocation models, topography, and seismicity along selected profiles across the EAFZ. The panels show the observed fault-parallel component velocities (blue dots) along selected velocity profiles (from SSW to NNE) compared with the dislocation models (solid red, gray, and black lines), topographic data (average altitude), interseismic model geometry (red dashed lines), seismicity (the blue dots represent the relocated 2023 aftershock of the first month after the mainshock [31]; pink dots are the relocated 2020 Elazığ seismicity [32]), and 2020–2023 coseismic fault planes (solid black lines on profiles b–e). The vertical red dashed lines indicate the points of intersection with the EAFZ trace.
Remotesensing 17 02270 g018
Disclaimer/Publisher’s Note: The statements, opinions and data contained in all publications are solely those of the individual author(s) and contributor(s) and not of MDPI and/or the editor(s). MDPI and/or the editor(s) disclaim responsibility for any injury to people or property resulting from any ideas, methods, instructions or products referred to in the content.

