Article

Spatiotemporal Drivers of Urban Vegetation Carbon Sequestration in the Yangtze River Delta Urban Agglomeration: A Remote Sensing-Based GWR-RF-SEM Framework Analysis

1
Nanjing Institute of Environmental Sciences, Ministry of Ecology and Environment, Nanjing 210042, China
2
School of Environment and Spatial Informatics, China University of Mining and Technology, Xuzhou 221116, China
3
National Institute of Natural Hazards, Ministry of Emergency Management, Beijing 100085, China
4
Co-Innovation Center for Sustainable Forestry in Southern China, Key Laboratory of Soil and Water Conservation and Ecological Restoration of Jiangsu Province, Nanjing Forestry University, Nanjing 210037, China
*
Author to whom correspondence should be addressed.
Remote Sens. 2025, 17(12), 2110; https://doi.org/10.3390/rs17122110
Submission received: 4 May 2025 / Revised: 10 June 2025 / Accepted: 18 June 2025 / Published: 19 June 2025

Abstract

Vegetation carbon sequestration (CS) is critical for mitigating climate change in urban agglomerations, yet its driving mechanisms remain poorly understood in rapidly urbanizing regions. This study introduces an integrated attribution and influence analysis framework, GWR-RF-SEM, to quantitatively assess the driving forces, mechanisms, and pathways of CS using multi-source remote sensing data at the county scale within the Yangtze River Delta Urban Agglomeration (YRDUA), China, from 2001 to 2020. Our results reveal an overall increase in CS across 70.14% districts in the YRDUA, with municipal districts exhibiting significantly lower CS compared to the outside districts. Photosynthesis and human activities emerged as the dominant drivers, collectively accounting for 73.1% of CS variation, significantly surpassing the influence of climate factors. Although most factors influenced urban vegetation CS either directly or indirectly, photosynthesis, afforestation, and urban green space structure were identified as the primary direct drivers of CS enhancement in both districts. Notably, we found significant spatial heterogeneity in CS drivers between municipal districts and the outside districts, highlighting the need for targeted strategies to enhance CS efficiency. These findings advance our understanding of urban vegetation CS mechanisms, providing essential support for the enhancement of nature-based solutions depending on ecosystem services under urbanization and climate change.

Graphical Abstract

1. Introduction

The continuous rise in greenhouse gas (GHG) emissions, mainly carbon dioxide (CO2), has triggered increasingly severe global warming, posing a serious threat to the human living environment [1,2,3]. Currently, over 55% of the global population resides in urban areas, a proportion projected to reach 70% by 2050 [4,5], now making them the critical nodes where global climate change directly impacts human habitats. As clusters of spatially and economically interconnected cities with high population density [6], urban agglomerations (UAs) are a more typical urban area [7], where the living environment may face greater threats. Strict emission control measures significantly reduce pollutants that cause health problems, such as respiratory and cardiovascular diseases, which creates a healthier and more conducive living environment in urban areas. Therefore, carbon reduction and removal must be strictly implemented in urban areas to mitigate climate change and its adverse effects.
Due to the significant contribution of energy consumption and land use changes to carbon emissions [6], extensive research on carbon emission drivers in UAs has provided insights for technology- or engineering-based solutions [6,8,9]. However, relying solely on emission reductions cannot achieve the needed reduction in peak warming, as certain sectors like agriculture and heavy industries are unlikely to reach net-zero emissions in the short term [10]. Nor will they mitigate other urban problems caused by climate change, such as the impacts on the physical and mental health of urban residents. For this reason, carbon sequestration (CS) in UA, a nature-based solution, should be emphasized to fill these gaps. Recent studies have demonstrated that an examination of urban vegetation CS is crucial for elucidating the role of non-natural ecosystem vegetation cover in climate change mitigation, and advancing our insights into the global carbon cycle and sustainable development [11]. According to Zhang et al. (2022) [12], CS by urban greening can partially offset aboveground carbon losses caused by urban expansion. Its significant role in alleviating the negative impacts of global climate change has been confirmed on a global scale [13,14]. The Sixth Assessment Report (AR6) of the Intergovernmental Panel on Climate Change (IPCC) also underscores the criticality of augmenting carbon absorption and storage in urban environments [2]. Additionally, urban vegetation also delivers multiple positive contributions to climate change mitigation and adaptation through diverse ecosystem services that benefit from CS. Numerous studies have shown that urban vegetation effectively reduces local temperatures via shading and evapotranspiration, curbing energy consumption from air conditioning during summer heatwaves, thereby indirectly lowering urban carbon emissions [15,16]. Meanwhile, increasing residents’ exposure to urban vegetation can reduce climate-related threats by promoting physical health, alleviating mental stress, and mitigating natural disasters [4,17]. These ecosystem services also further intensify as vegetation CS accumulates. Consequently, the potential of urban vegetation CS, with its associated ecosystem services, to mitigate climate change may be severely underestimated [11].
Net primary productivity (NPP), serving as a crucial indicator for assessing vegetation carbon sequestration capacity, has been extensively utilized in existing research. However, while traditional methods for calculating NPP such as field sampling data and flux station data based on eddy covariance can provide more accurate NPP observations, their limited temporal and spatial coverage significantly constrains their application in studies over the UA scale [18]. In contrast, remote sensing-based NPP products, particularly the Terra Moderate Resolution Imaging Spectroradiometer (MODIS) NPP dataset, offer long-term, consistent NPP observations with comprehensive spatiotemporal coverage. Recognized for its relatively high retrieval accuracy, MODIS NPP has been widely adopted for CS studies at global [19], national [20], and regional [21] scales.
Despite the growing urban population leading to increasing demand for urban green spaces among residents, urban vegetation cannot feasibly meet this demand through area expansion due to constraints from urban land scarcity [22]. This makes improving vegetation CS efficiency a potential strategy to partially address the demand gap. While several prior works of research had comprehensively explored factors influencing vegetation CS [23,24,25,26], these studies primarily focus on large-scale contiguous natural ecosystems. Compared to natural ecosystems, urban vegetation CS is simultaneously influenced by both natural factors and diverse anthropogenic pressures [27,28], potentially yielding distinct outcomes from those observed in natural ecosystems. Under intensifying pressures from climate change and urbanization, the impacts on urban CS may also exhibit significant spatial and temporal heterogeneity. There is therefore an urgent need to develop robust models to deeply understand urban vegetation CS contributions and their complex driven mechanisms. Existing related studies often make no distinction between municipal districts and their outside districts, and they lack comprehensive consideration of both driving capacity [14,29] and underlying mechanisms [13,30]. These severely constrain the attribution analysis of vegetation CS drivers within complex urban systems.
This study conducted a quantitative investigation of vegetation carbon sequestration (CS) driving forces and mechanisms at the county-level scale within the Yangtze River Delta Urban Agglomeration (YRDUA) from 2001 to 2020, based on multi-source remote sensing data. The analysis specifically focused on the synergistic interactions between anthropogenic activities, climatic change, atmospheric CO2 concentration, nitrogen deposition, soil nutrient cycles (particularly nitrogen and phosphorus), and vegetation photosynthetic processes. Given the complexity and nonlinearity of factors influencing CS, we introduce an integrated attribution and influence analysis framework [31,32,33], which integrates the nonlinear machine learning approach of Geographically Weighted Regression–Random Forest (GWR-RF) with Structural Equation Modeling (SEM) within a linear attribution framework [33]. This data-driven local approach comprehensively considers the impacts of driving factors on urban vegetation CS [34,35,36] and further distinguishes between direct and indirect driving mechanisms and their pathways [37,38,39] under a unified attribution framework. Our research focuses on the quantitative analysis of the driving forces, mechanisms, and pathways of multiple influencing factors on urban vegetation CS at the county scale within YRDUA, separately discussing the differences between municipal districts and their outside districts. Addressing these issues is critical for understanding the CS mechanisms of urban vegetation, ultimately providing essential support for the enhancement of natural-based solutions depending on ecosystem services under urbanization and climate change.

2. Materials and Methods
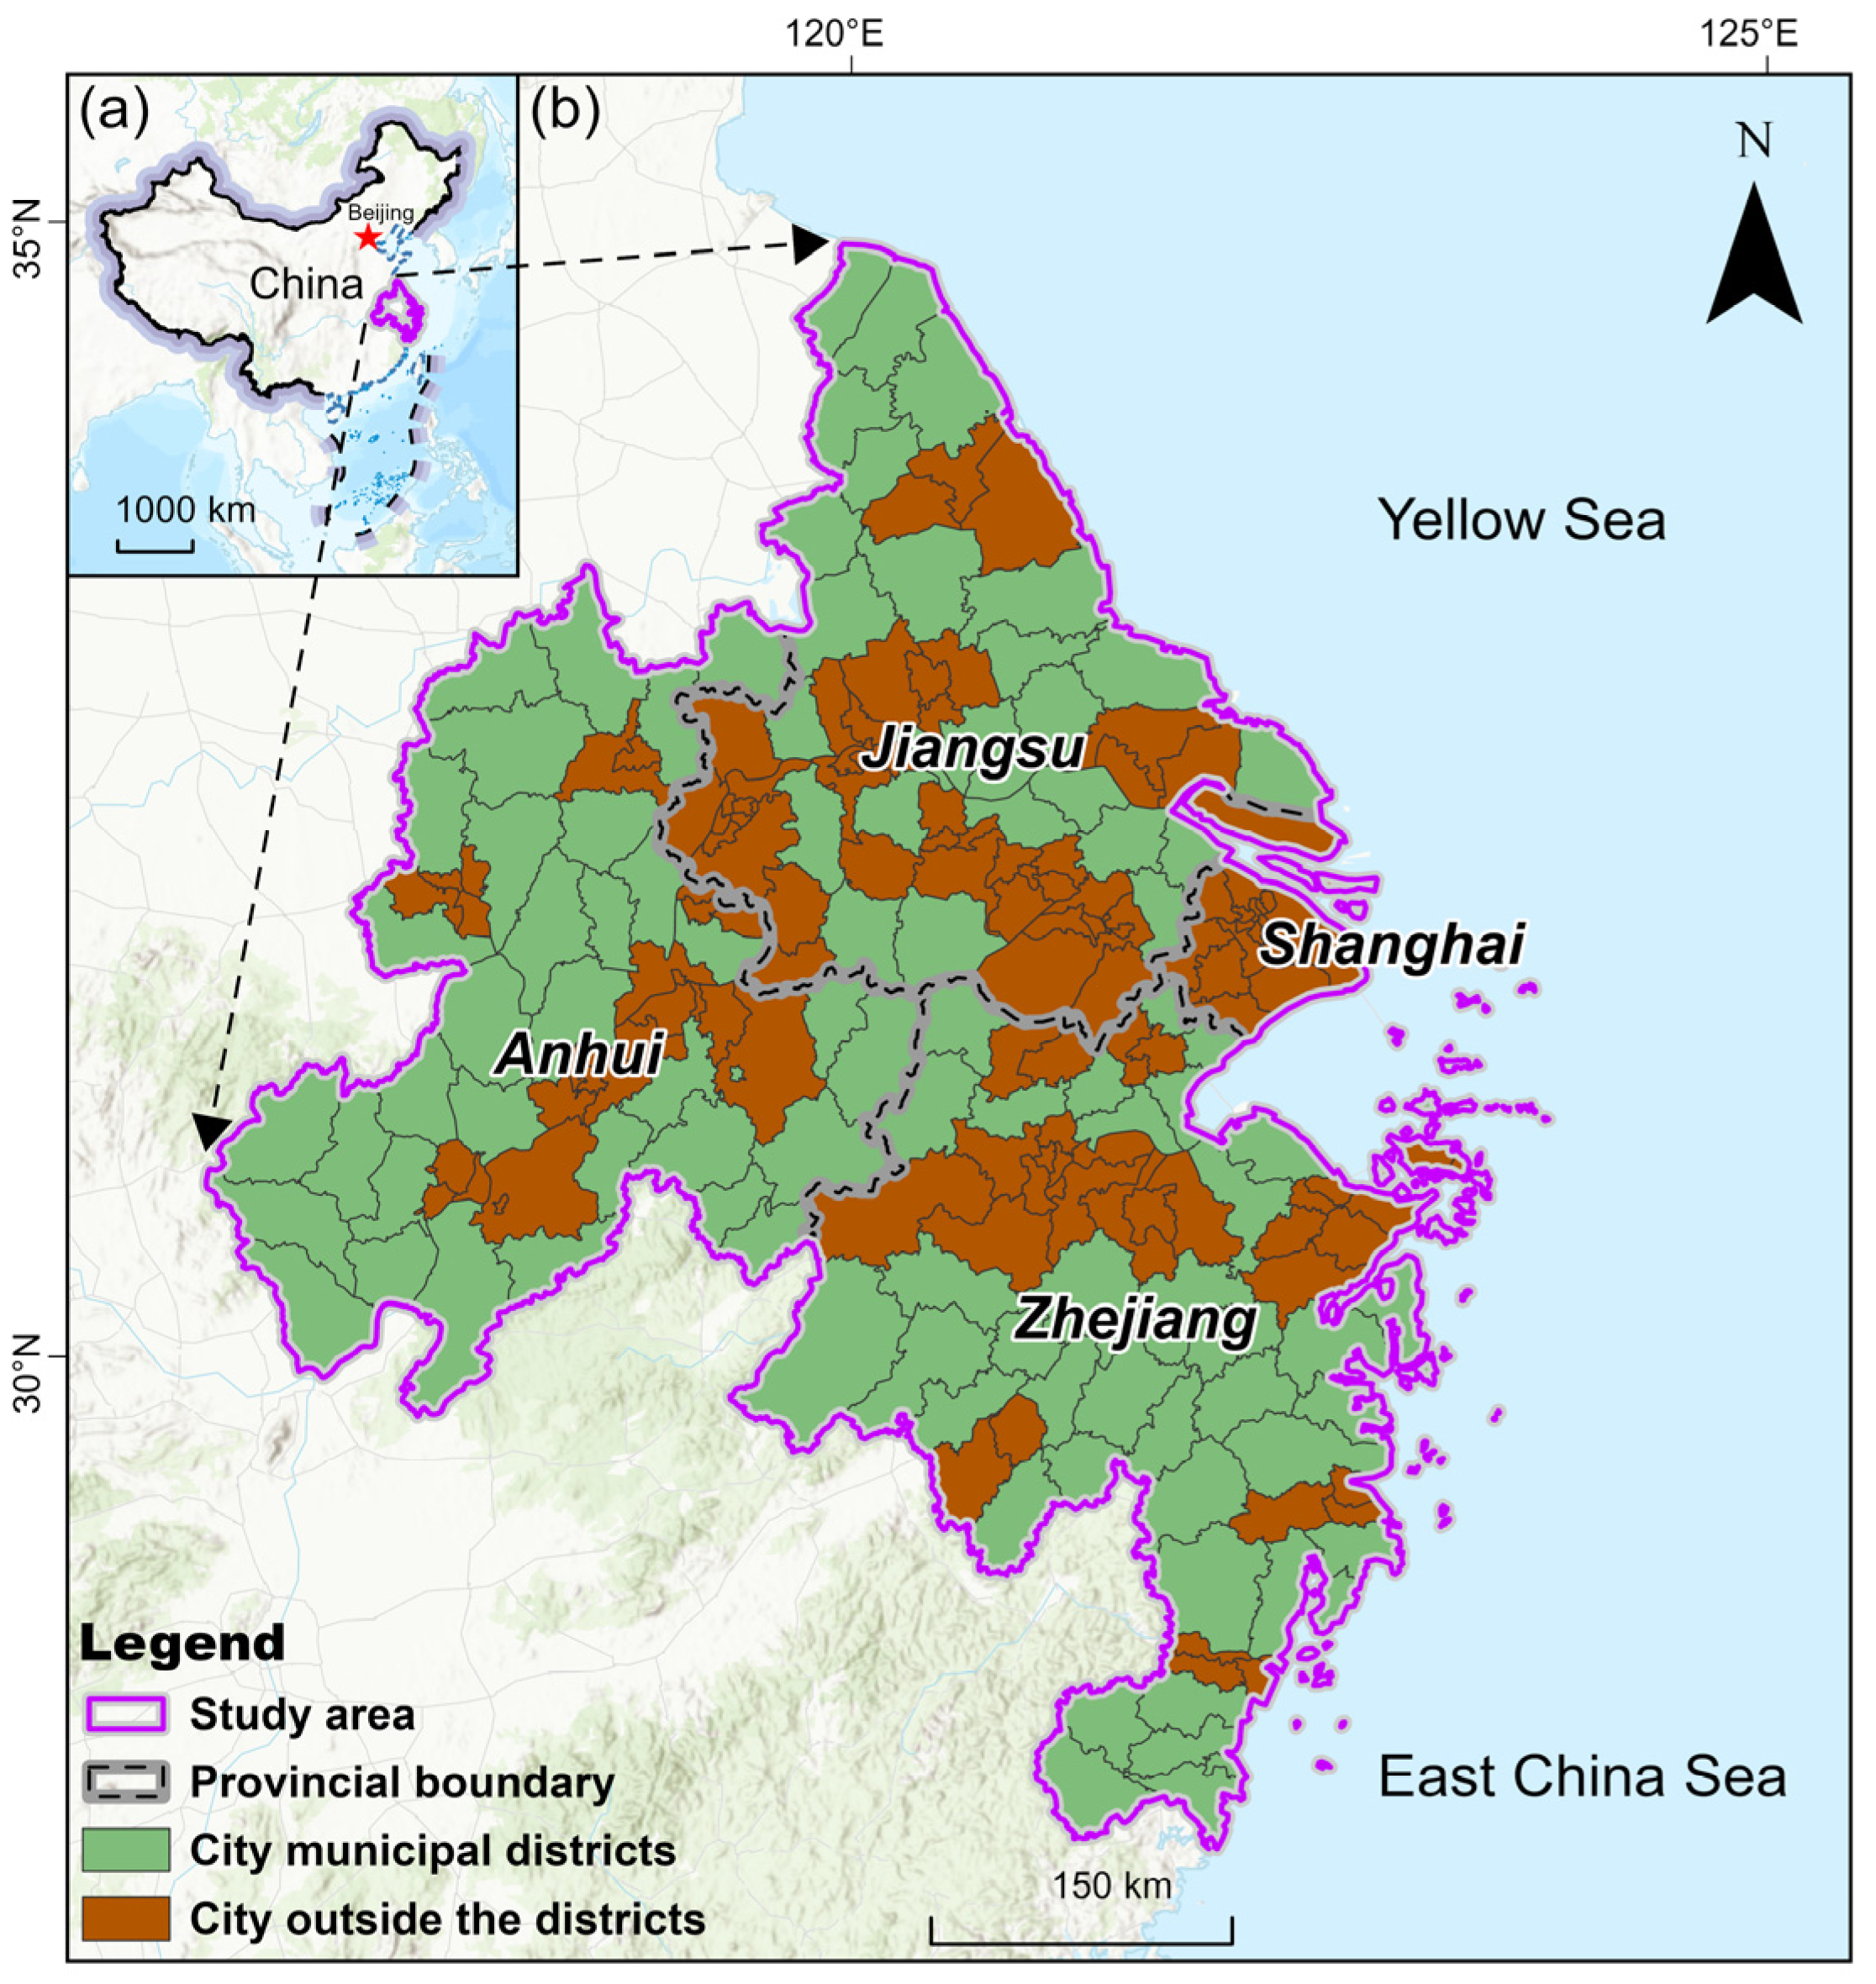
2.1. Study Area

The study area, the Yangtze River Delta Urban Agglomeration (YRDUA), spans 214 county-level administrative units, including both municipal districts and those outside the districts, across 27 central cities in Shanghai, Jiangsu, Zhejiang, and Anhui. The two kinds of districts were distinguished based on the administrative type of the county-level units according to the government. Municipal districts refer to county-level administrative units that are directly governed by the municipal-level administrative authority, and outside districts denote all other county-level administrative units within the study area except municipal districts. Specifically, it comprises 16 counties in Shanghai, 68 in Jiangsu, 75 in Zhejiang, and 55 in Anhui, respectively (Figure 1). The study area covers approximately 222,400 km2, with 114 municipal districts accounting for 35.22% of this area (brown in Figure 1b). Although it represents only 2.1% of China’s total land area, the YRDUA is a significant economic hub, contributing about a quarter of the nation’s total economic output and more than a quarter of its industrial added value. The economic vitality comes with high carbon emission intensity and the complex pressure of rapid urbanization on the ecosystem.
To address urgent CS demands, the YRDUA is committed to establishing a National Forest Urban Group. This initiative, along with ongoing efforts in afforestation, greening, ecological protection, and restoration, aims to continuously enhance the urban ecological spatial arrangement. Marking a significant stride since the 13th Five-Year Plan, the central government has dedicated substantial resources to these efforts. An investment of RMB 453 million was allocated to afforestation activities, culminating in the greening of approximately 876 km2 in the YRDUA. Moreover, the Yangtze River and coastal protection forest project have been bolstered with an allocation of over RMB 442 million, facilitating the establishment of around 1305 km2 of protective forests.
It should be noted that 17 counties were excluded from the final modeling analysis due to significant changes in their administrative boundaries between 2001 and 2020; for the remaining data, the analysis included as many counties as possible.

2.2. Data Sources

2.2.1. Carbon Sequestration Data

Net primary production (NPP), a key indicator of ecosystem productivity, refers to the net increase in organic matter synthesized by plants through photosynthesis. In this study, NPP is utilized as a proxy to assess urban carbon sequestration. Wang et al. (2025) [18] shows that the NPP data based on the Carnegie–Ames–Stanford Approach (CASA) model has high relationship with MODIS NPP in the YRDUA. Therefore, the NPP used in this study was obtained from the Land Processes Distributed Active Archive Center (LP DAAC)), specifically the MOD17A3 HGF.061 dataset (Table 1). This dataset was derived from the light use efficiency model and the vegetation carbon allocation model, and it has been widely validated globally [40,41] and in China [42].

2.2.2. Carbon Sequestration Driving Factors

A total of 14 potential driving factors were selected to explore the driving mechanisms behind CS changes in urbanized areas. These encompass a range of factors including anthropogenic activities, climatic change, atmospheric CO2 concentration, nitrogen deposition, soil nutrient cycles, and vegetation photosynthesis. The use of a multi-faceted data approach aims to elucidate the complex interplay between healthy vegetation growth and the myriad factors influencing CS. These 14 indicators in six categories are described below, and the data sources used in this study are detailed in Table 1.
Anthropogenic activity: Five indicators were selected to represent anthropogenic activities: nighttime lights (NTLs), population density (POP), annual area of afforestation (AAF), green area ratio (GAR), and wetland coverage ratio (WCR). NTLs, as an effective proxy for detecting human economic activity, may have a particular influence on CS through affecting vegetation phenology and ecophysiology, which remains inadequately quantified [43]. The NTL data produced by Chen et al. (2021) [44] were refined through a cross-sensor nighttime light data correction scheme, which captures urban illumination more accurately in the long term. POP data were also employed to explore the impact of urbanization on the CS capacity of vegetation. The AAF was chosen to represent human activities in afforestation and reforestation, aiming to reflect the long-term ecological benefits of afforestation [45]. The GAR and WCR were calculated from the GlobeLand30 dataset [46]. The GAR is defined as the ratio of arable land, forest land, grassland, shrubs, and wetlands in the total area, which was chosen to assess the impact of urban land use pattern transformations on the quantity of carbon sequestered by vegetation. Due to the wide distribution of wetlands in the YRDUA, the WCR was selected to investigate the relationship between changes in wetland patterns and factors influencing vegetation CS during urbanization, as highlighted in [47]. Considering the high level of regional urbanization, changes in both GAR and WCR are strongly influenced by anthropogenic factors. Consequently, this study regards the two indicators as a concentrated manifestation of human impacts on spatial patterns and classifies them into the category of Anthropogenic Activity.
Climate change: The climate change data were derived from the ERA5-Land dataset [48]. This comprehensive dataset merges model data with global observations. Three indicators were selected: 2 m surface temperature (T2m), surface solar radiation downwards (SSRD), and total precipitation (TP).
Atmospheric CO2 concentration: CO2 fertilization and nitrogen deposition are two significant factors contributing to the increase in vegetation CS. However, the specific impact of CO2 fertilization on the CS of vegetation in urban areas with high CO2 concentrations, where the effect is possibly nearing saturation [49], remains unclear. Global spatial CO2 concentration data from CarbonTracker were used [50] in this study. Monthly CO2 concentration values were calculated by summing fossil fuel emissions, land biosphere (excluding fire), wildfire emissions, and air–sea exchange for each month. Annual averages were then derived from these monthly values.
Nitrogen deposition: Similar to atmospheric CO2 concentration, the effects of nitrogen deposition on urban vegetation CS are also unclear [51,52,53,54], especially the effects from different types of nitrogen deposition in rapidly urbanizing areas [55,56]. The spatial and temporal pattern datasets of dry deposition of atmospheric inorganic nitrogen (DAN) [57] and wet deposition of atmospheric inorganic nitrogen (WAN) [58] were selected for analysis.
Photosynthesis intensity: Sun-induced chlorophyll fluorescence (SIF) data, a crucial indicator of plant photosynthesis [59], exhibits both direct and indirect relationships with CS changes in urban contexts [60,61,62]. Research has validated the use of SIF and atmospheric CO2 concentration as primary factors in estimating gross primary productivity (GPP) [63]. However, the integration of SIF with other factors, such as anthropogenic activities and climate change, in analyzing urban vegetation CS remains underexplored. Contiguous solar-induced fluorescence (CSIF) dataset provides high-resolution, long-term, daily global SIF data from 2001 to 2022, addressing previous limitations of short time series and low spatial resolution [64]. Its accuracy was validated against GOME-2 SIF datasets.
Soil nitrogen and phosphorus: In contrast to other external drivers like human activities and climate change, less attention has been paid to how nitrogen (N) and phosphorus (P) in soil play fundamental roles in vegetation physiological activities and functions in city areas. However, the availability of these soil nutrients may be the possible reason to limit the increased intensity of plant photosynthesis [65]. Surface soil (0–10 cm) nitrogen (SoilN) and phosphorus (SoilP) data from the Chinese Terrestrial Ecosystem Nitrogen and Phosphorus Pool Model Database were used in this study [66]. This dataset is based on field sampling and machine learning predictions and has undergone model validation and uncertainty analysis.
In the data pre-processing phase, the county (municipal district or outside) was used as the basic research unit, and the values of the sub-indicators came from raster data, except for the sub-indicator data of AAF (based on statistical yearbook accounting), GAR (land use data statistics), and WCR (land use data statistics). Lastly, all the raster data were transformed to a unified projected coordinate system (CGCS2000_3_degree_Gauss_Kruger_zone_35), and county-scale mean statistics were realized by the Zonal Statistics function of ArcGIS 10.5 software.

2.3. Methodology

2.3.1. Establishment of Urban Vegetation Carbon Sequestration Attribution Analysis Framework

This study proposes a novel analytical framework, namely GWR-RF-SEM, which is mainly used to explore the complex driving mechanism of CS in urbanized areas, including the driving contribution and driving causality. The advantage of this framework is to clarify the contribution and the causal relationship of the factors in the context of a unified linear trend analysis. Among them, the driving contribution module is mainly implemented by the GWR-RF method, which integrates the local spatial features and the superior learning ability of machine learning and can overcome the shortcomings of traditional linear methods. The driving causality module is mainly implemented by the SEM method, which is designed to explore the complex direct and indirect influences among the influencing factors under a cohesive attribution framework. In this study, the framework was used to explore the driving patterns of 14 driving factors in six categories of vegetation CS changes in the YRDUA region. Compared with the traditional driving analysis, this study is the first time to explore the driving contribution and driving causality of vegetation CS in a unified framework, especially in urbanized areas. The framework is defined by the equation:
C S s l o p e = f G W R R F 1 n α × X s l o p e i + ε ,     for   driving   contribution f S E M 1 n γ × X s l o p e i + ε ,     for   driving   causality
where C S s l o p e denotes the slope of change of CS from 2001 to 2020, X s l o p e i denotes the slope of change of the i-th influencing factor, with i referring to the 14 driving factors, and the slope calculations are all Sen’s slope [67]. The function f signifies the method of imputation analysis within the GWR-RF-SEM framework, encompassing two functions: f G W R R F and f S E M . These two functions are used to detect the driving contribution and driving causality, respectively. Regression coefficients α for each driving factor obtained using f G W R R F will ultimately be used to analyze their driving contributions to the   C S s l o p e . γ here indicates the coefficient of the driver in the complex driver network relationship. ε denotes the residuals of the imputation analysis.
Since the attribution of CS in urban municipal districts is different from that in areas outside municipal districts due to strong human activities and higher ecosystem complexity, this study endeavors to model their attribution analysis separately.

2.3.2. Analysis of Carbon Sequestration Driving Contribution Using GWR-RF

GWR-RF combines the advantages of Geographically Weighted Regression (GWR) and Random Forest (RF). GWR addresses spatial non-stationarity in geographical phenomena by creating local regression models, thus considering the local effects of spatial objects [68]. RF, known for its robustness against overfitting and ability to gauge the significance of variables, constructs multiple decision trees, with the final prediction determined through a voting process among these trees [69].
GWR-RF integrates a spatial weight matrix (SWM, a matrix measuring spatial proximity) and RF into a local regression analysis framework, enabling the handling of high-dimensional variables with nonlinear relationships and multicollinearity. The process involves [34,35]: (1) establishing SWM for each spatial unit in the study area,
w i j = { [ 1 ( d i j b ) 2 ] 2 , d i j b 0 , d i j > b
where d i j is the distance between county i and county j , and b refers to the bandwidth, (2) selecting adjacent elements of each spatial unit based on SWM, (3) constructing local RF models using these units and their neighbors, and (4) repeating these steps to build local RF models for each spatial unit, estimating the importance of local variables. We employed a 5-fold cross-validation approach for hyperparameter optimization of the model and selected the median value of 50 random seed results as the final model to ensure its robustness.
In the analysis of driving forces within the GWR-RF framework, the absolute change in CS is the sum of the absolute changes in various influencing factors, and the contribution of human activities, climate change, increase in CO2 concentration, nitrogen deposition, photosynthesis, and soil nitrogen and phosphorus to the change in CS in each county is the proportion of the absolute value sum, in%. To validate the superiority of the GWR-RF attribution analysis method, meanwhile, we also selected ordinary least squares (OLS), GWR, and RF as a comparative study of GWR-RF to evaluate the performance of these models in terms of indicators such as residual sum of squares (RSS), Akaike information criterion (AIC), AIC with correction (AICc), coefficient of determination (R2), and adjusted R2 (Adj. R2).

2.3.3. Analysis of Carbon Sequestration Driving Causality Using SEM

Structural Equation Modeling (SEM) in this study encompasses both direct and indirect causal relationships between multiple variables, represented by arrows in the model’s graphical depiction. Unlike traditional variance–covariance-based SEM, piecewise SEM allows for the combination of multiple linear models into a cohesive causal network. It uses Shipley’s separation test for model path validation and the Akaike information criterion (AIC) for model comparison [70,71]. The drivers’ paths are standardized by fitting linear models, with the overall fit of the segmented SEM evaluated using Shipley’s separation test. Combined with the reality that CS in urbanized areas is an interaction of composite ecosystems, the SEM methods can be used in a way that fully considers the contribution of the direct or indirect effects of each driver. Piecewise SEM is implemented in the R software (v4.4.0) package “piecewiseSEM” (v2.3.0.1) and is referenced as a previous study using Chi-Squared and Fisher’s C, AIC, and R2 as model test indicators. It should be noted that if the p-value of either of χ2 value and Fisher’s C are below the significance level (p < 0.05), the model hypothesis was not valid and should be rejected.
To obtain the SEM relationship network of the driving mechanism of CS changes in the YRDUA, we first constructed a graphical conceptual model by putting forward several hypotheses on the relationships between variables related to changes in CS based on a literature review and existing knowledge. Then, the conceptual model was converted into a mathematical model by SEM, which was calibrated according to the observation data. This led to refinements of the conceptual model and re-specification of the mathematical model. Finally, the path analysis diagram of the SEM model of CS changes in the YRDUA was established. Once the model and all variables have passed statistical tests, the SEM model provides path diagrams and standardized coefficients with values ranging from 0 to 1, with larger path coefficients indicating larger driving influences. The total standardized driving effect on CS change consists of a direct effect, which is the path coefficient on the arrow pointing directly to the CS change, and an indirect effect, which is the product of the coefficient on the arrow of the mediating variable (e.g., photosynthesis) and the coefficient on the arrow from the mediating variable to the CS change. In addition, in SEM, there may be multiple mediating variables from a driver to a change in CS, so the indirect effect is the sum of all indirect coefficients for each indirect path.
The graphical conceptual model of this study is shown in Figure 2. It is assumed that the CS changes in the YRDUA during the period of 2001–2020 are directly affected by six major influencing factors, and all causality-driven numerical measures of impact will be included under a unified standardized framework. Concurrently, it is considered that human activities can indirectly affect changes in CS through climate change and vegetation photosynthesis. Furthermore, indirect effects on CS change through vegetation photosynthesis by soil nitrogen and phosphorus patterns, nitrogen deposition, and atmospheric CO2 concentration have also been included in the detection and analysis. Moreover, the effectiveness of the feedback effect of CO2 concentration on human activities was also considered for exploration and analysis.

3. Results

3.1. Spatial–Temporal Distribution of Carbon Sequestration and Potential Drivers

3.1.1. Attributes of Carbon Sequestration
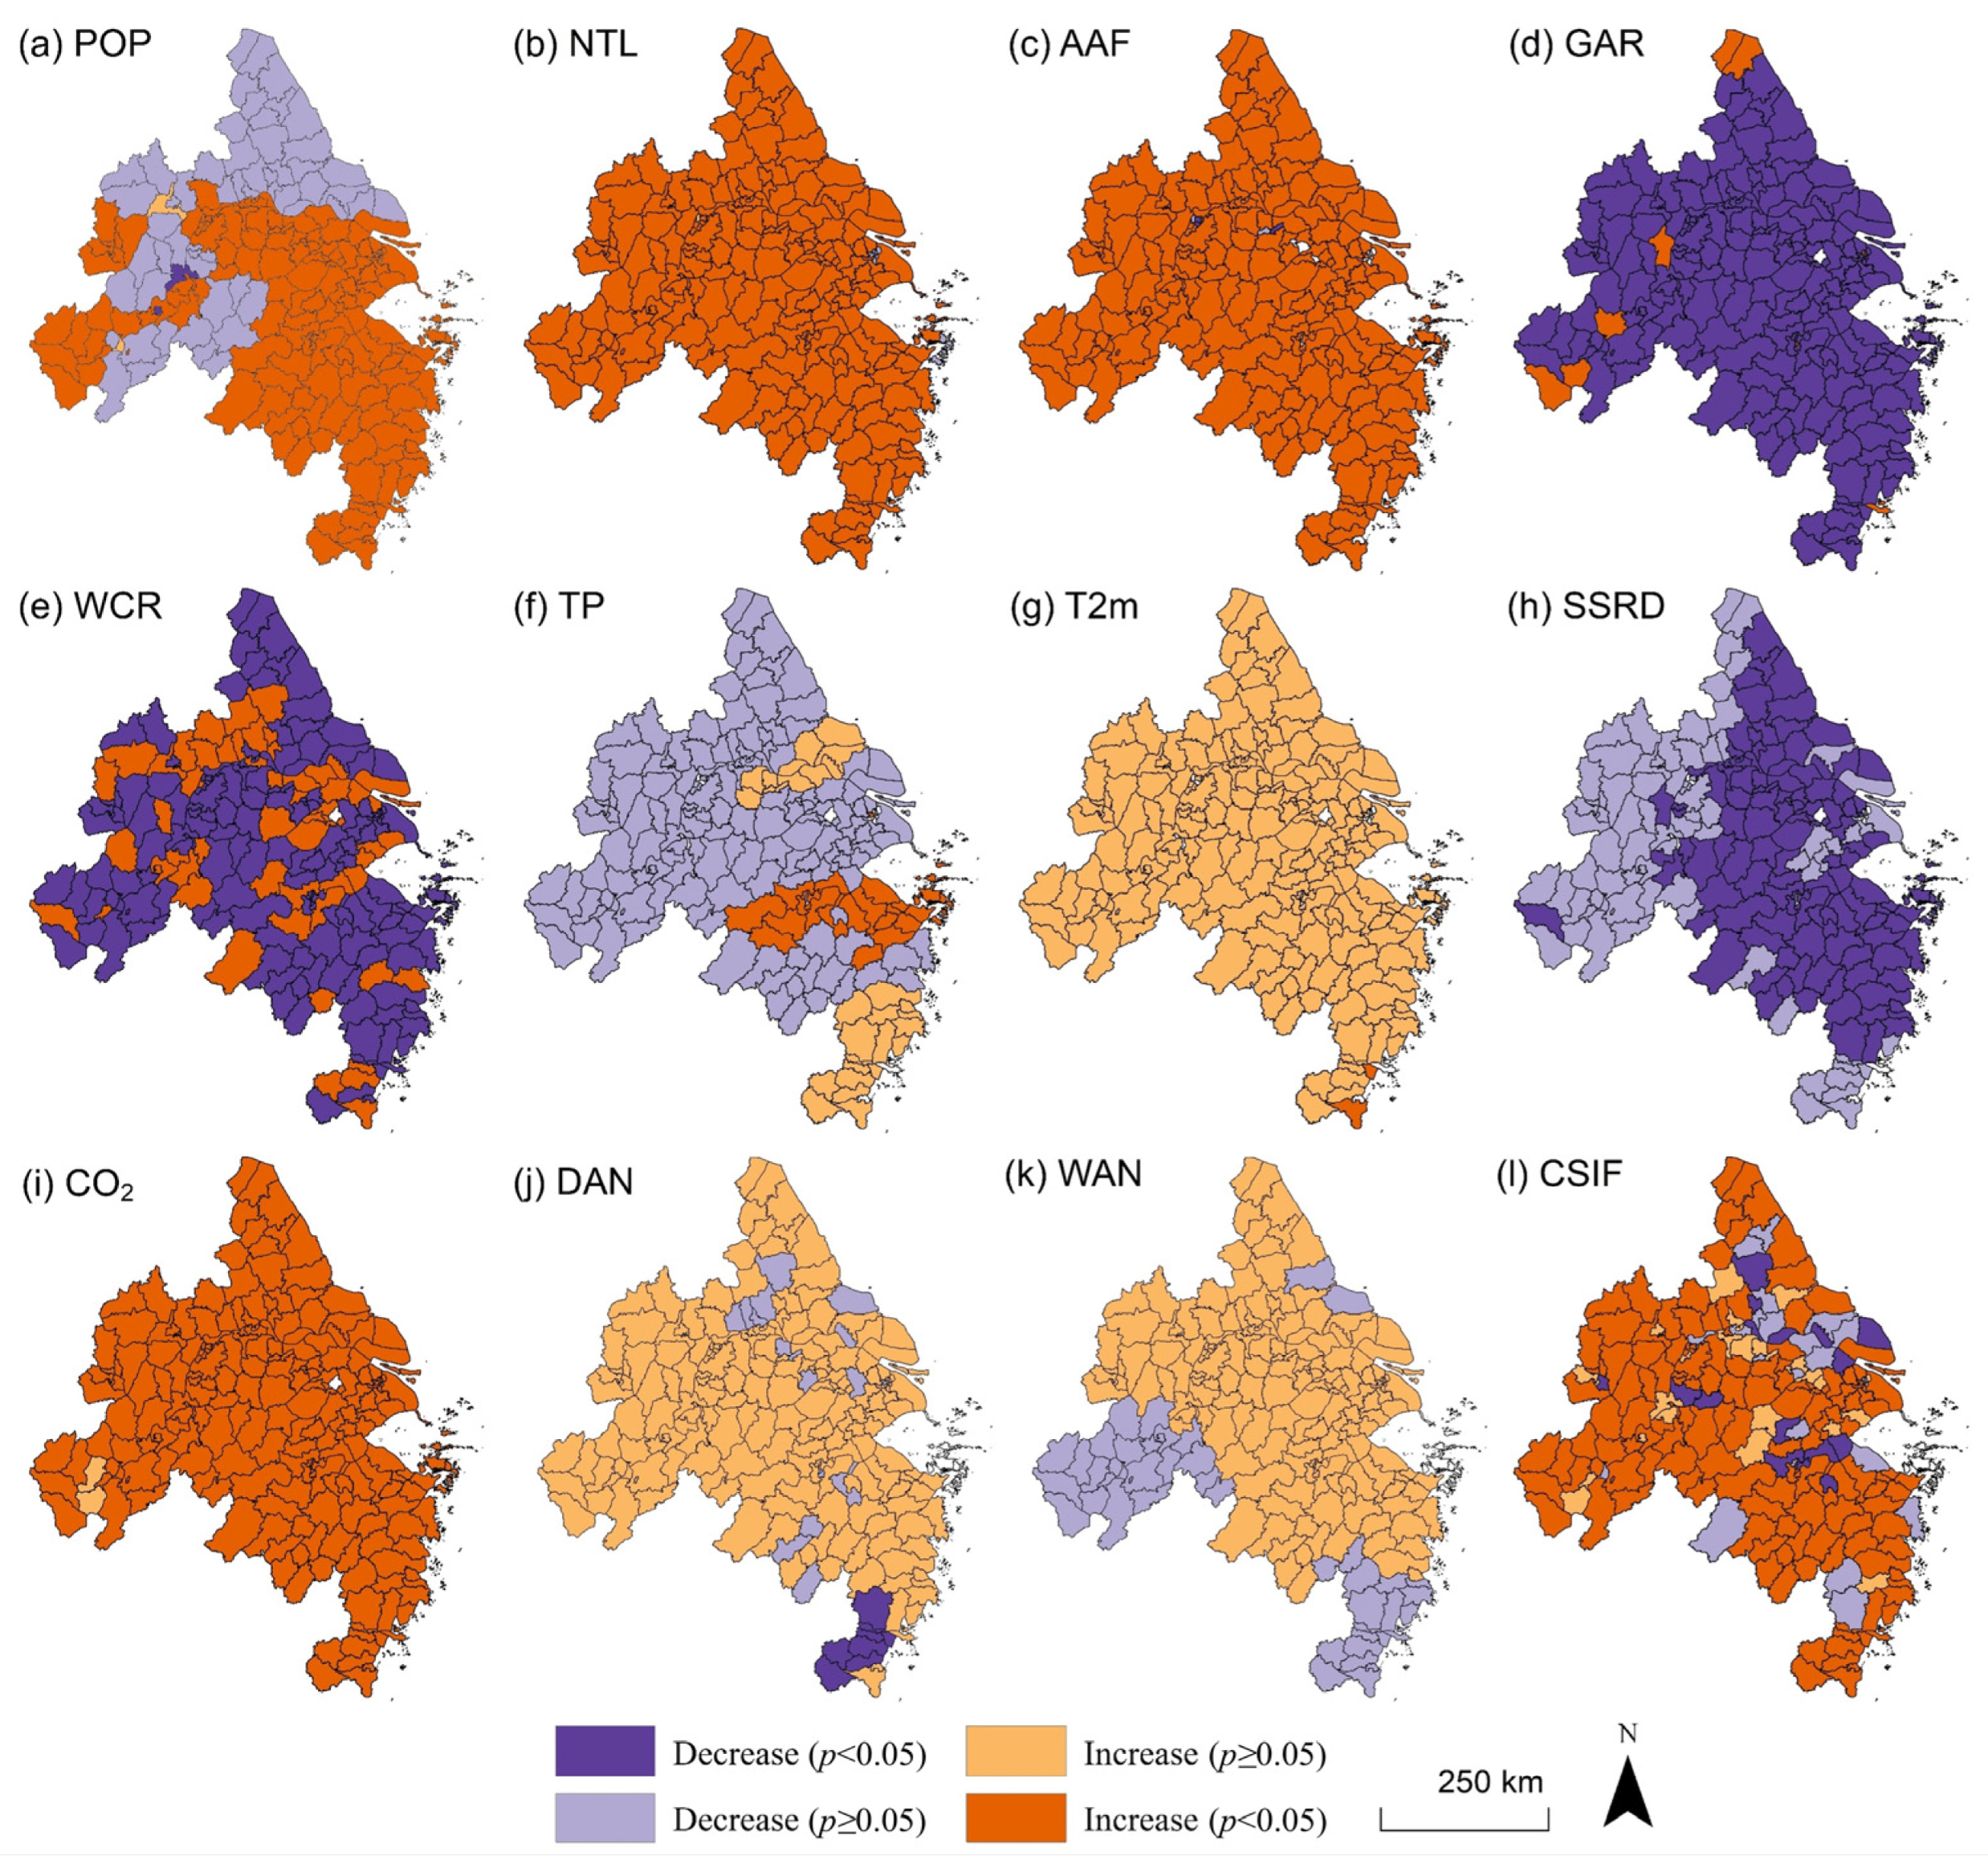
The data revealed that the total CS at the county level within the YRDUA experienced growth from 487.68 × 10⁷ t in 2001 to 519.67 × 10⁷ t in 2020, marking an increase of over 6.55%. The peak value during this period was 538.89 × 10⁷ t in 2014. Within this period, CS increased in 148 counties, representing 70.14% of the total, and decreased in 63 counties. Structurally, in 2020, the total CS of counties within and outside municipal districts was 147.76 × 10⁷ t and 371.91 × 10⁷ t, respectively, constituting 28.43% and 71.57% of the total. The data (refer to Figure 3) indicated that in 2001, the average CS in municipal districts was 1.28 × 10⁷ t, which was below the overall county average of 2.31 × 10⁷ t, whereas counties outside municipal districts averaged 3.44 × 10⁷ t. By 2020, CS had escalated in both categories by 4.69% and 6.98%, respectively. From 2001 to 2020, 36 municipal districts exhibited a decline in CS. Predominantly, the municipal districts, characterized by dense transportation networks and building clusters, presented a lower CS backdrop, highlighting the ecological space’s encroachment. The fluctuating CS patterns in these districts were complex, reflecting the nonlinear and intricate influences of urbanization on CS. A similar, albeit less intense, a pattern was observed in counties outside the municipal districts. The one-way ANOVA test affirmed a very significant difference (p < 0.001) in the CS trends between municipal districts and outer counties for the years 2001, 2020, and the entire period from 2001 to 2020 (Figure 3). This underscores the likely variance in the driving mechanisms of CS alterations between the two regions.
From 2001 to 2020, spatial distribution analysis revealed that the highest mean CS values, in the ranges of ((5.54, 9.59] × 107 t) and ((3.37, 5.54] × 107 t), were predominantly located in the southern and western regions of the YRDUA. These areas, characterized by dense forest cover, consistently exhibited elevated CS values (Figure 4a). Outside of the YRDUA’s southern mountainous zones, regions with high baseline CS values demonstrated a general upward trend. In contrast, municipal districts, which had lower baseline CS values, displayed variable CS dynamics (Figure 4b), often experiencing simultaneous increases and decreases in CS. In contrast, areas outside the districts showed more pronounced rising trends.
A spatial analysis of hot and cold spots using Gi* statistics revealed distinct clustering patterns in CS changes, aligning with Sen’s slope trend analysis (Figure 4b,c). Hot spots, with a 99% confidence level, included 14 counties across the coastal regions of Jiangsu Province, western and northern Anhui Province, and areas adjoining Anhui, Zhejiang, and Jiangsu. Cold spots, identified with over 95% confidence, encompassed 20 counties, primarily in coastal zones.

3.1.2. CS Drivers

Combining Sen’s slope and the Mann–Kendall test, Figure 5 presents a spatial characterization of the significance of the rise or fall in each driver of CS.
Anthropogenic activities: From 2001 to 2020, POP in northern Jiangsu and most parts of Anhui Province within the YRDUA exhibited a decreasing trend. In contrast, other counties experienced a notable increase (Figure 5a). The NTL decreased slightly but not significantly in some municipal districts of Shanghai, which have historically experienced high levels of development and were undergoing urban renewal activities at this stage (Figure 5b); elsewhere, most counties saw a significant rise in NTL. Similarly, barring a few municipal districts like Shanghai, Nanjing, and Changzhou, there was a marked increase in artificial tree plantations across the majority of the regions (Figure 5c). From the perspective of land use structure, the vast majority of county cities showed a significant decreasing trend in the proportion of green space, which was very closely related to the expansion of the local economy and the increase in construction land (Figure 5d). At the same time, the increase and decrease in wetlands were significant (Figure 5e).
Climate change: In terms of precipitation, there were significant differences in the trends of SP changes in northern, central, and southern Zhejiang, with an increasing trend in the north and south, and a decreasing trend in the center instead, of which only the increasing trend in the north was significant; most other counties showed a decreasing trend in TP, but it was not significant (Figure 5f). T2m showed an increasing trend in almost all counties, but only individual counties were significant (Figure 5g). SSRD was decreasing across the region (Figure 5h). Overall, the regional climate change of the entire urban agglomeration from 2001 to 2020 showed a trend of decreasing humidity, increasing temperature, and dimming brightness.
Atmospheric CO2 concentration: Despite variability (Figure S1), nearly all YRDUA counties exhibited a significant rise in CO2 concentration from 2001 to 2020, aligning with the notion that highly urbanized areas are typical carbon sources (Figure 5i).
Atmospheric nitrogen deposition: Both dry and wet inorganic nitrogen deposition increased in most counties, although not significantly (Figure 5j,k). The southern region saw a notable decrease in DAN. In some southern and western counties, WAN decreased, but not significantly.
Photosynthesis intensity: As indicated by Chlorophyll Fluorescence Satellite Index (CSIF) data, most counties, especially those outside municipal districts, showed a significant increase in photosynthesis intensity (Figure 5l). In contrast, some counties within or near municipal districts experienced a decline, notably significant in a few. Old urban areas with limited space exhibited both increases and decreases in photosynthesis, reflecting the complexity and nonlinearity of photosynthesis-driving mechanisms in densely urbanized areas. Based on Figure 5d, it can be further analyzed that the reason for the decline in photosynthesis in some areas may be the alteration of the vegetation structure supporting photosynthesis. The reality is that the city is simultaneously expanding construction land and increasing afforestation. The proportion of green space structure may not have changed significantly, but its functional differences are detected in the changes in CSIF. Additionally, a trend of declining photosynthesis was observed in the highly forested southern counties, although this trend was not significant (Figure 5h).
Soil nitrogen and phosphorus: As these are not time-series data, no slope analyses are provided. However, combined with Figure S1, soil nitrogen (SoilN) was highest near Anhui and Zhejiang provinces, decreasing outwardly, while soil phosphorus (SoilP) peaked in northern Jiangsu, also decreasing outwardly.
In summary, time-series data analysis revealed complex trends in the factors influencing CS in urbanized areas, providing a foundational understanding of the underlying mechanisms of CS.

3.2. Contributions of Carbon Sequestration on County Scale

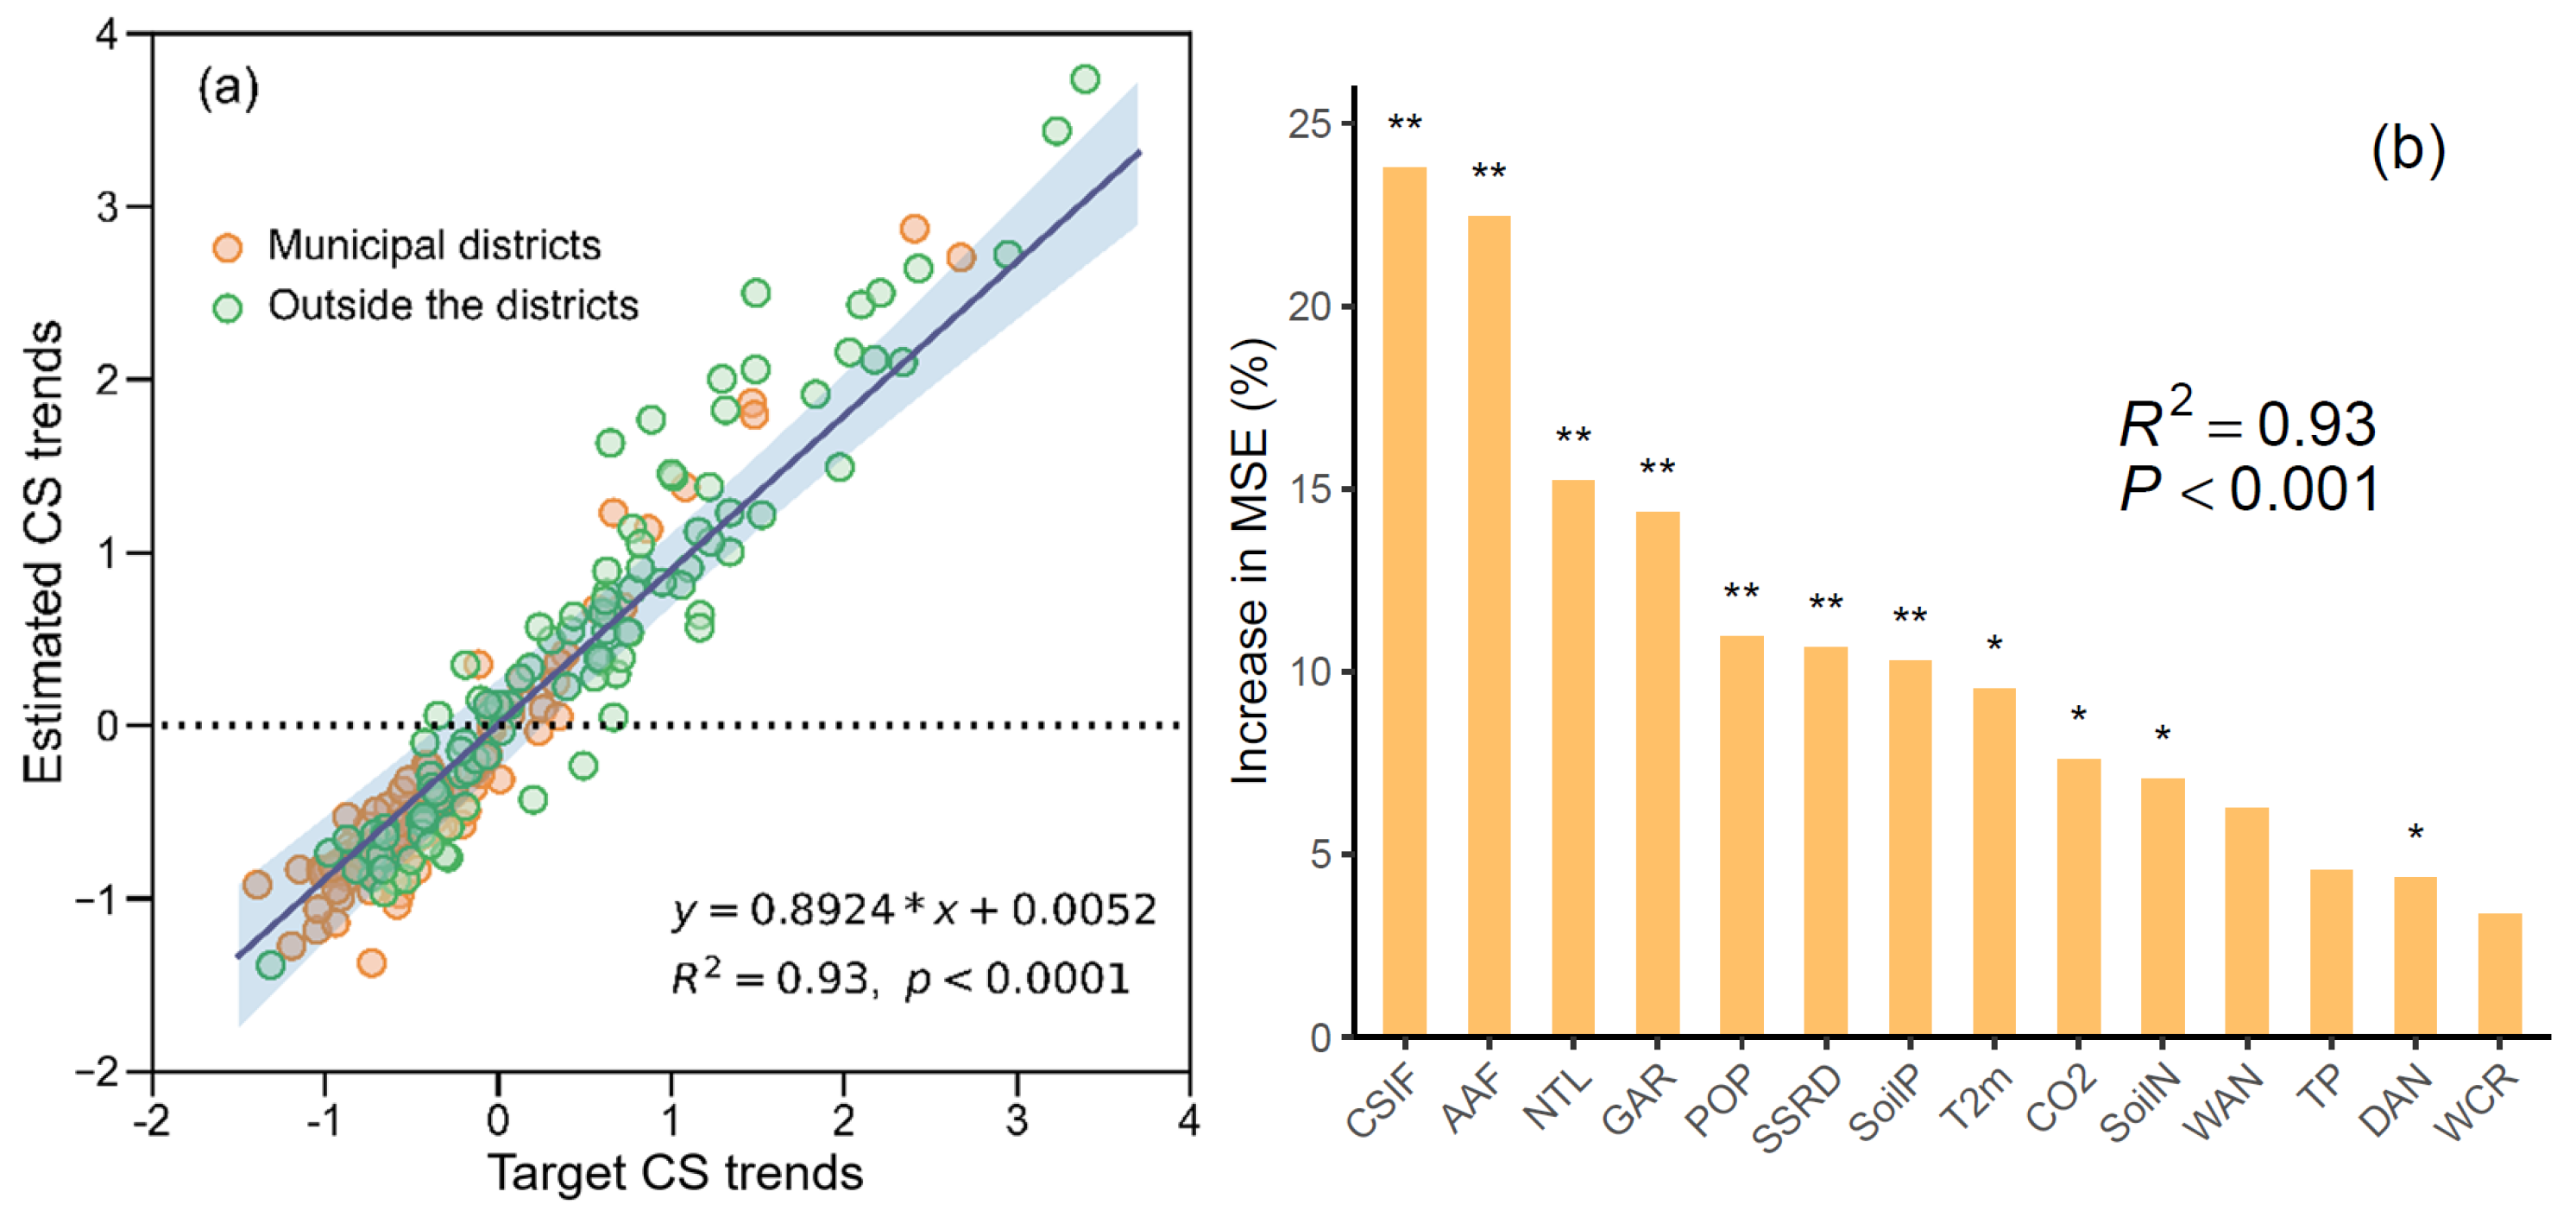
3.2.1. GWR-RF Modeling Result

GWR-RF is mainly used for CS-driven contribution attribution. The R2 test of the GWR-RF model reached 0.93, indicating that the model has strong explanatory power and outperforms OLS, GWR, and RF in RSS, AIC, and AICc (Table 2), which suggests that GWR-RF is suitable for driver modeling of county-scale CS changes in the YRDUA and that GWR-RF has a good ability to fit nonlinear relationships in highly complex impact environments (Table 2 and Figure S2 (which give the local R2 of the fitted CS change for each county)). The scatter plot depicting the estimated versus target values for the GWR-RF model (as shown in Figure 6a) further corroborates the model’s high-level fitting accuracy, with a coefficient of determination (k) reaching 0.89.
GWR-RF simultaneously evaluated and ranked the importance and significance of all influences (Figure 6b). Among them, SIF and AAF were the most important drivers of CS change with high significance levels, which confirmed the intrinsic and extrinsic influence pathways of CS from the positive perspectives of vegetation ecological photosynthesis mechanism and anthropogenic silviculture, respectively. After SIF and AAF, the CS drivers were, in order of importance, NTL, GAR, POP, SSRD, SoilP, T2m, and CO2, with a lower significance level for CO2. Other influences such as SoilN, TP, WAN, and WCR had insignificant effects on CS drivers.

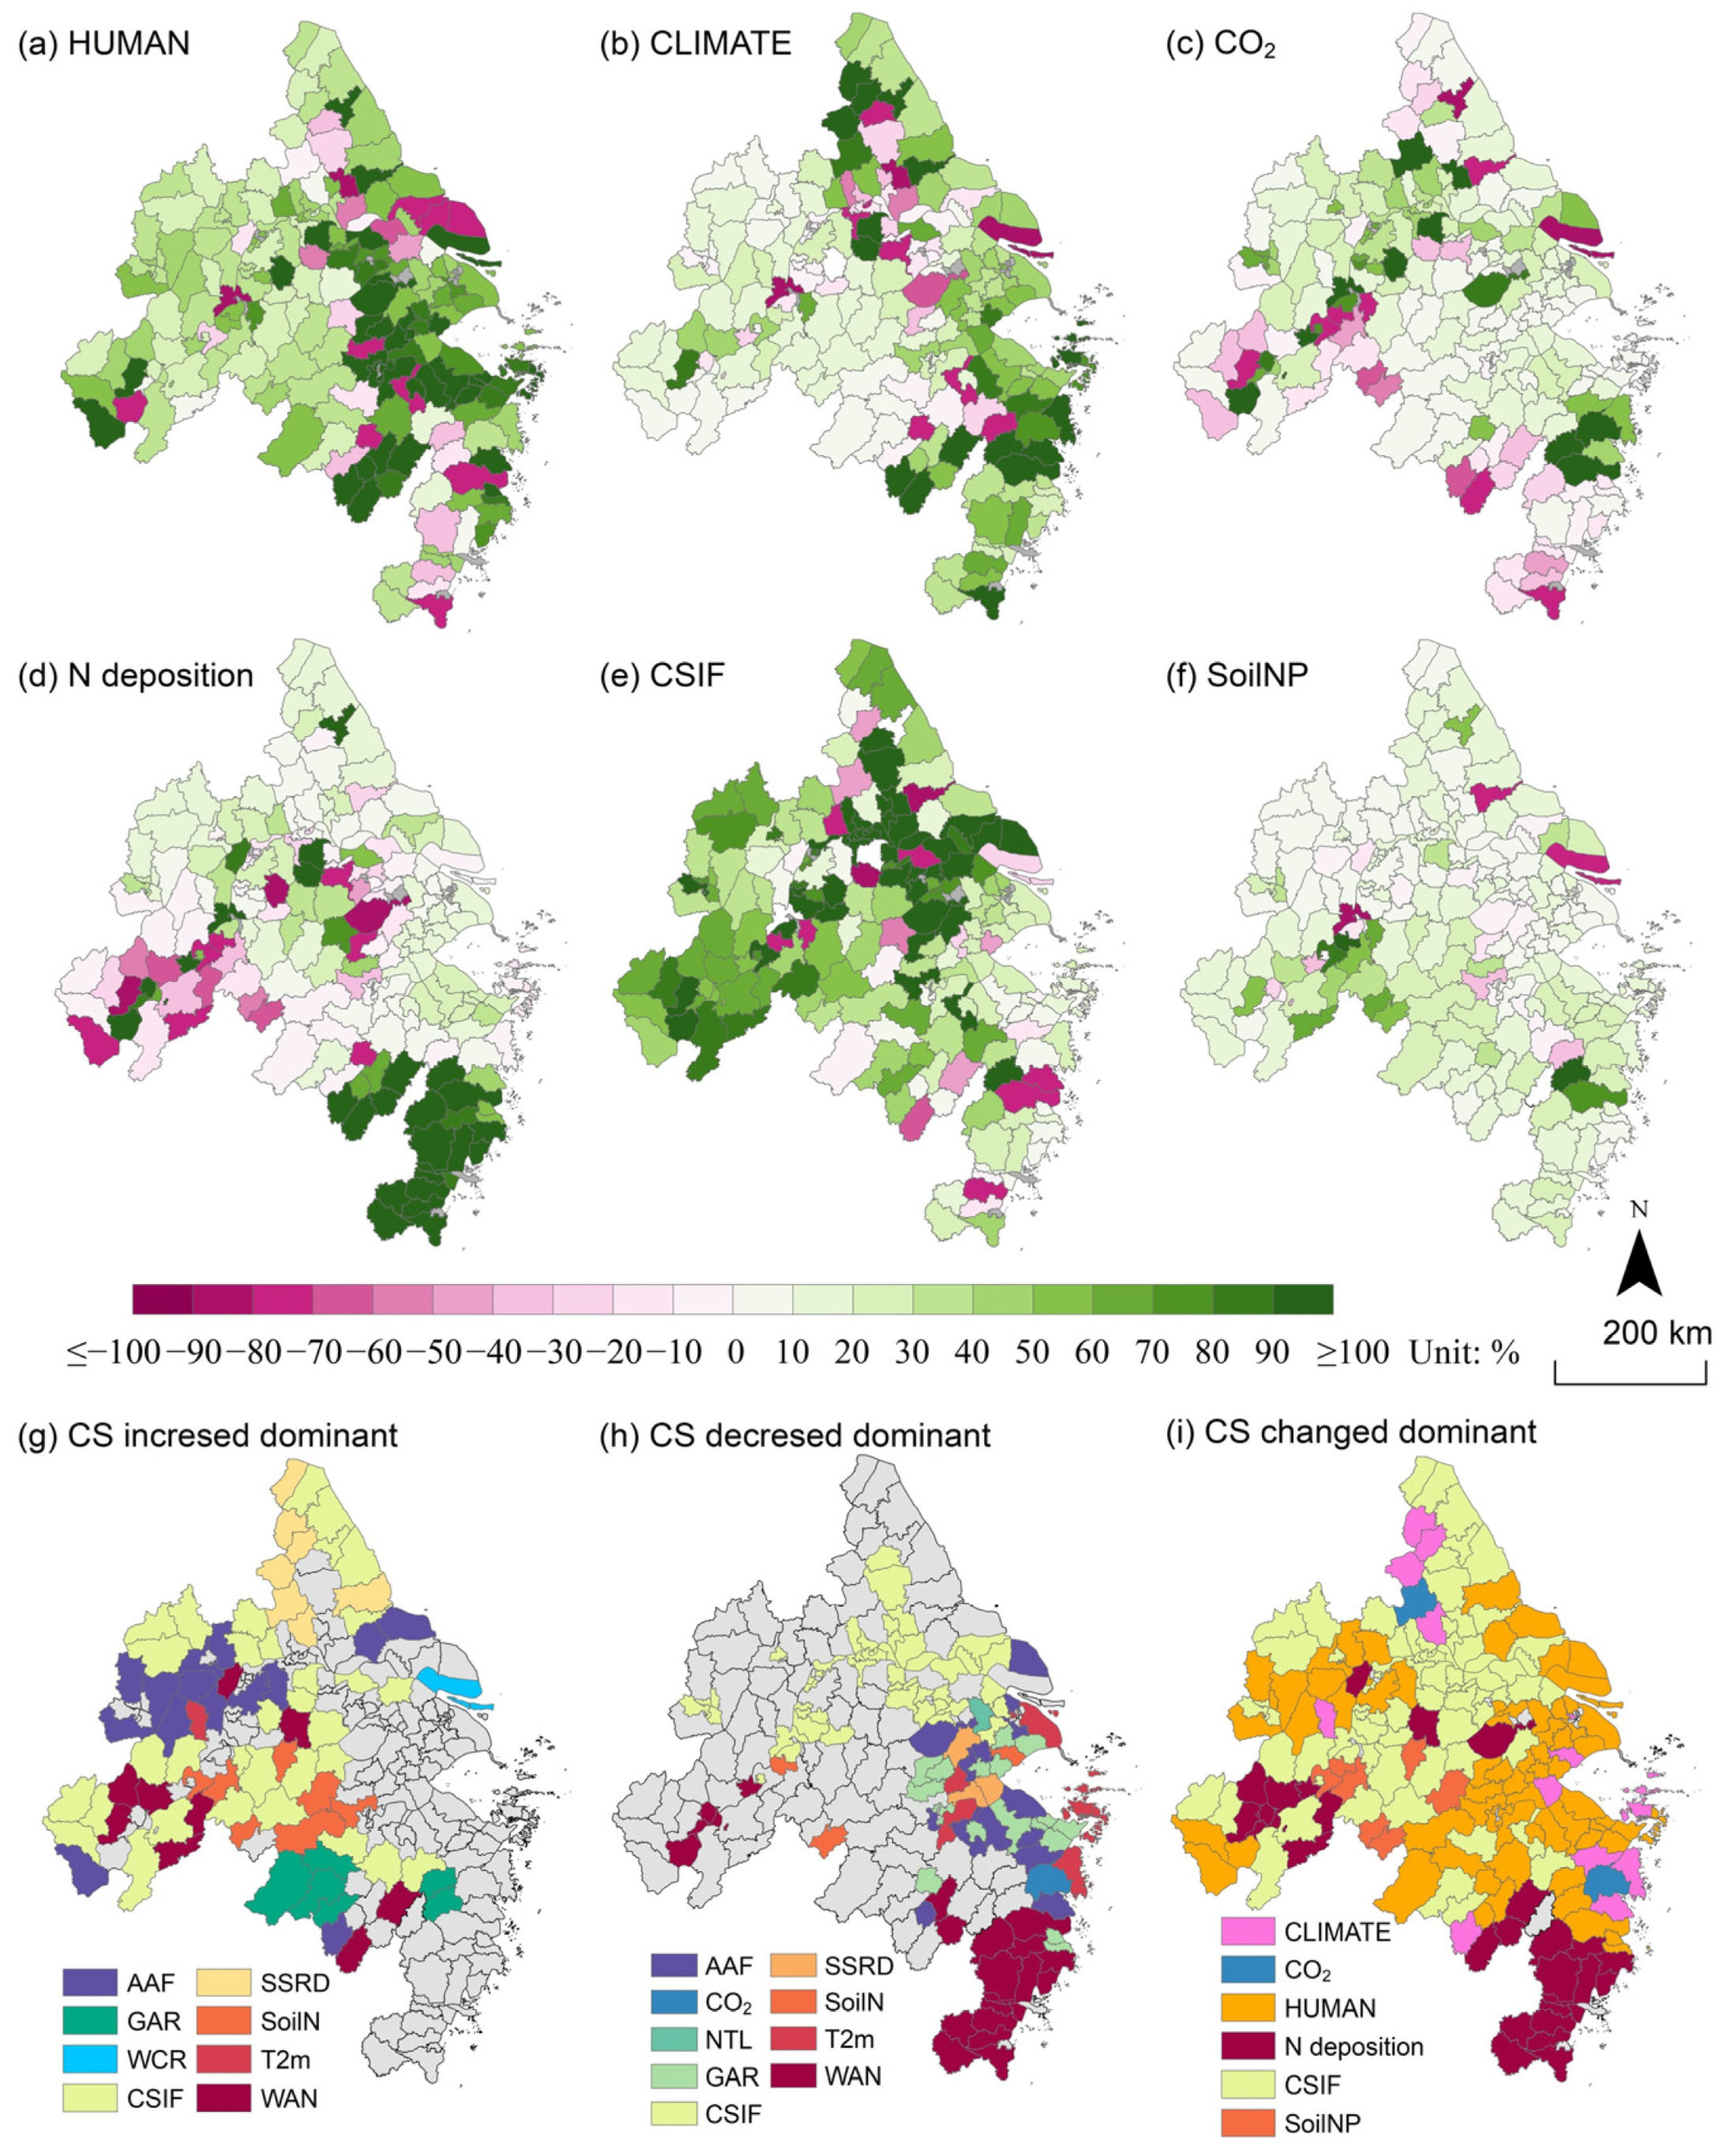
3.2.2. Driver Contributions

Based on the GWR-RF model coefficients, we estimated the relative contribution of six major categories (Figure 7a–f) and 14 subdivisions of driving factors (Figure S3) to CS changes from 2001 to 2020 for each county. Among them, the driving factors whose absolute value of driving contribution exceeds 50% and whose number exceeds 20 counties include AAF, GAR, T2m, SSRD, CO2, CSIF, and SoilN (Figure S3).
The differences in CLIMATE’s driving contributions to CS changes are significant, but they are mainly concentrated in coastal counties (Figure 7b). The positive effects of T2m and SSRD in the southern coastal counties of the YRUDA offset the negative effects of TP to a certain extent (Figure S3f–h); in the central region of the study area, the negative effects of T2m offset the positive effects of SSRD (Figure S3g,h). CO2 has a positive impact on Anhui and northern Jiangsu and some coastal areas of Zhejiang. Among them, 21 counties have a positive contribution of more than 50% (Figure 7c). The CO2 fertilization effect is suppressed within urban areas where high concentrations of CO2 are found. In some regions, negative values were observed, likely due to the combined effects of other factors or data inaccuracies, which reflected the saturation effect of CO2 fertilization. The decrease in WAN (Figure 5k) resulted in a negative effect on CS changes in the counties in the western YRDUA, while the simultaneous decrease in WAN and DAN (Figure 5i,k) resulted in a positive driving contribution to CS changes in the counties in the southern YRDUA (Figure 7d); this shows that the impact of changes in nitrogen deposition on CS has reached a relatively sensitive level. CSIF had a positive effect on 154 counties but still inhibited some municipal districts (Figure 7e), which is related to the decrease in photosynthesis intensity in these areas (Figure 5l).
The driving factor with the largest absolute contribution rate was identified as the dominant factor in CS changes. CSIF, AAF, WAN, SoilN, SSRD, and GAR, respectively, dominated the CS increase in 33, 14, 9, 7, 7, and 6 counties (Figure 7g); at the same time, CSIF, WAN, AAF, and T2m dominated the CS decrease in 47, 22, 14, and 8 counties (Figure 7h). Finally, through partitioning the absolute values of driver contribution by category, it can be revealed that CSIF and HUMAN emerged as the predominant determinants of CS changes in 74 and 70 counties, respectively. These factors accounted for the majority of cases, followed by N deposition (30 districts), CLIMATE (14 districts), SoilNP (7 districts), and CO2 (2 districts) (Figure 7i).
However, the number of counties where anthropogenic activities (AAF) led to an increase in CS was lower than the number of counties where AAF led to a decrease in CS. As shown in Figure 5c and Figure S3c, the continuous increase in urban afforestation does not necessarily lead to increased CS by vegetation, though afforestation certainly plays a positive role. It must be acknowledged that focusing solely on the driving contributions of the positive benefits of urban afforestation is insufficient; a deeper understanding of the underlying causal driving relationships is also necessary, offering a significant perspective for the research in Section 3.3.

3.3. Causal Relationships of Carbon Sequestration on County Scale

3.3.1. SEM Modeling Result

Structural Equation Modeling (SEM) forms the second module of our GWR-RF-SEM attribution analysis framework, focusing on discerning causal relationships driving CS. Utilizing the assumptions outlined in Figure 2, SEM was applied to verify CS changes in municipal districts, counties outside municipal districts, and across all counties. Both Chi-Squared and Fisher’s C tests affirm the credibility of the three causal models (p-value > 0.05). The explanatory capabilities (R2) of these models in municipal districts, counties outside municipal districts, and all counties were 0.71, 0.67, and 0.70, respectively. However, different regions showed different driving paths, and only AFF, GAR, and CSIF appeared as direct factors contributing to CS in each region.

3.3.2. Causal Path Characteristics

In areas outside municipal districts (Figure 8a), five direct paths drive CS: CSIF, AAF, WAN, GAR, and SSRD. CSIF emerged as the strongest driver (β = 0.44 ***), highlighting photosynthesis as the core driving force of CS amidst numerous external factors. This complexity is evident in the intricate causal network. AAF, along with POP, NTL, SoilN, SoilP, and DAN, indirectly influenced CSIF (β = 0.29 **) through GAR, besides directly driving CS (β = 0.21 **). Notably, POP and NTL exerted an indirectly negative influence (β = −0.11 *, β = −0.49 ***), while AAF (β = 0.26 **) and SoilN (β = 0.34 **) also indirectly impacted CS via CSIF. Both GAR and AAF in the county had direct and indirect effects on CS, with WAN’s direct influence exceeding DAN’s indirect impact. Whether direct or indirect, T2m and TP had no significant effect on CS.
In municipal areas (Figure 8b), the direct and positive impact of NTL and T2m on CS became significant (β = 0.23 **, β = 0.24 **), aligning with the unique dynamics of highly urbanized regions, where economic growth correlates with the urban heat island effect. While AAF maintains a strong direct effect on CS (β = 0.39 ***), its insignificant indirect pathway through CSIF suggests limited efficacy in boosting carbon sequestration via photosynthetic optimization. This implies that future afforestation should prioritize quantity-driven strategies. The direct impact of CSIF on CS was more pronounced than in the outside districts, suggesting stronger vegetation photosynthesis in urban areas, which may be caused by CO2 fertilization. GAR’s direct effect on CS paralleled that in the outside districts, indicating the consistent effectiveness of optimizing urban green space structure for CS enhancement. Neither WAN nor DAN significantly affected CS in urban areas. Notably, the inhibitory impact of increasing CO2 concentrations on GAR became significant in municipal districts, reflecting the dampening effect of rising CO2 on green space expansion. SoilN continued to indirectly affect CS through CSIF and GAR.
Considering all counties (Figure 8c), the driving strength of CSIF on CS slightly diminished (β = 0.40 **), nearly matching AAF’s influence (β = 0.38 **). The direct impact of GAR on CS intensified (β = 0.29 **), simplifying the overall causal network. The direct or indirect effects of SoilP, SoilN, POP, NTL, and WAN were not significant, nor were the influences of climate change factors and CO2 concentration on CS. It is worth noting that these drivers show different significance in municipal districts and the outside districts, which suggests that it is necessary to discuss these two districts separately. However, the pathway of GAR indirectly affecting CS via CSIF (β = 0.31 **) remained significant, affirming the reliability of influencing vegetation photosynthesis by optimizing green spatial structure.

4. Discussion

4.1. Causes of Changes in Urban Carbon Sequestration

Urbanized areas, with their unstable terrestrial ecosystems, often see vegetation transition from carbon sinks to sources. Our study found that 29.86% of counties in the YRDUA experienced a decrease in carbon sequestration (CS) (Figure 4b and Figure 6a), aligning with [72]’s findings on carbon sink stability across China’s terrestrial ecosystems. Contrary to [73], who focused on climate as the dominant factor, our research additionally investigates the influential capabilities of five other factors. It was discovered that human activities (HUMAN) and vegetation photosynthesis (CSIF) are the predominant drivers in over 144 counties, accounting for 73.10% of CS changes (Figure 7i), surpassing the impact of climate factors. It should be explicitly noted that although photosynthesis was observed in this study as the largest driving factor of CS, we argue that urban CS is primarily driven by the interplay between the biophysical potential for photosynthesis (represented by CSIF) and the overarching constraints and modifications imposed by human activities (represented by GAR, WCR, and others), rather than being solely attributed to the dominance of photosynthesis. The relative influence of photosynthesis and anthropogenic factors (e.g., land cover change) can vary dynamically, especially under conditions of large-scale changes in GAR, which were not observed within the study area.
Afforestation, the enhancement of green spatial structure, and the promotion of photosynthesis emerge as key drivers of CS changes, differing from studies focused solely on urban green infrastructure [73,74]. Compared with other factors, the intrinsic driver of CS in vegetation photosynthesis is considered the most significant. This is reflected in the evaluation of the importance of driving factors in GWR-RF (Figure 6b) and SEM modeling, which indicates that the normalized path coefficient β of CSIF, as influenced by CS, is greater than that of other factors (Figure 7). This suggests that promoting the sustainable development of vegetation photosynthesis based on natural solutions is the most important way to increase vegetation CS in urbanized areas. Afforestation and the enhancement of urban green space structure are recognized as important strategies for urban CS capability enhancement. These initiatives not only directly increase CS but also indirectly contribute to this process by promoting photosynthesis. They can be effectively advanced through collaborative efforts.
This study’s findings indicate that afforestation has boosted vegetation CS but has also contributed to CS decline in certain areas (Figure S3c), potentially due to disruptive afforestation practices harming wetland CS capacities. This supports reference [75]’s observations of decreasing wetland areas due to increased afforestation at the county scale. Therefore, in regions like the East China Plain, with its rich wetlands and river networks, careful consideration is required to balance afforestation with ecosystem preservation.
In municipal areas, urban green space optimization (GAR) significantly enhances CS compared to outside municipal areas, supported by additional light and heat resources from artificial lighting and urban heat islands (Figure 8b), more so than in non-municipal areas (Figure 8a). This finding aligns with research highlighting urban vegetation growth season extension due to increased light and heat conditions [43,76]. However, this extended growth period may also accelerate metabolism, potentially shortening vegetation lifespans and increasing mortality risks [75]. Therefore, the implementation of urban greening in urban areas necessitates refined management to ensure the maximization of urban CS potential.
This study found that SSRD and T2m have a significant impact on CS in some areas (Figure S3, Figure 6b, and Figure 8b), but compared to areas dominated by natural ecosystems, this impact was obviously lower [21]. It is possible that the time series of our study is relatively short, and the more significant effects of climate change have not been detected. Increases or decreases in nitrogen deposition had different driving forces on CS in the YRDUA [77], and it is hypothesized that the impact of nitrogen deposition on CS has reached a certain critical level and has large spatial differences, necessitating further exploration in future studies.
Contrary to the global trend where CO2 fertilization enhances CS, this study observed a bottleneck in the growth of vegetation CS under prolonged high CO2 conditions, likely due to imbalanced nutrient levels [78]. Additionally, the complex causal relationship between CS and CO2, considering that CO2 is both a byproduct of urban carbon emissions and a substrate for carbon absorption by urban vegetation [79], may also result in trends that differ from the observed global patterns.
In this study, T2m and TP were observed to have no significant effect on CS in rural areas. But in fact, vegetation growth related to CS is closely affected by hydrothermal conditions. The possible reason is that this study was conducted at an annual scale, and it is generally believed that annual changes in water and temperature stress are more pronounced at monthly or shorter time scales [80]. Meanwhile, due to the thermal adaptability of vegetation [81], the impact of temperature on CS is not significant over longer time scales. Additionally, compared to urban areas, rural areas tend to have fewer extreme climate events (such as high temperatures) [82], and due to the good economic development level of these areas, they have better vegetation maintenance capabilities, which can effectively handle water stress and other conditions. As a result, the effects of T2m and TP on CS were observed to be statistically insignificant on an interannual scale in rural areas.

4.2. Decision-Making of Targeted Development Strategies

Currently, in the context of China’s ongoing push for new urbanization and urban renewal in major cities, optimizing urban ecological spatial patterns emerges as a crucial task. The GWR-RF-SEM attribution analysis framework has thoroughly assessed the contribution and causal processes of carbon sequestration (CS) across 197 counties in China’s most developed urban agglomerations. The gained insights are instrumental in scientifically guiding these urbanization policies.
Coordinated urban and county-level strategies: The enhancement of urban vegetation’s CS capacity necessitates a coordinated strategy that encompasses both municipal districts and the surrounding counties. Due to the desynchronization between urbanization levels and carbon emissions across regions [83], it is possible to reduce carbon emissions within cities by strategically optimizing the location and scale of land designated for construction. Inter-city collaboration, accounting for the spillover effects of carbon emissions, can promote regional collaborative emission reductions, particularly through the coordination between developed areas and their peripheries. This fosters the coordinated development of neighboring regions and supports collective emission reductions. In this context, recognizing the high CS potential of green spaces, such as forests, is crucial for regional coordinated development. Based on factors including population density, nighttime illumination, nitrogen deposition, and soil nitrogen and phosphorus content, the selection of appropriate natural vegetation for cities and their adjacent counties is also of great importance. For rural and suburban areas, choosing vegetation species with the highest CS potential can effectively increase the regional carbon sink. It is estimated that, if all vegetation with carbon advantages were selected, China’s entire forest ecosystem could offset 7–14% of the current fossil carbon emissions by 2060 [84]. In urban areas, where improved lighting and thermal conditions are more favorable for carbon fixation [43,76], the effective maintenance of street trees and green belts will also contribute to the rapid achievement of regional carbon neutrality.
Wetland-sensitive afforestation: In the plains of the Yangtze River Delta, which are characterized by an extensive network of waterways and wetlands, the selection of sites for afforestation must be approached with caution. The objective should be to minimize any adverse effects of afforestation on the CS functions of these critical wetland ecosystems. The plains of the Yangtze River Delta, with their dense network of waterways and numerous wetlands, are subject to increased carbon emissions from water bodies due to eutrophication caused by various wastewater sources, which correlates positively with the level of socio-economic development. Focused protection of these wetlands is essential. Additionally, the selection of sites for afforestation must be carefully considered, with the goal of minimizing the negative impact on the CS capabilities of these vital wetland ecosystems. It is also proposed to establish a wetland protection fund for urban agglomerations to compensate for the economic losses incurred by development restrictions in outside districts oriented toward wetland protection and to provide financial support for regional wetland conservation.
Customized policy framework: Our identification of 14 key drivers influencing CS in the 197 counties of the YRDUA provides a valuable reference for crafting tailored CS policies at the county level. This localized approach is pivotal, as it recognizes the unique environmental, economic, and social contexts of each county.
These findings and recommendations highlight the importance of nuanced, data-driven approaches to urban ecological planning, essential for fostering sustainable urban development and enhancing the environmental health of China’s rapidly urbanizing regions.

4.3. Limitations and Future Work

The YRDUA, the focus of this study, possesses unique geographical and climatic characteristics [85]. Consequently, the identified driving mechanisms and model results are specific to this region and may vary significantly from those in tropical or arid urban environments. Due to the relatively high climate consistency within the study area, this paper adopts coarse-resolution reanalysis data to characterize regional climate change. In future studies on a larger scale, more detailed data are required to describe the influence of climate factors on CS. Additionally, our analysis utilizes static cross-sectional measurements of soil nitrogen and phosphorus, which constrains dynamic causal interpretation of nutrient–vegetation relationships; future work should incorporate temporal soil sampling to address this limitation. Another limitation of our study is the omission of the effects of urban atmospheric, soil, and water pollutants on vegetation CS. This aspect, particularly the health and growth status of vegetation under various stressors, should be incorporated in subsequent studies [86]. In addition, this study primarily examines the independent effects of various factors on CS. However, the synergistic effects (enhance or diminish CS) among these factors are also worthy of in-depth study.

5. Conclusions

To address the complex drivers of urban vegetation carbon sequestration (CS) changes, this study developed an innovative integrated attribution and influence analysis framework, GWR-RF-SEM. The results demonstrate that this framework effectively quantifies the contributions of various drivers to CS in densely urbanized areas and establishes a robust causal network structure. Compared to existing models, the GWR-RF model exhibits superior accuracy in measuring the contributions of different drivers to vegetation CS changes, successfully identifying and describing the main factors affecting CS across 197 counties. By utilizing SEM to analyze 14 driving indicators categorized into six groups, we elucidated the direct and indirect pathways influencing CS, providing a comprehensive causal structure diagram of urban CS dynamics. These findings significantly enhance our understanding of the mechanisms driving CS in the Yangtze River Delta Urban Agglomeration (YRDUA), China’s most developed urban area, from 2001 to 2020. Notably, we observed significant differences in CS drivers between municipal districts and the outside districts, with the SEM module thoroughly characterizing these disparities and underscoring the need for targeted strategies to optimize CS efficiency. Key findings highlight that promoting vegetation photosynthesis, artificial afforestation, and optimizing urban green space structures are pivotal for enhancing urban CS, with photosynthesis emerging as the central determinant. Nitrogen deposition, soil nitrogen and phosphorus, and anthropogenic activity have significantly different effects on urban vegetation CS between municipal districts and the outside districts.
In summary, the methodological approach developed in this study provides valuable insights into the mechanisms of urban vegetation CS, advancing the field of vegetation CS research, particularly in rapidly urbanizing areas. This advancement not only propels the field of vegetation CS studies forward, particularly in rapidly urbanizing areas, but also provides essential support for the enhancement of natural-based solutions depending on ecosystem services under urbanization and climate change.

Supplementary Materials

The following supporting information can be downloaded at: https://www.mdpi.com/article/10.3390/rs17122110/s1, Figure S1: Spatial distribution of the 2020 values of the 14 driver indicators of vegetation carbon sequestration in the YRDUA; Figure S2: GWR-RF modeling of vegetation carbon sequestration in the YRDUA local R2 in each county; Figure S3: Spatial distribution of driving contributions of 14 indicators to changes in vegetation carbon sequestration in the YRDUA, 2001–2020.

Author Contributions

Conceptualization, W.M.; methodology, W.M. and Y.Z.; software, W.M. and D.O.; validation, Y.S.; formal analysis, W.M. and N.W. (Nan Wang); data curation, Y.Z.; writing—original draft preparation, W.M. and Y.Z.; writing—review and editing, Y.C. and N.W. (Nannan Wang); visualization, Y.C. and W.M.; supervision, H.L.; project administration, H.L.; funding acquisition, W.M. and H.L. All authors have read and agreed to the published version of the manuscript.

Funding

This research was funded by the Basic Special Business Fund for R&D for Central Level Scientific Research Institutes with grants ZX2023QT006 and GYZX220308, under the Nanjing Institute of Environmental Sciences, Ministry of Ecology and Environment, and was also supported by the National Key Plan for Research and Development of China (with grant no 2023YFC3804202).

Data Availability Statement

All the datasets used in this article can be found in Table 1.

Conflicts of Interest

The authors declare no conflicts of interest.

References

  1. Filonchyk, M.; Peterson, M.P.; Zhang, L.; Hurynovich, V.; He, Y. Greenhouse Gases Emissions and Global Climate Change: Examining the Influence of CO2, CH4, and N2O. Sci. Total Environ. 2024, 935, 173359. [Google Scholar] [CrossRef] [PubMed]
  2. IPCC. Climate Change 2023: Synthesis Report; IPCC: Geneva, Switzerland, 2023. [Google Scholar]
  3. UNEP. Emissions Gap Report 2024: No More Hot Air…Please! With a Massive Gap Between Rhetoric and Reality, Countries Draft New Climate Commitments; UNEP: Nairobi, Kenya, 2024. [Google Scholar]
  4. Raj, S.; Yerim, L.; Yun, G.Y.; Santamouris, M. Contrasting Urban Heat Disparities across Income Levels in Seoul and London. Sustain. Cities Soc. 2025, 121, 106215. [Google Scholar] [CrossRef]
  5. United Nations. World Urbanization Prospects: The 2018 Revision; United Nations: New York, NY, USA, 2019. [Google Scholar]
  6. He, J.; Wang, F. Does Urban Agglomeration Reduce Carbon Emissions in Chinese Cities? New Perspective on Factor Mobility. Energy Econ. 2025, 143, 108297. [Google Scholar] [CrossRef]
  7. Liu, X.; Zheng, L.; Wang, Y. Revealing the Roles of Climate, Urban Form, and Vegetation Greening in Shaping the Land Surface Temperature of Urban Agglomerations in the Yangtze River Economic Belt of China. J. Environ. Manag. 2025, 377, 124602. [Google Scholar] [CrossRef]
  8. Cai, A.; Wang, L.; Zhang, Y.; Wu, H.; Zhang, H.; Guo, R.; Wu, J. Uncovering the Multiple Socio-Economic Driving Factors of Carbon Emissions in Nine Urban Agglomerations of China Based on Machine Learning. Energy 2025, 319, 134859. [Google Scholar] [CrossRef]
  9. Li, X.; Zhan, W.; Deng, F.; Liang, X.; Luo, P. Causal Discovery and Analysis of Global City Carbon Emissions Based on Data-Driven and Hybrid Intelligence. Comput. Environ. Urban Syst. 2025, 115, 102206. [Google Scholar] [CrossRef]
  10. Girardin, C.A.J.; Jenkins, S.; Seddon, N.; Allen, M.; Lewis, S.L.; Wheeler, C.E.; Griscom, B.W.; Malhi, Y. Nature-Based Solutions Can Help Cool the Planet—If We Act Now. Nature 2021, 593, 191–194. [Google Scholar] [CrossRef]
  11. Lian, X.; Jiao, L.; Liu, Z.; Jia, Q.; Liu, W.; Liu, Y. A Detection of Street Trees and Green Space: Understanding Contribution of Urban Trees to Climate Change Mitigation. Urban For. Urban Green. 2024, 102, 128561. [Google Scholar] [CrossRef]
  12. Zhang, X.; Brandt, M.; Tong, X.; Ciais, P.; Yue, Y.; Xiao, X.; Zhang, W.; Wang, K.; Fensholt, R. A Large but Transient Carbon Sink from Urbanization and Rural Depopulation in China. Nat. Sustain. 2022, 5, 321–328. [Google Scholar] [CrossRef]
  13. Chen, J.; Qiu, B.; Chakraborty, T.; Miao, X.; Cao, Y.; Li, L.; Zhao, S.; Ni, Y.; Tian, X.; Qian, Y.; et al. Contrasting Effects of Urbanization on Vegetation between the Global South and Global North. Nat. Sustain. 2025, 8, 373–384. [Google Scholar] [CrossRef]
  14. Kang, J.; Zhang, B.; Zhang, Q.; Li, C.; Ma, J.; Yin, J.; Yu, K.; Hu, Y.; Bou-Zeid, E. Global Urbanization Indirectly ‘Enhances’ the Carbon Sequestration Capacity of Urban Vegetation. Geogr. Sustain. 2025, 6, 100268. [Google Scholar] [CrossRef]
  15. Chen, Y.; Ma, W.; Shao, Y.; Wang, N.; Yu, Z.; Li, H.; Hu, Q. The Impacts and Thresholds Detection of 2D/3D Urban Morphology on the Heat Island Effects at the Functional Zone in Megacity during Heatwave Event. Sustain. Cities Soc. 2025, 118, 106002. [Google Scholar] [CrossRef]
  16. Rodriguez Mendez, Q.; Fuss, S.; Lück, S.; Creutzig, F. Assessing Global Urban CO2 Removal. Nat. Cities 2024, 1, 413–423. [Google Scholar] [CrossRef]
  17. Vora, N.M.; Narayan, S.; Aluso, A.; Donatti, C.I.; El Omrani, O.; Hannah, L.; Mahmood, J.; Ndembi, N.; Vale, M.M.; Willetts, E. Nature-Based Solutions Are Essential for Climate and Health Action. Lancet 2024, 404, 913–915. [Google Scholar] [CrossRef]
  18. Wang, J.; Shao, Z.; Fu, P.; Zhuang, Q.; Chang, J.; Jing, P.; Zhao, Z.; Xu, Z.; Wang, S.; Yang, F. Unraveling the Impact of Urban Expansion on Vegetation Carbon Sequestration Capacity: A Case Study of the Yangtze River Economic Belt. Sustain. Cities Soc. 2025, 120, 106157. [Google Scholar] [CrossRef]
  19. Liu, Z.; Liu, Y.; Wang, J. A Global Analysis of Agricultural Productivity and Water Resource Consumption Changes over Cropland Expansion Regions. Agric. Ecosyst. Environ. 2021, 321, 107630. [Google Scholar] [CrossRef]
  20. Zhang, X.; Susan Moran, M.; Zhao, X.; Liu, S.; Zhou, T.; Ponce-Campos, G.E.; Liu, F. Impact of Prolonged Drought on Rainfall Use Efficiency Using MODIS Data across China in the Early 21st Century. Remote Sens. Environ. 2014, 150, 188–197. [Google Scholar] [CrossRef]
  21. Lyu, J.; Fu, X.; Lu, C.; Zhang, Y.; Luo, P.; Guo, P.; Huo, A.; Zhou, M. Quantitative Assessment of Spatiotemporal Dynamics in Vegetation NPP, NEP and Carbon Sink Capacity in the Weihe River Basin from 2001 to 2020. J. Clean. Prod. 2023, 428, 139384. [Google Scholar] [CrossRef]
  22. Tong, Z.; Yang, J.; Liu, Y.; Zhang, Z.; Liu, S.; Lu, Y.; Pang, B.; An, R. Cooling and Optimizing Urban Heat Island Based on a Thermal Knowledge-Informed Multi-Type Ant Colony Model. Remote Sens. Environ. 2024, 306, 114138. [Google Scholar] [CrossRef]
  23. Cai, W.; Xu, L.; Wen, D.; Zhou, Z.; Li, M.; Wang, T.; He, N. The Carbon Sequestration Potential of Vegetation over the Tibetan Plateau. Renew. Sustain. Energy Rev. 2025, 207, 114937. [Google Scholar] [CrossRef]
  24. Liao, Z.; Yue, C.; He, B.; Zhao, K.; Ciais, P.; Alkama, R.; Grassi, G.; Sitch, S.; Chen, R.; Quan, X.; et al. Growing Biomass Carbon Stock in China Driven by Expansion and Conservation of Woody Areas. Nat. Geosci. 2024, 17, 1127–1134. [Google Scholar] [CrossRef]
  25. Sun, Y.; Guan, Q.; Du, Q.; Wang, Q.; Sun, W. Elevation Dependence of Vegetation Growth Stages and Carbon Sequestration Dynamics in High Mountain Ecosystems. Environ. Res. 2025, 273, 121200. [Google Scholar] [CrossRef] [PubMed]
  26. Tian, S.; Wu, W.; Chen, S.; Song, D.; Li, L.; Li, Z. Regional Differences in the Contribution of Drivers to Carbon Sequestration and Oxygen Release from Global Terrestrial Ecosystems. Resour. Conserv. Recycl. 2024, 207, 107704. [Google Scholar] [CrossRef]
  27. Kikstra, J.S.; Nicholls, Z.R.J.; Smith, C.J.; Lewis, J.; Lamboll, R.D.; Byers, E.; Sandstad, M.; Meinshausen, M.; Gidden, M.J.; Rogelj, J.; et al. The IPCC Sixth Assessment Report WGIII Climate Assessment of Mitigation Pathways: From Emissions to Global Temperatures. Geosci. Model Dev. 2022, 15, 9075–9109. [Google Scholar] [CrossRef]
  28. Zhang, J.; Chen, S.; Wu, Z.; Fu, Y.H. Review of Vegetation Phenology Trends in China in a Changing Climate. Prog. Phys. Geogr. Earth Environ. 2022, 46, 829–845. [Google Scholar] [CrossRef]
  29. Hong, W.; Ren, Z.; Guo, Y.; Wang, C.; Cao, F.; Zhang, P.; Hong, S.; Ma, Z. Spatiotemporal Changes in Urban Forest Carbon Sequestration Capacity and Its Potential Drivers in an Urban Agglomeration: Implications for Urban CO2 Emission Mitigation under China’s Rapid Urbanization. Ecol. Indic. 2024, 159, 111601. [Google Scholar] [CrossRef]
  30. Wang, A.; Kafy, A.-A.; Rahaman, Z.A.; Rahman, M.T.; Faisal, A.A.; Afroz, F. Investigating Drivers Impacting Vegetation Carbon Sequestration Capacity on the Terrestrial Environment in 127 Chinese Cities. Environ. Sustain. Indic. 2022, 16, 100213. [Google Scholar] [CrossRef]
  31. Huang, B.; Lu, F.; Wang, X.; Wu, X.; Zhang, L.; Ouyang, Z. Ecological Restoration and Rising CO2 Enhance the Carbon Sink, Counteracting Climate Change in Northeastern China. Environ. Res. Lett. 2022, 17, 014002. [Google Scholar] [CrossRef]
  32. Khodakarami, L. Spatial Modeling of Micro-scale Carbon Dioxide Sources and Sinks in Urban Environments: A Novel Approach to Quantify Urban Impacts on Global Warming. Greenh. Gases Sci. Technol. 2024, 14, 470–491. [Google Scholar] [CrossRef]
  33. Xie, S.; Mo, X.; Hu, S.; Liu, S. Contributions of Climate Change, Elevated Atmospheric CO2 and Human Activities to ET and GPP Trends in the Three-North Region of China. Agric. For. Meteorol. 2020, 295, 108183. [Google Scholar] [CrossRef]
  34. Grekousis, G.; Feng, Z.; Marakakis, I.; Lu, Y.; Wang, R. Ranking the Importance of Demographic, Socioeconomic, and Underlying Health Factors on US COVID-19 Deaths: A Geographical Random Forest Approach. Health Place 2022, 74, 102744. [Google Scholar] [CrossRef] [PubMed]
  35. Khan, S.N.; Li, D.; Maimaitijiang, M. A Geographically Weighted Random Forest Approach to Predict Corn Yield in the US Corn Belt. Remote Sens. 2022, 14, 2843. [Google Scholar] [CrossRef]
  36. Luo, Y.; Yan, J.; McClure, S. Distribution of the Environmental and Socioeconomic Risk Factors on COVID-19 Death Rate across Continental USA: A Spatial Nonlinear Analysis. Environ. Sci. Pollut. Res. 2021, 28, 6587–6599. [Google Scholar] [CrossRef] [PubMed]
  37. Wang, Y.; Hu, J.; Yang, Y.; Li, R.; Peng, C.; Zheng, H. Climate Change Will Reduce the Carbon Use Efficiency of Terrestrial Ecosystems on the Qinghai-Tibet Plateau: An Analysis Based on Multiple Models. Forests 2021, 12, 12. [Google Scholar] [CrossRef]
  38. Wei, S.; Chen, Q.; Wu, W.; Ma, J. Quantifying the Indirect Effects of Urbanization on Urban Vegetation Carbon Uptake in the Megacity of Shanghai, China. Environ. Res. Lett. 2021, 16, 064088. [Google Scholar] [CrossRef]
  39. Xu, D.; Mou, W.; Wang, X.; Zhang, R.; Gao, T.; Ai, D.; Yuan, J.; Zhang, R.; Fang, X. Consistent Responses of Ecosystem CO2 Exchange to Grassland Degradation in Alpine Meadow of the Qinghai-Tibetan Plateau. Ecol. Indic. 2022, 141, 109036. [Google Scholar] [CrossRef]
  40. Ito, A. A Historical Meta-analysis of Global Terrestrial Net Primary Productivity: Are Estimates Converging? Glob. Change Biol. 2011, 17, 3161–3175. [Google Scholar] [CrossRef]
  41. Turner, D.P.; Ritts, W.D.; Cohen, W.B.; Gower, S.T.; Running, S.W.; Zhao, M.; Costa, M.H.; Kirschbaum, A.A.; Ham, J.M.; Saleska, S.R.; et al. Evaluation of MODIS NPP and GPP Products across Multiple Biomes. Remote Sens. Environ. 2006, 102, 282–292. [Google Scholar] [CrossRef]
  42. Sun, J.; Yue, Y.; Niu, H. Evaluation of NPP Using Three Models Compared with MODIS-NPP Data over China. PLoS ONE 2021, 16, e0252149. [Google Scholar] [CrossRef]
  43. Lian, X.; Jiao, L.; Zhong, J.; Jia, Q.; Liu, J.; Liu, Z. Artificial Light Pollution Inhibits Plant Phenology Advance Induced by Climate Warming. Environ. Pollut. 2021, 291, 118110. [Google Scholar] [CrossRef]
  44. Chen, Z.; Yu, B.; Yang, C.; Zhou, Y.; Yao, S.; Qian, X.; Wang, C.; Wu, B.; Wu, J. An Extended Time Series (2000–2018) of Global NPP-VIIRS-like Nighttime Light Data from a Cross-Sensor Calibration. Earth Syst. Sci. Data 2021, 13, 889–906. [Google Scholar] [CrossRef]
  45. Yang, W.; Zhao, Y.; Wang, Q.; Guan, B. Climate, CO2, and Anthropogenic Drivers of Accelerated Vegetation Greening in the Haihe River Basin. Remote Sens. 2022, 14, 268. [Google Scholar] [CrossRef]
  46. Chen, J.; Chen, J.; Liao, A.; Cao, X.; Chen, L.; Chen, X.; He, C.; Han, G.; Peng, S.; Lu, M.; et al. Global Land Cover Mapping at 30m Resolution: A POK-Based Operational Approach. ISPRS J. Photogramm. Remote Sens. 2015, 103, 7–27. [Google Scholar] [CrossRef]
  47. Xi, Y.; Peng, S.; Liu, G.; Ducharne, A.; Ciais, P.; Prigent, C.; Li, X.; Tang, X. Trade-off between Tree Planting and Wetland Conservation in China. Nat. Commun. 2022, 13, 1967. [Google Scholar] [CrossRef]
  48. Muñoz-Sabater, J.; Dutra, E.; Agustí-Panareda, A.; Albergel, C.; Arduini, G.; Balsamo, G.; Boussetta, S.; Choulga, M.; Harrigan, S.; Hersbach, H.; et al. ERA5-Land: A State-of-the-Art Global Reanalysis Dataset for Land Applications. Earth Syst. Sci. Data 2021, 13, 4349–4383. [Google Scholar] [CrossRef]
  49. Wang, S.; Zhang, Y.; Ju, W.; Chen, J.M.; Ciais, P.; Cescatti, A.; Sardans, J.; Janssens, I.A.; Wu, M.; Berry, J.A.; et al. Recent Global Decline of CO2 Fertilization Effects on Vegetation Photosynthesis. Science 2020, 370, 1295–1300. [Google Scholar] [CrossRef]
  50. Babenhauserheide, A.; Basu, S.; Houweling, S.; Peters, W.; Butz, A. Comparing the CarbonTracker and TM5-4DVar Data Assimilation Systems for CO2 Surface Flux Inversions. Atmos. Chem. Phys. 2015, 15, 9747–9763. [Google Scholar] [CrossRef]
  51. Bloom, A.J.; Kasemsap, P.; Rubio-Asensio, J.S. Rising Atmospheric CO2 Concentration Inhibits Nitrate Assimilation in Shoots but Enhances It in Roots of C3 Plants. Physiol. Plant. 2020, 168, 963–972. [Google Scholar] [CrossRef]
  52. Feng, Z.; Rütting, T.; Pleijel, H.; Wallin, G.; Reich, P.B.; Kammann, C.I.; Newton, P.C.D.; Kobayashi, K.; Luo, Y.; Uddling, J. Constraints to Nitrogen Acquisition of Terrestrial Plants under Elevated CO2. Glob. Change Biol. 2015, 21, 3152–3168. [Google Scholar] [CrossRef]
  53. Gurmesa, G.A.; Wang, A.; Li, S.; Peng, S.; De Vries, W.; Gundersen, P.; Ciais, P.; Phillips, O.L.; Hobbie, E.A.; Zhu, W.; et al. Retention of Deposited Ammonium and Nitrate and Its Impact on the Global Forest Carbon Sink. Nat. Commun. 2022, 13, 880. [Google Scholar] [CrossRef]
  54. Tausz-Posch, S.; Tausz, M.; Bourgault, M. Elevated [CO2] Effects on Crops: Advances in Understanding Acclimation, Nitrogen Dynamics and Interactions with Drought and Other Organisms. Plant Biol. 2020, 22, 38–51. [Google Scholar] [CrossRef] [PubMed]
  55. Chen, Z.; Huang, X.; Huang, C.; Yang, Y.; Yang, H.; Zhang, J.; Huang, T. High Atmospheric Wet Nitrogen Deposition and Major Sources in Two Cities of Yangtze River Delta: Combustion-Related NH3 and Non-Fossil Fuel NOx. Sci. Total Environ. 2022, 806, 150502. [Google Scholar] [CrossRef] [PubMed]
  56. Seddon, J.; Smit, W.; Kheirbek, I.; Gu, B. The Urban Nitrogen Challenge. One Earth 2021, 4, 8–9. [Google Scholar] [CrossRef]
  57. Jia, Y.; Wang, Q.; Zhu, J.; Chen, Z.; He, N.; Yu, G. A Spatial and Temporal Dataset of Atmospheric Inorganic Nitrogen Dry Deposition in China (2006–2015). China Sci. Data 2021, 6. [Google Scholar] [CrossRef]
  58. Jia, Y.; Wang, Q.; Zhu, J.; Chen, Z.; He, N.; Yu, G. A Spatial and Temporal Dataset of Atmospheric Inorganic Nitrogen Wet Deposition in China (1996–2015). China Sci. Data 2019, 4. [Google Scholar] [CrossRef]
  59. Sun, Y.; Gu, L.; Wen, J.; van der Tol, C.; Porcar-Castell, A.; Joiner, J.; Chang, C.Y.; Magney, T.; Wang, L.; Hu, L.; et al. From Remotely Sensed Solar-Induced Chlorophyll Fluorescence to Ecosystem Structure, Function, and Service: Part I-Harnessing Theory. Glob. Change Biol. 2023, 29, 2926–2952. [Google Scholar] [CrossRef]
  60. Wang, S.; Ju, W.; Peñuelas, J.; Cescatti, A.; Zhou, Y.; Fu, Y.; Huete, A.; Liu, M.; Zhang, Y. Urban−rural Gradients Reveal Joint Control of Elevated CO2 and Temperature on Extended Photosynthetic Seasons. Nat. Ecol. Evol. 2019, 3, 1076–1085. [Google Scholar] [CrossRef]
  61. Yu, H.; Zhang, J.; Kong, X.; Du, G.; Meng, B.; Li, M.; Yi, S. The Consequences of Urbanization on Vegetation Photosynthesis in the Yangtze River Delta, China. Front. For. Glob. Change 2022, 5, 996197. [Google Scholar] [CrossRef]
  62. Zhang, L.; Yang, L.; Zohner, C.M.; Crowther, T.W.; Li, M.; Shen, F.; Guo, M.; Qin, J.; Yao, L.; Zhou, C. Direct and Indirect Impacts of Urbanization on Vegetation Growth across the World’s Cities. Sci. Adv. 2022, 8, eabo0095. [Google Scholar] [CrossRef]
  63. Qiu, R.; Han, G.; Ma, X.; Sha, Z.; Shi, T.; Xu, H.; Zhang, M. CO2 Concentration, A Critical Factor Influencing the Relationship between Solar-Induced Chlorophyll Fluorescence and Gross Primary Productivity. Remote Sens. 2020, 12, 1377. [Google Scholar] [CrossRef]
  64. Zhang, Y.; Joiner, J.; Alemohammad, S.H.; Zhou, S.; Gentine, P. A Global Spatially Contiguous Solar-Induced Fluorescence (CSIF) Dataset Using Neural Networks. Biogeosciences 2018, 15, 5779–5800. [Google Scholar] [CrossRef]
  65. Du, E.; Terrer, C.; Pellegrini, A.F.A.; Ahlström, A.; van Lissa, C.J.; Zhao, X.; Xia, N.; Wu, X.; Jackson, R.B. Global Patterns of Terrestrial Nitrogen and Phosphorus Limitation. Nat. Geosci. 2020, 13, 221–226. [Google Scholar] [CrossRef]
  66. Zhang, Y.-W.; Guo, Y.; Tang, Z.; Feng, Y.; Zhu, X.; Xu, W.; Bai, Y.; Zhou, G.; Xie, Z.; Fang, J. Patterns of Nitrogen and Phosphorus Pools in Terrestrial Ecosystems in China. Earth Syst. Sci. Data 2021, 13, 5337–5351. [Google Scholar] [CrossRef]
  67. Gocic, M.; Trajkovic, S. Analysis of Changes in Meteorological Variables Using Mann-Kendall and Sen’s Slope Estimator Statistical Tests in Serbia. Glob. Planet. Change 2013, 100, 172–182. [Google Scholar] [CrossRef]
  68. Jasim, I.A.; Fileeh, M.K.; Ebrahhem, M.A.; Al-Maliki, L.A.; Al-Mamoori, S.K.; Al-Ansari, N. Geographically Weighted Regression Model for Physical, Social, and Economic Factors Affecting the COVID-19 Pandemic Spreading. Environ. Sci. Pollut. Res. 2022, 29, 51507–51520. [Google Scholar] [CrossRef]
  69. Breiman, L. Random Forests. Mach. Learn. 2001, 45, 5–32. [Google Scholar] [CrossRef]
  70. Conradi, T.; Van Meerbeek, K.; Ordonez, A.; Svenning, J. Biogeographic Historical Legacies in the Net Primary Productivity of Northern Hemisphere Forests. Ecol. Lett. 2020, 23, 800–810. [Google Scholar] [CrossRef]
  71. Lefcheck, J.S. piecewiseSEM: Piecewise Structural Equation Modelling in R for Ecology, Evolution, and Systematics. Methods Ecol. Evol. 2016, 7, 573–579. [Google Scholar] [CrossRef]
  72. Wang, K.; Piao, S.; He, Y.; Liu, Y.; He, H. Spatial Variations and Mechanisms for the Stability of Terrestrial Carbon Sink in China. Sci. China Earth Sci. 2023, 66, 227–236. [Google Scholar] [CrossRef]
  73. Dorst, H.; van der Jagt, A.; Raven, R.; Runhaar, H. Urban Greening through Nature-Based Solutions—Key Characteristics of an Emerging Concept. Sustain. Cities Soc. 2019, 49, 101620. [Google Scholar] [CrossRef]
  74. Zhuang, Q.; Shao, Z.; Gong, J.; Li, D.; Huang, X.; Zhang, Y.; Xu, X.; Dang, C.; Chen, J.; Altan, O.; et al. Modeling Carbon Storage in Urban Vegetation: Progress, Challenges, and Opportunities. Int. J. Appl. Earth Obs. Geoinf. 2022, 114, 103058. [Google Scholar] [CrossRef]
  75. Esperon-Rodriguez, M.; Tjoelker, M.G.; Lenoir, J.; Baumgartner, J.B.; Beaumont, L.J.; Nipperess, D.A.; Power, S.A.; Richard, B.; Rymer, P.D.; Gallagher, R.V. Climate Change Increases Global Risk to Urban Forests. Nat. Clim. Change 2022, 12, 950–955. [Google Scholar] [CrossRef]
  76. Chen, Y.; Feng, X.; Tian, H.; Wu, X.; Gao, Z.; Feng, Y.; Piao, S.; Lv, N.; Pan, N.; Fu, B. Accelerated Increase in Vegetation Carbon Sequestration in China after 2010: A Turning Point Resulting from Climate and Human Interaction. Glob. Change Biol. 2021, 27, 5848–5864. [Google Scholar] [CrossRef] [PubMed]
  77. Pichler, M.; Hartig, F. Machine Learning and Deep Learning—A Review for Ecologists. Methods Ecol. Evol. 2023, 14, 994–1016. [Google Scholar] [CrossRef]
  78. Fang, J.; Yu, G.; Liu, L.; Hu, S.; Chapin, F.S. Climate Change, Human Impacts, and Carbon Sequestration in China. Proc. Natl. Acad. Sci. USA 2018, 115, 4015–4020. [Google Scholar] [CrossRef]
  79. Ruehr, S.; Keenan, T.F.; Williams, C.; Zhou, Y.; Lu, X.; Bastos, A.; Canadell, J.G.; Prentice, I.C.; Sitch, S.; Terrer, C. Evidence and Attribution of the Enhanced Land Carbon Sink. Nat. Rev. Earth Environ. 2023, 4, 518–534. [Google Scholar] [CrossRef]
  80. Damm, A.; Cogliati, S.; Colombo, R.; Fritsche, L.; Genangeli, A.; Genesio, L.; Hanus, J.; Peressotti, A.; Rademske, P.; Rascher, U.; et al. Response Times of Remote Sensing Measured Sun-Induced Chlorophyll Fluorescence, Surface Temperature and Vegetation Indices to Evolving Soil Water Limitation in a Crop Canopy. Remote Sens. Environ. 2022, 273, 112957. [Google Scholar] [CrossRef]
  81. Fang, Z.; Zhang, W.; Wang, L.; Schurgers, G.; Ciais, P.; Peñuelas, J.; Brandt, M.; Yang, H.; Huang, K.; Shen, Q.; et al. Global Increase in the Optimal Temperature for the Productivity of Terrestrial Ecosystems. Commun. Earth Environ. 2024, 5, 466. [Google Scholar] [CrossRef]
  82. Jia, W.; Zhao, S. Trends and Drivers of Land Surface Temperature along the Urban-Rural Gradients in the Largest Urban Agglomeration of China. Sci. Total Environ. 2020, 711, 134579. [Google Scholar] [CrossRef]
  83. Zhou, Y.; Chen, M.; Tang, Z.; Mei, Z. Urbanization, Land Use Change, and Carbon Emissions: Quantitative Assessments for City-Level Carbon Emissions in Beijing-Tianjin-Hebei Region. Sustain. Cities Soc. 2021, 66, 102701. [Google Scholar] [CrossRef]
  84. Xu, H.; Yue, C.; Zhang, Y.; Liu, D.; Piao, S. Forestation at the Right Time with the Right Species Can Generate Persistent Carbon Benefits in China. Proc. Natl. Acad. Sci. USA 2023, 120, e2304988120. [Google Scholar] [CrossRef] [PubMed]
  85. Velasco, E.; Roth, M.; Norford, L.; Molina, L.T. Does Urban Vegetation Enhance Carbon Sequestration? Landsc. Urban Plan. 2016, 148, 99–107. [Google Scholar] [CrossRef]
  86. Eckardt, N.A.; Ainsworth, E.A.; Bahuguna, R.N.; Broadley, M.R.; Busch, W.; Carpita, N.C.; Castrillo, G.; Chory, J.; DeHaan, L.R.; Duarte, C.M.; et al. Climate Change Challenges, Plant Science Solutions. Plant Cell 2023, 35, 24–66. [Google Scholar] [CrossRef] [PubMed]
Figure 1. Geographical Layout of the YRDUA. (a) presents the positioning of the YRDUA in China. Part (b) offers a detailed portrayal of the 214 counties constituting the YRDUA.
Remotesensing 17 02110 g001
Figure 2. Conceptual SEM model of CS changes in the YRDUA. The black arrows indicate the direction of causality, with the cause at the point where the arrow departs and the effect at the point where the arrow points. Different colors represent different types of influences, mentioned in Table 1.
Remotesensing 17 02110 g002
Figure 3. Box plots of CS in all counties, municipal districts, and cities outside the districts in the YRDUA. The values for the years 2001 and 2020 represent the mean CS for each district, while the values for the period 2001–2020 represent the change in CS for each district.
Remotesensing 17 02110 g003
Figure 4. CS spatial distribution characteristics in YRDUA from 2001 to 2020: (a) mean CS; (b) Sen’s slope of CS; (c) hot spot analysis (Getis-Ord Gi*).
Remotesensing 17 02110 g004
Figure 5. Sen’s slope and significance level of CS driving factors in the YRDUA from 2001 to 2020. The abbreviated characters in (al) have the same meaning as in Figure 2. Significant trends indicate p < 0.05. White color means no data in this county.
Remotesensing 17 02110 g005
Figure 6. Scatterplot of GWR-RF model fit and importance ranking of drivers for changes in CS from 2001 to 2020 in the YRDUA: (a) scatterplot, with city districts and urban areas outside city districts marked in different colors, and the blue shadow represents the confidence interval of the linear fitting; (b) importance ranking of drivers, where the significance levels are as follows: * denotes p < 0.05 and ** denotes p < 0.01, respectively.
Remotesensing 17 02110 g006
Figure 7. Spatial distribution of contribution of CS driving factors at county scale in YRDUA. (af) represent driving contribution of HUMAN, CLIMATE, CO2, N deposition, CSIF, and CO2 to CS changes, respectively. HUMAN is sum of POP, NTL, AAF, GAR, and WCR; CLIMATE is sum of T2m, SSRD, and TP; N deposition is sum of DAN and WAN; SoilNP is sum of SoilN and SoilP. All units are in %. (g,h), respectively, represent dominant driving factors in municipal and outside districts. (i) represents class of dominant driving factors in study area. Gray color means no data in this county.
Remotesensing 17 02110 g007
Figure 8. SEM causal path modeling driven by changes in CS in the YRDUA from 2001 to 2020. The results are obtained by verifying the model assumed in Figure 2. (a) Outside the districts. (b) Municipal districts. (c) All counties. The black arrow indicates that the predictive factor has a significant impact on the response variable (* p < 0.05, ** p < 0.01, *** p < 0.001), while the dashed line indicates no significant impact. The direction of the arrow represents the direction of causal action, and the number on the arrow is the standardized path coefficient β. A larger β implies a stronger driving influence.
Remotesensing 17 02110 g008
Table 1. Carbon sequestration and its driving data in YRDUA.
Data TypeIndicatorsUnitSpatial ResolutionTime RangeData Source
Carbon sequestrationNPPkgC/m2/year500 m2001–2020https://doi.org/10.5067/MODIS/MOD17A3HGF.061 (accessed on 9 June 2025)
Anthropogenic activityPOPmillion/km21 km2001–2020https://www.worldpop.org/
(accessed on 9 June 2025)
NTLnW/cm2/sr1 km2001–2020https://doi.org/10.7910/DVN/YGIVCD
(accessed on 9 June 2025)
AAFhm2Statistical2001–2020https://data.cnki.net/
(accessed on 9 June 2025)
GAR%30 m2000, 2010, 2020https://www.webmap.cn/commres.do?method=globeIndex
(accessed on 9 June 2025)
WCR%30 m
Climate changeTPm0.1°2010–2020https://cds.climate.copernicus.eu/cdsapp#!/dataset/reanalysis-era5-land?tab=overview
(accessed on 9 June 2025)
T2mK0.1°
SSRDJ/m20.1°
Atmospheric CO2
concentration
CO2mol/m2·s1° × 1°2010–2020http://carbontracker.noaa.gov
(accessed on 9 June 2025)
Nitrogen depositionDANkg/hm210 km2006–2015http://www.nesdc.org.cn (accessed on 9 June 2025)
WANkg/hm21 km2001–2015
Photosynthesis intensityCSIFmW/m2·nm·sr0.05°2001–2020https://doi.org/10.11888/Ecolo.tpdc.271751
(accessed on 9 June 2025)
Soil nitrogen and phosphorusSoilN *mg/hm21 km-https://datadryad.org/stash/dataset/doi:10.5061/dryad.6hdr7sqzx
(accessed on 9 June 2025)
SoilP *mg/hm21 km-
* Indicates that the dataset is not a time series but a grid state value.
Table 2. Model accuracy of CS attribution in YRDUA.
Evaluation IndicatorOLSGWRRFGWR-RF
RSS66.3432.3118.0114.77
AIC388.68286.24206.44162.64
AICc393.81331.16263.16210.11
R20.690.840.900.93
Adj. R20.660.810.870.91
Disclaimer/Publisher’s Note: The statements, opinions and data contained in all publications are solely those of the individual author(s) and contributor(s) and not of MDPI and/or the editor(s). MDPI and/or the editor(s) disclaim responsibility for any injury to people or property resulting from any ideas, methods, instructions or products referred to in the content.

