4.1. Datasets
The VisDrone2019 dataset [
47] is a widely recognized, large-scale benchmark designed for UAV vision research and algorithm evaluation. It comprises over 6000 video clips and 25,000 images covering diverse environments, including urban, rural, highway, and construction sites, under varying weather conditions and target sizes. This diversity enables a comprehensive assessment of model robustness across different scenarios. The dataset includes key object categories, such as pedestrians, vehicles, bicycles, and motorcycles, with detailed annotations encompassing bounding boxes, object categories, motion states, and occlusion information—essential for training, evaluation, and validation.
SRM-YOLO is evaluated on the VisDrone2019 dataset, which offers a broad and representative set of samples.
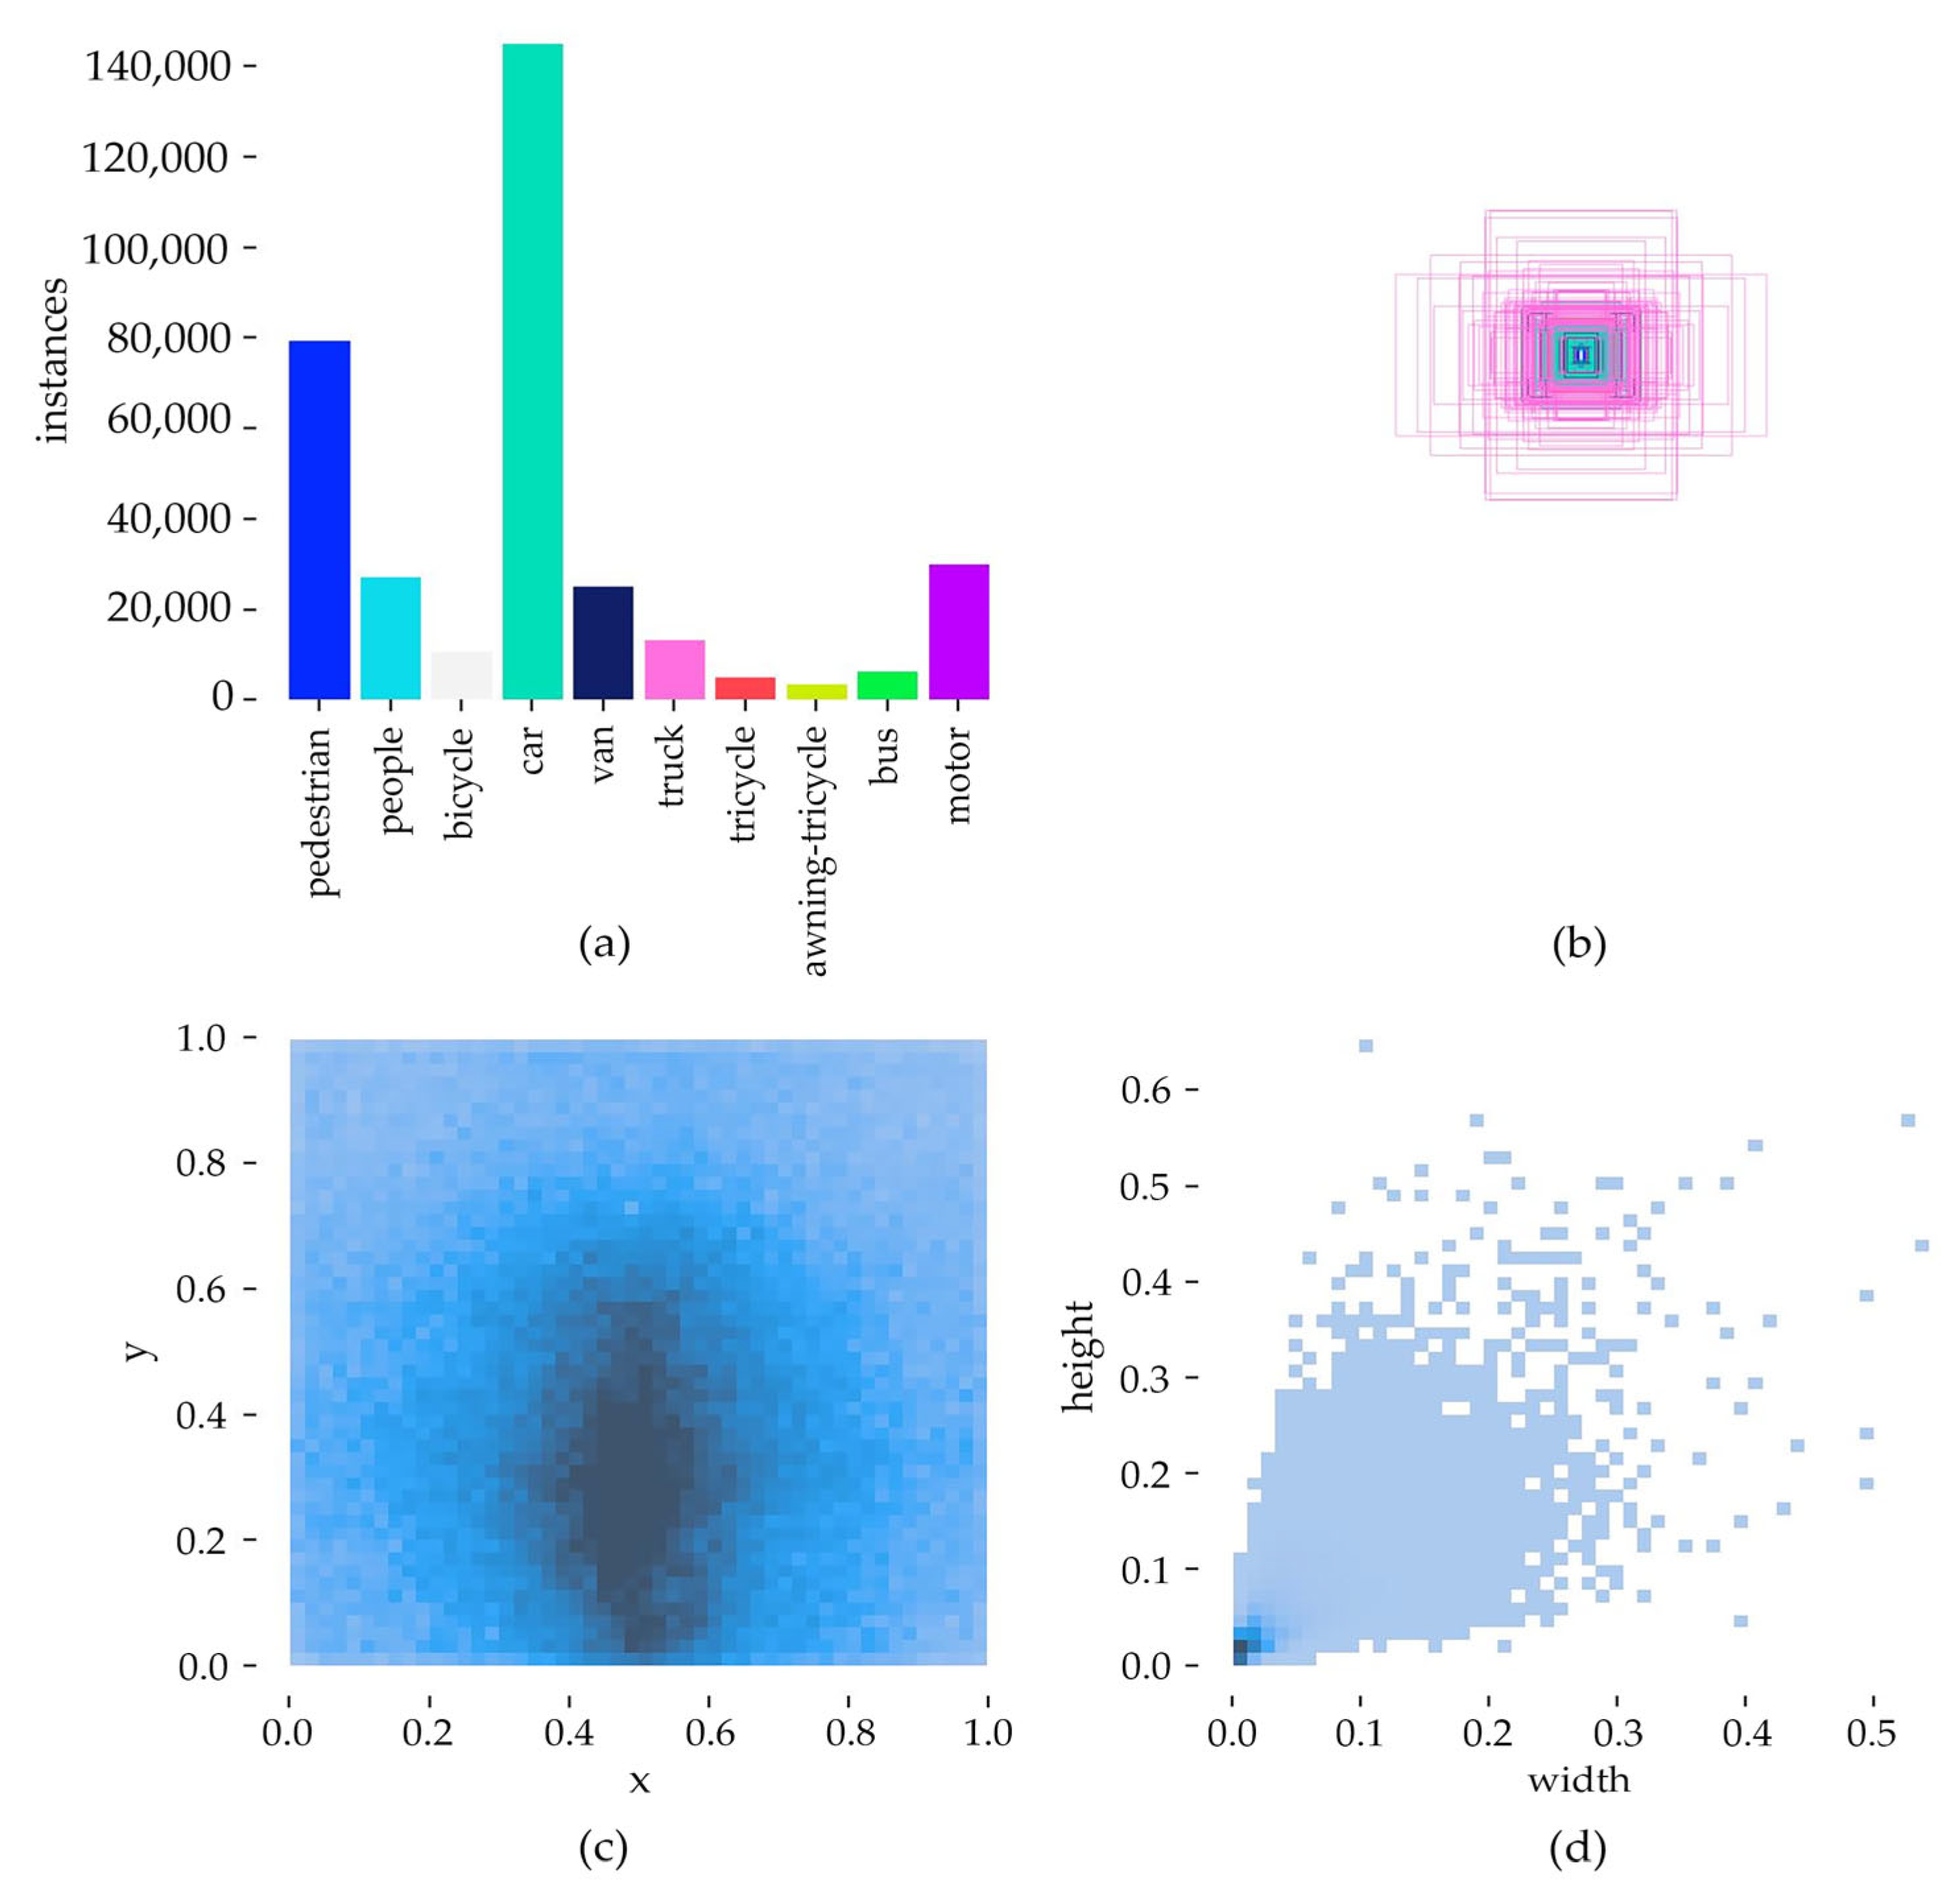
Figure 7 illustrates the dataset’s image distribution, label counts, and object size variations, highlighting several inherent challenges. First, object detection is complicated by factors such as high density, motion blur, small object size, and class ambiguity. For instance, distinguishing between pedestrians and people can be difficult in certain scenarios. Moreover, UAV imaging introduces significant variations in object scale and increased occlusion, further complicating detection. Second, class imbalance is evident in the dataset, with the Car category having 144,867 annotations, whereas Awning-tricycle has only 3246. This imbalance necessitates robust detection models capable of handling underrepresented classes. Third, the anchor size distribution reveals that while medium- and large-sized anchors dominate categories like Van, Truck, Car, and Bus, most objects are smaller than 100 × 100 pixels, with a significant proportion under 50 × 50 pixels, posing additional challenges for small object detection.
For this study, the dataset is divided into training, validation, and testing sets, with 6471, 548, and 1610 images, respectively, following the partitioning used in the VisDrone2019 Challenge. All images are resized to 640 × 640 pixels for both training and testing. Utilizing the YOLOv8 framework, two sets of scaling parameters—[0.33, 0.25, 1024] and [0.33, 0.50, 1024]—are applied to adjust network depth, width, and maximum channel capacity, ensuring optimal model performance.
4.3. Evaluation Metrics
In this experiment, the performance of the proposed network was evaluated using three standard object detection metrics—precision (P), recall (R), and mean average precision (mAP).
Precision (
P) stands for the percentage of targets that are correctly predicted in all detected targets. The accuracy rate can be calculated using the following formula, where
TP represents the correct prediction of the model, and
represents the wrong prediction of the model:
Recall (
R) stands for the proportion of targets that are correctly predicted in all targets. The recall rate can be calculated by the following formula, where
represents the targets that need to be predicted but are incorrectly detected by the model:
Average accuracy (
AP) stands for the area enclosed by the axis of the curve formed by the precision rate and recall rate, while the average accuracy (
mAP) is the mean of the average accuracy of all samples, both of which can be calculated using the following formulas:
In addition, to describe the computational cost caused by the proposed modules, the number of parameters (Param) and GFLOPs are used as indicators to describe the results of the algorithm.
4.4. Ablation Experiment
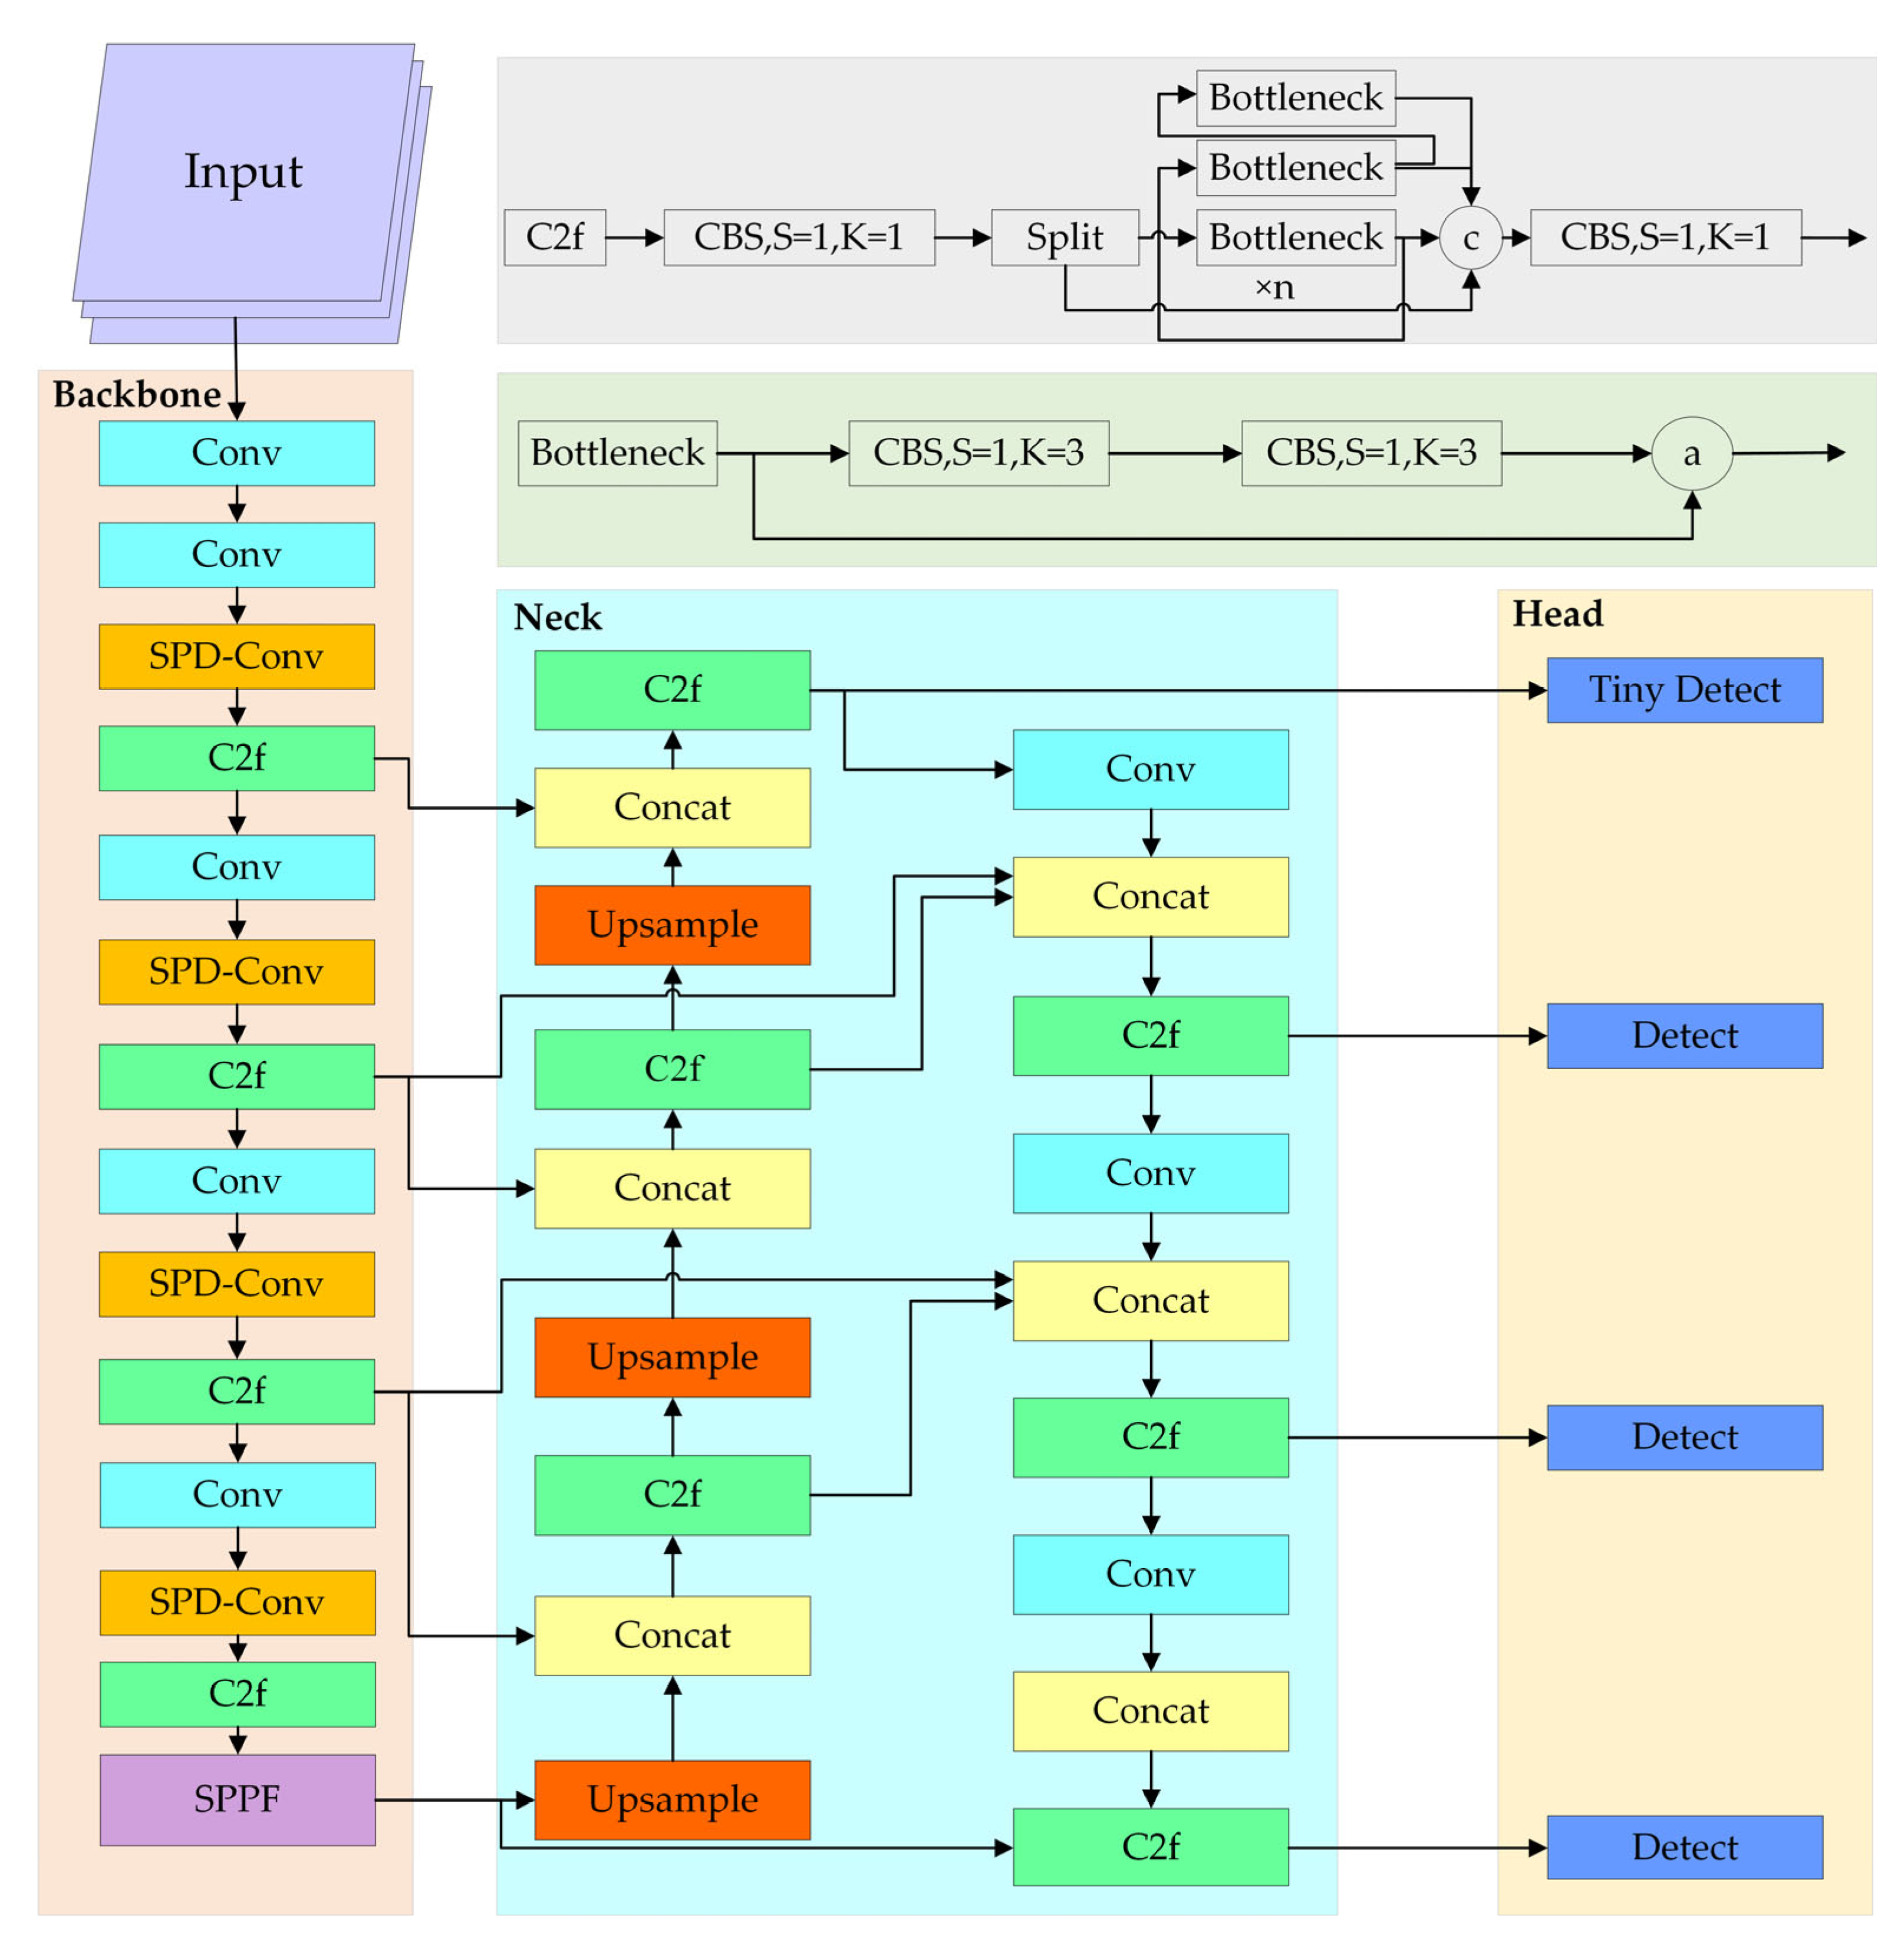
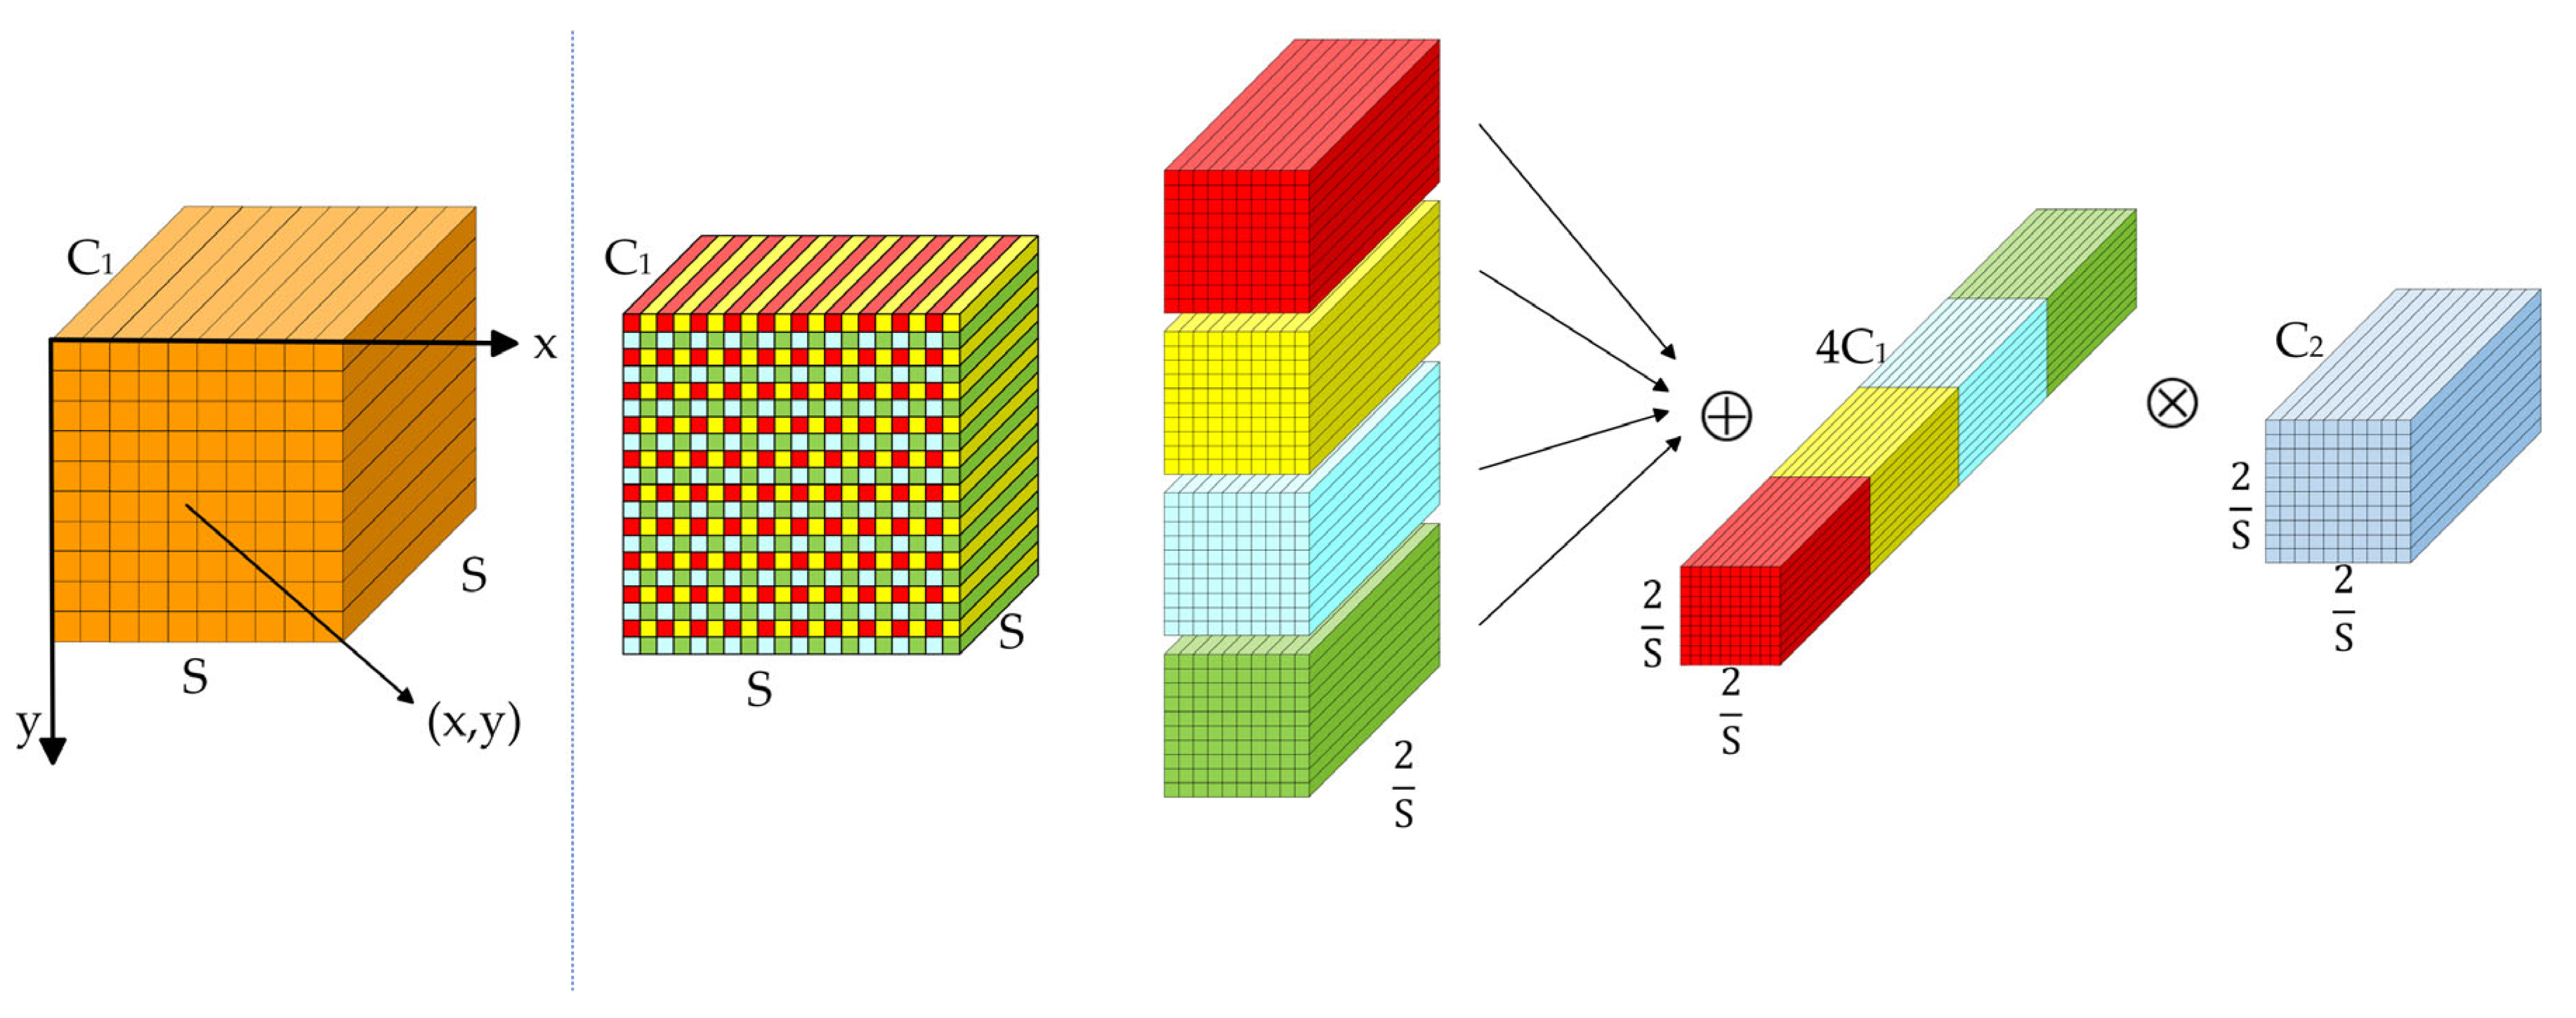
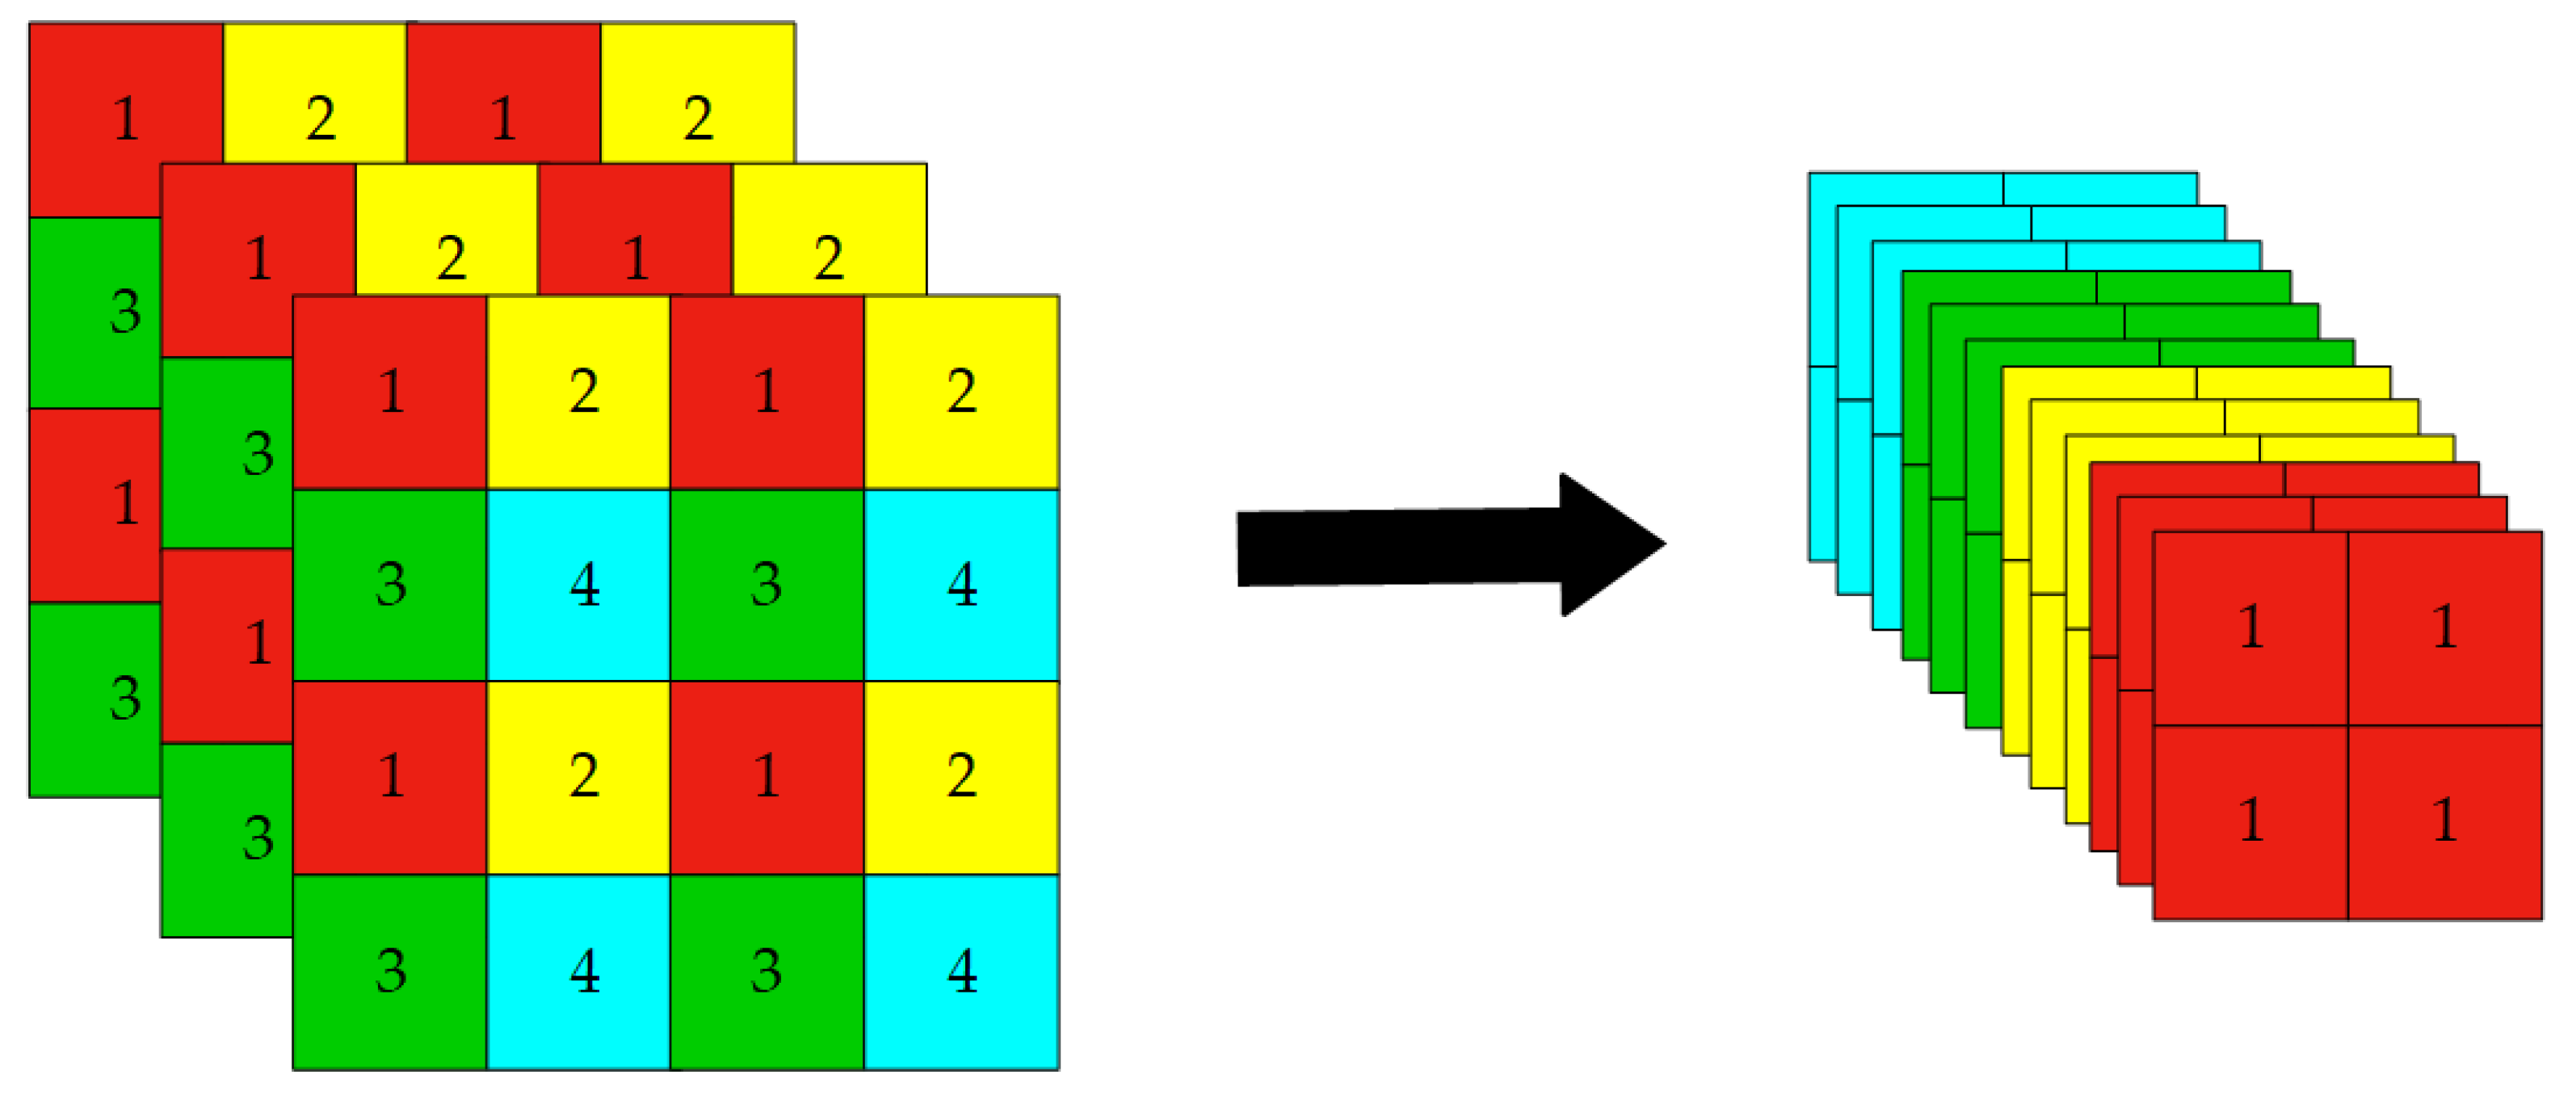
To evaluate the effectiveness of each proposed component, we conducted a series of ablation studies using the YOLOv8n and YOLOv8s models as baselines. Our proposed model, SRM-YOLO, integrates the following four key components to enhance the detection performance of small objects: the SPD-Conv block, the Reuse Fusion Structure (RFS) for feature reutilization, a dedicated tiny-object detection head, and the MPDIoU loss function for improved localization accuracy. Specifically, the RFS module was designed to efficiently reuse multi-scale features extracted from the backbone, alleviating feature degradation caused by repeated upsampling and downsampling. This reinforced the feature representation of small-scale targets.
The impact of each individual module was evaluated using standard detection metrics, including precision (
P), recall (
R), mAP50, and the number of parameters (Param) and GFLOPs. The results are presented in
Table 3 and
Table 4.
Table 3 and
Table 4 present the detailed results of our ablation studies, where √ indicates module activation and -- denotes deactivation. This experimental design enables a clear assessment of each component’s contribution to the overall performance.
In YOLOv8s-based experiments, the baseline achieved a precision of 48.8%, a recall of 38.7%, and an mAP50 of 38.9%. Introducing the SPD-Conv module alone increased precision to 52.7% and mAP50 to 40.8%, while the Tiny Head alone raised mAP50 to 42.6%. When all modules were integrated, SRM-YOLO (based on YOLOv8s) achieved a precision of 53.6%, a recall of 44.6%, and an mAP50 of 45.6%.
These findings not only validate the individual effectiveness of SPD-Conv and the Tiny Head but also emphasize the synergistic effect achieved when combined with the RFS module. Notably, the RFS module benefits from the fine-grained representations provided by SPD-Conv during the feature fusion process, resulting in marked improvements in detection performance.
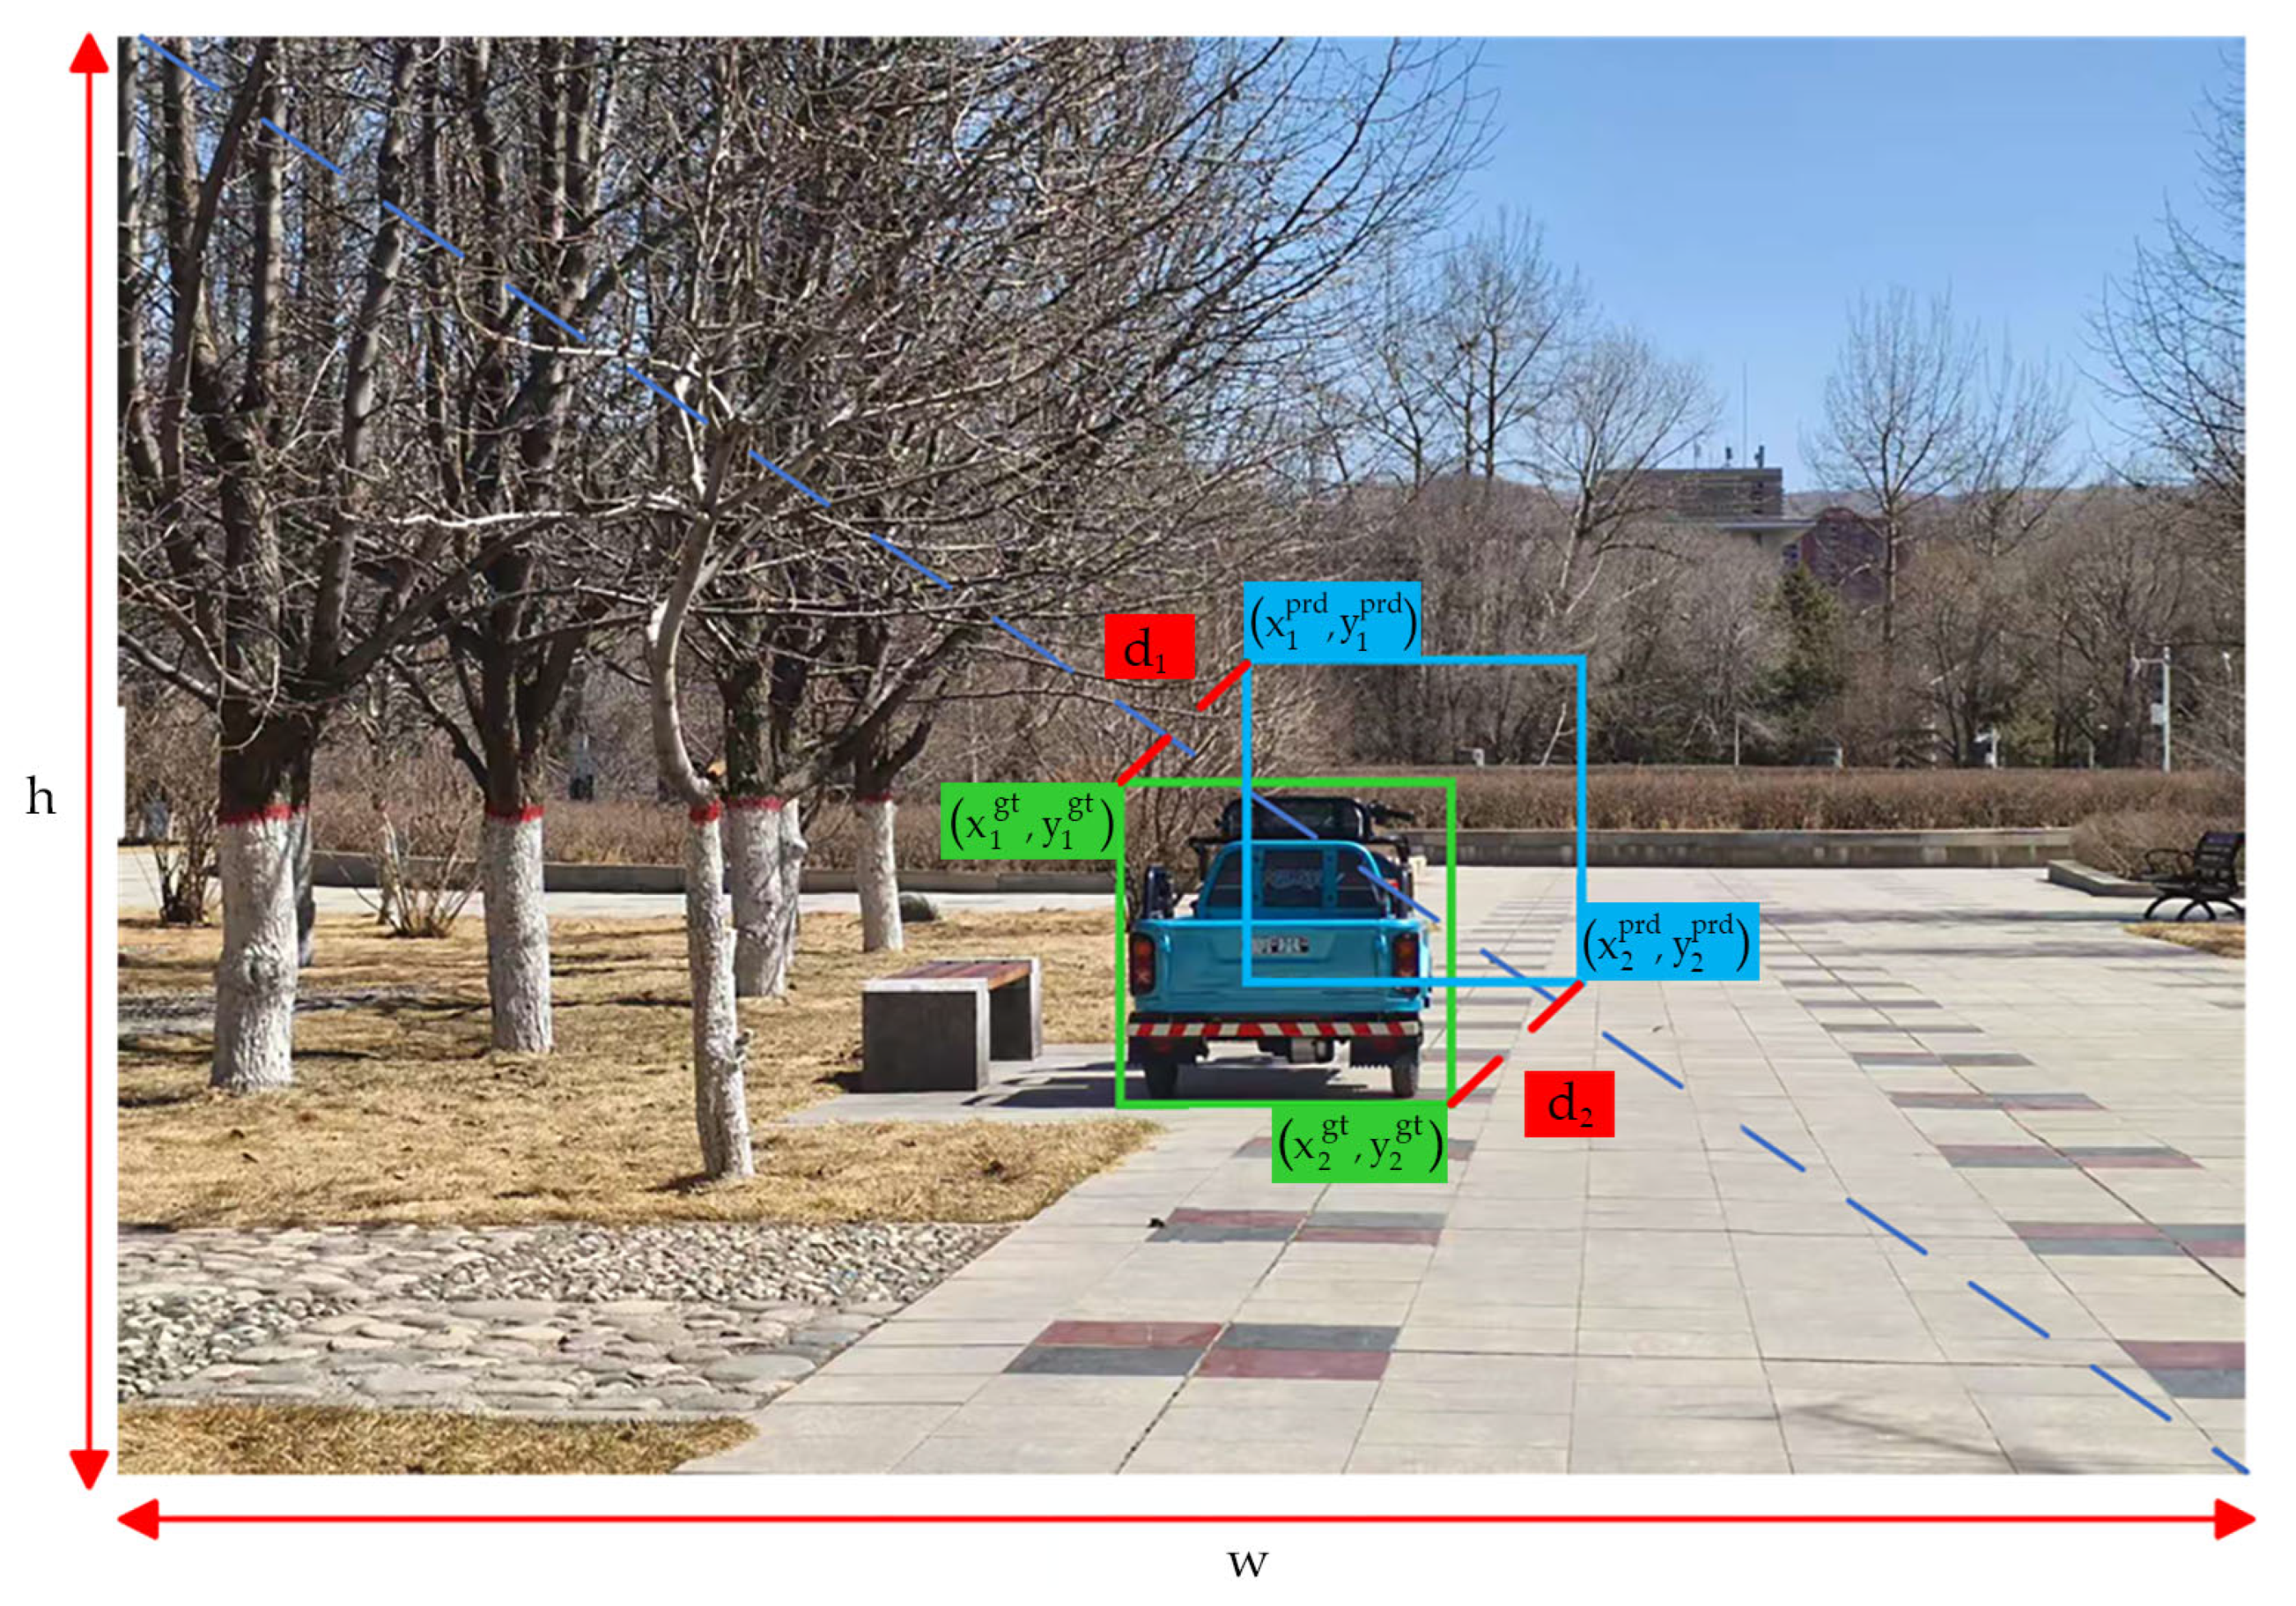
To further evaluate the effectiveness of the proposed MPDIoU loss, we conducted comparative experiments against several widely adopted IoU-based loss functions, including GIoU, DIoU, CIoU, and the Normalized Wasserstein Distance (NWD), using YOLOv8n as the baseline. As shown in
Table 5, while GIoU, DIoU, and NWD offered only marginal improvements in mAP50, MPDIoU achieved a notable 1.0% increase, demonstrating its superior capacity to improve localization accuracy—particularly for small objects—and overall detection performance.
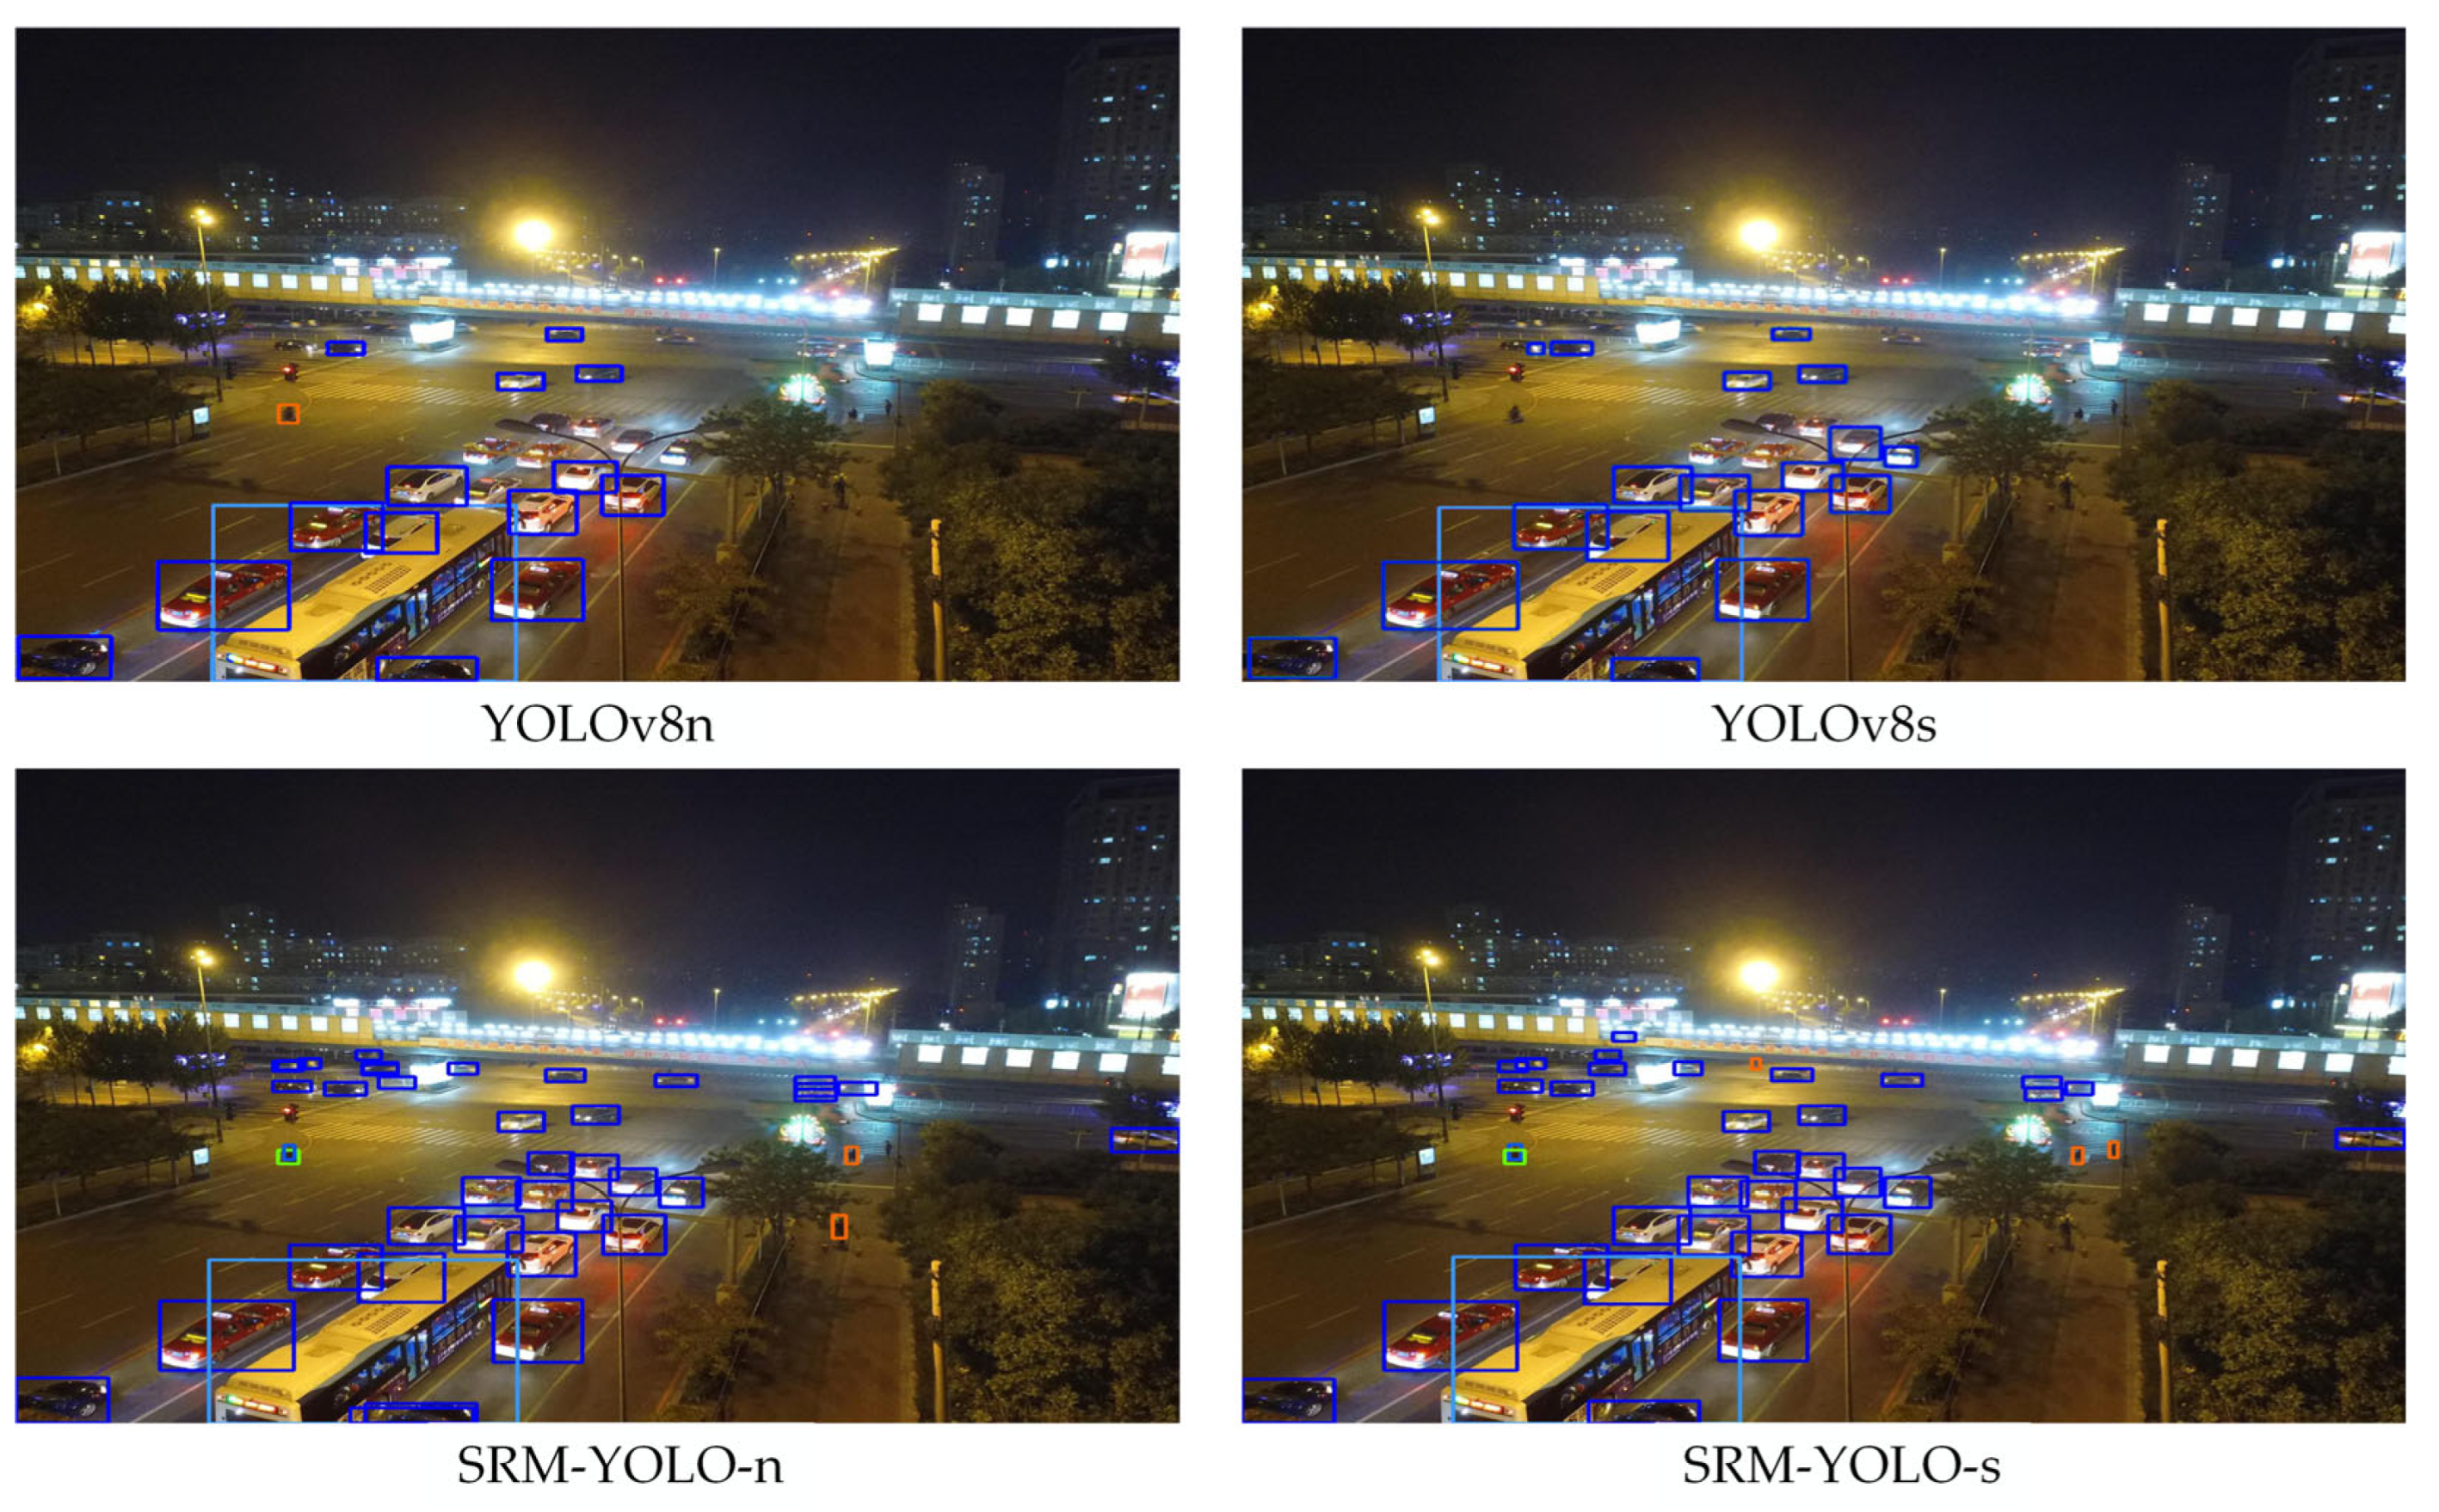
We further conducted a comparative analysis of SRM-YOLO and the baseline YOLOv8 models using diverse images from the VisDrone2019 dataset. These samples cover various lighting conditions, object densities, camera perspectives, and scene complexities. Due to the high density of detected objects, category labels and confidence scores are omitted in the visualizations for clarity. Instead, different colors are used to distinguish object categories.
Figure 8 presents an urban traffic scene captured by a UAV during daylight from a moderate altitude and an oblique perspective, illustrating the detection performance of the four models. While all models successfully identified most vehicles and pedestrians, notable differences were observed. YOLOv8n primarily detected larger objects but struggled with smaller and more distant ones, such as vehicles and pedestrians further from the camera. Additionally, it exhibited inconsistencies in recognizing occluded objects and those blending into the background.
Figure 9 depicts an oblique aerial image of a major roadway at nighttime, captured by a drone flying at a moderate altitude. The upper portion of the image is characterized by strong light interference around the bridge, with some vehicles partially obscured by the bridge structure. Due to drone movement during image acquisition, the image exhibits slight blurriness, presenting challenges for accurate object detection. Compared to YOLOv8, the proposed SRM-YOLO model exhibits improved capability in detecting occluded and relatively blurred vehicles, indicating better adaptability to motion blur and challenging lighting conditions.
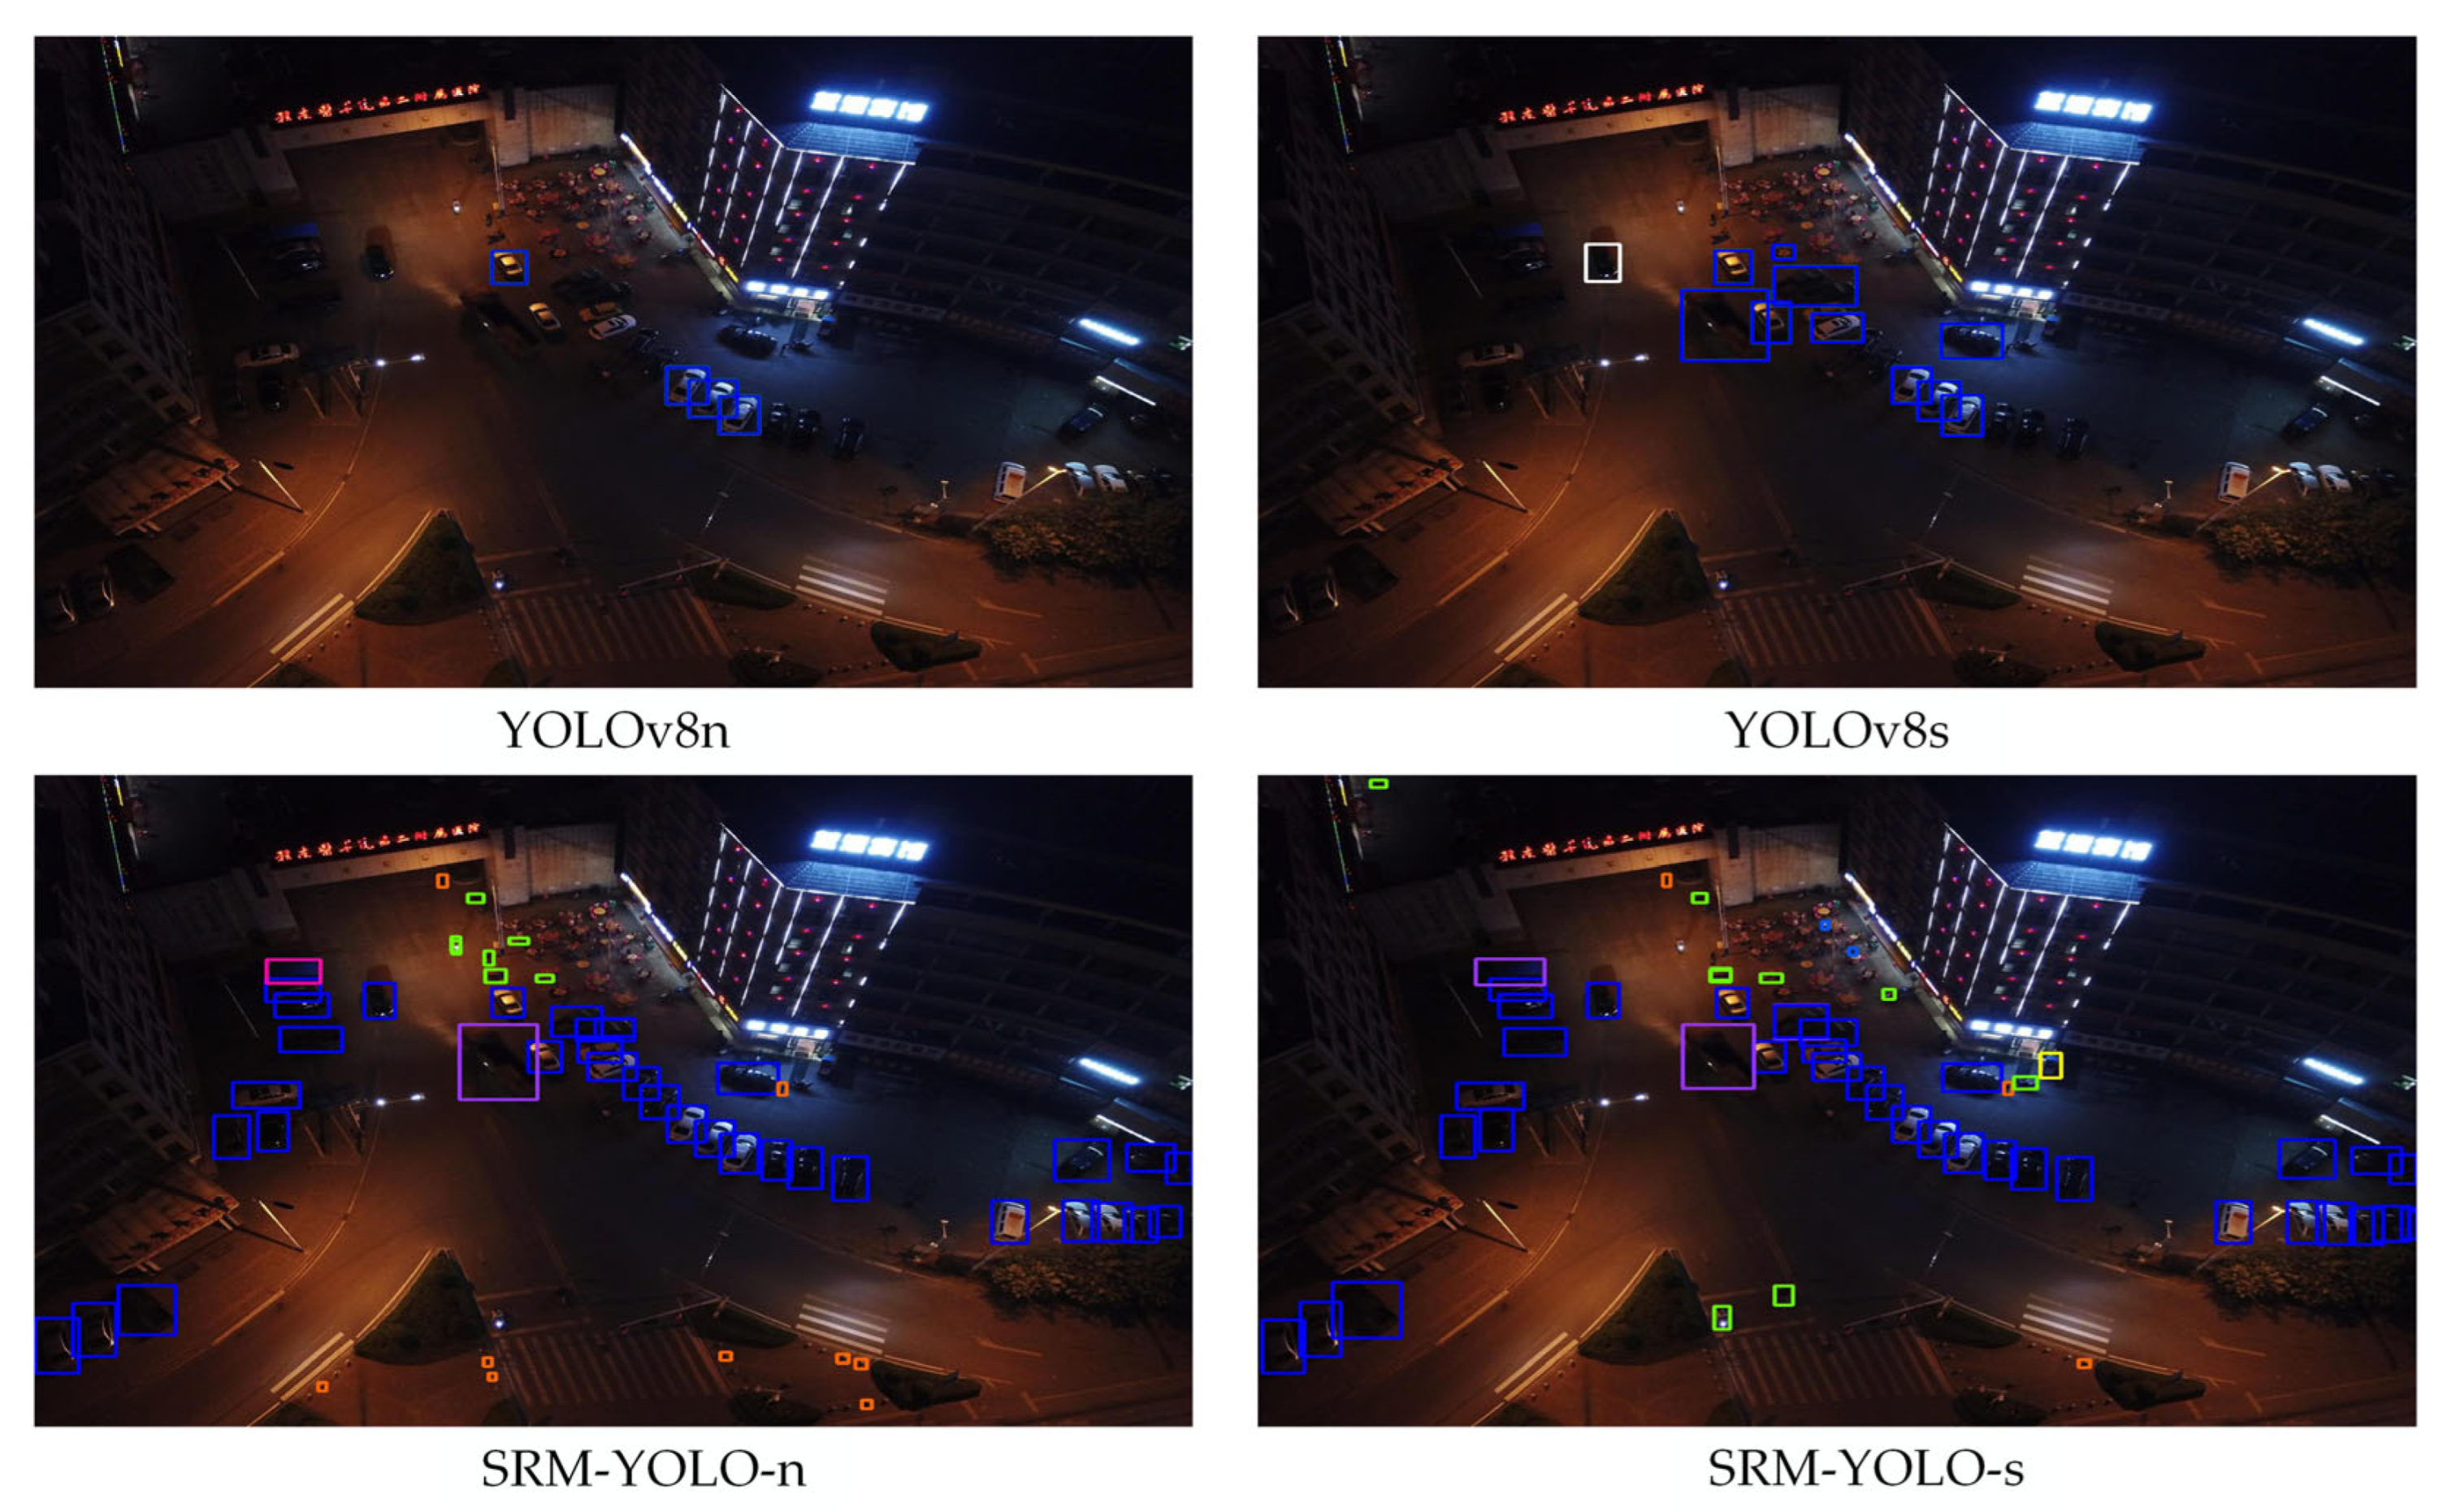
Figure 10 illustrates a surveillance scenario in which a UAV captures a top-down nighttime view of a residential community entrance. Due to insufficient illumination, large portions of the image exhibit extremely low brightness, significantly hindering object localization and classification. This poses substantial challenges for detection algorithms operating in low-light conditions. The experimental results indicate that YOLOv8n and YOLOv8s not only struggle to detect objects in severely underexposed areas but also suffer from false detections and missed detections. In contrast, the proposed SRM-YOLO model successfully detects some objects under these challenging conditions, demonstrating improved robustness and practical applicability for object detection in dark environments.
Overall, SRM-YOLO exhibits greater sensitivity and robustness, effectively detecting a higher number of objects, particularly small and distant vehicles and pedestrians. This improvement is evident in the increased number of bounding boxes in the images, underscoring the model’s enhanced performance in dense traffic environments. These results suggest that SRM-YOLO is better suited for accurately detecting small objects in complex scenes.
4.5. Comparisons with Other Object Detection
To comprehensively evaluate the performance of SRM-YOLO, we compared it against a broad spectrum of state-of-the-art object detection models. The benchmark set includes anchor-free detectors such as TOOD [
48], VFNet [
49], various YOLO-based architectures, and several enhanced variants, including SOD-YOLO [
50], LUD-YOLO [
51], and a customized version named Drone-YOLO. Additionally, transformer-based detectors—such as RT-DETR-R18 [
52] and D-FINE-S [
53]—were incorporated to ensure a thorough and balanced assessment.
Table 6 presents a comprehensive summary of the experimental results. Except for TOOD and VFNet, which were trained on the official VisDrone2021 dataset, all other models were implemented within the PyTorch framework and optimized using the Stochastic Gradient Descent (SGD) algorithm. The initial learning rate was set to 0.01 and gradually decayed to 12% of its original value. In this study, we primarily compared the mean Average Precision (mAP) on the validation set across different models and parameter configurations, focusing on their performance over 10 distinct categories in the dataset.
Table 6 presents the experimental results of the proposed SRM-YOLO-N and eight other benchmark algorithms. Compared with the one-stage object detection models TOOD and VFNet, SRM-YOLO demonstrates a notable improvement in detection accuracy. Despite having a significantly smaller number of parameters, SRM-YOLO achieves an overall mAP of 45.6%, which is substantially higher than TOOD and VFNet. In the Awning Tricycle category, which has the smallest number of instances, SRM-YOLO maintains a higher detection accuracy than these two models.
Against other YOLO-based detectors—including YOLOv8-s, YOLOv10-s, and YOLOX-s—SRM-YOLO-s consistently delivers improved accuracy across most categories. The performance gains are particularly evident in challenging classes such as Pedestrian, Bus, and Motor. Although SRM-YOLO-s entails a slightly larger parameter count, the accuracy improvement represents a favorable trade-off, confirming the model’s effectiveness in balancing detection performance and computational complexity.
Furthermore, SRM-YOLO-s surpasses several state-of-the-art detectors—D-FINE-s (42.3%), LUD-YOLO-s (41.7%), and RT-DETR-R18 (42.5%)—in overall detection accuracy. While Drone-YOLO-m achieves a marginally higher mAP of 46.9%, SRM-YOLO-s offers comparable accuracy with a considerably smaller model size. In key categories such as Truck and Motor, SRM-YOLO-s delivers competitive results, demonstrating strong adaptability in complex UAV scenarios.
In conclusion, SRM-YOLO enhances detection accuracy, especially for small, complex objects in UAV aerial imagery. Despite a higher computational cost, its superior performance makes it suitable for real-world applications requiring precision and robustness, and it remains feasible for UAV embedded system deployment.
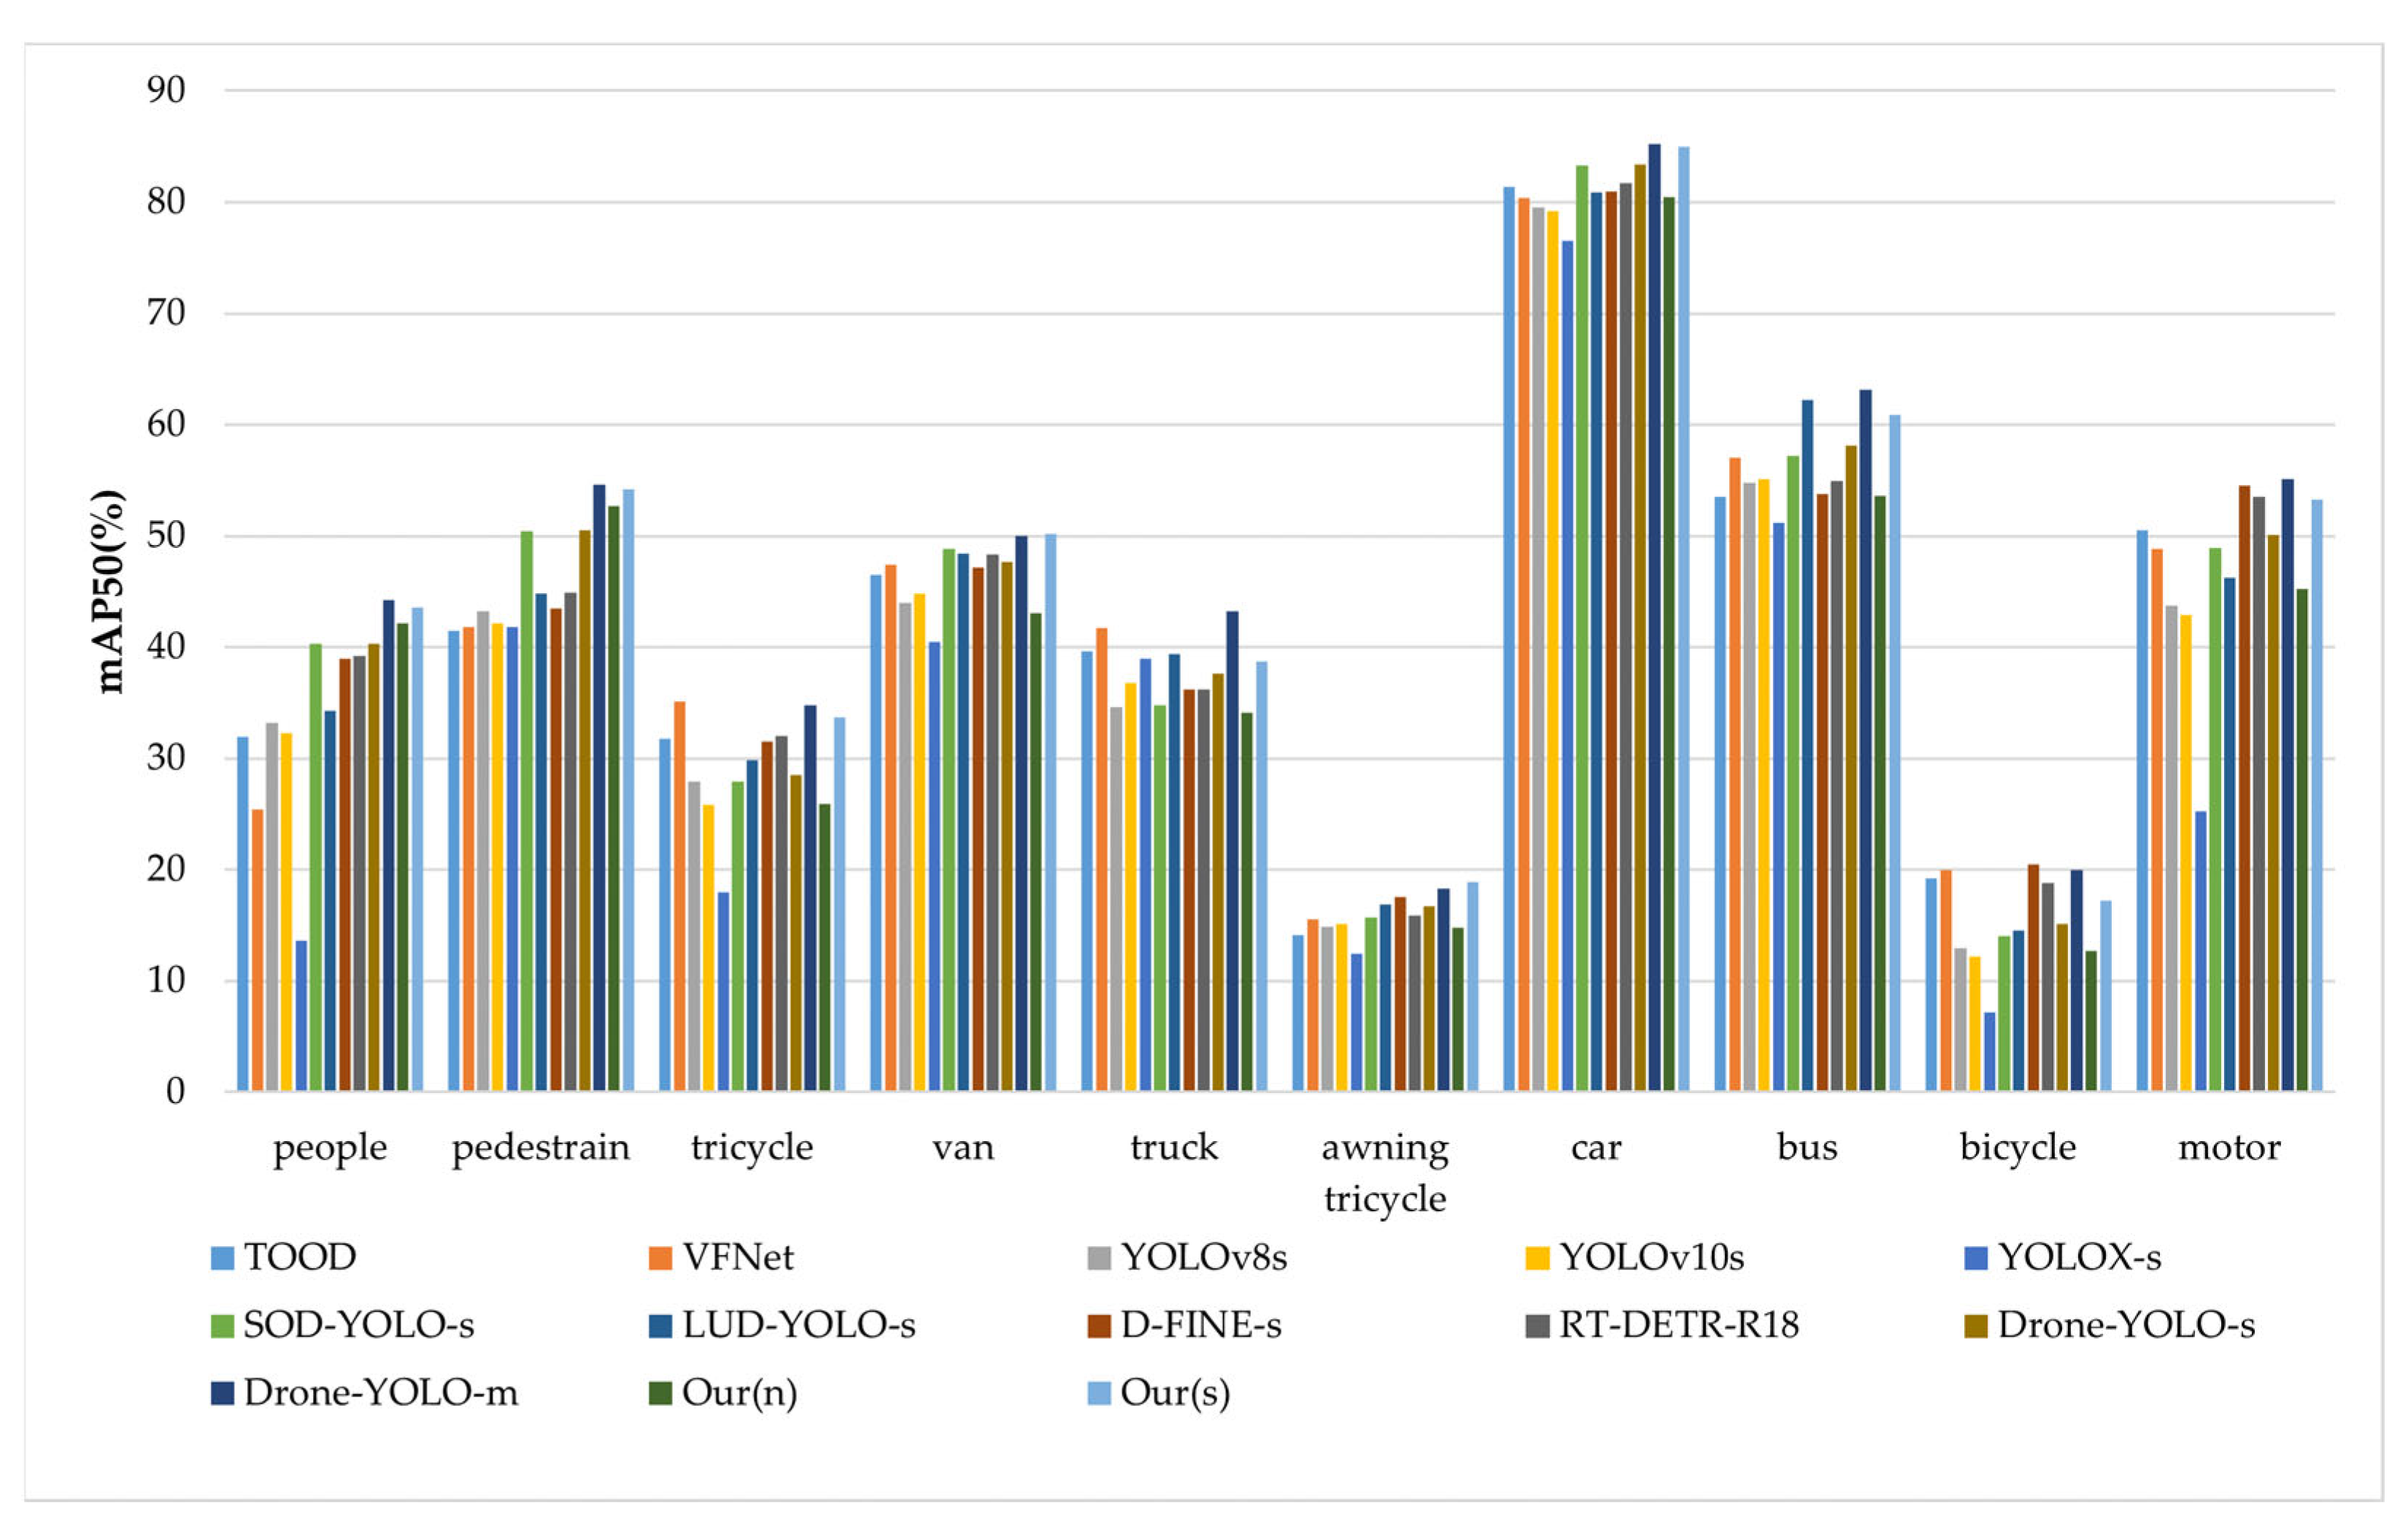
Overall, SRM-YOLO demonstrates high detection accuracy for both small and large objects in UAV imagery. Despite a moderate increase in computational cost, its accuracy and versatility make it well suited for practical UAV-based deployments where precision and efficiency are critical. As shown in
Figure 11, SRM-YOLO-s achieves superior detection performance for small objects such as Pedestrian and Tricycle, while also maintaining reliable accuracy on larger classes like Car and Bus.
4.6. Generalization Test
To further evaluate the effectiveness of our proposed method, we conducted comparative analyses with various YOLO-series object detection algorithms on the SSDD [
54] and NWPU VHR-10 [
55] datasets. For consistency and fairness, the same hyperparameters and training protocols used for the VisDrone2019 dataset were applied.
The SSDD dataset, designed for ship detection in satellite imagery, consists of 1160 high-resolution images containing 2456 annotated ship instances. The NWPU VHR-10 dataset includes 800 very-high-resolution remote sensing images (ranging from 500 × 500 to 1100 × 1100 pixels) sourced from Google Earth and Vaihingen, covering 3651 instances across ten object categories. The average object size in the NWPU VHR-10 dataset is approximately 6.4% of the image area.
Based on the results in
Table 7, the proposed SRM-YOLO algorithm outperforms Faster R-CNN, SSD, YOLOv5n, YOLOv8n, and YOLOv10 in terms of precision (
P), recall (
R), mAP50, and the number of parameters on both the SSDD and NWPU VHR-10 datasets. Notably, compared to YOLOv8n, the SRM-YOLO model achieves an improvement of 1.7% in mAP50 on the SSDD dataset and 1.4% on the NWPU VHR-10 dataset. These improvements suggest that the SRM-YOLO model demonstrates decent generalization capability.


