Article

Drought Amplifies the Suppressive Effect of Afforestation on Net Primary Productivity in Semi-Arid Ecosystems: A Case Study of the Yellow River Basin

1
School of Resource and Environmental Sciences, Wuhan University, Wuhan 430079, China
2
State Key Laboratory of Information Engineering in Surveying, Mapping and Remote Sensing, Wuhan University, Wuhan 430079, China
*
Author to whom correspondence should be addressed.
Remote Sens. 2025, 17(12), 2100; https://doi.org/10.3390/rs17122100
Submission received: 19 May 2025 / Revised: 12 June 2025 / Accepted: 15 June 2025 / Published: 19 June 2025

Abstract

:
As a critical ecologicalbarrier in the semi-arid to semi-humid transition zone of northern China, the interaction between afforestation and climatic stressors in the Yellow River Basin constitutes a pivotal scientific challenge for regional sustainable development. However, the synthesis effects of afforestation and climate on primary productivity require further investigation. Integrating multi-source remote sensing data (2000–2020), meteorological observations with the Standardized Precipitation Evapotranspiration Index (SPEI) and an improved CASA model, this study systematically investigates spatiotemporal patterns of vegetation net primary productivity (NPP) responses to extreme drought events while quantifying vegetation coverage’s regulatory effects on ecosystem drought sensitivity. Among drought events identified using a three-dimensional clustering algorithm, high-intensity droughts caused an average NPP loss of 23.2 gC·m−2 across the basin. Notably, artificial irrigation practices in the Hetao irrigation district significantly mitigated NPP reduction to −9.03 gC·m−2. Large-scale afforestation projects increased the NDVI at a rate of 3.45 × 10⁻⁴ month−1, with a contribution rate of 78%, but soil moisture competition from high-density vegetation reduced carbon-sink benefits. However, mixed forest structural optimization in the Three-North Shelterbelt Forest Program core area achieved local carbon-sink gains, demonstrating that vegetation configuration alleviates water competition pressure. Drought amplified the suppressive effect of afforestation through stomatal conductance-photosynthesis coupling mechanisms, causing additional NPP losses of 7.45–31.00 gC·m−2, yet the April–July 2008 event exhibited reversed suppression effects due to immature artificial communities during the 2000–2004 baseline period. Our work elucidates nonlinear vegetation-climate interactions affecting carbon sequestration in semi-arid ecosystems, providing critical insights for optimizing ecological restoration strategies and climate-adaptive management in the Yellow River Basin.

1. Introduction

Net Primary Productivity (NPP), a core indicator of ecosystem carbon cycling, plays a decisive role in regulating global energy allocation and carbon sink potential [1,2,3,4,5]. Existing studies suggest that NPP dynamics in terrestrial ecosystems are a key source of uncertainty in predicting coupled carbon–water balance [6]. Notably, in semi-arid zones, vegetation productivity exhibits significantly higher sensitivity to drought stress compared to humid zones. These fluctuations are not only dominated by climatic factors but also involve nonlinear interactions with human activities [7,8]. In China’s semi-arid zones, NPP shows significant positive correlations with annual precipitation, CO2 emissions, and GDP [9]. Studies on the Mongolian Plateau further confirm that climate warming and human activities jointly drive NPP growth, with human activities contributing more than 30%, highlighting the vulnerability and complexity of the ecosystems in semi-arid zones [10].
While drought’s inhibitory effect on NPP is well established, its mechanisms remain controversial. Studies in the Amazon forest demonstrate that short-term droughts reduce NPP through photosynthetic inhibition caused by decreased stomatal conductance [11]. The decrease in relative water content of the leaf will gradually reduce the stomatal conductivity and slow down the CO2 assimilation [12]. In contrast, research in China’s Qinling-Daba Mountains reveals that drought-induced NPP suppression varies significantly with drought duration, indicating temporal-scale dependency [13]. Analyses in the Yellow River Basin further demonstrated that drought and extreme temperature events significantly suppress NPP, which exhibits strong correlations with precipitation and temperature, while sensitivity to drought varies substantially across vegetation types [14,15]. However, the existing studies are mostly limited to unidimensional analysis of precipitation shortage and fail to systematically integrate the synergistic effects of multiple elements such as evapotranspiration anomalies and soil water storage deficit [16,17]. Moreover, NPP responses to drought are influenced not only by drought intensity but also depend on vegetation types and ecosystem structural configurations [18]. Drought has a significant negative effect on NPP of grassland, and different types of grassland are sensitive to drought [19]. Grassland ecosystems exhibit higher drought sensitivity owing to shallower root systems, whereas forests demonstrate greater resilience through deeper root penetration and canopy interception capacity [20]. However, current research predominantly focuses on single vegetation types or short-term observations, lacking comprehensive basin-scale comparisons across ecosystems. Moreover, systematic quantification of drought’s cumulative impacts and legacy effects remains critically understudied [21].
While afforestation remains a cornerstone strategy for strengthening terrestrial carbon sequestration globally, its ecological impacts in semi-arid regions remain contentious. Although the implementation of the Yellow River Basin’s “returning farmland to forest” project has markedly increased vegetation greenness, concurrent observations of progressive soil desiccation and native vegetation degradation in localized zones [22] demonstrate a critical trade-off between carbon sink enhancement and hydrological resource sustainability [23]. Although the global greening trend enhances the carbon sequestration potential of vegetation [24], high-density plantation forests may induce ecosystem degradation through resource competition [25]. Existing studies have failed to effectively quantify the regulatory role of drought in the coupled climate–human–ecology system, which limits the optimization of ecological restoration strategies in semi-arid areas.
Conventional drought identification methodologies predominantly rely on threshold-based approaches or run theory [26]. However, these techniques exhibit limited capacity to characterize the multidimensional spatiotemporal evolution patterns of drought episodes [27]. The 3D clustering algorithm enhances drought event identification accuracy through integrated analysis of temporal, spatial, and intensity attributes [28], establishing a novel framework for investigating drought–NPP interactions. Current drought research predominantly focuses on single temporal scales or static analytical frameworks [29]. There is a lack of a comprehensive dynamic identification mechanism that can fully capture the physical cumulative of drought events. Critical knowledge gaps persist in understanding the spatiotemporal propagation dynamics of drought events, including trajectory patterns and cumulative impacts, as well as their interaction mechanisms with vegetation responses.
The Yellow River Basin, a core region for plantation forests in China’s semi-arid zone, has accumulated about 1.7 million hectares of afforestation since the 1980s. However, concurrent with this large-scale afforestation, the frequency of extreme drought events has significantly increased [30,31], highlighting a critical tension between ecological restoration and climatic challenges. By integrating the three-dimensional clustering algorithm and the improved CASA model, this study aims to (1) quantify the spatial and temporal evolution characteristics of drought events; (2) analyze the response patterns of NPP to drought-afforestation under different scenarios; and (3) reveal the regulatory mechanism of the synergistic effect of climate and human activities on the carbon sink function of ecosystems. The research results can provide theoretical support for the ecological protection and high-quality development of the Yellow River Basin, as well as a scientific basis for the paradigm shift of sustainable ecological management in semi-arid regions around the world.

2. Data and Methodology
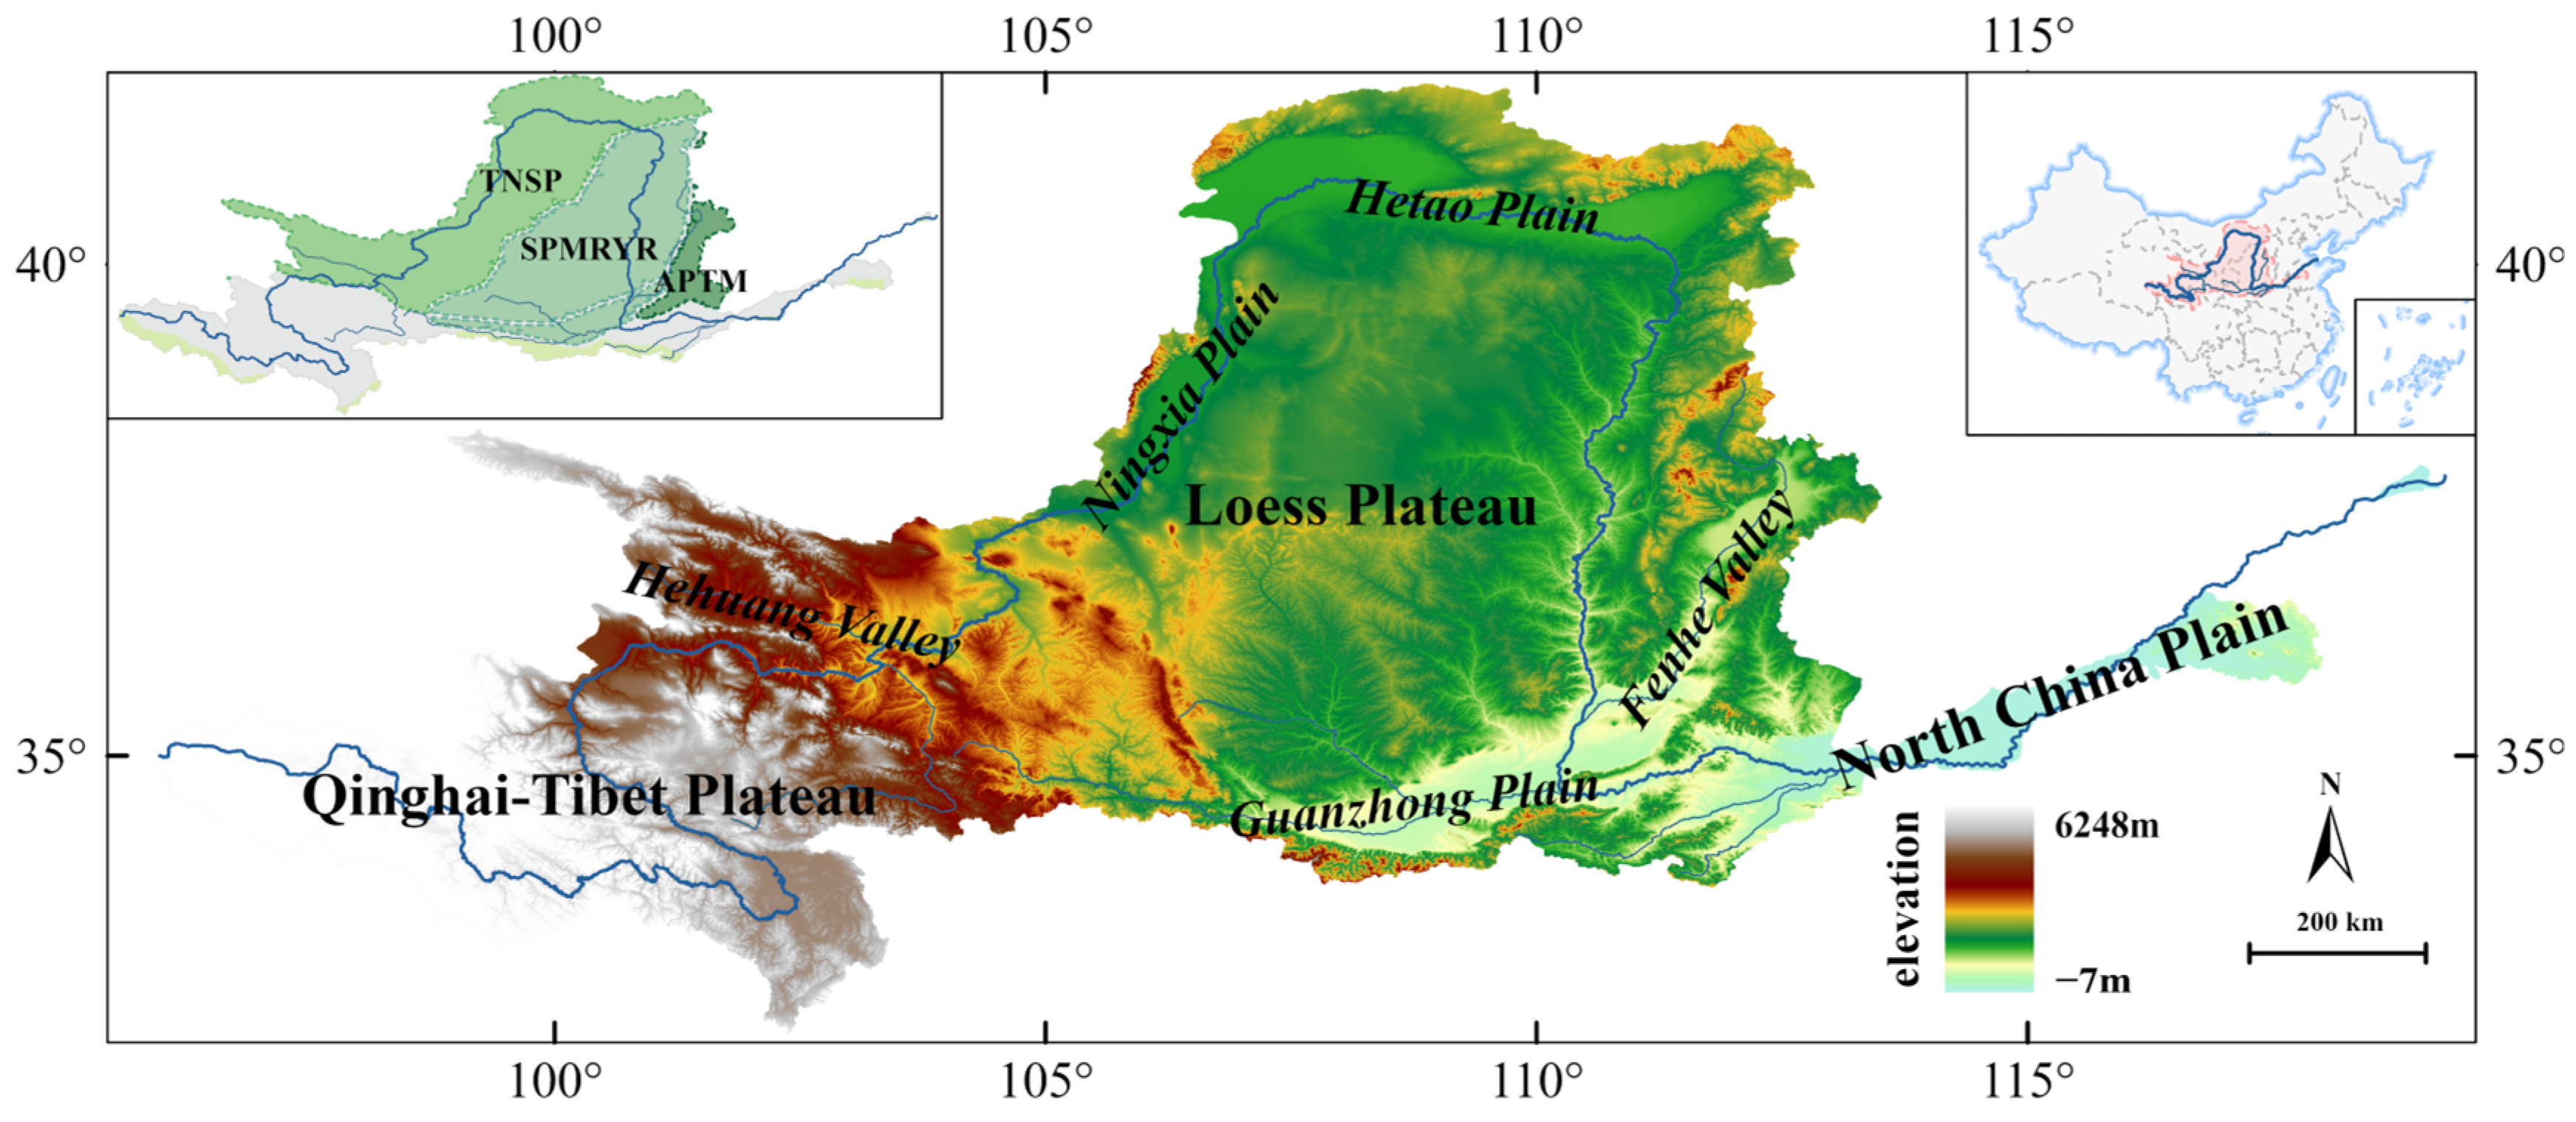
2.1. Study Area

The Yellow River Basin (32–42°N, 96–119°E) spans the Tibetan Plateau to the North China Plain, with a total area of 79.5 × 10⁴ km2 (Figure 1). The topography descends stepwise across four principal geomorphological units—the Tibetan Plateau, Inner Mongolian Plateau, Loess Plateau, and North China Plain—along a west–east axis, governing the transition of hydrothermal gradients from northwestern arid zones to southeastern semi-humid regions [15]. Seventy-five percent of the basin’s vegetation consists of cropland (southeastern plains), grasslands (arid and northeastern semi-arid zones), and meadows (Qinghai-Tibetan Plateau). The Loess Plateau, a critical ecologically fragile region in the Yellow River Basin, has been the primary implementation zone for ecological restoration projects since the 1980s [32]. Large-scale initiatives, including the Three-North Shelterbelt Forest Program (TNSP), Taihang Mountain Afforestation Project (TMAP), and Middle Yellow River Shelterbelt Project (MYRSP), have cumulatively achieved 1.7 million hectares of afforestation and 3.47 million hectares of grassland rehabilitation. Numerous studies have confirmed its lasting and far-reaching influence on the vegetation cover of the land surface, which has become one of the anthropogenic factors that cannot be ignored in the study of vegetation dynamics of land surface ecosystems in the Yellow River Basin [33,34].

2.2. Dataset

The data sources and processing flow of this study are as follows. Meteorological data including temperature and precipitation were obtained from a nationwide monthly 1 km resolution spatiotemporal dataset (2000–2020) developed by Peng et al. [35]. This dataset integrates nationwide meteorological station observations through the thin-plate spline interpolation method, with topographic correction applied to enhance spatial accuracy. The vegetation data include a 250 m resolution NDVI dataset (2000–2020) based on the MODIS MOD13Q1 product, processed through cloud removal and spatiotemporal filtering with an R2 exceeding 0.85, as well as 868 basic vegetation units mapped in the Chinese 1:4 million vegetation atlas. The solar radiation data were sourced from the homogenized Chinese land surface climate observation grid dataset (2000–2020) (https://data.tpdc.ac.cn/, accessed on 12 June 2025). This dataset integrated MODIS 0.1-degree resolution cloud cover, aerosol retrieval, and ground-based sunshine duration observation data using the Geographically Weighted Regression (GWR) method, ensuring the spatiotemporal consistency of surface solar radiation. All the raster data were obtained from the National Tibetan Plateau Science Data Center (https://data.tpdc.ac.cn/, accessed on 12 June 2025) and the Gansu Ecological and Environmental Science Data Center (http://eco.gssdc.cn, accessed on 12 June 2025). Dataset resampling to 250 m spatial resolution was performed using bilinear interpolation, followed by geospatial extraction of the Yellow River Basin boundaries to ensure multi-source data compatibility. This preprocessing workflow guaranteed pixel-level spatial consistency across heterogeneous datasets.
Model validation was performed using the GLASS vegetation net primary productivity product (GLASS NPP, 500 m/8 days), which was generated based on 10 dynamic vegetation models simulating plant autotrophic respiration to GPP ratios from the TRENDY model comparison program [36,37,38]. The data are available through the GLASS product release website of the University of Hong Kong (https://www.glass.hku.hk/, accessed on 12 June 2025).

2.3. Research Methodology

2.3.1. Drought Event Recognition and Multidimensional Feature Extraction

An integrated drought identification framework was developed by combining the Standardized Precipitation Evapotranspiration Index (SPEI) [39] with a three-dimensional spatiotemporal clustering algorithm, enabling systematic detection and quantification of drought events [40].
The drought identification process began by detecting drought seed points, defined as grid cells with SPEI values < −1. Spatially connected drought patches were then constructed using the Moore neighborhood 8-direction search algorithm implemented in two stages. First, within each monthly timestep, contiguous grid cells meeting SPEI < −1 were clustered into spatial drought patches through 8-directional connectivity. Then, across consecutive months, drought patches were linked into unified events when exhibiting spatial overlap exceeding the predefined area threshold. During which a double filtering mechanism was applied to enhance spatial clustering accuracy. Finally, drought events were identified by applying spatiotemporal continuity constraints to link clusters across consecutive time steps. Small isolated drought patches covering less than 1.6% of the study area were excluded [41] following noise suppression principles [27,42]. To ensure physical coherence in spatiotemporal evolution, drought events were retained only when exhibiting overlap areas exceeding 6400 km2 for two consecutive months, which was an empirical parameter from 3D clustering methods. Studies have demonstrated this threshold’s effectiveness in identifying spatiotemporal continuity of drought events; thus, this study adopts the established empirical value, as determined by the overlap area threshold method [28,42,43].
The construction of the characterization index system contains four core parameters: drought duration (DD), drought severity (DS, km2∙month), drought-affected area (DA) [40], and drought migration path length (DL) [28,44]. DD characterizes drought event duration. DS quantifies drought intensity and spatial cumulative effect. DA reflects maximum spatial coverage. DL portrays drought dynamic propagation characteristics through center-of-mass migration trajectory. Building upon these four indicators established in prior studies, this study introduced a weighting scheme to integrate them and proposed the comprehensive drought index (DI) for a more holistic characterization of drought intensity. To ensure objectivity and avoid subjective bias in weight assignment, the weights of each index were determined (DD: 0.22, DA: 0.17, DS: 0.24, DL: 0.28) using the entropy weighting method. This approach leverages information entropy—a measure of system disorder that quantifies useful information in data. Indicators exhibiting significant value variations yield low entropy, indicating high information content and thus warranting greater weights. Conversely, minimal variations correspond to high entropy and lower weights. The weight coefficients were derived automatically based on the information entropy of raw data [45]. This process involved solely the integration and weighting of existing indicators without defining new variables. The comprehensive drought index (DI) was constructed to realize the multidimensional feature coupling:
D I = 0.22 D D + 0.17 D A + 0.24 D S + 0.28 D L
While inherent drought characteristics lead to some linear correlation among DD, DS, DA, and other indicators, these variables capture distinct physical aspects and thus provide complementary information within the comprehensive model. Crucially, the entropy weighting method, being information-based, is unaffected by multicollinearity issues common in linear models. It effectively reduced the influence of inter-correlated variables and enhanced the discriminative power of DI. The composite index addresses single-indicator limitations through an optimized weighting fusion mechanism, enabling comprehensive characterization of drought events’ spatiotemporal characteristics. During calculation, Z-score standardization was systematically applied to both normalize measurement scales and ensure dimensional contribution comparability across all input parameters.

2.3.2. NDVI Dynamic Attribution and Driving Mechanisms Analysis

A multi-scale analytical framework was employed to investigate vegetation dynamics drivers. Spatiotemporal NDVI trends were rigorously assessed through the integrated application of Sen’s slope estimator for magnitude quantification and the Mann–Kendall test for statistical significance evaluation [46,47]. Additionally, the NDVI time series is decomposed into trend ( T t ), seasonal ( S t ), and residual ( R t ) components using the Seasonal-Trend decomposition procedure based on Loess (STL)—a robust method for intuitive exploration of time-series data. This technique, successfully applied in visual analytics for temporal pattern identification, event detection, and trend forecasting, effectively separate the vegetation dynamic characteristics at different temporal scales [48,49].
A dynamic attribution model for vegetation cover was developed, grounded in the residual trend analysis framework [50]. Within the East Asian monsoon-influenced Yellow River Basin, precipitation (P) and temperature (T) exhibit high temporal correlation, potentially destabilizing multiple linear regression models. We therefore employed robust PCA regression, which maintains accuracy while enhancing computational efficiency for large-scale per-pixel spatial modeling. Validation on sample pixels confirmed the first principal component typically captures >90% of original climatic variance. Thus, PCA was applied to precipitation (P) and temperature (T) to extract PC1 as the integrated climatic state [32,51].
P C 1 = λ · P + μ · T
We then established a Linear Regression Model for NDVI Climate Response to calculate the climate-driven predicted value ( N D V I p r e ):
N D V I p r e = a · P C 1 + b
Then, we calculated the residuals between the observed NDVI ( N D V I o b s ) and the N D V I p r e .
N D V I r e s = N D V I o b s N D V I p r e
The residual trend ( N D V I r e s ) was attributed to the impact of human activities primarily driven by afforestation projects. Six types of driving scenarios were established based on the combination of trend directions (Table 1). The relative contributions of climate change and human activities were quantified using the slope ratio method, where S N D V I o b s , S N D V I p r e and S N D V I r e s denoted the Sen’s slope values for the observed vegetation trend, climate-driven trend, and residual trend (human-influenced component), respectively [32,51].

2.3.3. Vegetation NPP Simulation and Scenario Experiments

The improved CASA (Carnegie–Ames–Stanford Approach) model, as refined by Zhu et al. [52,53] through regional-specific parameter adaptations, was used to calculate the Net Primary Productivity (NPP) values to analyze the influence mechanism of drought stress and afforestation projects on the NPP. The model parameters adopted in this study are based on Zhu et al.’s refinements, which underwent rigorous validation against flux tower observations in their original work, confirming strong applicability and accuracy across China. The model substantially enhanced NPP simulation accuracy through implementation of vegetation-type-specific response functions coupled with a dynamic regional evapotranspiration correction algorithm [52]. The model core equation is expressed as:
N P P ( x , t ) = A P A R ( x , t ) × ε ( x , t )
where A P A R ( x , t ) is the Photosynthetically Active Radiation (PAR) absorbed by image x in month t (gC·m−2·month−1), and ε ( x , t ) denotes the actual light energy utilization of image x in month t (gC·m−1) [53].
By designing four sets of control experiments (Table 2), the independent and interactive effects of drought and afforestation projects on NPP were systematically quantified. The baseline scenario S1 used actual observed precipitation (P), temperature (T), NDVI, and PAR. The S2 scenario replaced climatic parameters with climatic averages from 2000 to 2020 to eliminate extreme drought fluctuations. The S3 scenario fixed NDVI as the 2000–2005 base period mean to simulate the vegetation response to the termination. This base period was selected because it represents a relatively stable climatic phase in the Yellow River Basin prior to large-scale ecological projects, thus providing a near-natural reference baseline for assessing subsequent vegetation changes. The S4 scenario superimposed ideal climate conditions on S3. The comparison of S1 and S3 can assess the influence of afforestation projects on NPP under drought stress. The comparison of S2 and S4 can reveal the effect of afforestation projects under ideal climatic conditions. The cross-comparison analysis was used to analyze the modulation strength of drought on the coupling relationship between NDVI and NPP.

3. Results

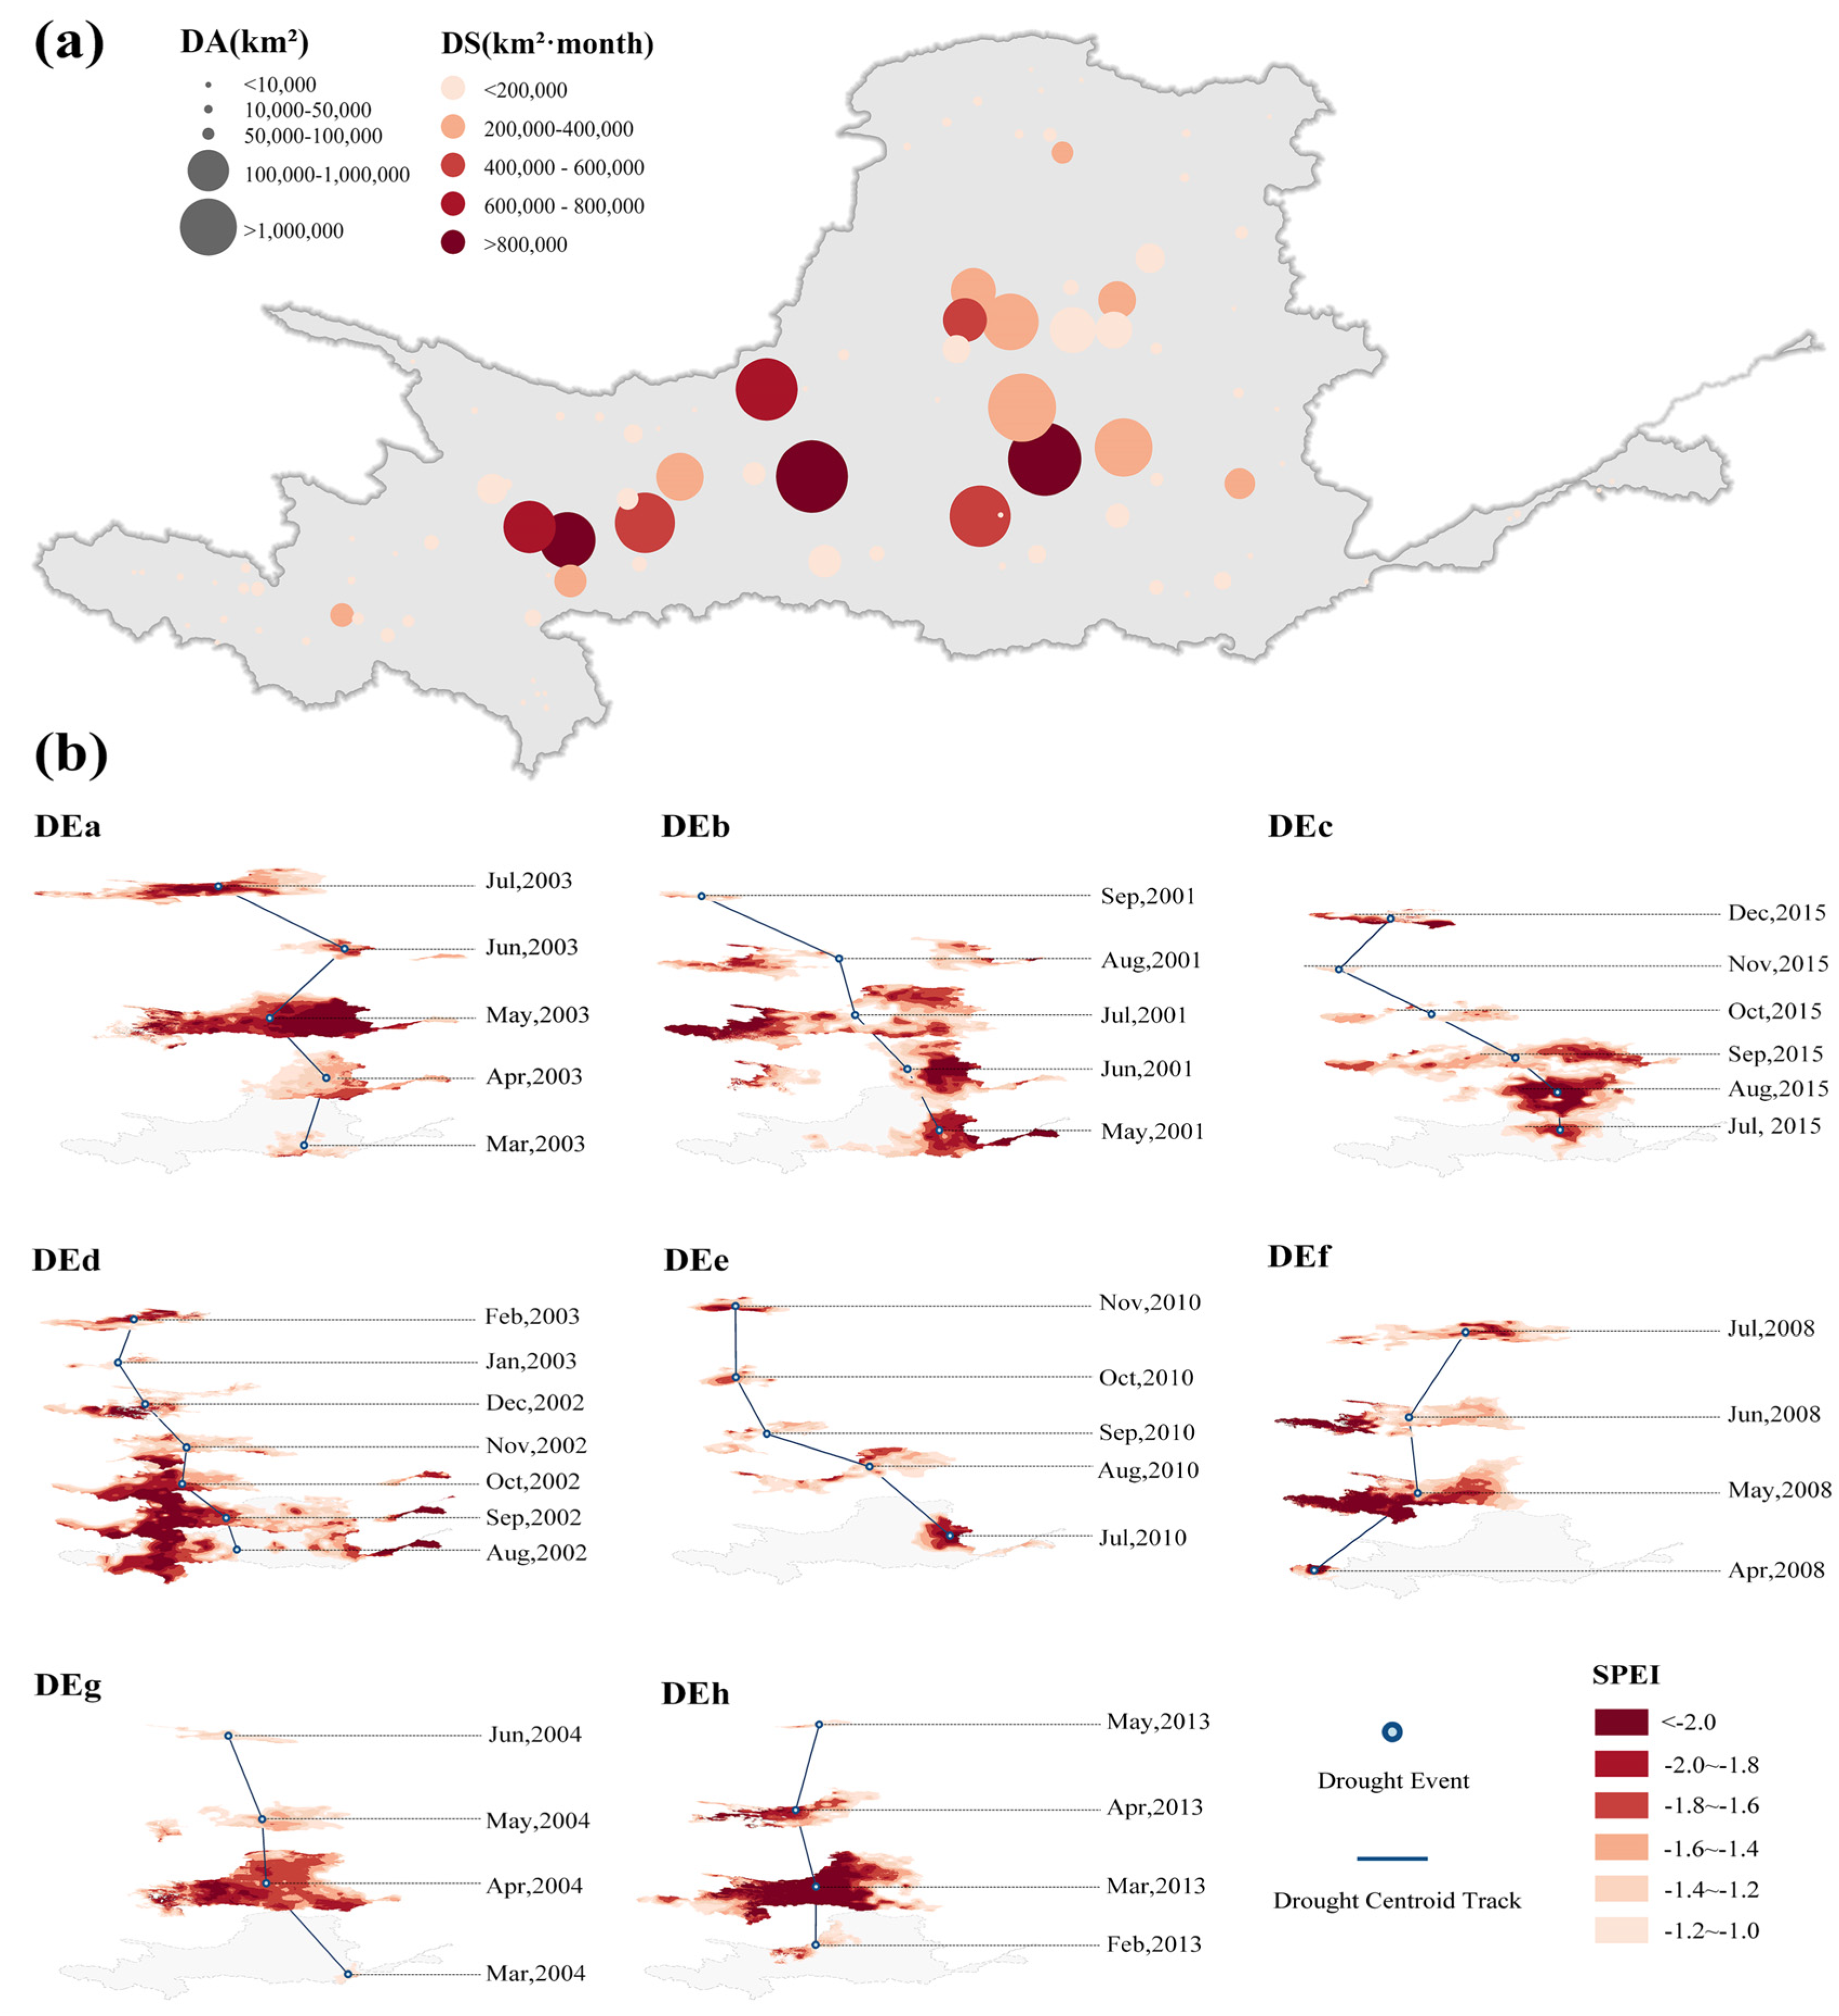
3.1. Spatial and Temporal Characteristics of Extreme Drought Events

Based on the 3D clustering algorithm, 101 drought events were identified in the Yellow River Basin from 2000 to 2020, in which there were 42 composite drought events with durations longer than 2 months. The eight typical events were identified with the DI of more than 0.55 (Table 3). The drought duration exhibited a distinct bimodal distribution, with 28% of events persisting for 3–5 months and only seven events lasting beyond 5 months. The most prolonged event occurred from August 2002 to February 2003, maintaining drought conditions continuously for seven months. Spatially, DA of 8.9% of the events were more than 5 × 10⁵ km2, with the March–July 2000 event covering the largest area of 7.11 × 10⁵ km2. The high DS events exceeding 8 × 10⁵ km2·h were predominantly concentrated in the central Loess Plateau (107–112°E, 34–37°N), where the sparse surface cover and strong evapotranspiration synergistically amplified the cumulative drought effect. The March–July 2000 drought events demonstrated peak values in both integrated intensity and drought severity, reaching 0.919 and 946.3 × 10³ km2·h, respectively. This severity magnitude exceeded the mean event severity of 108.2 × 10³ km2·h by a factor of 8.7.
Drought event centroids predominantly cluster within the midstream topographic transition zone (107–112°E, 34–38°N) (Figure 2a), displaying two distinct migration patterns. Local retention events, typified by the 2013 case, maintained stable centers near the Gansu-Ningxia border with <400 km displacement. Conversely, inter-regional propagation events like the 2000 case showed substantial centroid movement from southwestern Shanxi to Lanzhou’s periphery in Gansu Province, traversing 1442.48 km (Figure 2b).

3.2. The Suppression of Drought on NPP

The NPP analysis calculated by the modified CASA model showed that NPP response to drought in the Yellow River basin indicated significant non-linear characteristics (Figure 3). High-intensity drought events (DI > 0.7) caused an average NPP reduction of 23.2 gC·m−2, representing 68% of total drought-induced productivity loss. The extreme case DEd (DI = 0.794) showed the most severe NPP deficit (ΔNPP = −47.89 gC·m−2), with its drought severity (DS = 928.31 km2·h) strongly correlating with productivity loss (r = 0.91, p < 0.01). Low-intensity drought events (0.5 < DI < 0.6), including cases DEe and DEh, induced substantial NPP reductions despite their moderate intensity. Event DEe exhibited the most severe NPP deficit (−54.21 gC·m−2), with this exceptional productivity loss primarily driven by the high ecological vulnerability characterizing its drought-affected regions (104.31°E, 36.07°N). This area is located in the semi-arid zone, covering the ecologically sensitive zone of the northeast edge of Qinghai-Tibet Plateau and the northern Loess Plateau, with low vegetation coverage and weak soil water holding capacity. The suppressive effect of water deficit on the photosynthetic carbon fixation process is significantly amplified.
Spatial analysis revealed significant spatial heterogeneity in the intensity of NPP inhibition by drought. The ΔNPP of the ecological fragile areas of the southern edge (event DEd) and the northern margin (event DEe) of the Yellow River basin reached −47.89 and −54.21 gC·m−2, respectively. However, the Hetao Irrigation District showed limited NPP loss (9.03 gC·m−2) during event DEb, reflecting effective artificial irrigation mitigation. Similarly, despite severe drought conditions on the northeastern Tibetan Plateau during event DEf, observed ΔNPP (−5.36 gC·m−2) remained substantially below projected losses, potentially due to deep-rooting adaptations in alpine meadows. These cases demonstrate that ecosystem drought responses depend not only on climatic intensity but also on regional vegetation traits and human management practices.
Drought-induced NPP suppression exhibited distinct temporal phasing, with the most pronounced productivity losses occurring during the initial 1–2 months of drought events. For instance, event DEe demonstrated a first-month ΔNPP of −41.79 gC·m−2, representing 76.9% of its cumulative NPP deficit. As drought persisted, vegetation exhibited adaptive physiological responses including stomatal regulation and carbon reallocation, ultimately leading to positive ΔNPP during the recovery phase of event DEe. This characteristic “rapid decline-gradual recovery” pattern demonstrates the Yellow River Basin vegetation’s conditional drought resilience, though constrained by the underlying ecosystem’s carrying capacity. The observed variations in recovery rates across ecological zones primarily reflect synergistic effects of vegetation functional traits, edaphic properties, and water acquisition strategies.

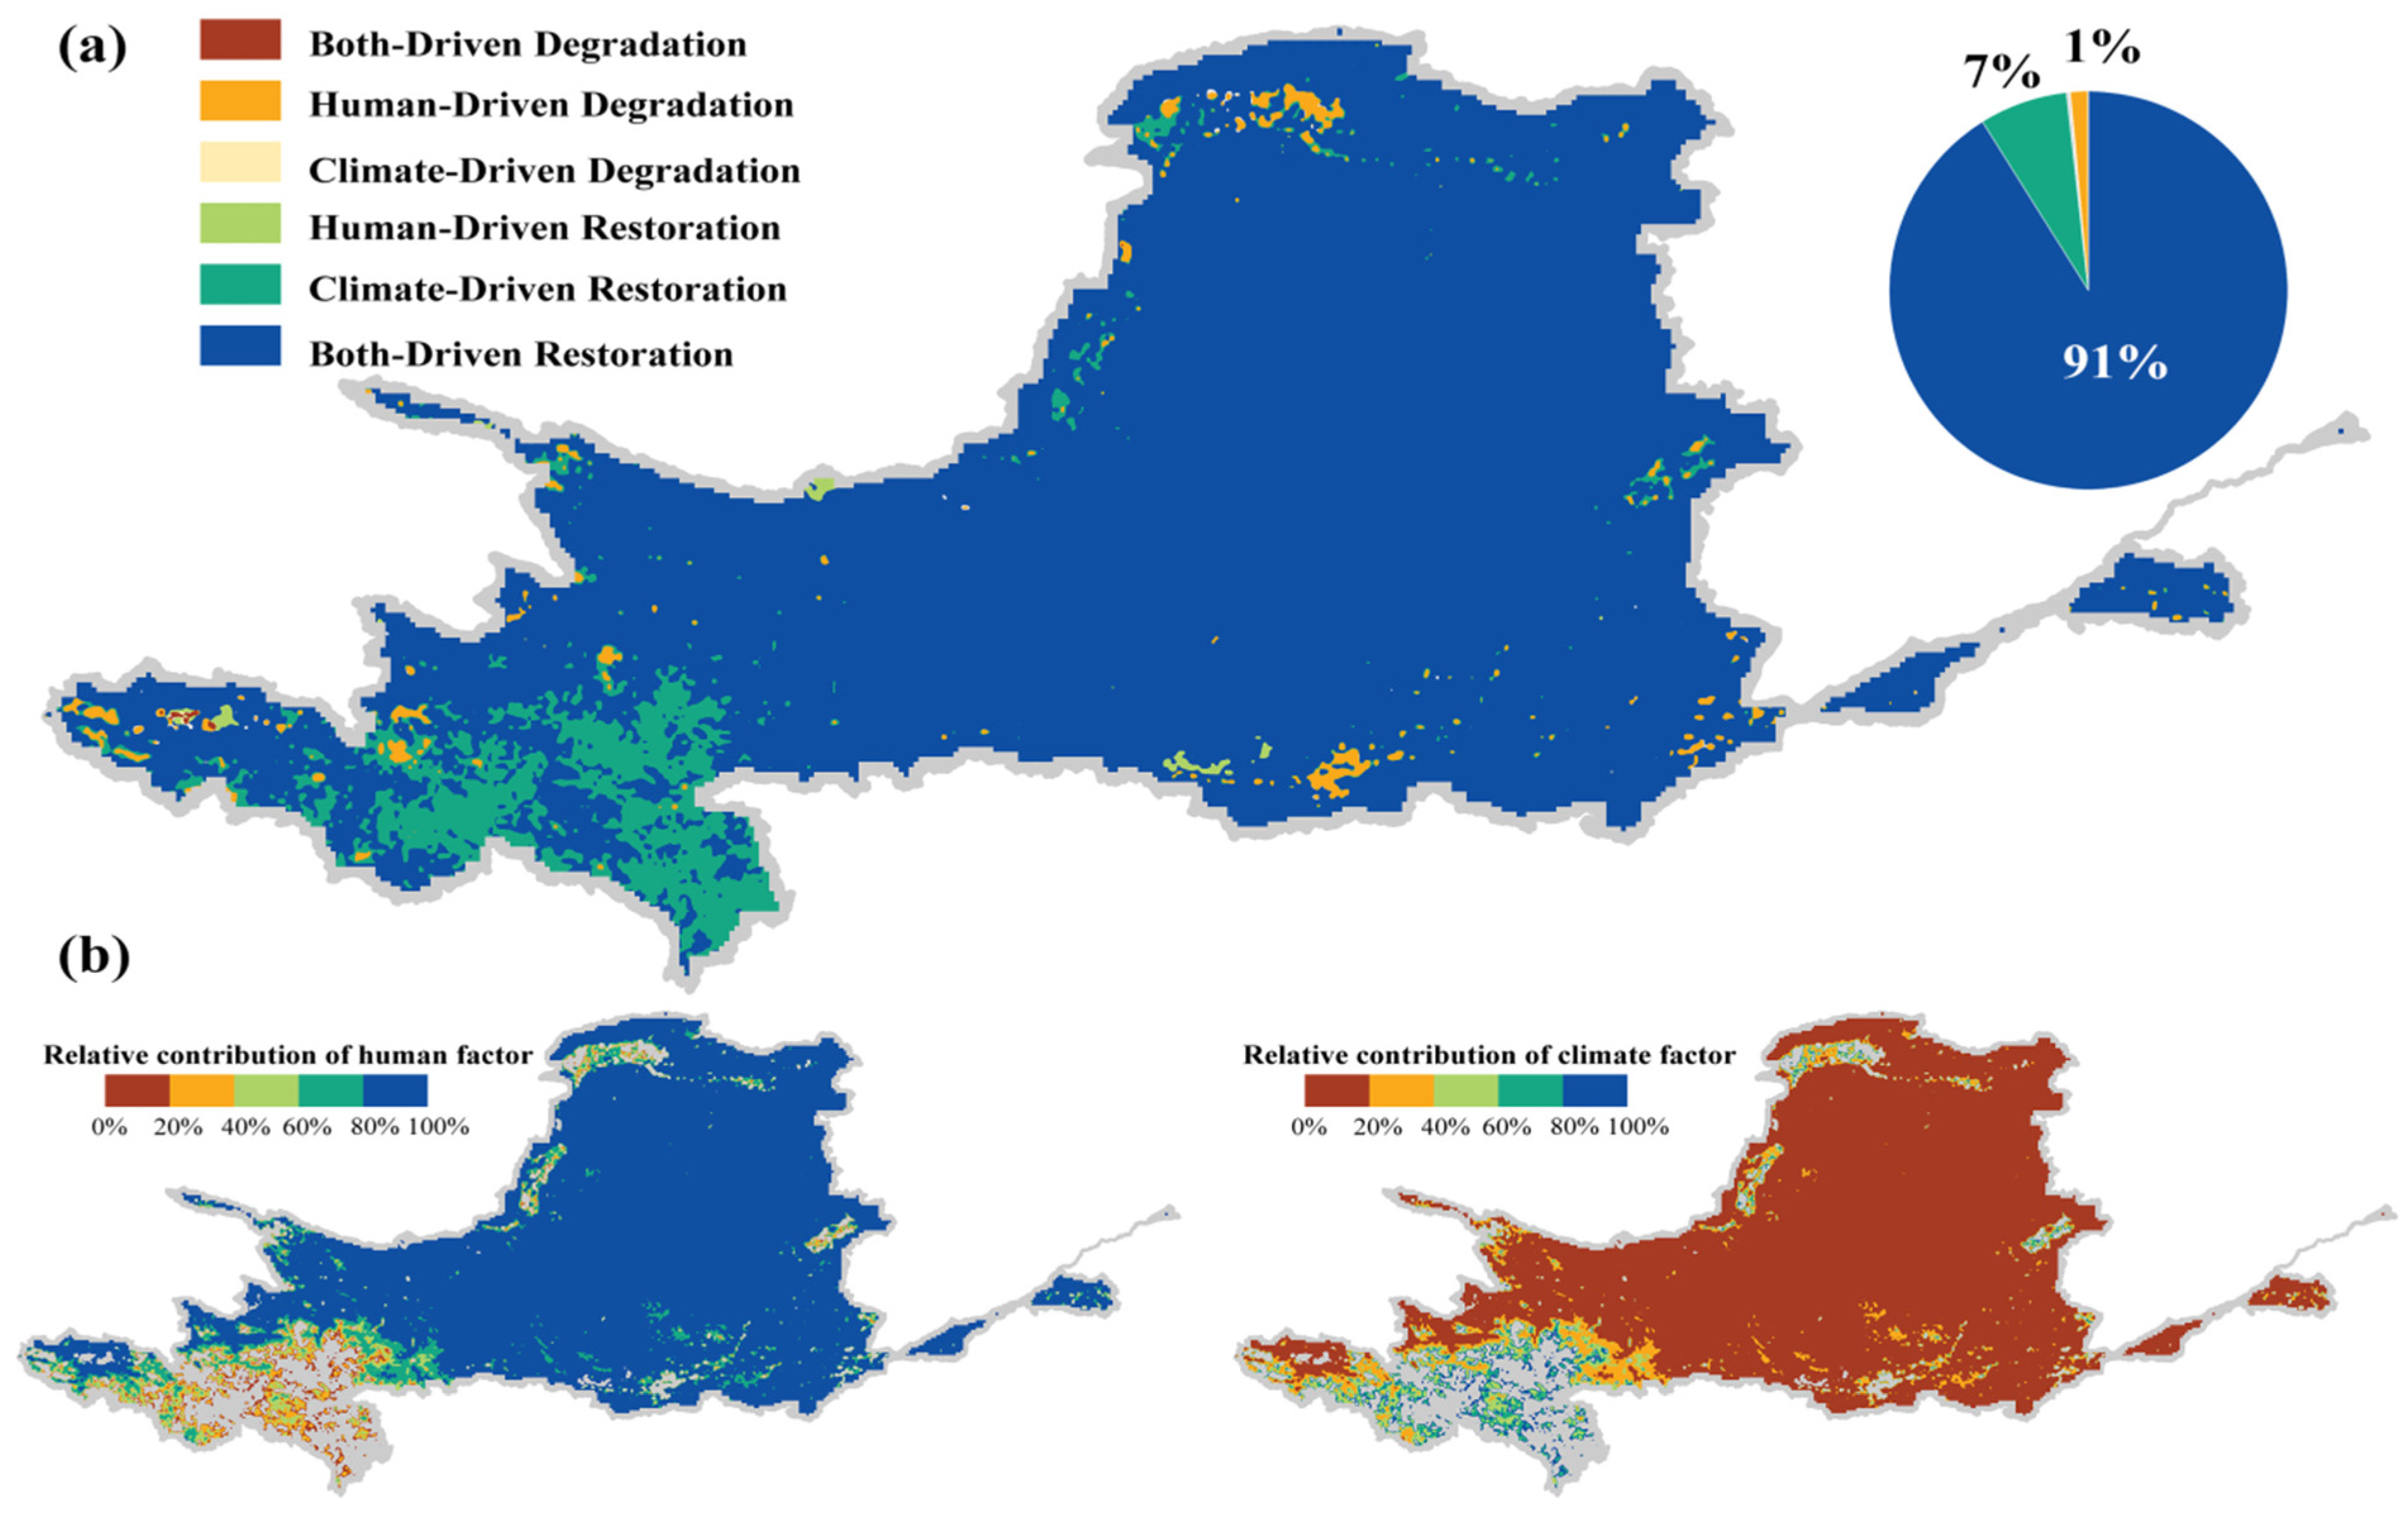
3.3. The Suppressive Effect of Afforestation Projects on NPP

3.3.1. The Leading Role of Afforestation Projects in NDVI Growth

STL decomposition revealed a significant NDVI increase in the Yellow River Basin from 2000 to 2020 (Sen’s slope = 3.45 × 10⁻⁴, p < 0.01), with a five-year moving average 24% higher than the 2000–2004 baseline. The trend analysis revealed that human activities ( N D V I r e s ) dominated vegetation variability ( N D V I o b s ), contributing 78% of the observed change (slope = 2.87 × 10⁻⁴), while climate factors ( N D V I p r e ) accounted for only 22% (slope = 0.79 × 10⁻⁴). This confirms that vegetation greening in the basin was primarily driven by afforestation efforts, with climate warming and humidification playing a secondary role (Figure 4). Spatially, the increase in NDVI showed significant heterogeneity. The Loess Plateau hinterland formed a core area of vegetation restoration (Sen’s Slope > 6.0 × 10⁻⁴, p < 0.05), which highly overlapped with the implementation area of the Middle Reaches of the Yellow River Shelter Forest Project (SPMRYR), showing a significant spatial coupling effect. The N D V I r e s amplitude in the TNSP and APTM areas was 0.0–6.0 × 10⁻⁴ (p < 0.05), while local degradation occurred in human activity-intensive areas such as the Guanzhong Plain, Hetao Plain, and the ecologically vulnerable areas at the northeastern edge of the Tibetan Plateau (Sen’s Slope was a negative value) (Figure 5).
Climate–human synergies dominate vegetation dynamics across 91% of the Yellow River Basin, with anthropogenic factors contributing >80% of observed ecological changes. These high-impact zones show striking spatial concordance with the Middle Yellow River Shelterbelt Project (SPMRYR) implementation areas (Figure 6). In contrast, only 7% of the upstream Tibetan Plateau exhibited NDVI increases primarily driven by climatic warming and humidification, yet its contribution (<20%) remained significantly lower than that attributable to human activities. In contrast, roughly 1% of localized areas—notably the Guanzhong Plain and Hetao Irrigation District—displayed decreasing NDVI trends attributable to urban sprawl and intensified agricultural practices. This vegetation suppression highlights the ecological consequences of focused human disturbance.

3.3.2. Decoupling of NDVI-NPP

Although afforestation projects significantly enhance NDVI, they exert a suppressive effect on NPP (Figure 7). Under drought stress scenarios (S1–S3), afforestation-induced ΔNPP2 exhibited consistent negative values across four representative drought events. The most pronounced declines occurred in the TNSP region, spanning the Hetao Plain, Ningxia Plain, western Loess Plateau margin, and Hehuang Valley, where ΔNPP2 reached significantly negative levels. During DEe, afforestation-induced ΔNPP2 consistently remained below −80 gC·m−2. This severe carbon loss resulted from intensified water competition in high-density plantations, which simultaneously reduced both soil moisture content and light use efficiency. These coupled constraints ultimately elevated autotrophic respiration, driving significant NPP reduction. However, in the Loess Plateau, the SPMRYR project core zone, the mixed forest structure resulted in ΔNPP2 > 0, forming a local carbon-sink gain. Ideal climate scenarios (S2–S4) further confirm the decoupled climate independence. The TNSP project area maintained negative ΔNPP3 values, whereas the SPMRYR area sustained positive ΔNPP3 with greater variability than ΔNPP2, demonstrating how vegetation configuration modulates ecosystem functionality (Figure 8).
During most drought events, the absolute value of ΔNPP2 exhibited a certain degree of attenuation characteristics. During the DEe, the first month’s ΔNPP2 reached −40.21 gC·m−2, while it attenuated to 1.40 gC·m−2 at the end. This nonlinear attenuation process suggested that there may be some physiological regulatory mechanisms within the ecosystem to mitigate the negative effects of resource competition.

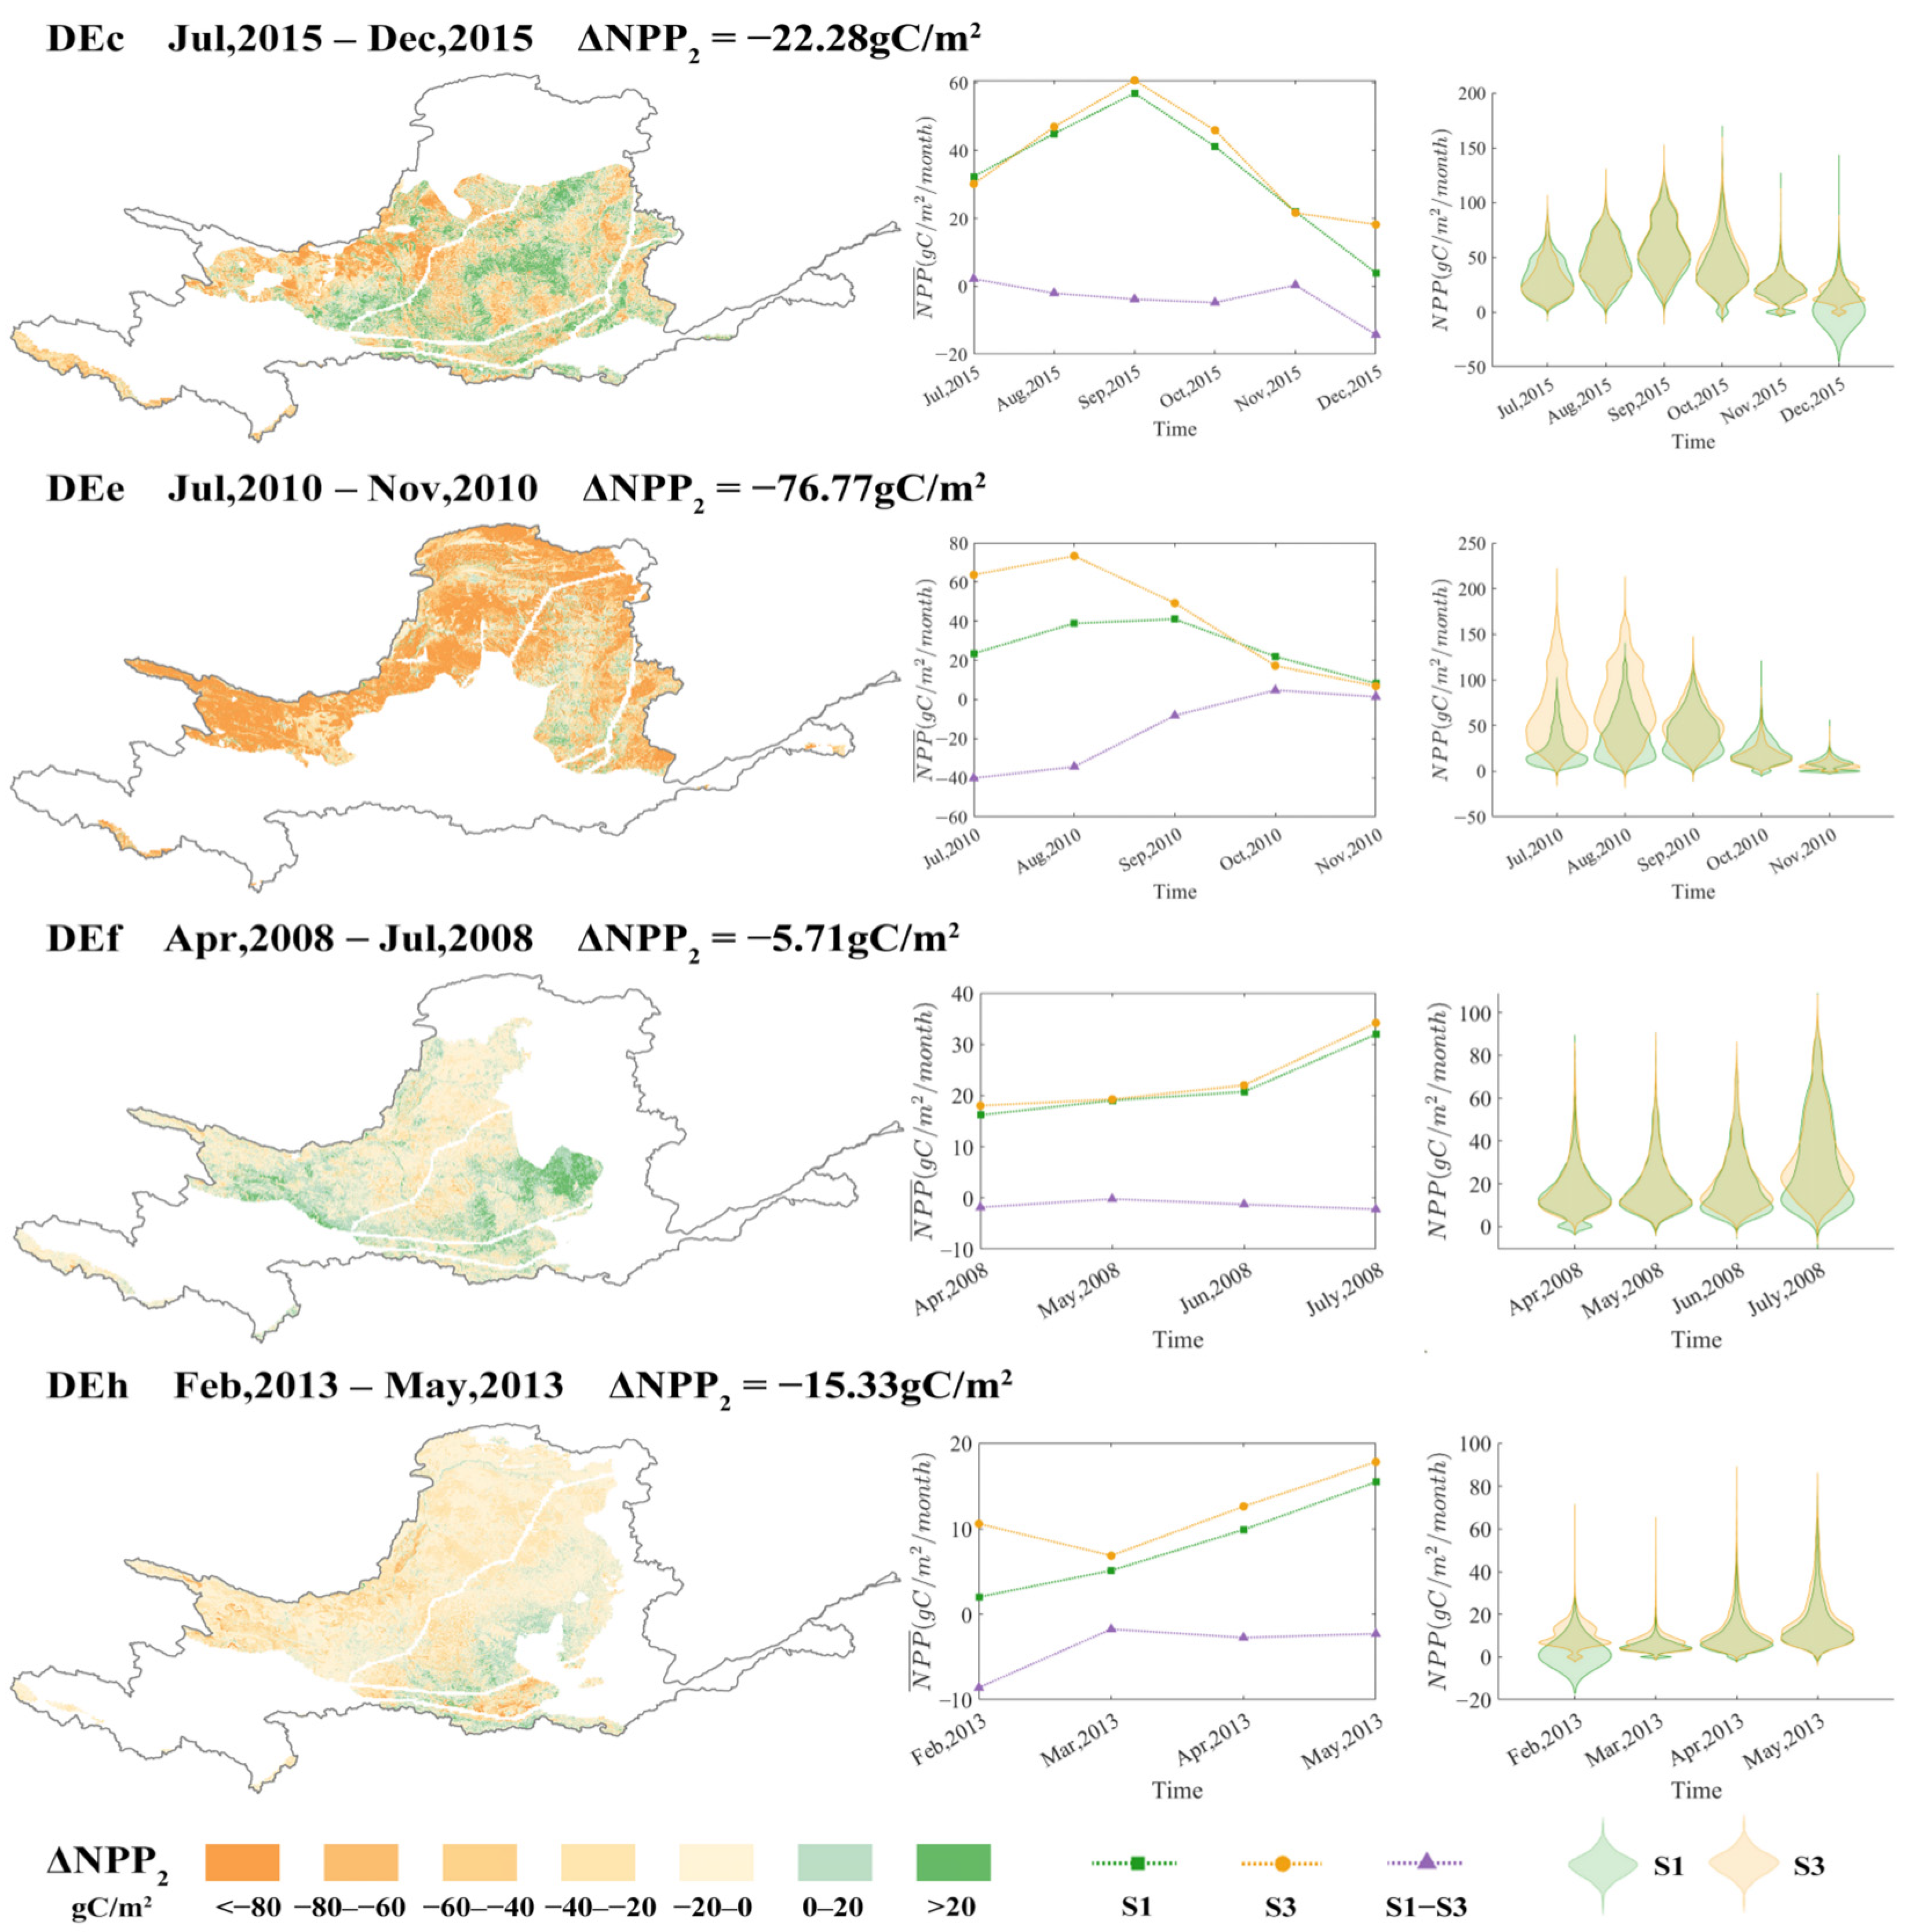
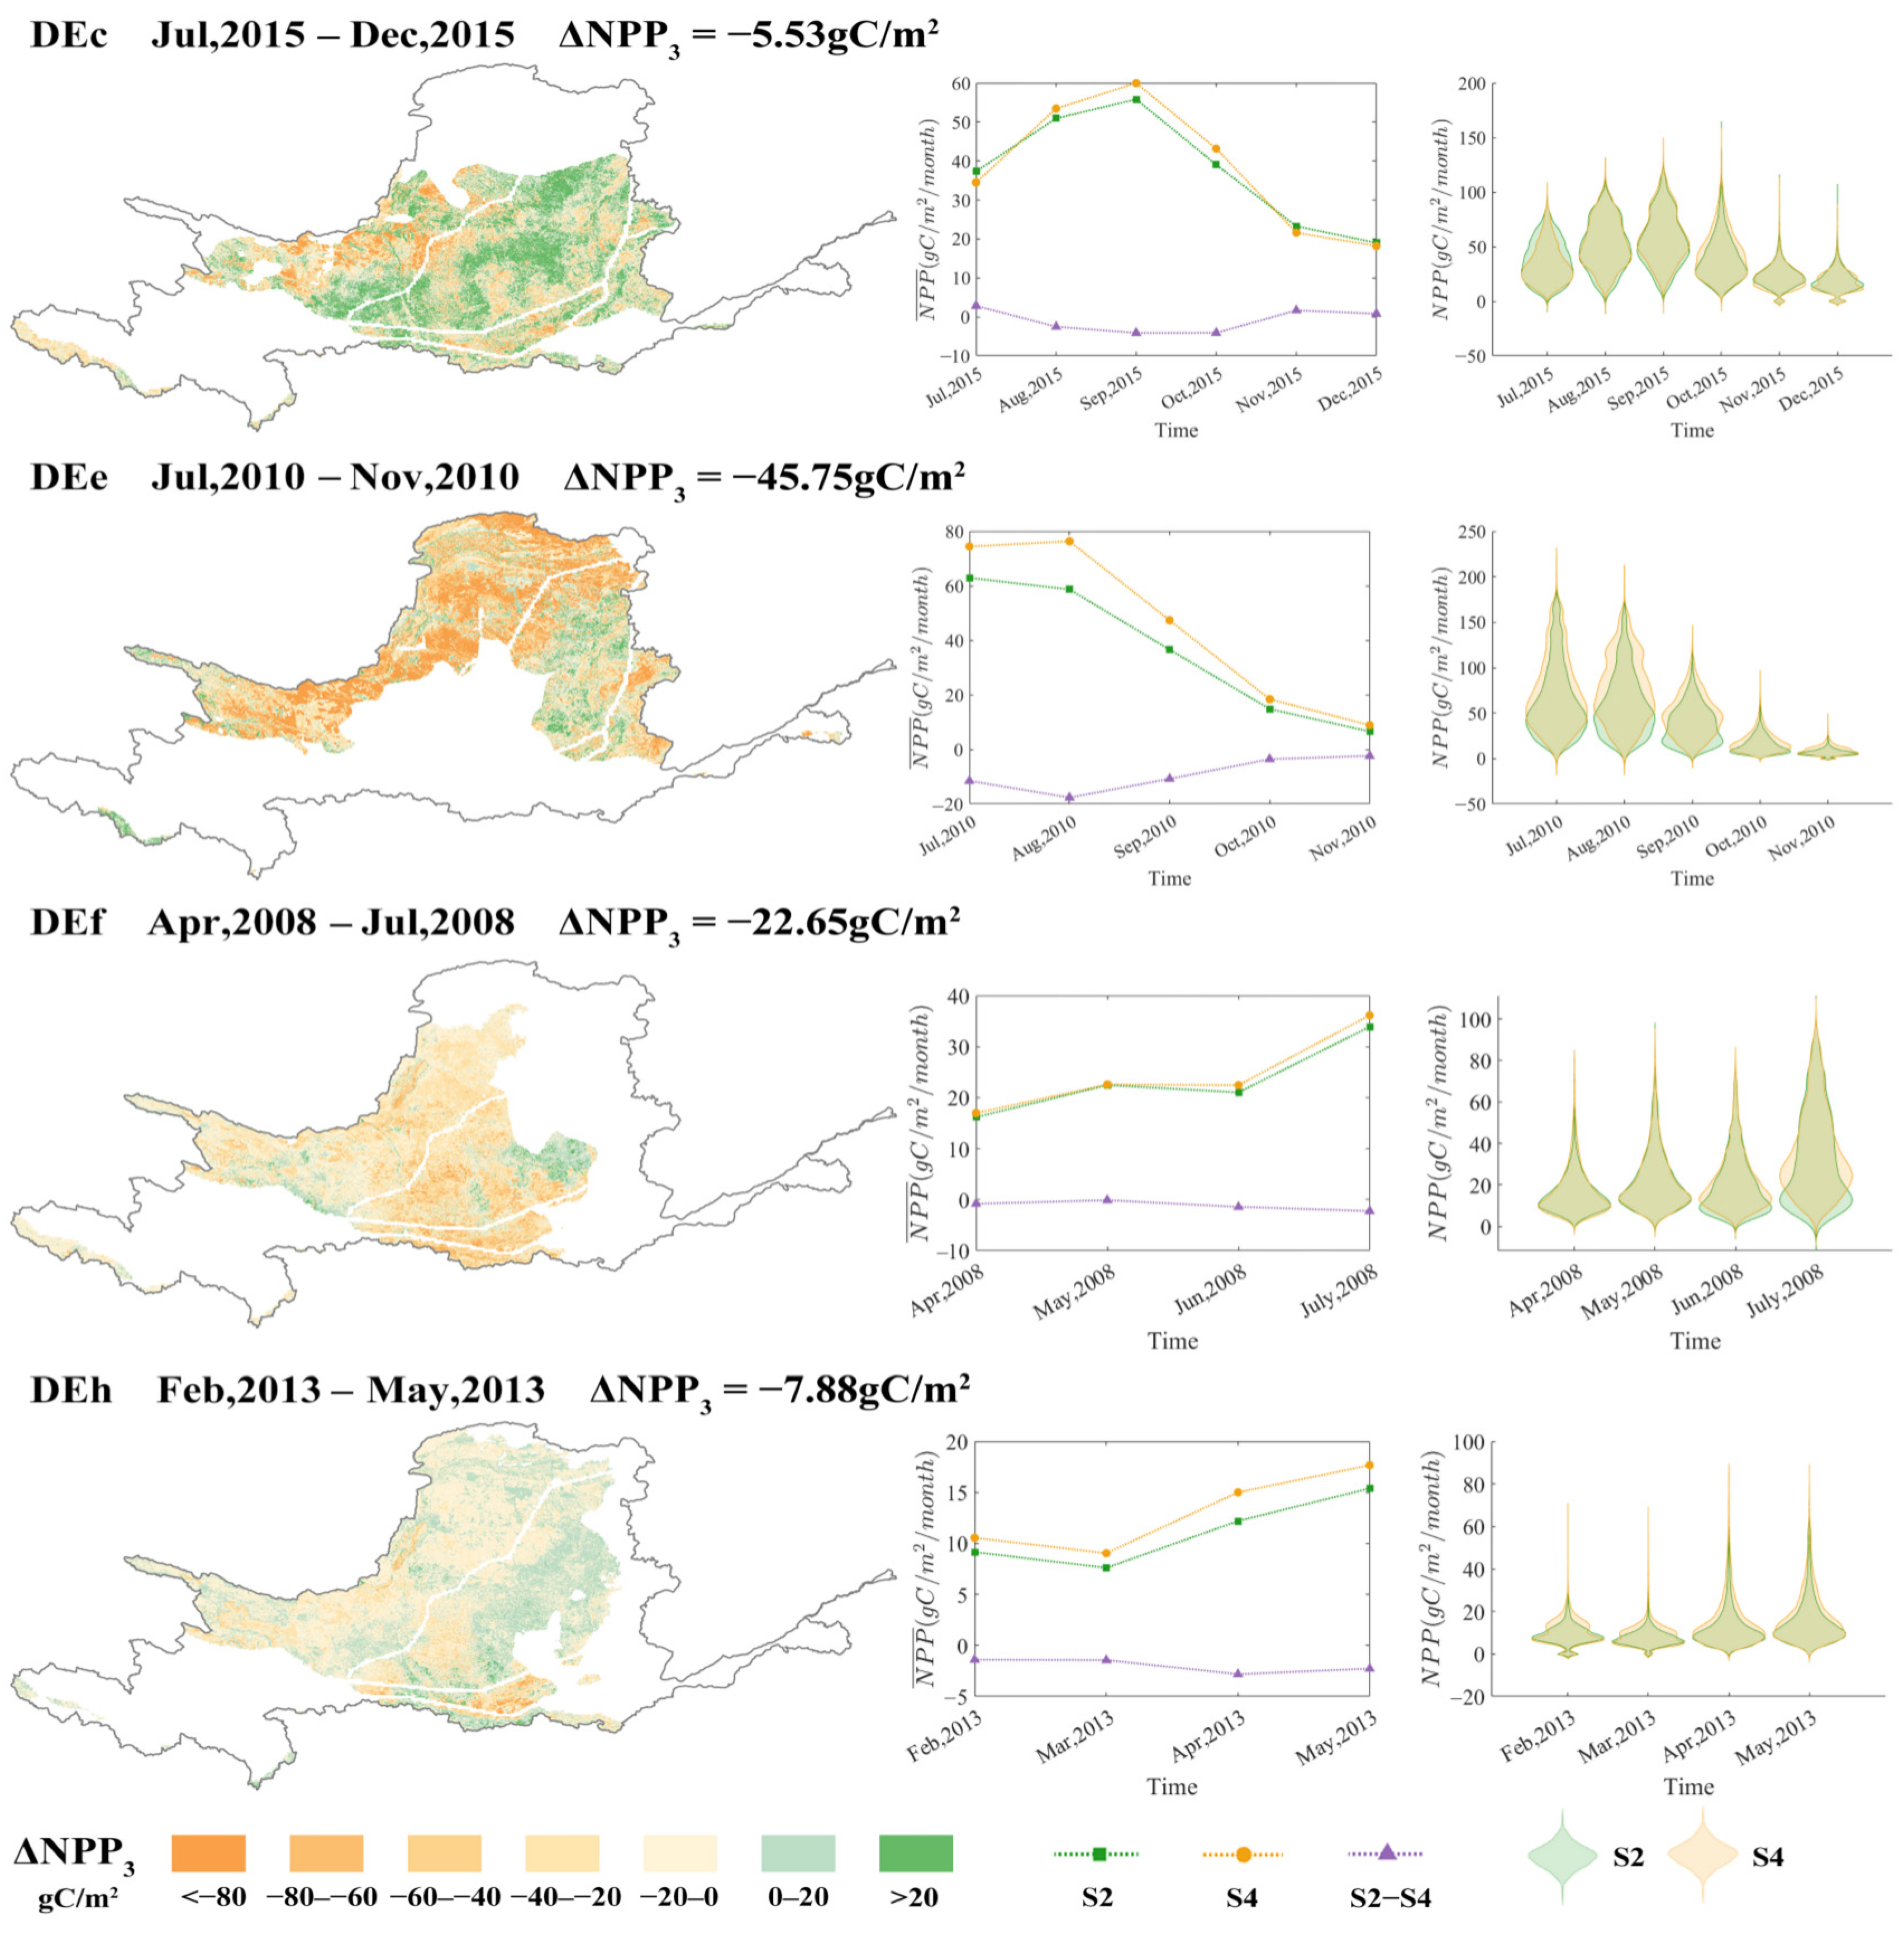
3.4. Amplification of the Suppressive Effect by Drought

Drought events significantly exacerbated the suppressive effect of NDVI growth on NPP (Figure 9). Relative to ideal climate conditions, the negative ΔNPP2-ΔNPP3 values observed during four representative drought events revealed that drought stress intensified NPP suppression by 155.5% on average. Event DEe had the most significant amplification, during which ΔNPP2 reached −81.58 gC·m−2. There was an increase in inhibition intensity of 78.3% compared to ΔNPP3 (−45.75 gC·m−2) (ΔNPP2-ΔNPP3 = −31.00 gC·m−2). Although the absolute values of ΔNPP2-ΔNPP3 for events DEc and DEh were lower (−16.76 and −7.45 gC·m−2), their relative amplification rates are as high as 303.1% and 94.5%, which reflected the impact of short-duration droughts on vegetation physiological processes.
Spatially, the amplification effect showed significant heterogeneity. Across the Hehuang Valley, Ningxia Plain, and Hetao Plain, ΔNPP2-ΔNPP3 consistently fell below −80 gC·m−2. This severe carbon loss primarily resulted from soil moisture content dropping below critical thresholds combined with a persistent imbalance between evapotranspiration demand and precipitation supply. However, in the Guanzhong Plain irrigation area, ΔNPP2-ΔNPP3 ranging from 0 to 20 gC·m−2 due to artificial irrigation, which verified the buffering effect of water management on the amplification effect. Event DEf represented the sole anomaly with positive ΔNPP2-ΔNPP3 values (+16.94 gC·m−2). This deviation likely reflects its (2008) temporal proximity to the 2000–2004 baseline period, when newly established engineered vegetation lacked stable community structure and consequently exhibited reduced drought sensitivity.
The suppressive effect exhibited a nonlinear attenuation with the duration of drought. During the event DEe, ΔNPP2-ΔNPP3 reached −29.6 gC·m−2 in the first month, but it recovered to +1.7 gC·m−2 in the fifth month. Vegetation gradually adapted to stress through stomatal regulation and redistribution of photosynthetic products. However, for most events, ΔNPP2 failed to recover to baseline levels within the drought cycle due to ecological resilience being limited by background conditions, such as soil organic matter and soil moisture content.

4. Discussion

4.1. The Ecological Mechanism of the Suppressive Effect of Afforestation on NPP

A systematic decoupling exists between significant NDVI increases and concurrent NPP declines across the Yellow River Basin. This “greening paradox” underscores fundamental ecological trade-offs in semi-arid region restoration projects. Although large-scale afforestation drove the increase in NDVI (Sen’s slope = 2.87 × 10⁻⁴), artificial forest expansion—while offsetting natural forest loss—may attenuate carbon sequestration benefits, particularly when lacking structural diversity in vegetation configuration [54]. High-density plantation forests intensified resource competition under moisture-constrained conditions characterized by annual precipitation below 400 mm, which reduced the efficiency of light energy utilization, while simultaneously increasing autotrophic respiration, and ultimately suppressed the increase in NPP growth [25,55]. This phenomenon showed that drought can offset vegetation greenness-induced productivity gains. Long-term droughts progressively suppress NPP despite short-term greening promotions [56]. This phenomenon was closely related to the coupled carbon–water imbalance in semi-arid soils. Deep soil water depletion accelerated organic carbon mineralization [55]. At the watershed scale, water scarcity exacerbated the evapotranspiration–precipitation imbalance, ultimately leading to NPP suppression despite vegetation densification [40]. In contrast, the SPMRYR project area realized ΔNPP2 gain through mixed forest configuration, confirming vegetation diversity in regulating the role of the carbon–water balance.

4.2. Mechanisms of Drought Amplification of Suppressive Effects

Extreme drought exacerbates the decoupling effect between NDVI and NPP via two mechanisms: physiological stress and resource competition [8]. Stomatal conductance exhibits high sensitivity to water stress. When relative soil moisture content falls below 52%, stomatal conductance decreases significantly with further moisture reduction [57]. This reduction in stomatal conductance is a primary driver of declined photosynthetic rates, with stomatal limitation progressively increasing as drought intensifies [58,59]. Notably, under extreme high-temperature conditions, decoupling may occur between stomatal conductance and photosynthesis regardless of water availability. This phenomenon could explain anomalous events where minimal NPP reduction occurs despite drought stress [60]. The evapotranspiration demand of plantation forests exceeds the capacity of natural precipitation recharge, which triggers the “water siphoning” effect and significantly increases the soil drying rate [61]. This amplification effect is particularly significant in semi-arid areas such as Hehuang Valley [62]. But in the Hetao Irrigation Area, ΔNPP2–ΔNPP3 can be controlled within ±20 gC·m−2 through irrigation management, which highlights the value of anthropogenic water regulation in enhancing ecological resilience [63]. The suppressive effect was strongest at the beginning of the drought, which was gradually mitigated with vegetative stomatal regulation and carbon redistribution. But most of the events failed to return to the baseline during the drought cycle, which suggests that ecological resilience is limited by the background conditions.

4.3. The Applicability of 3D Clustering Algorithm

Theoretically, 3D clustering algorithms may be subject to spatial constraints when applied to study areas with complex boundaries. In the Yellow River Basin, the lower reaches exhibit a narrow width, small area, and irregular shape due to the natural “suspended river” topography, which cannot be artificially adjusted. However, the drought events identified and analyzed in this study were primarily concentrated in the middle reaches, particularly the Loess Plateau where afforestation projects are focused. Although the lower reaches are included in the study area, they were not the spatial focus of this research. Therefore, the 3D clustering algorithm remains applicable to this study.

4.4. Ecological Management Strategy Optimization Path

The ecological governance framework of the Yellow River Basin requires a paradigm shift from scale-centric approaches to quality-oriented methodologies. To address ecological challenges, priority should be given to implementing low-density mixed forests in water-limited regions such as the Northwest Loess Plateau [64]. Mixed forest configurations in water-limited regions can enhance carbon sequestration while mitigating soil desiccation. Targeted reforestation in semi-arid zones can balance carbon sequestration and water resource sustainability [65]. Additionally, the NPP-NDVI decoupling index (DNI = ΔNPP/ΔNDVI) should be employed to identify critical risk areas where DNI values below −0.5 would prohibit high-density afforestation initiatives. To enable weekly-scale water stress detection, the MODIS-PET drought early warning system must be coupled with a high-density soil moisture network deploying 1 station per 50 km2 for real-time monitoring. In key agricultural zones like the Hetao-Ningxia Plain, adopting photovoltaic-powered drip irrigation systems could elevate water use efficiency to 85%. To ensure sustainable implementation, a cross-provincial eco-compensation framework should integrate NPP improvements into basin-wide fiscal transfer mechanisms, thereby harmonizing ecological conservation with water resource management.

5. Conclusions

This study integrated multi-source remote sensing and meteorological observation data from 2000 to 2020, combined with the SPEI and improved CASA model, systematically analyzed the spatiotemporal response law of the Yellow River basin vegetation NPP to extreme drought events, and quantified the regulation effect of vegetation coverage change on the drought sensitivity of the ecosystem. Among the 101 drought events identified based on the 3D clustering algorithm, the high-intensity drought event with DI of more than 0.7 resulted in an average NPP loss of −23.2 gC·m−2. However, the NPP reduction was significantly reduced to −9.03 gC·m−2 through artificial irrigation regulation in the Hetao irrigation area. Large-scale afforestation projects were driving basin NDVI to a 3.45 × 10⁻⁴ month−1 rate of sustained growth, with a contribution rate of 78%, but the high-density vegetation soil moisture competition caused carbon-sink benefit attenuation. The core of TNSP in the central loess plateau “Three North Shelterbelt” presented significant exceptions, in which local carbon sink gain was realized through the mixed forest structure optimization, which revealed the vegetation configuration regulation can effectively alleviate the pressure of water competition. Drought amplifies the Suppressive Effect of Afforestation through stomatal conductance-photosynthesis coupling mechanisms, inducing additional NPP losses of 7.45–31.00 gC·m−2, yet the April–July 2008 event exhibited reversed suppression effects due to immature artificial communities during the 2000–2004 baseline period. Our work elucidates nonlinear inhibitory mechanisms of vegetation-climate interactions on carbon sequestration in semi-arid ecosystems, providing critical insights for optimizing ecological restoration strategies and climate-adaptive management in the Yellow River Basin.
There are still two limitations in this study. First, the coupling mechanism of vegetation physiological processes and drought stress needs to be further analyzed, combined with in situ observation data. Second, the response threshold of ecosystem resilience to composite climate stress needs to be verified by long-term monitoring. Future research should focus on the spatial and temporal sustainability of ecological engineering benefits in the context of climate change to provide a scientific basis for ecological protection and high-quality development in the Yellow River Basin.

Author Contributions

Conceptualization, F.W., Z.Z. and M.D.; methodology, F.W.; software, F.W.; validation, F.W. and Z.Z.; formal analysis, F.W., data curation, F.W., Z.Z. and M.D.; writing—original draft preparation, Z.Z. and M.D.; writing—review and editing, Z.Z., M.D. and J.L.; visualization, F.W.; supervision, F.W., J.L. and Z.Z.; project administration, Z.Z., J.L. and X.C.; funding acquisition, J.L. and X.C. All authors have read and agreed to the published version of the manuscript.

Funding

This study was funded by the National Natural Science Foundation of China (42371367, 42271354), the Key Research and Development Program of Jiangxi Province in China (20243BBH81033), and the LIESMARS Special Research Funding.

Data Availability Statement

The original contributions presented in this study are included in the article. Further inquiries can be directed to the corresponding author.

Acknowledgments

During the preparation of this manuscript, the authors used Deepseek for the purposes of enhancing article readability. The authors have reviewed and edited the output and take full responsibility for the content of this publication.

Conflicts of Interest

The authors declare no conflicts of interest.

Abbreviations

The following abbreviations are used in this manuscript:
NPPNet Primary Productivity
CASACarnegie–Ames–Stanford Approach
STLSeasonal-Trend Decomposition using Loess
SPEIStandardized Precipitation Evapotranspiration Index
TNSPThree-North Shelterbelt Forest Program
PARPhotosynthetically Active Radiation

References

  1. Berthelot, M.; Friedlingstein, P.; Ciais, P.; Monfray, P.; Dufresne, J.L.; Le Treut, H.; Fairhead, L. Global response of the terrestrial biosphere to CO2 and climate change using a coupled climate-carbon cycle model. Glob. Biogeochem. Cycles 2002, 16, 31-1–31-15. [Google Scholar] [CrossRef]
  2. Cao, M.K.; Prince, S.D.; Li, K.R.; Tao, B.; Small, J.; Shao, X.M. Response of terrestrial carbon uptake to climate interannual variability in China. Glob. Change Biol. 2003, 9, 536–546. [Google Scholar] [CrossRef]
  3. Wahyudi, A.J.; Afdal. Climate Change Mitigation: From Carbon Cycle to Policy. In Proceedings of the 9th International Conference on Global Resource Conservation (ICGRC) and AJI from Ritsumeikan University, Malang, Indonesia, 7–8 March 2018; Volume 2019, p. 040019. [Google Scholar]
  4. Wang, B.; Sun, R.; Deng, Y. The Variability of Net Primary Productivity and Its Response to Climatic Changes Based on the Methods of Spatiotemporal Decomposition in the Yellow River Basin, China. Pol. J. Environ. Stud. 2022, 31, 4229–4312. [Google Scholar] [CrossRef]
  5. White, A.; Cannell, M.G.R.; Friend, A.D. CO2 stabilization, climate change and the terrestrial carbon sink. Glob. Change Biol. 2000, 6, 817–833. [Google Scholar] [CrossRef]
  6. Pan, S.; Tian, H.; Dangal, S.R.; Zhang, C.; Yang, J.; Tao, B.; Ouyang, Z.; Wang, X.; Lu, C.; Ren, W.; et al. Complex Spatiotemporal Responses of Global Terrestrial Primary Production to Climate Change and Increasing Atmospheric CO2 in the 21st Century. PLoS ONE 2014, 9, e112810. [Google Scholar] [CrossRef]
  7. Huang, K.; Xia, J.Y. High ecosystem stability of evergreen broadleaf forests under severe droughts. Glob. Change Biol. 2019, 25, 3494–3503. [Google Scholar] [CrossRef] [PubMed]
  8. Zhao, M.S.; Running, S.W. Drought-Induced Reduction in Global Terrestrial Net Primary Production from 2000 Through 2009. Science 2010, 329, 940–943. [Google Scholar] [CrossRef]
  9. Zhao, D.D.; Jia, W.Y.; Liu, J.P. Dynamic Changes and Driving Mechanisms of Net Primary Production (NPP) in a Semi-Arid Region of China. Sustainability 2023, 15, 11829. [Google Scholar] [CrossRef]
  10. Bao, G.; Bao, Y.H.; Qin, Z.H.; Xin, X.P.; Bao, Y.L.; Bayarsaikan, S.; Zhou, Y.; Chuntai, B. Modeling net primary productivity of terrestrial ecosystems in the semi-arid climate of the Mongolian Plateau using LSWI-based CASA ecosystem model. Int. J. Appl. Earth Obs. Geoinf. 2016, 46, 84–93. [Google Scholar] [CrossRef]
  11. Doughty, C.E.; Metcalfe, D.B.; Girardin, C.A.J.; Amézquita, F.F.; Cabrera, D.G.; Huasco, W.H.; Silva-Espejo, J.E.; Araujo-Murakami, A.; da Costa, M.C.; Rocha, W.; et al. Drought impact on forest carbon dynamics and fluxes in Amazonia. Nature 2015, 519, 78–82. [Google Scholar] [CrossRef]
  12. Lawlor, D.W. Limitation to photosynthesis in water-stressed leaves: Stomata vs. metabolism and the role of ATP. Ann. Bot. 2002, 89, 871–885. [Google Scholar] [CrossRef] [PubMed]
  13. He, T.; Dai, X.A.; Li, W.Y.; Zhou, J.Y.; Zhang, J.J.; Li, C.; Dai, T.R.; Li, W.L.; Lu, H.; Ye, Y.K.; et al. Response of net primary productivity of vegetation to drought: A case study of Qinba Mountainous area, China (2001–2018). Ecol. Indic. 2023, 149, 110148. [Google Scholar] [CrossRef]
  14. Jiang, X.W.; Bai, J.J. Quantifying the impacts of drought and ecological restoration on net primary production changes in the Chinese Loess Plateau. PLoS ONE 2020, 15, e0238997. [Google Scholar] [CrossRef] [PubMed]
  15. Wu, S.H.; Yang, Q.Y.; Du, Z. Delineation of eco-geographic regional system of China. J. Geogr. Sci. 2003, 13, 309–315. [Google Scholar]
  16. Li, J.G.; Wang, Y.; Liu, L.L. Responses of the Terrestrial Ecosystem Productivity to Droughts in China. Front. Earth Sci. 2020, 8, 59. [Google Scholar] [CrossRef]
  17. Sun, B.F.; Zhao, H.; Wang, X.K. Effects of drought on net primary productivity: Roles of temperature, drought intensity, and duration. Chin. Geogr. Sci. 2016, 26, 270–282. [Google Scholar] [CrossRef]
  18. Li, X.Y.; Piao, S.L.; Huntingford, C.; Peñuelas, J.; Yang, H.; Xu, H.; Chen, A.P.; Friedlingstein, P.; Keenan, T.F.; Sitch, S.; et al. Global variations in critical drought thresholds that impact vegetation. Natl. Sci. Rev. 2023, 10, nwad049. [Google Scholar] [CrossRef] [PubMed]
  19. Wang, Q.; Yang, Y.; Liu, Y.Y.; Tong, L.J.; Zhang, Q.P.; Li, J.L. Assessing the Impacts of Drought on Grassland Net Primary Production at the Global Scale. Sci. Rep. 2019, 9, 14041. [Google Scholar] [CrossRef]
  20. Li, C.; Filho, W.L.; Yin, J.; Hu, R.C.; Wang, J.; Yang, C.S.; Yin, S.; Bao, Y.H.; Ayal, D.Y. Assessing vegetation response to multi-time-scale drought across inner Mongolia plateau. J. Clean. Prod. 2018, 179, 210–216. [Google Scholar] [CrossRef]
  21. Zhan, C.; Liang, C.; Zhao, L.; Jiang, S.Z.; Niu, K.J.; Zhang, Y.L. Drought-related cumulative and time-lag effects on vegetation dynamics across the Yellow River Basin, China. Ecol. Indic. 2022, 143, 109409. [Google Scholar] [CrossRef]
  22. Jiao, Q.; Li, R.; Wang, F.; Mu, X.M.; Li, P.F.; An, C.C. Impacts of Re-Vegetation on Surface Soil Moisture over the Chinese Loess Plateau Based on Remote Sensing Datasets. Remote Sens. 2016, 8, 156. [Google Scholar] [CrossRef]
  23. Zhang, J.H.; Zhang, Y.L.; Wang, X.; He, T.H.; Xia, H.J.; Zhang, K.R.; Zhang, Q.F. National Forest Restoration Projects in China: Cost-Efficiency and Trade-Off Between Carbon Sequestration and Water Consumption. Earths Future 2024, 12, e2024EF004976. [Google Scholar] [CrossRef]
  24. Chen, C.; Park, T.; Wang, X.H.; Piao, S.L.; Xu, B.D.; Chaturvedi, R.; Fuchs, R.; Brovkin, V.; Ciais, P.; Fensholt, R.; et al. China and India lead in greening of the world through land-use management. Nat. Sustain. 2019, 2, 122–129. [Google Scholar] [CrossRef] [PubMed]
  25. Berdugo, M.; Gaitán, J.J.; Delgado-Baquerizo, M.; Crowther, T.W.; Dakos, V. Prevalence and drivers of abrupt vegetation shifts in global drylands. Proc. Natl. Acad. Sci. USA 2022, 119, e2123393119. [Google Scholar] [CrossRef]
  26. Lloyd-Hughes, B. A spatio-temporal structure-based approach to drought characterisation. Int. J. Climatol. 2012, 32, 406–418. [Google Scholar] [CrossRef]
  27. Xu, K.; Yang, D.W.; Xu, X.Y.; Lei, H.M. Copula based drought frequency analysis considering the spatio-temporal variability in Southwest China. J. Hydrol. 2015, 527, 630–640. [Google Scholar] [CrossRef]
  28. Guo, H.; Bao, A.M.; Ndayisaba, F.; Liu, T.; Jiapaer, G.; El-Tantawi, A.M.; Maeyer, P.D. Space-time characterization of drought events and their impacts on vegetation in Central Asia. J. Hydrol. 2018, 564, 1165–1178. [Google Scholar] [CrossRef]
  29. Vicente-Serrano, S.M.; Gouveia, C.; Camarero, J.J.; Beguería, S.; Trigo, R.; López-Moreno, J.I.; Azorín-Molina, C.; Pasho, E.; Lorenzo-Lacruz, J.; Revuelto, J.; et al. Response of vegetation to drought time-scales across global land biomes. Proc. Natl. Acad. Sci. USA 2013, 110, 52–57. [Google Scholar] [CrossRef] [PubMed]
  30. Li, C.; Kattel, G.R.; Zhang, J.; Shang, Y.; Gnyawali, K.R.; Zhang, F.; Miao, L.J. Slightly enhanced drought in the Yellow River Basin under future warming scenarios. Atmos. Res. 2022, 280, 106423. [Google Scholar] [CrossRef]
  31. Wang, L.; Shu, Z.K.; Wang, G.Q.; Sun, Z.L.; Yan, H.F.; Bao, Z.X. Analysis of Future Meteorological Drought Changes in the Yellow River Basin under Climate Change. Water 2022, 14, 1896. [Google Scholar] [CrossRef]
  32. Zheng, L.; Lu, J.Z.; Liu, H.; Chen, X.L.; Yesou, H. Evidence of vegetation greening benefitting from the afforestation initiatives in China. Geo-Spat. Inf. Sci. 2024, 27, 683–702. [Google Scholar] [CrossRef]
  33. Tian, Q.; Lu, J.Z.; Chen, X.L. A novel comprehensive agricultural drought index reflecting time lag of soil moisture to meteorology: A case study in the Yangtze River basin, China. Catena 2022, 209, 105804. [Google Scholar] [CrossRef]
  34. Wu, J.R.; Chen, X.L.; Lu, J.Z. Assessment of long and short-term flood risk using the multi-criteria analysis model with the AHP-Entropy method in Poyang Lake basin. Int. J. Disaster Risk Reduct. 2022, 75, 102968. [Google Scholar] [CrossRef]
  35. Peng, S.Z.; Ding, Y.X.; Liu, W.Z.; Li, Z. 1 km monthly temperature and precipitation dataset for China from 1901 to 2017[dataset]. Earth Syst. Sci. Data 2019, 11, 1931–1946. [Google Scholar] [CrossRef]
  36. Yuan, W.P.; Liu, S.G.; Yu, G.R.; Bonnefond, J.M.; Chen, J.Q.; Davis, K.; Desai, A.R.; Goldstein, A.H.; Gianelle, D.; Rossi, F.; et al. Global estimates of evapotranspiration and gross primary production based on MODIS and global meteorology data. Remote Sens. Environ. 2010, 114, 1416–1431. [Google Scholar] [CrossRef]
  37. Yuan, W.P.; Zheng, Y.; Piao, S.L.; Ciais, P.; Lombardozzi, D.; Wang, Y.P.; Ryu, Y.; Chen, G.X.; Dong, W.J.; Hu, Z.M.; et al. Increased atmospheric vapor pressure deficit reduces global vegetation growth. Sci. Adv. 2019, 5, eaax1396. [Google Scholar] [CrossRef]
  38. Zheng, Y.; Shen, R.Q.; Wang, Y.W.; Li, X.Q.; Liu, S.G.; Liang, S.L.; Chen, J.M.; Ju, W.M.; Zhang, L.; Yuan, W.P. Improved estimate of global gross primary production for reproducing its long-term variation, 1982–2017. Earth Syst. Sci. Data 2020, 12, 2725–2746. [Google Scholar] [CrossRef]
  39. Vicente-Serrano, S.M.; Beguería, S.; López-Moreno, J.I. A Multiscalar Drought Index Sensitive to Global Warming: The Standardized Precipitation Evapotranspiration Index. J. Clim. 2010, 23, 1696–1718. [Google Scholar] [CrossRef]
  40. Li, J.; Wang, Z.L.; Lai, C.G. Severe drought events inducing large decrease of net primary productivity in mainland China during 1982–2015. Sci. Total Environ. 2020, 703, 135541. [Google Scholar] [CrossRef]
  41. Sheffield, J.; Andreadis, K.M.; Wood, E.F.; Lettenmaier, D.P. Global and continental drought in the second half of the twentieth century: Severity-area-duration analysis and temporal variability of large-scale events. J. Clim. 2009, 22, 1962–1981. [Google Scholar] [CrossRef]
  42. Guo, H.; Bao, A.M.; Liu, T.; Jiapaer, G.; Ndayisaba, F.; Jiang, L.L.; Kurban, A.; Maeyer, P.D. Spatial and temporal characteristics of droughts in Central Asia during 1966–2015. Sci. Total Environ. 2018, 624, 1523–1538. [Google Scholar] [CrossRef] [PubMed]
  43. Vidal, J.P.; Martin, E.; Franchistéguy, L.; Habets, F.; Soubeyroux, J.M.; Blanchard, M.; Baillon, M. Multilevel and multiscale drought reanalysis over France with the Safran-Isba-Modcou hydrometeorological suite. Hydrol. Earth Syst. Sci. 2010, 14, 459–478. [Google Scholar] [CrossRef]
  44. Diaz, V.; Perez, G.A.C.; Van Lanen, H.A.J.; Solomatine, D.; Varouchakis, E.A. Characterisation of the dynamics of past droughts. Sci. Total Environ. 2020, 718, 134588. [Google Scholar] [CrossRef]
  45. Huang, S.Z.; Chang, J.X.; Leng, G.Y.; Huang, Q. Integrated index for drought assessment based on variable fuzzy set theory: A case study in the Yellow River basin, China. J. Hydrol. 2015, 527, 608–618. [Google Scholar] [CrossRef]
  46. Kendall, M.G. Rank Correlation Methods; Charles Griffin & Company: London, UK, 1949. [Google Scholar]
  47. Yue, S.; Pilon, P.; Cavadias, G. Power of the Mann-Kendall and Spearmans rho tests for detecting monotonic trends in hydrological series. J. Hydrol. 2002, 259, 254–271. [Google Scholar] [CrossRef]
  48. Alexandersson, H. A homogeneity test applied to precipitation data. Int. J. Climatol. 1986, 6, 661–675. [Google Scholar] [CrossRef]
  49. Krake, T.; Kltzl, D.; Hgele, D. Uncertainty-Aware Seasonal-Trend Decomposition Based on Loess. IEEE Trans. Vis. Comput. Graph. 2025, 31, 1496–1512. [Google Scholar] [CrossRef]
  50. Evans, J.; Geerken, R. Discrimination between climate and human-induced dryland degradation. J. Arid. Environ. 2004, 57, 535–554. [Google Scholar] [CrossRef]
  51. Gao, W.D.; Zheng, C.; Liu, X.H.; Lu, Y.D.; Chen, Y.F.; Wei, Y.; Ma, Y.D. NDVI-based vegetation dynamics and their responses to climate change and human activities from 1982 to 2020: A case study in the Mu Us Sandy Land. China Ecol. Indic. 2022, 137, 108745. [Google Scholar] [CrossRef]
  52. Zhu, W.Q.; Pan, Y.Z.; He, H.; Wang, L.L.; Mou, M.J.; Liu, J.H. A Changing-Weight Filter Method for Reconstructing a High-Quality NDVI Time Series to Preserve the Integrity of Vegetation Phenology. IEEE Trans. Geosci. Remote Sens. 2012, 50, 1085–1094. [Google Scholar] [CrossRef]
  53. Zhu, W.Q.; Pan, Y.Z.; Zhang, J.S. Estimation of Net Primary Productivity of Chinese Terrestrial Vegetation Based on Remote Sensing. Chin. J. Plant Ecol. 2007, 3, 413–424. [Google Scholar]
  54. Xu, H.T.; He, B.; Guo, L.L.; Yan, X.; Dong, J.W.; Yuan, W.P.; Hao, X.M.; Lv, A.F.; He, X.Q.; Li, T.W. Changes in the Fine Composition of Global Forests from 2001 to 2020. J. Remote Sens. 2024, 4, 0119. [Google Scholar] [CrossRef]
  55. Huang, Y.Z.; Gao, G.Y.; Ran, L.S.; Wang, Y.; Fu, B.J. Afforestation Reduces Deep Soil Carbon Sequestration in Semiarid Regions: Lessons From Variations of Soil Water and Carbon Along Afforestation Stages in Chinas Loess Plateau. J. Geophys. Res. Biogeosci. 2024, 129, e2024JG00828. [Google Scholar] [CrossRef]
  56. Zheng, L.; Lu, J.Z.; Chen, X.L. Drought offsets the vegetation greenness-induced gross primary productivity from 1982 to 2018 in China. J. Hydrol. 2024, 632, 130881. [Google Scholar] [CrossRef]
  57. Thitiporn, M.; Thong-ob, T.; Wonprasaid, S. Effect of Soil Moisture and Determination of Critical Soil Moisture Contents of Cassava. Indian J. Agric. Res. 2020, 54, 483–488. [Google Scholar]
  58. Medrano, H.; Escalona, J.M.; Bota, J.; Gulías, J.; Flexas, J. Regulation of Photosynthesis of C3 Plants in Response to Progressive Drought: Stomatal Conductance as a Reference Parameter. Ann. Bot. 2002, 89, 895–905. [Google Scholar] [CrossRef]
  59. Tezara, W.; Fernández, M.D.; Donoso, C.; Herrera, A. Seasonal Changes in Photosynthesis and Stomatal Conductance of Five Plant Species from a Semiarid Ecosystem. Photosynthetica 1998, 35, 399–410. [Google Scholar] [CrossRef]
  60. Marchin, R.M.; Medlyn, B.E.; Tjoelker, M.G.; Ellsworth, D.S. Decoupling between stomatal conductance and photosynthesis occurs under extreme heat in broadleaf tree species regardless of water access. Glob. Change Biol. 2023, 29, 6319–6335. [Google Scholar] [CrossRef]
  61. Lei, Y.; Zhang, Z.H.; Li, Z.S. Effects of large-scale re-vegetation on soil desiccation in the Loess Plateau: Problems and perspectives. Acta Ecol. Sin. 2019, 39, 7382–7388. [Google Scholar]
  62. Wei, Y.Q.; Jin, J.L.; Li, H.C.; Zhou, Y.L.; Cui, Y.; Commey, N.A.; Zhang, Y.L.; Jiang, S.M. Assessment of Agricultural Drought Vulnerability Based on Crop Growth Stages: A Case Study of Huaibei Plain, China. Int. J. Disaster Risk Sci. 2023, 14, 209–222. [Google Scholar] [CrossRef]
  63. Wang, J.X.; Yang, Y.; Huang, J.K.; Adhikari, B. Adaptive irrigation measures in response to extreme weather events: Empirical evidence from the North China plain. Reg. Environ. Change 2019, 19, 1009–1022. [Google Scholar] [CrossRef]
  64. Chen, G.; Tan, Q.Y.; Xu, M.X.; Liu, G.B. Mixed-species plantations can alleviate water stress on the Loess Plateau. For. Ecol. Manag. 2020, 458, 117767. [Google Scholar]
  65. Fan, L.; Dong, G.; Frappart, F.; Wigneron, J.P.; Yue, Y.; Xiao, X.; Zhang, Y.; Tao, S.; Cao, L.; Li, Y.; et al. Satellite-Observed Increase in Aboveground Carbon over Southwest China during 2013–2021. J. Remote Sens. 2024, 4, 0113. [Google Scholar] [CrossRef]
Figure 1. Study Area.
Remotesensing 17 02100 g001
Figure 2. Spatial distribution of the center of mass of drought events in the Yellow River Basin from 2000 to 2020 (a) and spatial migration paths of the center of mass of eight typical drought events (b).
Remotesensing 17 02100 g002
Figure 3. Spatial distribution of ΔNPP for eight typical drought events in the Yellow River Basin (left), folded map of the average NPP distribution of all grids during the drought events (center), and fiddle map of the NPP distribution of all grids during the drought events (right). S1 represents the baseline scenario, and S2 represents the experimental scenario.
Remotesensing 17 02100 g003
Figure 4. STL decomposition results for NDVI time series.
Remotesensing 17 02100 g004
Figure 5. Characteristics of spatial differentiation in NDVI trends.
Remotesensing 17 02100 g005
Figure 6. Mechanisms driving vegetation change in the Yellow River Basin: (a) spatial distribution of dominant factors (b) climatic factors and human activities contribution to vegetation gain.
Remotesensing 17 02100 g006
Figure 7. Spatial distribution of ΔNPP2 during four typical drought events in the Yellow River Basin (left), average NPP over all grids during the drought events folded plot of the distribution (center), and fiddle plot of the NPP distribution over all grids during the drought events (right).
Remotesensing 17 02100 g007
Figure 8. Spatial distribution map of ΔNPP3 during 4 typical drought events in the Yellow River Basin (left), line chart of average NPP distribution of all grids during drought events (middle), and violin plot of NPP distribution of all grids during drought events (right).
Remotesensing 17 02100 g008
Figure 9. Spatial distribution and time-series line graphs of ΔNPP2 − ΔNPP3 of four typical drought events in the Yellow River Basin.
Remotesensing 17 02100 g009
Table 1. Scenarios for assessing driving mechanisms for the relative roles of climate change and human activities.
Dominant Driver Scenario S N D V I o b s S N D V I p r e S N D V I r e s Relative Contribution of Climate ChangeRelative Contribution of Human Activities
Climate-driven vegetation gain>0>0<0100%0%
Anthropogenically promoted vegetation gain>0<0>00%100%
Climate-anthropogenic synergistic vegetation gain>0>0>0 S N D V I p r e / S N D V I o b s S N D V I r e s / S N D V I o b s
Climate-driven vegetation degradation<0<0>0100%0%
Anthropogenic disturbed vegetation degradation<0>0<00%100%
Climate-anthropogenic synergistic vegetation degradation<0<0<0 S N D V I p r e / S N D V I o b s S N D V I r e s / S N D V I o b s
Table 2. Comparison of S1–S4 scenario inputs.
SightPrecipitation Temperature NDVI PAR
S1
S2
S3
S4
●: Real observed value ○: Experimental simulated value.
Table 3. Eight typical drought events and their characteristic variables in the Yellow River Basin, 2000–2020.
Event IDTime PeriodDD (Months)DA (×103 km2)DS (×103 km2·h)DL (km)DI
DEaMarch, 2000–July, 20005710.65946.301442.480.919
DEbMay, 2001–September, 20015702.86930.111204.550.861
DEcJuly, 2015–December, 20156579.54567.591348.880.800
DEdAugust, 2002–February, 20037537.02928.34714.930.794
DEeJuly, 2010–November, 20105449.98246.081269.230.618
DEfApril, 2008–July, 20084496.91618.94833.980.601
DEgMarch, 2004–June, 20044591.45464.96811.710.579
DEhFebruary, 2013–May, 20134599.37714.31378.540.558
Disclaimer/Publisher’s Note: The statements, opinions and data contained in all publications are solely those of the individual author(s) and contributor(s) and not of MDPI and/or the editor(s). MDPI and/or the editor(s) disclaim responsibility for any injury to people or property resulting from any ideas, methods, instructions or products referred to in the content.

