Abstract
Enhancing low-light remote sensing images is crucial for preserving the accuracy and reliability of downstream analyses in a wide range of applications. Although numerous enhancement algorithms have been developed, many fail to effectively address the challenges posed by non-uniform illumination in low-light scenes. These images often exhibit significant brightness inconsistencies, leading to two primary problems: insufficient enhancement in darker regions and over-enhancement in brighter areas, frequently accompanied by color distortion and visual artifacts. These issues largely stem from the limitations of existing methods, which insufficiently account for non-uniform atmospheric attenuation and local brightness variations in reflectance estimation. To overcome these challenges, we propose a robust enhancement method based on non-uniform illumination compensation and the Atmospheric Scattering Model (ASM). Unlike conventional approaches, our method utilizes ASM to initialize reflectance estimation by adaptively adjusting atmospheric light and transmittance. A weighted graph is then employed to effectively handle local brightness variation. Additionally, a regularization term is introduced to suppress noise, refine reflectance estimation, and maintain balanced brightness enhancement. Extensive experiments on multiple benchmark remote sensing datasets demonstrate that our approach outperforms state-of-the-art methods, delivering superior enhancement performance and visual quality, even under complex non-uniform low-light conditions.
1. Introduction
The primary goal of remote sensing technology is to acquire clear and precise information about terrestrial scenes. Compared to conventional imaging methods, remote sensing imagery offers richer color detail and broader spatial coverage. However, images captured under low-light or uneven illumination often suffer from color degradation and detail loss due to nighttime conditions and environmental influences. In such scenarios, degradation phenomena—including underexposure, reduced visibility, noise amplification, and loss of fine structures—severely impair image usability and visual quality. These impairments hinder effective information transmission and compromise the performance of downstream tasks that rely on remote sensing data [1,2]. Consequently, restoring high-quality images in complex, non-uniform low-light environments has become a critical challenge in computer vision and image processing. A key issue in low-light enhancement is how to suppress noise effectively while enhancing visibility in dark regions without over-brightening already well-lit areas.
Remote sensing imagery, with its extensive spatial scales, often presents complex and heterogeneous illumination conditions. The arrangement of large-scale features—such as forests spanning several square kilometers or road networks crossing entire scenes—leads to pronounced lighting variations, especially under low-light conditions. For instance, streetlights may brightly illuminate urban areas while adjacent regions remain dark. Such illumination inconsistency exacerbates image degradation, causing color distortion, detail loss, and overall deterioration in visual quality. Compared to traditional static images, remote sensing data requires higher spatial resolution and finer detail, making it more susceptible to the adverse effects of inadequate and uneven lighting. In applications including urban monitoring [3], wildlife observation [4], and disaster recovery [5], low-quality imagery directly undermines the accuracy of data analysis and decision-making. Therefore, designing enhancement algorithms that can effectively counter the challenges of low-light and non-uniform illumination in remote sensing imagery is a vital research direction. Figure 1 illustrates an example of a non-uniform low-light remote sensing image.
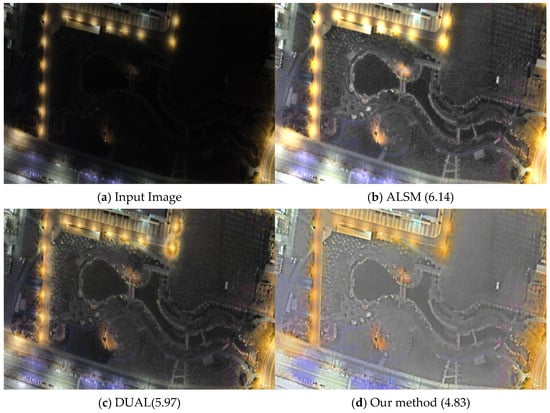
Figure 1.
The results of enhancing classical non-uniform low-light images from the darkrs dataset show that our method can enhance the dim regions, suppress noise, and simultaneously rebalance the global brightness. (a) Original image. (b) ALSM method excessively enhances the highlight regions, losing details and failing to enhance the low-light regions effectively. (c) DUAL method exhibits insufficient noise suppression in the enhanced image. (d) Our approach demonstrates improved precision in the details of darker regions, with strong noise suppression capability. The enhanced images look more natural and vibrant. The values in parentheses represent NIQE values.
Recent advances have been made in low-light image enhancement (LLIE) methods, which include techniques such as histogram equalization [6], inverse domain operations [7], Retinex-based methods [8], and deep learning-based algorithms [9,10]. Histogram equalization improves contrast to enhance dark regions but often overlooks noise, leading to loss of fine details. Retinex-based methods decompose an image into reflectance and illumination components and adjust illumination to increase brightness; however, they can introduce severe distortions under non-uniform lighting. Most existing studies target natural images, revealing a clear gap in methods tailored for remote sensing data, especially in the presence of uneven illumination. In recent years, deep learning approaches have shown remarkable performance in LLIE [11,12], but these supervised methods require paired remote sensing datasets—which are scarce—and may exhibit poor generalization and amplify noise in low-light conditions.
We observe that the ASM and Retinex theory both seek to recover intrinsic scene reflectance, they differ fundamentally in their assumptions: Retinex corrects illumination through reflectance–illumination decomposition, while ASM estimates transmittance and atmospheric light to implicitly separate reflectance. DCP-based inverse-imaging enhancement approaches, although grounded in ASM, lack physical interpretability in their inverse imaging process and exhibit limited robustness under severe degradation. Retinex-based methods, on the other hand, struggle to balance compensation in extremely low-illumination regions and suppression in overexposed areas. In contrast, our method uniquely integrates ASM-based reflectance initialization with a weighted variational optimization framework: ASM provides a more accurate initial reflectance and transmittance map by decomposing and compensating for spatially non-uniform atmospheric light and transmittance, while the variational model adaptively suppresses noise and enforces weighted regularization to accommodate diverse illumination variations. This joint ASM–variational optimization not only yields a physically grounded but also significantly improves robustness to non-uniform, low-light degradation—distinguishing our approach from both DCP-based inverse-imaging enhancement and Retinex-based algorithms. Our contributions are summarized as follows:
- Reflectance Estimation with ASM: We employ the ASM for reflectance estimation, enhancing the stability and accuracy of the initial reflectance map in non-uniform low-light environments through refined initialization and compensation of atmospheric light and transmittance.
- Weighted Reflectance Reconstruction: We introduce a weighted reconstruction approach to replace global gamma correction, which adaptively enhances reflectance values in different regions while preserving the overall image depth.
- Robustness and Noise Suppression: The Non-Uniform Illumination Compensation model introduces a noise regularization term and alternating optimization to suppress noise while robustly preserving fine details, ensuring improved image naturalness and quality in low-light areas.
- Comprehensive Experimental Validation: Extensive testing across multiple datasets demonstrates the model’s robust performance and generalization, validating its effectiveness in low-light image enhancement under diverse conditions.
2. Related Work
2.1. Conventional Methods
Traditional LLIE methods are typically divided into histogram equalization (HE)- and Retinex-based methods. HE-based methods normalize pixel values to the range [0, 1] and then apply histogram equalization to globally enhance image contrast, improving the visibility of low-light images [13,14]. Although these methods support both global and local adjustments, they often struggle to capture non-local features and the relationships among neighboring pixels, sometimes leading to overexposure or underexposure. To address these limitations, Retinex-inspired methods decompose images into reflectance and illumination components, aiming to better preserve local details and reduce artifacts.
In this framework, represents the image, while and denote the reflectance and illumination components, respectively, and denotes noise. Here, denotes the Hadamard product of matrices, which refers to the element-wise multiplication of corresponding entries in the matrices. According to the Retinex theory, a color image can be decomposed into these three components, with the reflectance component considered the final enhanced result. The Multi-Scale Retinex (MSR) model [15] combines dynamic range compression, color consistency, and brightness adjustment, using color restoration to recover the original illumination. However, SSR and MSR models often suffer from color cast issues, which were later addressed by MSRCR [16] through Gaussian and guided filtering. The Natural Preservation Enhancement (NPE) algorithm [17] utilizes a lightness-order-error measure to balance detail enhancement and naturalness preservation.
To further enhance local contrast and details, the MF method [18] integrates multiple techniques for decomposing illumination and compensates the adjusted illumination back into the reflectance. The Low-light Image Enhancement based on Illumination Map Estimation (LIME) [19] estimates pixel-wise illumination by selecting the maximum value across the R, G, and B channels, followed by structural refinement of the illumination map. The BIMEF method [20] introduces a dual-exposure fusion strategy to enhance contrast and brightness effectively. Li et al. [21] proposed a robust Retinex model that estimates the noise map alongside the reflectance, which improves performance in noisy low-light conditions. To preserve finer details in the reflectance, Fu et al. [22] incorporated a weighted variational regularization term, while Gu et al. [23] introduced total variation regularization for both reflectance and illumination to preserve image details during the enhancement process. Cotogni et al. [24] proposed an automatic weak-light enhancement method for improving digital image quality. Lastly, Wang et al. proposed an adaptive image fusion framework based on a virtual exposure strategy [25].
Although these techniques have demonstrated differing levels of efficacy in enhancing images captured in low-light conditions, they frequently encounter challenges related to noise and uneven illumination. This results in inconsistent outcomes, especially in the context of remote sensing imagery. Furthermore, their emphasis on general low-light processing constrains their effectiveness in intricate, real-world situations.
2.2. Atmospheric Scattering Model
In recent years, atmospheric scattering models have been extensively explored for low-light image enhancement. Yu et al. [26] proposed an adaptive environmental light and scattering attenuation framework to mitigate halo artifacts, unnatural coloration, and information loss by leveraging the inherent correlation between atmospheric light and medium transmittance. Inspired by the similarity between inverted low-light images and hazy scenes, Dong et al. [27] introduced a dehazing-inspired approach utilizing the dark channel prior (DCP) to achieve brightness restoration. Subsequent studies, including works by Zhang et al. [28] and Jiang et al. [29], further refined this paradigm by integrating noise suppression strategies and multi-scale pyramid decomposition into the DCP framework. Although these methodologies create associations between inverted low-light images and the principles of atmospheric scattering, their main emphasis is on the enhancement of global luminance. Unlike current techniques, our approach incorporates prior constraints on transmittance and atmospheric light to generate a more accurate initial estimation of reflectance. Compared to Retinex-based methods, ASM-based approaches offer greater operational flexibility, as they allow explicit modeling and adjustment of spatially varying transmittance and atmospheric light, enabling more precise control over the enhancement process.
2.3. Deep Learning-Based Methods
Deep learning-based methods [30,31] have shown great promise in low-light and non-uniform illumination enhancement [32,33]. Wang et al. [34] introduced a deep illumination network that iteratively estimates residuals between low-light and normal-light images using multiple illumination back-projection modules, effectively reconstructing low-contrast images via feature aggregation. Similarly, Xu et al. [35] proposed a frequency-based model for image decomposition and enhancement, followed by a network designed to suppress noise and boost high-frequency details.
However, most CNN-based approaches require paired training data for supervised learning, making them sensitive to specific datasets and limiting their generalizability. To address this, Jiang et al. introduced EnlightenGAN [36], an unsupervised generative adversarial network trained without paired images. Guo et al. [37] further proposed Zero-DCE—a zero-reference enhancement network employing a non-reference loss function—thus reducing overfitting risks. Additionally, Wang et al. developed an unsupervised low-light enhancement model based on an improved CycleGAN with AdaIN and guided filtering [38].
Despite these advances, data-driven methods remain constrained by the availability of training datasets, limiting their applicability in diverse real-world scenarios.
3. Proposed Method
In this section, we present an enhanced optimization model based on the Non-Uniform Illumination Compensation and demonstrate the existence of its solution. The proposed model integrates a weighted map designed to effectively address luminance discrepancies resulting from non-uniform illumination in remote sensing images, while its constraint terms promote efficient noise reduction. We subsequently focus on the refined solution methodology for the initial reflectance matrix , which is estimated utilizing the ASM. This method improves reflectance estimation and detail preservation by using atmospheric priors. Compared to Retinex or other illumination estimation methods, our approach fully leverages multiple priors from the degraded image to ensure that the implicitly estimated maintains stronger robustness under both extremely high and low illumination conditions.
3.1. A Novel Robust Non-Uniform Illumination Compensation-Based Model
Non-uniform low-light conditions pose a significant challenge due to overexposure in bright regions and the inherently ill-posed problem of directly estimating reflectance and illumination. To overcome these issues, we propose an enhanced Non-uniform Illumination Compensation model that incorporates a weighted brightness map and a noise regularization term. Our method uses an iterative optimization scheme to alternately update the reflectance, weighted brightness map, and noise components. Initially, the reflectance map is estimated via the Atmospheric Scattering Model to preserve fine image details, as described in the following sections.
Let be an open bounded subset of the two-dimensional real domain . We decompose this image into a reflectance function r: . Based on this, we construct a new weighting function , such that the bright image can be expressed as . The proposed method is based on the following assumptions:
Assumption 1.
Let Ω be an open and bounded subset . Its associated enhanced image can be composed by , where , and satisfies the Lipschitz condition on , where is a constant, is set as the initial enhanced image, and are fixed-parameter matrices, satisfying . The computation of these two parameters is described in the model (10). Consider the energy functional given as follows:
where , , and be user-defined weights that balance the contributions of each term in our model. We integrate total variation regularization [39] into the weight matrix to enforce smoothness and suppress noise gradients. Brightness rebalancing across the image is achieved by alternately updating the weighting function and reflectance map. To maintain fidelity to the initial estimate, we include a squared-residual consistency term and introduce an explicit noise component. The noise constraint matrix is formulated to antagonize image structure, ensuring that noise is concentrated in homogeneous regions without degrading edges. Although the optimization problem is not globally convex—occasionally yielding suboptimal local minima—the feasible solution space is rigorously defined by the theory of bounded variation [40].
Definition 1.
The space of bounded variation functions is defined as the space of real-valued functions such that the total variation is as follows:
Equation (3) is finite, where denotes the divergence operator. Then, is a Banach space with a norm.
Alternatively, the feasible set is defined as follows:
The minimization problem corresponding to (2) is formulated as . We then prove that a solution to the above problem exists:
Theorem 1.
Given Assumption 1, problem (2) admits at least one solution.
Proof.
First, let , then . Since , and . Then . Then inf E is bounded. Suppose is a minimizing sequence of problem and there exists a constant M > 0 such that , i.e.,
Based on our assumption , , are uniformly bounded both in and , we can conclude that and is uniformly bounded in Therefore, up to a sub-sequence, taking as an example, the cases for and follow analogously.
Given that and , we have in Additionally, it holds that and , where exist, therefore
Owing to the lower semi-continuity of the and norms, we have, for a suitable subsequence, taking term as an example, the cases for and follow analogously as follows:
Since , {} is also bounded in . Together with , it is bounded in . By the lower semi-continuity of and the chain rule, we have the following:
Combining (7) and (8) together on a suitable sub-sequence, we have
□
Therefore, is a minimizer of the problem, concluding the proof. However, due to the lack of strict convexity, uniqueness cannot be guaranteed, and multiple local optima may exist.
Considering that RGB images consist of three distinct channels, we address the optimization problem for each channel independently. Given that images are commonly represented in matrix form in applications, the matrix representation of the optimization problem can be articulated as follows:
The symbol ∘ denotes the element-wise product across all color channels, while indicates element-wise division. The degradation of low-light images is a multifaceted process. To enhance denoising, our model assumes noise within the , and this prevents from amplifying noise. In an ideal scenario, represents the intrinsic physical properties of the object, which remain constant regardless of varying lighting conditions.
Previous research has predominantly concentrated on the smoothness of reflectance [21,41,42] utilizing post-processing gamma correction to enhance brightness. In contrast, our methodology directly influences by modifying the scaling factor . This adjustment can be interpreted as an element-wise scaling operation on , resulting in a non-uniform enhancement of the reflectance. The mask matrix Z takes on higher values in regions with rich textures and high illumination, ensuring that noise is primarily concentrated in areas with low illumination and weak texture. Furthermore, the noise estimation in our approach is also non-uniform; our assumption regarding is predicated on the fact that noise is more pronounced in the low-light areas, which aligns with the characteristics of the camera, where noise in these regions is more susceptible to amplification. The matrix selects information from the important regions of the image and offsets the effect of regular term, thereby ensuring that the regularization does not apply smoothing to these critical regions, and matrices do not participate in iteration, the setting of its values will be introduced later. Figure 2 illustrates the flowchart of our proposed method.
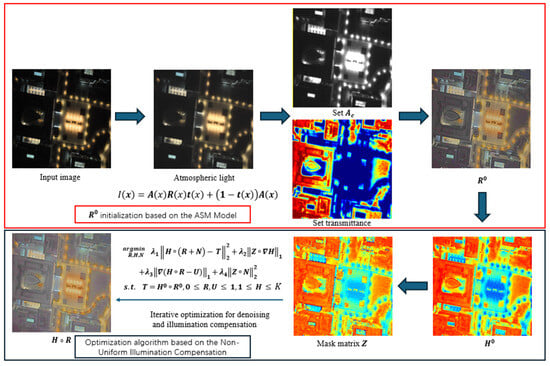
Figure 2.
The flowchart delineates the proposed methodology, emphasizing two primary elements: the initialization of the reflectance map (red block diagram) and the optimization of illumination compensation (black block diagram). The initialization phase of employs the ASM to adjust for atmospheric light and transmission effects. Following this, illumination compensation and denoising optimization are performed based on our Non-Uniform Illumination Compensation (10).
3.2. An Alternative Updating Scheme
In the subsequent discussion, we propose an alternating scheme that iteratively estimates the weighting map , noise , and reflectance , one by one. The proposed algorithm utilizes a sparse matrix to convert all operations into element-wise multiplication of matrices, thereby enhancing optimization and computational efficiency. Here denotes the sparse matrix operator corresponding to , signifies the vectorized representation of . The vectorized variables appear only after the sparse diagonal matrix. This design aims to transform matrix convolution into sparse matrix multiplication, thereby optimizing computational complexity and facilitating iterative operations.
Specifically, the sub-problem for each variable during the -th iteration is as follows:
The half-quadratic splitting (HQS) technique [43] is utilized to address the sub-problems. Next, we will delineate the processes involved in resolving each of these sub-problems.
Solving the -problem: Problem (11) can be expressed as follows:
denotes the illumination-weighted matrix. The initial component constitutes the iterated fidelity term, while the subsequent variational term ensures the relative smoothness of the -weighted matrix. Additionally, the third term constrains its impact on the image gradients. The iterative HQS method is employed for the -problem as follows:
Solving the -problem:
Since the optimization primarily focuses on the quality of the enhanced image, we first treat the enhanced image as a matrix variable and optimize it iteratively. Subsequently, the new weighting map is used to iteratively update . In this optimization term, the variational component constrains the gradient texture in regions that are uniform and exhibit lower pixel values, thereby enhancing the smoothness and natural appearance of these areas. Let :
The HQS updates for the and the subproblem proceed as follows.
Here, is a sparse matrix with unit diagonal elements. The purpose is to use the iteratively updated to solve for and subsequently update . Then, is updated by
Solution to -problem: The HQS iterations for the subproblem are as follows:
The initial term guarantees that the combined sum of the noise matrix and the reflectance matrix closely resembles the original image. In the subsequent regularization term, the mask matrix imposes a constraint on the resulting noise component, ensuring that it primarily arises from regions of low values within matrix . This approach is consistent with the typical noise generation patterns identified in standard imaging systems. The solution for the matrix is as follows:
Configuration of the and matrix.
In order to distinguish between textured regions and noisy homogeneous areas, this study develops an adaptive masking matrix utilizing superpixel segmentation. Specifically, the initial reflectance component is divided into multiple superpixels ), with each superpixel containing pixels. The masking matrix is calculated independently for each color channel. For a specific superpixel in color channel , the corresponding masking matrix is defined as follows:
In this context, denotes the variation within the superpixel block for the color channel . This formulation allocates higher masking values to regions with a small dynamic range and low mean intensity, thereby imposing more stringent gradient constraints. Conversely, regions that are textured, possess a small area, exhibit high variation, and have a high mean intensity are assigned lower masking values, which allows to remain more aligned with the . This approach mitigates the gradient constraint on significant textured areas. Consequently, is defined as follows:
3.3. Initialization for and Based on ASM
In order to tackle the issues associated with sparse detail features and inconsistent illumination and transmittance in extensive remote sensing imagery, this study utilizes the ASM to enhance the estimation of the initial reflectance component matrix, denoted as . Specifically, through a thorough analysis of the ASM and the recalibration of atmospheric light and transmittance, we are able to effectively process low-light images, resulting in a more precise estimation of . This methodology outperforms conventional techniques in preserving critical color information in extremely low-light environments. It is important to note that the primary objective of the initialization process is to comprehensively extract image details rather than to perform denoising. Consequently, the model undergoes further optimization following the resolution of based on the ASM, thereby ensuring a synergistic relationship between the two processes.
Low-light remote sensing images are generally characterized by reduced transmittance and increased scattering effects during the imaging process. The extensive spatial coverage and uneven illumination inherent result in non-uniform atmospheric light and transmittance, which can be effectively described using the ASM. By compensating for the atmospheric light and transmittance matrices, a more informative reflectance matrix, denoted as , can be derived. The noise components in the reflectance matrix are temporarily not separated. The ASM model can represent a low-illumination image as follows:
In , represents the known degraded image, while denotes the transmittance matrix. Under low-light conditions, the atmospheric light matrix is typically not a constant matrix. To derive an initial estimation of atmospheric light, we draw upon atmospheric light estimation techniques commonly used in image dehazing methods [44]. We utilize guided filtering, with being a small constant typically set at 0.1. Given the presence of multiple unknown variables, we treat as a function of and and perform a monotonicity analysis for each individual variable.
Partial Derivative of with respect to :
In the context of the partial derivative presented in (24), it is consistently observed that the value is less than or equal to zero. Consequently, a decrease in corresponds to an increase in , which serves to enhance the pixel values within that specific channel. By resetting the original to , a uniform illumination of each color channel is achieved, thereby improving the overall color representation of the scene and accentuating intricate details. This process facilitates the extraction of the detailed reflectance matrix of the image. It is noteworthy that a larger value of results in a reduction of , while simultaneously enhancing the global contrast. Conversely, a smaller value of leads to an increase in , which may, however, induce saturation in areas that are overexposed. Taking these factors into account, we propose the design of as follows:
In the equation, represents the color channel, and the first term ensures that the is appropriately sized while preserving critical image information. The second term aims to establish acceptable values for the overexposed regions in low-light remote sensing images, effectively mitigating overexposure. Typically, the size of the Gaussian blur kernel is configured to 10 and set to 0.5.
Partial Derivative of with respect to :
Through experiments, we found that the initialized atmospheric light satisfies in the vast majority of image regions. Consequently, in regions exhibiting relatively low illumination within the original image, it is essential to enhance the transmittance. This adjustment aims to compensate for the non-uniformity in transmittance and to ensure the accurate retrieval of reflectance values.
The transformation of (23) results in an equation pertaining to . To ensure that is invariant across color channels, the matrices in (27) are defined in two dimensions. We then modify the denominator of (27) based on the assumption that regions with low pixel intensities and limited dynamic range require stronger transmittance enhancement to emphasize texture details. Accordingly, the denominator in (27), which includes the unknown term , is reformulated as follows:
is a relatively small constant that directly determines the overall level of the transmission rate, thereby affecting both the image illumination and contrast. In this work, we set . The block size used in ASD computation determines the granularity of the estimation. Larger blocks reduce computational complexity but also decrease the ability to distinguish between different regions. To balance accuracy and efficiency, we adopt an adaptive partitioning strategy based on the image size, where the height and width of each block are set to one-fiftieth of the corresponding dimensions of the original image. In regions characterized by lower illumination, a reduced numerator results in an elevated value of . Furthermore, denotes the Gaussian blur kernel, which guarantees that exhibits smoothness within its local vicinity, thereby conforming to physical properties. The parameter is a minor constant, conventionally assigned a value of 0.1. This parameter is introduced to enforce a lower bound on the transmission matrix , thereby preventing excessively small values that could lead to numerical instability in matrix computations.
At this juncture, both the transmittance function and the new atmospheric light have been determined. Utilizing the transformation outlined in (23), the enhanced solution for the initial transmittance matrix is as follows:
We introduce as the prior for to eliminate unintended solutions, ensuring that the optimization of in (10) converges towards . Our method can be interpreted as an element-wise scaling operation on , resulting in non-uniform enhancement. The initial is determined based on the global underexposure value and the local exposure value of the image, ensuring that brightness enhancement is applied non-uniformly across pixels. For estimating the global exposure value, we use the mean of as the criterion, as outlined below.
Let denote the total number of pixels present in the image; the local exposure value is determined as follows:
In this context, denotes the Gaussian blur kernel. The Gaussian blur kernel G is employed to ensure smooth transitions in the image’s weighted map, thereby preventing artifacts and ring-like distortions, and enhancing the robustness of the algorithm. This process yields the local exposure matrix , which serves to alleviate unnatural lighting discrepancies among objects, thereby minimizing the incidence of artifacts. We refine the ratio between the global underexposure value and the local exposure value to ascertain . Ultimately, the initial weighting map is estimated as follows:
Here, the parameter is used to distinguish between high- and low-illumination regions and to establish a baseline that ensures stronger illumination compensation in low-light areas. To enhance robustness across varying lighting conditions, is set to 0.5. the parameter determines the baseline for illumination compensation. A higher value of provides stronger compensation but may cause the overall image to appear overly bright or washed out. To ensure adequate enhancement in low-illumination regions while preserving color fidelity in high-illumination areas, is generally set to a relatively small value. In our experiments, it is set to 0.15.
Algorithm 1 presents the core technical procedure of the proposed algorithm.
| Algorithm 1 Algorithm for image enhancement |
| Input: Input image , initialized parameters. 1. Initialize via (29); 2. Initialize via (32); 3. Initialize: via (21); 4. Initialize: via (22); 5. For to maxiter do 6. Update via (15); 7. Update via (17); 8. Update via (18); 9. Update via (20); 10. End for Output: Enhanced image . |
4. Experiments
Our experimental evaluation comprises three phases. First, we describe the experimental setup. Second, we perform ablation studies to evaluate the key components of the proposed methodology. Finally, we compare our approach with alternative methods through qualitative and quantitative analyses and discuss the results.
4.1. Experimental Settings
(1) Datasets: We employed a low-light remote sensing dataset based on the iSAID benchmark [45]. To improve realism, we applied a non-uniform illumination reduction that simulates the complex lighting variations encountered in challenging environments, creating the dataset iSAID-dark2. Furthermore, we validated our method on the real-world low-light remote sensing dataset Darkrs. Both datasets have been extensively employed in various studies focused on remote sensing image enhancement [45,46]. Moreover, to evaluate the generalization capabilities of our model for low-light images across diverse scenarios, we assessed its performance on several widely recognized datasets, including DICM [6], MEF [47], Exdark [48], and LOL [49]. Our evaluation utilizes datasets from both remote sensing and non-remote sensing domains, encompassing natural outdoor scenes and typical environments. Non-remote sensing datasets—such as aerial sky imagery and low-light indoor scenes—further assess the generalization capability of the proposed algorithm. Moreover, these datasets are organized into reference and non-reference categories, enabling comprehensive comparisons of algorithm performance via diverse evaluation metrics.
(2) Hardware Configuration: The methodology was executed utilizing the MATLAB 2022b platform. The hardware configuration comprised 16 GB of RAM and an Intel Core i7 CPU. The comparative analysis of the CNN methods was conducted on a system equipped with an NVIDIA RTX 4070 Ti GPU.
(3) Parameter settings: In our experiments, and are both set to 1, is set to 0.5, and is set to 0.3. The values of , and are all set to 3. Mask matrix are initialized by .
4.2. Ablation Study
In order to systematically assess the efficacy of the ASM model initialization and the denoising optimization process, we undertook a series of ablation studies. These investigations concentrated on critical elements of the initialization, including the term within and the parameter in . Furthermore, we demonstrated that both the initialization and the model optimization are essential for enhancing image quality. Ultimately, we validated the denoising performance of the model optimization and its capacity for generalization across various scenarios through rigorous experimental evaluation.
(1) Ablation study on parameter in : In low-light remote sensing images, numerous overexposed regions exist, making their handling particularly critical. Based on theoretical analysis, we introduce the term in the initialization of to effectively suppress reflectance in high-exposure areas. As illustrated in Figure 3b–g, an increase in the parameter b leads to a significant reduction in the enhancement of overexposed regions, while enhancing the overall contrast of the image. The extremum constraint imposed on ensures that the suppression of illumination enhancement in darker areas is kept to a minimum. When the parameter exceeds 0.7, the suppression effect becomes significant, adversely affecting the global illumination. Based on these observations, we have established the value of b at 0.5 for our experimental procedures.
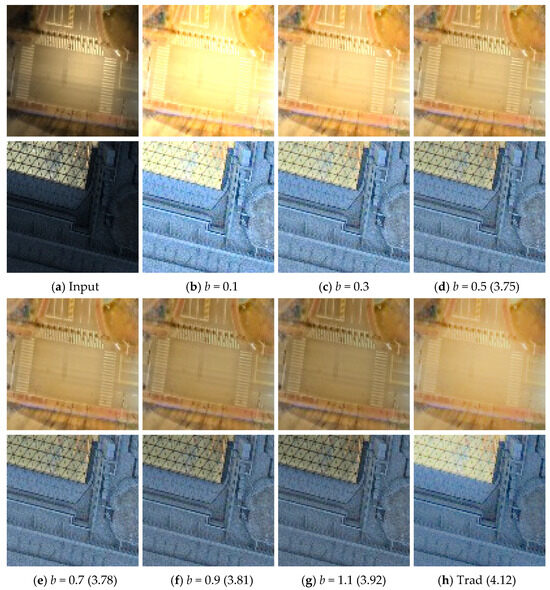
Figure 3.
Ablation study on the parameter in using the darkrs dataset. (a) Original image; (b–g) visualizations of the initial matrix obtained by varying the parameter ; (h) restored by the Retinex-based method LIME [19]. The values represent the NIQE index. Increasing reduces overexposure but can suppress dark region enhancement.
(2) Ablation study on parameter in : The parameter serves to alleviate the impact of non-uniform illumination through localized compensation in the transmittance matrix. As shown in Figure 4, a smaller value of results in an increase in overall transmittance, which subsequently elevates global illumination levels. As shown in Figure 4b–g, the transmission rate gradually decreases with the increase of the parameter value, effectively preserving the color contrast in key textured regions. As observed in Figure 4f–g, higher parameter values lead to pronounced luminance differentiation within the textured areas. The function exhibits relatively low values in areas of low illumination, and the fractional formulation of ensures that the transmittance in these regions remains close to “1”. As illustrated in Figure 4b–g, to achieve a balance between global illumination and local contrast, we set . In comparison to the conventional method shown in Figure 4h, which estimates , our initialization-based reflectance estimation demonstrates enhanced detail, particularly in the overexposed regions.
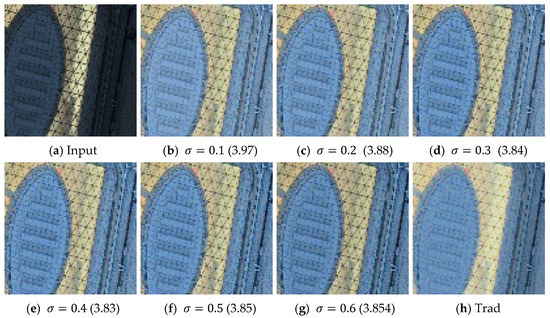
Figure 4.
Ablation study on the parameter in using the darkrs dataset. (a) Original image; (b–g) visualizations of the initial matrix obtained by varying the parameter ; (h) restored by Retinex-based method LIME. The values represent the NIQE index. With the increase of parameter, contrast in high-illumination and textured regions is noticeably enhanced, while overall image brightness shows a decreasing trend.
(3) Ablation study on ASM-based initialization and model optimization: Figure 5 presents an ablation study on two key components: ASM-based initialization and subsequent model optimization. Panel (a) uses traditional HE, and (b) applies Retinex-based methods; both fail to preserve detail in overexposed or extremely dark regions. In contrast, our initialization (c) better extracts fine structures under non-uniform illumination. Comparing (c) and (d), model optimization significantly improves denoising while maintaining texture integrity, as confirmed by the residual map in (e). The initialization emphasizes local detail extraction, especially under low light, while the matrix compensates for global illumination. These components complement each other, resulting in effective noise suppression and balanced illumination enhancement.
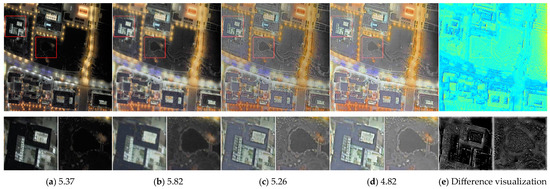
Figure 5.
Ablation study on ASM-based initialization and model optimization using the darkrs dataset. (a) Restored by the HE-based method BPDHE [14]; (b) restored by Retinex-based method LIME; (c) Our ; (d) Our after model optimization. The values represent the NIQE index. (e) Color-coded difference map, where blue indicates lower and red indicates higher differences.
(4) Ablation study on the denoising effectiveness of Model Optimization: In Figure 6, we present an ablation study examining the denoising efficacy of model optimization, utilizing two noisy images from the LOL dataset. As illustrated in panel (b), the noise is primarily concentrated in the uniform regions of the images, which is consistent with the assumptions underlying our model design concerning and the mask matrix . The findings indicate that model optimization effectively facilitates denoising. The mask matrix effectively inhibits denoising and smoothing in textured regions, resulting in substantial enhancements in the quantitative metrics of SSIM, PSNR, and NIQE. This study further underscores the generalization capability of the proposed algorithm.
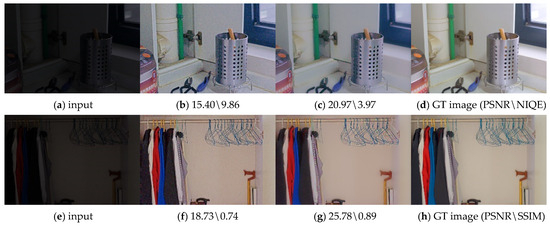
Figure 6.
Ablation study on the denoising performance of model optimization using the LOL dataset. (a,e) Image from the LOL dataset; (b,f) ; (c,g) Our after model optimization; (d,h) GT image from the LOL dataset.
(5) Robustness evaluation of the denoising module: As shown in Figure 5 and Figure 6, Figure 5 demonstrates that illumination compensation and noise removal primarily target homogeneous regions within the image. In contrast, high-texture areas—such as the magnified regions in Figure 5e—retain high-frequency details and sharp edges, with minimal differences observed in features like building edges and window areas. The magnified regions in Figure 5 and the water surface in Figure 6 contain relatively high-density natural noise. The comparisons across these images confirm that the proposed method does not introduce over-smoothing or distortion, and it maintains strong robustness under significant noise levels, with minimal impact on enhancement performance.
4.3. Comparison with State-of-the-Art Methods
(1) Comparison method: We performed both quantitative and visual comparative assessments to evaluate the efficacy of our approach relative to several established methods in the LLIE domain. Due to the unavailability of training codes for some state-of-the-art LLIE methods, the selected comparison methods include ALSM [50], Brain [8], Robust [21], Star [51], Dual [52], Scl [53], Stable [54], LIE [11], IAT [55], RUAS [56], and Zero [37]. Due to the limited availability of non-uniform low-light remote sensing samples, we selected a subset of the iSAID-dark2 dataset as the training set to fine-tune our learning-based models. Experimental results are reported through both qualitative and quantitative analyses.
(2) Evaluation Metrics: In the context of parameterized datasets that include ground truth (GT) images, we employ several evaluation metrics, namely Peak Signal-to-Noise Ratio (PSNR) [57], Structural Similarity Index (SSIM) [58], Visual Information Fidelity (VIF) [59], and locally restricted standard deviation (LRSD) [50]. Notably, VIF is particularly advantageous for evaluating the retention of image information in relation to human visual perception, which is critical for LLIE. The LRSD metric serves to effectively quantify noise amplification in low-light image enhancement, thereby providing a comprehensive evaluation.
For unparameterized datasets, we use NIQE [60], PIQE [61], Bright [50], and CEIQ [62] to assess image quality. Brightness quantifies illumination enhancement and overall image appearance, while the CEIQ index measures global contrast. However, no-reference metrics can overlook perceptual quality, so higher no-reference scores do not necessarily indicate better visual quality.
(3) Qualitative Evaluation: A comparative analysis of the iSAID-dark2 dataset Table 1 shows that the ALSM method enhances detail contrast but struggles with non-uniform illumination and provides insufficient noise suppression. The Brain method also underperforms in both noise reduction and brightness enhancement. Although the Robust method achieves the strongest denoising, it over-smooths the image, degrading fine details—this is evident in the reduced contrast of ground-class lines in Figure 7. Learning-based techniques generally handle non-uniform illumination well, yet their limited generalization leads to color distortion in certain regions (e.g., the vehicle in Figure 7 appears grayish). The STAR method substantially improves image contrast but does not produce uniform illumination. In contrast, our proposed method effectively suppresses noise while preserving significant image details, thereby markedly improving overall image quality and eliminating color distortion.

Table 1.
Quantitative results from Figure 7.
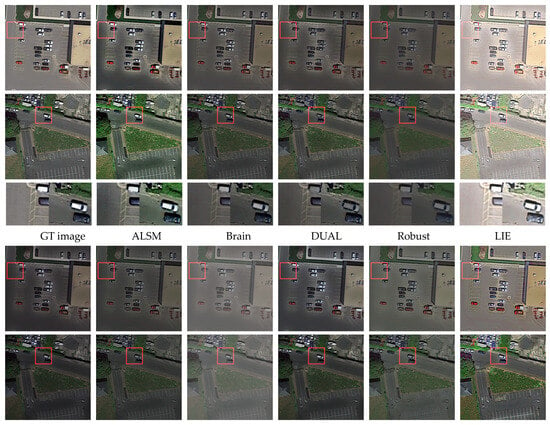
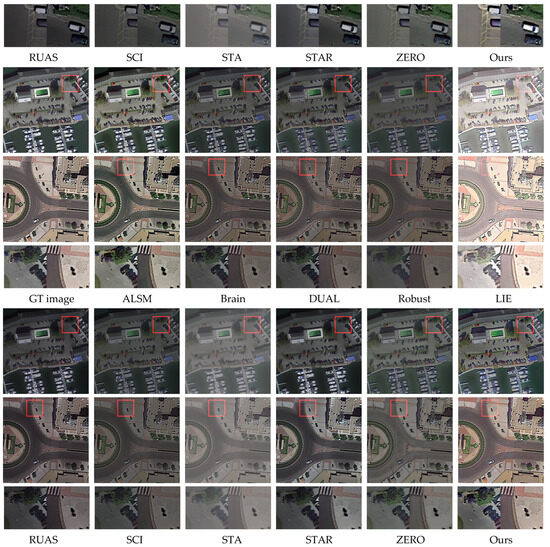
Figure 7.
Comparison of enhancement results on images from the iSAID-dark2 dataset.
On the darkrs dataset, we assessed each method’s performance in noise suppression and correction of non-uniform illumination. Table 2 presents the comparison results of quantitative metrics. It can be seen that the proposed algorithm consistently ranks among the top two across these metrics.The ALSM method effectively improves local contrast but exhibits poor denoising capability. Among learning-based methods, most demonstrate strong performance in addressing illumination inconsistency—STA performs best in this regard, whereas RUAS underperforms. LIE frequently results in overexposure, while ZERO, SCL, and DUAL leave visible noise artifacts, particularly on the lake surface shown in Figure 8. STAR shows weak performance in illumination correction. Although the Robust method increases overall brightness, it excessively smooths the image, leading to a loss of fine detail. In comparison, our method achieves both effective noise removal and preservation of image detail, while also delivering well-balanced global illumination.

Table 2.
Quantitative results from Figure 8.
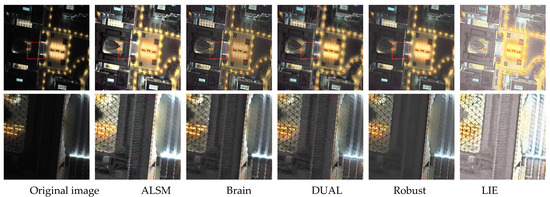
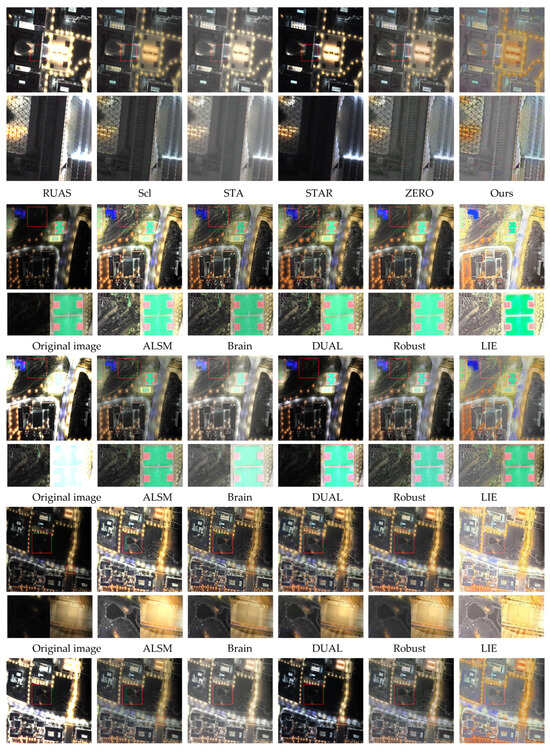
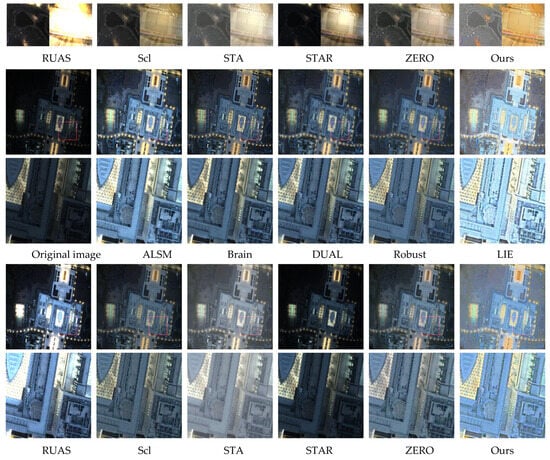
Figure 8.
Third comparison of enhancement results on images from the darkrs dataset.
In the evaluation of non-remote sensing image datasets (DICM, MEF, Exdark), we primarily assessed the generalization ability of our proposed algorithm. Table 3 shows the comparison results of quantitative metrics. It can be observed that the proposed algorithm performs well across these metrics.The first image in Figure 9 demonstrates the effectiveness of our algorithm in processing sky regions. Compared to other methods, our approach more accurately handles the land-sea boundary without introducing visible artifacts. The magnified section further illustrates how our method effectively addresses non-uniform low-light conditions in non-remote sensing scenarios, significantly improving both illumination and image contrast. The final image in Figure 9 showcases the denoising and detail-preserving capabilities of our method.

Table 3.
Quantitative results from MEF and other datasets.

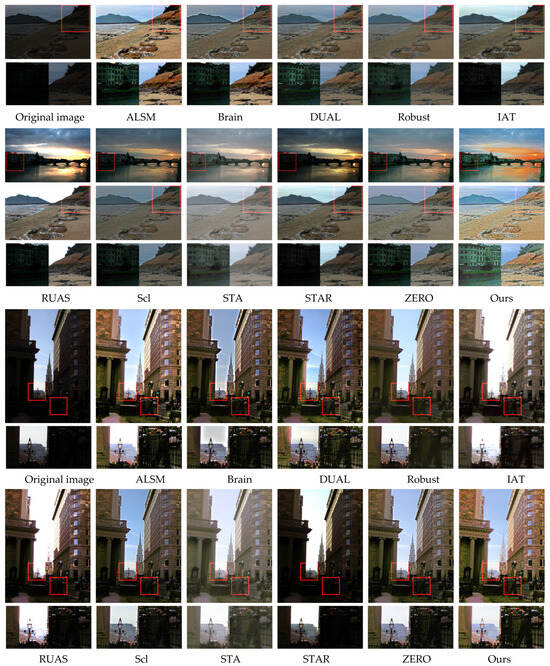
Figure 9.
Comparison of enhancement results on images from the non-remote sensing dataset (MEF and other datasets).
To further evaluate the denoising capability and generalization performance of our method across diverse scenes, we conducted experiments on the LOL dataset, as shown in Figure 10. Table 4 presents the comparison results of quantitative metrics. Although the proposed algorithm does not achieve top performance across all metrics, it attains the best result in terms of SSIM.The experimental results clearly highlight the method’s proficiency in noise suppression, as well as its effectiveness in maintaining textures and preserving edge details. Although our approach may not fully match the performance of leading learning-based algorithms in certain localized regions, it consistently delivers high reconstruction fidelity, robust denoising, and reliable edge preservation overall.
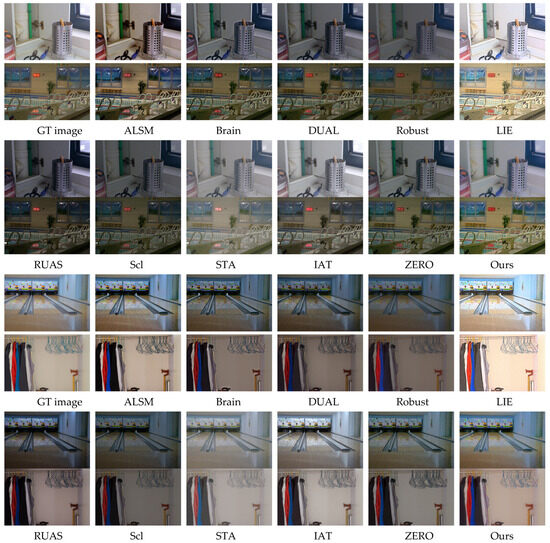
Figure 10.
Comparison of enhancement results on images from the LOL dataset.

Table 4.
Quantitative results from LOL dataset.
(4) Quantitative Evaluation: The proposed method exhibits strong performance across a variety of datasets, excelling in noise suppression, detail preservation, and correction of non-uniform illumination. On the iSAID-dark2 dataset, it achieves the highest PSNR and SSIM scores, along with a significant improvement in VIF, reflecting effective denoising and structural consistency. On darkrs, it ranks among the top two methods, successfully balancing global illumination enhancement with texture preservation, while avoiding artifacts caused by over-denoising. Although its NIQE scores on non-remote sensing datasets (such as DICM, MEF, and Exdark) are not the highest, the method still demonstrates competitive results in noise reduction and detail restoration. On the LOL dataset, elevated SSIM and LRSD values further affirm its generalization ability. Moreover, the consistently improved Bright index across datasets highlights its effectiveness in global illumination compensation. As shown in Table 1, Table 2, Table 3 and Table 4, these results collectively validate the robustness and wide applicability of the proposed approach for enhancing low-light images.
(5) Discussion of Computational Complexity
The computational complexity of the proposed algorithm is approximately linear with respect to both image size and the number of iterations (t), resulting in an overall complexity of . The algorithm leverages sparse matrix representations for the gradient operators and avoids costly Fourier transforms, significantly reducing the computational burden per iteration.
Each iteration involves three main subproblems: (1): the subproblem incorporates sparse gradient constraints and diagonal matrix operations, requiring approximately 12 mn operations; (2) the subproblem applies gradient regularization, with about 9 mn operations; and (3) the subproblem solves a weighted least-squares problem, costing around 5 mn operations.
In addition to the iterative process, the initialization phase (which includes estimation of , , and using the ASM model) provides strong priors, accelerating convergence. In practice, the algorithm converges within only three iterations, leading to approximately 8.2 × 10⁷ operations for a 1024 × 1024 image. To evaluate practical applicability, Table 5 compares the average computation time of our method and 12 existing approaches across four different image resolutions. Notably, for 1500 × 1500 high-resolution remote sensing images, our method takes 92.35 s, which is significantly faster than several model-based methods such as ALSM (112.19 s) and Robust (141.14 s), and comparable to SOTA approaches such as Brain (75.54 s) and STAR (98.65 s), as shown in Table 5.

Table 5.
Comparison of computation time (seconds).
We also measured the model’s inference performance in terms of parameter count and FLOPs (floating-point operations per second). Our model requires approximately 0.18 million parameters and 4.6 GFLOPs for a 1024 × 1024 image, which is substantially lower than most learning-based counterparts, making it highly efficient and lightweight.
The efficient convergence, low memory overhead, and avoidance of GPU dependency make the proposed method highly suitable for deployment in real-world or resource-constrained environments, particularly for medium-to-high-resolution remote sensing applications. Future work will explore combining our optimization-based framework with lightweight deep learning modules to further improve performance while maintaining computational efficiency.
(6) Parameter sensitivity analysis
In the parameter sensitivity analysis, we first consider the regularization coefficients to , which are associated with different regularization terms in the model optimization. Specifically, corresponds to the fidelity term, and controls the weighting map. Variations in these two parameters have a limited impact on image quality. In contrast, and are noise regularization coefficients that directly determine the degree of denoising. A smaller value restricts the denoising effect, while a larger value may lead to over-smoothing, thereby degrading image quality. These parameters are carefully determined through extensive experiments, as illustrated in Figure 11.
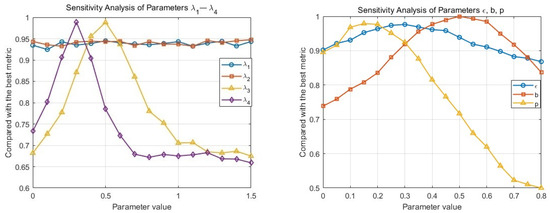
Figure 11.
Parameter sensitivity analysis. The horizontal axis indicates the selected parameter values, while the vertical axis represents the ratio between the PSNR corresponding to each parameter setting and the maximum PSNR value.
In addition, several other parameters exhibit notable sensitivity. For instance, the parameters and directly influence the magnitude of the illumination compensation weighting map, making them highly sensitive. These values are set based on iterative tuning across multiple images. Furthermore, the parameter b controls the suppression of enhancement in over-exposed regions. Excessive suppression can negatively affect visual performance, indicating that demonstrates moderate sensitivity. We have summarized the roles of the important parameters in Table 6.

Table 6.
Key parameters and their functions.
(7) Discussion on Limitations
The primary limitation of the proposed method lies in its lack of parameter adaptivity. Currently, several key parameters are empirically determined based on representative images from the selected datasets through experimental tuning. Some of these parameters, such as and , are set based on experience. While the chosen values yield satisfactory enhancement performance and robustness across the tested datasets, they may present limitations when applied to images from diverse and unseen scenarios. Therefore, a major direction for future improvement is to introduce adaptive parameter selection mechanisms that adjust parameter values based on the characteristics of different scenes, thereby enhancing the generalizability of the method. Additionally, parameters with low sensitivity, such as and , can be fixed to reduce computational complexity. Consequently, future work will focus on enhancing parameter adaptivity and improving the overall efficiency of the model.
5. Conclusions
This paper introduces a remote sensing image enhancement model grounded in the Atmospheric Scattering Model, specifically tailored for non-uniform low-light conditions. In the initial stage of reflectance estimation, the model integrates an atmospheric scattering framework and employs a compensation strategy to refine atmospheric light and transmittance, yielding a more accurate initial reflectance matrix. During the illumination enhancement phase, a novel weighted map is utilized to effectively recalibrate regions with uneven lighting, thereby achieving balanced overall brightness. Additionally, smoothing and denoising operations contribute to a more natural visual appearance. Extensive experimental results demonstrate that the proposed method outperforms existing techniques across multiple datasets, with distinct advantages in remote sensing scenarios. Although the algorithm benefits from rapid convergence and improved computational efficiency via the use of sparse operators, it remains less efficient than most CNN-based approaches. Therefore, we suggest that variational methods and CNNs are not inherently conflicting but instead offer complementary strengths. With ongoing advancements in deep unfolding techniques, variational loss formulations, and plug-and-play methodologies, CNNs guided by variational principles hold strong potential for enabling more structured, interpretable, data-efficient, and high-performing solutions. Given the demonstrated effectiveness of our approach for non-uniform low-light enhancement, future work will focus on further integrating deep learning with variational frameworks to boost both performance and efficiency, enhancing the overall practicality of the system.
Author Contributions
Methodology, X.Z.; software, X.Z.; writing—original draft preparation, X.Z., M.L., and T.N.; writing—review and editing, C.H. and L.H. All authors have read and agreed to the published version of the manuscript.
Funding
This work was supported by the National Natural Science Foundation of China (No. 62105328).
Data Availability Statement
Due to the nature of this research, participants of this study did not agree for their data to be shared publicly; therefore, the supporting data are not available.
Acknowledgments
We thank the anonymous reviewers for their valuable comments and suggestions.
Conflicts of Interest
The authors declare no conflicts of interest.
References
- Zhang, J.; Lei, J.; Xie, W.; Li, Y.; Yang, G.; Jia, X. Guided hybrid quantization for object detection in remote sensing imagery via one-to-one self-teaching. IEEE Trans. Geosci. Remote Sens. 2023, 61. [Google Scholar] [CrossRef]
- Zhang, Y.-f.; Zheng, J.; Li, L.; Liu, N.; Jia, W.; Fan, X.; Xu, C.; He, X. Rethinking feature aggregation for deep RGB-D salient object detection. Neurocomputing 2021, 423, 463–473. [Google Scholar] [CrossRef]
- Chen, F.; Chen, X.; Van de Voorde, T.; Roberts, D.; Jiang, H.; Xu, W. Open water detection in urban environments using high spatial resolution remote sensing imagery. Remote Sens. Environ. 2020, 242, 111706. [Google Scholar] [CrossRef]
- Brum-Bastos, V.; Long, J.; Church, K.; Robson, G.; de Paula, R.R.; Demšar, U.K. Multi-source data fusion of optical satellite imagery to characterize habitat selection from wildlife tracking data. Ecol. Inform. 2020, 60, 101149. [Google Scholar] [CrossRef]
- Zhang, Q.; Levin, N.; Chalkias, C.; Letu, H.; Liu, D. Nighttime light remote sensing: “Monitoring human societies from outer space. In Remote Sensing Handbook, Volume VI; CRC Press: Boca Raton, FL, USA, 2024; pp. 381–421. [Google Scholar]
- Lee, C.; Lee, C.; Kim, C.-S. Contrast enhancement based on layered difference representation of 2D histograms. IEEE Trans. Image Process. 2013, 22, 5372–5384. [Google Scholar] [CrossRef] [PubMed]
- Zhang, L.; Shen, P.; Peng, X.; Zhu, G.; Song, J.; Wei, W.; Song, H. Simultaneous enhancement and noise reduction of a single low-light image. IET Image Process. 2016, 10, 840–847. [Google Scholar] [CrossRef]
- Cai, R.; Chen, Z. Brain-like retinex: A biologically plausible retinex algorithm for low light image enhancement. Pattern Recognit. 2023, 136, 109195. [Google Scholar] [CrossRef]
- Wang, R.; Zhang, Q.; Fu, C.-W.; Shen, X.; Zheng, W.-S.; Jia, J. Underexposed photo enhancement using deep illumination estimation. In Proceedings of the IEEE/CVF Conference on Computer Vision and Pattern Recognition, Long Beach, CA, USA, 15–20 June 2019; pp. 6849–6857. [Google Scholar]
- Wang, Y.n.; Jiang, Z.; Liu, C.; Li, K.; Men, A.; Wang, H.; Chen, X. Shedding light on images: Multi-level image brightness enhancement guided by arbitrary references. Pattern Recognit. 2022, 131, 108867. [Google Scholar] [CrossRef]
- Fu, Z.; Yang, Y.; Tu, X.; Huang, Y.; Ding, X.; Ma, K.-K. Learning a simple low-light image enhancer from paired low-light instances. In Proceedings of the IEEE/CVF Conference on Computer Vision and Pattern Recognition, Vancouver, BC, Canada, 17–24 June 2023; pp. 22252–22261. [Google Scholar]
- Ma, L.; Ma, T.; Liu, R.; Fan, X.; Luo, Z. Toward fast, flexible, and robust low-light image enhancement. In Proceedings of the IEEE/CVF Conference on Computer Vision and Pattern Recognition, New Orleans, LA, USA, 18–24 June 2022; pp. 5637–5646. [Google Scholar]
- Coltuc, D.; Bolon, P.; Chassery, J.-M. Exact histogram specification. IEEE Trans. Image Process. 2006, 15, 1143–1152. [Google Scholar] [CrossRef]
- Ibrahim, H.; Kong, N.S.P. Brightness preserving dynamic histogram equalization for image contrast enhancement. IEEE Trans. Consum. Electron. 2007, 53, 1752–1758. [Google Scholar] [CrossRef]
- Jobson, D.J.; Rahman, Z.-u.; Woodell, G.A. A multiscale retinex for bridging the gap between color images and the human observation of scenes. IEEE Trans. Image Process. 1997, 6, 965–976. [Google Scholar] [CrossRef]
- Ma, J.; Fan, X.; Ni, J.; Zhu, X.; Xiong, C. Multi-scale retinex with color restoration image enhancement based on Gaussian filtering and guided filtering. Int. J. Mod. Phys. B 2017, 31, 1744077. [Google Scholar] [CrossRef]
- Wang, S.; Zheng, J.; Hu, H.-M.; Li, B. Naturalness preserved enhancement algorithm for non-uniform illumination images. IEEE Trans. Image Process. 2013, 22, 3538–3548. [Google Scholar] [CrossRef] [PubMed]
- Fu, X.; Zeng, D.; Huang, Y.; Liao, Y.; Ding, X.; Paisley, J. A fusion-based enhancing method for weakly illuminated images. Signal Process. 2016, 129, 82–96. [Google Scholar] [CrossRef]
- Guo, X.; Li, Y.; Ling, H. LIME: Low-light image enhancement via illumination map estimation. IEEE Trans. Image Process. 2016, 26, 982–993. [Google Scholar] [CrossRef]
- Ying, Z.; Li, G.; Gao, W. A bio-inspired multi-exposure fusion framework for low-light image enhancement. arXiv 2017, arXiv:1711.00591. [Google Scholar]
- Li, M.; Liu, J.; Yang, W.; Sun, X.; Guo, Z. Structure-revealing low-light image enhancement via robust retinex model. IEEE Trans. Image Process. 2018, 27, 2828–2841. [Google Scholar] [CrossRef]
- Fu, X.; Zeng, D.; Huang, Y.; Zhang, X.-P.; Ding, X. A weighted variational model for simultaneous reflectance and illumination estimation. In Proceedings of the IEEE Conference on Computer Vision and Pattern Recognition, Las Vegas, NV, USA, 27–30 June 2016; pp. 2782–2790. [Google Scholar]
- Gu, Z.; Li, F.; Lv, X.-G. A detail preserving variational model for image Retinex. Appl. Math. Model. 2019, 68, 643–661. [Google Scholar] [CrossRef]
- Jia, F.; Wong, H.S.; Wang, T.; Zeng, T. A reflectance re-weighted retinex model for non-uniform and low-light image enhancement. Pattern Recognit. 2023, 144, 109823. [Google Scholar] [CrossRef]
- Wang, W.; Yan, D.; Wu, X.; He, W.; Chen, Z.; Yuan, X.; Li, L. Low-light image enhancement based on virtual exposure. Signal Process. Image Commun. 2023, 118, 117016. [Google Scholar] [CrossRef]
- Yu, S.-Y.; Zhu, H. Low-illumination image enhancement algorithm based on a physical lighting model. IEEE Trans. Circuits Syst. Video Technol. 2017, 29, 28–37. [Google Scholar] [CrossRef]
- He, K.; Sun, J.; Tang, X. Single image haze removal using dark channel prior. IEEE Trans. Pattern Anal. Mach. Intell. 2010, 33, 2341–2353. [Google Scholar] [PubMed]
- Zhang, X.; Shen, P.; Luo, L.; Zhang, L.; Song, J. Enhancement and noise reduction of very low light level images. In Proceedings of the 21st International Conference on Pattern Recognition (ICPR2012), Tsukuba, Japan, 11–15 November 2012; pp. 2034–2037. [Google Scholar]
- Jiang, X.; Yao, H.; Zhang, S.; Lu, X.; Zeng, W. Night video enhancement using improved dark channel prior. In Proceedings of the 2013 IEEE International Conference on Image Processing, Melbourne, Australia, 15–18 September 2013; pp. 553–557. [Google Scholar]
- Wei, X.; Lin, X.; Li, Y. DA-DRN: A degradation-aware deep Retinex network for low-light image enhancement. Digit. Signal Process. 2024, 144, 104256. [Google Scholar] [CrossRef]
- Wang, M.; Li, J.; Zhang, C. Low-light image enhancement by deep learning network for improved illumination map. Comput. Vis. Image Underst. 2023, 232, 103681. [Google Scholar] [CrossRef]
- Al Sobbahi, R.; Tekli, J. Comparing deep learning models for low-light natural scene image enhancement and their impact on object detection and classification: Overview, empirical evaluation, and challenges. Signal Process. Image Commun. 2022, 109, 116848. [Google Scholar] [CrossRef]
- Tang, H.; Zhu, H.; Fei, L.; Wang, T.; Cao, Y.; Xie, C. Low-illumination image enhancement based on deep learning techniques: A brief review. Photonics 2023, 10, 198. [Google Scholar] [CrossRef]
- Wang, L.-W.; Liu, Z.-S.; Siu, W.-C.; Lun, D.P. Lightening network for low-light image enhancement. IEEE Trans. Image Process. 2020, 29, 7984–7996. [Google Scholar] [CrossRef]
- Xu, K.; Yang, X.; Yin, B.; Lau, R.W. Learning to restore low-light images via decomposition-and-enhancement. In Proceedings of the IEEE/CVF Conference on Computer Vision and Pattern Recognition, Seattle, WA, USA, 13–19 June 2020; pp. 2281–2290. [Google Scholar]
- Jiang, Y.; Gong, X.; Liu, D.; Cheng, Y.; Fang, C.; Shen, X.; Yang, J.; Zhou, P.; Wang, Z. Enlightengan: Deep light enhancement without paired supervision. IEEE Trans. Image Process. 2021, 30, 2340–2349. [Google Scholar] [CrossRef]
- Guo, C.; Li, C.; Guo, J.; Loy, C.C.; Hou, J.; Kwong, S.; Cong, R. Zero-reference deep curve estimation for low-light image enhancement. In Proceedings of the IEEE/CVF Conference on Computer Vision and Pattern Recognition, Seattle, WA, USA, 13–19 June 2020; pp. 1780–1789. [Google Scholar]
- Tang, G.; Ni, J.; Chen, Y.; Cao, W.; Yang, S.X. An improved CycleGAN-based model for low-light image enhancement. IEEE Sens. J. 2023, 24, 21879–21892. [Google Scholar] [CrossRef]
- Rudin, L.I.; Osher, S.; Fatemi, E. Nonlinear total variation based noise removal algorithms. Phys. D Nonlinear Phenom. 1992, 60, 259–268. [Google Scholar] [CrossRef]
- Giusti, E.; Williams, G.H. Minimal Surfaces and Functions of Bounded Variation; Springer: Berlin/Heidelberg, Germany, 1984; Volume 80. [Google Scholar]
- Park, S.; Yu, S.; Moon, B.; Ko, S.; Paik, J. Low-light image enhancement using variational optimization-based retinex model. IEEE Trans. Consum. Electron. 2017, 63, 178–184. [Google Scholar] [CrossRef]
- Ren, X.; Yang, W.; Cheng, W.-H.; Liu, J. LR3M: Robust low-light enhancement via low-rank regularized retinex model. IEEE Trans. Image Process. 2020, 29, 5862–5876. [Google Scholar] [CrossRef] [PubMed]
- Geman, D.; Yang, C. Nonlinear image recovery with half-quadratic regularization. IEEE Trans. Image Process. 1995, 4, 932–946. [Google Scholar] [CrossRef] [PubMed]
- Han, J.; Zhang, S.; Fan, N.; Ye, Z. Local patchwise minimal and maximal values prior for single optical remote sensing image dehazing. Inf. Sci. 2022, 606, 173–193. [Google Scholar] [CrossRef]
- Xing, L.; Qu, H.; Xu, S.; Tian, Y. CLEGAN: Toward low-light image enhancement for UAVs via self-similarity exploitation. IEEE Trans. Geosci. Remote Sens. 2023, 61, 1–14. [Google Scholar] [CrossRef]
- Yao, Z.; Fan, G.; Fan, J.; Gan, M.; Chen, C.P. Spatial-frequency dual-domain feature fusion network for low-light remote sensing image enhancement. IEEE Trans. Geosci. Remote Sens. 2024, 62. [Google Scholar] [CrossRef]
- Ma, K.; Zeng, K.; Wang, Z. Perceptual quality assessment for multi-exposure image fusion. IEEE Trans. Image Process. 2015, 24, 3345–3356. [Google Scholar] [CrossRef]
- Loh, Y.P.; Chan, C.S. Getting to know low-light images with the exclusively dark dataset. Comput. Vis. Image Underst. 2019, 178, 30–42. [Google Scholar] [CrossRef]
- Wei, C.; Wang, W.; Yang, W.; Liu, J. Deep retinex decomposition for low-light enhancement. arXiv 2018, arXiv:1808.04560. [Google Scholar]
- Wang, Y.-F.; Liu, H.-M.; Fu, Z.-W. Low-light image enhancement via the absorption light scattering model. IEEE Trans. Image Process. 2019, 28, 5679–5690. [Google Scholar] [CrossRef]
- Xu, J.; Hou, Y.; Ren, D.; Liu, L.; Zhu, F.; Yu, M.; Wang, H.; Shao, L. Star: A structure and texture aware retinex model. IEEE Trans. Image Process. 2020, 29, 5022–5037. [Google Scholar] [CrossRef] [PubMed]
- Zhang, Q.; Nie, Y.; Zheng, W.S. Dual illumination estimation for robust exposure correction. Comput. Graph. Forum 2019, 38, 243–252. [Google Scholar] [CrossRef]
- Liang, D.; Li, L.; Wei, M.; Yang, S.; Zhang, L.; Yang, W.; Du, Y.; Zhou, H. Semantically contrastive learning for low-light image enhancement. In Proceedings of the AAAI Conference on Artificial Intelligence, Online, 22 February–1 March 2022; pp. 1555–1563. [Google Scholar]
- Zhang, F.; Li, Y.; You, S.; Fu, Y. Learning temporal consistency for low light video enhancement from single images. In Proceedings of the IEEE/CVF Conference on Computer Vision and Pattern Recognition, Nashville, TN, USA, 20–25 June 2021; pp. 4967–4976. [Google Scholar]
- Cui, Z.; Li, K.; Gu, L.; Su, S.; Gao, P.; Jiang, Z.; Qiao, Y.; Harada, T. You only need 90k parameters to adapt light: A light weight transformer for image enhancement and exposure correction. arXiv 2022, arXiv:2205.14871. [Google Scholar]
- Liu, R.; Ma, L.; Ma, T.; Fan, X.; Luo, Z. Learning with nested scene modeling and cooperative architecture search for low-light vision. IEEE Trans. Pattern Anal. Mach. Intell. 2022, 45, 5953–5969. [Google Scholar] [CrossRef]
- Wang, Z.; Simoncelli, E.P.; Bovik, A.C. Multiscale structural similarity for image quality assessment. In Proceedings of the Thrity-Seventh Asilomar Conference on Signals, Systems & Computers, Pacific Grove, CA, USA, 9–12 November 2003; pp. 1398–1402. [Google Scholar]
- Lai, W.-S.; Huang, J.-B.; Hu, Z.; Ahuja, N.; Yang, M.-H. A comparative study for single image blind deblurring. In Proceedings of the IEEE Conference on Computer Vision and Pattern Recognition, Las Vegas, NV, USA, 27–30 June 2016; pp. 1701–1709. [Google Scholar]
- Han, Y.; Cai, Y.; Cao, Y.; Xu, X. A new image fusion performance metric based on visual information fidelity. Inf. Fusion 2013, 14, 127–135. [Google Scholar] [CrossRef]
- Zhang, L.; Zhang, L.; Bovik, A.C. A feature-enriched completely blind image quality evaluator. IEEE Trans. Image Process. 2015, 24, 2579–2591. [Google Scholar] [CrossRef]
- Venkatanath, N.; Praneeth, D.; Bh, M.C.; Channappayya, S.S.; Medasani, S.S. Blind image quality evaluation using perception based features. In Proceedings of the 2015 Twenty First National Conference on Communications (NCC), Mumbai, India, 27 February–1 March 2015; pp. 1–6. [Google Scholar]
- Yan, J.; Li, J.; Fu, X. No-reference quality assessment of contrast-distorted images using contrast enhancement. arXiv 2019, arXiv:1904.08879. [Google Scholar]
Disclaimer/Publisher’s Note: The statements, opinions and data contained in all publications are solely those of the individual author(s) and contributor(s) and not of MDPI and/or the editor(s). MDPI and/or the editor(s) disclaim responsibility for any injury to people or property resulting from any ideas, methods, instructions or products referred to in the content. |
© 2025 by the authors. Licensee MDPI, Basel, Switzerland. This article is an open access article distributed under the terms and conditions of the Creative Commons Attribution (CC BY) license (https://creativecommons.org/licenses/by/4.0/).