Article

Comprehensive Validation of MODIS-MAIAC Aerosol Products and Long-Term Aerosol Detection over an Urban–Rural Area Around Rome in Central Italy

by
Valentina Terenzi
1,
Patrizio Tratzi
1,*,
Valerio Paolini
1,
Antonietta Ianniello
1,
Francesca Barnaba
2 and
Cristiana Bassani
1
1
IIA-CNR, Institute of Atmospheric Pollution Research, Italian National Research Council, 00010 Rome, Italy
2
ISAC-CNR, Institute of Atmospheric Sciences and Climate, Italian National Research Council, 00133 Rome, Italy
*
Author to whom correspondence should be addressed.
Remote Sens. 2025, 17(12), 2051; https://doi.org/10.3390/rs17122051
Submission received: 30 April 2025 / Revised: 2 June 2025 / Accepted: 6 June 2025 / Published: 14 June 2025
(This article belongs to the Section Environmental Remote Sensing)

Abstract

Aerosols play a crucial role in air quality, climate regulation, and public health; their timely monitoring is hence fundamental. The aerosol optical depth (AOD) is the parameter used to investigate the spatial–temporal distribution of aerosols from space. Specifically, the AOD retrieved from the Multi-Angle Implementation of Atmospheric Correction (MAIAC) algorithm applied to a Moderate Resolution Imaging Spectroradiometer (MODIS) is suitable for aerosol investigation at a local scale by exploiting its high spatial resolution (1 km × 1 km). In this study, the MAIAC AOD retrieval over Rome (Italy) was validated for the first time, using ground-based data provided by an AERONET station operating in a semi-rural environment close to the city, over a time series from January 2001 to December 2022. Moreover, AOD trends were evaluated in a study area encompassing Rome and its surroundings, characterized by a transition zone between urban and rural environments. The results show a general underestimation of the MAIAC AOD; specifically, the validation process highlighted the less accurate performance of the algorithm under higher aerosol loading and with predominantly coarse mode aerosol. Interesting results were obtained concerning the influence of the geometrical configuration of satellite acquisition on the accuracy of the MAIAC product. In particular, the solar zenith angle, the relative azimuth and the scattering angle between the principal plane of the sun and satellite synergistically influence retrievals. Finally, the spatial distribution of the AOD shows a decreasing trend over the 2001–2022 period and a strong influence of the city of Rome over the whole study area.

1. Introduction

According to the European Environmental Agency [1], the air quality in Europe is improving, but air pollution is still the largest environmental health risk in specific hotspots, exceeding the European Union (EU) air quality standards [2]. Aerosol or particulate matter (PM) can contribute to worsening air quality. In fact, exposure to PM has been associated with health effects, such as premature death, heart disease, stroke, diabetes, chronic obstructive pulmonary disease, lung cancer and asthma [3]. In addition, aerosols are also responsible for environmental and climate effects. They contribute to acid deposition; soiling; damage to vegetation, materials and buildings; and increased at-ground ozone (O3) levels. They also affect Earth’s energy balance directly by scattering and absorbing solar and infrared radiation in the atmosphere, leading to either cooling or warming depending on their variable chemical and physical properties, and, indirectly, influencing cloud formation and lifetime [4].
Human exposure to air pollution mainly occurs in urban and industrial areas [3,5] or in populated rural areas where anthropogenic pollution sources (e.g., agriculture and farming) can be relevant. In general, aerosol sources can be both anthropogenic and natural. Fuel combustion in commercial, public and residential buildings was the main source of anthropogenic aerosol in Europe in 2022, accounting for about 62% of the total emissions, followed by manufacturing and extractive industry (about 13%), road transport (about 12%), waste (about 8%), energy supply (about 3%) and agriculture (3%) [6]. The major natural sources are wind-blown desert dust plumes, volcanic dust, products of forest fires, bioaerosols and sea spray, which can be significant in coastal areas and during specific seasonal periods [7]. Due to the multitude of sources and the relatively short lifetime of aerosols in the atmosphere, accurate aerosol knowledge is necessary to evaluate their spatial–temporal variability and assess their exposures and effects on the environmental and human health.
In Italy, air quality monitoring and assessment are mostly based on measurements collected by Regional Environmental Protection Agencies (ARPAs) acting within the National Environment Protection System (SNPA) and operating according to EU and Italian legislation [2]. However, the network of in situ stations is not sufficiently widespread to provide a detailed and wide characterization of the spatial distribution, especially within and around urban agglomerates and rural regions with spread emission sources. Satellite-based Earth Observation can be a potential tool to complement the in situ observations for air quality evaluations, with the main advantages of providing long-term and consistent datasets at a wider scale. Depending on the instrument and retrieval approach, the spatial resolution of atmospheric satellite products varies in a broad range of 1 to 50 km.
Most spectrometers onboard satellites that detect air pollution are polar-orbiting (e.g., MODIS, VIIRS, MISR, POLDER, and TROPOMI), although recent (GOES-16) and upcoming (Sentinel 4) geostationary satellites offer the potential for finer temporal resolution (e.g., GOES-16 provides aerosol data over the US every 15 min). There are also developments aimed at directly linking satellite-based detection of pollution and health impacts. This is the case of the MAIA (Multi-Angle Imager for Aerosols) mission, an upcoming joint initiative of NASA and the ASI (Italian Space Agency) that is explicitly designed to quantify the health impacts of different aerosol types. The upcoming MAIA instrument builds upon the legacy of MISR [8], thus combining multispectral, polarimetric and multi-angular capabilities to map total and speciated PM at a neighbourhood scale over a selected set of target areas and urban centers around the world.
Currently, the datasets derived from the Moderate Resolution Imaging Spectroradiometer (MODIS) sensor aboard the Earth Observing System (EOS) TERRA and AQUA platforms are among the most frequently used for satellite-based aerosol evaluation. In particular, the MODIS aerosol optical depth (AOD), an Essential Climate Variable [3,9], has been used to investigate the spatial–temporal distribution of aerosols from the local to regional and global scale [10,11,12,13,14,15,16]. Three operational algorithms (i.e., Dark Target (DT) over land [17], DT over ocean [18], and Deep Blue (DB) [19]) supply AOD products with a resolution of 10 km or 3 km; thus, they are suitable for investigating the regional to global scale. A fourth, more recent algorithm, the Multi-Angle Implementation of Atmospheric Correction (MAIAC) [20,21,22], is providing products with a spatial resolution of 1 km; thus, it is able to resolve the finer scale necessary for local studies, for example, within urban and surrounding areas.
Given the high resolution, the MAIAC AOD is suitable for air quality studies involving local emission sources in simple or complex matrixes and spectrally heterogeneous areas, such as urban areas, due to the constraints of surface reflectance during atmospheric retrieval [23,24]. Air quality studies using satellite products and focusing on a local geographical scale are mostly focused on urban areas, neglecting the surrounding areas, which can be made up of distinct environments (e.g., agricultural, forested, coastal, etc.) and have specific and characteristic emission sources. Recently, MAIAC products have been used to characterize the atmospheric pollution in urban areas and their surroundings, highlighting the changes affected by the growing urbanization of the last decades by exploiting their high spatial resolution. This specific trend must be understood and considered to plan transition policies aimed at long-term sustainable development, as reported in [4], and to move towards the ‘zero pollution’ action plan of the new European Green Deal.
Several previous studies have already documented the potential of MAIAC retrieval. Mhawish et al. (2019) showed promising results of MAIAC in detecting the AOD with the finest spatial resolution obtained over multiple surface typologies and different aerosol types and loadings [25]. In Di Antonio et al. (2023), the MAIAC AOD has been used to investigate the contribution of urban aerosol loading in 21 European cities compared to regional background values. The results highlighted that the AOD at city-scale does not necessarily surpass the regional AOD because of specific losses or inhomogeneity of the regional background regarding emission sources [26]. Similar results are reported in [27], where the AOD was found to be decreasing in Moscow because of urban pollution regulation, while in the surrounding area, there was an increase in the AOD because of growing anthropic activities. The high resolution of MAIAC products also allows for better characterization of the spatial–temporal distribution of aerosol emissions over an orographically complex area to assess their impact on ecosystems [28]. Few studies are going beyond providing the spatial distribution of the aerosol types identified by microphysical and optical properties. Addressing the aerosol field over Cordoba (Argentina), Della Ceca et al. (2018) solved the high values of biomass burning aerosols in late winter and spring, exploiting MAIAC AOD values, reporting that the high AOD from August to October mostly originated from the rural/agricultural area around the city. On the contrary, from November to February, the urban aerosol component was found to be dominant with a significant mineral dust component [29]. In Pandey et al. (2024), agglomerates have shown that the AOD is higher in the urban core, where absorbing aerosol is predominant, than in the surroundings, while aerosol size does not change with area type [30].
These results suggested the necessity to increase the knowledge of the impact of urban areas on their surroundings, and vice versa, specifically using the city of Rome and its surroundings as a model case study, as there is no suitable monitoring station network in the mixed area surrounding the city. Overall, satellite-derived AOD measurements, particularly from the MAIAC algorithm, provide continuous, high-resolution observations complementing ground-based monitoring networks. However, validation of satellite products is a required step to ensure the robustness of the dataset that will then be used. This validation is usually performed by matching up satellite data with ground-based AERONET (Aerosol Robotic Network) data [31].
All this considered, the aim of this study is to evaluate the performance of MAIAC AOD retrievals in a complex urban–rural transition environment comprising the urban area of Rome and its surroundings in Italy. Moreover, the MODIS-MAIAC record was used to investigate long-term aerosol trends over the targeted area. More specifically, the main objectives of this research are as follows:
  • Validate MAIAC AOD over 20 years using AERONET ground-based observations, to assess retrieval accuracy and biases related to the MODIS geometrical configuration of acquisition and the size and loading of aerosols.
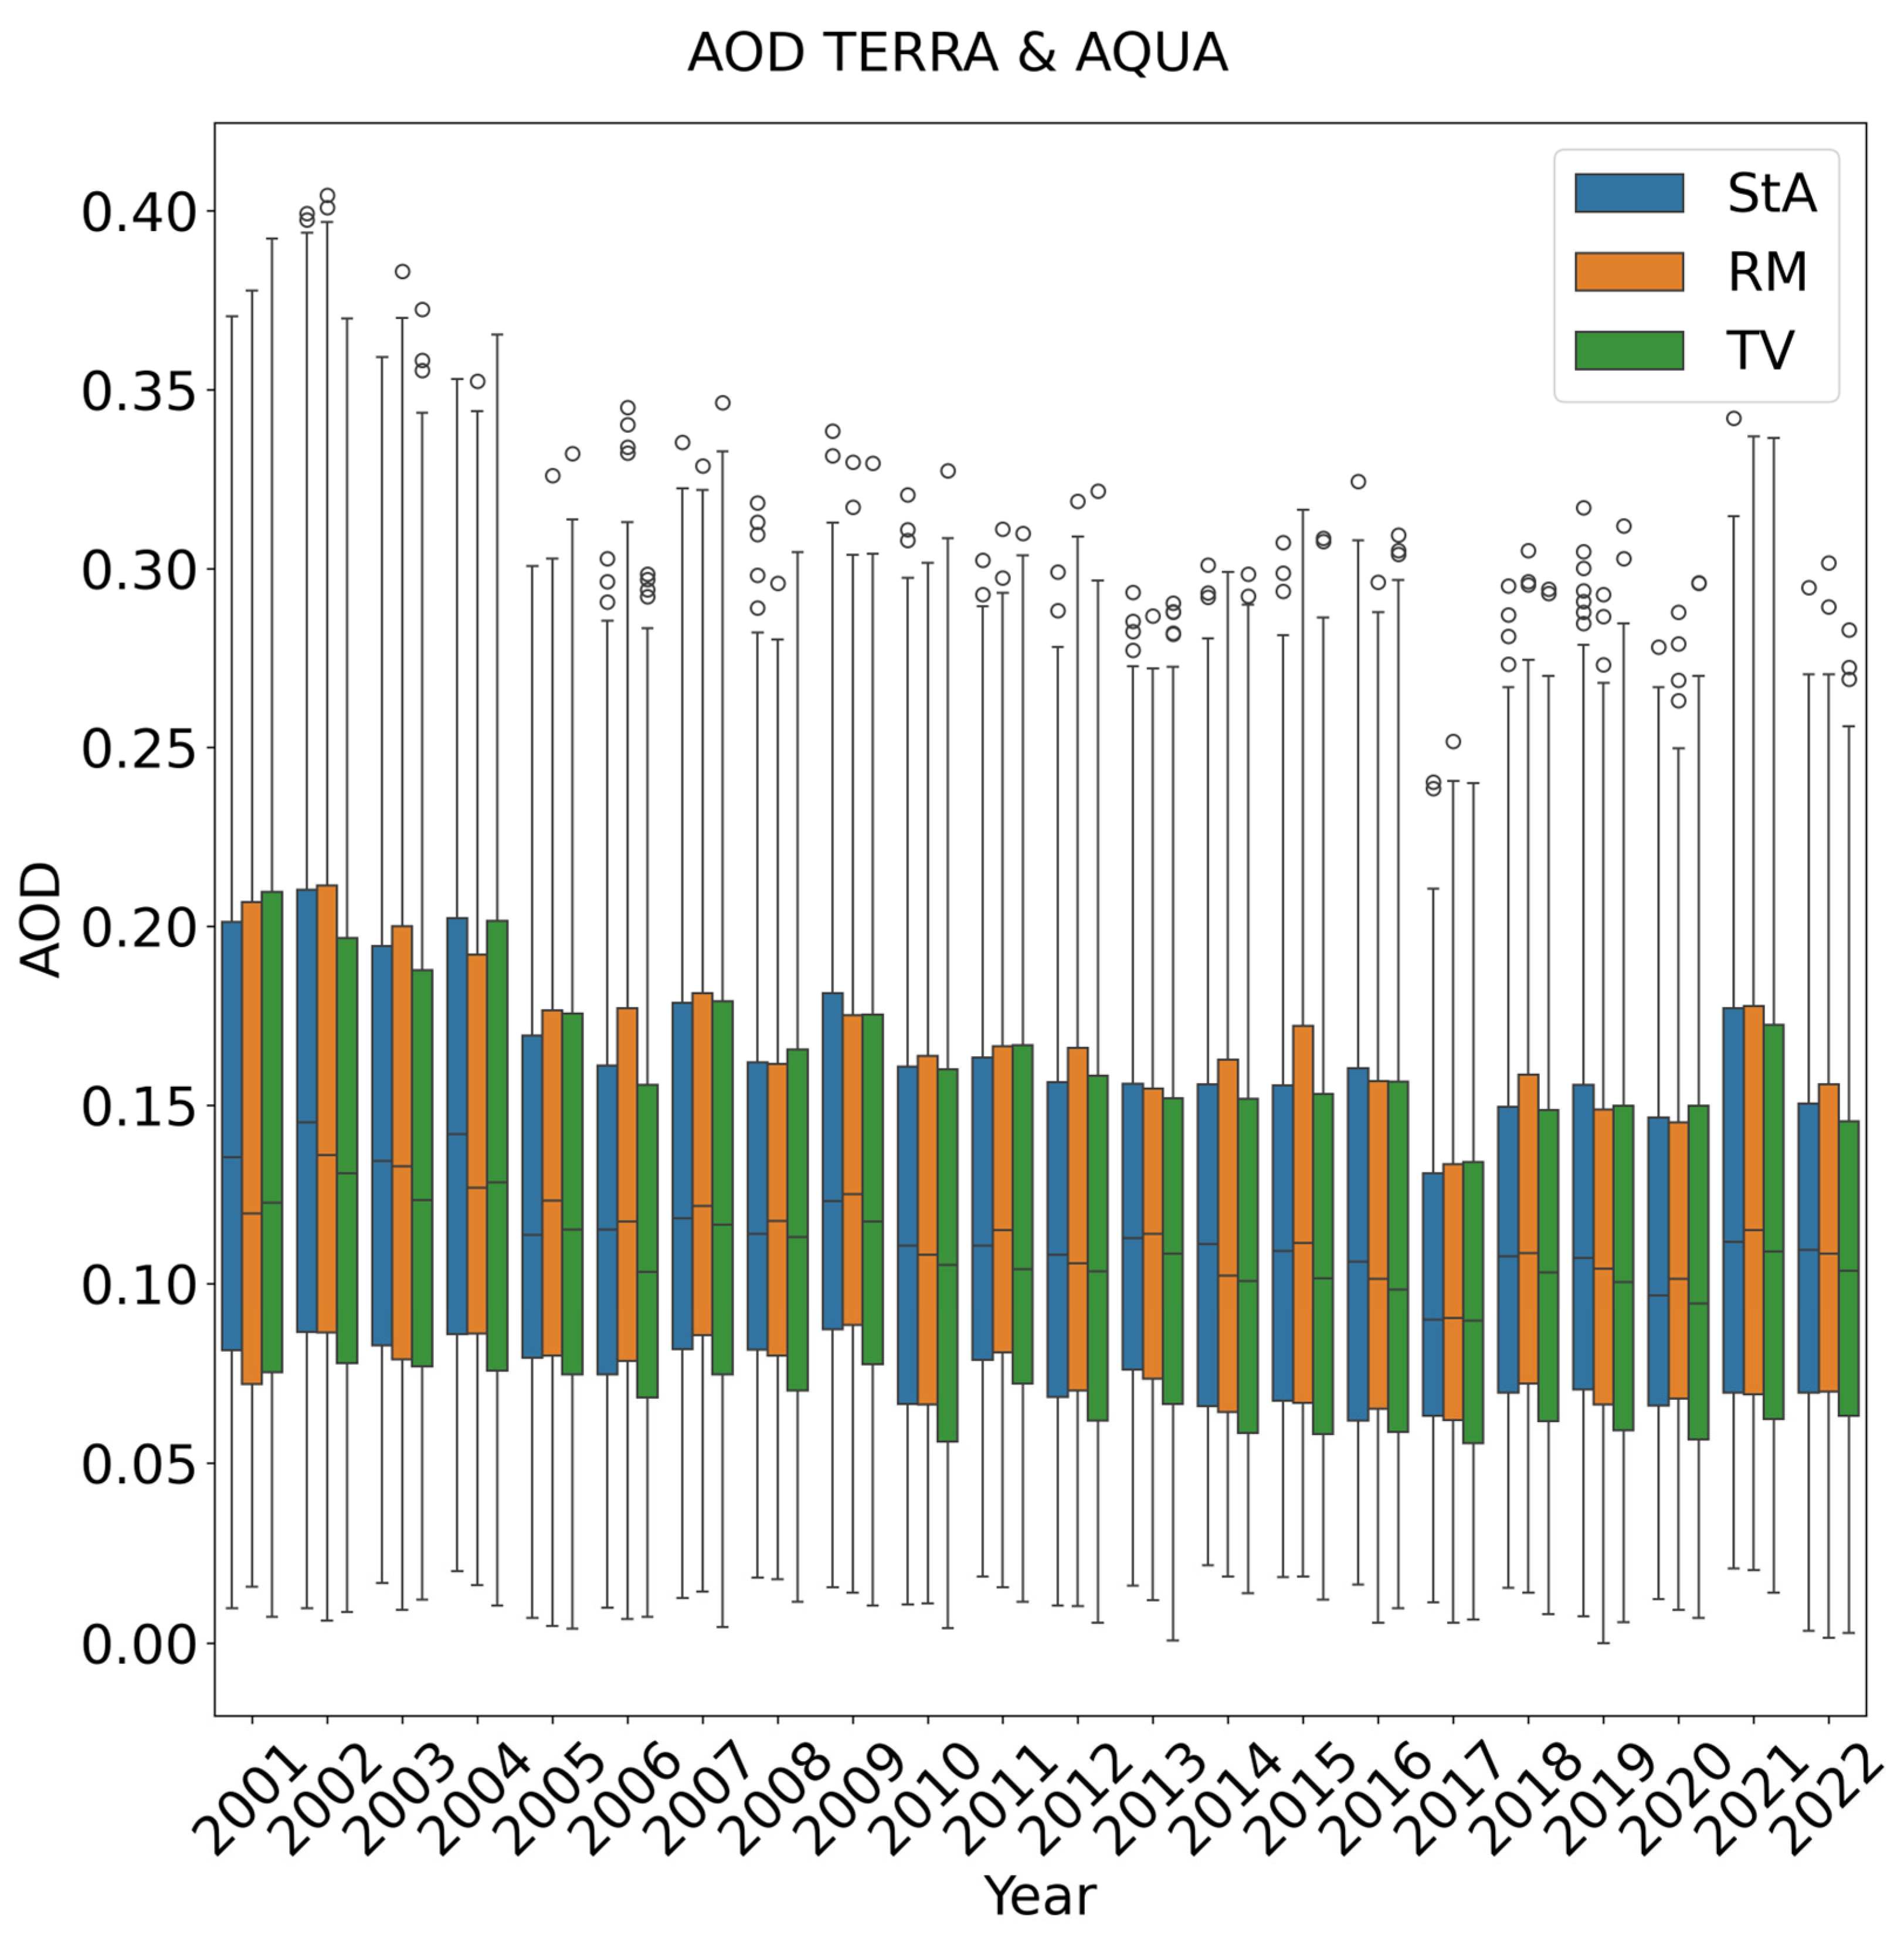
  • Analyze AOD variation over two decades (2001–2022) in Rome and its surroundings to evaluate changes in aerosol levels and their potential drivers.
  • Assess local emission sources in selected sub-areas on the aerosol loads through the satellite-based Local-to-Regional Ratio.
To achieve these objectives, AOD MAIAC data were compared to long-term AOD data available from the Rome_Tor_Vergata AERONET station operating since 2001 within the atmospheric observatory of the Institute of Atmospheric Science and Climate (ISAC) of the National Research Council (CNR) in the neighborhood of Tor Vergata, at the southeastern edge of the city of Rome. During the validation process, potential geometric constraints or dependencies of the AOD retrieval on the aerosol loading and particle size were explored. The influence of meteorological parameters on AOD loadings was also evaluated. Furthermore, the temporal and spatial variation in the AOD was examined in Rome and the urban–rural transition zone along the southern part of the Tiber Valley. Finally, changes in the influence of the city on its surroundings and vice versa were assessed.

2. Materials and Methods
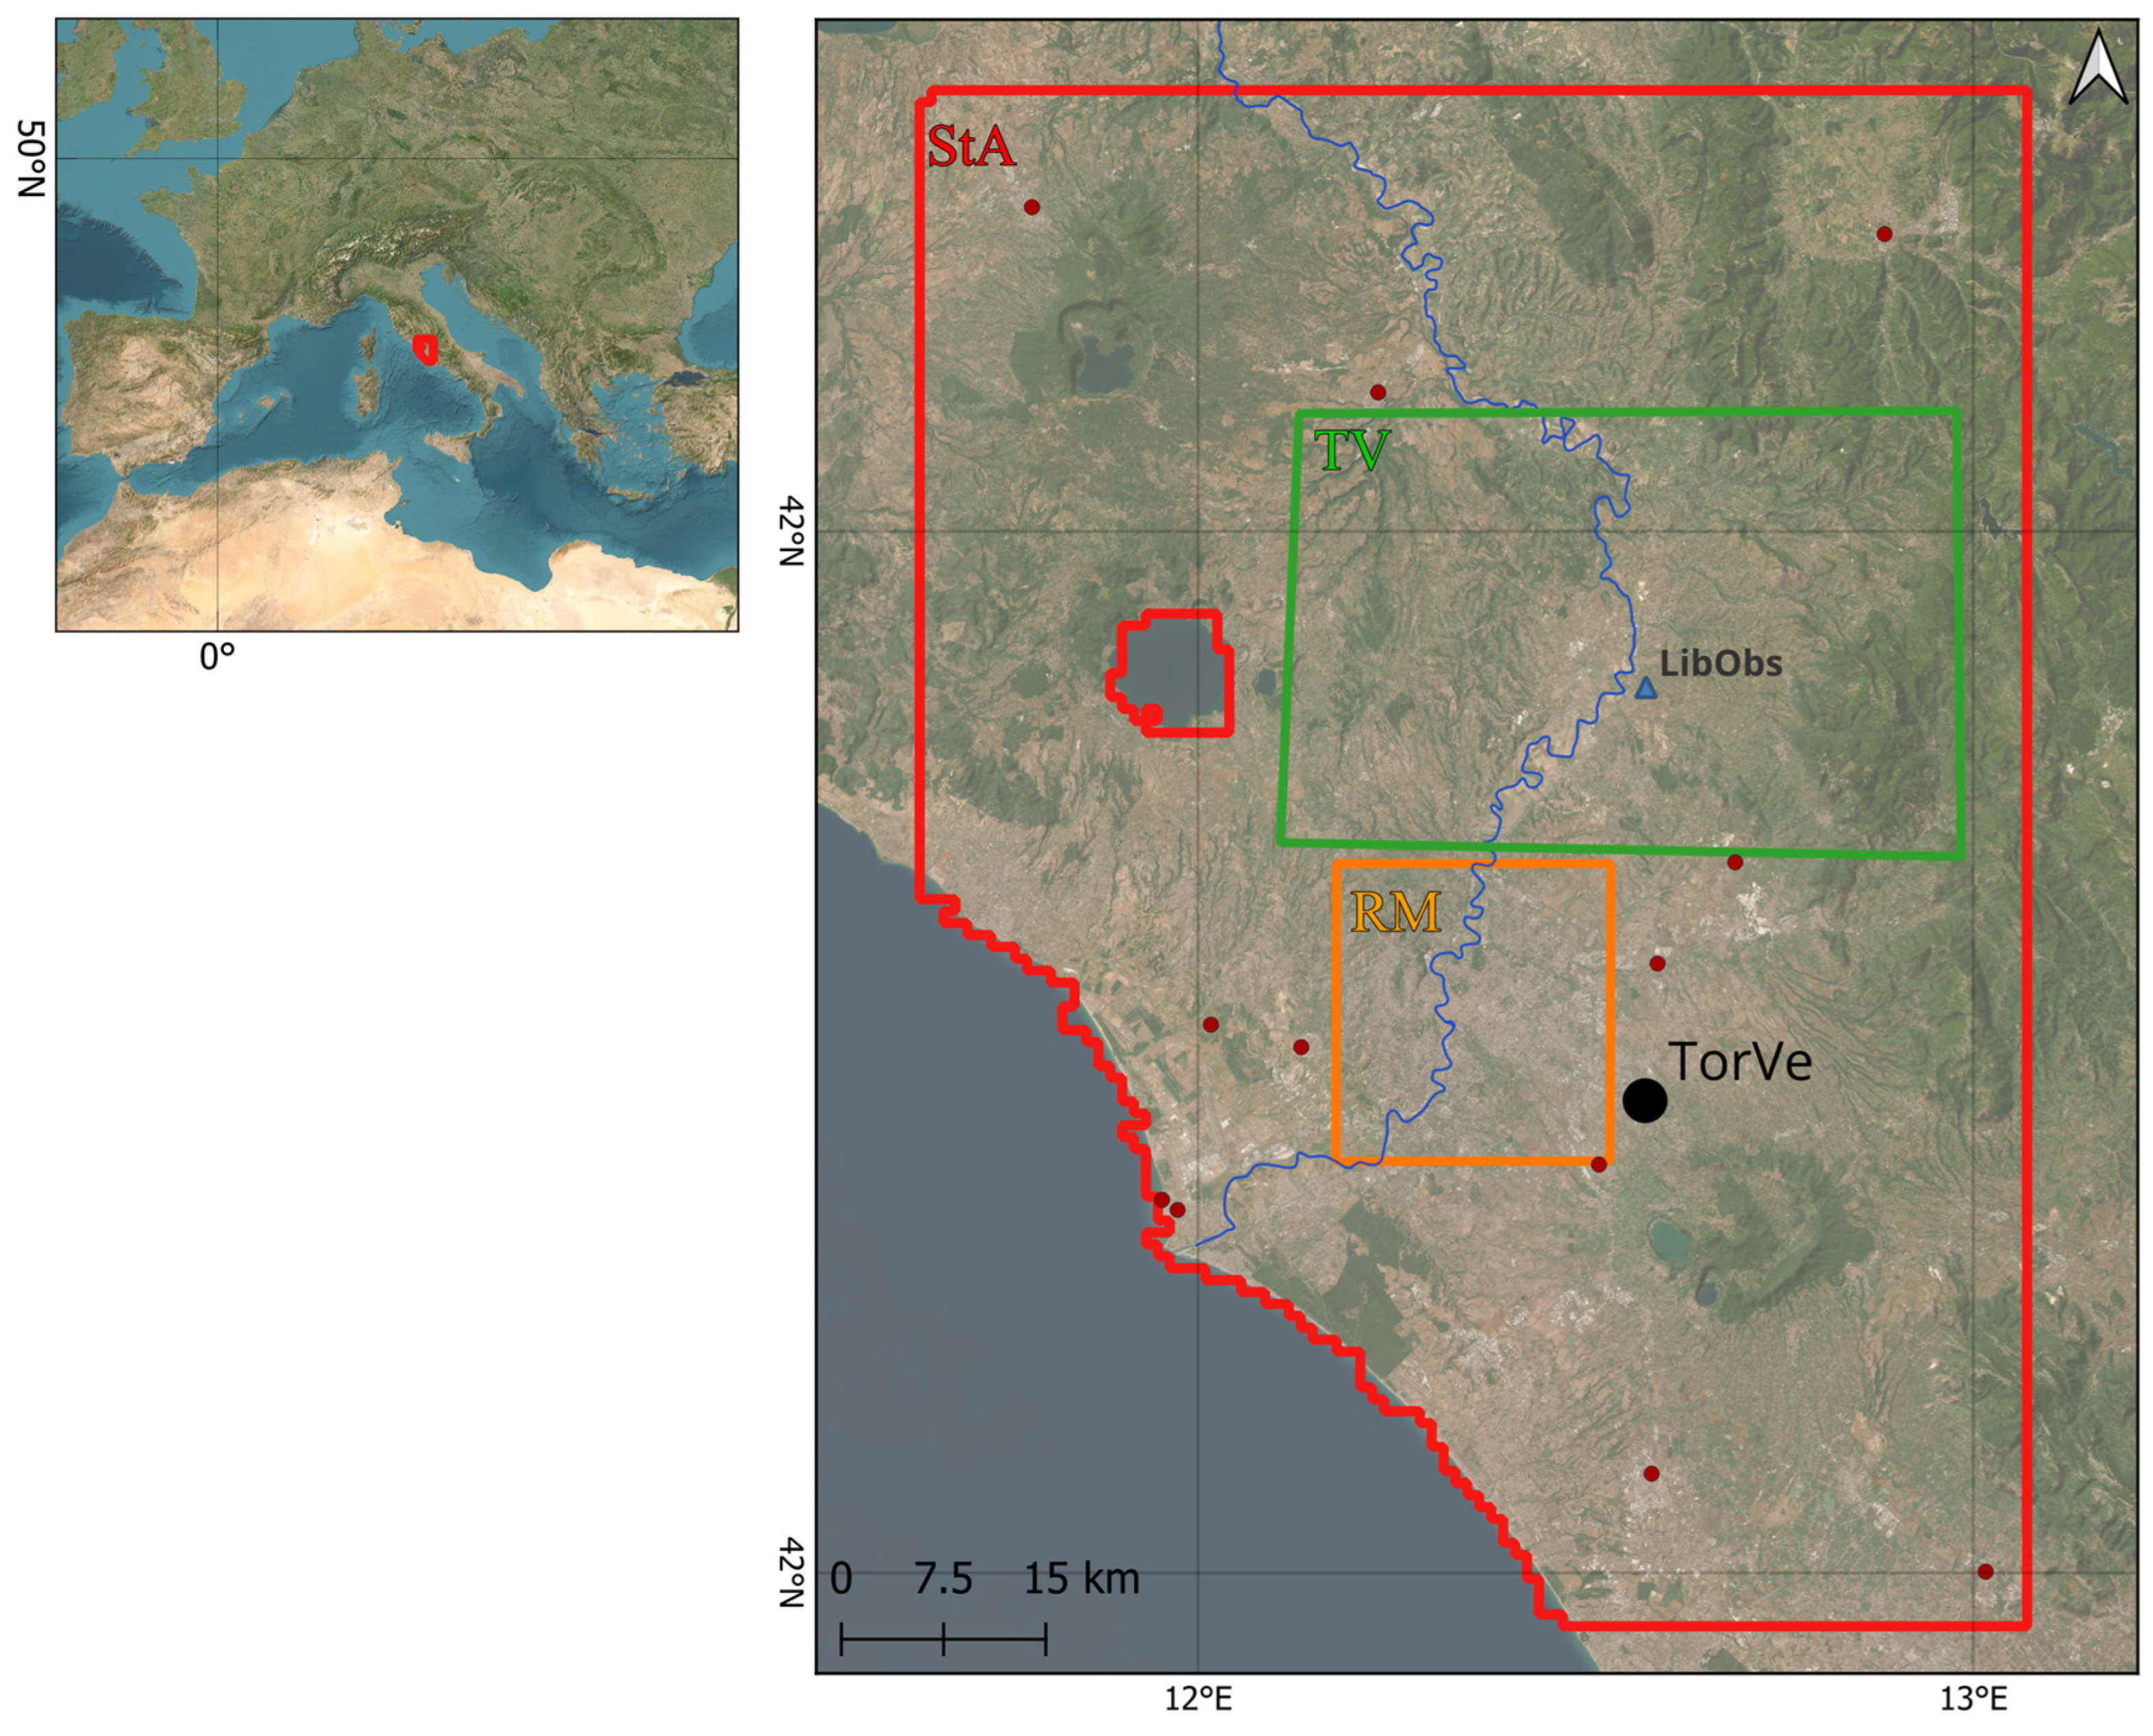
2.1. Study Area

This study is focused on an 80-by-110 km target area (StA) (red box in Figure 1), including the city of Rome (RM) (orange box in Figure 1) and its surroundings in a Central Mediterranean context. Rome is surrounded by the Tyrrhenian Sea to the southwest and by rural areas with complex orography in the other directions. To investigate urban-to-rural transitions, the suburban and rural area of the Tiber River Valley (TV) to the north and northeast of the city was selected (green box in Figure 1). The TV is characterized by sea breeze fronts that blow over Rome, leading to the mixing of local aerosol sources with urban and marine ones [32,33,34,35]. More generally, the orography of the area drives the dominant airflows within the Tiber Valley along the north–south direction, either from or towards the city. The target area is thus suitable to be used as a case study due to the coexistence of different environments and relevant emissions, such as agricultural, industrial, urban, forested and residential sources and environments. On the other hand, the Tiber Valley area is not covered by monitoring stations (red dots in Figure 1) of the Regional Agency for Environmental Protection (ARPA), while the city is covered by 12 stations. In Tiber Valley, despite the complexity of emission sources, the monitoring of atmospheric composition at the surface is only performed by the EMEP station (co-operative programme for monitoring and evaluation of the long-range transmission of air pollutants in Europe, https://www.emep.int) [36] operating at the Liberti Observatory (LibObs) of the Institute of Atmospheric Pollution Research of CNR (IIA-CNR), described in Bassani et al. (2023) [32].

2.2. Ground-Based Remote Sensing with AERONET

The AERONET program is a global network of ground-based aerosol monitoring systems, originally developed by NASA and PHOTONS, the University of Lille 1, CNES, and CNRS-INSU [31,37]. For more than 25 years, it has maintained a comprehensive public database, collected with instruments that are consistently standardized, offering valuable data on aerosol optical, microphysical and radiative properties. This information can then be used in aerosol research, satellite data validation and integration with other scientific databases.
In this study, AERONET observations for the data validation were obtained from the AERONET Rome_Tor_Vergata site (Figure 1) located at the southeastern edge of the Rome urban area (41.88°N, 12.68°E, 107 m a.s.l., hereafter also indicated as TorVe) and operated by the Institute of Atmospheric Sciences and Climate of CNR (CNR-ISAC) since 2001.
The AERONET aerosol parameters specifically used in this study are: (1) the Level 2.0 (quality assured) AOD at 440 nm from the Version 3 Direct Sun algorithm, and (2) the Angstrom Exponent (AE) computed using the 440 nm–675 nm wavelength pair (Equation (1)) of [25], applying the following formula:
A E 440   n m 675   n m = log A O D 440 A O D 675 log 440 675
This allowed to derive the AOD at 550 nm (MODIS wavelength) following Equation (2):
A O D 550 = A O D 4400 × 550 440 A E

2.3. Satellite-Based Remote Sensing with MODIS-MAIAC (AOD) Data

The MAIAC algorithm provides atmosphere and land products for each acquisition at high spatial resolution on a fixed grid (1 km × 1 km) by processing MODIS L1B data of both TERRA 9 (10:30 equator crossing time, descending) and AQUA 9 (13:30 equator crossing time, ascending) satellites [22]. For each acquisition, MAIAC returns atmosphere products by dynamically applying the minimum reflectance method to the surface spectral ratio (SSR) to specific bands depending on pixel brightness. Regarding the surface parameters, the products are optimized to maintain in memory consecutive overpasses up to 16 days to exploit the multi-angle observations due to the geometrical configuration of each acquisition.
In this study, the MAIAC granule h18v04 of the newest version of the AOD product (MCD19A2, Collection 6.1) has been used (https://search.earthdata.nasa.gov/search (accessed on 23 October 2024)). This is contained in daily Hierarchical Data Format (hdf) files, including both TERRA and AQUA acquisitions, supplying a suite of atmospheric and sun-view geometry products in addition to the AOD, such as solar zenith angle (SZA), view zenith angle (VZA), relative azimuth angle (RAA) and scattering angle (SA), which were used in this work. The MAIAC dataset has been limited to the highest quality as recommended in the MODIS MAIAC Data User’s Guide and corresponding to the “best quality” of the AOD_QA product (QA = 0000). All the products are generated at 1 km resolution on a global sinusoidal grid, for each available TERRA and AQUA orbit. The global sinusoidal grid of MAIAC products has been transformed to the WGS84 geographic coordinate system to produce the maps of this study.

2.4. Meteorological Data

To complement the analysis, environmental and meteorological data were obtained from the E-OBS daily gridded land-only observational dataset over Europe provided by the Copernicus Climate Change Service (C3S) [38]. E-OBS was chosen for the high resolution of its data and for the availability of temporal series and daily data during the selected time frame. The data are collected from the station network of the European Climate Assessment & Dataset (ECA&D) and sourced from the European National Meteorological and Hydrological Services (NMHSs) or other data holding institutions [38]. Data were chosen on a horizontal resolution of 0.1° × 0.1°, over the TorVe site. Daily measurements of meteorological parameters were used to retrieve monthly averages for relative humidity (RH), surface downwelling shortwave radiation (SD) and wind speed (WS). Precipitation data was recorded as cumulative rainfall (CR), while for temperature, the monthly maximum (Tmax) was selected.

2.5. Data Processing and Validation

To evaluate MAIAC-AERONET correspondence, a spatial matchup was performed. The satellite pixel (1 km × 1 km) including the AERONET TorVe site was used to extract the corresponding single pixel value of MAIAC observations. For a temporal matchup between the satellite and ground observations, a ±15 min window based on the satellite transit and data acquisition time was selected. This time interval was chosen considering the evidence that a larger time window does not seem to offer any advantages in dataset construction [39].
This AERONET-based MAIAC validation was performed over the whole twenty-one-year (January 2001–December 2022) time frame, and TERRA and AQUA values were considered together. Note, however, that AQUA data is only available starting from 2002.
To assess the correlation between MAIAC and TorVe AOD retrievals, the Kendall correlation coefficient (K) and the Pearson correlation coefficient (R) were both applied. The R correlation coefficient is generally the preferred method in the literature to assess the correlation between satellite-AOD and AERONET observations. However, the dataset considered in this study did not comply with the Pearson correlation requirements, that is, a normal distribution and the absence of outliers, as verified by the Shapiro–Wilk test (Stat = 0.90, p = 1.71). Hence, K was considered a more robust method to assess correlation, as it does not require the data to follow a normal distribution. Nonetheless, R values were reported for comparison with other studies. The expected error (EE) and bias (AODbias) are the consensus methods to evaluate satellite retrieval accuracy [39]. The EE is generally defined as ±(0.05 + 0.15 × AOD); however, considering the expected high accuracy of the MAIAC algorithm, EE with a stricter error range (EE = ±(0.05 + 0.10 × AOD)) was also calculated [40]. For the validation to be considered successful, at least 2/3 (67%) of the total matchups need to fall in the EE interval [41]. AODbias was calculated as in Equation (3). Other descriptive statistics, such as the root mean square error (RMSE) Equation (4), mean absolute error (MAE) Equation (5) and root mean bias (RMB) Equation (6), were further used to evaluate the quality and the accuracy of MAIAC AOD products [41,42].
A O D b i a s = A O D M A I A C A O D A E R O N E T
R M S E = 1 n i = 1 n A O D M A I A C i A O D A E R O N E T i 2
M A E = 1 n i = 1 n A O D M A I A C i A O D A E R O N E T i
R M B = 1 n i = 1 n A O D M A I A C i A O D A E R O N E T i
In particular, the AODbias was assessed as a function of angular dependence to the geometry parameters (i.e., viewing zenith angle, relative azimuth angle, solar zenith angle and scattering angle); difference of performances between the TERRA and AQUA satellites were considered. Although the RTLS-BRDF model of MAIAC algorithm accounts for geometry through predefined functions in its radiative transfer calculations, and the algorithm achieves the best quality in the AOD product that was used in this study, validation remains essential. High quality derived from the algorithm simulations is not a substitute for validation, which is crucial for evaluating performance in real-world scenarios. Therefore, the impact of geometry on AOD retrieval was specifically investigated. Aerosol size and loading were also evaluated.

2.6. Spatial–Temporal Analysis in Tiber Valley

The temporal and spatial variability of the MAIAC AOD were investigated in the SA. Differences between significative years (hereafter also referred to as delta maps) were built following Equation (7) [43] to visualize temporal changes:
D I F F a f t e r = 100 × X a f t e r X b e f o r e X b e f o r e
To evaluate the influence of local emission sources (i.e., RM and TV) on the StA, the Local-to-Regional ratio (LTRR) was calculated using Equation (8) [26]:
L T R R = A O D l o c a l A O D r e g i o n a l 1
AODregional is the yearly average of the AOD in the StA, while AODlocal is the yearly average of AOD in RM and in TV when calculating the LTRRRM/StA or LTRRTV/StA, respectively.

3. Results and Discussion

3.1. Validation with Ground AOD Observations

Figure 2 shows the time series over the twenty-one-year validation time frame for TorVe. Due to instrument calibration periods and some malfunctioning, the AERONET records show some major data gaps in 2019, 2020 and 2022, when the first operating sun-sky instrument was replaced by a new sun–lunar–sky one (Figure 2b).
From the scatterplots and the descriptive statistics reported in Table 1, there appears to be a strong positive correlation between MAIAC and AERONET observations. The K value shows a relatively good correlation (0.56). Accordingly, the fraction of observations within the EE interval shows good accordance between MAIAC and AERONET TorVe AOD distributions. Indeed, when considering EE = ±(0.05 + 0.15 × AOD), 78% of matchups fall within the interval, a relatively high value compared to other sites reported in the literature [25,27]. Hence, to better understand the accuracy of MAIAC retrieval, a more restrictive EE definition ±(0.05 + 0.10 × AOD) was applied. Even in this condition, the number of matchups in the EE interval (72%) respects the satisfactory requirements of EE. In both cases, the fraction of matchups falling below the EE interval indicated a tendency of MAIAC products to strongly underestimate AOD values compared to TorVe observations. This tendency was previously observed in other studies [25,39]. The RMSE, MAE and RMB values are low and close to zero, even in relation to the AOD value range, and confirm the general accordance of observations.
Most observations of the described dataset have an AOD value lower than 0.4, showing a limited AOD range. This result is in line with what was previously reported in other central European cities [26,44] and in Rome, using other AOD retrieval algorithms [45], confirming that Rome follows the general AOD values of the Euro-Mediterranean region and, consequently, low values are expected over the entire study area.

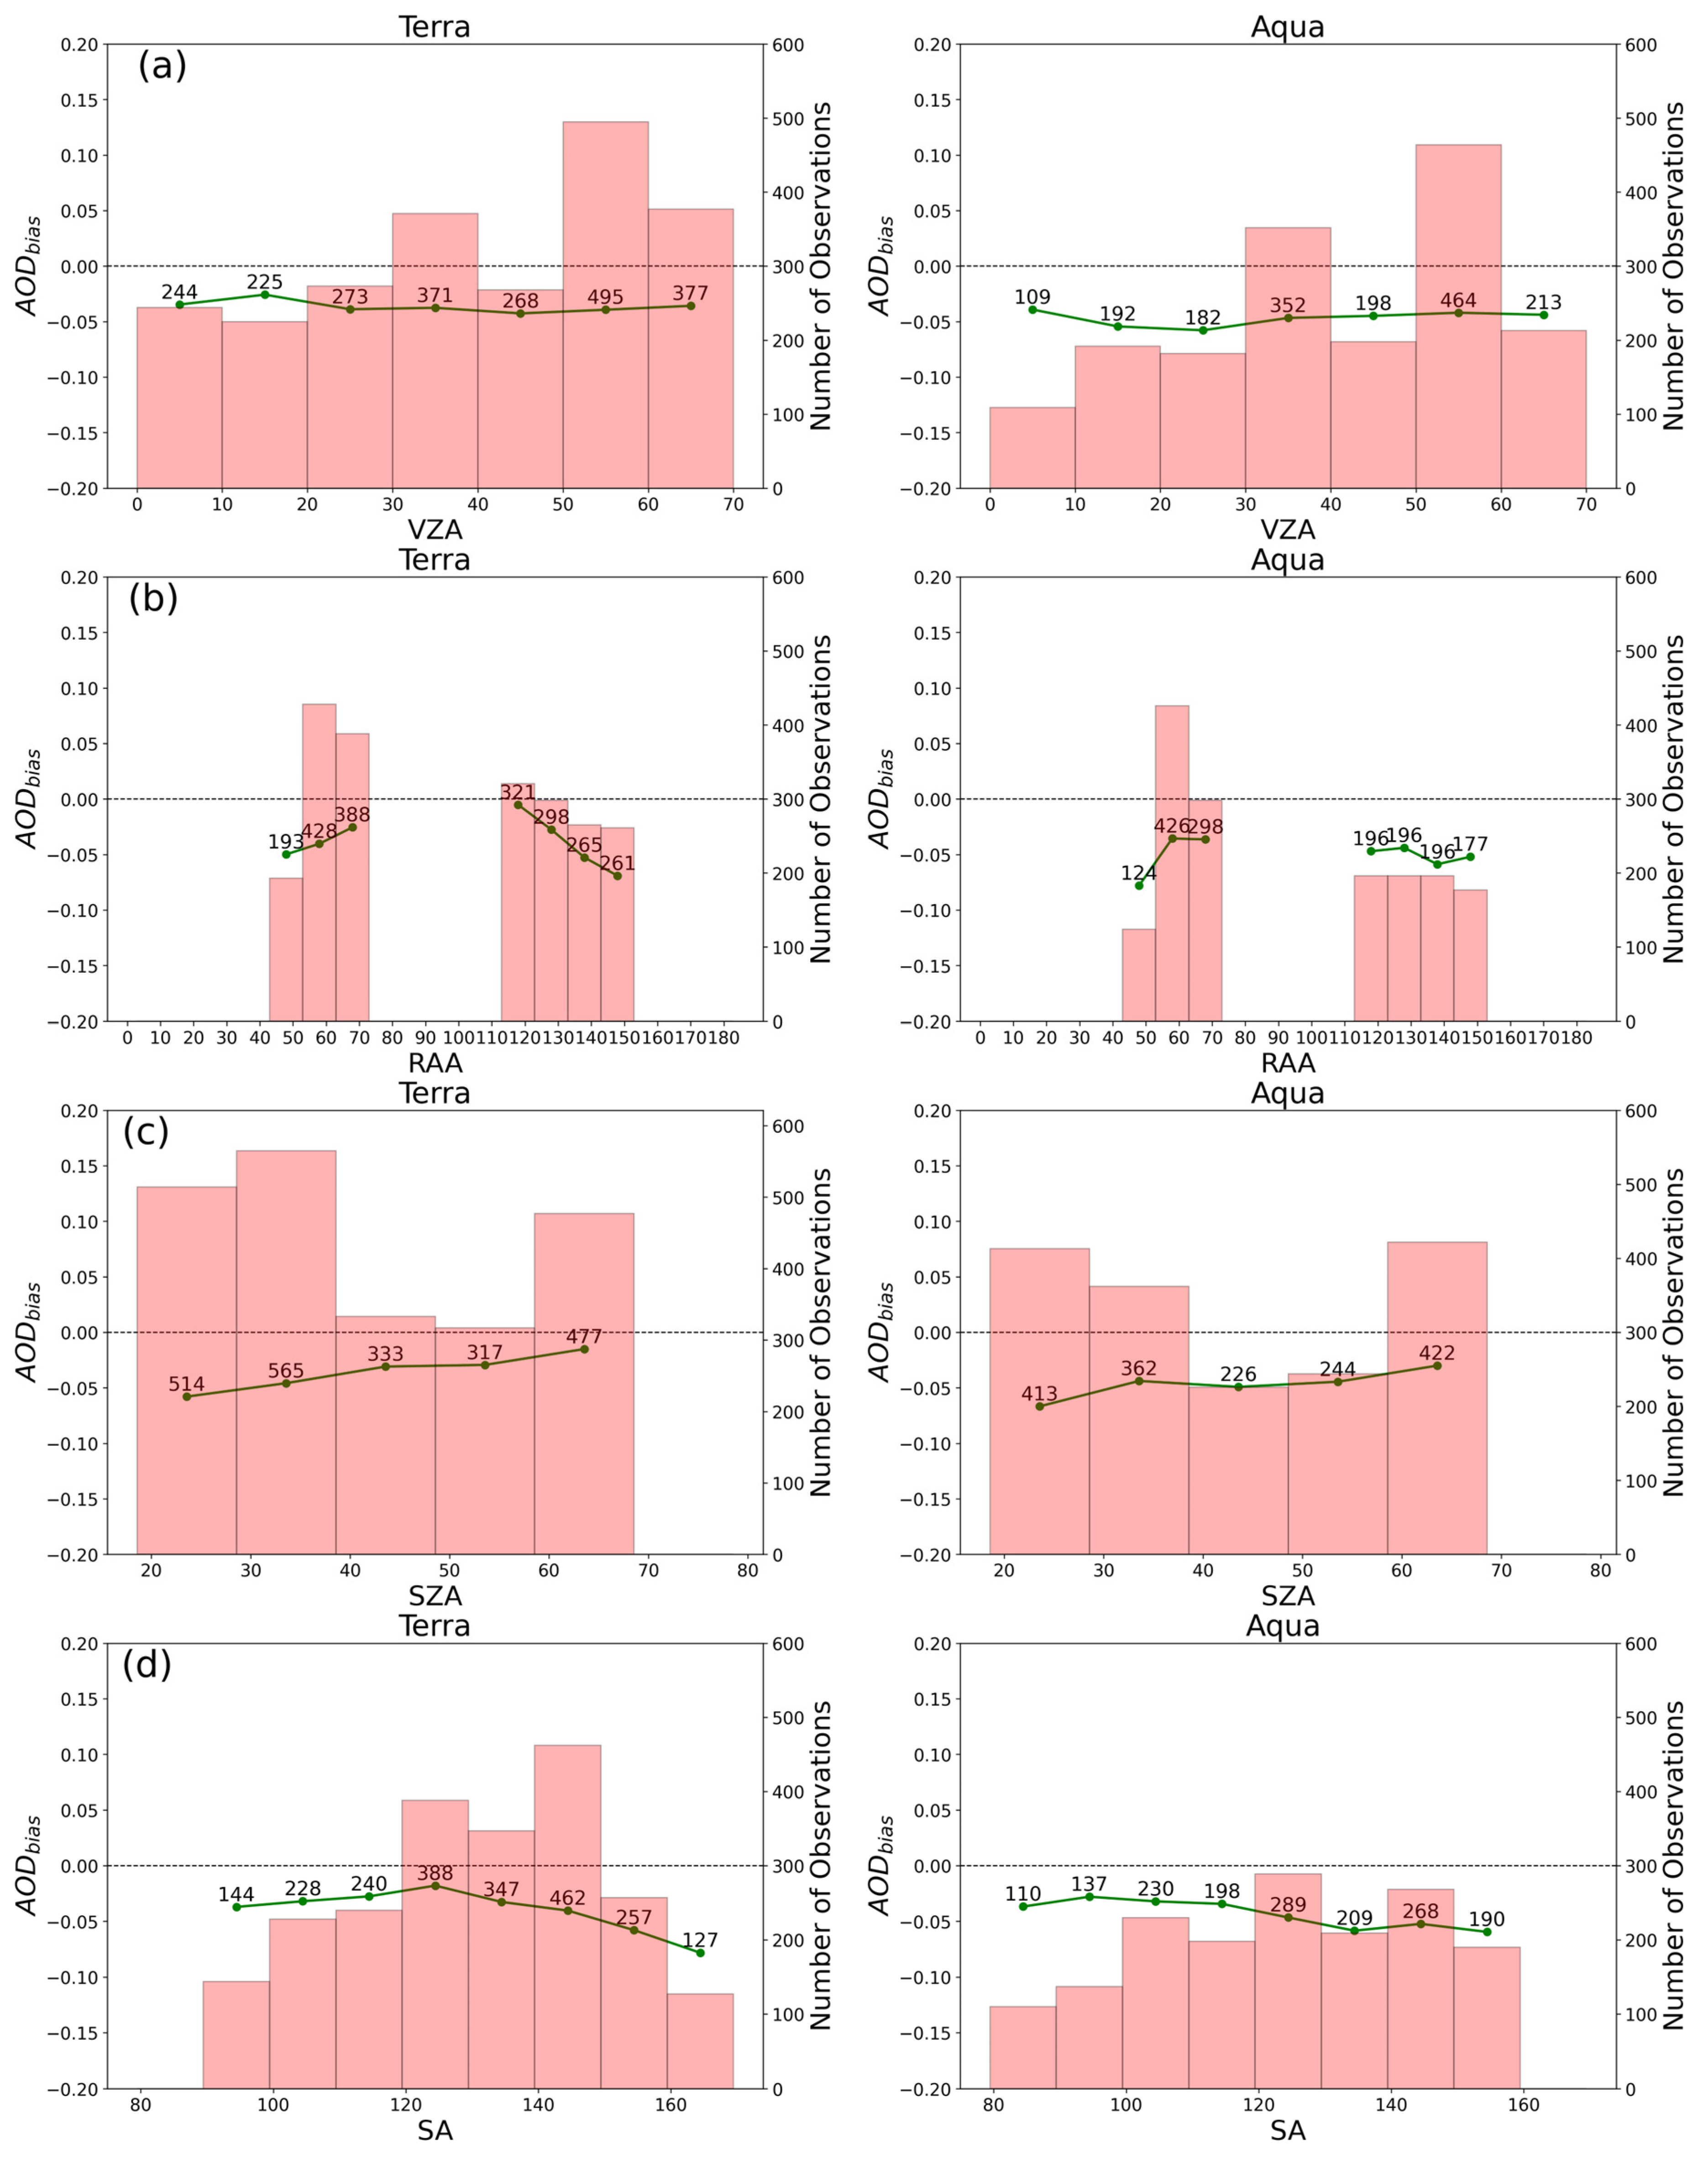
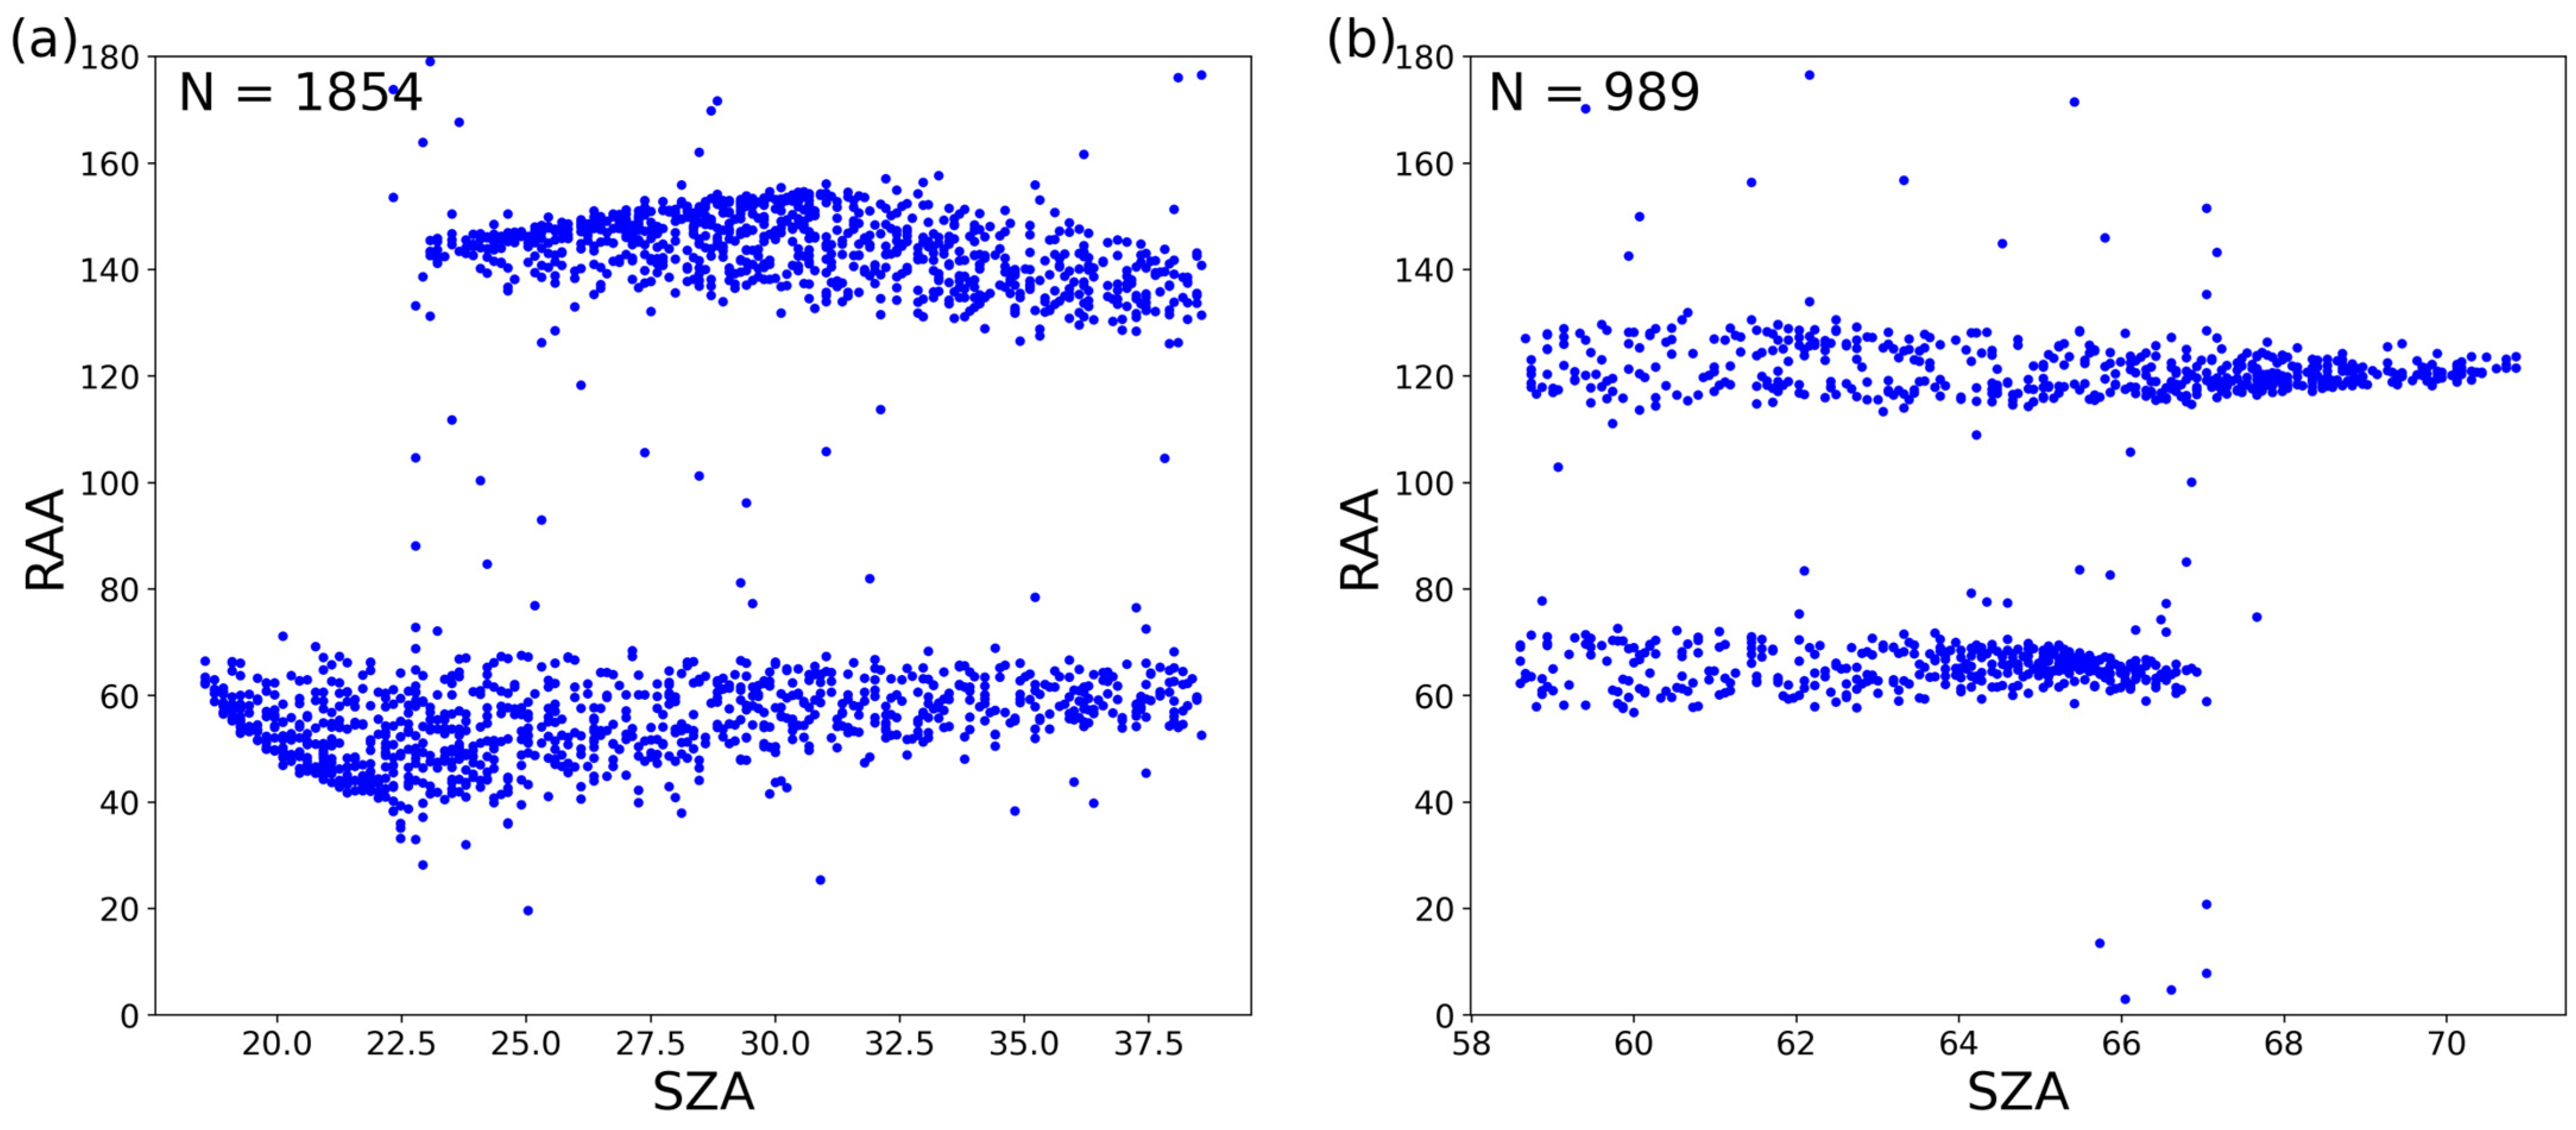
3.2. Geometry Dependence of AOD Retrieval

To assess the influence of the geometry on the satellite AOD retrieval, different angles related to both the satellite and the sun view position were considered. Figure 3 shows, for the TERRA and AQUA datasets separately, the relation between the AODbias and four angles: the viewing zenith angle (VZA), the relative azimuth angle (RAA), the solar zenith angle (SZA) and the scattering angle (SA). Angles were binned at 10°-steps (e.g., [25,46]) over the whole angle range. The mean AODbias for each bin was calculated, and the number of observations in each bin was reported. The bins with a low number of observations (<100) were not considered accurate and were thus excluded from the analysis.
Figure 3 shows a rather constant negative bias in the variation in the VZA for both TERRA and AQUA datasets; thus, no general dependence of AODbias on VZA is observed.
Conversely, an AODbias dependence on RAA is visible, which is more marked for TERRA than for AQUA. More specifically, the satellite has an increasingly more accurate AOD retrieval (i.e., a lower bias) going toward the centre of the angle range, approximately from 50° to 70° and from 150° to 110°. Overall, at this site, MAIAC shows higher accuracy when it is closer to being perpendicular to the sun. On the other hand, the literature results show that forward (RAA 180°) and backscattering (RAA 0°) geometries generally show a more accurate aerosol retrieval, since the top-of-atmosphere (TOA) reflectance is affected by a stronger aerosol contribution in these conditions [47,48]. At the same time, on oblique views (closer to 90° RAA), the TOA signal is influenced by both aerosol and surface bidirectional reflectance distribution function (BRDF) contribution [49]. However, as previously found by other studies, around the solar azimuth region, the surface reflectance anisotropy can still be highly sensitive to land cover features, and the surface reflectance contribution to total reflectance makes the aerosol contribution less retrievable [50,51]. In this research setting, forward and backscattering retrieval geometries are characterized by high variability, exhibiting high contribution from TOA reflectance and causing higher bias in the aerosol retrieval. Regarding the AQUA dataset, the variation in the number of observations is too high to draw reliable conclusions. Although the underestimation effect is clearly visible, it is less dependent on angle variation. The AODbias is generally constant between 50–70° and 110–150°. However, a higher number of observations would be necessary to confirm this trend.
When looking at the behavior of the bias as a function of SZA, a slight angle dependence is visible for both TERRA and AQUA. In general, MAIAC shows better accuracy for high values of SZA, up to approximately 58° and close to 70°, commonly associated with performance degradation in the MAIAC algorithm [22]. Therefore, the results seem to be in general disagreement with what is expected from the literature, which reports an increase in the bias for higher SZA values [52]. On the other hand, the effect of each angle depends on the overall sun-view geometry; in the condition of this study, the combination of multiple geometric parameters drives the MAIAC algorithm toward reduced AOD retrieval accuracy (i.e., higher bias) at lower SZA values due to an unfavorable satellite positioning in terms of other geometric parameters, such as the RAA. Hence, to further explore the multi-angle relation of AOD retrieval and evaluate the unexpected result obtained for SZA, the correlation between SZA and RAA was investigated (Figure 4a). AQUA and TERRA retrievals were grouped in a single dataset for this analysis. Lower SZA values (<38°) based on the chosen bins were selected because they represent the range of values to be explored. Observations with lower SZA values coincide with RAA values characterized by higher bias, and this effect is particularly evident for RAA values between 40° and 60° and between 140° and 160°, where the strongest underestimation of AOD retrieval occurs.
On the other hand, Figure 4b shows the correlation between higher SZA values (>58°) and RAA. Observations fall in the interval where RAA results in lower bias (approximately 55–70° and 120–130°). This result confirms that even when SZA is close to its detection limit (around 70°), the AOD retrieval shows high accuracy for particularly favorable positioning of the satellite for other geometrical parameters; particularly, RAA shows a higher influence on the AOD retrieval compared to SZA.
Regarding the dependence of the AODbias on the SA, Figure 3d highlights slightly better retrievals when the SA is between 80° and 120° [53]. This positioning corresponds to a 60–100° angle between the sensor and the sun.
While the TERRA and AQUA datasets have similar trends, TERRA displays the lowest AODbias between 120° and 130°. To determine whether the co-occurrence of SA values characterized by high bias may influence the bias of retrievals with low expected bias SZA values, the SA was analyzed for data with a low SZA. Figure 5 shows that limited data derive from MODIS acquisitions with SA < 100°, corresponding to low AODbias (Figure 3d), while most acquisitions seem to be performed with an unfavorable geometrical acquisition (high AODbias), that is, an SA between 150° and 170°. These results suggest that the SA could lead the AODbias and the accuracy of the MAIAC AOD, compared to the SZA, at least for what concerns this site over the last two decades.
The correlation between the SZA and VZA was not explored because the bias of retrievals did not vary depending on VZA values (Figure 3c).
Overall, the respective position of satellite and sun, described by the combination of geometric parameters, is an important factor to assess when investigating angle dependence on AOD retrieval. The results of the study confirm that highly unfavorable positions of the sensor can strongly influence AOD retrieval, leading to high bias even when low bias is expected if considering specific geometric parameters. Therefore, the relationship between AODbias and the combination of geometric parameters should be considered when evaluating the accuracy of AOD value retrieval. Moreover, these results suggest that, in the study setting, the MAIAC AOD retrieval is more accurate when the sensor and the sun are almost perpendicular on both the vertical and horizontal planes. However, while AERONET’s sun photometers perform direct sun measurements, retrieving the AOD directly along the solar beam, MAIAC retrieves the columnar AOD based on satellite observations with non-fixed viewing geometries, possibly leading to an anisotropic effect in the AOD field; consequently, the AODbias can partially depend on this difference rather than solely on MAIAC retrieval. Further studies to quantify sensor discrepancies depending on the field of view are necessary [54].

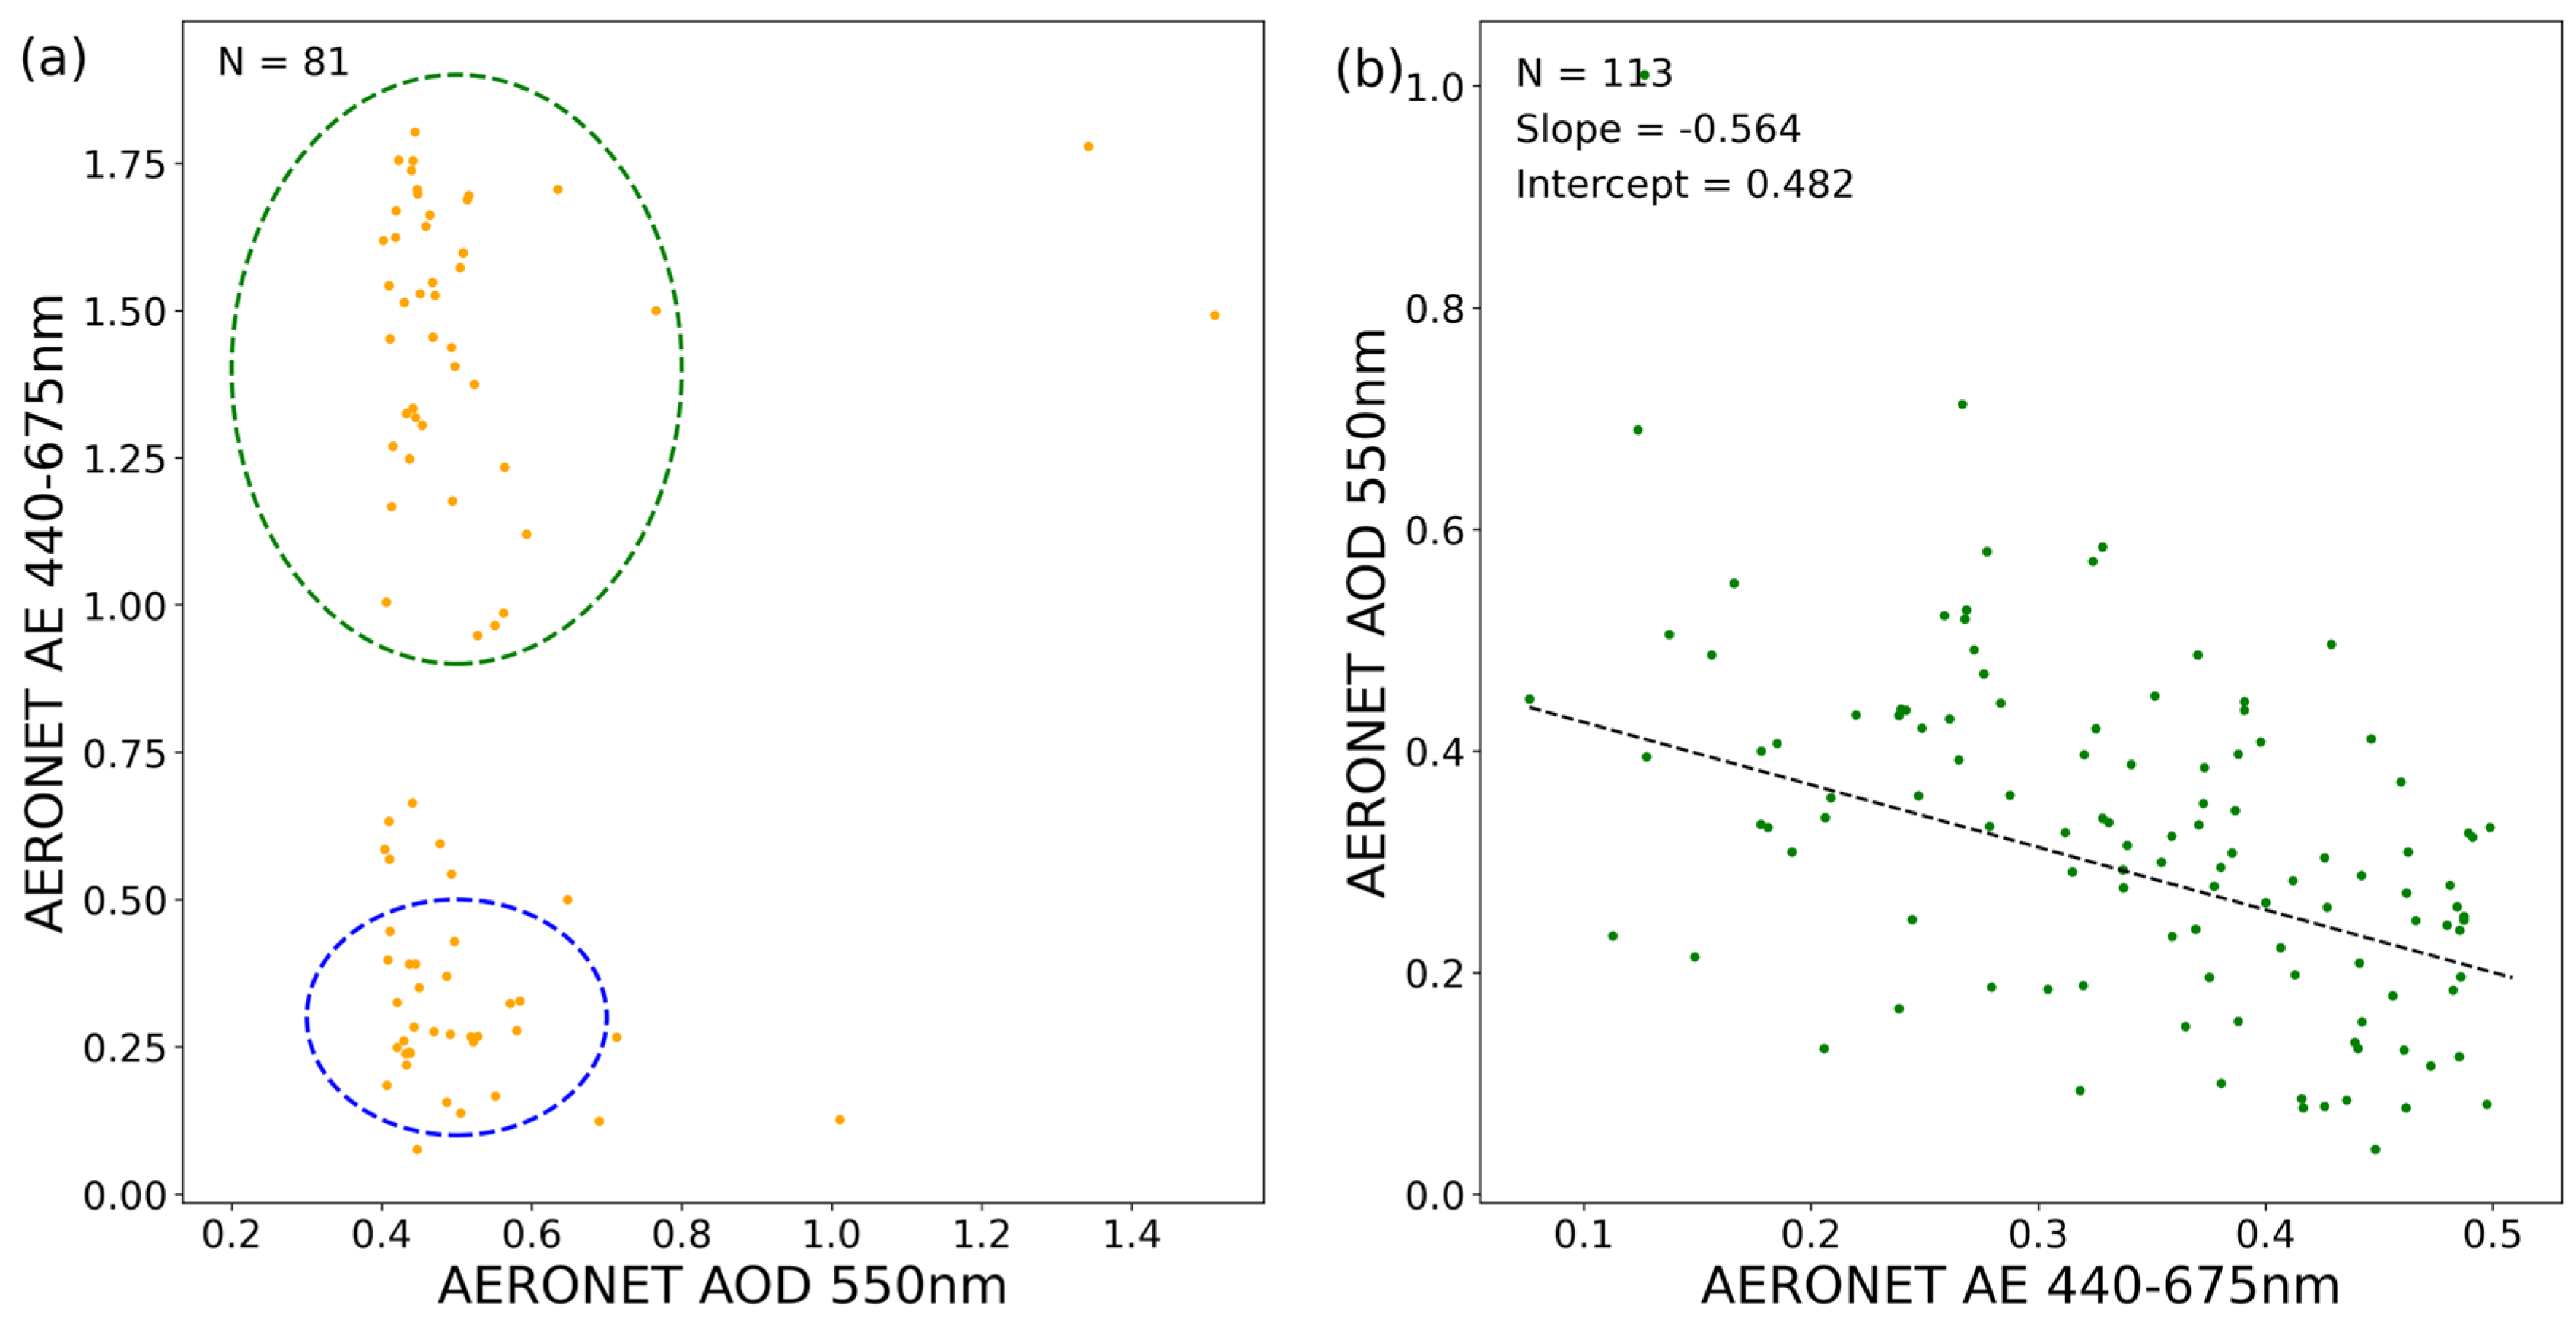
3.3. Aerosol Size and Loading Dependence of AOD Retrieval

Figure 6 shows the AODbias in relation to the AERONET AE (440–675 nm) and AERONET AOD (at 550 nm). Relating the AODbias to the AERONET AE and AOD can give information on the performance of the MAIAC algorithm in different aerosol conditions, such as the variation in loading and type. As a first approximation, AE values ≤ 0.7 are associated with a predominance of coarse-mode particles, AE ≥ 1.3 with a predominance of fine particles, and mixed conditions in between (0.7 < AE < 1.3) [25]. Accordingly, AE bins were chosen based on the literature. However, the last bin (2.1–2.5) covers a larger interval, because only six observations were present for AE > 2.3. In the study site, most observations are dominated by fine-mode aerosols [55], as expected; indeed, while the contribution of farming-dependent secondary PM cannot be discounted, as the study area is in a mixed region of urban and rural environments, it is likely that the main sources of particles measured in this zone are combustion processes (e.g., from traffic, domestic heating and industrial activity, e.g., [35]) taking place in the city of Rome. In prevalent coarse-mode conditions, the AODbias is maximum with a high quartile range, as previously observed in other studies [56].
MAIAC accuracy increases when the aerosol is dominated by mixed or fine particles (mean of AODbias for mixed and fine aerosol = −0.033), confirming the previous results in other regions [25,39]. This result shows a dependence of the MAIAC retrieval on particle size and type, while still confirming the general underestimation.
Regarding the AOD loading, it is generally considered low when below 0.2, moderate between 0.2 and 0.4, and high when above 0.4 [39]. Comparing the AOD loading with the AODbias can give an informative result on the performance of the MAIAC algorithm with the variation in the AOD. This comparison (Figure 6b) shows that the bias increases with an increasing AOD: for moderate and high aerosol loading (AOD > 0.2), MAIAC performs an underestimation of the AOD (maximum mean AODbias = −0.207). This result is in line with what was previously found in other studies and is related to the complexity of the aerosol under high loading conditions and to the uncertainty of the associated model [39,46]. On the other hand, under low aerosol loading conditions, MAIAC performs a more accurate retrieval, with a much lower underestimation (mean of AODbias for low aerosol loading = −0.025). The high number of observations for low values of AOD demonstrates the robustness of the result, showing that MAIAC can perform accurate retrievals even for low loadings, where accuracy is often reported as being lower. Generally, aerosol loading can influence the accuracy of AOD retrieval: during clear days (low aerosol loading condition, AOD ≤ 0.2), MAIAC may show less accuracy in the retrieval of aerosol properties, since high surface reflectance makes the aerosol contribution less detectable in the at-sensor radiance (or in the reflectance at the top of atmosphere) [39]. As mentioned before, most of the observations of the current dataset have an AOD < 0.4; to further evaluate the accuracy of AOD retrievals, descriptive statistics (R, EE) were calculated for AOD ≤ 0.2 and AOD > 2. Statistics were not calculated for each AOD loading interval separately since the dataset only contains 81 observations for AOD > 0.4. The results are reported in Table 2.
Table 2 confirms what was previously shown in Figure 6b. Over the TorVe study site, in low AOD days, MAIAC has the best AOD retrieval accuracy. Meanwhile, days with medium and high aerosol loading show a clear underestimation of the AOD retrieval. This result is related to the tendency of the Euro-Mediterranean region to show high aerosol loading conditions when dust events occur, caused by the wind transportation of Saharan dust in late spring and summer [57,58], which were previously reported over Rome [59,60,61]. These phenomena cause an increase in coarse particles, therefore affecting the accuracy of AOD retrieval as discussed above. This hypothesis is strengthened by the low number of observations for AOD > 0.4, suggesting that these are occasional events rather than a consistent local trend.
To confirm this hypothesis, the AERONET AOD-AE correlation, and vice versa, was calculated and plotted in Figure 7. The independent variables were chosen to emphasize aerosol loading or aerosol size, respectively, as previously discussed. Figure 7a shows that high aerosol loading conditions (AOD > 0.4) occur in two well-defined clusters based on the prevalent particle size. The blue cluster includes aerosols with the prevalence of very coarse particles (particularly AE ≤ 0.5 ) detected in high aerosol loading conditions. At the same time, aerosol, mainly characterized by mixed fine particles (particularly 1 < AE < 1.8 ), included in the green cluster, can also be found in high loading conditions. However, mixed fine particles constitute most of the dataset, but only on rare occasions do they coincide with high aerosol loading. Interestingly, very fine particles (AE ≥ 1.8) are never responsible for high aerosol loading conditions. Figure 7b shows that very coarse particles (AE ≤ 0.5) are present in the whole range of aerosol loading conditions. A tendency can be noted where coarser particles tend to be more present in higher loading conditions.

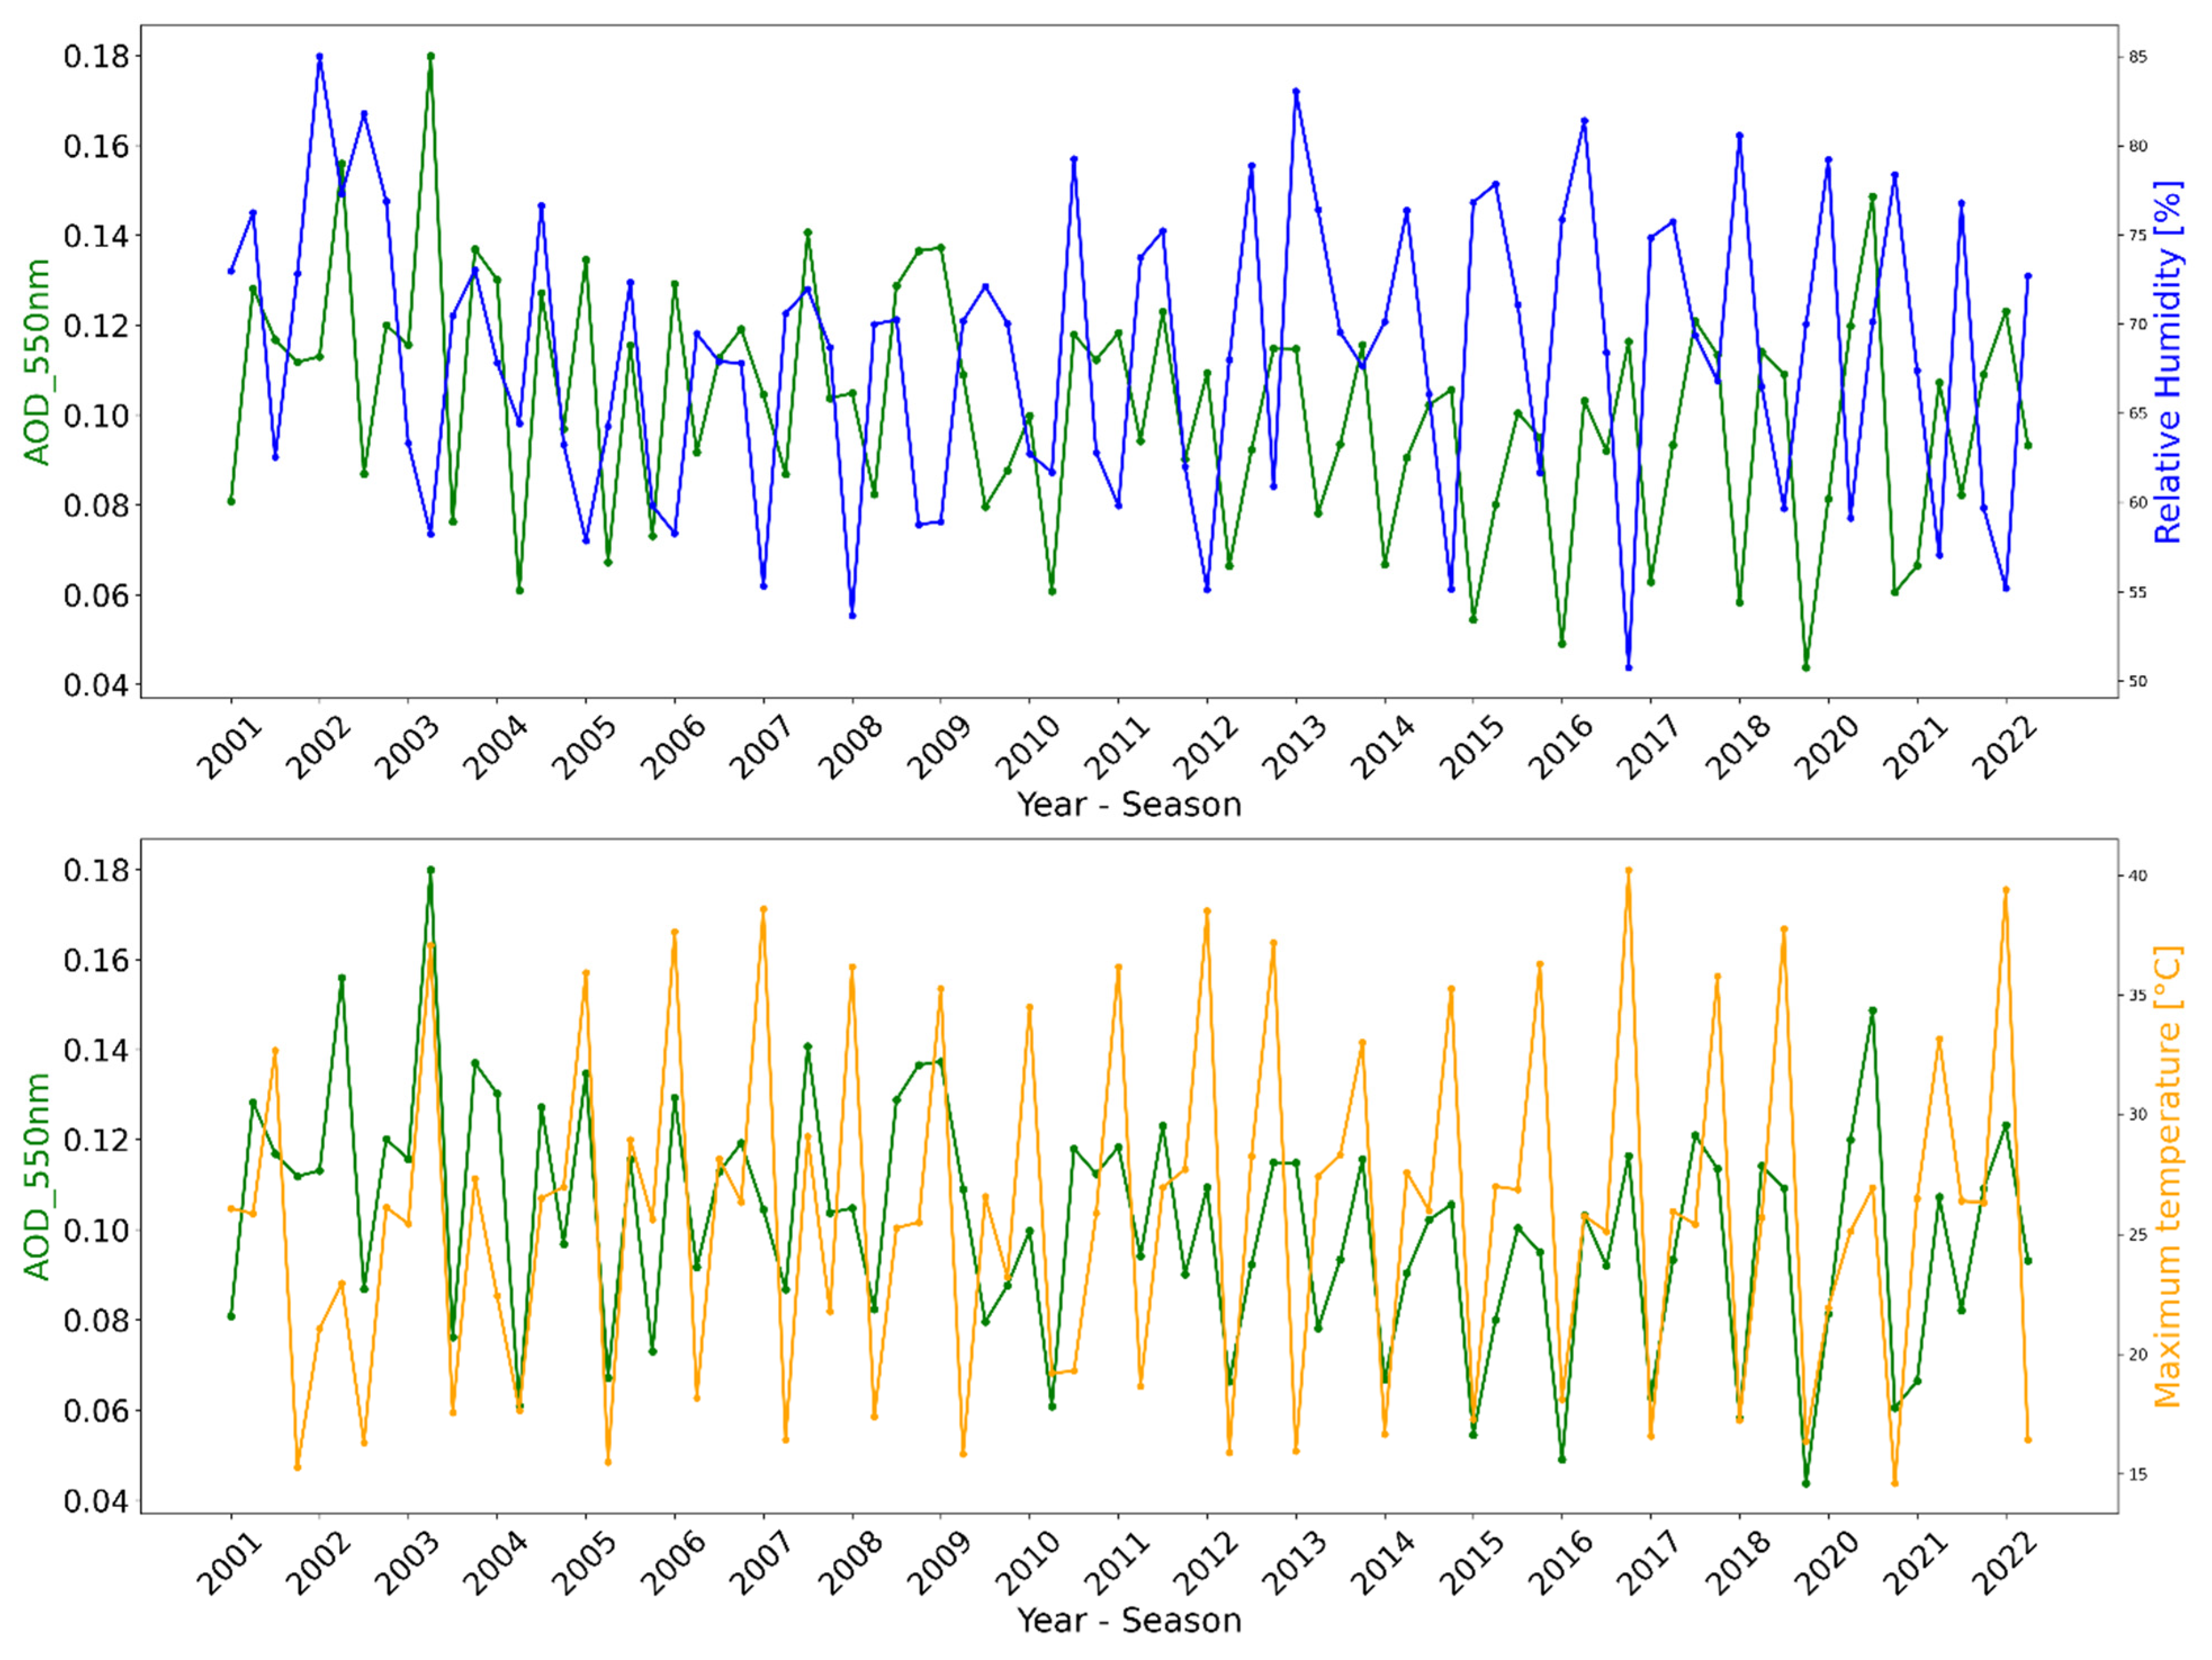
3.4. Meteorological Analysis

To check the impact of environmental parameters on the AOD variability, E-OBS meteorological data over the TorVe study site were analyzed. Physical and chemical changes in the composition of gases and aerosols due to atmospheric conditions (e.g., photochemical or hygroscopic processes) can indeed lead to changes in the AOD [62]. While these parameters can inform on ongoing processes in the atmospheric aerosol, it is important to note that E-OBS data describe conditions at the surface level, while AOD measures comprise the whole depth of the air column. A Principal Component Analysis (PCA), including the MAIAC AOD and AE, seasons, and meteorological parameters, showed that temperature (−0.52 on PC1, 0.47 on PC2), wind speed (−0.46 on PC1, −0.46 on PC2) and relative humidity (0.61 on PC1, 0.13 on PC2) are the main environmental parameters explaining the variability of the dataset in the first two components, showing a higher influence compared to the aerosol parameter (i.e., Angstrom Exponent). However, the first three components identified by the PCA can describe 60% of the variability of the dataset, suggesting that other parameters, outside the current analysis, could be relevant in explaining the drivers of AOD variability. To identify a possible relation with the AOD retrieval, the meteorological parameters’ monthly trends over 2001–2022 were compared with the MAIAC AOD trend; the results are shown in Figure 8.
Temperature shows a strong agreement with the AOD trend, with concordant positive and negative peaks. Indeed, temperature is correlated with solar irradiance, which directly influences AOD retrieval. Increased solar radiation enhances photochemical reactions, leading to the formation of secondary aerosols, which can increase AOD [63]. Additionally, higher temperatures can influence vertical mixing and cloud formation, affecting aerosol dispersion and concentration. Higher radiation levels can also enhance atmospheric convection, influencing aerosol distribution [64,65]. A similar consideration applies to surface downwelling shortwave flux, which predictably behaves like temperature, as discussed previously.
Relative humidity shows good agreement with the AOD trend: high-humidity conditions can lead to the formation of secondary aerosols, to water absorption by particles or, alternatively, to aerosol removal via cloud formation and precipitation. Overall, hygroscopy can modify aerosol size distribution and scattering [24,66]. Regarding wind speed, the two variables consistently reach their peaks simultaneously. However, the nature of their correlation varies: At times, they are positively correlated (both peak together), while in other instances, they are negatively correlated (one peaks while the other reaches a minimum). This alternation can be attributed to the lack of information in the E-OBS dataset regarding wind directions. As such, wind can be expected to clear atmospheric particulate when consistently blowing from the north and to transport particulate matter from the city of Rome when blowing from the south. However, wind direction is expected to have a lower influence on the broader StA scale.

3.5. Spatial–Temporal Analysis in Tiber Valley

The validation of the MAIAC AOD retrievals in the TorVe study site was the necessary condition to be able to use MAIAC data over the area of the city of Rome and its surrounding region. Consequently, the MAIAC product was used to characterize the spatial and temporal variation of the AOD in the entire urban area of Rome and the southern Tiber Valley, where monitoring stations are missing despite the heterogeneity of the environment and emission sources. Figure 9 shows the spatial variation of AOD in 2001, 2011 and 2022. 2011 was chosen as a middle point being at the center of the temporal interval. Moreover, the temporal difference between these three years is shown in the difference maps. The annual maps show a slight general decrease in AOD values during the studied years; particularly, the northern region of StA (including TV) in 2011 shows a more marked decrease compared to southern and coastal region. These observations were confirmed by the difference maps. While the TV and northern region decreased mostly in the first decade, RM and southern areas show an increase in the same period and a marked decrease in the second decade. Overall, the averaged difference between 2022 and 2001 is equal to 18.95%. Both the Rome and the Tiber Valley areas in the difference map 2022-2001 show a general decrease (e.g., green and blue shades) in much of their extension, more marked in the rural and peri-urban portions of the Tiber Valley area. The red area in the south-western portion of the Tiber Valley area (green square of Fig. 9) is the municipality of Monterotondo, suggesting that urban drivers, such as traffic and heating, are responsible for this local increase. The red area to the south-west of the city of Rome is located between the Fiumicino airport and the Malagrotta landfill and incinerator. Further studies are needed, though, to discern the sources and causes of that localized AOD increase.
To better describe the AOD variation over 2001–2022, yearly AOD trends were assessed over the study area and over Rome and the Tiber Valley separately, as shown in Figure 10. While the maps show the annual mean of selected years, the trends allow to better characterize the annual variability during the whole study period, assessing deviations from the mean and including variations possibly given by seasonal shifts and outliers. Overall, the trends show a general decrease in AOD values in all the areas. This trend is evident despite the occasional occurrence of matter advection events transporting marine and desert particulate matter over the study area and is driven by a reduction in the emissions of particulate matter (both PM2.5 and PM10) and precursor pollutants that have been occurring in the Lazio region (where RM and TV are located) for several years. Specifically, a reduction in both background emissions and traffic emissions over RM is documented by local monitoring stations and it is likely due to ever more stringent European Directives limiting tail pipe exhaust emissions [34,67]. However, the intensity of this decrease is year dependent, as years where the mean AOD surpasses the decreasing trend can still be found. For example, 2021 shows higher values compared to the trend, probably due to an increase in the use of private means of transport and a resumption of industrial activities after the 2020 lockdown, consistent with data reported for other countries [68]. Generally, Rome AOD values are higher compared to Tiber Valley values, denoting a concentration of principal emission sources in the city of Rome. This result is associated with more traffic intensity and concentration of domestic heating in the urban areas where population density is higher [69], while in the Tiber Valley region, more industrial activity and biomass heating are probably the main contributors to anthropogenic aerosol particles but are more spread out across the territory.
The contribution of aerosol sources deriving from processes happening within Rome or within the Tiber Valley to the aerosol values measured in the whole study area can be assessed through the LTRR. Positive values in the LTRR indicate that the aerosol measured in the local area influences the AOD retrieval of the whole area. On the other hand, negative values in the LTRR highlight the influence of the areal retrieval over the local one, suggesting a non-homogeneous aerosol distribution, overcoming the local signal [26]. As shown in Table 3, LTRRTV/StA is close to zero, demonstrating homogeneity between the Tiber Valley aerosol and the study area as a whole. Hence, a significant contribution of Tiber Valley aerosol and emission sources can be excluded. Moreover, this trend has remained constant for the whole historical series. LTRRRM/StA, instead, clearly shows a positive deviation, indicating a strong influence of the city over the study area. Interestingly, the influence of the city on StA is still significant in 2020 (LTRR = 0.164), when emissions related to traffic decreased by 50% compared to 2019 because of the lockdown [70].
Overall, 2020 represents an extraordinary year. Other than the lockdown, two exceptional dust events of Asian and Saharan origin occurred over Europe in March and May. These events have been detected by several AERONET sites in multiple countries, confirming the broad scale of the phenomena. Considering the homogeneous diffusion of the dust, these events are expected to have similar effects across the whole StA, without resulting in different effects on local areas [71,72]. Smaller events of Saharan dust and marine aerosol transportation are recorded in the winter of 2020 [73], but similar events are typical in this area and are periodically reported; hence, they are not expected to influence annual trends [35,61].
The influence of Rome over the StA was further explored by calculating monthly trends in the LTRR. In Table 4, a different trend in LTRRTV/StA and LTRRRM/StA is clearly visible. LTRRTV/StA is close to zero and shows a slight decrease in the late summer and winter months, when the influence of Rome is prevalent over the study area, confirmed by the LTRRRM/StA values. This result confirms the impact of the city of Rome on the seasonal AOD variation. The increase in the city’s contribution during late summer and winter can depend on the increase in traffic as the city repopulates after summer vacations and the use of domestic heating during winter. This trend suggests that continuous monitoring of the city is necessary to assess changes in the whole StA.

4. Conclusions

This study presented the results obtained from the first validation of MAIAC AOD retrieval over areas surrounding the urban core of Rome (Italy) during the period 2001–2022, which allowed a long-term analysis of MAIAC AOD products. MAIAC retrieval was validated using the Rome_Tor_Vergata AERONET station situated in the TorVe study site (RM2 research area of the National Research Council of Italy). The consistency between the two datasets was evaluated by applying descriptive statistics, which showed good agreement between them (R = 0.799; EE = 79%). However, the validation highlighted a general underestimation of MAIAC retrieval (26% of observations below the EE), in line with previous studies [25,39], confirming that the considered area falls under the common range of the Euro-Mediterranean region for general AOD values [26,44].
The accuracy of the MAIAC AOD retrieval was also evaluated in relation to acquisition geometry for TERRA and AQUA, aerosol loading and particle size. This extended geometry analysis investigated how the sensor viewing and sun positioning during the acquisition impact the AOD produced by MAIAC. The results show that over the study area, the relative azimuth angle (RAA), solar zenith angle (SZA) and scattering angle (SA) are the main geometrical parameters affecting retrieval. The RAA shows a progressively higher bias toward extreme values (50° and 150°), above the general underestimation of MAIAC retrievals. This is related to the high variability of surface reflectance on the solar principal plane [50,51]. At the same time, the SA shows higher bias at higher values, as reported in other studies [53]. The SZA results show higher bias for smaller values (<38°) when the sun is closer to the zenith. This effect was demonstrated to result from the satellite’s simultaneous unfavorable alignment along other geometric planes, which counteracted the advantage of being within the optimal range for the SZA, where the highest accuracy was expected, thus confirming the importance of comprehensively accounting for the sun-view geometry when assessing retrieval accuracy. This result represents an important advancement compared to studies assessing retrieval accuracy separately for each single geometric parameter. The effect of the combination of multiple angles is an interesting field to be further explored, especially in combination with data on surface coverage and BRDF available from the MODIS mission. This advancement can supply useful information for upcoming missions working with multi-angular aerosol parameters retrieval, like the NASA-ASI MAIA mission.
Regarding aerosol loading and particle size, the results align with the previous scientific literature [39,46], showing a higher bias in high aerosol loading conditions and when the aerosol is predominantly constituted by coarse particles. A relation between occasional extraordinary events, such as wind transporting Saharan dust, and the accuracy of retrieval depending on particle size and AOD loading was highlighted. Such events, in fact, increase the quantity of coarse particles and the aerosol loading, in turn affecting the accuracy of AOD retrieval. Understanding the relation between AOD and aerosol composition and investigating how these measures relate to the nature and source of particulate matter can offer improved insight into emission sources and phenomena occurring in the atmosphere.
Finally, the AOD validation paved the way to spatially analyze the AOD trend over 2001–2022 in the whole study area. The proposed framework synergizes ground and satellite databases, suitable for evaluating and identifying urban and rural trends. The trend shows a general decrease of approximately 19% of AOD in the whole area between 2001 and 2022, most likely associated with European Directives regulating vehicular traffic. Predictably, Rome always shows higher AOD values compared to the Tiber Valley due to higher traffic intensity and the higher intensity of domestic heating emissions. The LTRR confirmed the predominant influence of Rome over the study area over annual and seasonal trends, even when the general trend is decreasing. This result extends what was found by other studies investigating the relation between cities and their surroundings [26,27] and suggests that intervention in Rome through urban pollution regulation is fundamental for the wider area. Consequently, monitoring the evolution of the AOD in peri-urban areas and adjacent environments affected by the influence of the city is necessary for the full evaluation of the environmental impacts of strategies and policies taken at the urban level for pollution mitigation.
Overall, this study demonstrated the utility of satellite detection in the long-term monitoring of wide areas, where local monitoring action is limited. In particular, the MAIAC algorithm can produce accurate retrievals at high spatial resolutions, complementing surface monitoring.

Author Contributions

Conceptualization, C.B. and A.I.; methodology, C.B., V.T. and F.B.; software, C.B., V.T. and P.T.; validation, V.P.; formal analysis, V.T. and P.T.; investigation, V.T. and P.T.; resources, C.B. and V.P.; data curation, C.B. and A.I.; writing—original draft preparation, V.T., P.T. and C.B.; writing—review and editing, V.P., C.B. and F.B.; visualization, V.T., C.B. and P.T.; supervision, V.P. and C.B.; project administration, C.B. and V.P.; funding acquisition, C.B. All authors have read and agreed to the published version of the manuscript.

Funding

This research received no external funding.

Data Availability Statement

The dataset is available on request from the authors.

Conflicts of Interest

The authors declare no conflicts of interest.

Abbreviations

The following abbreviations are used in this manuscript:
AEAngstrom Exponent
AERONETAerosol Robotic Network
AODAerosol Optical Depth
CNESCentre National D’Études Spatiales
CNRS—INSUCentre National de la Recherche Scientifique —Institut National des Sciences de l’Univers
CRCumulative Rainfall
EEExpected Error
LTRRLocal-to-Regional Ratio
MAIACMulti-Angle Implementation of Atmospheric Correction
MAEMean Absolute Error
MODISModerate Resolution Imaging Spectroradiometer
NASANational Aeronautics and Space Administration
PHOTONSPHOtométrie pour le Traitement Opérationnel de Normalisation Satellitaire
RAARelative Azimuth Angle
RHRelative Humidity
RMRome
RMBRoot Mean Bias
RMSERoot Mean Square Error
SAScattering Angle
SDSurface Downwelling Shortwave Radiation
StAStudy Area
SZASolar Zenith Angle
TmaxTemperature Maximum
TorVeAERONET Rome_Tor_Vergata Site
TVTiber River Valley
VZAView Zenith Angle
WSWind Speed

References

  1. European Environment Agency. Air Pollution in Europe: 2024 Reporting Status Under the National Emission Reduction Commitments Directive; Publications Office: Luxembourg, 2024. [Google Scholar]
  2. European Parliament. Council of the European Union. Direttiva (UE) 2024/2881 del Parlamento Europeo e del Consiglio, del 23 Ottobre 2024, Relativa alla Qualità dell’aria Ambiente e per Un’aria Più Pulita in Europa; Publications Office: Luxembourg, 2024. [Google Scholar]
  3. World Health Organization. WHO Global Air Quality Guidelines: Particulate Matter (PM2.5 and PM10), Ozone, Nitrogen Dioxide, Sulfur Dioxide and Carbon Monoxide, 1st ed.; World Health Organization: Geneva, Switzerland, 2021; ISBN 978-92-4-003422-8. [Google Scholar]
  4. Calvin, K.; Dasgupta, D.; Krinner, G.; Mukherji, A.; Thorne, P.W.; Trisos, C.; Romero, J.; Aldunce, P.; Barrett, K.; Blanco, G.; et al. IPCC, 2023: Climate Change 2023: Synthesis Report. Contribution of Working Groups I, II and III to the Sixth Assessment Report of the Intergovernmental Panel on Climate Change, 1st ed.; Core Writing Team, Lee, H., Romero, J., Eds.; IPCC: Geneva, Switzerland, 2023. [Google Scholar]
  5. Sicard, P.; Agathokleous, E.; De Marco, A.; Paoletti, E.; Calatayud, V. Urban Population Exposure to Air Pollution in Europe over the Last Decades. Environ. Sci. Eur. 2021, 33, 28. [Google Scholar] [CrossRef] [PubMed]
  6. European Environment Agency. Europe’s Air Quality Status 2024; EEA Briefing; Publications Office: Luxembourg, 2024. [Google Scholar]
  7. Diapouli, E.; Manousakas, M.I.; Vratolis, S.; Vasilatou, V.; Pateraki, S.; Bairachtari, K.A.; Querol, X.; Amato, F.; Alastuey, A.; Karanasiou, A.A.; et al. AIRUSE-LIFE +: Estimation of Natural Source Contributions to Urban Ambient Air PM10 and PM2. 5 Concentrations in Southern Europe—Implications to Compliance with Limit Values. Atmos. Chem. Phys. 2017, 17, 3673–3685. [Google Scholar] [CrossRef]
  8. Diner, D.J.; Boland, S.W.; Brauer, M.; Bruegge, C.; Burke, K.A.; Chipman, R.; Di Girolamo, L.; Garay, M.J.; Hasheminassab, S.; Hyer, E. Advances in Multiangle Satellite Remote Sensing of Speciated Airborne Particulate Matter and Association with Adverse Health Effects: From MISR to MAIA. J. Appl. Remote Sens. 2018, 12, 1. [Google Scholar] [CrossRef]
  9. Hollmann, R.; Merchant, C.J.; Saunders, R.; Downy, C.; Buchwitz, M.; Cazenave, A.; Chuvieco, E.; Defourny, P.; De Leeuw, G.; Forsberg, R.; et al. The ESA Climate Change Initiative: Satellite Data Records for Essential Climate Variables. Bull. Am. Meteorol. Soc. 2013, 94, 1541–1552. [Google Scholar] [CrossRef]
  10. Bai, R.; Xue, Y.; Jiang, X.; Jin, C.; Sun, Y. Retrieval of High-Resolution Aerosol Optical Depth for Urban Air Pollution Monitoring. Atmosphere 2022, 13, 756. [Google Scholar] [CrossRef]
  11. Barnaba, F.; Gobbi, G.P. Aerosol Seasonal Variability over the Mediterranean Region and Relative Impact of Maritime, Continental and Saharan Dust Particles over the Basin from MODIS Data in the Year 2001. Atmos. Chem. Phys. 2004, 4, 2367–2391. [Google Scholar] [CrossRef]
  12. Faisal, A.-A.-; Kafy, A.-A.; Fattah, M.A.; Jahir, D.M.A.; Al Rakib, A.; Rahaman, Z.A.; Ferdousi, J.; Huang, X. Assessment of Temporal Shifting of PM2.5, Lockdown Effect, and Influences of Seasonal Meteorological Factors over the Fastest-Growing Megacity, Dhaka. Spat. Inf. Res. 2022, 30, 441–453. [Google Scholar] [CrossRef]
  13. Just, A.C.; Wright, R.O.; Schwartz, J.; Coull, B.A.; Baccarelli, A.A.; Tellez-Rojo, M.M.; Moody, E.; Wang, Y.; Lyapustin, A.; Kloog, I. Using High-Resolution Satellite Aerosol Optical Depth to Estimate Daily PM2.5 Geographical Distribution in Mexico City. Environ. Sci. Technol. 2015, 49, 8576–8584. [Google Scholar] [CrossRef]
  14. Raptis, I.-P.; Kazadzis, S.; Amiridis, V.; Gkikas, A.; Gerasopoulos, E.; Mihalopoulos, N. A Decade of Aerosol Optical Properties Measurements over Athens, Greece. Atmosphere 2020, 11, 154. [Google Scholar] [CrossRef]
  15. Smirnov, A.; Holben, B.N.; Giles, D.M.; Slutsker, I.; O’Neill, N.T.; Eck, T.F.; Macke, A.; Croot, P.; Courcoux, Y.; Sakerin, S.M.; et al. Maritime Aerosol Network as a Component of AERONET—First Results and Comparison with Global Aerosol Models and Satellite Retrievals. Atmos. Meas. Tech. 2011, 4, 583–597. [Google Scholar] [CrossRef]
  16. Sun, E.; Xu, X.; Che, H.; Tang, Z.; Gui, K.; An, L.; Lu, C.; Shi, G. Variation in MERRA-2 Aerosol Optical Depth and Absorption Aerosol Optical Depth over China from 1980 to 2017. J. Atmos. Sol.-Terr. Phys. 2019, 186, 8–19. [Google Scholar] [CrossRef]
  17. Levy, R.C.; Mattoo, S.; Munchak, L.A.; Remer, L.A.; Sayer, A.M.; Patadia, F.; Hsu, N.C. The Collection 6 MODIS Aerosol Products over Land and Ocean. Atmos. Meas. Tech. 2013, 6, 2989–3034. [Google Scholar] [CrossRef]
  18. Tanré, D.; Kaufman, Y.J.; Herman, M.; Mattoo, S. Remote Sensing of Aerosol Properties over Oceans Using the MODIS/EOS Spectral Radiances. J. Geophys. Res. 1997, 102, 16971–16988. [Google Scholar] [CrossRef]
  19. Hsu, N.C.; Jeong, M.-J.; Bettenhausen, C.; Sayer, A.M.; Hansell, R.; Seftor, C.S.; Huang, J.; Tsay, S.-C. Enhanced Deep Blue Aerosol Retrieval Algorithm: The Second Generation. JGR Atmos. 2013, 118, 9296–9315. [Google Scholar] [CrossRef]
  20. Lyapustin, A.; Martonchik, J.; Wang, Y.; Laszlo, I.; Korkin, S. Multiangle Implementation of Atmospheric Correction (MAIAC): 1. Radiative Transfer Basis and Look-up Tables. J. Geophys. Res. Atmos. 2011, 116, D03210. [Google Scholar] [CrossRef]
  21. Lyapustin, A.; Wang, Y.; Laszlo, I.; Kahn, R.; Korkin, S.; Remer, L.; Levy, R.; Reid, J.S. Multiangle Implementation of Atmospheric Correction (MAIAC): 2. Aerosol Algorithm. J. Geophys. Res. Atmos. 2011, 116, D03211. [Google Scholar] [CrossRef]
  22. Lyapustin, A.; Wang, Y.; Korkin, S.; Huang, D. MODIS Collection 6 MAIAC Algorithm. Atmos. Meas. Tech. 2018, 11, 5741–5765. [Google Scholar] [CrossRef]
  23. Chen, X.; Ding, J.; Liu, J.; Wang, J.; Ge, X.; Wang, R.; Zuo, H. Validation and Comparison of High-Resolution MAIAC Aerosol Products over Central Asia. Atmos. Environ. 2021, 251, 118273. [Google Scholar] [CrossRef]
  24. Wang, J.; Xu, X.; Spurr, R.; Wang, Y.; Drury, E. Improved Algorithm for MODIS Satellite Retrievals of Aerosol Optical Thickness over Land in Dusty Atmosphere: Implications for Air Quality Monitoring in China. Remote Sens. Environ. 2010, 114, 2575–2583. [Google Scholar] [CrossRef]
  25. Mhawish, A.; Banerjee, T.; Sorek-Hamer, M.; Lyapustin, A.; Broday, D.M.; Chatfield, R. Comparison and Evaluation of MODIS Multi-Angle Implementation of Atmospheric Correction (MAIAC) Aerosol Product over South Asia. Remote Sens. Environ. 2019, 224, 12–28. [Google Scholar] [CrossRef]
  26. Di Antonio, L.; Di Biagio, C.; Foret, G.; Formenti, P.; Siour, G.; Doussin, J.-F.; Beekmann, M. Aerosol Optical Depth Climatology from the High-Resolution MAIAC Product over Europe: Differences between Major European Cities and Their Surrounding Environments. Atmos. Chem. Phys. 2023, 23, 12455–12475. [Google Scholar] [CrossRef]
  27. Zhdanova, E.Y.; Chubarova, N.Y.; Lyapustin, A.I. Assessment of Urban Aerosol Pollution over the Moscow Megacity by the MAIAC Aerosol Product. Atmos. Meas. Tech. 2020, 13, 877–891. [Google Scholar] [CrossRef]
  28. Del Águila, A.; Alcaraz-Segura, D.; Martínez-López, J.; Postma, T.; Alados-Arboledas, L.; Zamora, R.; Navas-Guzmán, F. Two Decades of High-Resolution Aerosol Product over the Sierra Nevada Mountain Region (SE Spain): Spatio-Temporal Distribution and Impact on Ecosystems. Atmos. Res. 2024, 308, 107515. [Google Scholar] [CrossRef]
  29. Della Ceca, L.S.; García Ferreyra, M.F.; Lyapustin, A.; Chudnovsky, A.; Otero, L.; Carreras, H.; Barnaba, F. Satellite-Based View of the Aerosol Spatial and Temporal Variability in the Córdoba Region (Argentina) Using over Ten Years of High-Resolution Data. ISPRS J. Photogramm. Remote Sens. 2018, 145, 250–267. [Google Scholar] [CrossRef]
  30. Pandey, A.; Aditi, K.; Baranwal, H.; Siddiqui, A.; Banerjee, T. Contrasting Nature of Aerosols over South Asian Cities and Its Surrounding Environment. Environ. Pollut. 2024, 360, 124622. [Google Scholar] [CrossRef]
  31. Holben, B.N.; Eck, T.F.; Slutsker, I.; Tanré, D.; Buis, J.P.; Setzer, A.; Vermote, E.; Reagan, J.A.; Kaufman, Y.J.; Nakajima, T.; et al. AERONET—A Federated Instrument Network and Data Archive for Aerosol Characterization. Remote Sens. Environ. 1998, 66, 1–16. [Google Scholar] [CrossRef]
  32. Bassani, C.; Vichi, F.; Esposito, G.; Falasca, S.; Di Bernardino, A.; Battistelli, F.; Casadio, S.; Iannarelli, A.M.; Ianniello, A. Characterization of Nitrogen Dioxide Variability Using Ground-Based and Satellite Remote Sensing and In Situ Measurements in the Tiber Valley (Lazio, Italy). Remote Sens. 2023, 15, 3703. [Google Scholar] [CrossRef]
  33. Campanelli, M.; Diémoz, H.; Siani, A.M.; Di Sarra, A.; Iannarelli, A.M.; Kudo, R.; Fasano, G.; Casasanta, G.; Tofful, L.; Cacciani, M.; et al. Aerosol Optical Characteristics in the Urban Area of Rome, Italy, and Their Impact on the UV Index. Atmos. Meas. Tech. 2022, 15, 1171–1183. [Google Scholar] [CrossRef]
  34. Di Bernardino, A.; Iannarelli, A.M.; Casadio, S.; Perrino, C.; Barnaba, F.; Tofful, L.; Campanelli, M.; Di Liberto, L.; Mevi, G.; Siani, A.M.; et al. Impact of Synoptic Meteorological Conditions on Air Quality in Three Different Case Studies in Rome, Italy. Atmos. Pollut. Res. 2021, 12, 76–88. [Google Scholar] [CrossRef]
  35. Struckmeier, C.; Drewnick, F.; Fachinger, F.; Gobbi, G.P.; Borrmann, S. Atmospheric Aerosols in Rome, Italy: Sources, Dynamics and Spatial Variations during Two Seasons. Atmos. Chem. Phys. 2016, 16, 15277–15299. [Google Scholar] [CrossRef]
  36. Yttri, K.E.; Simpson, D.; Bergström, R.; Kiss, G.; Szidat, S.; Ceburnis, D.; Eckhardt, S.; Hueglin, C.; Nøjgaard, J.K.; Perrino, C.; et al. The EMEP Intensive Measurement Period Campaign, 2008–2009: Characterizing Carbonaceous Aerosol at Nine Rural Sites in Europe. Atmos. Chem. Phys. 2019, 19, 4211–4233. [Google Scholar] [CrossRef]
  37. Giles, D.M.; Sinyuk, A.; Sorokin, M.G.; Schafer, J.S.; Smirnov, A.; Slutsker, I.; Eck, T.F.; Holben, B.N.; Lewis, J.R.; Campbell, J.R.; et al. Advancements in the Aerosol Robotic Network (AERONET) Version 3 Database—Automated near-Real-Time Quality Control Algorithm with Improved Cloud Screening for Sun Photometer Aerosol Optical Depth (AOD) Measurements. Atmos. Meas. Tech. 2019, 12, 169–209. [Google Scholar] [CrossRef]
  38. Copernicus Climate Change Service. E-OBS Daily Gridded Meteorological Data for Europe from 1950 to Present Derived from in-Situ Observations; Copernicus Climate Change Service: Reading, UK, 2020. [Google Scholar]
  39. Falah, S.; Mhawish, A.; Sorek-Hamer, M.; Lyapustin, A.I.; Kloog, I.; Banerjee, T.; Kizel, F.; Broday, D.M. Impact of Environmental Attributes on the Uncertainty in MAIAC/MODIS AOD Retrievals: A Comparative Analysis. Atmos. Environ. 2021, 262, 118659. [Google Scholar] [CrossRef]
  40. Martins, V.S.; Lyapustin, A.; De Carvalho, L.A.S.; Barbosa, C.C.F.; Novo, E.M.L.M. Validation of High-resolution MAIAC Aerosol Product over South America. JGR Atmos. 2017, 122, 7537–7559. [Google Scholar] [CrossRef]
  41. Ji, W.; Yang, L.; Tian, X.; Bilal, M.; Pei, X.; Zheng, Y.; Lu, X.; Cheng, X. Long-Term Validation and Error Analysis of DB and MAIAC Aerosol Products over Bright Surface of China. Atmos. Res. 2024, 297, 107106. [Google Scholar] [CrossRef]
  42. Huang, G.; Su, X.; Wang, L.; Wang, Y.; Cao, M.; Wang, L.; Ma, X.; Zhao, Y.; Yang, L. Evaluation and Analysis of Long-Term MODIS MAIAC Aerosol Products in China. Sci. Total Environ. 2024, 948, 174983. [Google Scholar] [CrossRef]
  43. Liang, Y.; Gui, K.; Che, H.; Li, L.; Zheng, Y.; Zhang, X.; Zhang, X.; Zhang, P.; Zhang, X. Changes in Aerosol Loading before, during and after the COVID-19 Pandemic Outbreak in China: Effects of Anthropogenic and Natural Aerosol. Sci. Total Environ. 2023, 857, 159435. [Google Scholar] [CrossRef] [PubMed]
  44. Deaconu, L.-T.; Mereuță, A.; Radovici, A.; Ștefănie, H.I.; Botezan, C.; Ajtai, N. Consistency of Aerosol Optical Properties between MODIS Satellite Retrievals and AERONET over a 14-Year Period in Central–East Europe. Remote Sens. 2024, 16, 1677. [Google Scholar] [CrossRef]
  45. Rizza, U.; Mancinelli, E.; Morichetti, M.; Passerini, G.; Virgili, S. Aerosol Optical Depth of the Main Aerosol Species over Italian Cities Based on the NASA/MERRA-2 Model Reanalysis. Atmosphere 2019, 10, 709. [Google Scholar] [CrossRef]
  46. Qin, W.; Fang, H.; Wang, L.; Wei, J.; Zhang, M.; Su, X.; Bilal, M.; Liang, X. MODIS High-Resolution MAIAC Aerosol Product: Global Validation and Analysis. Atmos. Environ. 2021, 264, 118684. [Google Scholar] [CrossRef]
  47. Liu, N.; Zou, B.; Feng, H.; Tang, Y.; Liang, Y. Evaluation and Comparison of MAIAC, DT and DB Aerosol Productsover China. Atmos. Chem. Phys. Discuss 2019, 19, 8243–8268. [Google Scholar] [CrossRef]
  48. Zhang, H.; Hoff, R.M.; Kondragunta, S.; Laszlo, I.; Lyapustin, A. Aerosol Optical Depth (AOD) Retrieval Using Simultaneous GOES-East and GOES-West Reflected Radiances over the Western United States. Atmos. Meas. Tech. 2013, 6, 471–486. [Google Scholar] [CrossRef]
  49. Kolmonen, P.; Virtanen, T. EUMETSAT—Atmospheric Aerosol Optical Depth Retrieval Performance from Sentinel-3 SLSTR SARP; EUMETSAT: Darmstadt, Germany, 2021. [Google Scholar]
  50. Kokhanovsky, A.A.; Breon, F.-M. Validation of an Analytical Snow BRDF Model Using PARASOL Multi-Angular and Multispectral Observations. IEEE Geosci. Remote Sens. Lett. 2012, 9, 928–932. [Google Scholar] [CrossRef]
  51. Román, M.O.; Gatebe, C.K.; Schaaf, C.B.; Poudyal, R.; Wang, Z.; King, M.D. Variability in Surface BRDF at Different Spatial Scales (30m–500m) over a Mixed Agricultural Landscape as Retrieved from Airborne and Satellite Spectral Measurements. Remote Sens. Environ. 2011, 115, 2184–2203. [Google Scholar] [CrossRef]
  52. Smith, S.; Wu, Y.; Levy, R.; Ting, M. The Solar Zenith Angle Impacts MODIS versus CALIPSO AOD Retrieval Biases, with Implications for Arctic Aerosol Seasonality. EGUsphere 2025, 2025, 1–29. [Google Scholar]
  53. Chylek, P.; Henderson, B.; Mishchenko, M. Satellite Based Retrieval of Aerosol Optical Thickness: The Effect of Sun and Satellite Geometry. Geophys. Res. Lett. 2003, 30, 2003GL016917. [Google Scholar] [CrossRef]
  54. Schutgens, N.; Sayer, A.M.; Heckel, A.; Hsu, C.; Jethva, H.; De Leeuw, G.; Leonard, P.J.T.; Levy, R.C.; Lipponen, A.; Lyapustin, A.; et al. An AeroCom–AeroSat Study: Intercomparison of Satellite AOD Datasets for Aerosol Model Evaluation. Atmos. Chem. Phys. 2020, 20, 12431–12457. [Google Scholar] [CrossRef]
  55. Di Ianni, A.; Costabile, F.; Barnaba, F.; Di Liberto, L.; Weinhold, K.; Wiedensohler, A.; Struckmeier, C.; Drewnick, F.; Gobbi, G. Black Carbon Aerosol in Rome (Italy): Inference of a Long-Term (2001–2017) Record and Related Trends from AERONET Sun-Photometry Data. Atmosphere 2018, 9, 81. [Google Scholar] [CrossRef]
  56. Rogozovsky, I.; Ohneiser, K.; Lyapustin, A.; Ansmann, A.; Chudnovsky, A. The Impact of Different Aerosol Layering Conditions on the High-Resolution MODIS/MAIAC AOD Retrieval Bias: The Uncertainty Analysis. Atmos. Environ. 2023, 309, 119930. [Google Scholar] [CrossRef]
  57. Calidonna, C.R.; Avolio, E.; Gullì, D.; Ammoscato, I.; De Pino, M.; Donateo, A.; Lo Feudo, T. Five Years of Dust Episodes at the Southern Italy GAW Regional Coastal Mediterranean Observatory: Multisensors and Modeling Analysis. Atmosphere 2020, 11, 456. [Google Scholar] [CrossRef]
  58. Cuevas-Agulló, E.; Barriopedro, D.; García, R.D.; Alonso-Pérez, S.; González-Alemán, J.J.; Werner, E.; Suárez, D.; Bustos, J.J.; García-Castrillo, G.; García, O.; et al. Sharp Increase in Saharan Dust Intrusions over the Western Euro-Mediterranean in February–March 2020–2022 and Associated Atmospheric Circulation. Atmos. Chem. Phys. 2024, 24, 4083–4104. [Google Scholar] [CrossRef]
  59. Barnaba, F.; Bolignano, A.; Di Liberto, L.; Morelli, M.; Lucarelli, F.; Nava, S.; Perrino, C.; Canepari, S.; Basart, S.; Costabile, F.; et al. Desert Dust Contribution to PM10 Loads in Italy: Methods and Recommendations Addressing the Relevant European Commission Guidelines in Support to the Air Quality Directive 2008/50. Atmos. Environ. 2017, 161, 288–305. [Google Scholar] [CrossRef]
  60. Gobbi, G.P.; Barnaba, F.; Di Liberto, L.; Bolignano, A.; Lucarelli, F.; Nava, S.; Perrino, C.; Pietrodangelo, A.; Basart, S.; Costabile, F.; et al. An Inclusive View of Saharan Dust Advections to Italy and the Central Mediterranean. Atmos. Environ. 2019, 201, 242–256. [Google Scholar] [CrossRef]
  61. Mallone, S.; Stafoggia, M.; Faustini, A.; Gobbi, G.P.; Marconi, A.; Forastiere, F. Saharan Dust and Associations between Particulate Matter and Daily Mortality in Rome, Italy. Environ. Health Perspect. 2011, 119, 1409–1414. [Google Scholar] [CrossRef] [PubMed]
  62. Zhu, H.; Martin, R.V.; Van Donkelaar, A.; Hammer, M.S.; Li, C.; Meng, J.; Oxford, C.R.; Liu, X.; Li, Y.; Zhang, D.; et al. Importance of Aerosol Composition and Aerosol Vertical Profiles in Global Spatial Variation in the Relationship between PM2.5 and Aerosol Optical Depth. Atmos. Chem. Phys. 2024, 24, 11565–11584. [Google Scholar] [CrossRef]
  63. Wu, Y.; Liu, D.; Tian, P.; Sheng, J.; Liu, Q.; Li, R.; Hu, K.; Jiang, X.; Li, S.; Bi, K.; et al. Tracing the Formation of Secondary Aerosols Influenced by Solar Radiation and Relative Humidity in Suburban Environment. JGR Atmos. 2022, 127, e2022JD036913. [Google Scholar] [CrossRef]
  64. Jerez, S.; Palacios-Peña, L.; Gutiérrez, C.; Jiménez-Guerrero, P.; López-Romero, J.M.; Pravia-Sarabia, E.; Montávez, J.P. Sensitivity of Surface Solar Radiation to Aerosol–Radiation and Aerosol–Cloud Interactions over Europe in WRFv3.6.1 Climatic Runs with Fully Interactive Aerosols. Geosci. Model. Dev. 2021, 14, 1533–1551. [Google Scholar] [CrossRef]
  65. Lindfors, A.V.; Kouremeti, N.; Arola, A.; Kazadzis, S.; Bais, A.F.; Laaksonen, A. Effective Aerosol Optical Depth from Pyranometer Measurements of Surface Solar Radiation (Global Radiation) at Thessaloniki, Greece. Atmos. Chem. Phys. 2013, 13, 3733–3741. [Google Scholar] [CrossRef]
  66. Che, H.; Xia, X.; Zhu, J.; Li, Z.; Dubovik, O.; Holben, B.; Goloub, P.; Chen, H.; Estelles, V.; Cuevas-Agulló, E.; et al. Column Aerosol Optical Properties and Aerosol Radiative Forcing during a Serious Haze-Fog Month over North China Plain in 2013 Based on Ground-Based Sunphotometer Measurements. Atmos. Chem. Phys. 2014, 14, 2125–2138. [Google Scholar] [CrossRef]
  67. Tomassetti, L.; Torre, M.; Tratzi, P.; Paolini, V.; Rizza, V.; Segreto, M.; Petracchini, F. Evaluation of Air Quality and Mobility Policies in 14 Large Italian Cities from 2006 to 2016. J. Environ. Sci. Health Part A 2020, 55, 886–902. [Google Scholar] [CrossRef]
  68. Saleem, F.; Hina, S.; Ullah, I.; Habib, A.; Hina, A.; Ilyas, S.; Hamid, M. Impacts of Irregular and Strategic Lockdown on Air Quality over Indo-Pak Subcontinent: Pre-to-Post COVID-19 Analysis. Chaos Solitons Fractals 2024, 178, 114255. [Google Scholar] [CrossRef]
  69. Battista, G.; De Lieto Vollaro, E.; De Lieto Vollaro, R. Analysis of the Main Anthropogenic Sources’ Contribution to Pollutant Emissions in the Lazio Region, Italy. Appl. Sci. 2021, 11, 7936. [Google Scholar] [CrossRef]
  70. Bassani, C.; Vichi, F.; Esposito, G.; Montagnoli, M.; Giusto, M.; Ianniello, A. Nitrogen Dioxide Reductions from Satellite and Surface Observations during COVID-19 Mitigation in Rome (Italy). Environ. Sci. Pollut. Res. 2021, 28, 22981–23004. [Google Scholar] [CrossRef] [PubMed]
  71. Garofalide, S.; Postolachi, C.; Cocean, A.; Cocean, G.; Motrescu, I.; Cocean, I.; Munteanu, B.S.; Prelipceanu, M.; Gurlui, S.; Leontie, L. Saharan Dust Storm Aerosol Characterization of the Event (9 to 13 May 2020) over European AERONET Sites. Atmosphere 2022, 13, 493. [Google Scholar] [CrossRef]
  72. Tositti, L.; Brattich, E.; Cassardo, C.; Morozzi, P.; Bracci, A.; Marinoni, A.; Di Sabatino, S.; Porcù, F.; Zappi, A. Development and Evolution of an Anomalous Asian Dust Event across Europe in March 2020. Atmos. Chem. Phys. 2022, 22, 4047–4073. [Google Scholar] [CrossRef]
  73. Valentini, S.; Barnaba, F.; Bernardoni, V.; Calzolai, G.; Costabile, F.; Di Liberto, L.; Forello, A.C.; Gobbi, G.P.; Gualtieri, M.; Lucarelli, F.; et al. Classifying Aerosol Particles through the Combination of Optical and Physical-Chemical Properties: Results from a Wintertime Campaign in Rome (Italy). Atmos. Res. 2020, 235, 104799. [Google Scholar] [CrossRef]
Figure 1. The study area (in red) includes Rome_Tor_Vergata AERONET station (TorVe), the Liberti Observatory (LibObs), the ARPA stations (red dots), the urban area of Rome (in orange) and the mixed area of southern Tiber Valley (in green). The Tiber River is shown as a blue line. Background map: Esri. (n.d.). World Imagery. Retrieved from https://www.arcgis.com/home/item.html?id=10df2279f9684e4a9f6a7f08febac2a9 (accessed on 3 February 2025) © Esri, Maxar, Earthstar Geographics, and the GIS User Community.
Remotesensing 17 02051 g001
Figure 2. MAIAC and AERONET TorVe AOD datasets: (a) time series considering all the observations of the two datasets during the temporal interval of the study; (b) time series considering the overlapping observations within 15 min time frame; (c) MAIAC AOD (MCD19a2) vs. AERONET AOD (TorVe), observations are represented in yellow, while the trend line is represented in red, and the bisector line in black.
Remotesensing 17 02051 g002
Figure 3. AODbias for TERRA (left) and AQUA (right) datasets as a function of (a) VZA; (b) RAA; (c) SZA; (d) SA. The numbers above green dots and the height of the pink columns represent the number of observations for each bin.
Remotesensing 17 02051 g003
Figure 4. (a) Correlation between SZA (<38°) and RAA; (b) correlation between SZA (>50°) and RAA.
Remotesensing 17 02051 g004
Figure 5. Correlation between SZA (<38°) and SA.
Remotesensing 17 02051 g005
Figure 6. Variation of AODbias at the variation in AERONET (a) AE 440–675 nm and (b) AOD 550 nm. The number of observations for each bin is reported below each bar.
Remotesensing 17 02051 g006
Figure 7. (a) AERONET AOD (>0.4)-AE correlation, identifying two clusters highlighted in green and blue; (b) AE (≤0.5)-AOD correlation.
Remotesensing 17 02051 g007
Figure 8. Meteorological data (maximum temperature and relative humidity) and MAIC AOD seasonal trends over 2001–2022 on a seasonal average.
Remotesensing 17 02051 g008
Figure 9. The maps show the annual AOD average in 2001, 2011, 2022; the DIFFafter (see Equation (7)) between 2011 and 2001, 2022 and 2011, 2022 and 2001. Lake Bracciano (circled in red) is located within the StA but was not considered in the analysis. TV area is delimited by the green box, while RM area is delimited by the orange box.
Remotesensing 17 02051 g009
Figure 10. Yearly AOD variation over the study area (blue), Rome (orange) and Tiber Valley (green) separately.
Remotesensing 17 02051 g010
Table 1. Descriptive statistics on the MAIAC AOD versus AEROET AOD over the TorVe study site. Rows one and two report the number of matching observations (N); the Kendall correlation coefficient (K) and the relative p-value; the Pearson correlation coefficient (R); the root mean square error (RMSE); the mean absolute error (MAE); the root mean bias (RMB). Rows three to five report the percentage of values within, below (<EE) and above (>EE) of the expected error (EE) for both equations of the EE.
NKp-ValueRRMSEMAERMB
42110.560.000.800.070.050.20
Within EE (%)<EE (%)>EE (%)
EE = ±(0.05 + 0.10 × AOD)72.3125.721.97
EE = ±(0.05 + 0.15 × AOD)77.7720.591.64
Table 2. Pearson correlation coefficient (R) and expected error (EE) in different AOD loading conditions.
AOD LoadingNumberPercentageRWithin EE (%)<EE (%)>EE (%)
AOD ≤ 0.2334279%0.685.49%12.57%1.94%
AOD > 0.286921%0.748.10%51.44%0.46%
Table 3. LTRR yearly mean and standard deviation for RM/StA and TV/StA over the studied time frame. LTRRRM/StA shows a clear positive deviation (>0.07), while LTRRTV/StA exhibit small negative deviations (<−0.035).
YearLTRRRM/StAStdLTRRTV/StAStd
20010.093±0.232−0.001±0.107
20020.133±0.2170.004±0.117
20030.070±0.179−0.017±0.106
20040.084±0.182−0.001±0.115
20050.106±0.2160.004±0.111
20060.115±0.212−0.014±0.11
20070.092±0.218−0.007±0.113
20080.098±0.203−0.013±0.101
20090.097±0.186−0.01±0.103
20100.109±0.206−0.029±0.120
20110.087±0.187−0.022±0.102
20120.084±0.211−0.011±0.1
20130.106±0.212−0.005±0.113
20140.076±0.217−0.03±0.114
20150.102±0.202−0.013±0.111
20160.110±0.219−0.002±0.117
20170.072±0.185−0.009±0.1
20180.110±0.214−0.014±0.121
20190.116±0.331−0.02±0.109
20200.164±0.305−0.02±0.107
20210.109±0.341−0.01±0.116
20220.114±0.334−0.007±0.104
Table 4. LTRR monthly mean and standard deviation for RM/StA and TV/StA over the studied time frame.
MonthLTRRRM/StAStdLTRRTV/StAStd
January0.129±0.212−0.044±0.107
February0.051±0.236−0.013±0.110
March0.049±0.2360.024±0.109
April0.045±0.2140.040±0.105
May0.038±0.2070.020±0.117
June0.041±0.219−0.018±0.112
July0.053±0.203−0.012±0.111
August0.124±0.204−0.008±0.095
September0.163±0.222−0.010±0.104
October0.207±0.227−0.020±0.109
November0.166±0.210−0.040±0.101
December0.130±0.212−0.058±0.108
Disclaimer/Publisher’s Note: The statements, opinions and data contained in all publications are solely those of the individual author(s) and contributor(s) and not of MDPI and/or the editor(s). MDPI and/or the editor(s) disclaim responsibility for any injury to people or property resulting from any ideas, methods, instructions or products referred to in the content.

