Article

Remote Sensing of Seismic Signals via Enhanced Moiré-Based Apparatus Integrated with Active Convolved Illumination

by
Adrian A. Moazzam
1,
Anindya Ghoshroy
1,
Durdu Ö. Güney
1,2 and
Roohollah Askari
3,*
1
Department of Electrical and Computer Engineering, Michigan Technological University, Houghton, MI 49931, USA
2
John A. Paulson School of Engineering and Applied Sciences, Harvard University, Cambridge, MA 02138, USA
3
Geological and Mining Engineering and Sciences, Michigan Technological University, Houghton, MI 49931, USA
*
Author to whom correspondence should be addressed.
Remote Sens. 2025, 17(12), 2032; https://doi.org/10.3390/rs17122032
Submission received: 16 April 2025 / Revised: 26 May 2025 / Accepted: 9 June 2025 / Published: 12 June 2025
(This article belongs to the Section Earth Observation Data)

Abstract

:
The remote sensing of seismic waves in challenging and hazardous environments, such as active volcanic regions, remains a critical yet unresolved challenge. Conventional methods, including laser Doppler interferometry, InSAR, and stereo vision, are often hindered by atmospheric turbulence or necessitate access to observation sites, significantly limiting their applicability. To overcome these constraints, this study introduces a Moiré-based apparatus augmented with active convolved illumination (ACI). The system leverages the displacement-magnifying properties of Moiré patterns to achieve high precision in detecting subtle ground movements. Additionally, ACI effectively mitigates atmospheric fluctuations, reducing the distortion and alteration of measurement signals caused by these fluctuations. We validated the performance of this integrated solution through over 1900 simulations under diverse turbulence intensities. The results illustrate the synergistic capabilities of the Moiré apparatus and ACI in preserving the fidelity of Moiré fringes, enabling reliable displacement measurements even under conditions where passive methods fail. This study establishes a cost-effective, scalable, and non-invasive framework for remote seismic monitoring, offering transformative potential across geophysics, volcanology, structural analysis, metrology, and other domains requiring precise displacement measurements under extreme conditions.

1. Introduction

When two identical gratings are overlaid with a slight rotational offset, a series of fringes perpendicular to the gratings emerges (see Figure 1), which is known as the Moiré pattern [1]. Despite their simplicity, these patterns provide powerful tools for analyzing and interpreting various types of deformations and displacements. If either of these gratings moves slightly in the vertical direction, the Moiré patterns shift significantly in the horizontal direction, effectively magnifying the vertical displacement of the grating (Figure 1b,c). This magnification enables the detection of fine movements [2,3].
Moiré patterns have found beneficial applications in various domains, including nanomaterials [4], nanophotonics [5,6], super-resolution microscopy [7], diffusion coefficients in liquids [8], and thermal conductivity [9]. In addition, they have application in optical distortion correction [10], microelectronic devices [11,12,13,14,15], material characterization [16], clinical diagnosis [17,18,19,20], biomechanics [21], fracture mechanics [22,23], damage mechanisms [24], and textile composites [25]. The concept of Moiré patterns has been applied in the fabrication of metasurfaces [26] and anti-counterfeiting measures [27]. The Moiré technique has been widely employed to accurately measure minuscule physical quantities, including surface vibrations [28], surface roughness assessment [29], stress and strain analysis and deformation measurement [30,31,32,33], micromechanics [34,35], generation of surface contours [36], three-dimensional (3D) topography metrology [37], and face-spoofing detection [38].
The Moiré technique has also been adopted for remote sensing displacement measurements [39,40], where one grating is placed at the location of interest and another at a designated observation location. Such a configuration can enable the remote sensing of seismic motion at locations where the deployment of conventional seismometers or geophones is impossible (e.g., the area close to a volcanic edifice due to the safety hazards for the acquisition crews). Ground deformations, such as crater uplift, subsidence, or vibrations caused by explosive eruptions, gas venting, and rockfalls, typically range from approximately 3–5 cm [41] to several tens of centimeters [42], making these deformations detectable by using this approach. Such measurements near volcanic craters will enhance our understanding of near-surface volcanic dynamics. However, similar to any optical-based remote sensing technique, the accuracy of this method in remote displacement measurements can be hampered by atmospheric turbulence. Various solutions, including adaptive optics [43], blind deconvolution [44], and machine learning [45], can be applied to mitigate these effects. In this study, we specifically focus on the active convolved illumination (ACI) technique. ACI is an optical technique where a target pattern (e.g., an object in an imaging system) is convolved actively with an external beam designed carefully based on the stochastic characteristics of the system under consideration. With this approach, ACI can effectively address system imperfections such as absorption, attenuation, noise, and distortion across coherent near-field, incoherent near-field, and incoherent far-field systems [46,47,48,49,50,51,52,53,54,55]. In the presence of turbulence, the centroid of the optical beam displaces randomly off-axis from its designated propagation path, a phenomenon known as beam wandering [56]. ACI has shown significant potential in mitigating turbulence-induced distortions, including beam wandering and geometric deformation, enabling image recovery under highly distorted turbulent conditions [57,58]. Furthermore, the implementation of ACI does not preclude the incorporation of additional methods for further enhancement, thereby establishing ACI as a highly viable candidate for this application.
In this study, we present a Moiré-based apparatus designed for the remote sensing of seismic waves (ground displacement) under turbulent atmospheric conditions capable of actively tracking transient ground motions characteristic of seismic wave propagation. We provide simulation results demonstrating the capability of this apparatus using gratings to remotely measure sub-millimeter-scale physical displacements over a distance of 1 km with sub-second temporal resolution. This makes it a valuable tool for hazard assessment and volcanic activity monitoring. To address the challenges posed by atmospheric distortions, which introduce errors in ground displacement measurements, we employ ACI. This advanced optical compensation technique enhances the fidelity of image propagation through turbulent media, enabling more accurate displacement measurements. It is important to emphasize that the cumulative effects of beam wandering and wavefront aberrations fundamentally limit high spatiotemporal resolution in remote sensing applications employing Moiré gratings. Here we address this fundamental limitation, which exists irrespective of the homogeneity or isotropy of the propagation medium. The evaluation of over 1900 grating displacement cases under varying propagation conditions, considered here, numerically demonstrates the effectiveness of ACI in preserving the fidelity of remote sensing systems under moderate atmospheric distortions. This framework offers a robust pathway for precise measurements across diverse fields, including metrology, seismology, and remote sensing, where accuracy is paramount.

2. Background

2.1. State-of-the-Art Seismic Remote Sensing Methods

Seismic signals provide critical information about volcanic unrest, including the migration of gas and magma through the shallow crust [59]. In volcanology, seismic signals originating from near-surface sources or events can provide critical insights into magma migration and pre-eruption pressurization [60]. However, detecting these signals is challenging because they may be too weak to be recorded by conventional seismometers, which are often placed at safe distances from the volcanic edifice. Additionally, areas near volcanic edifices are typically highly attenuating, with alternating layers of poorly consolidated, or unconsolidated tephra interspersed with more competent lava flows [61]. Topographic scattering further complicates the recorded signals. These effects especially hamper recording high-frequency small events. Signals can be severely distorted within hundreds of meters of the source, complicating the interpretation of the source process [62]. In order to detect and characterize these signals, it is necessary to place seismometers very close to the source, which is often a dangerous place for people to visit. Furthermore, sensors placed in hazardous areas are vulnerable and can be destroyed in an eruption.
Moiré patterns exhibit unique properties that enable their application in measuring displacement, making them a promising tool for seismic remote sensing. Remote sensing seismology involves measuring ground motion at a safe distance from a target location, unlike traditional seismic recording, which requires sensors to be manually placed on the ground. However, achieving a resolution comparable to conventional seismometers is highly challenging in practice. Two seismic remote sensing methods, laser Doppler interferometry (LDI) (Berni, [63]) and stereo vision, have been proposed but with significant limitations in their practical implementation. LDI detects surface vibrations by measuring the Doppler frequency shift resulting from ground motion velocity [64]. Berni [63] developed an LDI system to measure ground velocity and compared its performance with conventional geophones. Although LDI provides comparable results to geophones under strong motion conditions, when ground velocity is weak, the LDI measurements are significantly affected by atmospheric turbulence. This turbulence, caused by convective air currents generated when the ground is heated by solar radiation, induces random frequency fluctuations in the laser beam, which interfere with the desired Doppler signal. To mitigate this effect, Berni [63] introduced differential laser Doppler interferometry (DLDI), using a beam splitter and reflector positioned at the target. Although the LDI and DLDI techniques have been widely used in structural engineering to detect vibrations (e.g., Stanbridge et al. [65]), they have not been applied in seismological studies, particularly for volcano seismology, due to several limitations. For remote targets, a high-power laser source is required, raising significant safety concerns for the acquisition team. Additionally, the precise positioning of the reflector is crucial to ensuring that the reflected laser beam can be detected by the LDI/DLDI apparatus. This poses challenges when deploying reflectors in areas accessible only by unmanned aerial vehicles (UAVs). Even when positioned accurately, the reflectors are susceptible to misalignment due to volcanic activity or wind, which can result in the reflected beam becoming undetectable.
Rapstine et al. [66] developed a remote sensing method based on stereo vision theory, utilizing two laterally offset cameras (stereo cameras) to capture images from a desired location. By analyzing the disparities between the images taken by the two cameras, lateral shifts in remote locations can be measured, enabling the calculation of 3D ground motion. For field applications, Rapstine et al. [66] proposed the use of a UAV to carry the stereo camera close to the target location, making remote sensing through this technology feasible. However, the authors emphasized that accurate knowledge of the location and orientation of the cameras is crucial, which is often difficult to achieve in practice. To address this limitation, Rapstine [67] introduced a framework in which only approximate positioning and orientation are required, provided that three conditions are met: (1) the movements and rotations of the stereo camera mounted on a UAV can be described by an analytic function over time, (2) the seismic signals have strong amplitudes during the measurement period, and (3) the ground motion follows a rigid translation. Although these conditions may be met during active seismic data acquisition (e.g., reflection seismology), where the acquisition time is brief, they are generally violated in passive seismic recordings, such as those in volcanic settings, rendering stereo technology impractical in such cases.
Another unconventional technique to measure seismic motions is based on global navigation satellite systems (GNSSs). GNSS-based techniques are typically divided into two categories: relative positioning (RP) [68] and precise point positioning (PPP) [69]. The RP approach requires at least one fixed GNSS as a reference station [69], whereas the PPP method eliminates the need for a reference station by utilizing precise satellite orbits and clocks. The success of RP, however, depends on the isolation of the base station, as surface vibration may affect both the base and recording stations, which makes seismic displacement measurements unreliable [70]. The PPP approach, on the other hand, depends on the availability of precise satellite orbits and clocks [71]. Despite its promise, GNSS-based seismic recording in remote and hazardous areas, such as volcanoes, poses significant challenges. Even if deployed via UAVs, the potential loss or damage of equipment due to volcanic activity could prove costly.
Satellite-based interferometric synthetic aperture radar (InSAR) employs radar signals from orbiting satellites to generate detailed maps of ground deformation over extensive regions. However, its performance is often hindered by atmospheric disturbances and the delay between successive satellite passes, which can restrict its ability to capture rapid deformation events [72,73]. In contrast, ground-based interferometric synthetic aperture radar (GBInSAR) provides the more rapid monitoring of localized deformation, typically updating measurements in the order of a few minutes. Nonetheless, its effectiveness can also be compromised by atmospheric conditions. Additionally, complex terrain may cause radar signals to reflect off multiple surfaces, which introduces phase ambiguities. Variations in surface properties can also alter the scattering behavior of the radar signal, potentially reducing measurement accuracy [74,75].
Volcanic monitoring poses significant logistical and safety challenges. Active volcanic regions are frequently inaccessible due to rugged, unstable terrain or remote locations, complicating installation and maintenance logistics. Additionally, deploying and servicing monitoring equipment is hazardous due to high risks from volcanic activities, such as extreme conditions, instability, ashfall, corrosive gases, and eruptions.
Additionally, high-frequency seismic signals attenuate significantly as they propagate; thus, positioning measurement instruments far from volcanic sources severely limits the detection and accurate recording of such activities. Consequently, there is a critical need for robust and safe methodologies capable of deploying and maintaining monitoring equipment near volcanic vents without endangering personnel.
Moreover, even advanced and expensive devices may become challenging to replace if damaged by volcanic activity, underscoring the importance of developing simpler, lower-cost, and easily replaceable monitoring solutions. Also, enhancing the temporal sampling rate would further enable capturing and recording higher-frequency volcanic events, significantly improving the comprehensiveness and effectiveness of volcanic monitoring efforts.
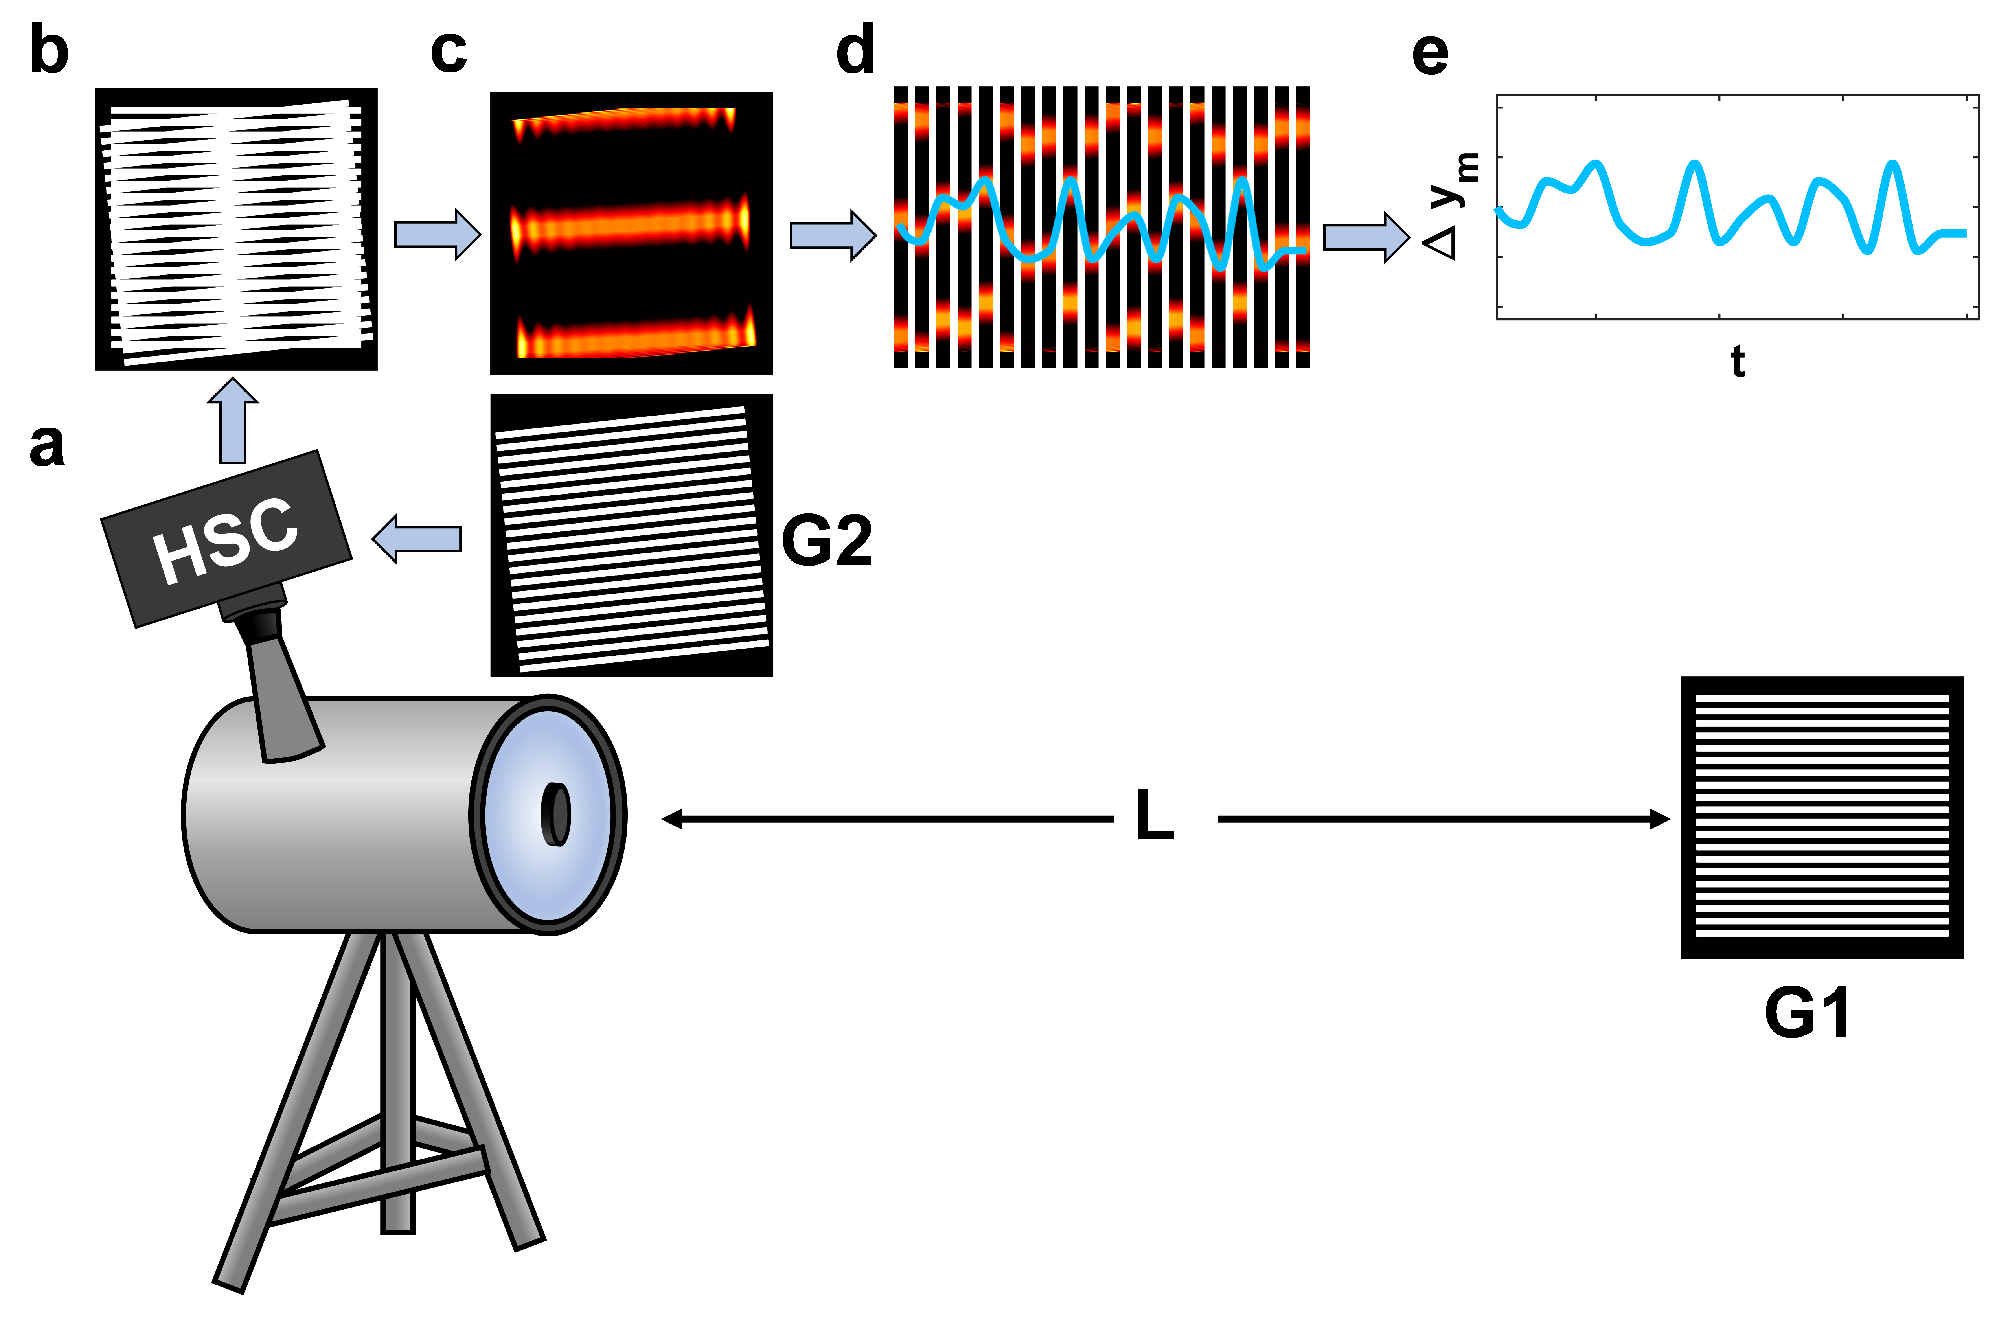
One promising approach to achieving reliable seismic remote sensing involves the use of a Moiré-based apparatus (Figure 2). We present a remote sensing apparatus explicitly designed for capturing seismological signals, harnessing the power of Moiré pattern-based technology. This innovative apparatus potentially offers remarkable cost-effectiveness, ease of replacement, and straightforward installation, making it a practical and efficient solution for seismic monitoring. One potential implementation of this setup highlights the system’s notable self-sustaining nature at the remote site (i.e., where only the base grating is located) without needing an external power source. This characteristic renders it particularly well-suited for deployment in remote and challenging environments, where access to continuous power may be limited or impractical.
However, the effectiveness of remote sensing techniques can be severely hampered by atmospheric perturbations that have a detrimental impact on image quality. This issue becomes particularly critical in scenarios like volcanic seismic remote sensing, where precise and accurate imaging is paramount for effective monitoring. The challenge of overcoming turbulent atmospheric conditions remains a significant undertaking in various scientific and engineering fields, which will be discussed further in the next section.

2.2. Moiré-Based Apparatus

To define Moiré patterns, we use two identical, finite periodic gratings, each consisting of equidistant straight lines with a pitch denoted by d. When one grating, as shown in Figure 1a, is slightly rotated with respect to the other, a set of Moiré fringes, as depicted in Figure 1b, emerges. The fringe spacing ( d f ) produced by this configuration depends on the angular offset ( α ) between the gratings and is expressed as
d f = d 2 sin ( α / 2 ) d α ,
where the small-angle approximation 2 sin ( α / 2 ) α is applied. This relationship illustrates how the fringe spacing is influenced by the intrinsic characteristics of the gratings and their relative orientation. A displacement Δ y in one of the gratings in Figure 1b shifts the observed interference pattern by Δ y f = Δ y / α , as illustrated in Figure 1b,c. The angular offset ( α ) between the patterns governs the periodicity of the Moiré fringes and significantly impacts the system’s sensitivity by amplifying displacements. For a given pattern, reducing the angular offset results in a more pronounced shift in the Moiré fringes, with the magnification scaling proportionally to 1 / α . This enhanced sensitivity facilitates the precise detection of minuscule displacements of the base grating, as these shifts are clearly represented in the interference pattern. While smaller angular offsets could further enhance displacement magnification, they would substantially limit the achievable measurement range. Additionally, a wide range of displacements, including larger ones, can be measured by simply adjusting this angular offset. Consequently, this study evaluated various angular offsets and identified α = 6 ° as the optimal value. This offset was consistently applied throughout the work, as it offers a balanced trade-off between sensitivity and measurement range.
We aim to design and implement a new remote sensor system capable of measuring seismic waves near the sources of active deformation (Figure 3a). We use inexpensive components, such as a simple printed or etched grating pattern mounted on either a standard or a tetrahedral frame deployable via a UAV. This system eliminates risks to field crews by operating in hazardous areas. It offers the capability to detect seismic signals in locations currently inaccessible to existing technologies. This remote sensing approach addresses a critical need in volcano seismology: the ability to record microseismicity associated with processes occurring in close proximity to an active vent, all while ensuring safety and operational efficiency.
In the Moiré apparatus, ideally, when viewed through a clear, non-turbulent atmosphere free from fog, aerosols, and clouds, higher resolution can be achieved by employing a telescope with a larger aperture diameter. For a telescope with an aperture diameter D, paired with a monochromatic camera operating at a wavelength λ , the minimum spatial resolution detectable at L is expressed as Δ l s = 1.22 L λ / D . This resolution sets the threshold for the smallest pitch size that can be used effectively in the base grating.
The resolution of the camera in conjunction with the telescope also plays a critical role in the performance of the system. If the camera resolution is lower than the telescope resolution, the features that the telescope can resolve cannot be effectively recorded. This highlights the importance of ensuring that the camera’s resolution matches or exceeds the optical resolution of the telescope for optimal detection.
The ability to resolve finer features through the telescope and its paired camera allows the system to utilize gratings with smaller pitch sizes. This, in turn, results in higher resolution in detection and facilitates the measurement of finer ground displacements. However, under atmospheric turbulence, increasing the telescope’s aperture diameter also amplifies the distortion introduced by the atmosphere, which can degrade the quality of the detected image and limit the smallest feasible pitch size of the grating, as discussed in detail in Section 2.3. It is also important to note that using a grating with a pitch size at the limit of the setup’s spatial resolution may not always be advantageous. On the other hand, employing gratings with larger pitch sizes can mitigate certain atmospheric effects, albeit at the cost of reduced measurement resolution, as further elaborated in Section 3.
The Moiré apparatus comprises a primary grating (base grating), positioned directly in the field, such as near a volcanic crater, and can be conveniently deployed via a UAV. A telescope, located at a safe distance L from the base grating and equipped with a high-speed camera, is used to observe and monitor the grating, as illustrated in Figure 2 and Figure 3a. This remote placement provides a secure operational environment for the telescope and attending personnel. To further enhance stability and mitigate external noise sources, such as vibrations induced by wind and ground motion, the telescope is housed within a protective observational tent and mounted on a vibration isolation platform. In a non-turbulent environment, the image captured by the telescope should accurately represent the original grating. Subsequently, a secondary, or revealing, grating can be digitally superimposed onto the captured image of the base grating to produce the Moiré fringes depicted in Figure 3b. By repeatedly monitoring the base grating over time, multiple snapshots are obtained; for each snapshot, the revealing layer is applied to generate the corresponding Moiré fringes. If the ground shifts, the base grating will move accordingly, and the Moiré fringes will display this displacement at a magnified scale, facilitating the detection of even minor movements. A series of post-processing steps, outlined in Figure 3c, are then employed to enhance the clarity of the fringes. Tracking the positions of these fringes in each snapshot allows for the precise recording of the base grating’s location at each time point. With multiple time-separated snapshots (corresponding to the sampling rate of base grating monitoring), a discrete temporal series of base grating positions is established, as shown in Figure 3d, from which the ground displacement can be deduced, as depicted in Figure 3e.

2.3. Active Convolved Illumination to Improve Wave Propagation in a Turbulent Volume

The operating principle of ACI is illustrated in Figure 4 in the context of remote sensing with Moiré patterns. More details on ACI for the high-fidelity transmission of complex target beams through turbulent atmosphere can be found in [57]. Generally, as an optical mode propagates through a turbid medium, it undergoes various forms of distortion, including geometric deformation or warping, scintillation (intensity fluctuations), contrast degradation, and beam wandering, often referred to as “image dancing”, beam tilt, or higher-order aberrations [76]. These effects cause distant targets, such as gratings, to become distorted and difficult to observe. The degree of distortion is governed by the turbulence volume within the diffraction cone of the propagating mode and depends on factors such as the distance between the target and the observation plane ( L ), the wavelength ( λ ), the refractive index structure parameter ( C n 2 ), and the spatial frequency content of the mode. Turbulence distorted beams are indicated as dashed arrows in Figure 4.
Let us consider a grating positioned at a remote location with a turbulent volume between the grating and the observation plane (such as a telescope or camera), as shown in Figure 4. Accurately monitoring physical displacements of the base layer becomes challenging if not impossible depending on the ambient conditions. In a weakly turbulent medium, random off-axis centroid shifts in the reconstructed base layer caused by beam wandering can be magnified during the subsequent interferometric step. This makes it challenging to accurately determine the physical displacement of the base layer, especially when the variance in the centroid shift due to turbulence starts to become similar in magnitude to that of the physical displacement itself. Under conditions of stronger turbulence, the overall geometry of the reconstructed base layer can be too heavily distorted to generate a Moiré pattern physically. This is illustrated in Figure 4. In principle, the residual geometric deformation of the reconstructed base layer can be corrected with sophisticated numerical post-processing methods such as blind deconvolution or deep learning since the original geometry is known. However, the physical displacement of the base layer may still be irretrievable, even with these methods.
Beam wandering is generally considered a bivariate independent stochastic process in the transverse plane. In our study, we focus on measuring physical displacements of the base layer along one axis, such as the y-axis. However, displacements along both axes can be captured by using two perpendicular gratings or by employing different types of gratings [77].
With ACI, the Moiré apparatus described here is capable of detecting subtle ground movements in the order of a few hundred micrometers, enabling potentially the observation of minute changes at volcanic sites. In general, under moderate-turbulence conditions where the structure constant typically lies in the range of 6.4 × 10 16 C n 2 2.5 × 10 15   m 2 / 3 , the variance in focal spot beam wandering is typically comparable to or larger than the dynamic displacement measurements considered in this work assuming that the base layer is remotely positioned at least a few hundred meters from the detector [78]. The severity of distortion is considerably worse over longer propagation distances or under worsening ambient conditions. Additionally, precise measurements of such small displacements necessitate the use of gratings with features comparable to if not smaller than the statistical long-exposure resolution limit of the atmosphere. Therefore, the severity of both beam wandering and higher-order aberrations is expected to be strong.
In this work, we propose an implementation of ACI to mitigate the impact of turbulence-related distortion on the Moiré patterns and the resultant displacement measurements. We previously proposed that ACI can simultaneously mitigate turbulence-related beam wandering and geometric distortion [57]. This would enable the robust propagation of sophisticated optical modes through a turbulent medium. The concept has been extended to the present study, where we are interested in propagating the base grating in a minimally distorted state.
With ACI, the accumulative multi-path distortion encountered within the diffraction cone of the base layer is characterized with a set of OAM modes. Each mode samples the distortion within a segment of the total diffraction cone. After reconstruction, the OAM modes (see dashed blue arrows in Figure 4) contain the spatiotemporal snapshot of the turbulence-induced distortion at the moment when each mode is propagated through the medium. The reciprocal space analysis of each distorted OAM mode is used to determine a set of correlation-injecting sources (CISs) indicated by the gray arrow. The set of CISs can be thought of as a set of orthogonal narrow-band beams possessing the capability to correct distortions incurred within their own diffraction cones. Through convolution, this unique property is injected into the base layer, yielding a set of correlation-injected partial targets. The modification introduced into the base layer through convolution with the CISs is referred to as the auxiliary source. Therefore, the correlation-injected target can be thought of as a superposition of the base layer with an auxiliary source, where the latter is correlated with both the ground truth and the CISs. During the transmission process, the auxiliary source exchanges energy with the base layer, compensating for the distortion the latter would incur. Assuming that a set of orthogonal narrow-band CISs can be perfectly generated, then the auxiliary source fully vanishes at the output, and perfect transmission is achieved. However, imperfections in the characterization and generation stages lower the efficacy of the CISs, even though strong distortion mitigation is achieved. An illustrative example of a base layer reconstructed with ACI and the corresponding Moiré pattern are shown in Figure 4. Note that the CIS characterization assumes no information about the mode geometry of the base layer nor its transversal position relative to the optical axis. Therefore, propagating the base grating in a minimally distorted state would potentially enable significantly more accurate estimation of its physical displacements. Although the OAM beams are introduced on the base grating side in Figure 4, in principle, they could also be transmitted from and processed at the telescope side. Additionally, the implementation of ACI here is compatible with the integration of other techniques, such as blind deconvolution [79,80] and deep learning [81,82], allowing for the development of hybrid technologies with enhanced performance. For a more detailed understanding of the operating principle of ACI, the reader is referred to [57].

3. Data Simulation Framework

Accurate displacement measurements using the Moiré apparatus remain challenging even under low-turbulence conditions (small C n 2 values) due to atmospheric distortion. Beam wandering, a prevalent issue under these conditions, can be easily misinterpreted as actual grating displacement, thereby complicating measurement accuracy.
Our prior work [57] thoroughly analyzed the principles of ACI in turbulent environments. It illustrated ACI’s robust capacity during atmospheric propagation in managing the reliable transmission of various objects under distortion, as detailed in Section 2.3. In the current setup, a digital revealing layer is utilized to enhance compatibility with ACI. Ideally, upon superimposition, the Moiré fringes should be clearly visible and aligned in a straight line. However, at low levels of atmospheric distortion, the beam wandering effect may be observed, causing the Moiré fringes to appear straight and clear but misaligned due to the slight displacement of the base grating from its actual position.
To gain insights into how atmospheric distortion affects a grating, we simulated its propagation through a turbulent medium by using the split-step method [83] and von Kármán’s power spectral density model. The statistical averages of the largest and smallest turbulent eddies are represented by the outer scale L 0 = 100 m and the inner scale l 0 = 1 cm [84], respectively. A spatially coherent uniform plane wave is assumed to be normally incident on a planar reflective grating at the base layer location ( z = 0 ). The reflected field distribution is represented by g ( r , z = 0 ) C , where r R 2 denotes the position coordinates. The reflected beam propagates over a distance of L = 1   km . For a system with constant propagation distance and monochromatic wavelength, at λ = 1550 nm , we considered different turbulent conditions within 1 × 10 15 C n 2 7 × 10 15 m 2 / 3 . After this propagation, the distorted grating is reconstructed, and the result is expressed as
g ( r , z = L ) = S t { g ( r , z = 0 ) } , g ˜ ( r ) = R { g ( r , z = L ) } ,
where S t represents the propagation operator, while g ( r , z = L ) refers to the transverse field distribution on the observation plane. The reconstructed transverse field distribution of the grating is denoted by g ˜ ( r ) , with R serving as the reconstruction operator. A range of methods [79,85,86,87,88] can be employed for R . However, for simplicity, R is modeled here as a basic deconvolution operator, utilizing a point spread function (PSF) derived from vacuum propagation. The PSF is generated via the angular spectrum method, simulating the vacuum propagation of a point source. For the simulation framework, a discretized grid of 8192 × 8192 pixels was utilized, with each pixel corresponding to a physical dimension of 0.35 mm in both the source and observation planes. Note that the spatial sampling parameters are selected to ensure that good accuracy with the angular spectrum propagation method is maintained when simulating wave propagation through turbulence. All numerical simulations were conducted using MATLAB (R2022a).
The severity of turbulence is measured by the ratio Δ l t / Δ l s [57], where Δ l t = 1.22 L λ / r 0 represents the atmospheric resolution limit, with r 0 being the Fried parameter. Here, D, in Δ l s , is assumed to be the diameter of a phantom aperture that encloses 1 1 / e 2 of the total power in the diffraction pattern at the observation plane. This ratio, Δ l t / Δ l s , is employed to estimate turbulence-induced aberrations and serves as an alternative to the conventional measurement of D / r 0 , where D represents the imaging aperture. Additionally, anisoplanatism severity is quantified by the ratio θ s / θ t , where θ s is the field size at the source plane and θ t is the isoplanatic patch, defined as the product of the isoplanatic angle and the propagation distance L .
For the simulated results, we use the normalized cross-correlation (NCC) metric, ξ , to evaluate distortion and the effects of turbulence. The NCC values for wave propagation with and without ACI are denoted by ξ A and ξ P , respectively.
Throughout this work, we use periodic gratings consisting of 20 equidistant strips with pitch d = 4.9 mm to generate the Moiré patterns. We set the overall grating width to 100 mm to limit the severity of anisoplanatism to be within θ s / θ t 2 , similar to [57]. It is important to note that only refractive index inhomogeneities larger than the overall optical mode size contribute to beam wandering. Therefore, optimizing the grating geometry can help mitigate this effect. However, increasing the optical mode size typically leads to reduced sensitivity in interferometric displacement measurements, making it more difficult to detect small physical displacements of the base layer. We carefully select the grating parameters to ensure that the remote detection of sub-millimeter-scale displacements from a distance of 1 km is feasible with reasonable accuracy.
In a weakly turbulent medium, the displacement observed in the Moiré pattern is influenced by both the physical displacement of the base layer Δ y and the turbulence-induced centroid shift in the reconstructed base layer. Consequently, the measured displacement of the Moiré pattern can be represented as
Δ y f Δ y + Δ y T α ,
where Δ y T is the turbulence-induced centroid shift. Therefore, the displacement calculated from a faulty measurement is Δ y m = α Δ y f . We study and compare the fidelity of displacement measurements for Δ y Δ y T with and without ACI in subsequent discussions. Additionally, we consider the more extreme case where the geometric deformation from higher-order aberrations on the reconstructed base layer is too severe to even generate a Moiré pattern.

4. Results

The performance of Moiré-based remote sensing under varying atmospheric turbulence levels is critical to accurate displacement measurement. This section explores a comprehensive analysis of the effects of atmospheric distortion, characterized by C n 2 values, on the visibility and clarity of the Moiré fringes. The evaluation includes scenarios both with and without ACI, highlighting the robustness of ACI in preserving fringe fidelity and improving displacement detection across different turbulence conditions. Additionally, methods for fringe extraction and displacement tracking are discussed, emphasizing the role of filtering and cross-correlation in enhancing measurement accuracy.

4.1. Performance Across Turbulence Levels

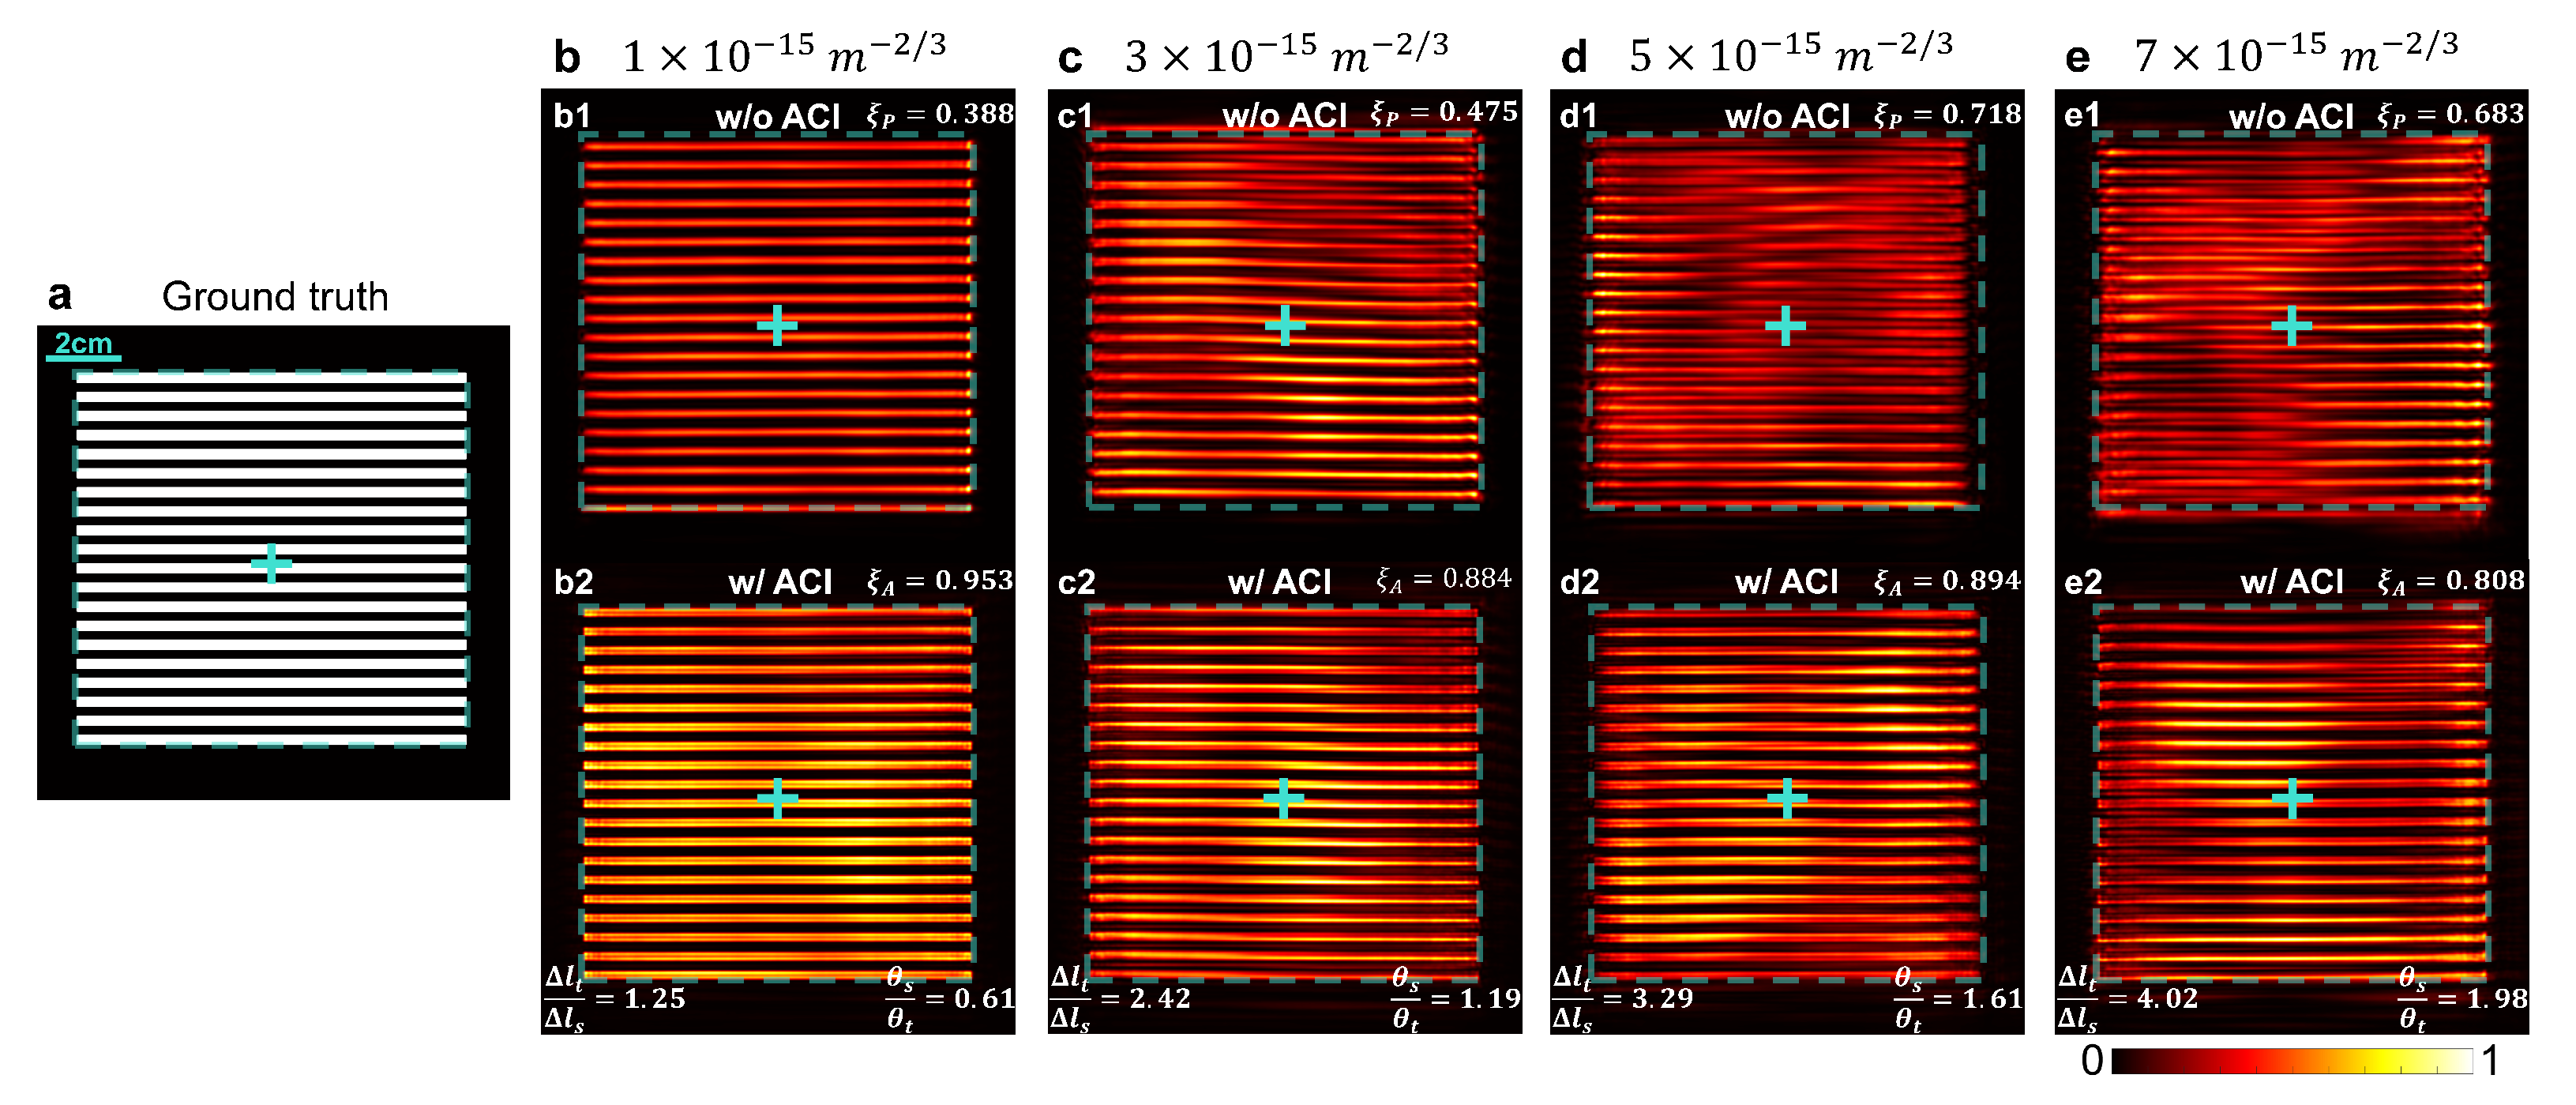
When there is atmospheric turbulence, characterized by increasing C n 2 values, the visibility of the Moiré fringes progressively deteriorates. These distortions disrupt fringe alignment, causing the patterns to appear distorted or unclear, particularly in passive configurations. At lower C n 2 values, as illustrated in Figure 5(b1,c1), beam wandering emerges as the dominant source of degradation, introducing errors in displacement measurements, although extraction remains feasible with limited accuracy, as will be shown in subsequent discussions. As turbulence intensifies at higher C n 2 values, as shown in Figure 5(d1,e1), the increased atmospheric distortion damages the grating reconstructions. This makes producing the Moiré fringes nearly impossible.
ACI substantially mitigates the effects of turbulence, preserving the alignment and visibility of the Moiré fringes even under higher- C n 2 conditions, because, as we numerically demonstrate in Figure 5(b2–e2), the ACI-enhanced images are well-centered and possess higher contrast. This enables accurate displacement measurements across all turbulence levels analyzed.
The reconstructed grating remains visible in the active cases across all the C n 2 values. In contrast, the passive cases maintain clarity only up to Δ l t / Δ l s = 2.42 (i.e., C n 2 = 3 × 10 15   m 2 / 3 ), as illustrated in Figure 5(b1,c1). At this threshold, significant beam wandering along the pattern’s periodicity leads to a noticeable drop in NCC values. For higher turbulence intensities, the effects of atmospheric distortion become increasingly pronounced in the passive cases, as observed in Figure 5(d1,e1), further reducing the clarity of the reconstructed pattern. Interestingly, beam wandering shifts the grating orientation in such a way that higher NCC values are obtained in these cases compared with those in Figure 5(b1,c1). Given these limitations of a single atmospheric realization in capturing the full impact of C n 2 , a larger ensemble is analyzed in a subsequent discussion.
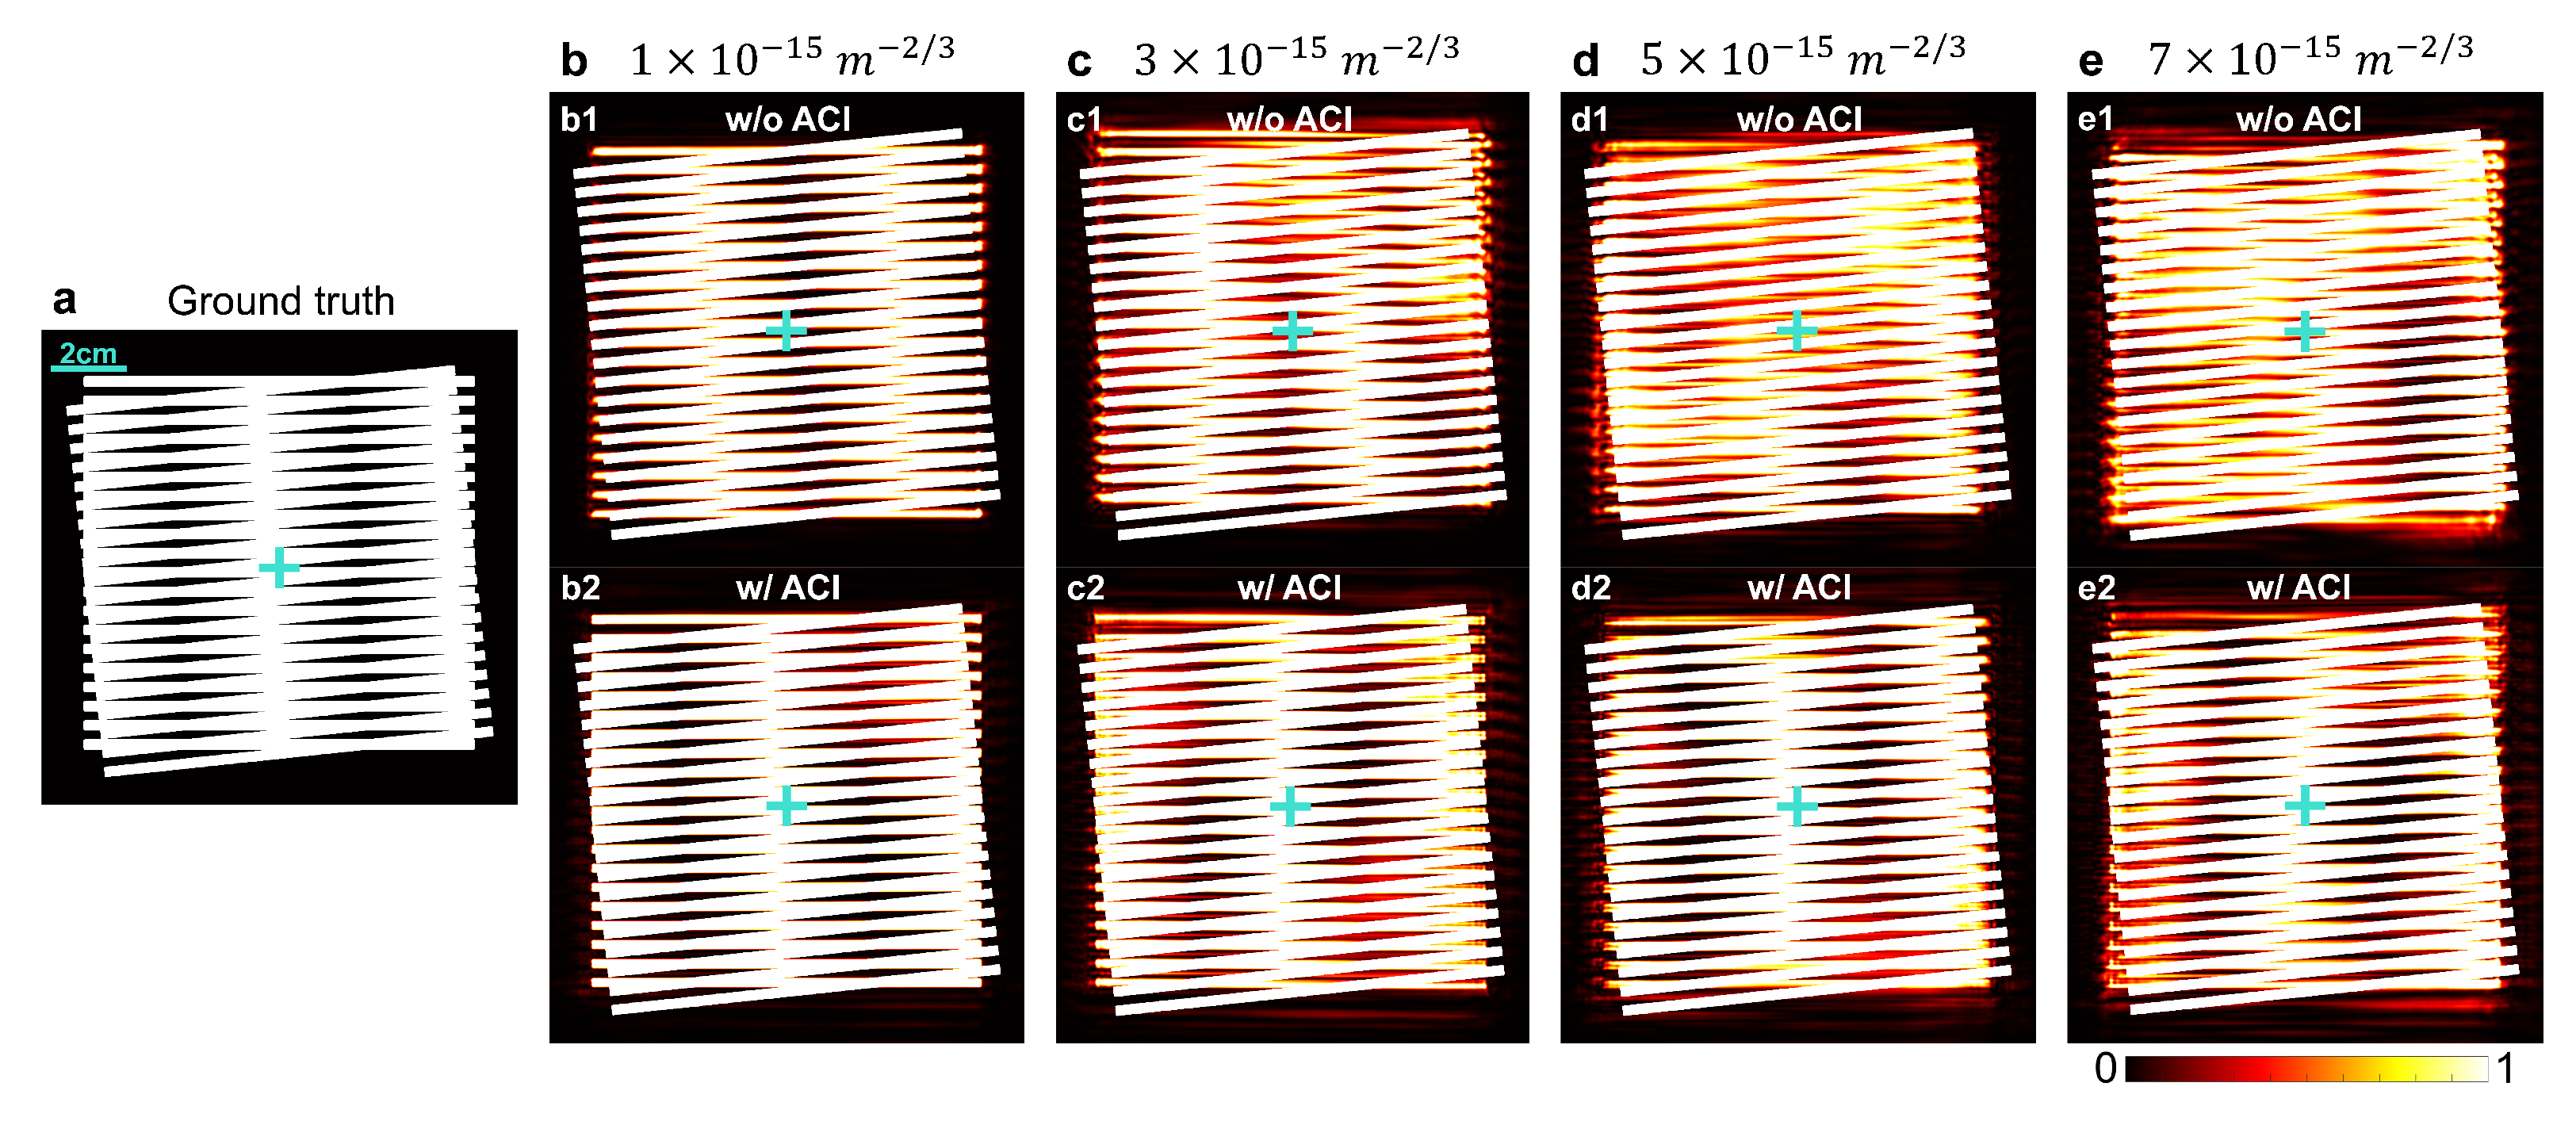
We generated the Moiré pattern by digitally superimposing the second grating onto the reconstructed base grating, as demonstrated in Figure 6. This figure clearly illustrates the shortcomings of passive configurations under turbulence conditions. At lower C n 2 values, passive Moiré fringes are displaced by beam wandering, inaccurately reflecting the base grating’s true position. At higher turbulence levels, the passive fringes fail to form properly, underscoring the limitations of this approach. In contrast, active configurations consistently produce clear and correctly aligned Moiré fringes, highlighting their robustness under adverse conditions.
Given the critical role of the Moiré fringes in representing the displacement of the base grating, accurately tracking their movements becomes essential, particularly under conditions of atmospheric turbulence. The first step in this process is to isolate the interference fringes from the overall Moiré pattern, which can be significantly affected by the distortions at higher C n 2 values. This isolation allows for more precise displacement tracking, even in challenging scenarios where fringe clarity is compromised. We use the distinct frequency components of the interference fringes, in contrast to those of the grating, as an effective method for extracting the fringes. By applying appropriate filters, we can selectively extract the relevant components to preserve displacement information. This process, which is critical to maintaining accuracy in both passive and active configurations, will be elaborated in the subsequent subsection.

4.2. Filtering and Post-Processing for Fringe Extraction

Accurate displacement measurement depends on the ability to isolate and track the Moiré fringes, particularly under challenging atmospheric conditions. The grating and the Moiré fringes exhibit distinct periodicities, which can be used for effective filtering. For instance, when the grating’s periodicity is oriented along the y-axis, as illustrated in Figure 5a, the Moiré fringes predominantly exhibit periodicity along the x-axis, influenced by the angular misalignment between the gratings.
To effectively extract the Moiré fringes, one possible method involves applying a filter to isolate the spatial frequencies along the x- and y-axes. Note that the dominant periodic spatial content of the Moiré pattern along the y-axis corresponds to the grating. In contrast the periodic content along the x-axis is related to the fringes. This principle holds true in the two-dimensional reciprocal space. In physical space, the Moiré pattern is denoted by m ( r ) , and in reciprocal space, it becomes M ( k ) = F { m ( r ) } , where k ( k x , k y ) are the reciprocal space coordinates.
For cases like Figure 6a, filtering involves designing a two-dimensional filter resembling a low-pass filter along the k y direction. This filter selectively passes content along k x (fringe information) while restricting content along k y (grating information). The filter must be broad enough along the k x direction to capture all relevant fringe components. Conversely, it acts as a low-pass filter along the k y direction. In this work, the cutoff frequency of this filter in the k y direction is set close to the reciprocal grid size defined by the Nyquist criteria. The periodicity of the Moiré fringes varies depending on the angular misalignment between the base and revealing gratings, which influences the frequency bandwidth of the fringe. This choice ensures that the filter captures the full bandwidth of fringe content for all possible grating orientations. As a result, this filtering approach effectively isolates Moiré fringes under various angular configurations.
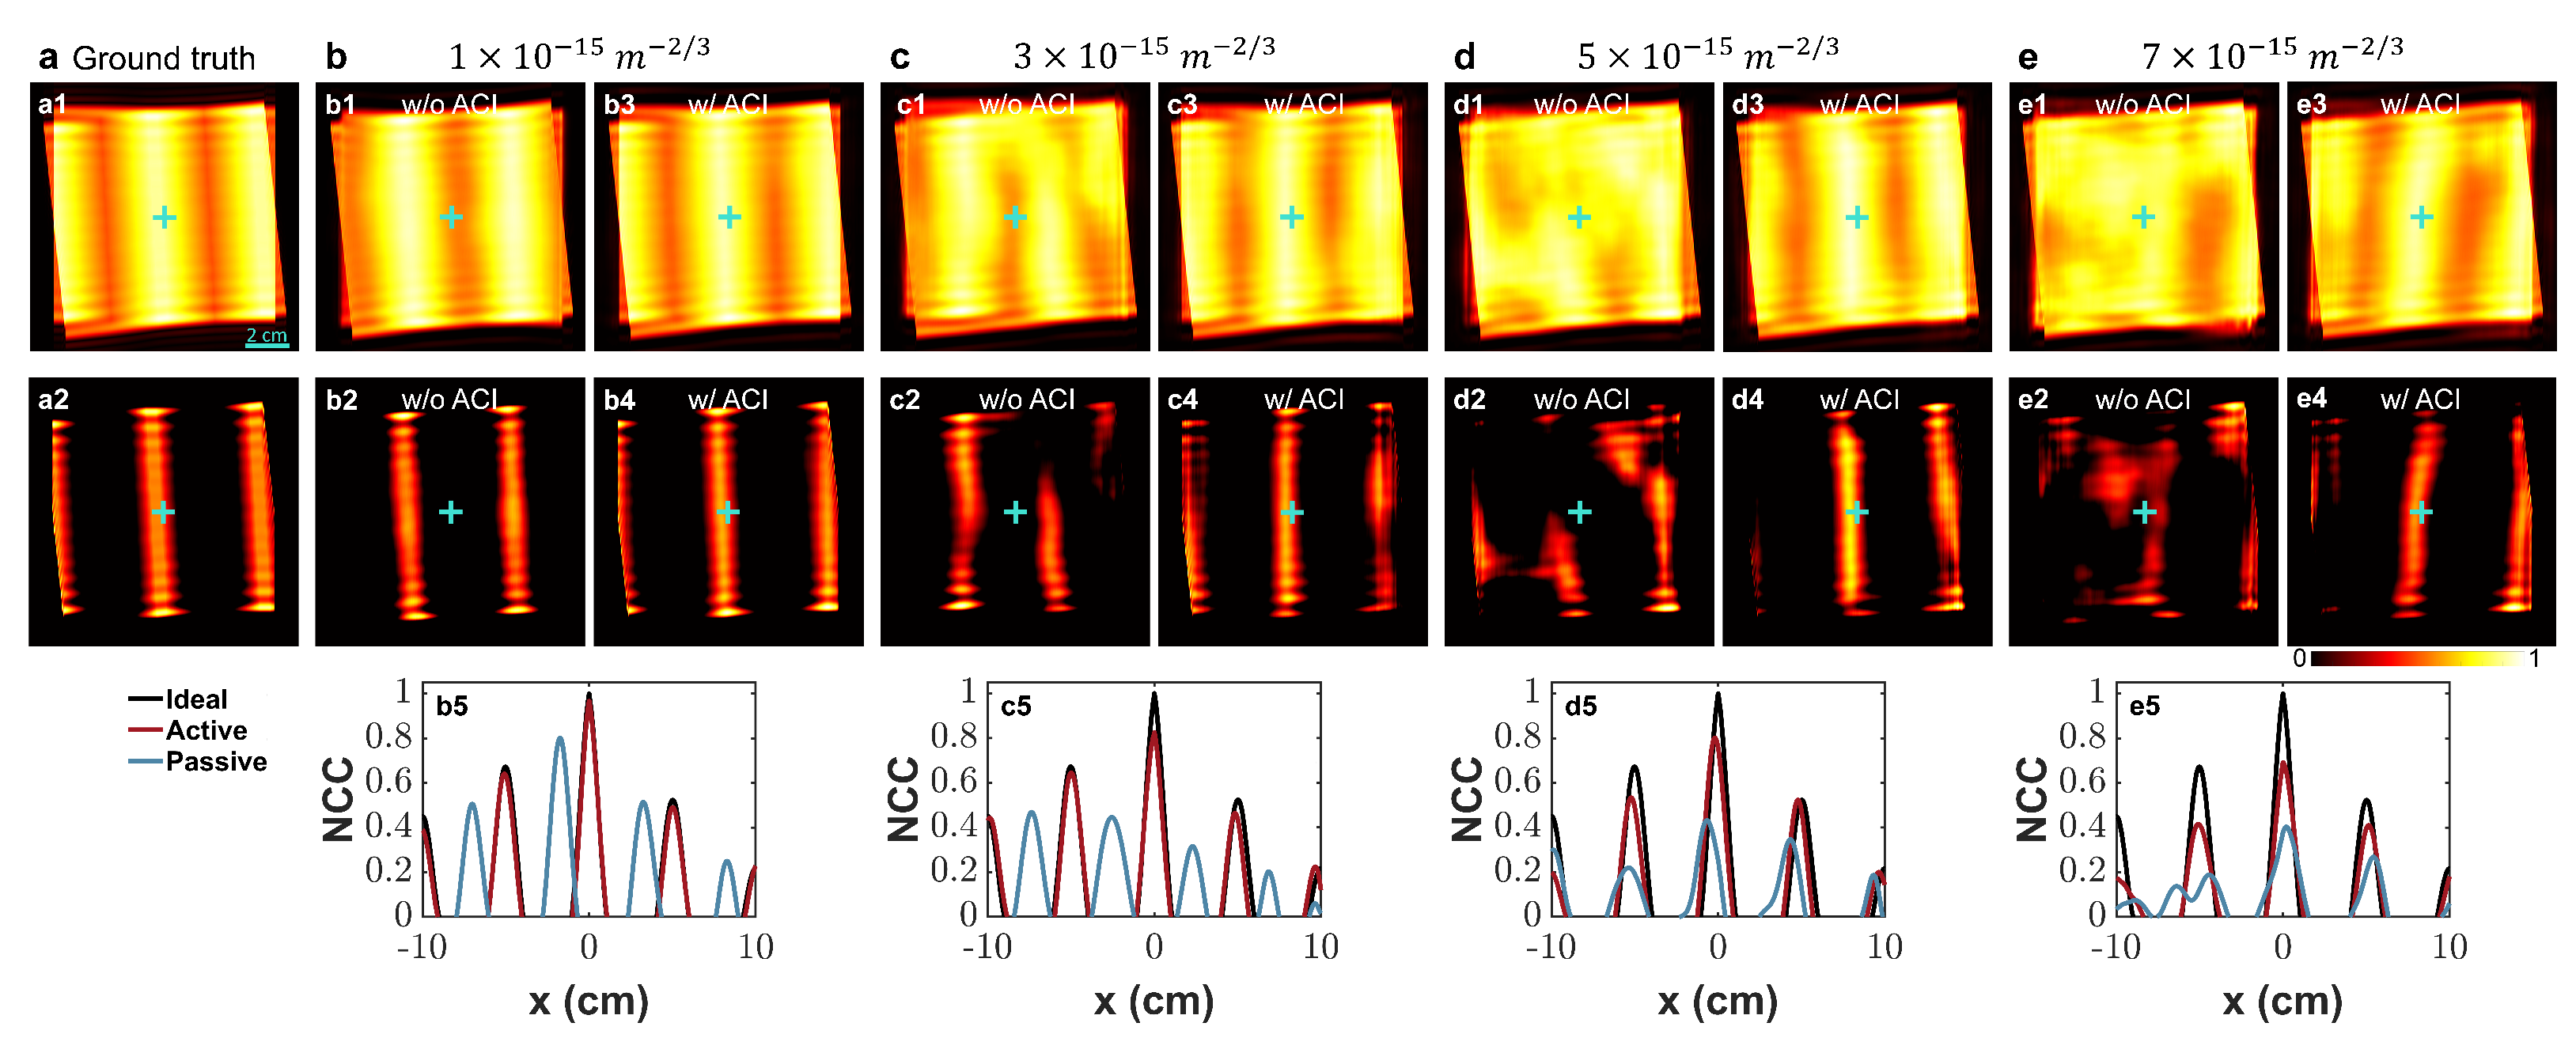
The performance of filtering on the ideal Moiré pattern (Figure 6a), the passively reconstructed Moiré patterns (Figure 6(b1–e1)), and the actively reconstructed Moiré patterns (Figure 6(b2–e2)) is illustrated in Figure 7(a1), Figure 7(b1–e1), and Figure 7(b3–e3), respectively. As the turbulence parameter C n 2 increases, the fringes in the passive cases (Figure 7(b1–e1)) become progressively harder to distinguish, while they remain distinctly visible in the active cases (Figure 7(b3–e3)).
While filtering enhances the ability to track fringe positions, further refinement is required for improved precision. In the filtered results, fringes appear as regions of the highest intensity. These high-intensity fringes can be precisely identified by applying global image thresholding [89] and normalization. This is illustrated in Figure 7(a2) for the ideal case, Figure 7(b2–e2) for the passive cases, and Figure 7(b4–e4) for the active cases. By comparing the extracted ground-truth Moiré grating (Figure 7(a2)) to the passive cases (Figure 7(b2–e2)), it can be observed that the fringes in passive reconstructions deviate from their true positions at lower turbulence levels ( C n 2 ), primarily due to beam wandering. At higher turbulence levels, distinguishing Moiré fringe positions becomes increasingly challenging due to higher-order aberrations. In contrast, active reconstructed cases (Figure 7(b4–e4)) effectively mitigate beam wandering effects and maintain fringe integrity even at high C n 2 values, ensuring accurate displacement measurements.
After thresholding, the fringes become more prominent, facilitating more accurate displacement extraction. In certain approaches [39], the fringes are condensed into a one-dimensional signal for displacement tracking. In our method, we employ cross-correlation, as shown in Figure 7(b5–e5), by comparing the extracted fringe pattern with the one derived from the ideal Moiré pattern. Assuming that the grating moves along the y-axis, the fringe displacement manifests along the x-axis, so only the normalized cross-correlation in the x direction is considered. The displacement of the fringe pattern is indicated by the positional shift (lead or lag) of the cross-correlation peak. Dividing this measurement by the magnification factor, derived from the angle between gratings, yields the corresponding displacement relative to the origin. When observing a grating over time, one effective method involves capturing multiple snapshots of the grating, selecting one frame as the reference, and calculating the displacement of subsequent frames relative to this reference frame. This method only requires knowledge of the grating pitch, as the displacement is measured by superimposing the reconstructed base grating with a digital revealing grating, eliminating the need for additional prior information.

4.3. Influence of Turbulence on Measurement Accuracy and Displacement Detection

By tracking the base grating displacement, its movement can be effectively monitored. However, this approach faces significant challenges when turbulence occurs between the base grating and the observation plane or sensor. As discussed, ACI can address these challenges. To evaluate the performance of the Moiré apparatus under turbulent conditions, we simulated the propagation of the base grating both with and without ACI by applying the post-processing technique to extract fringes and measure displacement under various atmospheric conditions. To quantify the impact of different turbulence levels ( C n 2 ), simulations were conducted in both passive and active configurations, focusing on the y-axis position of the grating. If we assume that atmospheric turbulence follows a stochastic process, it should exhibit variability after a characteristic correlation time. Therefore, to further explore the system’s behavior within a turbulent medium, we performed 100 independent simulations for the stationary base grating under short realizations of atmospheric conditions and assessed the measured displacements for each scenario.
Although the center of the base grating was aligned with the origin, its propagation and reconstruction demonstrated an off-axis behavior due to the beam wandering effect, which was predominantly observed in passive cases. We measured the position of the non-displaced base grating across various C n 2 values, which are presented in Figure 8a. This figure illustrates the distribution of the measured positions. In active cases, ACI effectively addressed atmospheric distortion effects, particularly significantly mitigating the beam wandering effect, allowing for accurate measurements of grating displacements, with only minor errors being observed when C n 2 reached 7 × 10 15   m 2 / 3 . The solid blue and red lines represent the mean displacement across the 100 realizations for the passive and active cases, respectively. The dark-shaded regions indicate the standard deviation of the measurements, while the light-shaded regions denote the range within which 90% of the measured displacements fall. As C n 2 increase, both the standard deviation and the 90% displacement range tend to expand.
In Figure 8b, to evaluate the accuracy of our measurements at C n 2 = 7 × 10 15   m 2 / 3 , the ground-truth grating was intentionally displaced by Δ y g , as indicated by the solid black line. The resulting displacement Δ y m was measured for both active and passive cases. The solid blue and red lines again represent the mean measured displacement for the passive and active cases, respectively. The error boxes illustrate the standard deviation of the measurements, while the error bars denote the range within which 90% of the measured displacements fall. The standard deviation of the measured displacement remains consistent across all cases, as C n 2 remains constant.
To better evaluate the impact of atmospheric turbulence on the performance of the Moiré apparatus, with and without ACI, in the context of seismic displacement measurements, we simulated a representative ground displacement scenario. A 10-s synthetic seismic displacement signal was generated and discretized to match the simulation domain. For each discrete displacement point, the base grating was shifted accordingly and then observed and reconstructed for both ACI and non-ACI cases after 1   km of propagation through atmospheric turbulence with a turbulence level of C n 2 = 7 × 10 15 m 2 / 3 .
Similar to the procedure in Figure 3, each frame of the resulting Moiré pattern represents the ground displacement at that moment. By extracting the grating’s position over time, we can track the ground displacement, as shown in Figure 9. In this figure, the ground-truth seismic signal is shown as black stars (discretized) and interpolated for better visualization. The measurements using ACI are shown as red stars and connected, since ACI can accurately capture the displacement. With a higher sampling rate, the interpolated curve would closely follow the red trajectory, reflecting ACI’s reliability.
The measurements without ACI are shown as blue stars. The interpolation is not shown for the non-ACI case, as it would not be accurate due to much larger variance (see Figure 8).
Under turbulent conditions, the displacement detected in the Moiré pattern results from both the actual physical displacement of the base layer and the turbulence-induced centroid shift, as indicated by Equation (3). Figure 9 demonstrates that applying ACI markedly enhances the accuracy of displacement measurements by mitigating the centroid shift caused by atmospheric turbulence. In contrast, the centroid shift significantly impacts measurement accuracy in the non-ACI scenario.
It should also be noted that the simulation depicted in Figure 9 presumes a frame rate of 5 frames per second (FPS); however, this rate can be increased depending on the capabilities of the camera employed.
The comprehensive analysis presented in this section numerically demonstrates that the implementation of ACI significantly enhances the robustness and accuracy of Moiré-based displacement measurements under various atmospheric turbulence conditions. By effectively mitigating beam wandering and higher-order aberrations, ACI preserves fringe visibility and measurement fidelity. The comparative performance evaluations, including statistical assessments over multiple atmospheric realizations and realistic seismic displacement simulations, underscore the necessity and effectiveness of ACI for reliable remote sensing applications. In the following section, we further discuss the implications of these findings, address practical considerations for field deployment, and explore potential avenues for refining and extending the current approach.

5. Discussion

5.1. Field Deployment and Monitoring

Effective volcanic monitoring requires overcoming numerous environmental and operational hurdles. Harsh terrains, remote access, and hazards like eruptions, instability, and corrosive gases complicate instrument deployment and upkeep. Therefore, monitoring solutions must prioritize safety, robustness, and ease of replacement. Deploying simpler, cost-effective systems minimizes the risks and operational disruptions associated with equipment loss or damage under such extreme conditions.
The Moiré apparatus is well-suited for deployment in challenging or hazardous environments, as the grating can be transported near volcanic craters by using unmanned aerial vehicles (UAVs). Nevertheless, the grating’s accuracy in displacement measurements may be compromised by environmental factors such as volcanic eruptions, sunlight exposure, rainfall, and dust accumulation. Given these potential issues, the grating’s low-cost construction and easy portability make it practical to replace whenever necessary.
We propose a tetrahedral frame (Figure 10a) with patterns printed on all sides. This geometry provides excellent structural stability, while a weighted base ensures strong coupling with the ground. A potential challenge during UAV deployment is that the grating may not be positioned vertically, resulting in inaccurate vertical displacement measurements. To mitigate this, the grating can include both horizontal and vertical lines (Figure 10b). If tilted, the vertical displacement along the z-axis can be calculated by using y = y cos ( δ ) x sin ( δ ) , where y and x are the displacements measured from the horizontal and vertical grating lines, respectively, and δ is the tilt angle.
Additionally, ground coupling may be compromised by vegetation or uneven terrain. Although active volcanic vents typically exhibit volcanic desert conditions lacking vegetation and smooth terrain [90], the potential presence of vegetation or uneven terrain in surrounding areas must be evaluated and considered in deployment strategies.
On the observation side, a remotely located telescope integrated with a high-speed camera enables the continuous and safe monitoring of the grating, minimizing risk to personnel and equipment. To enhance accuracy and reliability, the telescope is isolated from external vibrations. The primary sources of such vibrations include (1) wind-induced disturbances and (2) ground vibrations. Wind-induced vibrations can be mitigated by housing the telescope within a specially designed observatory tent. To reduce ground vibrations, including low-frequency disturbances originating from volcanic activity, environmental noise, and other external sources, the telescope can be mounted on a specialized vibration isolation platform.
For nighttime operation, one approach is to use thermal infrared (IR) imaging to capture Moiré patterns. This method has the advantages of being eye-safe and offering lower atmospheric distortion. However, it may perform poorly during intense volcanic activity due to elevated ambient IR levels, which can obscure the Moiré fringes. Additionally, thermal IR detectors are expensive. An alternative is to use cost-effective detectors (e.g., CMOSs) in conjunction with an external incoherent near-IR light source, such as high-lumen LEDs operating around 900–1000 nm, to illuminate the first grating.
There are inherent limitations associated with measuring grating displacement by using Moiré patterns. Notably, when the base grating shifts by one full pitch, the resulting Moiré pattern appears unchanged, causing ambiguity similar to a no-displacement scenario. A practical approach to address this issue is to monitor the gratings across sequential realizations; if a full-pitch displacement occurs within the interval of multiple realizations, it can be distinguished. In this study, each atmospheric realization was treated as an independent random draw, making it impossible to differentiate between a grating with no displacement and one displaced by an integer multiple of the pitch size (n), where n Z . This ambiguity also applies to fractional displacements offset by n. In passive cases, displacement errors may be underestimated; a displacement of 5 / 4 or 3 / 4 of a pitch may appear as a 1 / 4 pitch displacement. Additionally, the coincidental alignment of the Moiré pattern may lead to accidentally accurate measurements. This can occur when beam wandering shifts the base grating’s center by n pitches, misinterpreted as zero displacement, inadvertently producing correct displacement measurements in certain cases.

5.2. Atmospheric Distortion and ACI Performance

In this study, the grating dimensions are chosen based on a conservative assumption: it is desirable to remotely measure sub-millimeter-scale physical displacements over a distance of 1   km with sub-second temporal resolution. Our results indicate that high-fidelity displacement measurements using ACI remain feasible for turbulence levels up to C n 2 = 7 × 10 15 m 2 / 3 where Δ l t / Δ l s = 4.02 . Note that the above operating regime can be realized under diverse propagation conditions as described by, for example, the experimental data presented in [91]. However, since the physical operating conditions are sensitive to factors such as local geography, meteorological conditions, wave propagation distance, and configuration (e.g., horizontal vs. vertical paths), it is possible for the system to deviate significantly from optimal conditions [91,92,93,94,95]. Environmental parameters including ambient temperature, wind speed, altitude, and proximity to the ground further influence the statistical characteristics of turbulence and, consequently, must be considered when optimizing any technique designed for the partial or full correction of image degradation. A more detailed overview was presented by Cherubini et al. [96], taking the Mauna Kea volcano in Hawai‘i as an example. The authors also propose an algorithm for estimating ambient turbulence levels, which can support the optimization of correction techniques such as adaptive optics and, in principle, could be incorporated into the present framework.
The operating regime presented in this work allows for flexible adjustments, with trade-offs in spatiotemporal resolution when addressing more extreme turbulence conditions or longer propagation distances in practical systems. Increased turbulence or longer propagation distances lead to a higher Δ l t / Δ l s for the selected grating dimensions. To maintain the high accuracy of displacement measurements illustrated in the current regime, the grating dimensions can be optimized to reduce Δ l t / Δ l s , albeit at the cost of spatiotemporal resolution. Importantly, this adjustment does not require changes to the propagation configuration or the ACI implementation. For instance, the grating geometry can be appropriately adjusted to shift displacement measurements from the sub-millimeter scale to the centimeter scale. The conservative operating regime adopted here provides ample room for optimization, as the required spatiotemporal resolution is often lower in practical applications. The numerical prediction of C n 2 in the physical system can guide grating dimension adjustments, ensuring stable ACI performance and maintaining high measurement accuracy even if turbulence conditions vary. Moreover, the ACI implementation proposed by Ghoshroy et al. [57] has the potential for further optimization and enhancements, such as a more robust CIS characterization algorithm or the incorporation of anisoplanatism effects. These advancements would expand the operating regime to accommodate larger Δ l t / Δ l s values, enabling remote sensing under harsher turbulence conditions or over longer propagation distances. Several strategies for improving the CIS characterization algorithm have been proposed by Ghoshroy et al. [57]. Additionally, integrating ACI with post-processing techniques, such as deep learning-based methods, could further improve the apparatus’ operational performance and resilience. Furthermore, using higher-resolution cameras and telescopes may help increase the operating distance.
It is important to note that the ACI framework adopted in this work is based on the Kolmogorov theory, which assumes isotropic turbulence. However, volcanic environments can exhibit anisotropic and inhomogeneous propagation conditions due to factors such as elevation, ambient temperature gradients, wind, and the presence of nearby hard boundaries like the ground surface, forests, and vegetation. Temperature fluctuations are the dominant random process responsible for variations in the refractive index along the propagation path. Consequently, the anisotropic nature of the temperature field is reflected in the fluctuating refractive index distribution. This anisotropy causes the statistical long-exposure turbulence characteristics, such as beam wandering and the Fried parameter, to become direction-dependent. Similarly, under short-exposure conditions, the observed intensity speckles also exhibit directional dependence. In the current ACI framework, the intensity speckles observed in the short-exposure reconstruction of OAM beams are used to construct CISs. Note that the turbulence-induced effects on the OAM mode are used as signatures to then determine the subsequent correction. This enables the stable propagation of the grating pattern along the optical axis in a minimally distorted state, allowing for the robust generation of Moiré patterns in the subsequent step. In principle, the effects of anisotropy and inhomogeneity are inherently encoded within the short-exposure speckle patterns and could be incorporated into the ACI framework through appropriate modifications. However, a comprehensive treatment of these effects lies beyond the scope of the present work. Given their strong dependence on ambient environmental conditions, a dedicated, environment-specific investigation is warranted, as also noted by Ghoshroy et al. [57]. Accordingly, the current implementation is presented as a proof of concept, with future efforts aimed at expanding the framework to account for these complexities. It is important to emphasize that the cumulative effects of beam wandering and wavefront aberrations fundamentally limit high spatiotemporal resolution in remote sensing applications employing Moiré gratings. Here we address this fundamental limitation, which exists irrespective of the homogeneity or isotropy of the propagation medium.
Additional factors such as humidity, dust, and rainfall can also degrade apparatus performance. To address such issues, the ACI method, a preprocessing approach, can be effectively combined with post-processing techniques such as deep learning models [97]. This integration can potentially help manage the impact of aerosol particles and maintain performance even under challenging atmospheric conditions.
For extreme C n 2 values, the displacement of the base grating can still be measured in both scenarios, with and without ACI. However, these measurements may become increasingly unreliable. In passive measurements at low C n 2 values, the NCC offset is primarily influenced by the beam wandering effect, which results in the interference pattern being interpreted at a different location, thereby leading to inaccuracies in displacement measurement. During the extraction of the Moiré interference location, identifying the pattern through the NCC peak is often complicated by localized noise from atmospheric distortion. This noise can significantly impact the NCC value, resulting in measurements that are more reflective of localized intensity distortions rather than the actual interference pattern positions. Consequently, while readings can be taken, they may not accurately capture the true positions of either the base grating or the interference pattern.

6. Conclusions

The Moiré-based apparatus effectively addresses the need for remote displacement measurements in challenging environments; however, atmospheric disturbances remain a key limitation. Particularly in passive scenarios, turbulence significantly reduces the accuracy of displacement measurements, leading to discrepancies between the observed and true grating positions, as indicated by decreased NCC values.
The integration of ACI with the Moiré-based apparatus effectively addresses these limitations, significantly enhancing measurement accuracy under turbulent atmospheric conditions. ACI maintains higher NCC values, ensuring better alignment with the original grating across diverse turbulence levels characterized by varying C n 2 values. By preserving the integrity of the Moiré fringes, ACI enables reliable displacement tracking, emphasizing its potential for applications such as remote seismic monitoring in volcanic regions with atmospheric distortions.
Compared with conventional methods, such as laser Doppler interferometry and stereo vision [63], the Moiré-based apparatus integrated with ACI offers distinct advantages. Traditional techniques often require direct access to observation sites or struggle with atmospheric interference, limiting their applicability in challenging environments. The Moiré apparatus, however, provides a non-invasive and cost-effective alternative for displacement measurements.
Future research can further enhance ACI’s performance under more extreme atmospheric conditions by integrating advanced image processing techniques and deep learning algorithms for fringe extraction and turbulence compensation. Utilizing incoherent light [54] or intensity data can reduce the complexity in ACI’s implementation. Conducting on-site field validation studies is essential to confirming the practical utility of this method, particularly in applications like seismic monitoring, where precise displacement measurements are critical. Additionally, systematic evaluations of the installation challenges encountered in actual field monitoring scenarios are recommended. Expanding the use of this apparatus to monitor human-induced deformations such as those in buildings, bridges, dams, and mine landslides presents another promising direction for future studies.
In conclusion, this work numerically demonstrates the effectiveness of combining the Moiré approach and ACI to achieve accurate displacement measurements in turbulent environments. Tested across over 1900 grating displacement scenarios under varying atmospheric turbulence levels, the system demonstrates significantly enhanced accuracy, which becomes particularly evident in high-turbulence conditions. With further development and real-world testing, this approach has the potential to become a reliable and versatile tool for seismic monitoring and other remote sensing applications in extreme and inaccessible environments.

Author Contributions

Conceptualization, A.G., D.Ö.G. and R.A.; methodology, A.A.M., A.G., D.Ö.G. and R.A.; software, A.A.M.; validation, A.A.M., A.G., D.Ö.G. and R.A.; formal analysis, A.A.M., A.G., D.Ö.G. and R.A.; investigation, A.A.M.; resources, D.Ö.G. and R.A.; data curation, A.A.M.; writing—original draft preparation, A.A.M.; writing—review and editing, A.A.M., A.G., D.Ö.G. and R.A.; visualization, A.A.M.; supervision, D.Ö.G. and R.A.; project administration, D.Ö.G. and R.A.; funding acquisition, D.Ö.G. and R.A. All authors have read and agreed to the published version of the manuscript.

Funding

This research study was supported by National Science Foundation (EAR-2221730).

Data Availability Statement

The data presented in this study are openly available in Zenodo (accessed on 16 January 2025) at https://doi.org/10.5281/zenodo.14674744.

Acknowledgments

We would like to thank Greg Waite and James Davis from Michigan Technological University for their insightful discussions and valuable feedback.

Conflicts of Interest

The authors declare no conflicts of interest.

References

  1. Oster, G.; Nishijima, Y. Moiré patterns. Sci. Am. 1963, 208, 54–63. [Google Scholar] [CrossRef]
  2. Shao, J.; Ding, Y.; Tian, H.; Li, X.; Li, X.; Liu, H. Digital moiré fringe measurement method for alignment in imprint lithography. Opt. Laser Technol. 2012, 44, 446–451. [Google Scholar] [CrossRef]
  3. Xiao, X.; Kang, Y.; Hou, Z.; Qiu, W.; Li, X.; Li, X. Displacement and strain measurement by circular and radial gratings moiré method. Exp. Mech. 2010, 50, 239–244. [Google Scholar] [CrossRef]
  4. Khurana, R.K. Moiré patterns in nanomaterials. Mater. Sci. Semicond. Process. 2022, 140, 106406. [Google Scholar] [CrossRef]
  5. Tang, H.; Ni, X.; Du, F.; Srikrishna, V.; Mazur, E. On-chip light trapping in bilayer moiré photonic crystal slabs. Appl. Phys. Lett. 2022, 121, 231101. [Google Scholar] [CrossRef]
  6. Alagappan, G.; Png, C.E. Dense and sharp resonance peaks in stretched moiré waveguides. Phys. Rev. A 2024, 110, 033516. [Google Scholar] [CrossRef]
  7. Bezryadina, A.; Zhao, J.; Xia, Y.; Zhang, X.; Liu, Z. High spatiotemporal resolution imaging with localized plasmonic structured illumination microscopy. ACS Nano 2018, 12, 8248–8254. [Google Scholar] [CrossRef]
  8. Schirripa Spagnolo, G.; Ambrosini, D.; Paoletti, D. Liquid diffusion coefficients by digital moiré. Opt. Eng. 2004, 43, 798–805. [Google Scholar]
  9. Huyeh, M.R.; Goudarzi, P.; Rasouli, S. Study of thermal conductivity of nano-fluids containing gold nanoparticles using moiré deflectometry. Int. J. Green Nanotechnol. 2012, 4, 385–388. [Google Scholar] [CrossRef]
  10. Zhao, J.; Hou, Y.; Liu, Z.; Xie, H.; Liu, S. Modified color CCD moiré method and its application in optical distortion correction. Precis. Eng. 2020, 65, 279–286. [Google Scholar] [CrossRef]
  11. Bryngdahl, O. Moiré: Formation and interpretation. J. Opt. Soc. Am. 1974, 64, 1287–1294. [Google Scholar] [CrossRef]
  12. Post, D.; Han, B.; Ifju, P. High Sensitivity Moiré: Experimental Analysis for Mechanics and Materials; Springer Science & Business Media: Berlin/Heidelberg, Germany, 2012. [Google Scholar]
  13. Amidror, I. The Theory of the Moiré Phenomenon: Volume I: Periodic Layers; Springer Science & Business Media: Berlin/Heidelberg, Germany, 2009; Volume 38. [Google Scholar]
  14. Pan, B.; Xie, H.; Kishimoto, S.; Xing, Y. Experimental study of moiré method in laser scanning confocal microscopy. Rev. Sci. Instruments 2006, 77, 045101. [Google Scholar] [CrossRef]
  15. Li, C.; Liu, Z.; Xie, H.; Wu, D. Novel 3D SEM moiré method for micro height measurement. Opt. Express 2013, 21, 15734–15746. [Google Scholar] [CrossRef]
  16. Tang, S.; Wang, H.; Wang, H.S.; Sun, Q.; Zhang, X.; Cong, C.; Xie, H.; Liu, X.; Zhou, X.; Huang, F.; et al. Silane-catalysed fast growth of large single-crystalline graphene on hexagonal boron nitride. Nat. Commun. 2015, 6, 6499. [Google Scholar] [CrossRef] [PubMed]
  17. Takasaki, H. Moiré topography. Appl. Opt. 1970, 9, 1467–1472. [Google Scholar] [CrossRef]
  18. Adler, N.S.; Csongradi, J.; Bleck, E.E. School screening for scoliosis—one experience in California using clinical examination and moiré photography. West. J. Med. 1984, 141, 631. [Google Scholar]
  19. Rossler, T.; Hrabovsky, M.; Pochmon, M. Moiré methods for measurement of displacement and topography. Czechoslov. J. Phys. 2006, 56, 101–124. [Google Scholar] [CrossRef]
  20. Porto, F.; Gurgel, J.L.; Russomano, T.; Farinatti, P.D.T.V. Moiré topography: Characteristics and clinical application. Gait Posture 2010, 32, 422–424. [Google Scholar] [CrossRef]
  21. Breque, C.; Dupre, J.C.; Bremand, F. Calibration of a system of projection moiré for relief measuring: Biomechanical applications. Opt. Lasers Eng. 2004, 41, 241–260. [Google Scholar] [CrossRef]
  22. Yilan, K.; Hua, L. Investigation of near-tip displacement fields of a crack normal to and terminating at a bimaterial interface under mixed-mode loading. Eng. Fract. Mech. 2002, 69, 2199–2208. [Google Scholar] [CrossRef]
  23. Savalia, P.C.; Tippur, H.V. A study of crack–inclusion interactions and matrix–inclusion debonding using moiré interferometry and finite element method. Exp. Mech. 2007, 47, 533–547. [Google Scholar] [CrossRef]
  24. Mollenhauer, D.; Iarve, E.V.; Kim, R.; Langley, B. Examination of ply cracking in composite laminates with open holes: A moiré interferometric and numerical study. Compos. Part A Appl. Sci. Manuf. 2006, 37, 282–294. [Google Scholar] [CrossRef]
  25. Shrotriya, P.; Sottos, N.R. Local time—Temperature-dependent deformation of a woven composite. Exp. Mech. 2004, 44, 336–353. [Google Scholar]
  26. Chen, K.; Rajeeva, B.B.; Wu, Z.; Rukavina, M.; Dao, T.D.; Ishii, S.; Aono, M.; Nagao, T.; Zheng, Y. Moiré nanosphere lithography. ACS Nano 2015, 9, 6031–6040. [Google Scholar] [CrossRef] [PubMed]
  27. Cadarso, V.J.; Chosson, S.; Sidler, K.; Hersch, R.D.; Brugger, J. High-resolution 1D moirés as counterfeit security features. Light. Sci. Appl. 2013, 2, e86. [Google Scholar] [CrossRef]
  28. Ragulskis, K.; Maskeliunas, R.; Zubavičius, L. Analysis of structural vibrations using time averaged shadow moiré. J. Vibroeng. 2006, 8, 267–275. [Google Scholar]
  29. Ezazshahabi, N.; Latifi, M.; Madanipour, K. Surface roughness assessment of woven fabrics using fringe projection moiré techniques. Fibres Text. East. Eur. 2015, 23, 76–84. [Google Scholar] [CrossRef]
  30. Khanna, S.K.; He, C.; Agrawal, H.N. Residual stress measurement in spot welds and the effect of fatigue loading on redistribution of stresses using high sensitivity moiré interferometry. J. Eng. Mater. Technol. 2001, 123, 132–138. [Google Scholar] [CrossRef]
  31. Prabhakara, V.; Jannis, D.; Béché, A.; Bender, H.; Verbeeck, J. Strain measurement in semiconductor FinFET devices using a novel moiré demodulation technique. Semicond. Sci. Technol. 2020, 35, 034002. [Google Scholar] [CrossRef]
  32. Kishimoto, S.; Egashira, M.; Shinya, N. Microcreep deformation measurements by a moiré method using electron beam lithography and electron beam scan. Opt. Eng. 1993, 32, 522–526. [Google Scholar] [CrossRef]
  33. Ri, S.; Fujigaki, M.; Morimoto, Y. Sampling moiré method for accurate small deformation distribution measurement. Exp. Mech. 2010, 50, 501–508. [Google Scholar] [CrossRef]
  34. Han, B. Micromechanical deformation analysis of beta alloy titanium in elastic and elastic/plastic tension. Exp. Mech. 1996, 36, 120–126. [Google Scholar] [CrossRef]
  35. Bastawros, A.F.; Kim, K.S. Experimental analysis of near-crack-tip plastic flow and deformation characteristics (I): Polycrystalline aluminum. J. Mech. Phys. Solids 2000, 48, 67–98. [Google Scholar] [CrossRef]
  36. Meadows, D.M.; Johnson, W.O.; Allen, J.B. Generation of surface contours by moiré patterns. Appl. Opt. 1970, 9, 942–947. [Google Scholar] [CrossRef]
  37. Tsuruta, T.; Itoh, Y.; Anzai, S. Moiré topography for the measurement of film flatness. Appl. Opt. 1970, 9, 2802–2804. [Google Scholar] [CrossRef]
  38. Bian, Y.; Zhang, P.; Wang, J.; Wang, C.; Pu, S. Learning multiple explainable and generalizable cues for face anti-spoofing. In Proceedings of the ICASSP 2022—2022 IEEE International Conference on Acoustics, Speech and Signal Processing (ICASSP), Singapore, 22–27 May 2022; IEEE: Piscataway, NJ, USA, 2022; pp. 2310–2314. [Google Scholar]
  39. Wu, J.; Zhou, T.T.; Yuan, B.; Wang, L.Q. A digital moiré fringe method for displacement sensors. Front. Inf. Technol. Electron. Eng. 2016, 17, 946–953. [Google Scholar] [CrossRef]
  40. Rasouli, S.; Esmaeili, S.; Sobouti, F. Design and construction of a seismometer based on the moiré technique: Detailed theoretical analysis, experimental apparatus, and primary results. Int. J. Opt. Photonics 2016, 10, 3–10. [Google Scholar]
  41. Bemelmans, M.J.W.; Biggs, J.; Poland, M.; Wookey, J.; Ebmeier, S.K.; Diefenbach, A.K.; Syahbana, D. High-resolution InSAR reveals localized pre-eruptive deformation inside the crater of Agung Volcano, Indonesia. J. Geophys. Res. Solid Earth 2023, 128, e2022JB025669. [Google Scholar] [CrossRef]
  42. Salzer, J.T.; Nikkhoo, M.; Walter, T.R.; Sudhaus, H.; Reyes-Dávila, G.; Bretón, M.; Arámbula, R. Satellite radar data reveal short-term pre-explosive displacements and a complex conduit system at Volcán de Colima, Mexico. Front. Earth Sci. 2014, 2, 12. [Google Scholar] [CrossRef]
  43. Daigle, J.F.; Kamali, Y.; Châteauneuf, M.; Tremblay, G.; Thérèbe, F.; Dubois, J.; Roy, G.; Chin, S.L. Remote sensing with intense filaments enhanced by adaptive optics. Appl. Phys. B 2009, 97, 701–713. [Google Scholar] [CrossRef]
  44. Shen, H.; Du, L.; Zhang, L.; Gong, W. A blind restoration method for remote sensing images. IEEE Geosci. Remote Sens. Lett. 2012, 9, 1137–1141. [Google Scholar] [CrossRef]
  45. Wang, J.; Gong, Z.; Liu, X.; Guo, H.; Yu, D.; Ding, L. Object detection based on adaptive feature-aware method in optical remote sensing images. Remote Sens. 2022, 14, 3616. [Google Scholar] [CrossRef]
  46. Sadatgol, M.; Özdemir, Ş.K.; Yang, L.; Güney, D.Ö. Plasmon injection to compensate and control losses in negative index metamaterials. Phys. Rev. Lett. 2015, 115, 035502. [Google Scholar] [CrossRef] [PubMed]
  47. Ghoshroy, A.; Özdemir, Ş.K.; Güney, D.Ö. Loss compensation in metamaterials and plasmonics with virtual gain. Opt. Mater. Express 2020, 10, 1862–1880. [Google Scholar] [CrossRef]
  48. Adams, W.; Sadatgol, M.; Güney, D.Ö. Review of near-field optics and superlenses for sub-diffraction-limited nano-imaging. AIP Adv. 2016, 6, 105123. [Google Scholar] [CrossRef]
  49. Adams, W.; Sadatgol, M.; Zhang, X.; Güney, D.Ö. Bringing the ‘perfect lens’ into focus by near-perfect compensation of losses without gain media. New J. Phys. 2016, 18, 125004. [Google Scholar] [CrossRef]
  50. Zhang, X.; Adams, W.; Sadatgol, M.; Güney, D.Ö. Enhancing the resolution of hyperlens by the compensation of losses without gain media. arXiv 2016, arXiv:1607.07466. [Google Scholar] [CrossRef]
  51. Zhang, X.; Adams, W.; Güney, D.Ö. Analytical description of inverse filter emulating the plasmon injection loss compensation scheme and implementation for ultrahigh-resolution hyperlens. J. Opt. Soc. Am. B Opt. Phys. 2017, 34, 1310–1318. [Google Scholar] [CrossRef]
  52. Adams, W.; Ghoshroy, A.; Güney, D.Ö. Plasmonic superlens image reconstruction using intensity data and equivalence to structured light illumination for compensation of losses. J. Opt. Soc. Am. B Opt. Phys. 2017, 34, 2161–2168. [Google Scholar] [CrossRef]
  53. Adams, W.; Ghoshroy, A.; Güney, D.Ö. Plasmonic superlens imaging enhanced by incoherent active convolved illumination. ACS Photonics 2018, 5, 1294–1302. [Google Scholar] [CrossRef]
  54. Adams, W.; Ghoshroy, A.; Güney, D.Ö. Incoherent active convolved illumination enhances the signal-to-noise ratio for shot noise: Experimental evidence. Phys. Rev. Appl. 2022, 18, 064080. [Google Scholar] [CrossRef]
  55. Ghoshroy, A.; Adams, W.; Güney, D.Ö. Theory of coherent active convolved illumination for superresolution enhancement. J. Opt. Soc. Am. B Opt. Phys. 2020, 37, 2452–2463. [Google Scholar] [CrossRef]
  56. Andrews, L.C.; Phillips, R.L. Laser Beam Propagation Through Random Media; SPIE Press: Bellingham, WA, USA, 2005. [Google Scholar]
  57. Ghoshroy, A.; Davis, J.; Moazzam, A.A.; Askari, R.; Güney, D.Ö. Enhancing complex light beam propagation in turbulent atmosphere with active convolved illumination. ACS Photonics 2024, 11, 4541–4558. [Google Scholar] [CrossRef]
  58. Moazzam, A.A.; Ghoshroy, A.; Askari, R.; Güney, D.Ö. Active convolved illumination towards enhanced remote sensing through a turbulent atmosphere. In Proceedings of the AGU 2023, San Francisco, CA, USA, 11–15 December 2023; p. S11F-0322. [Google Scholar]
  59. Burlini, L.; Vinciguerra, S.; Di Toro, G.; De Natale, G.; Meredith, P.; Burg, J.P. Seismicity preceding volcanic eruptions: New experimental insights. Geology 2007, 35, 183–186. [Google Scholar] [CrossRef]
  60. Rodean, H.C. Inelastic processes in seismic wave generation by underground explosions. In Identification of Seismic Sources—Earthquake or Underground Explosion: Proceedings of the NATO Advance Study Institute Held at Voksenåsen, Oslo, Norway, 8–18 September 1980; Springer: Berlin/Heidelberg, Germany, 1981; pp. 97–189. [Google Scholar]
  61. Gudmundsson, A. Toughness and failure of volcanic edifices. Tectonophysics 2009, 471, 27–35. [Google Scholar] [CrossRef]
  62. Coughlin, M.; Harms, J. Seismic topographic scattering in the context of GW detector site selection. Class. Quantum Gravity 2012, 29, 075004. [Google Scholar] [CrossRef]
  63. Berni, A.J. Remote sensing of seismic vibrations by laser Doppler interferometry. Geophysics 1994, 59, 1856–1867. [Google Scholar] [CrossRef]
  64. Meyer-Arendt, J.R. Introduction to Classical and Modern Optics; Prentice-Hall: Englewood Cliffs, NJ, USA, 1989. [Google Scholar]
  65. Stanbridge, A.B.; Ewins, D.J.; Khan, A.Z. Modal testing using impact excitation and a scanning LDV. Shock Vib. 2000, 7, 91–100. [Google Scholar] [CrossRef]
  66. Rapstine, T.; Sava, P.; Arias, E. Airborne seismic data acquisition using stereo vision. J. Unmanned Veh. Syst. 2017, 6, 31–42. [Google Scholar] [CrossRef]
  67. Rapstine, T.D. Towards Airborne Measurements of Ground Displacement; Colorado School of Mines: Golden, CO, USA, 2020. [Google Scholar]
  68. Bock, Y.; Nikolaidis, R.M.; de Jonge, P.J.; Bevis, M. Instantaneous geodetic positioning at medium distances with the Global Positioning System. J. Geophys. Res. Solid Earth 2000, 105, 28223–28253. [Google Scholar] [CrossRef]
  69. Zumberge, J.F.; Heflin, M.B.; Jefferson, D.C.; Watkins, M.M.; Webb, F.H. Precise point positioning for the efficient and robust analysis of GPS data from large networks. J. Geophys. Res. Solid Earth 1997, 102, 5005–5017. [Google Scholar] [CrossRef]
  70. Kouba, J. Measuring seismic waves induced by large earthquakes with GPS. Stud. Geophys. Et Geod. 2003, 47, 741–755. [Google Scholar] [CrossRef]
  71. Geng, T.; Xie, X.; Fang, R.; Su, X.; Zhao, Q.; Liu, G.; Li, H.; Shi, C.; Liu, J. Real-time capture of seismic waves using high-rate multi-GNSS observations: Application to the 2015 Mw 7.8 Nepal earthquake. Geophys. Res. Lett. 2016, 43, 161–167. [Google Scholar] [CrossRef]
  72. Garthwaite, M.C.; Miller, V.L.; Saunders, S.; Parks, M.M.; Hu, G.; Parker, A.L. A simplified approach to operational InSAR monitoring of volcano deformation in low-and middle-income countries: Case study of Rabaul Caldera, Papua New Guinea. Front. Earth Sci. 2019, 6, 240. [Google Scholar] [CrossRef]
  73. Cigna, F.; Tapete, D.; Lu, Z. Remote sensing of volcanic processes and risk. Remote Sens. 2020, 12, 2567. [Google Scholar] [CrossRef]
  74. Di Traglia, F.; Calvari, S.; D’Auria, L.; Nolesini, T.; Bonaccorso, A.; Fornaciai, A.; Esposito, A.; Cristaldi, A.; Favalli, M.; Casagli, N. The 2014 effusive eruption at Stromboli: New insights from in situ and remote-sensing measurements. Remote Sens. 2018, 10, 2035. [Google Scholar] [CrossRef]
  75. Kuraoka, S.; Nakashima, Y.; Doke, R.; Mannen, K. Monitoring ground deformation of eruption center by ground-based interferometric synthetic aperture radar (GB-InSAR): A case study during the 2015 phreatic eruption of Hakone volcano. Earth Planets Space 2018, 70, 1–9. [Google Scholar] [CrossRef]
  76. Huebner, C.S. A profiling scheme for algorithms and applications to enable a methodological evaluation of turbulence mitigation methods. In Proceedings of the Environmental Effects on Light Propagation and Adaptive Systems III; SPIE: Bellingham, WA, USA, 2020; Volume 11532, pp. 107–117. [Google Scholar]
  77. Xu, F.; Chang, S.; Zhao, Y.; Li, W.; Xia, H. High-precision moiré alignment method using centrosymmetric grating for 3D interlayer interconnect. Opt. Lasers Eng. 2023, 171, 107815. [Google Scholar] [CrossRef]
  78. Cox, M.A.; Mphuthi, N.; Nape, I.; Mashaba, N.; Cheng, L.; Forbes, A. Structured light in turbulence. IEEE J. Sel. Top. Quantum Electron. 2020, 27, 1–21. [Google Scholar] [CrossRef]
  79. Deledalle, C.A.; Gilles, J. Blind atmospheric turbulence deconvolution. IET Image Process. 2020, 14, 3422–3432. [Google Scholar] [CrossRef]
  80. Chen, G.; Gao, Z.; Wang, Q.; Luo, Q. Blind de-convolution of images degraded by atmospheric turbulence. Appl. Soft Comput. 2020, 89, 106131. [Google Scholar] [CrossRef]
  81. Mao, Z.; Jaiswal, A.; Wang, Z.; Chan, S.H. Single frame atmospheric turbulence mitigation: A benchmark study and a new physics-inspired transformer model. In Proceedings of the European Conference on Computer Vision, Tel Aviv, Israel, 23–27 October 2022; Springer: Berlin/Heidelberg, Germany, 2022; pp. 430–446. [Google Scholar]
  82. Jin, D.; Chen, Y.; Lu, Y.; Chen, J.; Wang, P.; Liu, Z.; Guo, S.; Bai, X. Neutralizing the impact of atmospheric turbulence on complex scene imaging via deep learning. Nat. Mach. Intell. 2021, 3, 876–884. [Google Scholar] [CrossRef]
  83. Schmidt, J.D. Numerical Simulation of Optical Wave Propagation with Examples in Matlab; SPIE Press: Bellingham, WA, USA, 2010. [Google Scholar]
  84. Ke, X.; Wang, J. Generation, Transmission, Detection, and Application of Vortex Beams; Springer: Berlin/Heidelberg, Germany, 2023. [Google Scholar]
  85. Chen, J.; Kong, L.; Zhan, Q. Demonstration of a vectorial optical field generator with adaptive close loop control. Rev. Sci. Instruments 2017, 88, 125101. [Google Scholar] [CrossRef]
  86. Liu, J.; Wang, P.; Zhang, X.; He, Y.; Zhou, X.; Ye, H.; Li, Y.; Xu, S.; Chen, S.; Fan, D. Deep learning based atmospheric turbulence compensation for orbital angular momentum beam distortion and communication. Opt. Express 2019, 27, 16671–16688. [Google Scholar] [CrossRef]
  87. Hua, X.; Pan, C.; Shi, Y.; Liu, J.; Hong, H. Removing atmospheric turbulence effects via geometric distortion and blur representation. IEEE Trans. Geosci. Remote Sens. 2020, 60, 1–13. [Google Scholar] [CrossRef]
  88. Maulik, R.; San, O. A neural network approach for the blind deconvolution of turbulent flows. J. Fluid Mech. 2017, 831, 151–181. [Google Scholar] [CrossRef]
  89. Sahoo, P.K.; Soltani, S.; Wong, A.K. A survey of thresholding techniques. Comput. Vision Graph. Image Process. 1988, 41, 233–260. [Google Scholar] [CrossRef]
  90. Moufti, M.R.; Németh, K.; Moufti, M.R.; Németh, K. Harrat Rahat: The geoheritage value of the youngest long-lived volcanic field in the Kingdom of Saudi Arabia. In Geoheritage of Volcanic Harrats in Saudi Arabia; Springer: Berlin/Heidelberg, Germany, 2016; pp. 33–120. [Google Scholar]
  91. Tunick, A.; Tikhonov, N.; Vorontsov, M.; Carhart, G. Characterization of Optical Turbulence (Cn2) Data Measured at the ARL A_LOT Facility; US Army Research Laboratory: Adelphi, MD, USA, 2005. [Google Scholar]
  92. Walters, D.; Kunkel, K. Atmospheric modulation transfer function for desert and mountain locations: The atmospheric effects on r 0. J. Opt. Soc. Am. 1981, 71, 397–405. [Google Scholar] [CrossRef]
  93. Liu, H.; Yuan, R.; Mei, J.; Sun, J.; Liu, Q.; Wang, Y. Scale properties of anisotropic and isotropic turbulence in the urban surface layer. Bound.-Layer Meteorol. 2017, 165, 277–294. [Google Scholar] [CrossRef]
  94. Serafin, S.; Adler, B.; Cuxart, J.; De Wekker, S.F.; Gohm, A.; Grisogono, B.; Kalthoff, N.; Kirshbaum, D.J.; Rotach, M.W.; Schmidli, J.; et al. Exchange processes in the atmospheric boundary layer over mountainous terrain. Atmosphere 2018, 9, 102. [Google Scholar] [CrossRef]
  95. Finnigan, J. Turbulence in plant canopies. Annu. Rev. Fluid Mech. 2000, 32, 519–571. [Google Scholar] [CrossRef]
  96. Cherubini, T.; Businger, S.; Lyman, R.; Chun, M. Modeling optical turbulence and seeing over Mauna Kea. J. Appl. Meteorol. Climatol. 2008, 47, 1140–1155. [Google Scholar] [CrossRef]
  97. Zamir, S.W.; Arora, A.; Khan, S.; Hayat, M.; Khan, F.S.; Yang, M.H. Restormer: Efficient transformer for high-resolution image restoration. In Proceedings of the IEEE/CVF Conference on Computer Vision and Pattern Recognition, New Orleans, LA, USA, 18–24 June 2022; pp. 5728–5739. [Google Scholar]
Figure 1. When a grating with a pitch size d, as shown in (a), is superimposed onto a slightly rotated version of itself, a Moiré pattern forms, as illustrated in (b). The fringe spacing, d f , is determined by the grating pitch size (d) and the angle of rotation ( α ), as described by Equation (1). The displacement of the base grating by Δ y along the y-axis with the revealing grating remaining stationary, as depicted in (c), causes a fringe shift Δ y f along the x-axis. This shift is proportional to the grating displacement and inversely proportional to the angle of rotation.
Remotesensing 17 02032 g001
Figure 2. A remote sensing Moiré apparatus, designed to measure displacement and ground movement in challenging and inaccessible areas, such as volcanic regions. The apparatus comprises two gratings. The first grating, referred to as the base layer (G1) is positioned at the location where the displacement is to be measured. The second grating, known as the revealing layer (G2), is placed in front of a telescope or camera, or it can be digitally superimposed after capturing the base grating. The interaction between these two gratings generates Moiré fringes. When the base layer undergoes displacement while the revealing layer remains stationary, the resulting interference pattern shifts. This shift is magnified, with the degree of magnification being determined by the grating pitch and the angle between the two patterns.
Remotesensing 17 02032 g002
Figure 3. A schematic representation of the remote sensing Moiré apparatus and seismic displacement measurement workflow. A telescope records the base grating (G1), positioned at a distance L from the telescope, while the revealing grating (G2) is superimposed either physically—by positioning it in front of a high-speed camera—or digitally, onto the pattern acquired by the camera, as depicted in (a). The interaction between the two gratings generates a Moiré pattern, shown in (b). Post-processing techniques are employed to extract the Moiré fringes, enabling the measurement of displacement, as illustrated in (c). When the gratings move along the y-axis, the fringes in the Moiré pattern shift along the x-axis. To more effectively represent displacement along the y-axis, the pattern is rotated by 90 degrees. By compiling multiple frames of the captured Moiré fringes over time, the grating’s displacement can be continuously tracked, as shown in (d). These sequential frames provide a comprehensive visualization of the measured displacement ( Δ y m ), ultimately leading to its temporal representation, as presented in (e).
Remotesensing 17 02032 g003
Figure 4. A schematic illustrating the integration of the remote sensing Moiré apparatus with ACI. Various forms of turbulence-induced geometric deformation such as beam wandering or higher-order aberrations hinder the accurate reconstruction of the base layer before physical or numerical superposition with the revealing layer. As a result, leveraging Moiré patterns to remotely detect small physical displacements of the base layer may become unreliable depending on the ambient propagation conditions. This is illustrated as the passive case denoted by green arrows. With ACI, the spatiotemporal distortion encountered within the diffraction cone of the base layer is first characterized by propagating and then reconstructing a set of orbital angular momentum (OAM) modes. The band-limited profile of each OAM mode characterizes a segment of the total diffraction cone at the moment of propagation. Subsequently, a reciprocal space analysis of the distortion in each reconstructed OAM mode is used to determine unique correlation-injecting sources for the corresponding mode. Each correlation-injecting source (CIS) can be conceptualized as an orthogonal narrow-band beam capable of compensating distortions incurred within its diffraction cone. Therefore, the set of CISs is used to provide compensation within the broader diffraction cone of the base layer. Through convolution, the CISs are injected into the base layer as shown in the purple block. This generates a set of correlation-injected partial targets, which can be conceptualized as the superposition of the base layer with an auxiliary source. The auxiliary source which is correlated with both the base layer and the CISs enables high-fidelity propagation and reconstruction at the detector side. Turbulence-induced distortions are sufficiently suppressed, allowing for the remote detection of physical displacements of the base layer with good precision.
Remotesensing 17 02032 g004
Figure 5. The propagation of a grating through turbulent atmospheric conditions is examined across different turbulence levels, characterized by the C n 2 values. The comparison includes both the passive and active cases as C n 2 increases from 1 × 10 15   m 2 / 3 (b) to 7 × 10 15   m 2 / 3 (e). Correspondingly, the ratio Δ l t / Δ l s increases from 1.25 to 4.02 across these cases. The ground-truth or reference grating is depicted in (a) for comparison. In the top row, the passive propagation results are presented (b1e1), while the active results appear in the bottom row (b2e2). To enhance the visibility of displacement due to atmospheric effects, all gratings are framed by a dashed rectangular box centered at the origin, facilitating the detection of pattern shifts.
Remotesensing 17 02032 g005
Figure 6. After the grating patterns propagate through a turbulent medium and are reconstructed, the revealing grating can be digitally superimposed to generate the Moiré fringes. The ideal Moiré fringes are shown in panel (a), while the passive Moiré fringes for increasing turbulence levels, from C n 2 = 1 × 10 15 m 2 / 3 to 7 × 10 15 m 2 / 3 , are displayed in the top row (b1e1). Similarly, the active results are shown in the bottom row (b2e2).
Remotesensing 17 02032 g006
Figure 7. Displacement information is obtained from the grating pattern after it propagates through atmospheric turbulence and undergoes reconstruction, with the revealing grating being applied and the Moiré pattern being generated digitally. (a) The ground truth. (be) Passive and active cases across a range of turbulence levels, from C n 2 = 1 × 10 15 m 2 / 3 to 7 × 10 15 m 2 / 3 . In (a1), the ideal Moiré pattern is filtered to highlight the interference pattern, while (b1e1) display the passive Moiré patterns for the respective C n 2 values, and (b3e3) illustrate the active cases. (a2) depicts the interference pattern for the ideal case, whereas (b2e2) represent the passive cases, and (b4e4) show the active cases. The black line denotes the auto-NCC for the ideal case, while the blue line represents the NCC for the passive case relative to the ideal case, and the red line corresponds to the NCC for the active case in comparison with the ideal case.
Remotesensing 17 02032 g007
Figure 8. The measured displacement of the grating after propagation through the atmosphere and reconstruction was compared across 100 realizations, both with and without ACI, as the turbulence strength C n 2 increased from 1 × 10 15   m 2 / 3 to 7 × 10 15   m 2 / 3 in (a). In all the scenarios, the ground-truth grating remained stationary, although the measured values exhibited some variation. The solid blue and red lines represent the mean displacement across the 100 realizations for the passive and active cases, respectively. The error boxes (dark-shaded regions) indicate the standard deviation of the measurements, while the error bars (light-shaded regions) denote the range within which 90% of the measured displacements fall. For all values of C n 2 , the active cases recorded either no displacement or very minimal displacement, closely aligning with the ground truth. To verify the consistency of our measurements, the ground-truth grating was deliberately displaced by Δ y g for 7 × 10 15   m 2 / 3 , as illustrated by the solid black line in (b), and the displacement Δ y m was subsequently measured both with and without ACI. The blue and red solid lines again represent the mean measured displacement for the passive and active cases, respectively, with the error boxes showing the standard deviation and the error bars indicating the range within which 90% of the measured displacements fall.
Remotesensing 17 02032 g008
Figure 9. Performance comparison of the Moiré apparatus, with and without ACI integration, for seismic displacement measurement. The figure shows the true displacement as black stars, and the Moiré apparatus measurements with ACI as red stars (both discretized and interpolated for clarity). In contrast, the measurements without ACI are represented by blue stars.
Remotesensing 17 02032 g009
Figure 10. (a) Diagram of tetrahedral frame structure and (b) dual-component measurement setup used to determine vertical displacement when the grating is tilted.
Remotesensing 17 02032 g010
Disclaimer/Publisher’s Note: The statements, opinions and data contained in all publications are solely those of the individual author(s) and contributor(s) and not of MDPI and/or the editor(s). MDPI and/or the editor(s) disclaim responsibility for any injury to people or property resulting from any ideas, methods, instructions or products referred to in the content.