
Indeterminacy of Camera Intrinsic Parameters in Structure from Motion Using Images from Constant-Pitch Flight Design


Abstract

1. Introduction
- (a)
- To investigate the indeterminacy of two basic intrinsic parameters f and cy, which showed significant instabilities in the previous experiment as described above [25].
- (b)
- To validate these numerical findings using real datasets acquired at three different ground sampling distances (GSDs).
- (c)
- To discuss a practical mitigation strategy to stabilize intrinsic parameter estimation.
2. Materials and Methods
2.1. Fundamental of Self-Calibration in SfM
- (x, y): image coordinates of the projection of ground point.
- (X, Y, Z): object space coordinates of the ground point.
- (X0, Y0, Z0): object space coordinates of the camera projection center.
- cy: y-coordinate of the principal point in the image.
- f: camera focal length.
- α1i, α2i, α3i (i = 1, 2, 3): elements of the rotation matrix formed by three rotation angles.
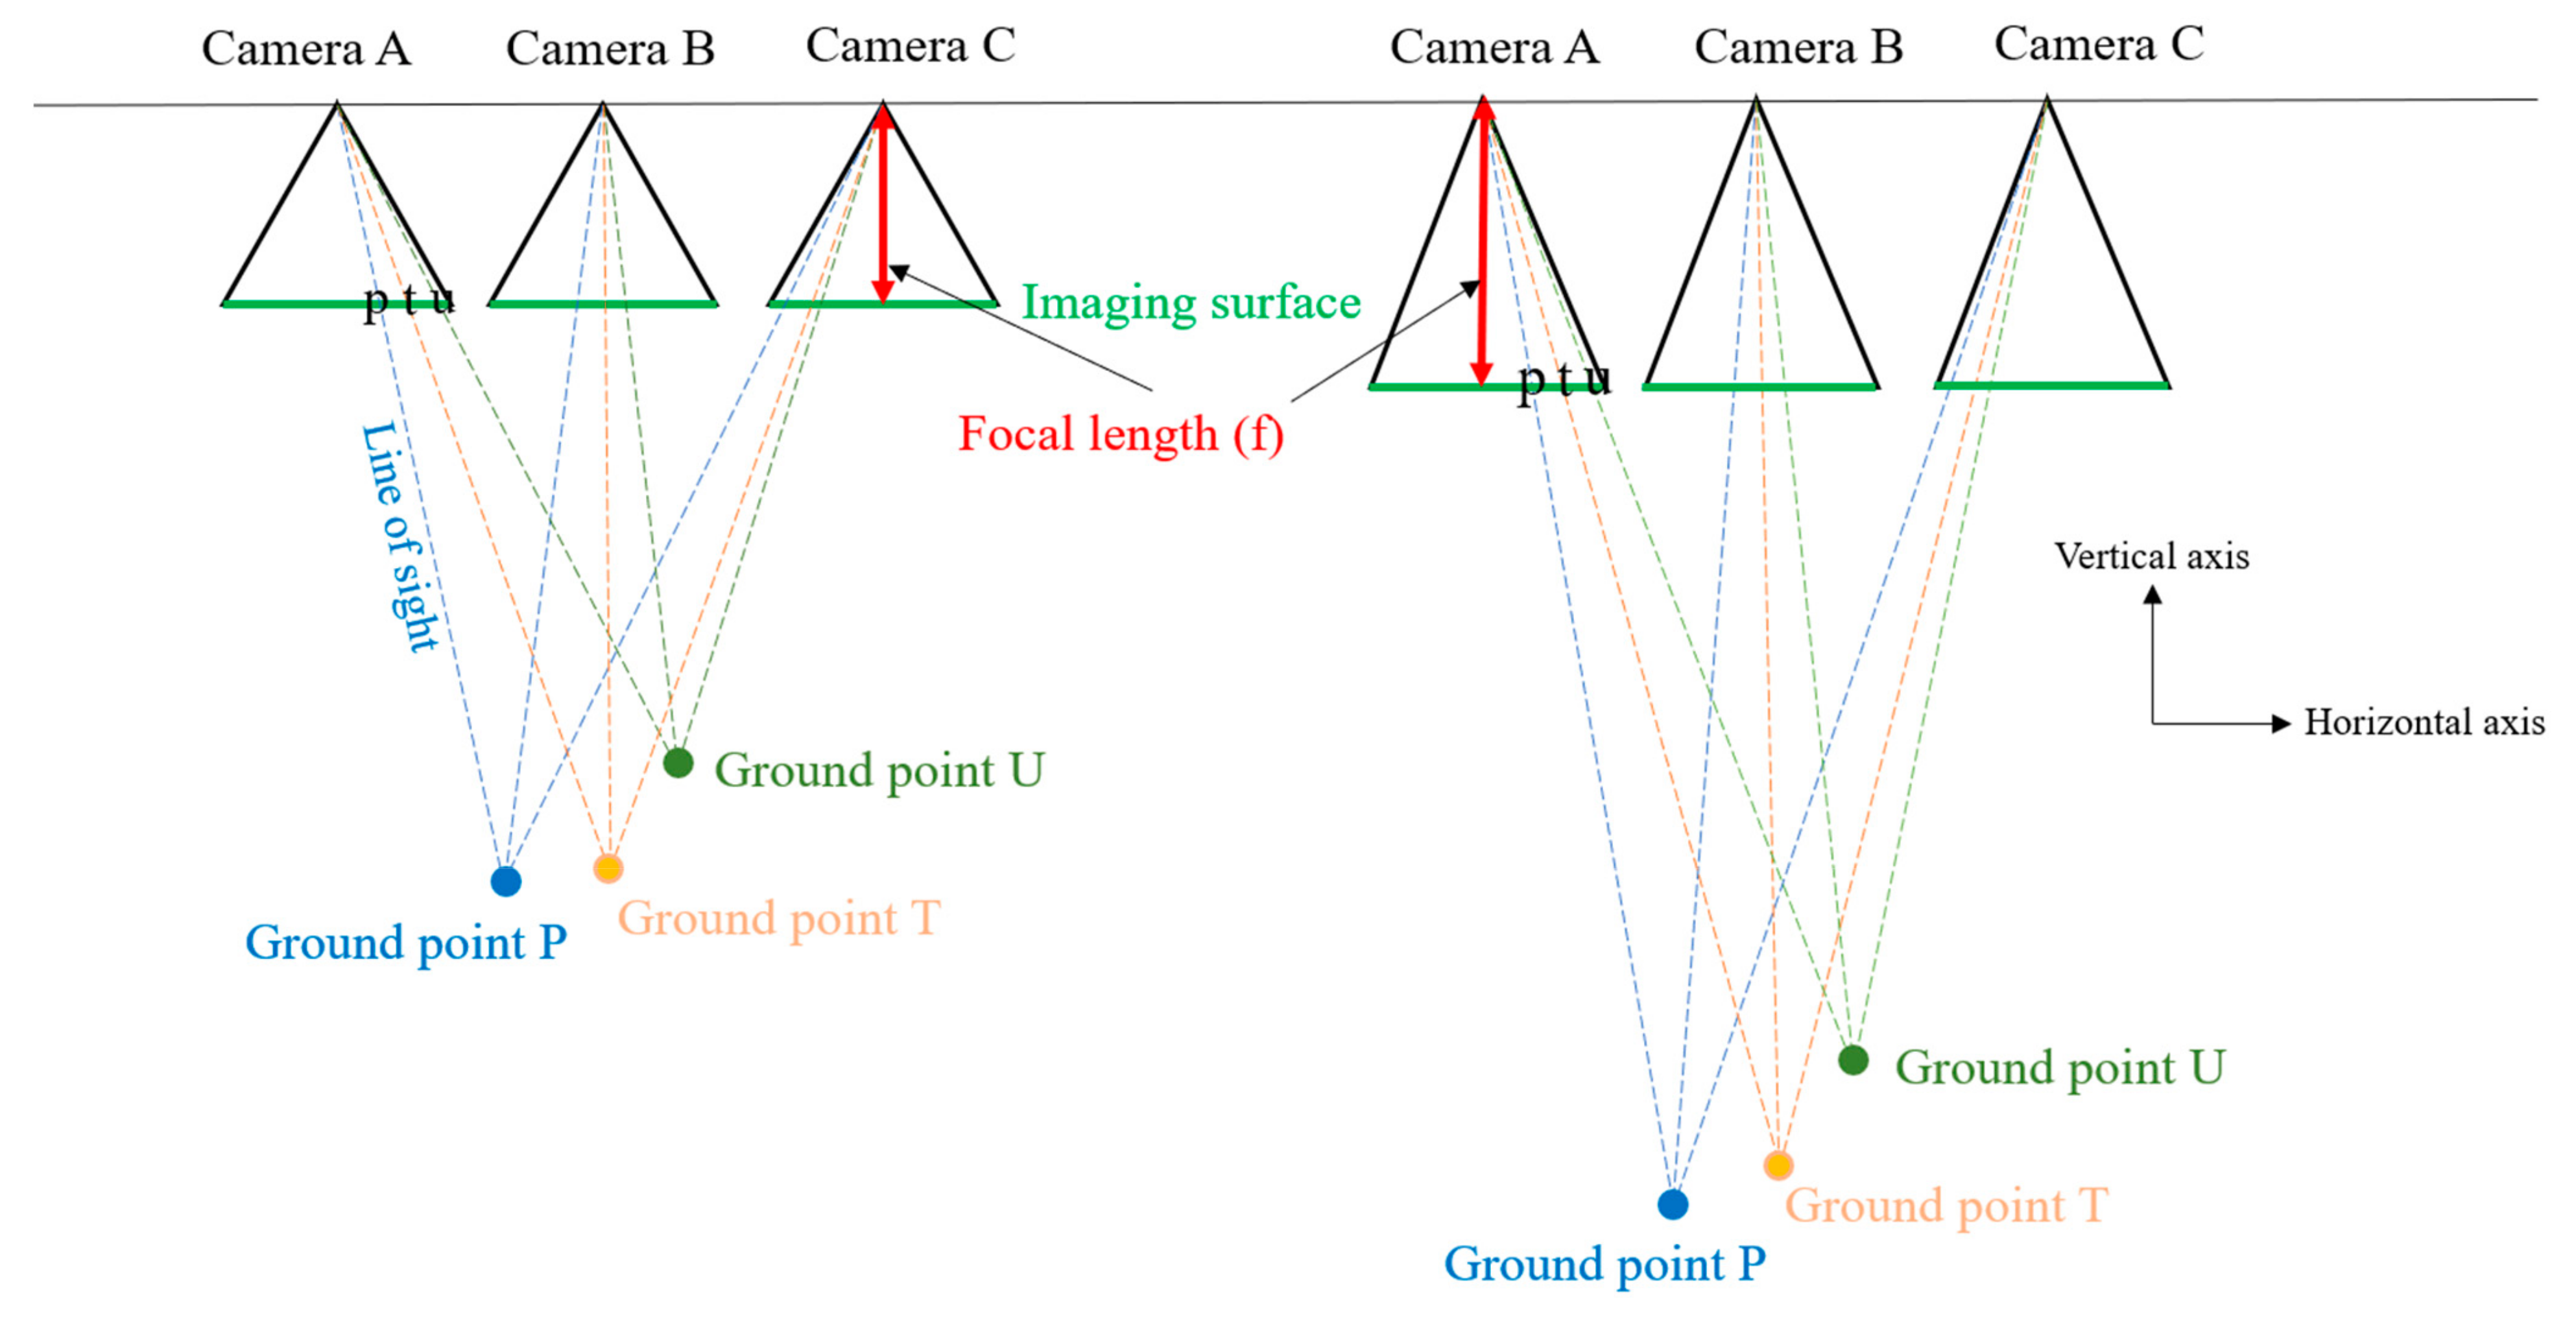
- Extrinsic parameters: parameters representing relative position and the orientation of each camera.
- Intrinsic parameters: parameters representing the geometric characteristics of the camera, such as focal length and principal points. Note that only two parameters f and cy are considered in this study and in Equation (1).
- Three-dimensional point coordinates: relative coordinates of scene points in object space.
2.2. Numerical Experiments
- (a)
- Synthetic Image Acquisition
- (b)
- SfM Processing
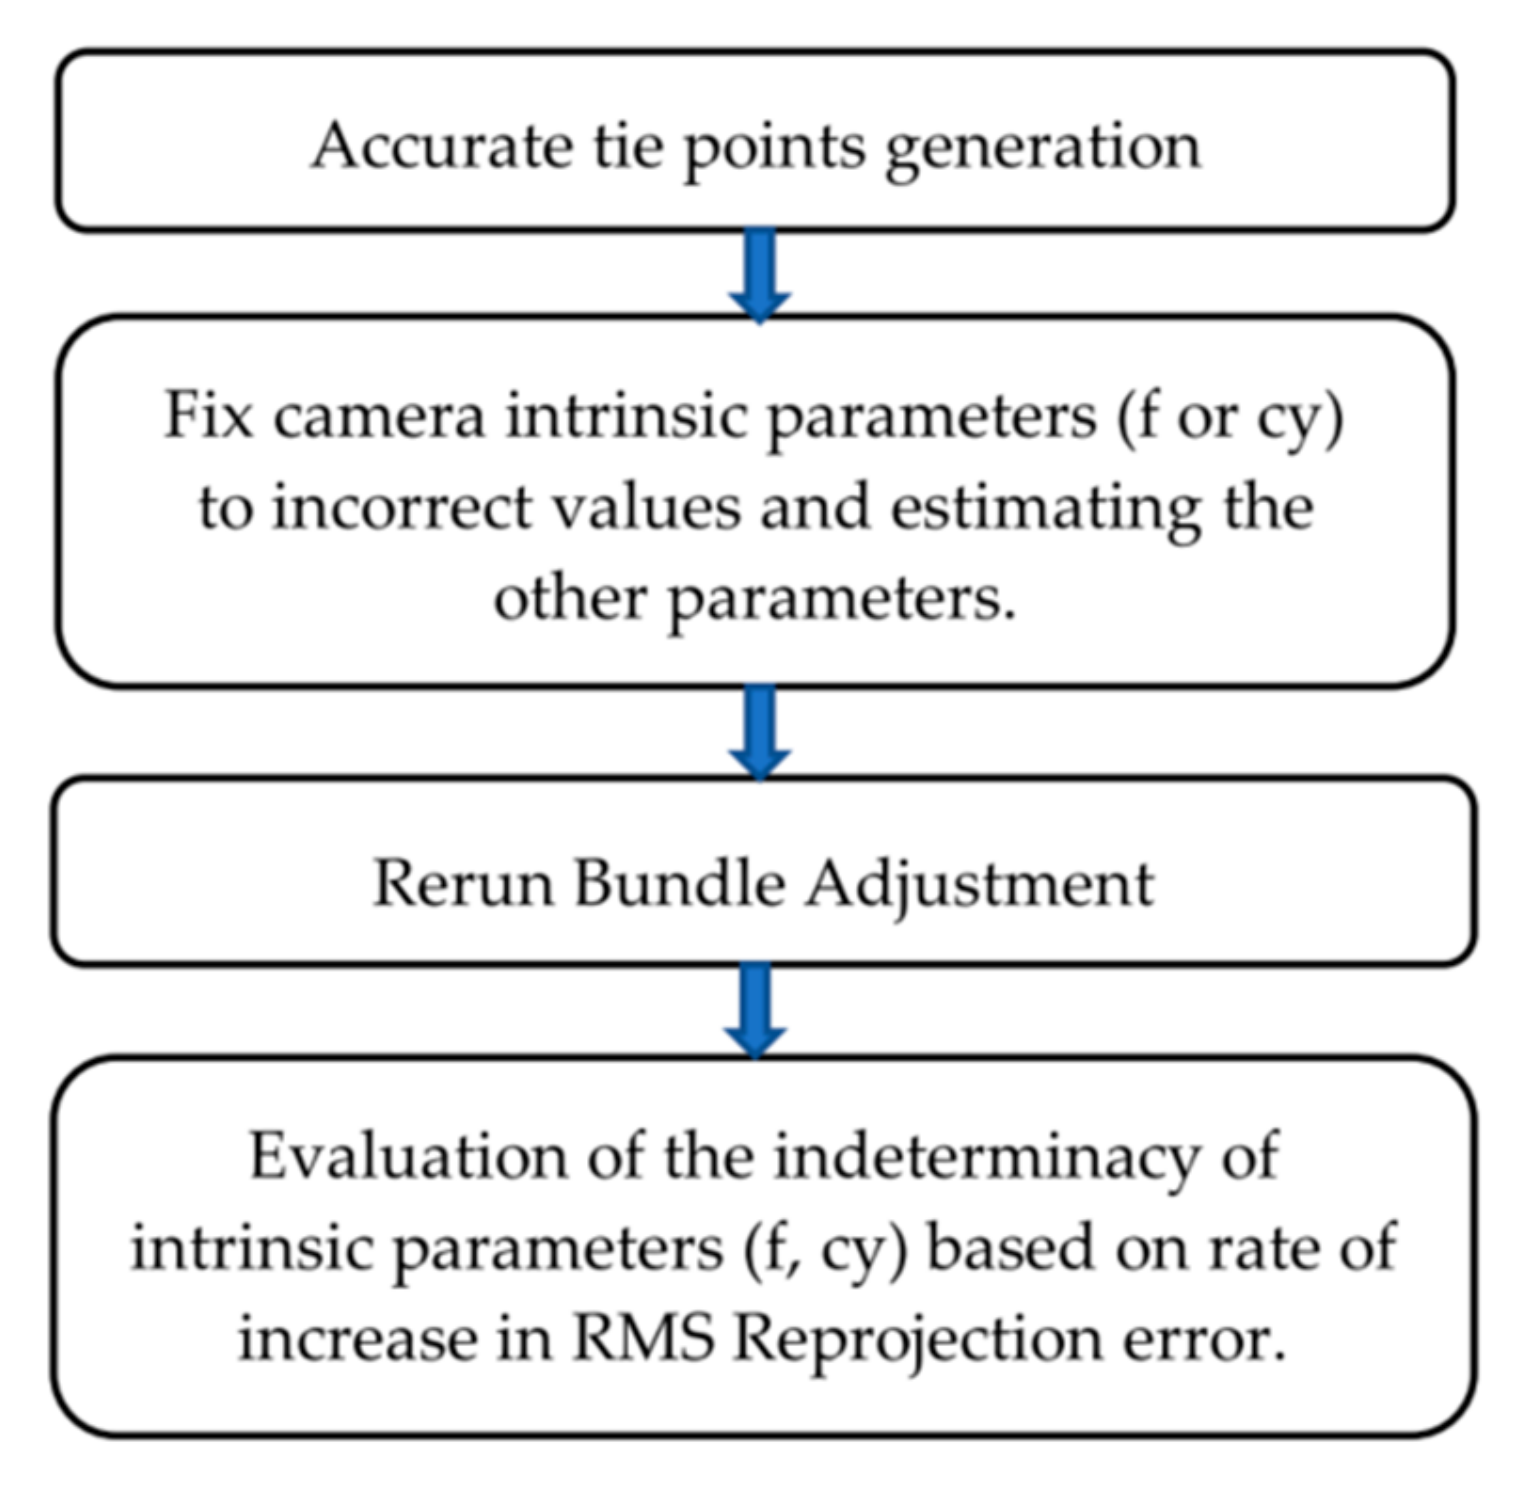
- (c)
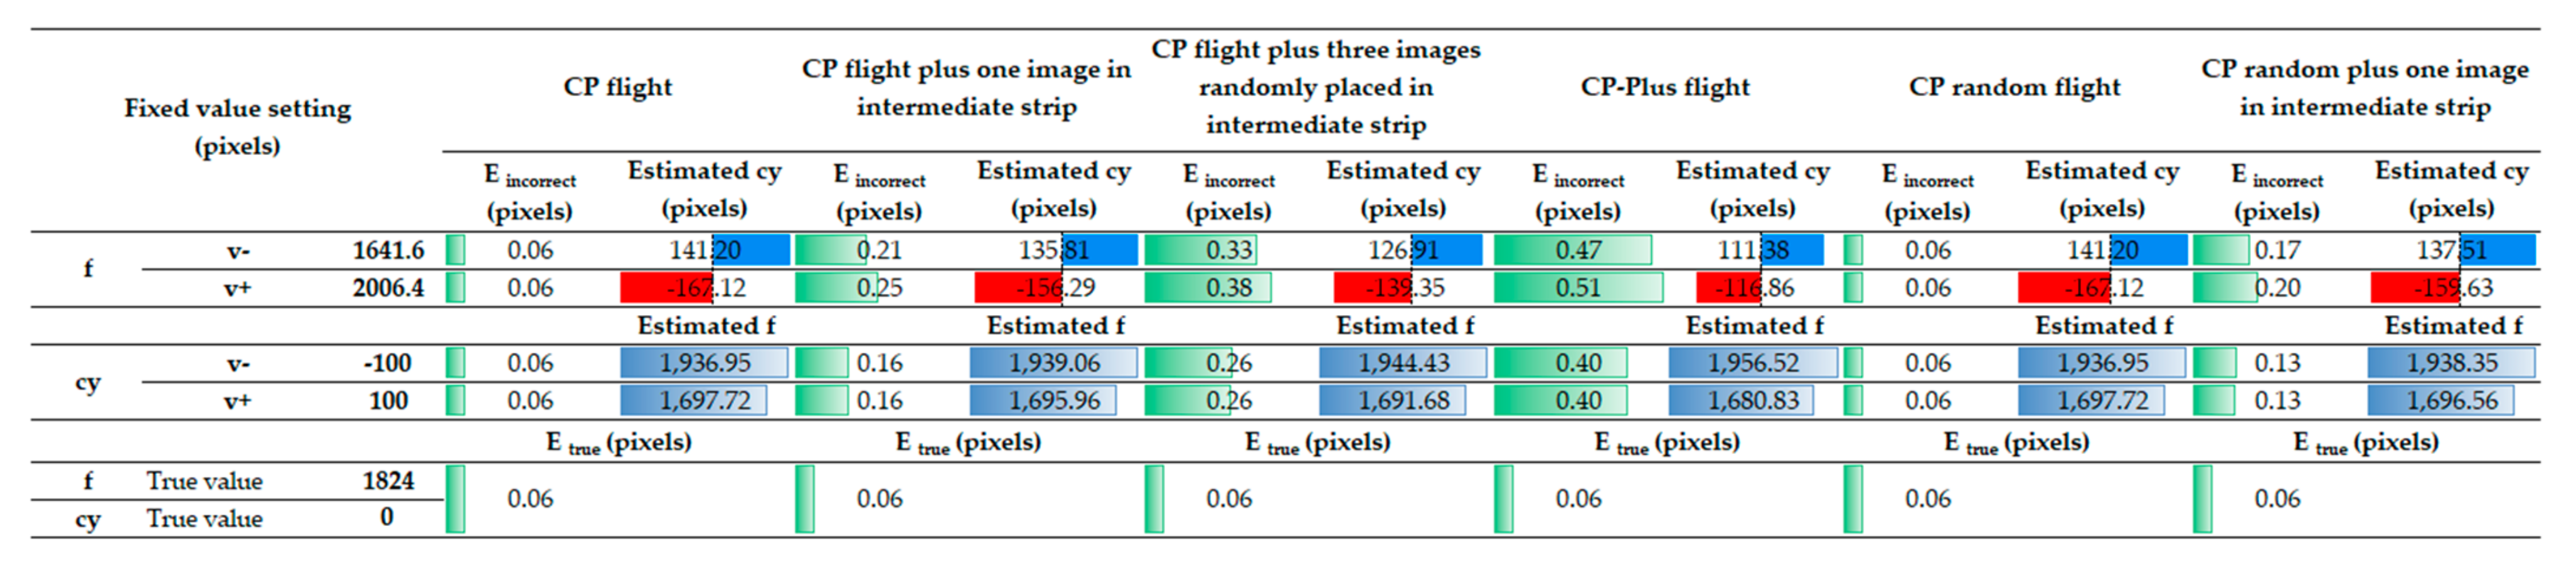
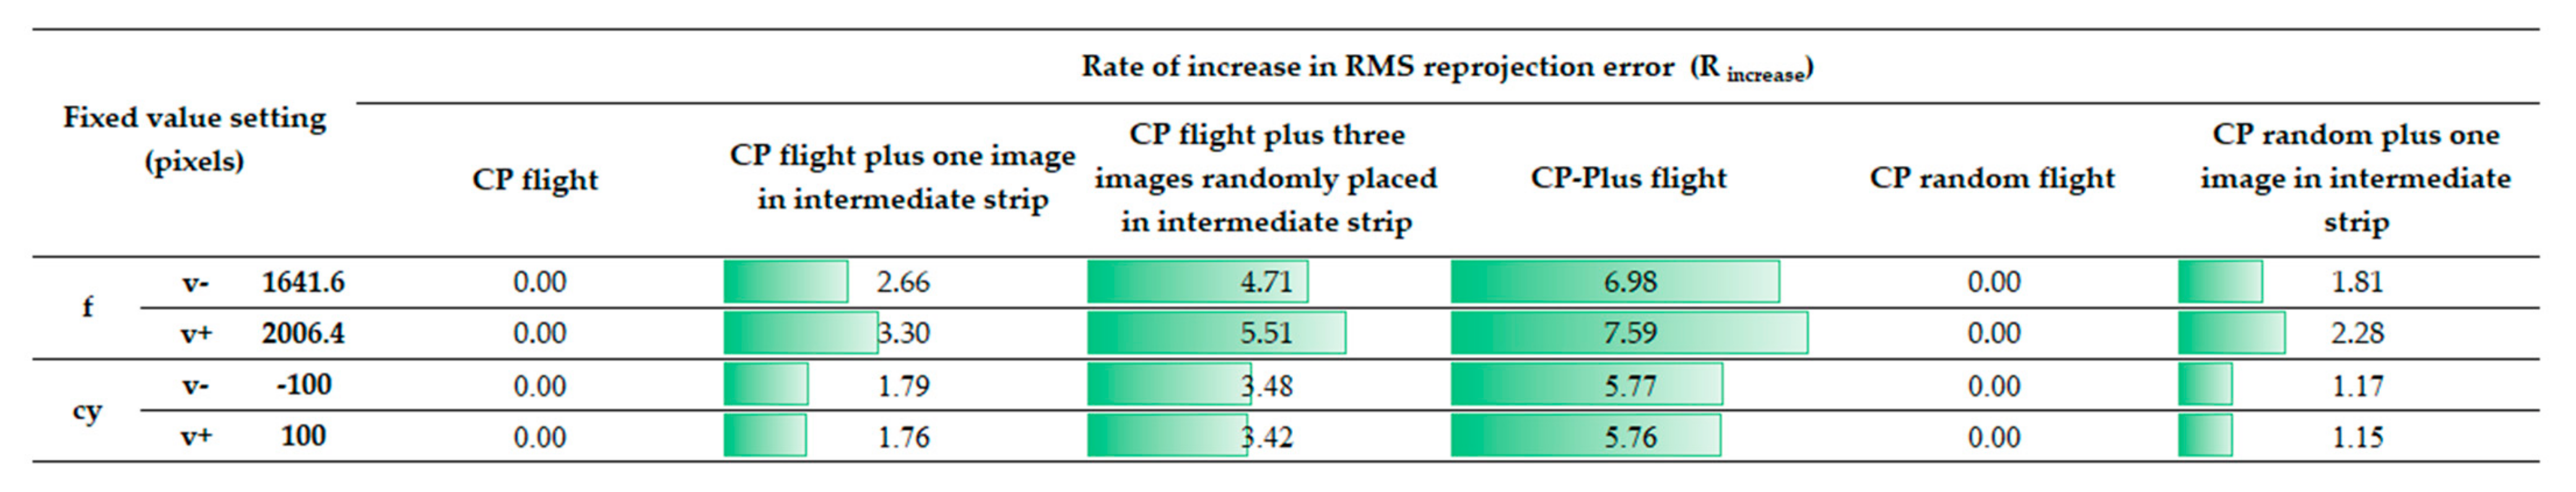
- Evaluation of The Indeterminacy of Intrinsic Camera Parameters in SfM
2.3. Real-Data Analysis
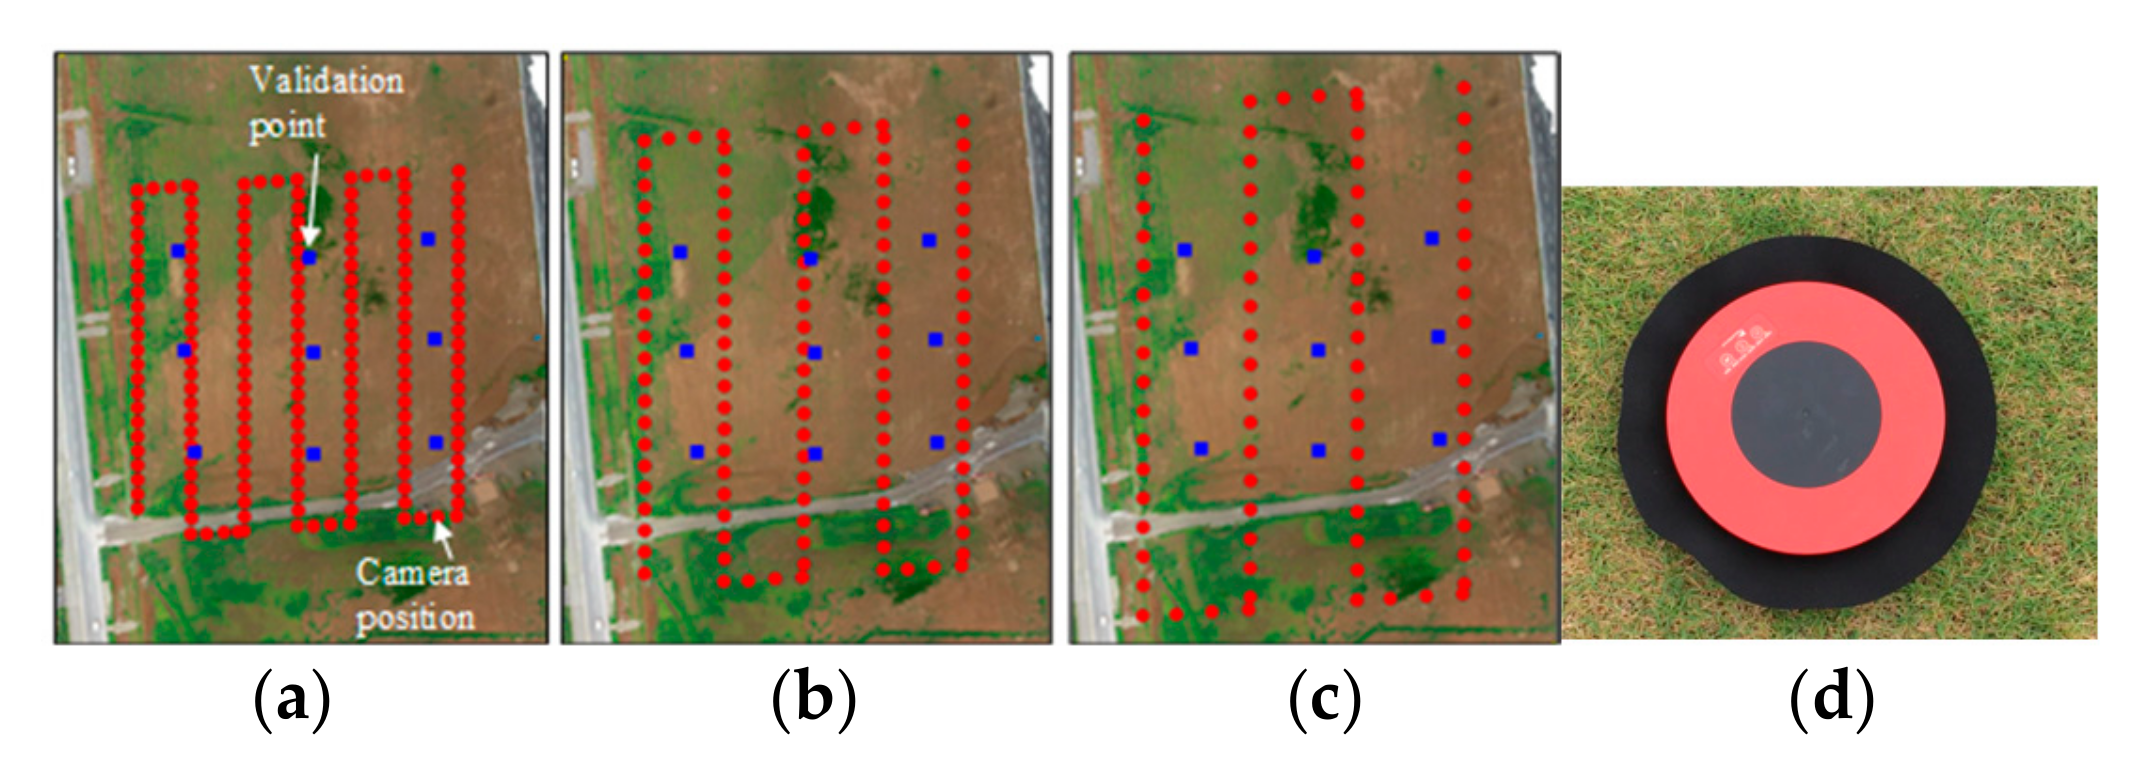
- (a)
- Study Site
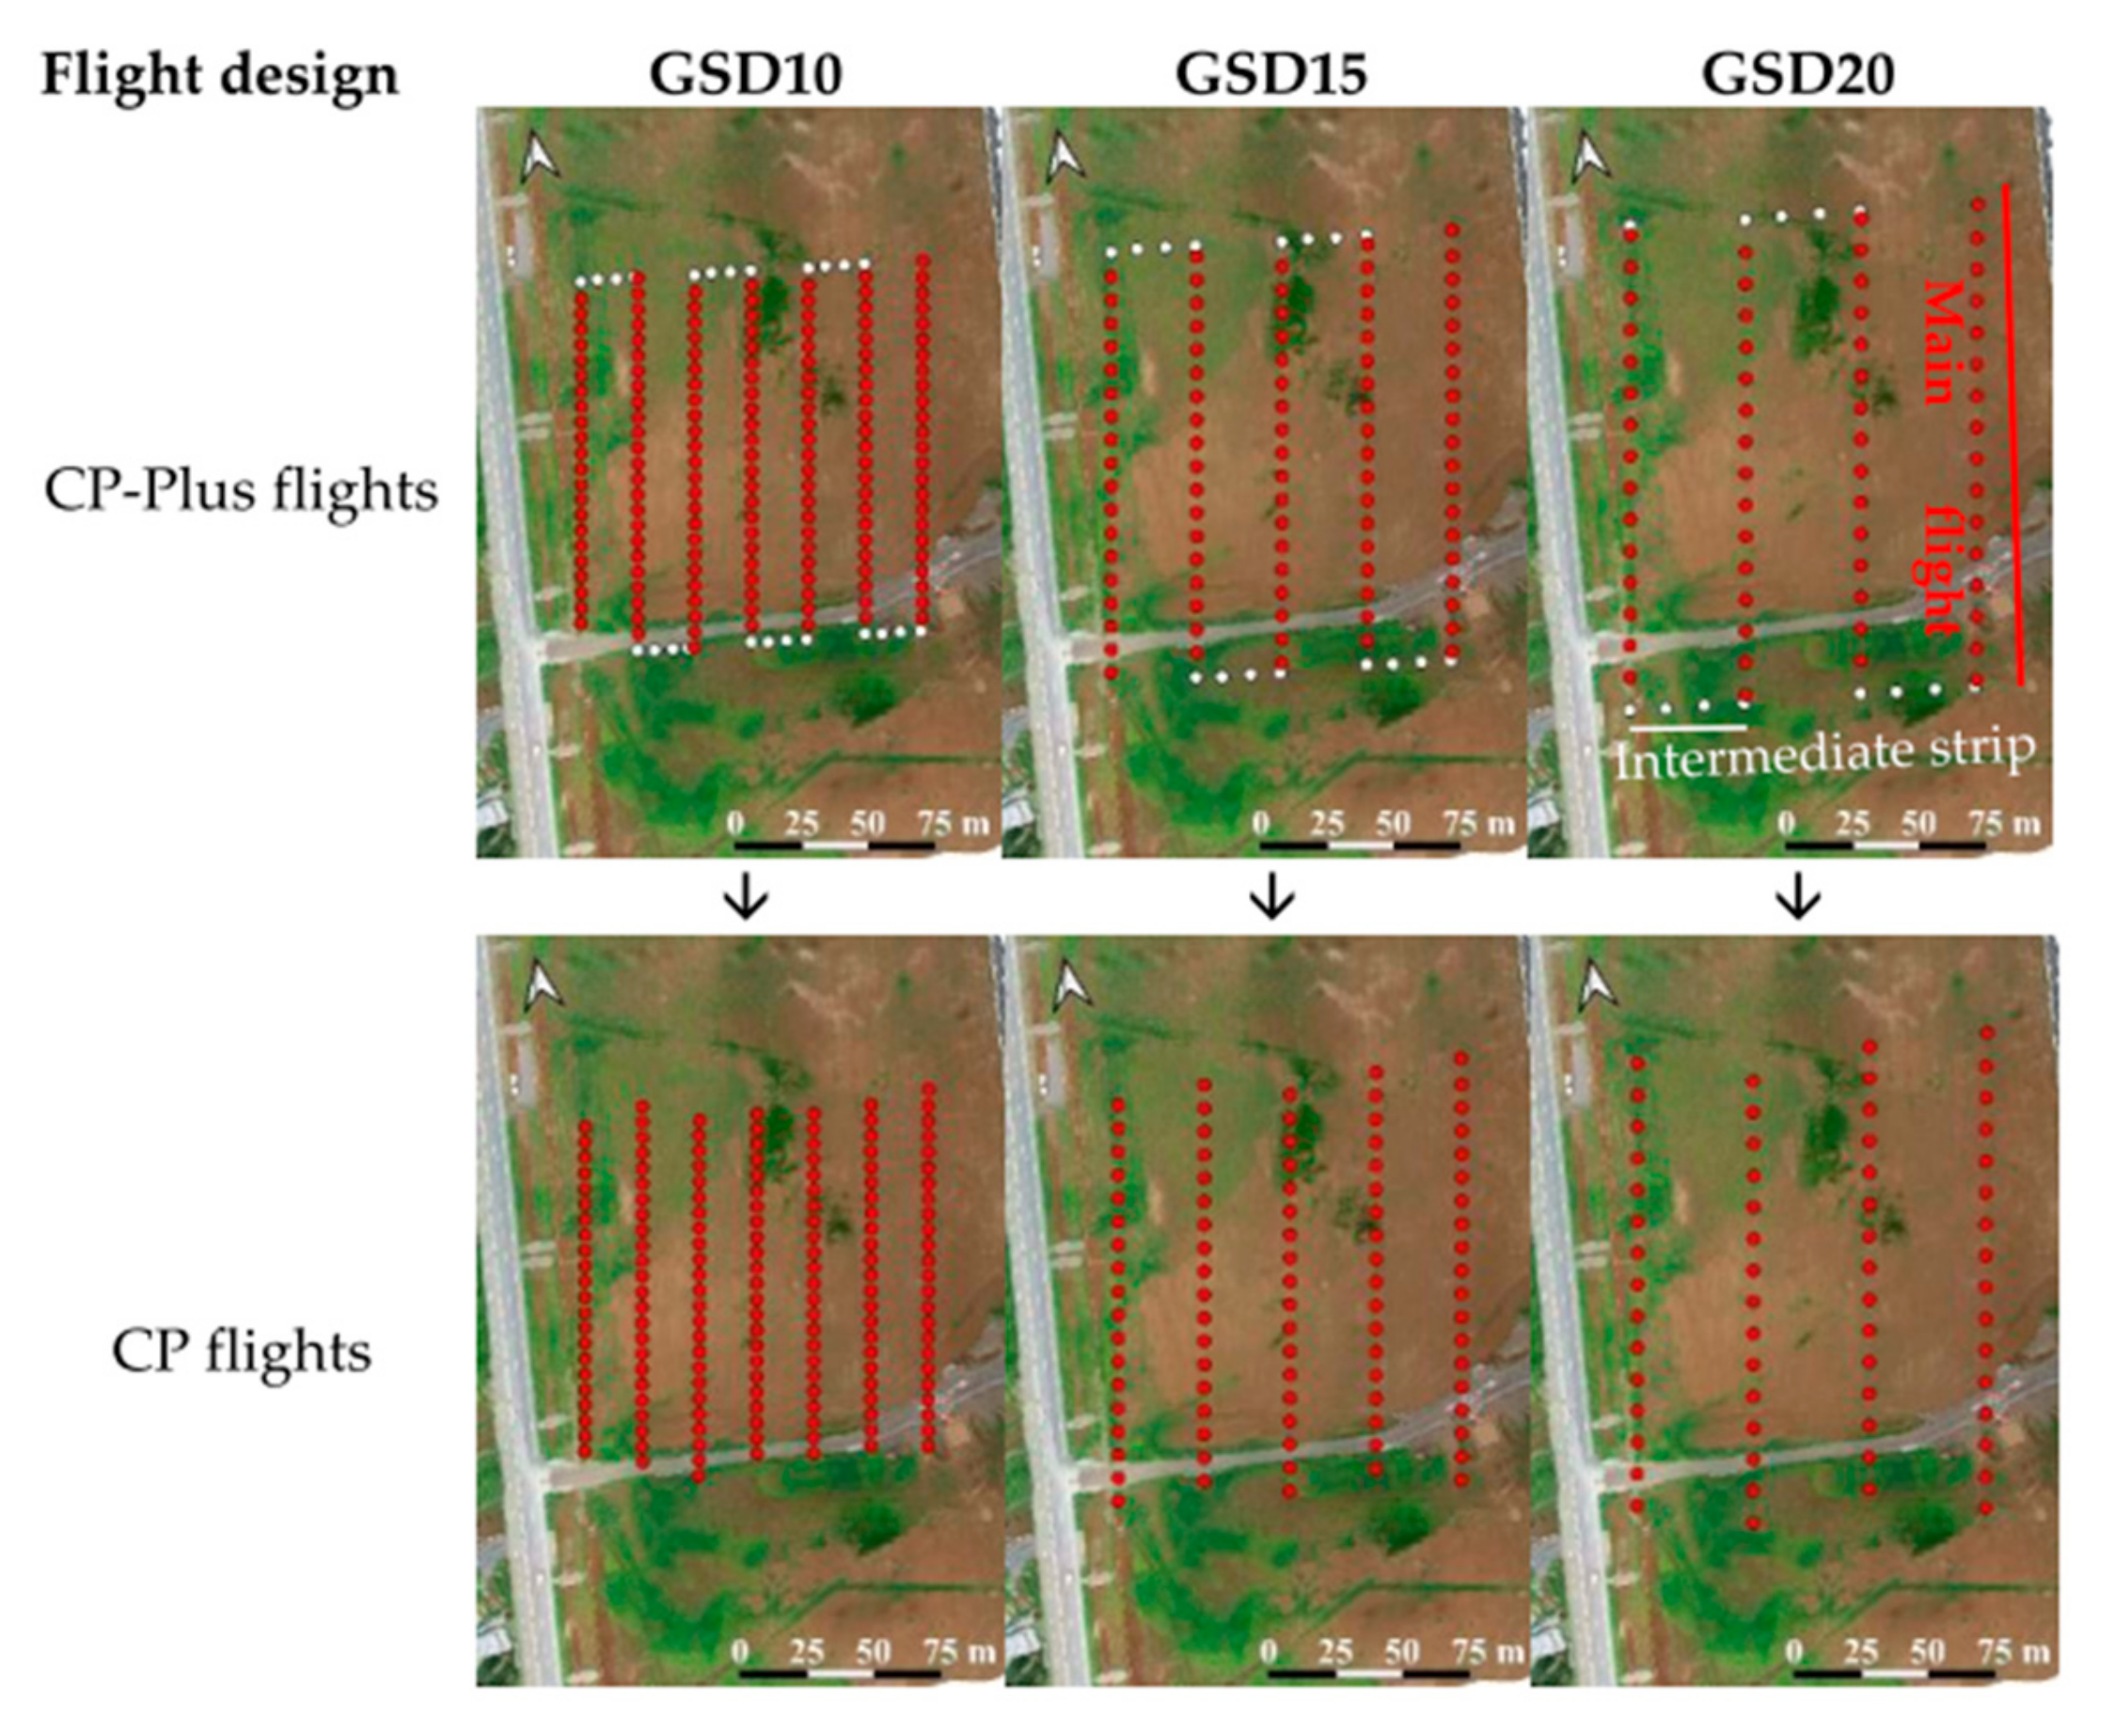
- (b)
- Image Acquisition
- (c)
- SfM Processing
- Size of input images for feature detection: High
- Key point limit: a half (½) of the average number of detectable key points for the input images (35,643).
- Intrinsic parameters considered in Brown models: f, cx, cy, k1–k3, p1–p2.
- (d)
- Intrinsic Parameters Estimation and Error Evaluation.
3. Results
3.1. Numerical Experiments
3.2. Real-Data Analysis
3.2.1. Estimates of Intrinsic Camera Parameters (f, cy) Across 50 Trials of a Single SfM Setting
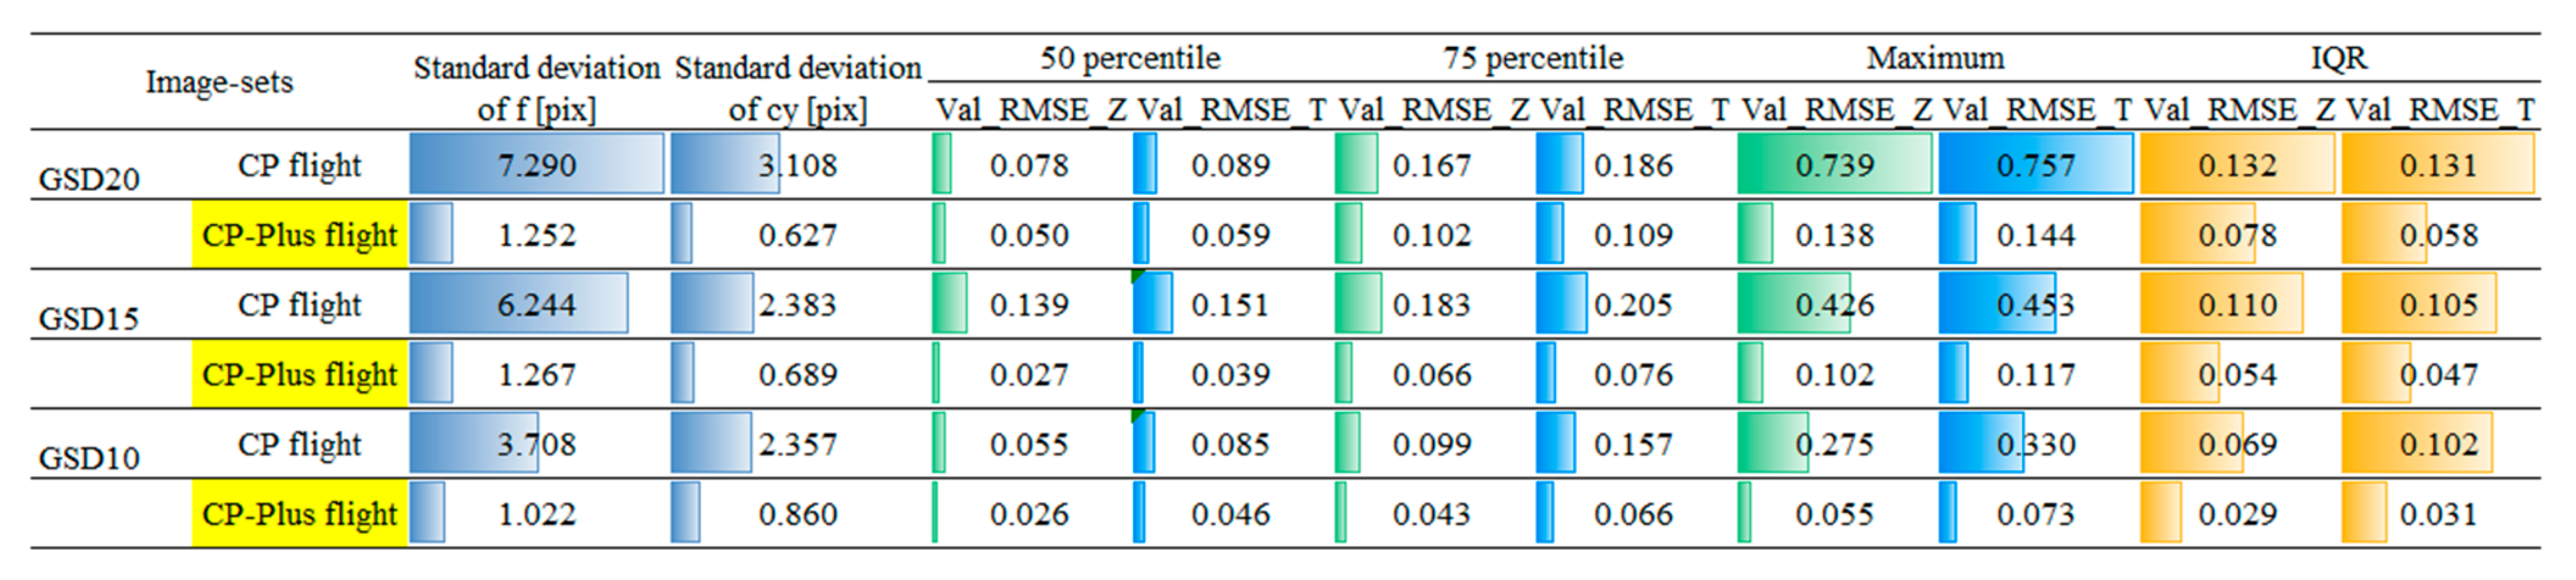
3.2.2. Estimates of Intrinsic Camera Parameters (f and cy) Across 30 SfM Settings
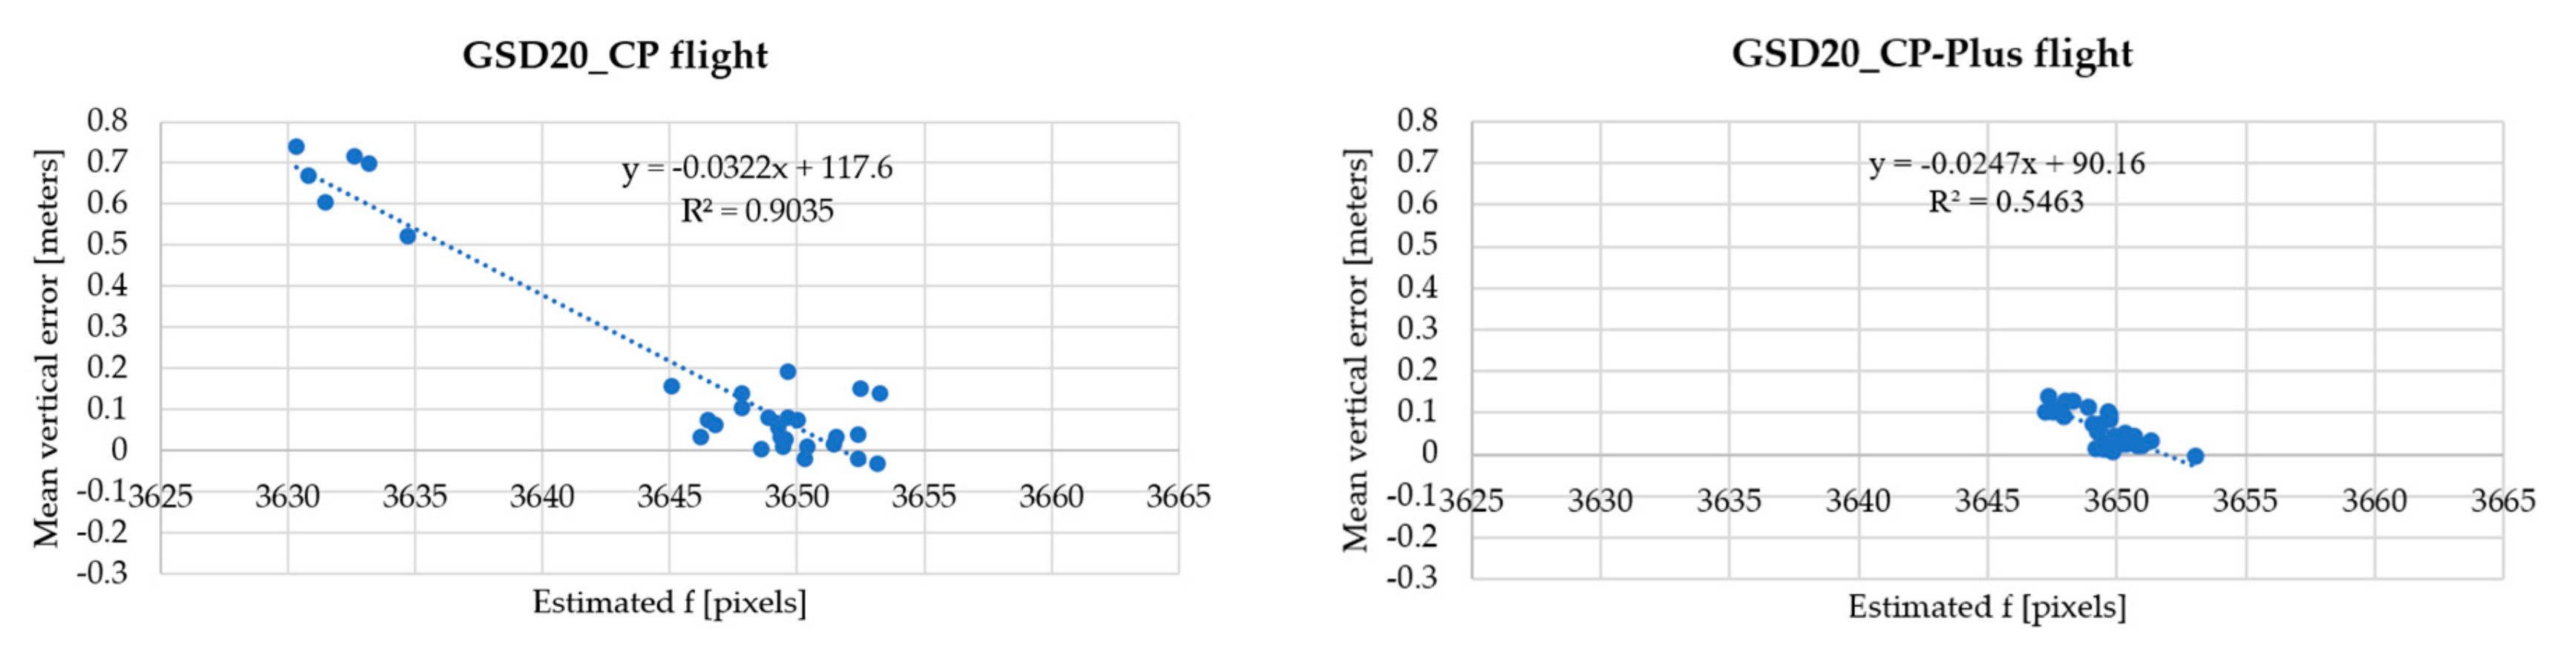
3.2.3. Correlation Between the Estimates of f and the Mean Vertical Error for All Validation Points
4. Discussion
4.1. Indeterminacy of Intrinsic Camera Parameters in Image-Based SfM
4.2. Remedy for Indeterminacy of Intrinsic Parameters in Image-Based SfM
4.3. Implications for Common Flight Configurations
5. Conclusions
Supplementary Materials
Author Contributions
Funding
Data Availability Statement
Acknowledgments
Conflicts of Interest
Abbreviations
| BA | Bundle Adjustment |
| CP | Constant Pitch |
| DEM | Digital Elevation Model |
| GCP | Ground Control Point |
| GNSS | Global Navigation Satellite System |
| MEZ | Mean vertical error of all validation points |
| MVS | Multi-View Stereo |
| RMS Error | Root Mean Square Error |
| RTK-GNSS | Real-Time Kinematic Global Navigation Satellite System |
| SfM | Structure from Motion |
| UAV | Unmanned Aerial Vehicle |
| Val_RMSE_T | Total RMS error of all validation points |
| Val_RMSE_Z | Vertical RMS error of all validation points |
References
- Xu, Y.; Zhang, J. UAV-Based Bridge Geometric Shape Measurement Using Automatic Bridge Component Detection and Distributed Multi-View Reconstruction. Autom. Constr. 2022, 104376. [Google Scholar] [CrossRef]
- Wang, F.; Zou, Y.; del Rey Castillo, E.; Ding, Y.; Xu, Z.; Zhao, H.; Lim, J.B.P. Automated UAV Path-Planning for High-Quality Photogrammetric 3D Bridge Reconstruction. Struct. Infrastruct. Eng. 2024, 20, 1595–1614. [Google Scholar] [CrossRef]
- Khaloo, A.; Lattanzi, D.; Cunningham, K.; Dell’Andrea, R.; Riley, M. Unmanned Aerial Vehicle Inspection of the Placer River Trail Bridge through Image-Based 3D Modelling. Struct. Infrastruct. Eng. 2018, 14, 124–136. [Google Scholar] [CrossRef]
- Siqueira, H.L.; Marcato, J.; Matsubara, E.T.; Eltner, A.; Colares, R.A.; Santos, F.M. The Impact of Ground Control Point Quantity on Area and Volume Measurements with UAV SFM Photogrammetry Applied in Open Pit Mines. In Proceedings of the IGARSS 2019 IEEE International Geoscience and Remote Sensing Symposium, Yokohama, Japan, 28 July 2019; pp. 9093–9096. [Google Scholar]
- Hao, J.; Zhang, X.; Wang, C.; Wang, H.; Wang, H. Application of UAV Digital Photogrammetry in Geological Investigation and Stability Evaluation of High-Steep Mine Rock Slope. Drones 2023, 7, 198. [Google Scholar] [CrossRef]
- Dawei, Z.; Lizhuang, Q.; Demin, Z.; Baohui, Z.; Lianglin, G. Unmanned Aerial Vehicle (UAV) Photogrammetry Technology for Dynamic Mining Subsidence Monitoring and Parameter Inversion: A Case Study in China. IEEE Access 2020, 8, 16372–16386. [Google Scholar] [CrossRef]
- Bonali, F.L.; Corti, N.; Russo, E.; Marchese, F.; Fallati, L.; Pasquaré Mariotto, F.; Tibaldi, A. Commercial-UAV-Based Structure from Motion for Geological and Geohazard Studies. In Building Knowledge for Geohazard Assessment and Management in the Caucasus and Other Orogenic Regions; Springer: Dordrecht, The Netherlands, 2021; pp. 389–427. [Google Scholar]
- Yakar, M.; Ulvi, A.; Yiğit, A.Y.; Alptekin, A. Discontinuity Set Extraction from 3D Point Clouds Obtained by UAV Photogrammetry in a Rockfall Site. Surv. Rev. 2023, 55, 416–428. [Google Scholar] [CrossRef]
- Butcher, B.; Walton, G.; Kromer, R.; Gonzales, E.; Ticona, J.; Minaya, A. High-Temporal-Resolution Rock Slope Monitoring Using Terrestrial Structure-from-Motion Photogrammetry in an Application with Spatial Resolution Limitations. Remote Sens. 2023, 16, 66. [Google Scholar] [CrossRef]
- Saito, T.; Kawai, T.; Takahara, Y.; Nagamatsu, D.; Inosako, K. Sand Movement Analysis of the Tottori Sand Dunes Using Aerial Photogrammetry by UAVs. J. Arid. Land Stud. 2024, 34, 87–91. [Google Scholar] [CrossRef]
- Laporte-Fauret, Q.; Marieu, V.; Castelle, B.; Michalet, R.; Bujan, S.; Rosebery, D. Low-Cost UAV for High-Resolution and Large-Scale Coastal Dune Change Monitoring Using Photogrammetry. J. Mar. Sci. Eng. 2019, 7, 63. [Google Scholar] [CrossRef]
- Fraser, C.S.; Al-Ajlouni, S. Zoom-Dependent Camera Calibration in Digital Close-Range Photogrammetry. Photogramm. Eng. Remote Sens. 2006, 72, 1017–1026. [Google Scholar] [CrossRef]
- Fraser, C.S. Photogrammetry and Remote Sensing Digital Camera Self-Calibration. ISPRS J. Photogramm. Remote Sens. 1997, 52, 149–159. [Google Scholar] [CrossRef]
- Abeho, D.R.; Shoko, M.; Odera, P.A. Effects of Camera Calibration on the Accuracy of Unmanned Aerial Vehicle Sensor Products. Int. J. Eng. Geosci. 2024, 9, 314–323. [Google Scholar] [CrossRef]
- Senn, J.A.; Mills, J.; Walsh, C.L.; Addy, S.; Peppa, M. On-site Geometric Calibration of RPAS Mounted Sensors for SfM Photogrammetric Geomorphological Surveys. Earth Surf. Process Landf. 2022, 47, 1615–1634. [Google Scholar] [CrossRef]
- Daakir, M.; Zhou, Y.; Pierrot Deseilligny, M.; Thom, C.; Martin, O.; Rupnik, E. Improvement of Photogrammetric Accuracy by Modeling and Correcting the Thermal Effect on Camera Calibration. ISPRS J. Photogramm. Remote Sens. 2019, 148, 142–155. [Google Scholar] [CrossRef]
- Elias, M.; Eltner, A.; Liebold, F.; Maas, H.-G. Assessing the Influence of Temperature Changes on the Geometric Stability of Smartphone- and Raspberry Pi Cameras. Sensors 2020, 20, 643. [Google Scholar] [CrossRef]
- Sanz-Ablanedo, E.; Chandler, J.H.; Ballesteros-Pérez, P.; Rodríguez-Pérez, J.R. Reducing Systematic Dome Errors in Digital Elevation Models through Better UAV Flight Design. Earth Surf. Process Landf. 2020, 45, 2134–2147. [Google Scholar] [CrossRef]
- Smith, M.J.; Cope, E. The Effects of Temperature Variation on Single-Lens-Reflex Digital Camera Calibration Parameters. In Proceedings of the International Archives of Photogrammetry, Remote Sensing and Spatial Information Sciences, Commission V Symposium, Part 5, Newcastle upon Tyne, UK, 21–24 June 2010; Volume 38, pp. 554–559. [Google Scholar]
- Luo, W.; Shao, M.; Che, X.; Hesp, P.A.; Bryant, R.G.; Yan, C.; Xing, Z. Optimization of UAVs-SfM Data Collection in Aeolian Landform Morphodynamics: A Case Study from the Gonghe Basin, China. Earth Surf. Process Landf. 2020, 45, 3293–3312. [Google Scholar] [CrossRef]
- Kanno, A.; Yuji, M.; Otsu, Y.; Sugimoto, K.; Takada, M. Effect of Constant Pitch Meandering Flight Method and Analysis Settings in SfM without GCPs. In Proceedings of the Annual Conference of the Japan Society of Photogrammetry and Remote Sensing, 20–21 May 2021; pp. 49–52. Available online: https://ds.cc.yamaguchi-u.ac.jp/~kanno/pdf/JSPRS_2021_1/paper_JSPRS_2021_1.pdf (accessed on 7 June 2025). (In Japanese).
- Ariyo, K.; Junnosuke, K.; Truc, T.H.; Masaki, H.; Tatsuji, F.; Kyouhei, K. Accuracy Verification Experiment of UAV Photogrammetry Using Optical Axis Optimization Shooting with Airpeak S1 + A7Ⅲ. In Proceedings of the Fall Conference of the Japan Society of Photogrammetry and Remote Sensing, 10–11 November 2022; pp. 41–42. Available online: https://ds.cc.yamaguchi-u.ac.jp/~kanno/pdf/JSPRS_2022_2/proceedings_JSPRS22_C-5.pdf (accessed on 7 June 2025). (In Japanese).
- Truc, T.H.; Ariyo, K.; Yuji, M.; Masahiko, S.; Tsuyoshi, I.; Koichi, Y.; Takaya, H. Robustness of Structure from Motion Accuracy/Precision against the Non-Optimality in Analysis Settings: Case Study in Constant-Pitch Flight Design. Int. J. Autom. Technol. 2024, 18, 621–631. [Google Scholar]
- Nesbit, P.R.; Hugenholtz, C.H. Enhancing UAV-SfM 3D Model Accuracy in High-Relief Landscapes by Incorporating Oblique Images. Remote Sens. 2019, 11, 239. [Google Scholar] [CrossRef]
- Kon, J.; Kanno, A.; Haruna, M.; Fujii, T.; Kurita, K. The Robustness of SfM Settings and Vulnerability to Dome-Shaped Deformation in Four Types of UAV Oblique Photography Methods. In Proceedings of the Annual Conference of the Japan Society of Photogrammetry and Remote Sensing, 18–19 May 2023; pp. 37–38. Available online: https://jglobal.jst.go.jp/detail?JGLOBAL_ID=202302237161111141 (accessed on 7 June 2025). (In Japanese).
- Hartley, R.; Zisserman, A. Multiple View Geometry in Computer Vision, 2nd ed.; Cambridge University Press: Cambridge, UK, 2004; ISBN 9780521540513. [Google Scholar]
- Štroner, M.; Urban, R.; Seidl, J.; Reindl, T.; Brouček, J. Photogrammetry Using UAV-Mounted GNSS RTK: Georeferencing Strategies without GCPs. Remote Sens. 2021, 13, 1336. [Google Scholar] [CrossRef]
- Blender Foundation Blender 2.79 Release Notes. Available online: https://developer.blender.org/docs/release_notes/2.79/ (accessed on 7 June 2025).
- Ahmed, S.; El-Shazly, A.; Abed, F.; Ahmed, W. The Influence of Flight Direction and Camera Orientation on the Quality Products of UAV-Based SfM-Photogrammetry. Appl. Sci. 2022, 12, 10492. [Google Scholar] [CrossRef]
- James, M.R.; Robson, S. Mitigating Systematic Error in Topographic Models Derived from UAV and Ground-Based Image Networks. Earth Surf. Process. Landf. 2014, 39, 1413–1420. [Google Scholar] [CrossRef]
- Dai, W.; Zheng, G.; Antoniazza, G.; Zhao, F.; Chen, K.; Lu, W.; Lane, S.N. Improving UAV-SfM Photogrammetry for Modelling High-relief Terrain: Image Collection Strategies and Ground Control Quantity. Earth Surf. Process. Landf. 2023, 48, 2884–2899. [Google Scholar] [CrossRef]
- DJI Enterprise Phantom 4 RTK. Available online: https://www.dji.com/jp/support/product/phantom-4-rtk (accessed on 19 November 2024).
- Aerosense Inc. Aerobo Marker. Available online: https://aerosense.co.jp/en/products/equipment_systems/ (accessed on 19 November 2024).
- James, M.R.; Chandler, J.H.; Eltner, A.; Fraser, C.; Miller, P.E.; Mills, J.P.; Noble, T.; Robson, S.; Lane, S.N. Guidelines on the Use of Structure-from-Motion Photogrammetry in Geomorphic Research. Earth Surf. Process. Landf. 2019, 44, 2081–2084. [Google Scholar] [CrossRef]
- Kahl, F.; Triggs, B.; Åström, K. Critical Motions for Auto-Calibration When Some Intrinsic Parameters Can Vary. J. Math. Imaging. Vis. 2000, 13, 131–146. [Google Scholar] [CrossRef]
- Ackermann, F.; Schade, H. Application of GPS for Aerial Triangulation. Photogramm. Eng. Remote Sens. 1993, 59, 1625–1632. [Google Scholar]
- Forstner, W. The Reliability of Block Triangulation. Photogramm. Eng. Remote Sens. 1985, 51, 1137–1149. [Google Scholar]
- Iheaturu, C.; Okolie, C.; Ayodele, E.; Stanley, E.A.; Musa, S.; Ifejika Speranza, C.I. A Simplified Structure-from-Motion Photogrammetry Approach for Urban Development Analysis. Remote Sens. Appl. 2022, 28, 100850. [Google Scholar] [CrossRef]


| Parameters | Value |
|---|---|
| Pin hole camera | Linear camera with no distortion |
| Focal length (pixels) | 1824 |
| Image size (pixels) | 2736 × 1824 |
| Flight Design | Description | Strip Interval/Images Interval in One Strip (Meters)/Number of Images | Illustration |
|---|---|---|---|
| CP flight | The camera is tilted at a fixed pitch angle along the flight lines, and when drones fly in the opposing direction, the local convergence is achieved. | 20/20/121 | 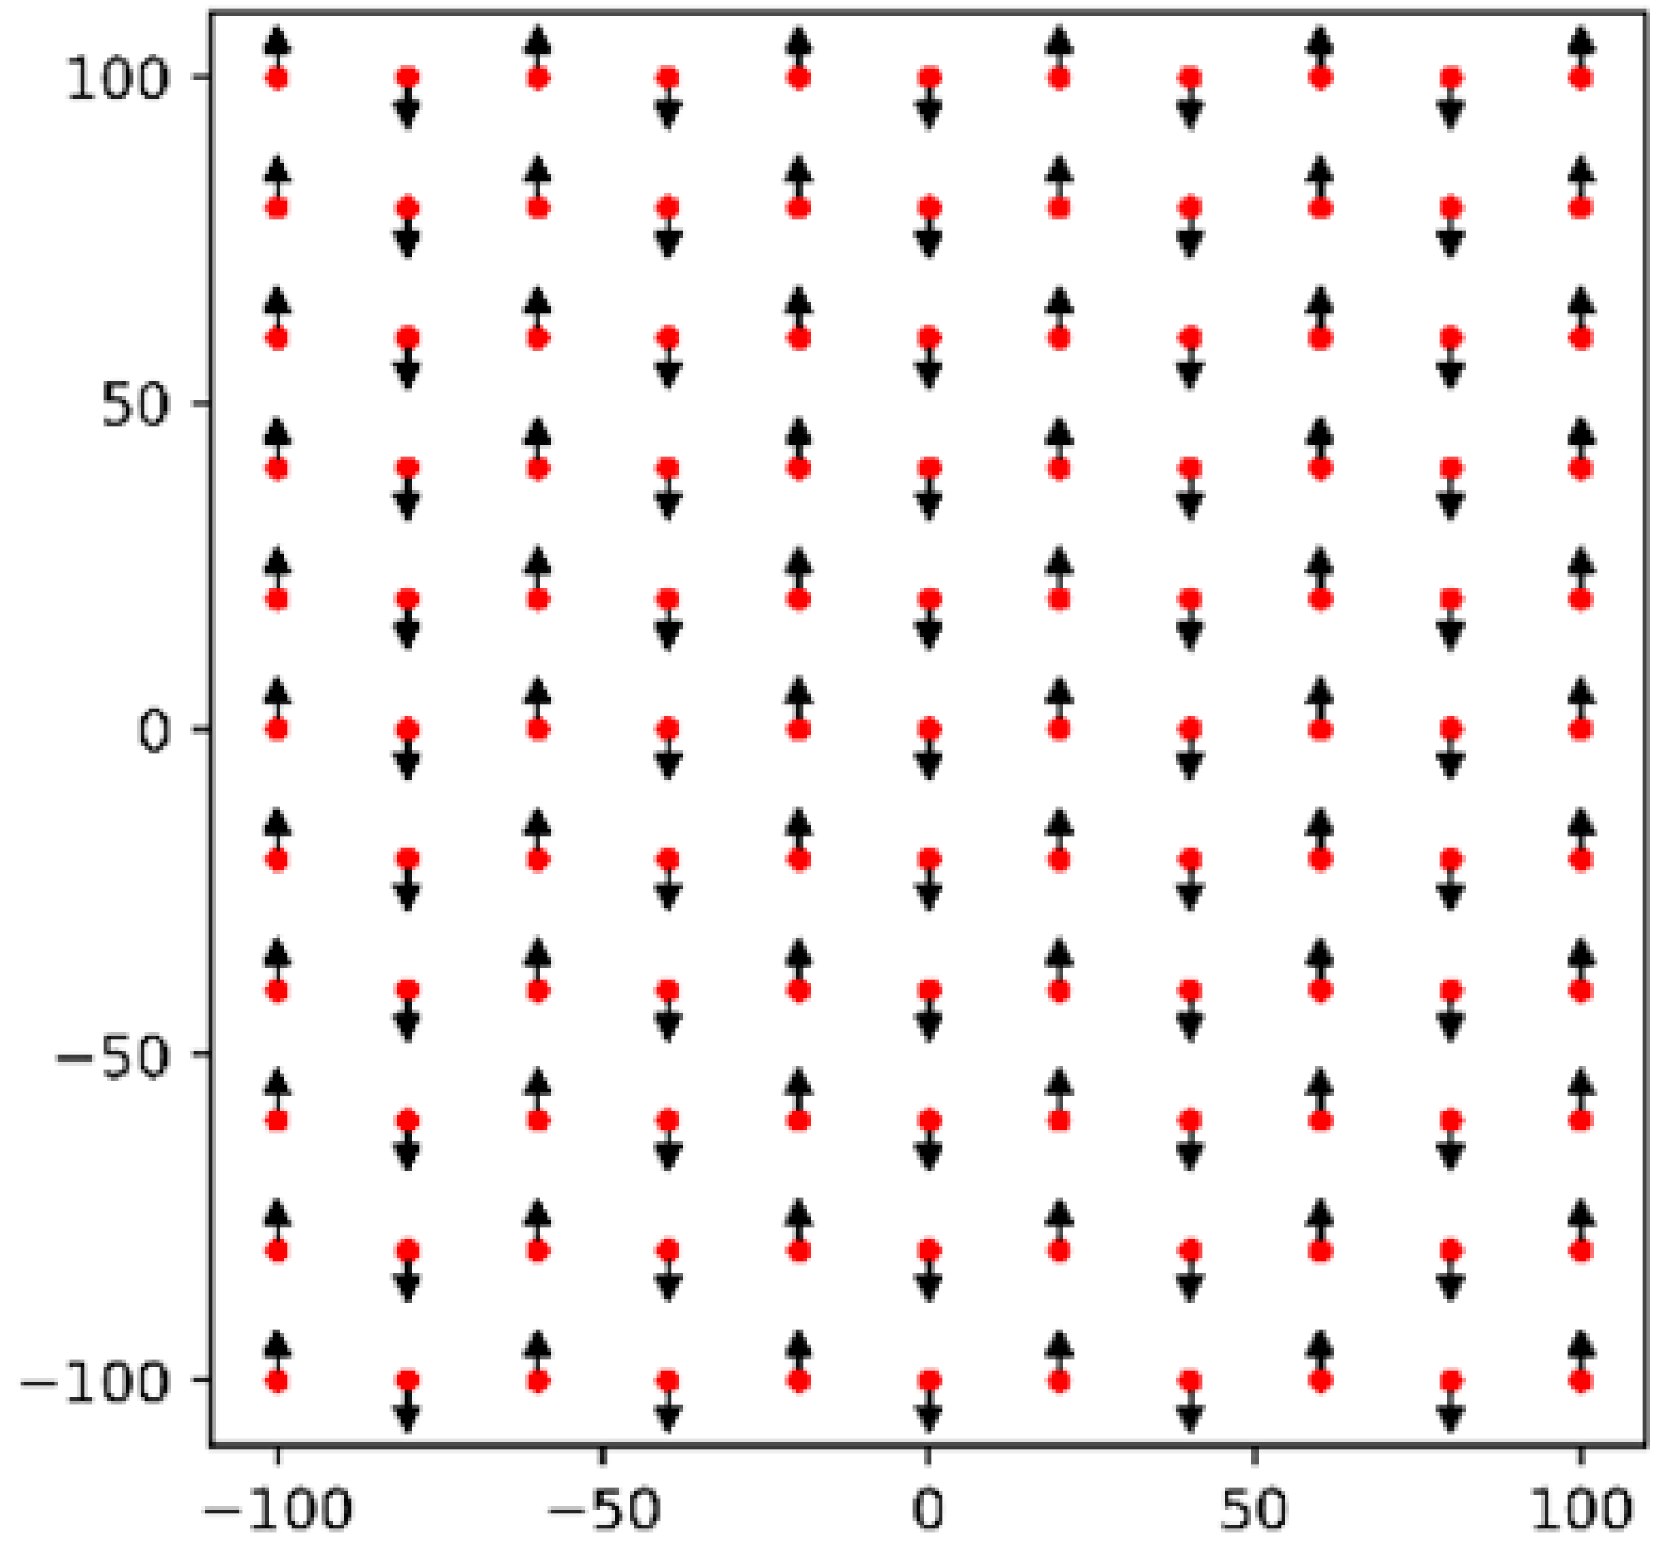 |
| CP flight plus one image in the intermediate strip | Only one image with the same pitch angle was added to the middle of the intermediate strip (strip between two flight lines) of the CP flight. | 20/20/122 | 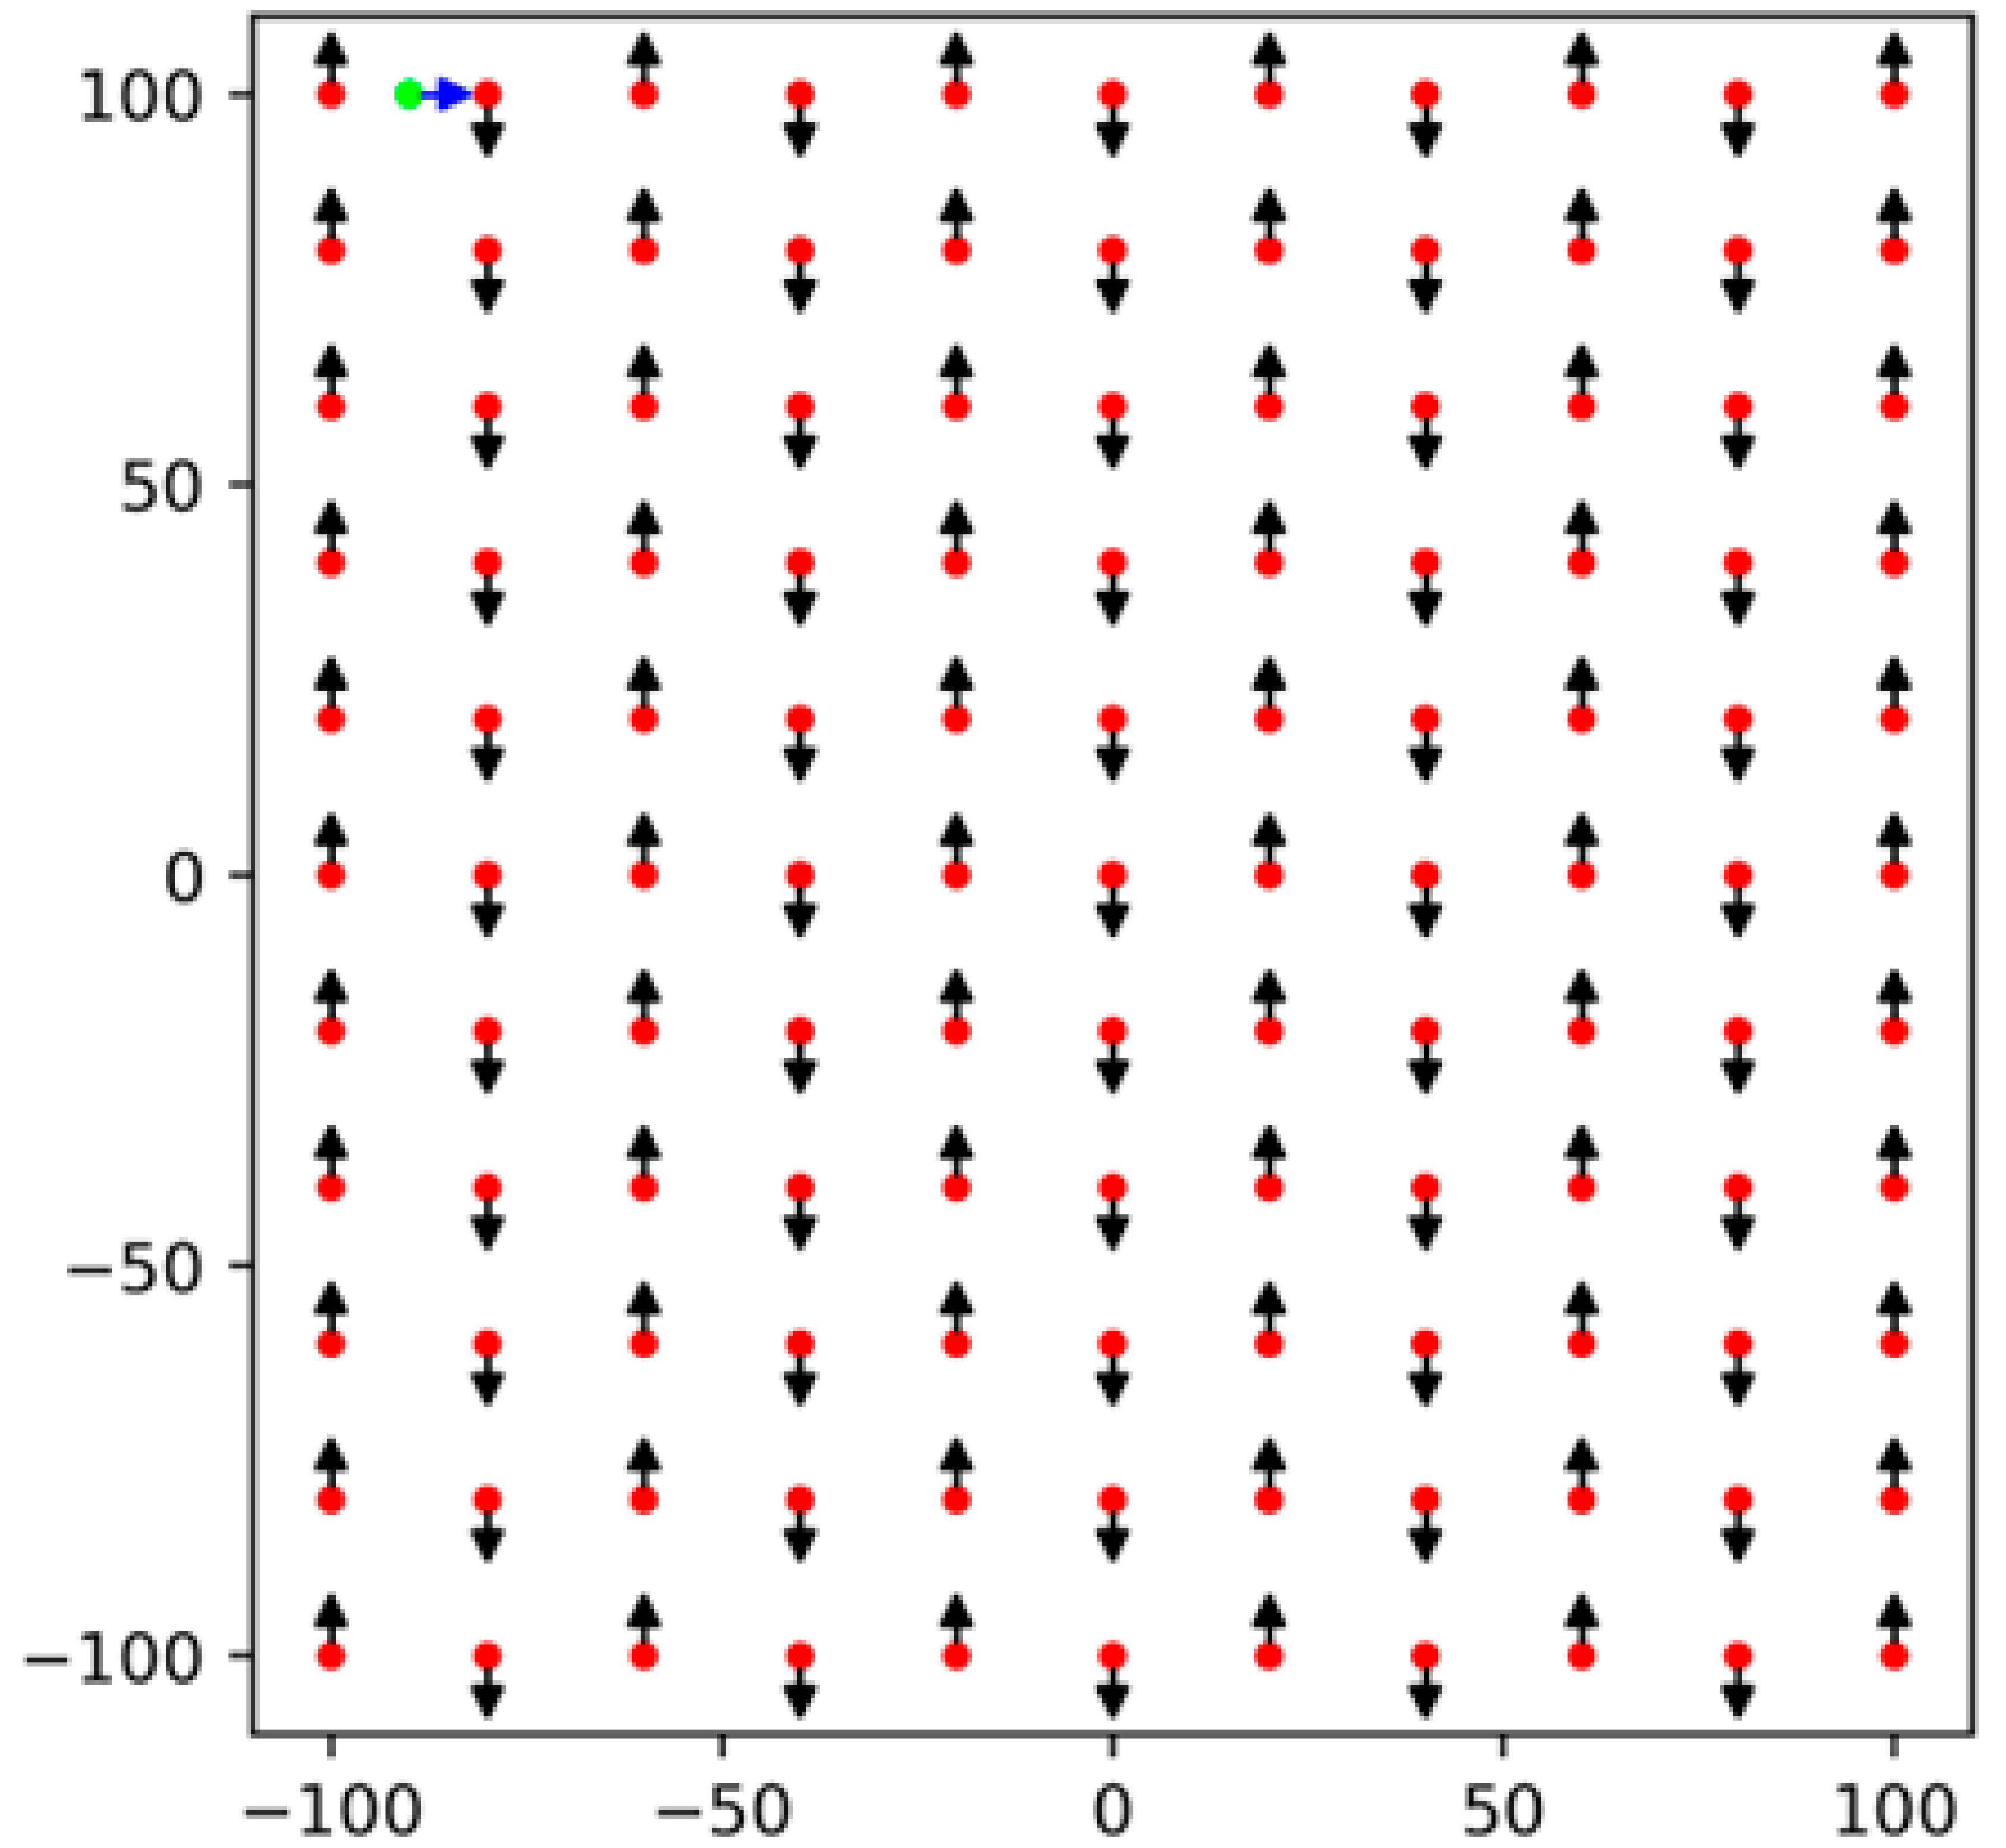 |
| CP flight plus three images randomly placed in the intermediate strip | Three images with the same pitch angle were randomly added to the middle of the intermediate strips of the CP flight. | 20/20/124 | 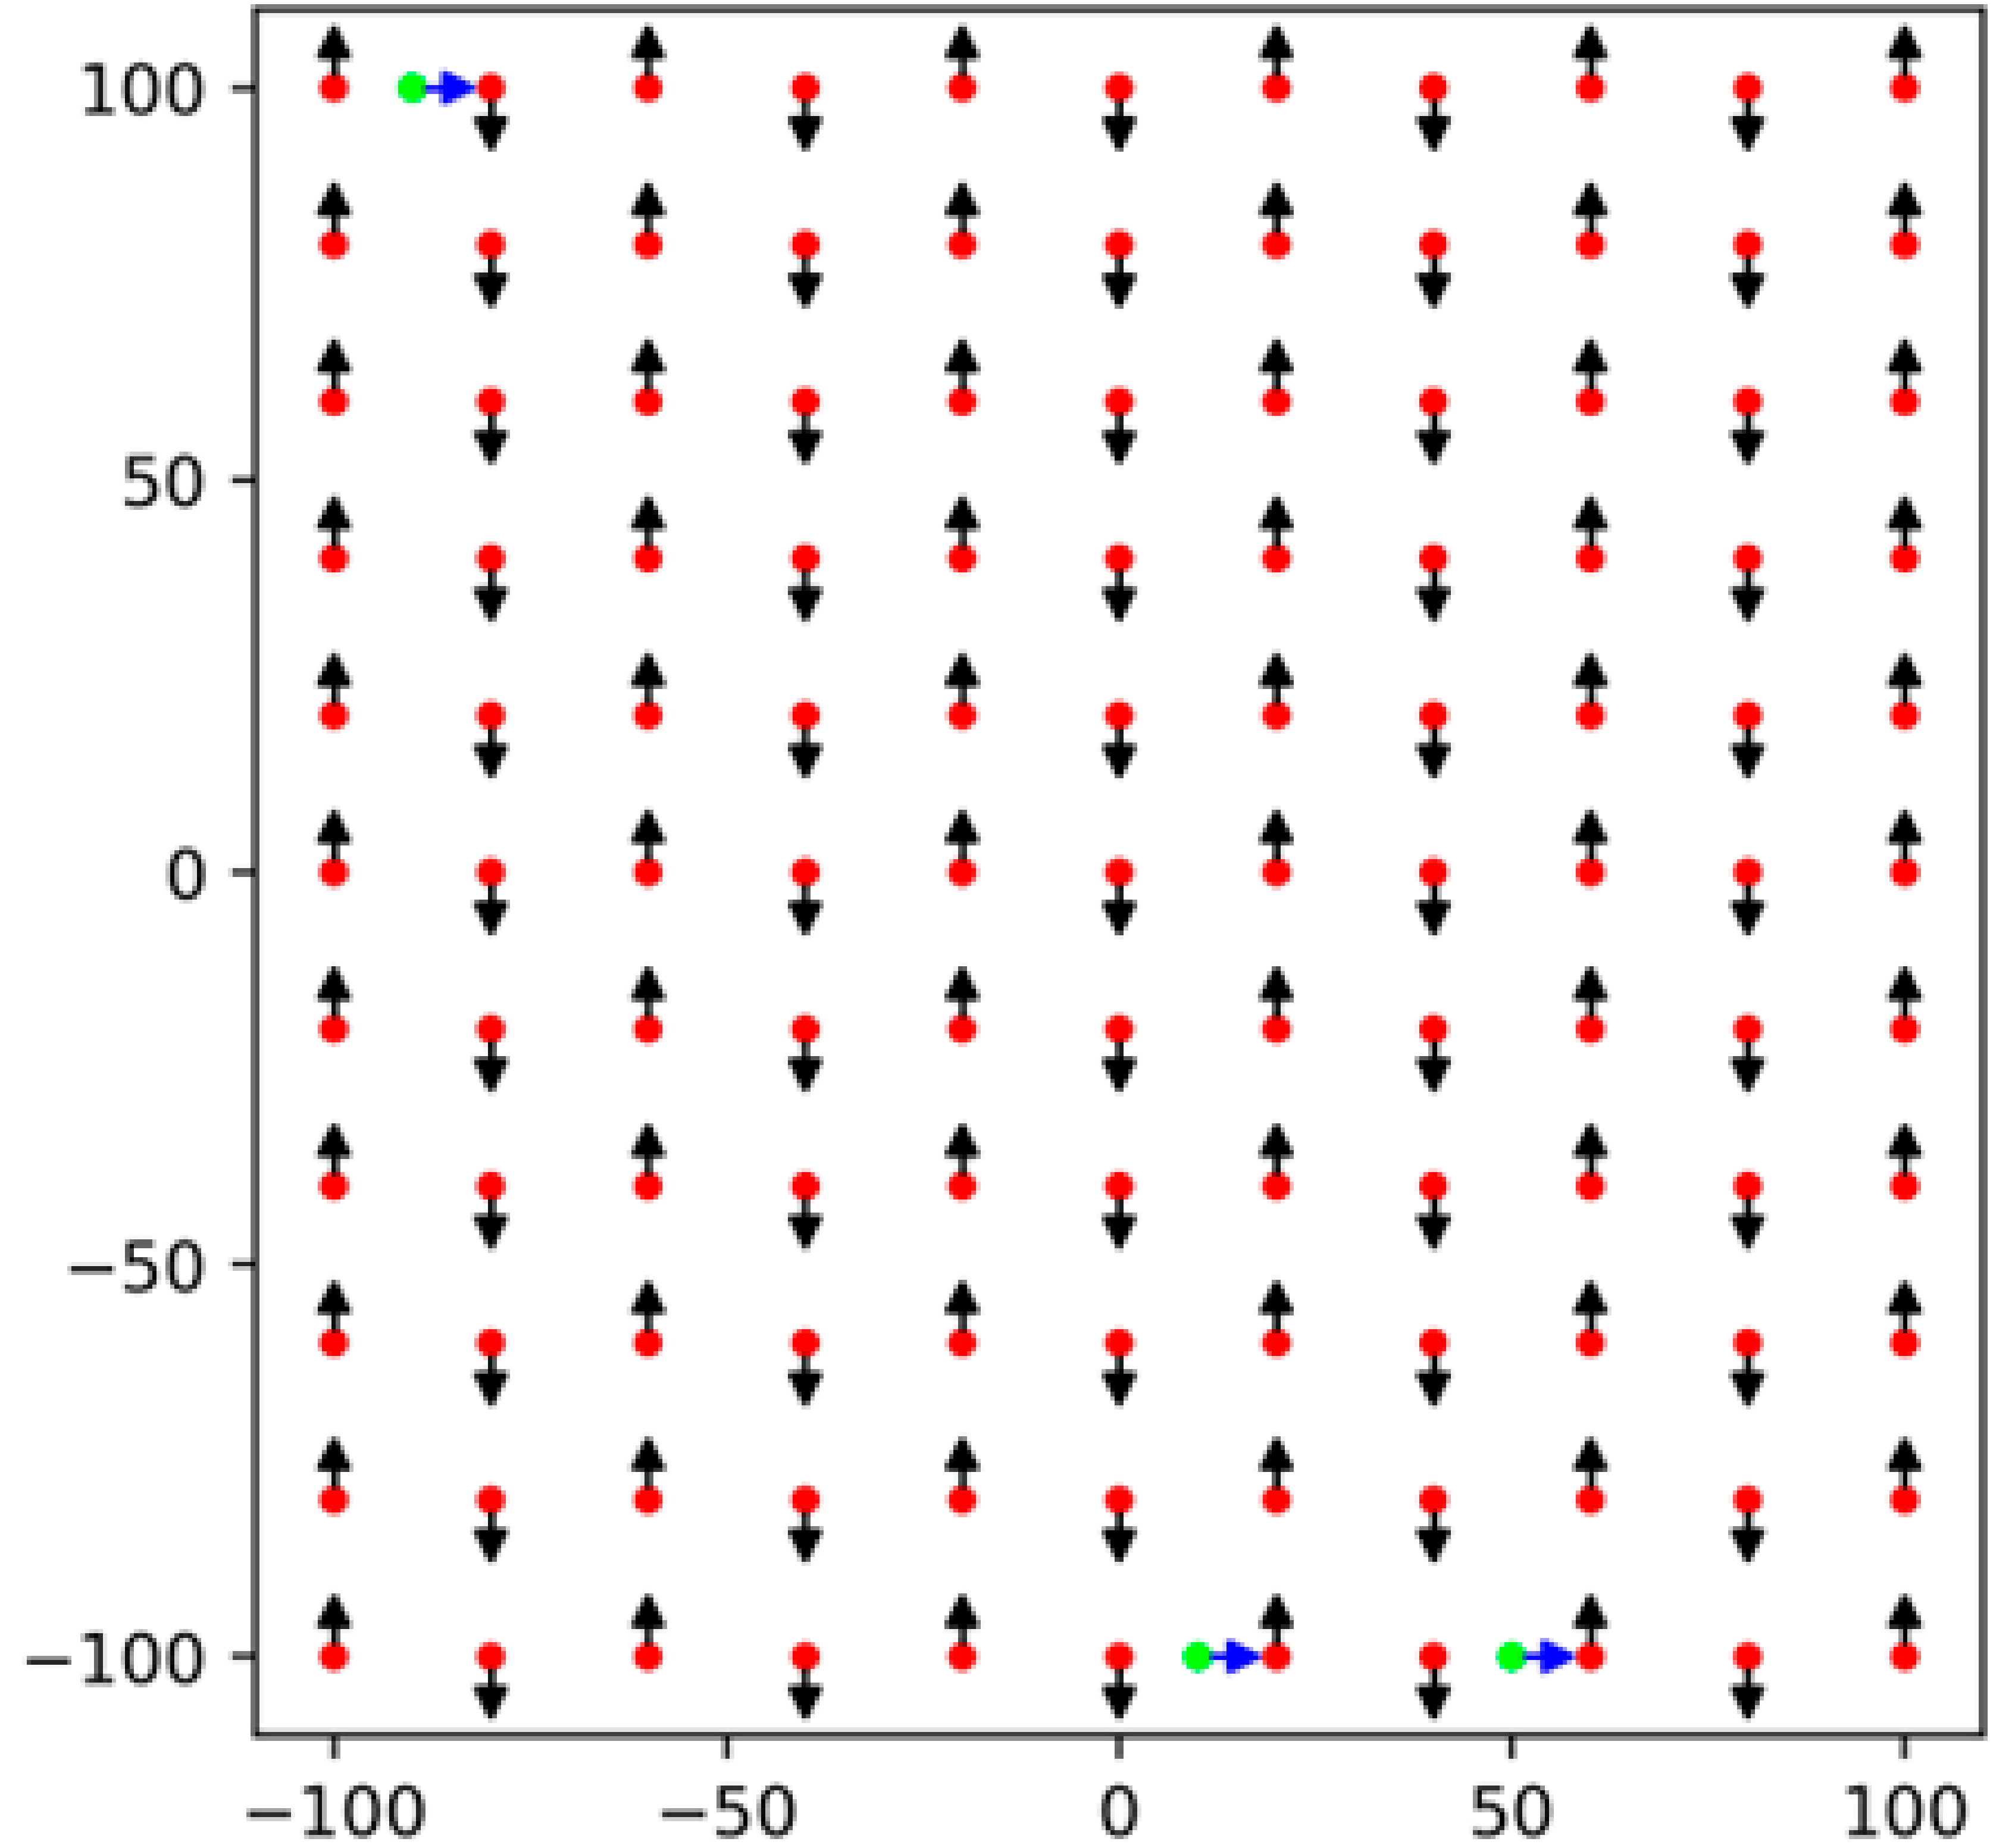 |
| CP-Plus flight | One image with the same pitch angle was added to the middle of each intermediate strip of the CP flight. | 20/20/131 | 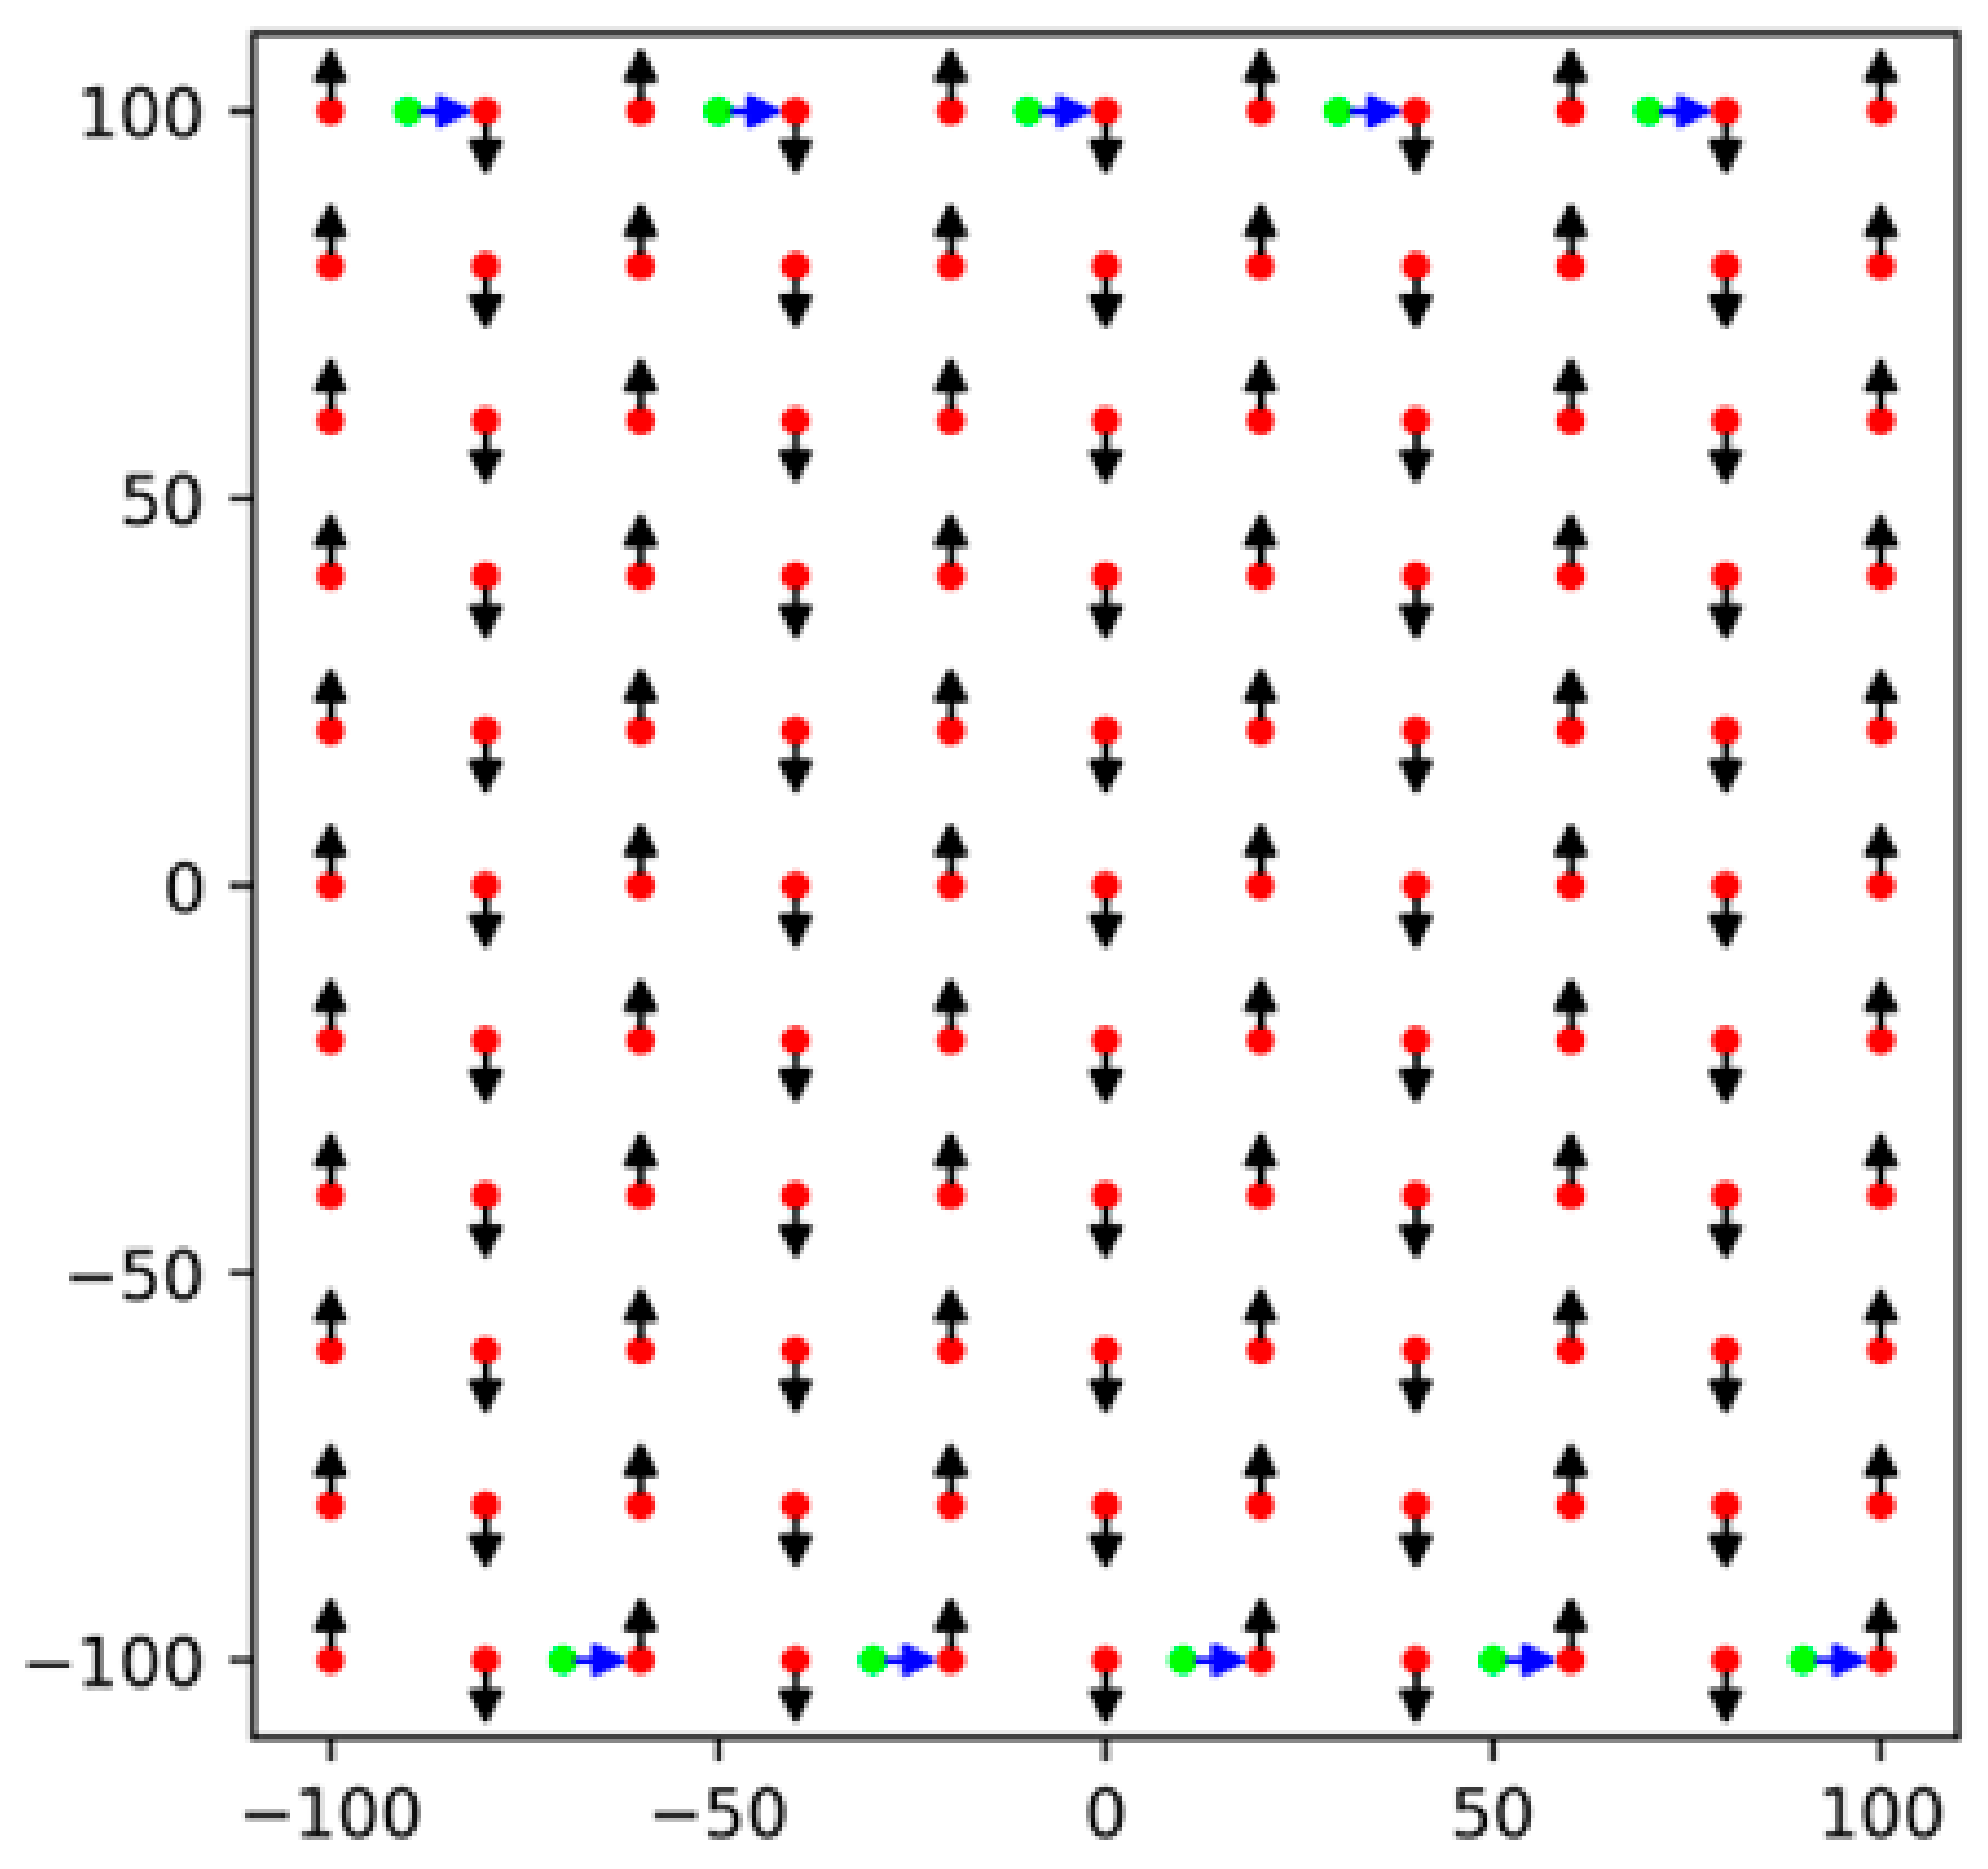 |
| CP random flight | Cameras were randomly placed on the horizontal plane 73 m above the target plane. Each camera was oriented in one of the two orientations appearing in the CP flight. | Random/random/200 |  |
| CP random plus one image in the intermediate strip | Only one image with the same pitch angle was added to the intermediate strip of the CP random flight. | Random/random/201 |  |
| Parameters | Values |
|---|---|
| Input image size | High (original size) (2736 × 1824 pixels) |
| Key point limit | 50,000 |
| Intrinsic parameters estimation | Fixed to true value during BA |
| Shooting Attitude [m] | Shooting Attitude [m] | Overlap Ratio [%] | |
|---|---|---|---|
| CP-Plus Flights | CP Flights | ||
| 73 (GSD20) | 74 | 61 | 80% forward, 60% side lap. |
| 55 (GSD15) | 107 | 91 | |
| 36 (GSD10) | 187 | 163 | |
| Setting Items | Meaning | Setting Values |
|---|---|---|
| Aligned photo accuracy | Set the size of input images (shrinkage ratio) for feature extraction.
| High, medium |
| Key point limit | Set the maximum number of feature points detected in each image. | 1/2, 1/3, 1/4 of the average number of detectable key points for the input images, corresponding to 35,643; 23,762; 17,821 when the size of input images is set as high. 8229; 5486; 4115 when the size of input images is set as medium. |
| Tie point limit | Set the maximum number of tie points to be detected in each image. | 0 It will attempt to detect as many tie points as possible in each image. |
| Optimize camera alignment | Set the intrinsic parameters considered in Brown models. | ① f, cx, cy, k1–k4, p1–p4, b1, b2 ② f, cx, cy, k1–k4, p1–p4 ③ f, cx, cy, k1–k4, p1–p2 ④ f, cx, cy, k1–k3, p1–p4 ⑤ f, cx, cy, k1–k3, p1–p2 |
| 2 × 3 × 5 = 30 analysis settings with 50 trials/setting, equivalent to 1500 trials for each image-set. | ||
| Image Sets | Average of Vertical Error Ratio (%) | |
|---|---|---|
| CP–Plus Flight | CP Flight | |
| GSD10 | 80.65 | 84.09 |
| GSD15 | 80.71 | 97.84 |
| GSD20 | 88.60 | 88.37 |
Disclaimer/Publisher’s Note: The statements, opinions and data contained in all publications are solely those of the individual author(s) and contributor(s) and not of MDPI and/or the editor(s). MDPI and/or the editor(s) disclaim responsibility for any injury to people or property resulting from any ideas, methods, instructions or products referred to in the content. |
© 2025 by the authors. Licensee MDPI, Basel, Switzerland. This article is an open access article distributed under the terms and conditions of the Creative Commons Attribution (CC BY) license (https://creativecommons.org/licenses/by/4.0/).
Share and Cite
Ho, T.T.; Sato, R.; Kanno, A.; Imai, T.; Yamamoto, K.; Higuchi, T. Indeterminacy of Camera Intrinsic Parameters in Structure from Motion Using Images from Constant-Pitch Flight Design. Remote Sens. 2025, 17, 2030. https://doi.org/10.3390/rs17122030
Ho TT, Sato R, Kanno A, Imai T, Yamamoto K, Higuchi T. Indeterminacy of Camera Intrinsic Parameters in Structure from Motion Using Images from Constant-Pitch Flight Design. Remote Sensing. 2025; 17(12):2030. https://doi.org/10.3390/rs17122030
Chicago/Turabian StyleHo, Truc Thanh, Riku Sato, Ariyo Kanno, Tsuyoshi Imai, Koichi Yamamoto, and Takaya Higuchi. 2025. "Indeterminacy of Camera Intrinsic Parameters in Structure from Motion Using Images from Constant-Pitch Flight Design" Remote Sensing 17, no. 12: 2030. https://doi.org/10.3390/rs17122030
APA StyleHo, T. T., Sato, R., Kanno, A., Imai, T., Yamamoto, K., & Higuchi, T. (2025). Indeterminacy of Camera Intrinsic Parameters in Structure from Motion Using Images from Constant-Pitch Flight Design. Remote Sensing, 17(12), 2030. https://doi.org/10.3390/rs17122030