Article

A Holistic Solution for Supporting the Diagnosis of Historic Constructions from 3D Point Clouds

by
Luis Javier Sánchez-Aparicio
1,2,
Rubén Santamaría-Maestro
1,
Pablo Sanz-Honrado
1,3,
Paula Villanueva-Llauradó
4,
Jose Ramón Aira-Zunzunegui
1,* and
Diego González-Aguilera
2
1
Department of Construction and Technology in Architecture (DCTA), Escuela Técnica Superior de Arquitectura de Madrid (ETSAM), Universidad Politécnica de Madrid, Av. Juan de Herrera, 4, 28040 Madrid, Spain
2
Department of Cartographic and Land Engineering, Escuela Politécnica Superior de Ávila, Universidad de Salamanca, Hornos Caleros, 50, 05003 Ávila, Spain
3
Institute of Physical and Information Technologies Leonardo Torres Quevedo (ITEFI), CSIC, C/Serrano 144, 28006 Madrid, Spain
4
Department of Building Structures and Physics, Escuela Técnica Superior de Arquitectura (ETSAM), Universidad Politécnica de Madrid, Avda. Juan de Herrera, 4, 28040 Madrid, Spain
*
Author to whom correspondence should be addressed.
Remote Sens. 2025, 17(12), 2018; https://doi.org/10.3390/rs17122018
Submission received: 23 March 2025 / Revised: 19 May 2025 / Accepted: 6 June 2025 / Published: 11 June 2025
(This article belongs to the Special Issue New Perspectives on 3D Point Cloud (Third Edition))

Abstract

This paper presents Segmentation for Diagnose (Seg4D), a holistic tool for processing 3D point clouds in the field of historical constructions. This tool incorporates state-of-the-art algorithms for the segmentation and analysis of construction systems and damage. Seg4D applies both supervised and unsupervised machine learning and deep learning methods, including the Point Transformer Neural Network for point cloud segmentation. Additionally, it facilitates the extraction of geometrical and statistical features, colour-scale conversion, noise reduction with anisotropic filters and the use of custom scripts for analysing deflections in slabs or out-of-plane movements in arches and vaults, among others. The Seg4D installer and source code are are publicly available in a GitHub repository.

1. Introduction

Over the past few years, several guidelines and documents have been focused on how heritage needs to be preserved. Parts of these documents are led by CH organisations such as the International Centre for the Preservation and Restoration of Cultural Property (ICCROM), UNESCO and the European Commission [1,2]. One of the current references is the Charter of Krakow [3]. It is a key document focused on protecting CH and was developed as part of a broader effort to ensure the preservation and sustainable management of CH sites around the world. This charter emphasises the way in which heritage should be preserved by adopting a multidisciplinary approach. This approach needs to be supported by scientifically proven tests that provide comprehensive knowledge of the building or assets under study.
Among the numerous testing methods available today, 3D point clouds have emerged as an exceptionally relevant and valuable data source, thanks to their ability to precisely and accurately represent the physical world in great detail, while being captured remotely. Consequently, this data source has gained significant attention over the last century, since it is able to represent the current geometry of the scene, the metric dimensions of the elements, as well as their current damage status [4]. Traditionally, this source of information has been used for generating as-built planimetries by means of section and orthoimages or 3D models for HBIM and GIS platforms [5,6]. However, improvements in computer capabilities and artificial intelligence approaches have opened new possibilities within the heritage domain. These strategies allow the exploitation of the geometric and radiometric information contained in these products, enabling the segmentation of 3D point clouds into constructive systems or even detecting damages, as demonstrated by recent systematic reviews [7,8]. Some recent examples of the application of advanced processing methods in 3D point clouds can be found in the works performed by González-Aguilera et al. [9] and Teruggi et al. [10] for constructive segmentation or the works of Del Pozo et al. [11], Sánchez-Aparicio et al. [12] and Valero et al. [13] for damage detection.
From the analysis of the systematic reviews carried out by Yang et al. [7] and Sánchez-Aparicio et al. [8], it is possible to observe that there is no holistic solution that allows the application of these methods in the heritage field. Most of the works tend to use several software solutions (which complicates the standardisation and application of these methods). Among this wide variety of software, the most broadly used is CloudCompare® 2.13. CloudCompare is a general-purpose open-source library for 3D point clouds with an associated GUI. This solution allows a wide variety of operations on the 3D point clouds, such as loading, merging, cropping or even applying common algorithms. However, it cannot include some of the algorithms used in the works previously cited, such as machine (ML) and deep learning (DL) methods for 3D point cloud classification in the heritage field, among others.
On this basis, this paper introduces a new software solution that extends CloudCompare’s capabilities by integrating ML, DL and other algorithms for the proper exploitation of 3D point clouds within the heritage field. This holistic solution has been named Segmentation for Diagnose (Seg4D). Among the different innovations introduced by this solution, the following features are noteworthy:
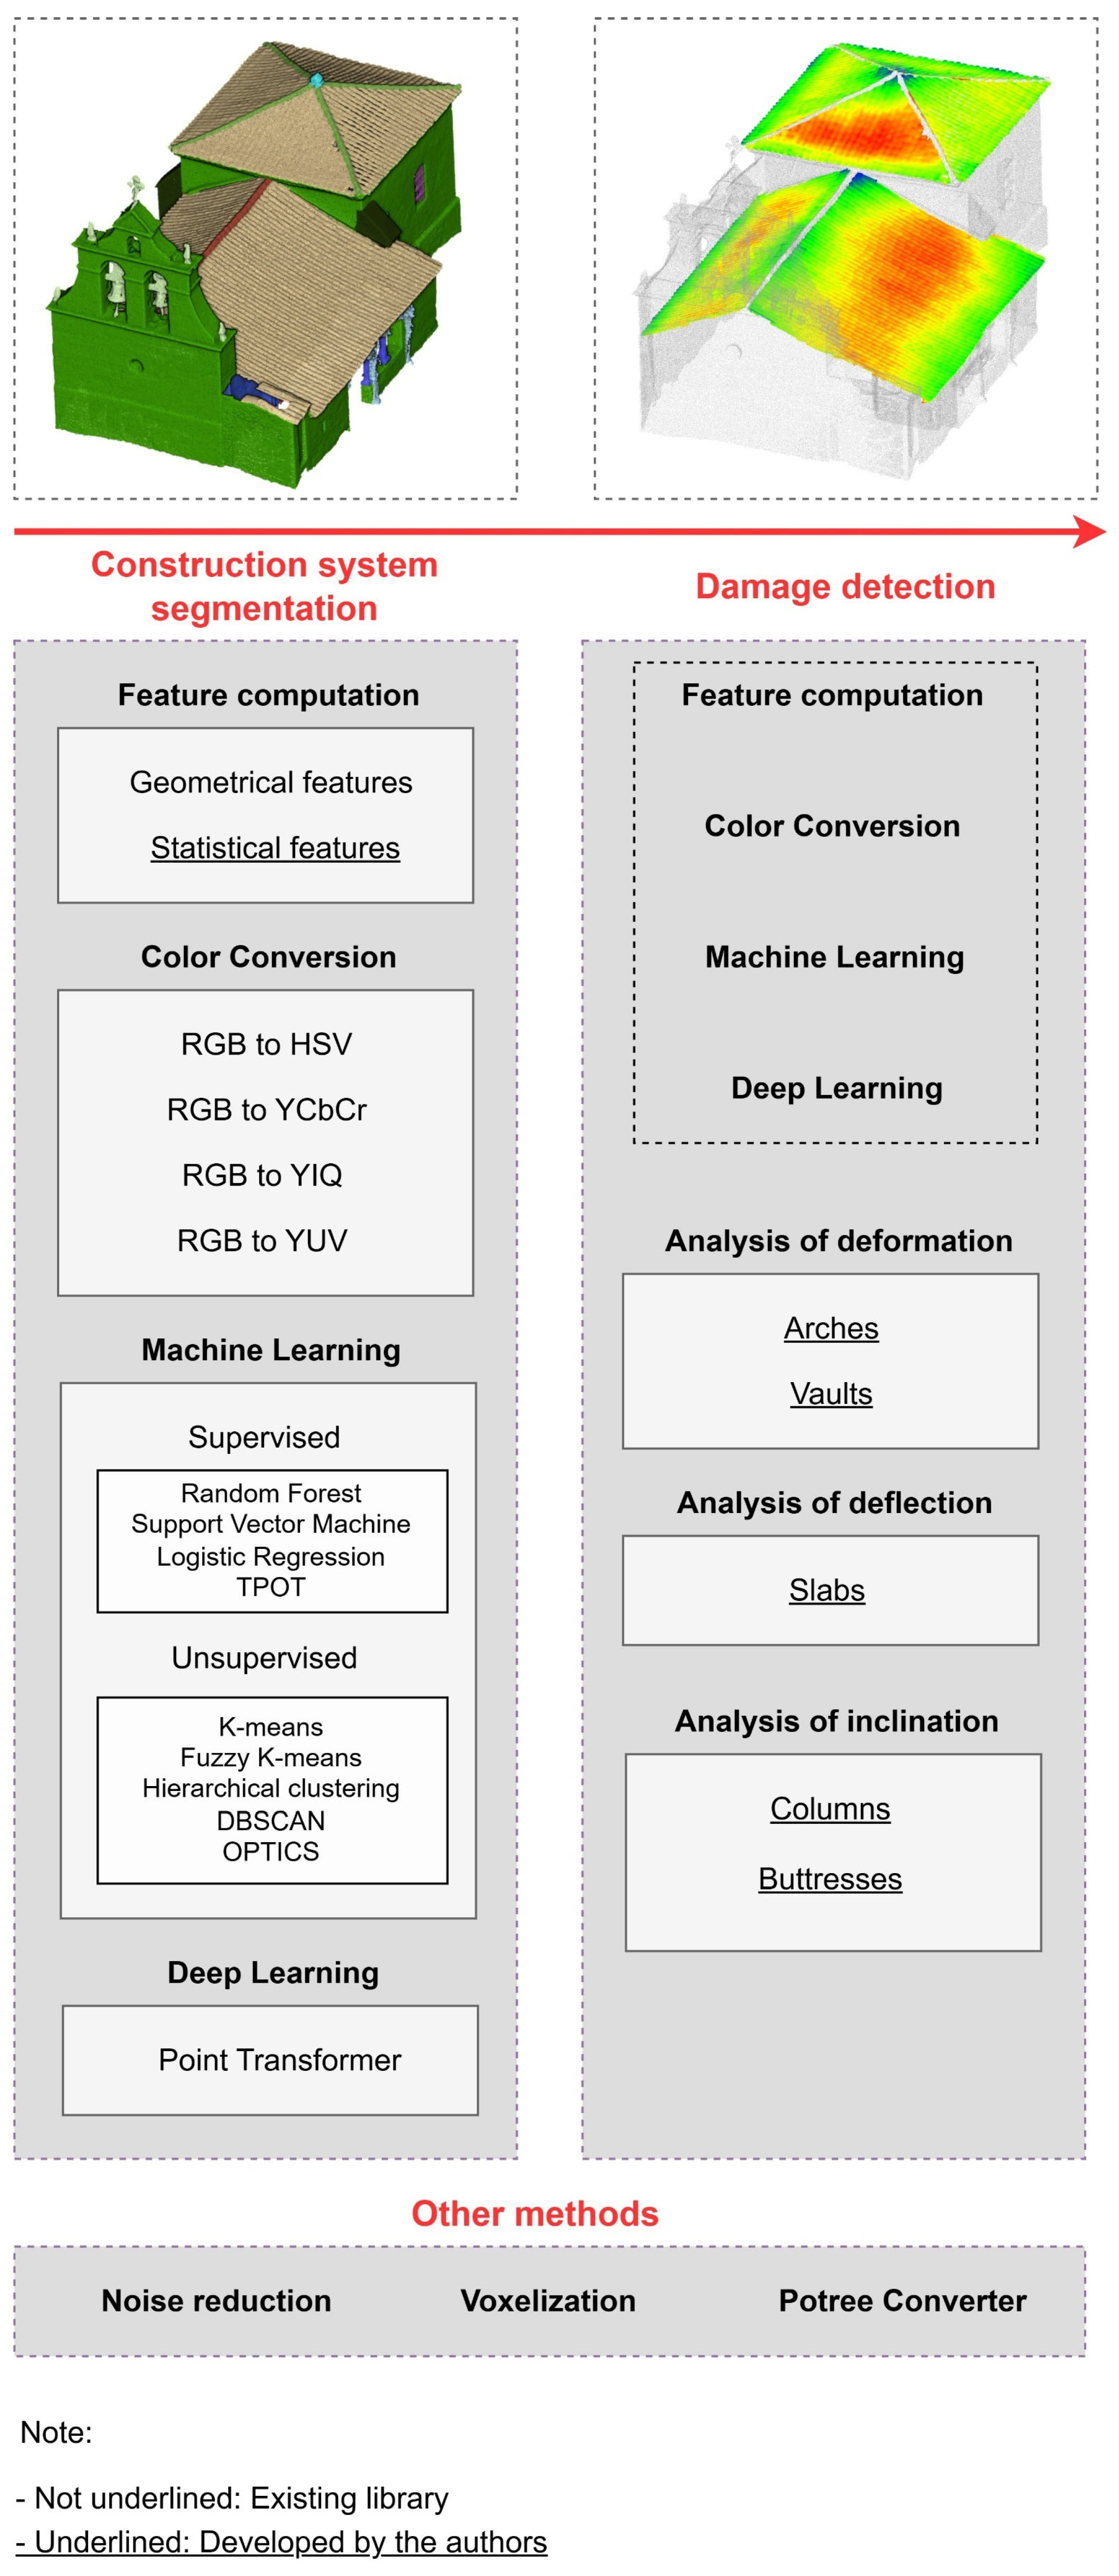
  • The application of both unsupervised and supervised ML methods for constructive system and damage detection.
  • The ability to segment 3D point clouds using a Point Transformer Neural Network (PTNN).
  • The computation of geometric-based and statistics-based features, as well as the capability to compute several colour spaces within the same 3D point cloud.
  • The implementation of algorithms for analysing deflections in beams and slabs, inclinations in columns and out-of-plane deformations in arches and vaults.
  • The integration of a voxel discretisation method, a noise reduction filter and a web-based viewer for large 3D point clouds.
All these new features are included in a unified Graphical User Interface (GUI) within CloudCompare. The GUI is developed for non-expert users, integrating several guides for constructive systems and damage detection based on 3D point clouds. Both guides include the proposal of several classification trees for preparing the 3D point cloud for constructive system identification, as well as a unified classification proposal for damage detection. The latter also includes various sheets to help choose the most appropriate strategy depending on the type of damage to be detected.
Accordingly, this paper outlines the main structure and some applications of this holistic solution. Following this introduction, Section 2 presents the background of this publication regarding the use of approaches for processing 3D point clouds in the heritage field. Section 3 describes the architecture of the solution, as well as the classification proposal for constructive system segmentation and damage detection. Finally, the paper concludes with a section dedicated to the main conclusions and future work.

2. Background

The aim of this section is to provide a summary of key topics, including the information contained in a 3D point cloud and the main approaches for constructive and damage segmentation. This will help contextualise the importance of developing a comprehensive software solution for leveraging 3D point clouds in the heritage field.

2.1. The 3D Point Cloud

A 3D point cloud comprises a set of points in a common 3D coordinate system that accurately represents the surface of an object, including its colour. Primarily, this data source can be obtained using digital cameras with the Structure from Motion (SfM) technique [14] or Light Detection and Ranging (LiDAR) technology [15].
The SfM approach generates a 3D point cloud from a series of images. The resulting 3D point cloud contains an accurate geometry with radiometric values associated with the visible spectrum (red–green–blue), although other types of cameras can be used to capture infrared or ultraviolet data, among others.
On the other hand, LiDAR technology creates a 3D point cloud by periodically emitting and receiving laser beams. Its geometric accuracy is high, and its radiometric values are associated with the reflectance values captured by the sensor and, in some cases, may also incorporate visible data from the projection of images onto the 3D point cloud.
The geometric and radiometric values are highly valuable to CH technicians, as they provide critical information about the current condition of buildings or assets. Regardless of the method used, the 3D point cloud contains noise. This noise can be due to the presence of external objects (such as people or irrelevant areas) or even due to errors attributed to the sensor or method used. The former could be addressed by deleting all those areas without interest. Meanwhile, the latter could be minimised by applying the proper algorithms. In this context, there are several works that deal with the use of noise reduction algorithms to enhance the quality of the 3D point clouds [16,17]. Some of them focus on improving specific 3D point clouds for technical purposes, such as deflection analysis [17].

2.2. Segmentation of Constructive Elements Using 3D Point Clouds

As Yue et al. [18] have highlighted, applying 3D point clouds in the construction sector first requires the reliable recognition of relevant objects. Point cloud segmentation encompasses all procedures aimed at classifying points into meaningful classes (e.g., pillars or vaults).
Recent advances in computer science have yielded highly accurate techniques for segmenting the variety of construction systems found in buildings. These techniques can be grouped into five main categories: (i) edge-based methods [19], (ii) region-growing methods [20], (iii) model-fitting methods [21], (iv) hybrid methods, and (v) machine and deep learning methods [18].
Regardless of the chosen approach, proper post-processing of the 3D point cloud is essential to prepare it for segmentation. Exogenous elements must be removed to minimise mismatches [20,21]. Moreover, ML and DL workflows require carefully curated input datasets: not only must the dataset be representative, but it must also be balanced, which often entails the use of sampling techniques [22]. This makes it usual to train the model with predefined datasets, which in some cases are public [18].
Of these, ML and DL are the most promising, as they leverage the rich features of 3D point clouds to automatically recognise building elements [18]. The recent systematic review conducted by Yang et al. [7] highlights the positive trend of this approach in the CH field, as it provides additional information of great relevance to the study of buildings or assets.
On the one hand, ML methods allow for establishing a relationship between a set of inputs (geometric and radiometric features of the 3D point cloud) and a specific label. This method involves not only the use of the coordinates and radiometry of each point, but also additional features (geometric and radiometric) that establish a relationship between each point and its neighbours. In this context, these methods can be structured in supervised methods (which require an input with features and labels) and unsupervised methods (which require only an input with features and several labels to classify the 3D point cloud) [23]. Supervised methods mostly consist of the use of Support Vector Machine and the Random Forest approach. Meanwhile, unsupervised methods are based on the use of K-means, Fuzzy K-means, DBSCAN clustering and hierarchical approaches. These methods have been applied with success for operational safety [24], progress monitoring [25] or semantic segmentation [26]. In the CH field, both approaches are used in several works for segmenting a building into its constructive elements [9,10,12,27,28,29]. In this case, the most used algorithms are the Random Forest, K-means, Fuzzy K-means and DBSCAN algorithms. However, these works depend on several software solutions [10] (e.g., CloudCompare for feature computation) as well as ad hoc scripts for transforming the colour space (e.g., from RGB to HSV) or applying the segmentation methods [28,29].
Deep learning models learn their own features directly from raw point cloud data, eliminating the need for hand-crafted descriptors. Current architectures fall into four broad families: (i) projection-based methods (i.e., multiview or spherical representations), (ii) discretisation-based methods (i.e., dense or sparse discretisations), (iii) point-based methods (i.e., convolutional, graph, recurrent or multi-layer perceptron networks) and (iv) hybrid methods [18]. Point-based networks dominate 3D research because they act directly on the unordered points and avoid lossy intermediate representations. The breakthrough was the PointNet architecture [30]. A major leap came in 2020 with the Point Transformer Neural Network (PTNN). This network introduced self-attention mechanisms. The latest advance, published by Wu et al. [31], further refines it. These NNs underpin a wide range of construction tasks: (i) recognition of facilities [32], (ii) progress-monitoring pipelines [33] and (iii) semantic segmentation [34]. The latter is the focus of roughly 80% of recent studies in this domain, according to the review by Yue et al. [18]. In the CH field, some studies can be highlighted, such as those performed by Matrone et al. [28] and Pierdicca et al. [35]. In line with the ML methods, the works tend to use CloudCompare as a visualiser and pre-processing and ad hoc scripts in Python 3.10. for performing the classification.

2.3. Damage Detection Based on 3D Point Clouds

Beyond element segmentation, 3D point clouds are increasingly applied to damage assessment, providing a means to detect and quantify defects in three dimensions. These approaches are focused on reducing manual inspections [23]. Current methods fall into three groups: (i) methods that work directly on the 3D point cloud [36,37], (ii) methods that use digital images [38,39] as input and (iii) hybrid methods that combine both approaches [40,41]. The first one makes use of the features contained in the 3D point cloud. The second approach uses digital image processing methods (i.e., edge detection or object detection methods) to extract the damage. Meanwhile, the third approach makes use of the advantages of the second approach (speed and high resolution) to detect the damage and then project it onto the 3D point cloud.
Regardless of the strategy, the raw data—whether 3D point clouds or digital images—must be carefully pre-processed. For point clouds (the focus of this study), the proper removal of exogenous elements (i.e., people or ornamental elements) and the segmentation of the target surface are required since the methodologies are mostly designed to work on specific shapes for damage detection [37,42].
Recently, Sánchez-Aparicio et al. [8] published a systematic review detailing how 3D point clouds are employed to detect damage in cultural-heritage structures. One of the main outputs of this work is a classification tree for structuring the wide variety of approaches that can be applied to 3D point clouds to detect damage. This proposal is structured in two main groups [8]: (i) geometric-based methods and (ii) radiometric-based methods.
Geometric-based methods rely on the use of the geometry of the 3D point cloud as well as the geometrical relations of each point with respect to its neighbourhood. These methods can extract deformations, cracks, features induced by material loss, and detachments [8]. To this end, the authors use several methods such as the extraction of sections from the 3D point cloud for analysing inclinations, fitting methods to approximate the ideal shape of the element for deformation analysis or the use of ML approaches for extracting areas with material losses [11,12,13]. Sánchez-Aparicio et al. [12] used the CANUPO (CAractérisation de NUages de POints) algorithm—implemented in CloudCompare—to identify areas with significant material losses. Meanwhile, the detection of crusts, biological colonies and moisture required the use of Matlab scripts external to the CloudCompare software. Del Pozo et al. [11] detected damage on a masonry façade by pre-processing a 3D point cloud with CloudCompare and then applying the Fuzzy K-means algorithm via a Matlab script for damage detection. Finally, Valero et al. [13] identified damage on a masonry wall using a similar approach, pre-processing the 3D point cloud with the manufacturing software and using Matlab software to extract several features (colour- and texture-based) and apply an ML classifier.
On the other hand, radiometric-based methods use the radiometric information contained in the 3D point cloud to evaluate the status of the building. This is because some damage can be identified by its colour, its texture or even the reflectance values captured by the sensor, as demonstrated by Del Pozo et al. [11]. In this context, radiometric methods can be used to detect biological colonisation, discolouration and deposits, detachment, cracks and features induced by material loss [8]. Some of these approaches rely on the use of unsupervised and supervised ML methods, mainly based on K-means, Fuzzy K-means and OPTICS (Ordering Points To Identify the Clustering Structure) algorithms for extracting changes in the colour or even shape of the elements (i.e., erosions or detachment) [11,13,43]. These works use CloudCompare as well as external scripts in Matlab to detect the damage.

3. Materials and Methods

Seg4D is a holistic solution that facilitates the use of different advanced algorithms for processing 3D point clouds within the heritage field. This solution has been built upon two main libraries.
The first one is a well-known set of libraries (https://github.com/CloudCompare/CloudCompare (accessed on 1 March 2025)) devoted to 3D point clouds. It has been programmed in C++, and its release is offered as stand-alone software (https://www.danielgm.net/cc/ (accessed on 1 March 2025). One of the outstanding features of this library is its ability to load multiple point cloud file formats, enabling users to work with a wide variety of datasets generated by laser scanning or photogrammetry. Additionally, it provides pre-processing tools for cleaning and preparing data prior to conducting more advanced analysis. Among the possibilities that the latter property offers, the following algorithms stand out:
  • CANUPO [44]: This algorithm is a binary classifier that segments a 3D point cloud into two classes by using the dimensionality of the 3D point cloud at different scales. In heritage constructions, this method is useful for segmenting different types of damage or construction systems [6,12,44].
  • M3C2 (Multiscale Model-to-Model Cloud Comparison) [45]: This technique estimates discrepancies between two-point clouds using a modified cloud-to-cloud distance calculation that considers the normal vector and local roughness of the point cloud. The algorithm can estimate the uncertainty in the distance calculation and identify significant changes. Thanks to this, it is possible to monitor geometrical changes between different epochs, evaluating material losses or even structural movements, as demonstrated by Costamagna et al. [46] and Dominici et al. [47].
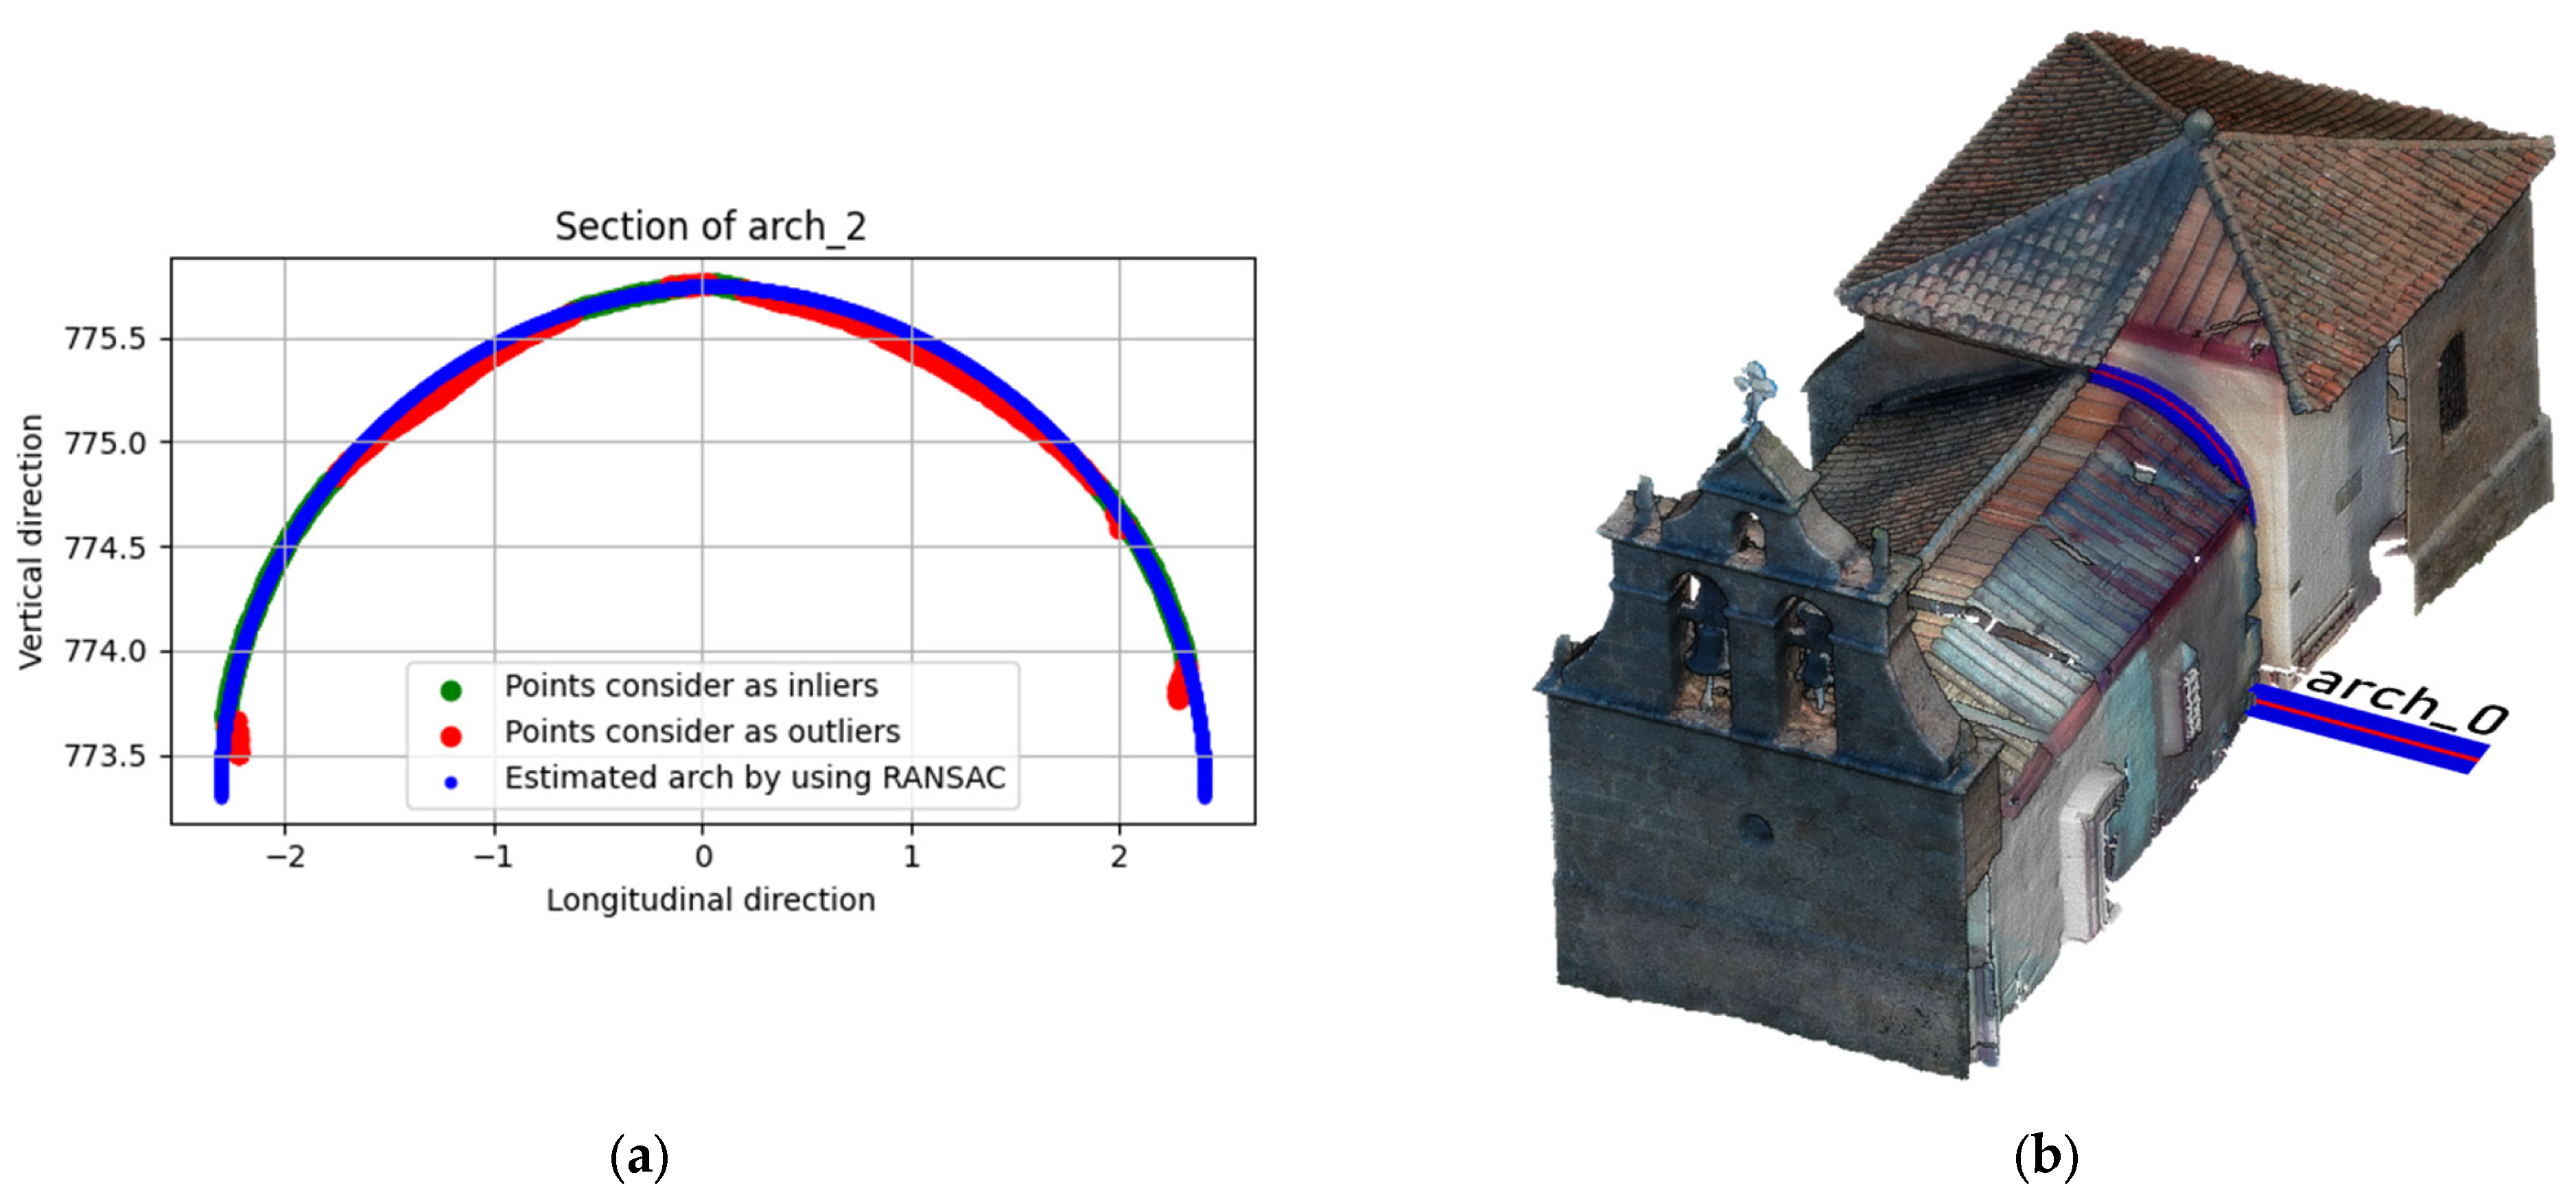
  • RANSAC Shape Detector (Random Sample Consensus Shape Detector): This is a modified version of the well-known RANSAC approach, designed to estimate the best-fit parametric shape (plane, sphere, toroid or cone) from a set of points while dealing with outliers. This method is commonly used in heritage for estimating the inclination of walls [12] or the segmentation of point clouds into constructive systems [48].
The second library is CloudCompare-PythonRuntime®. The source code for CloudCompare-PythonRuntime® is publicly available at the following link: https://github.com/tmontaigu/CloudCompare-PythonRuntime (accessed on 1 March 2025). This is a Python wrapper that allows the execution of Python routines within CloudCompare processes. This plugin offers a comprehensive range of functionalities, including loading and saving point clouds, executing operations such as Merge, Crop2D, and Subsampling, and applying transformations like translation, rotation and scaling. Additionally, it facilitates the manipulation and visualisation of scalar fields. Thus, the plugin represents a valuable tool for integrating CloudCompare libraries with other Python-based workflows, offering a versatile and powerful interface for point cloud processing and analysis.
The integration of both libraries allows the extension of the capability of the well-known software CloudCompare by integrating several advanced methods, including machine and deep learning for the segmentation of 3D point clouds in the field of heritage constructions. Figure 1 summarises the additional functionalities offered by Seg4D in comparison to CloudCompare.
The GUI of the solution is mainly built for non-expert users, including a total of three tabs for different purposes (Figure 2):
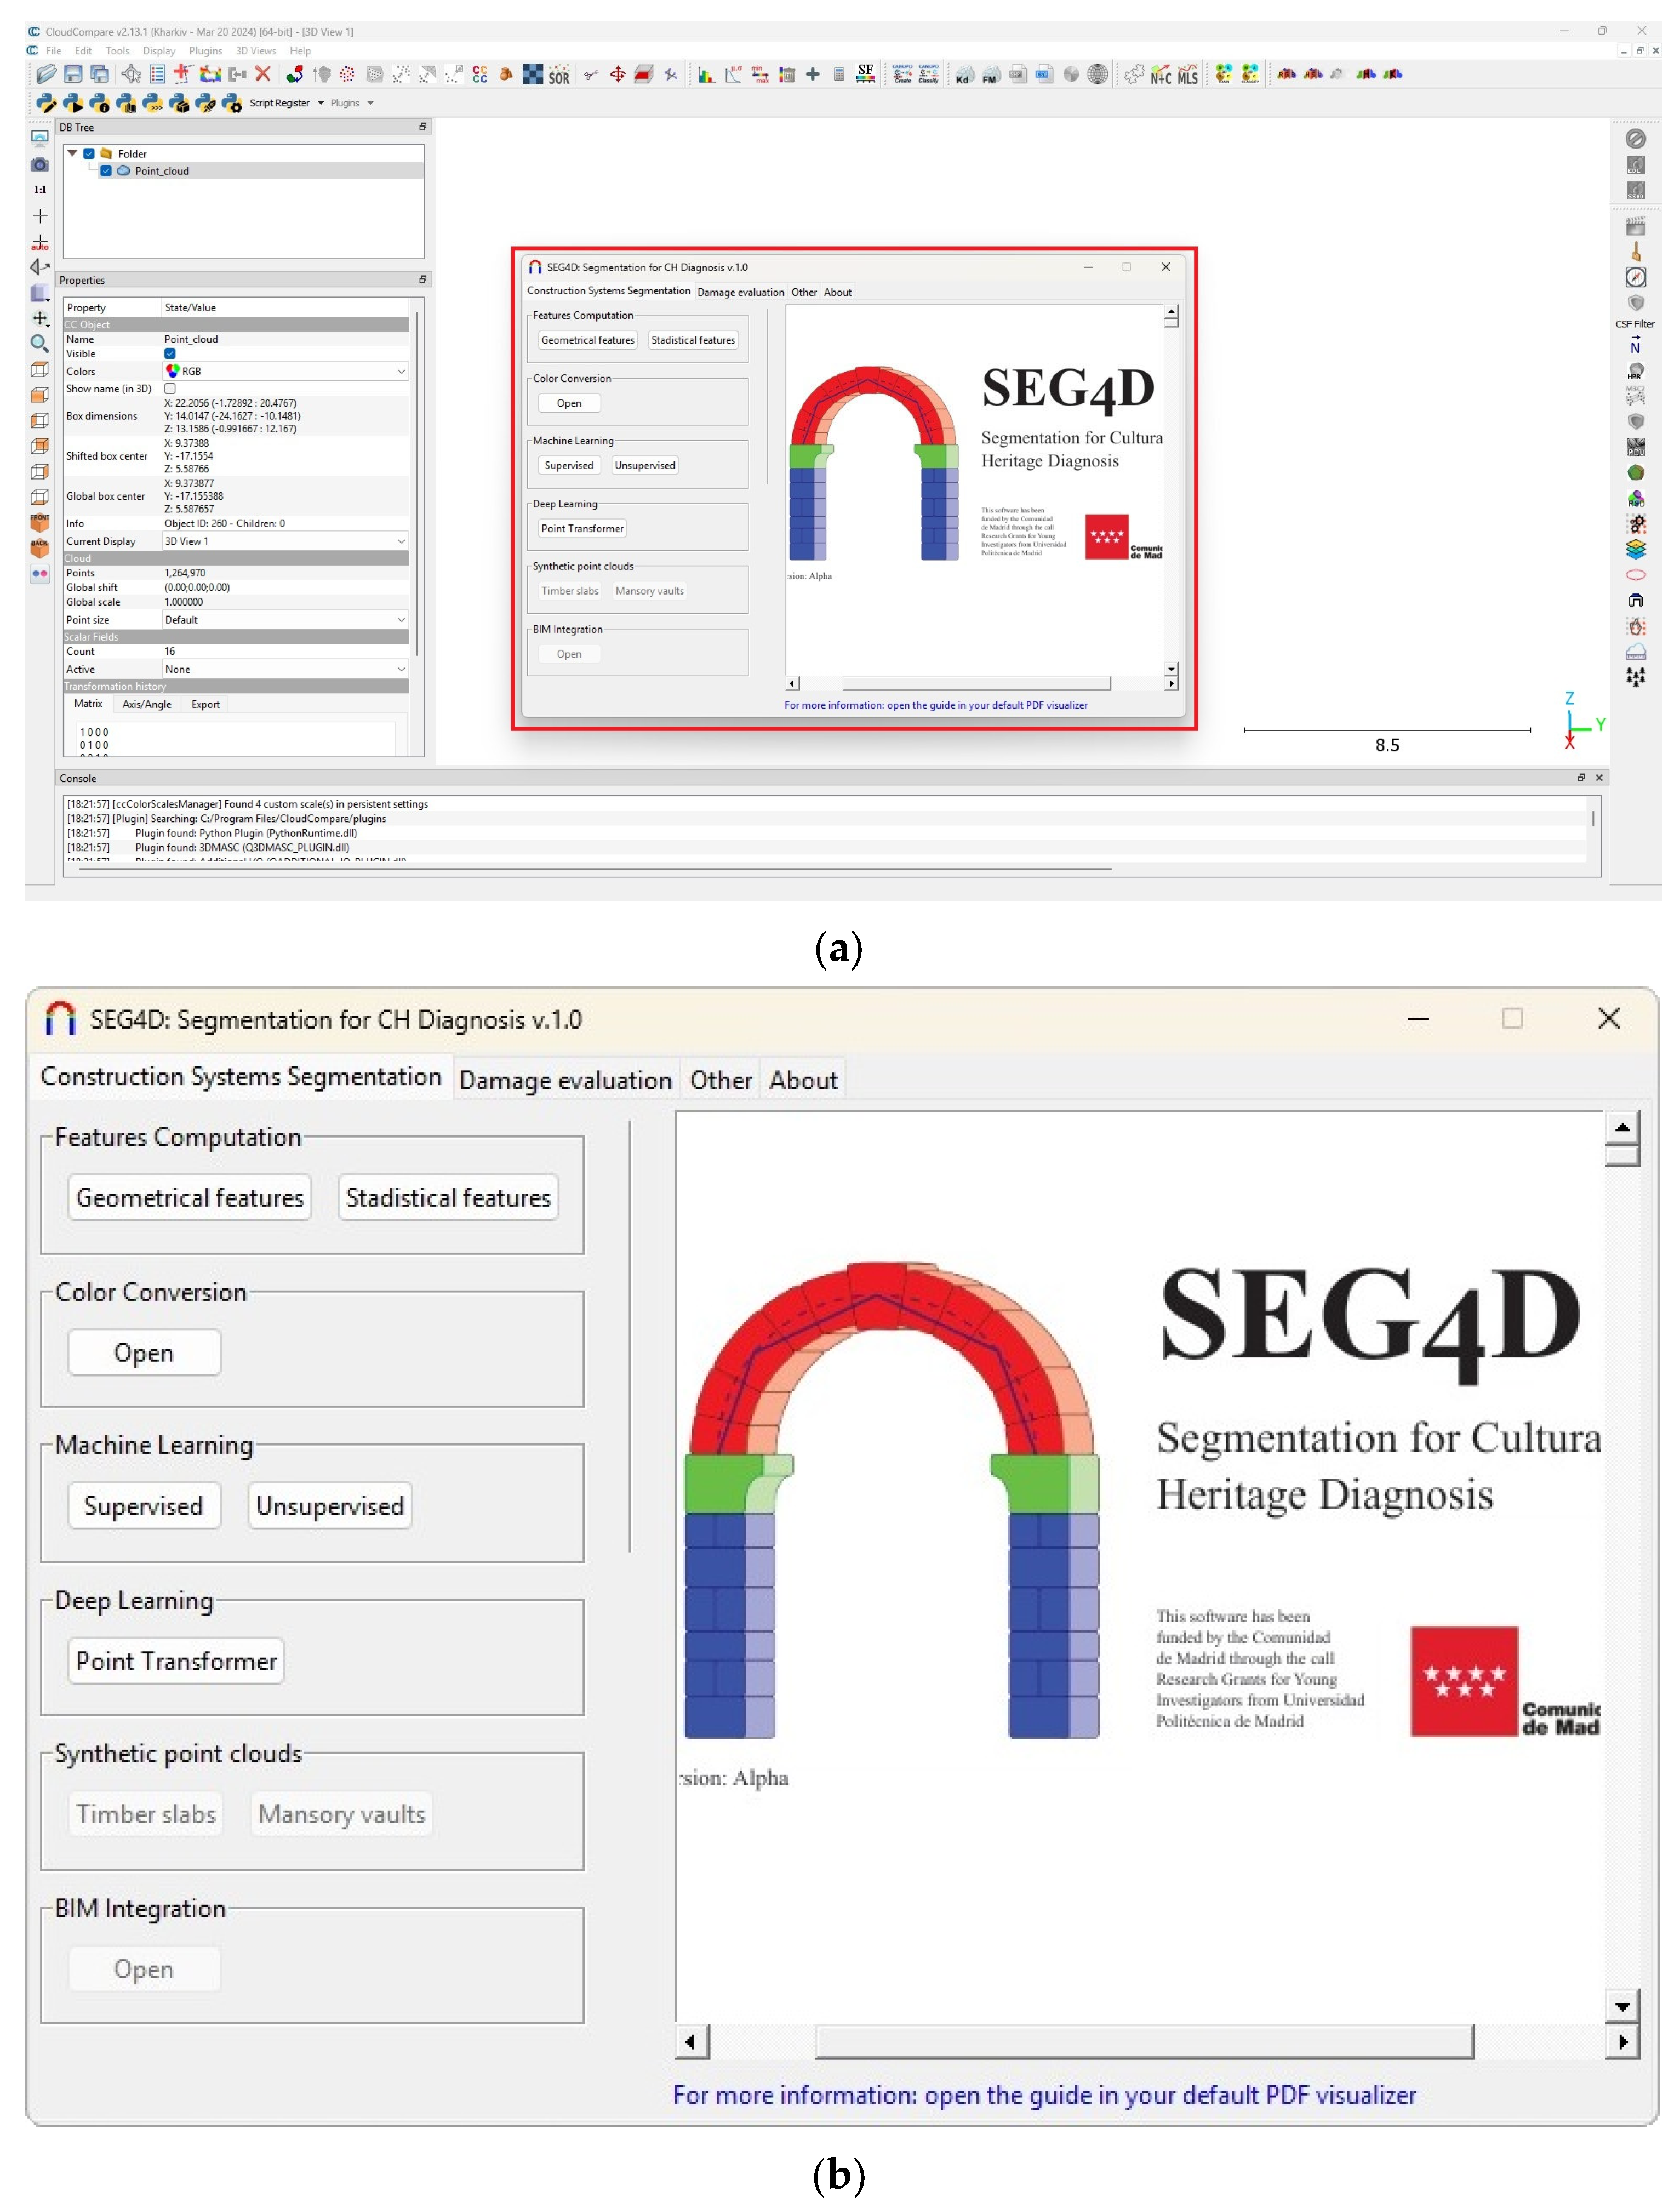
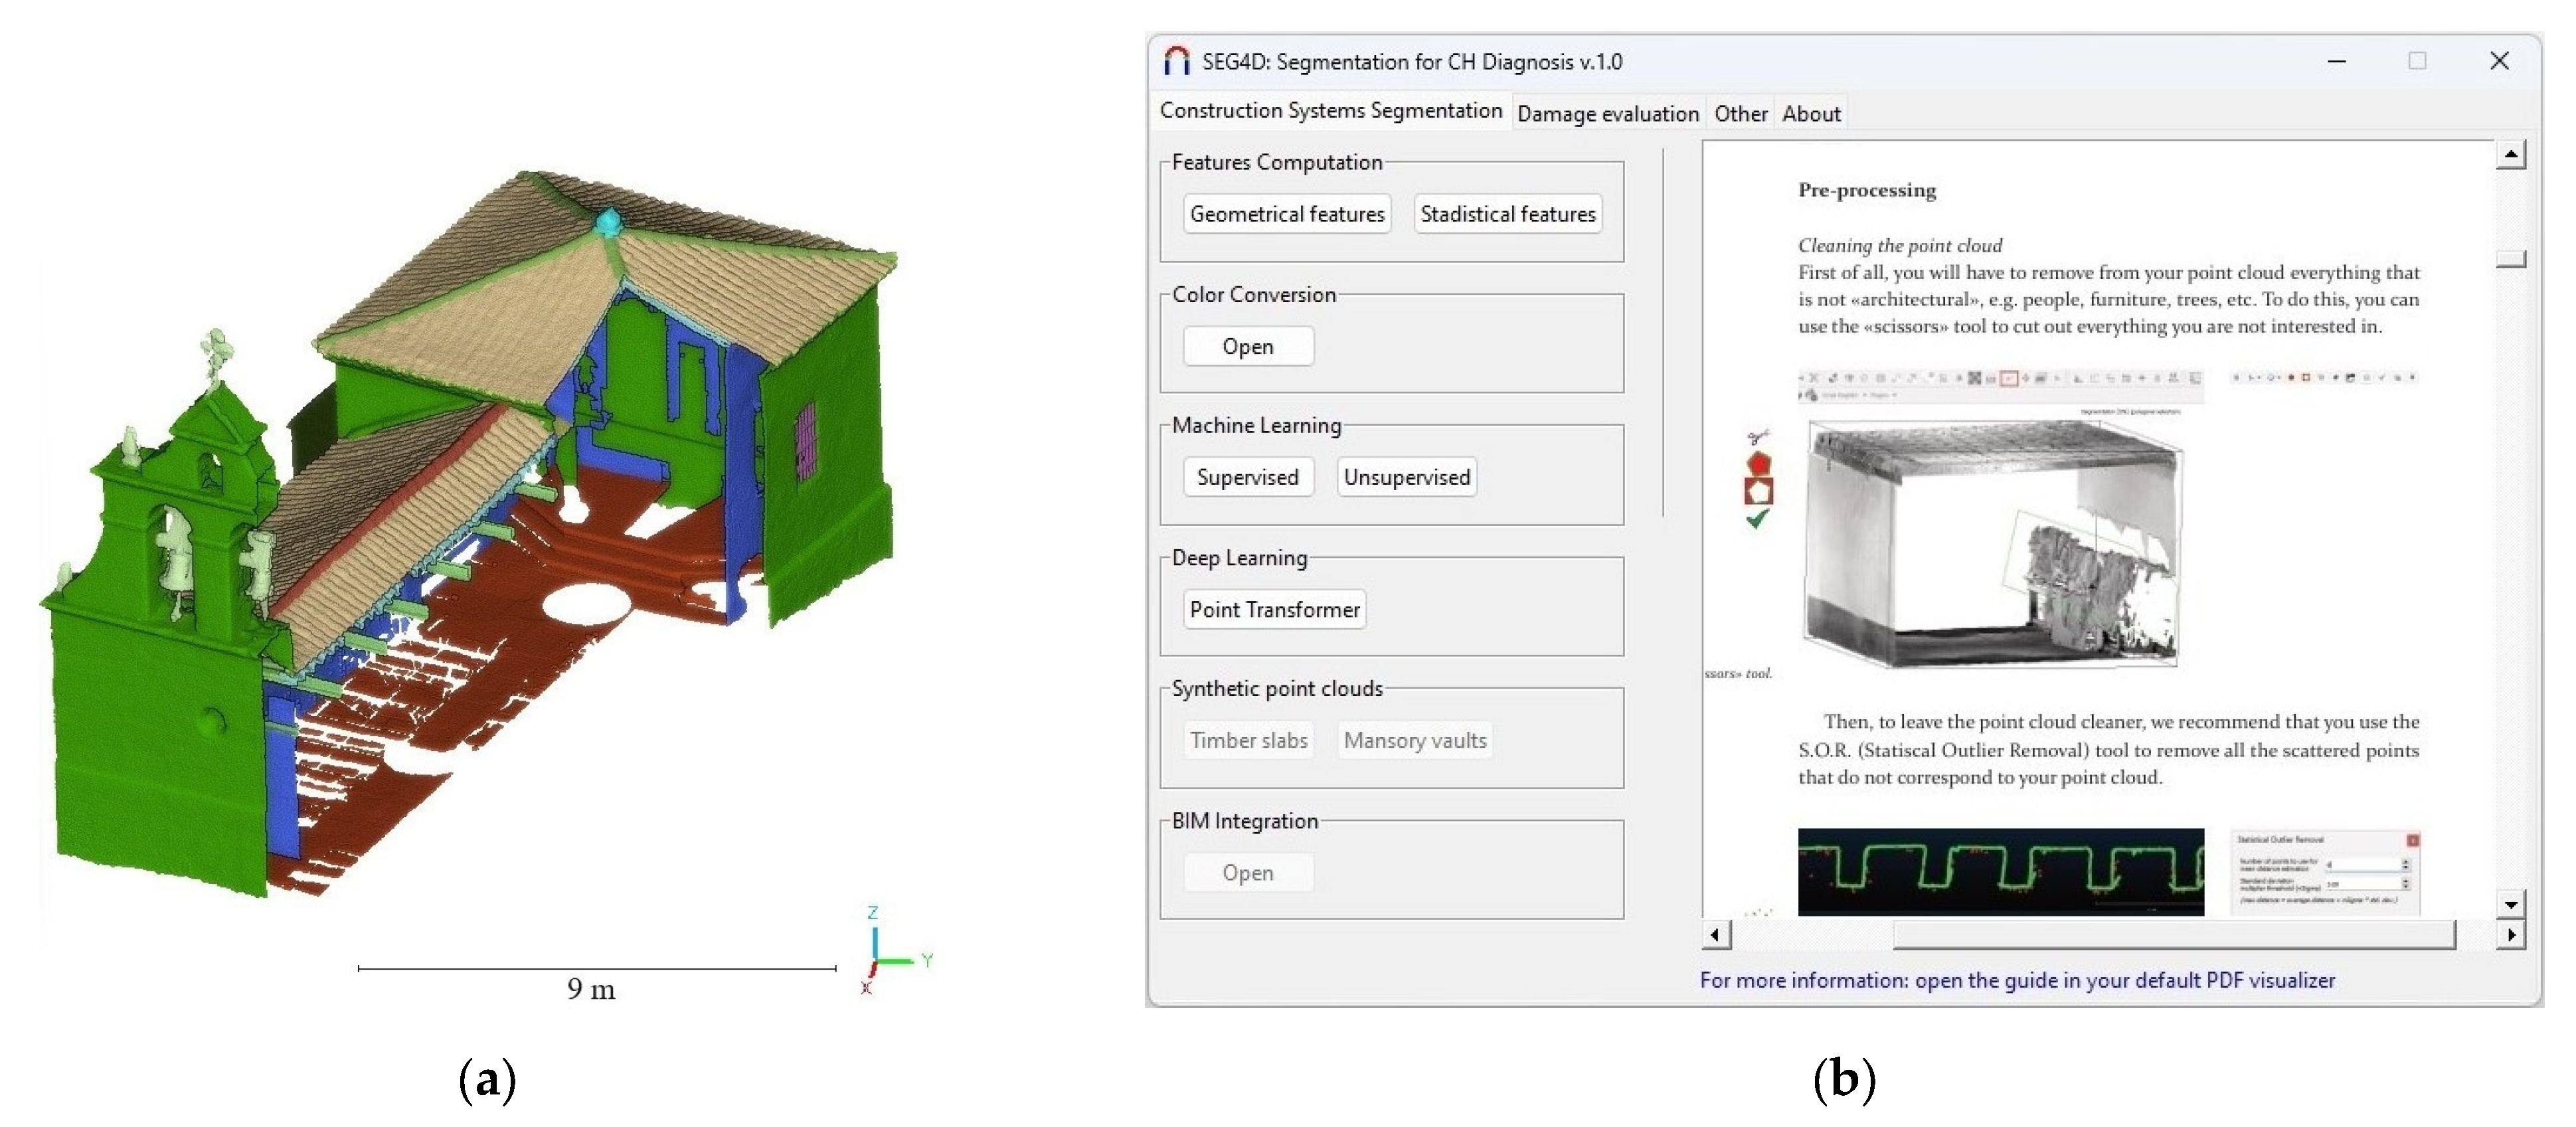
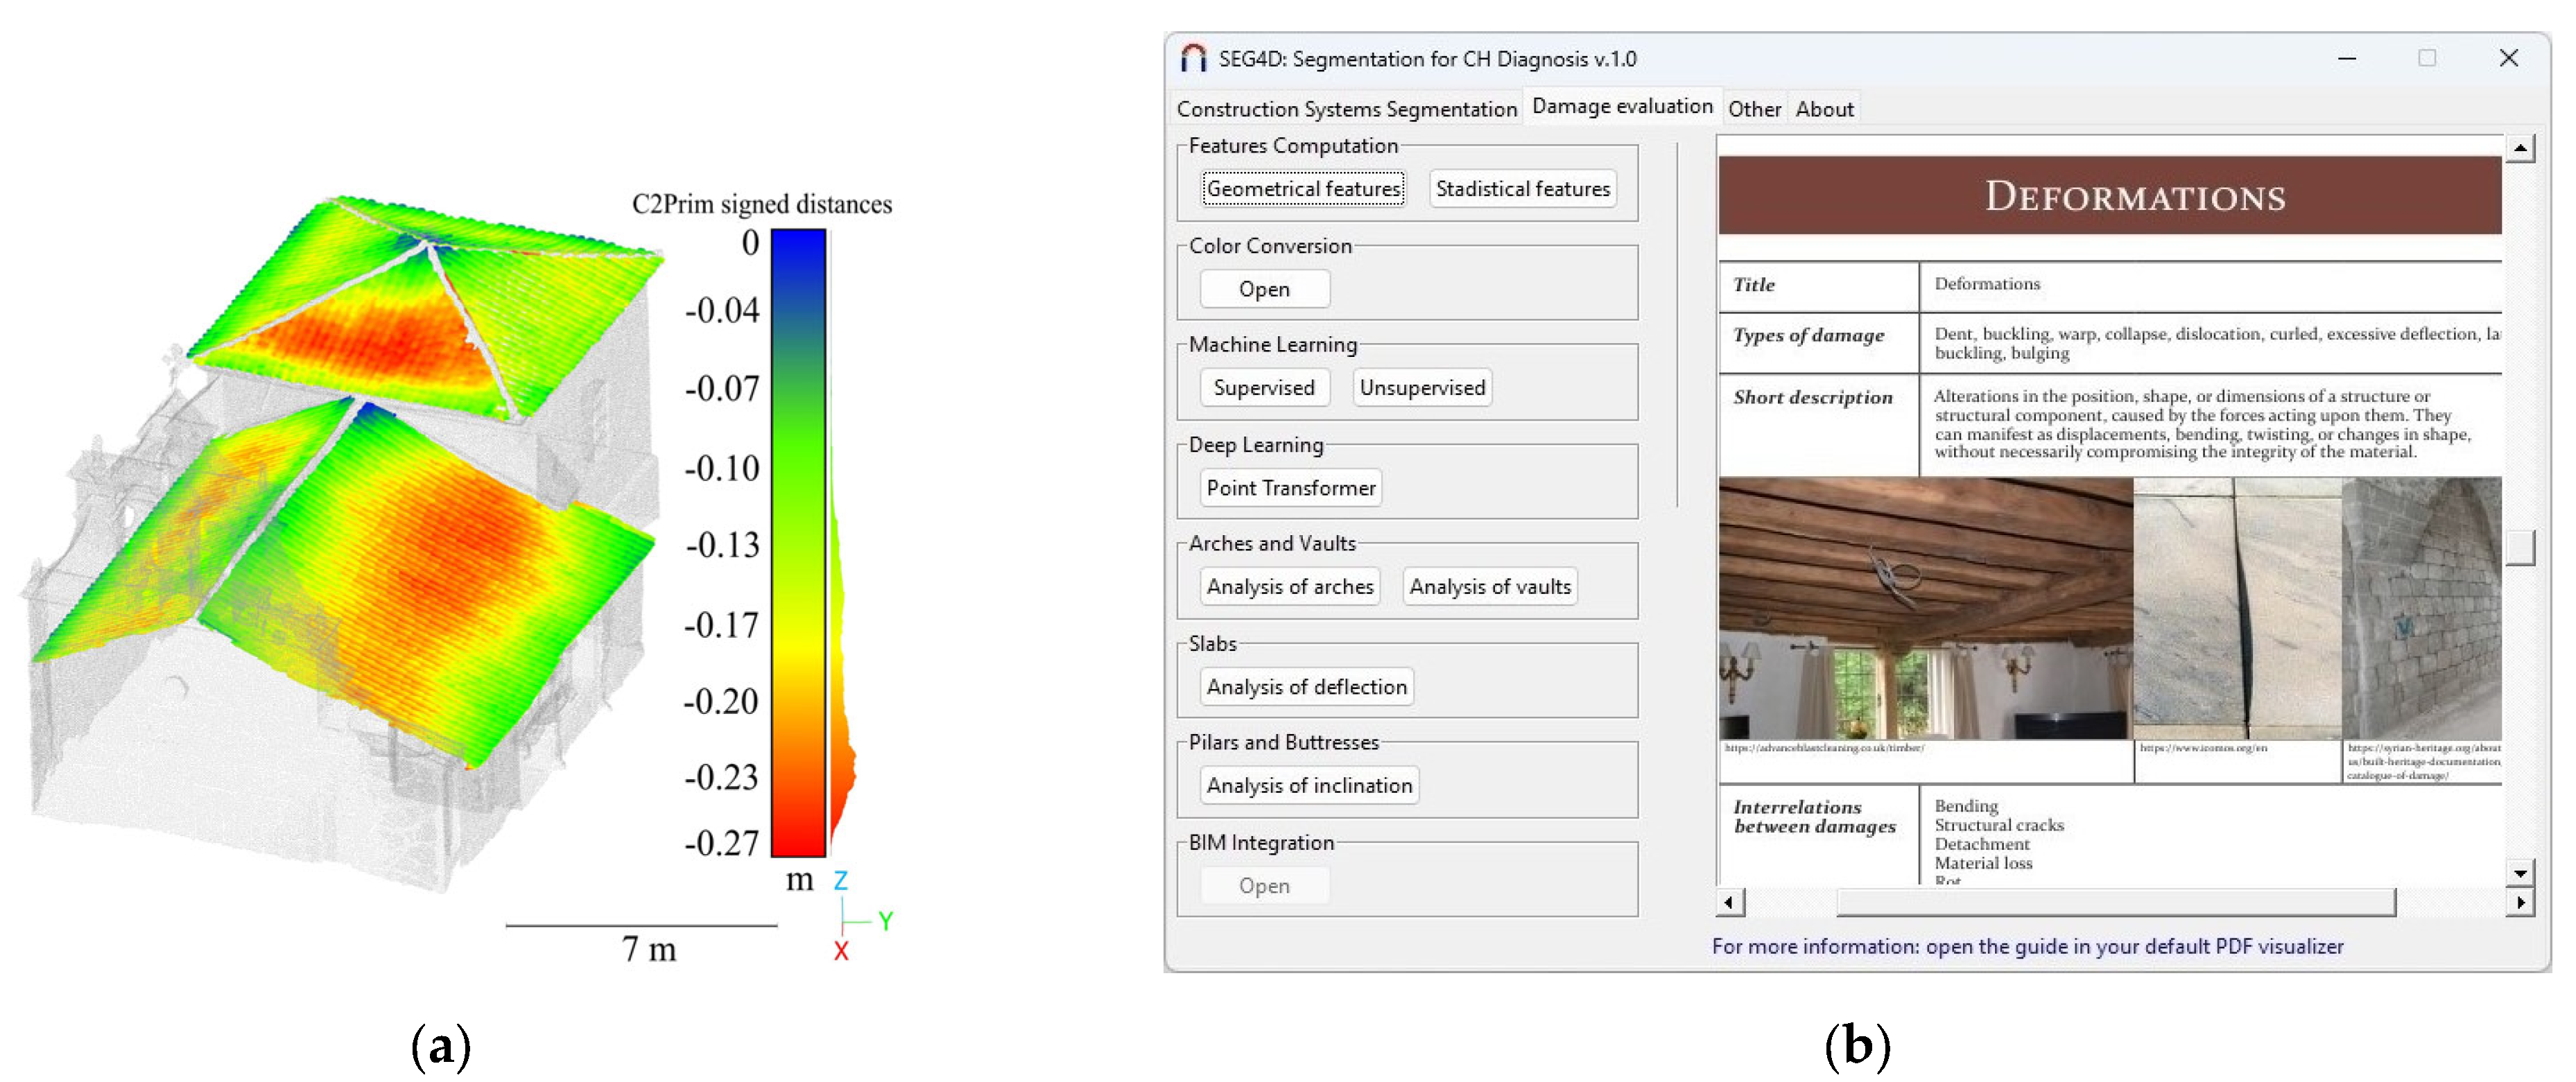
  • Tab for construction system detection: This tab provides all strategies that allow users to segment the constructive systems of the 3D point cloud.
  • Tab for damage detection: When the user clicks on this tab, the plugin displays all strategies devoted to detecting damage. Since damage detection is mainly performed on construction systems, it is highly recommended to previously segment the 3D point cloud into constructive systems.
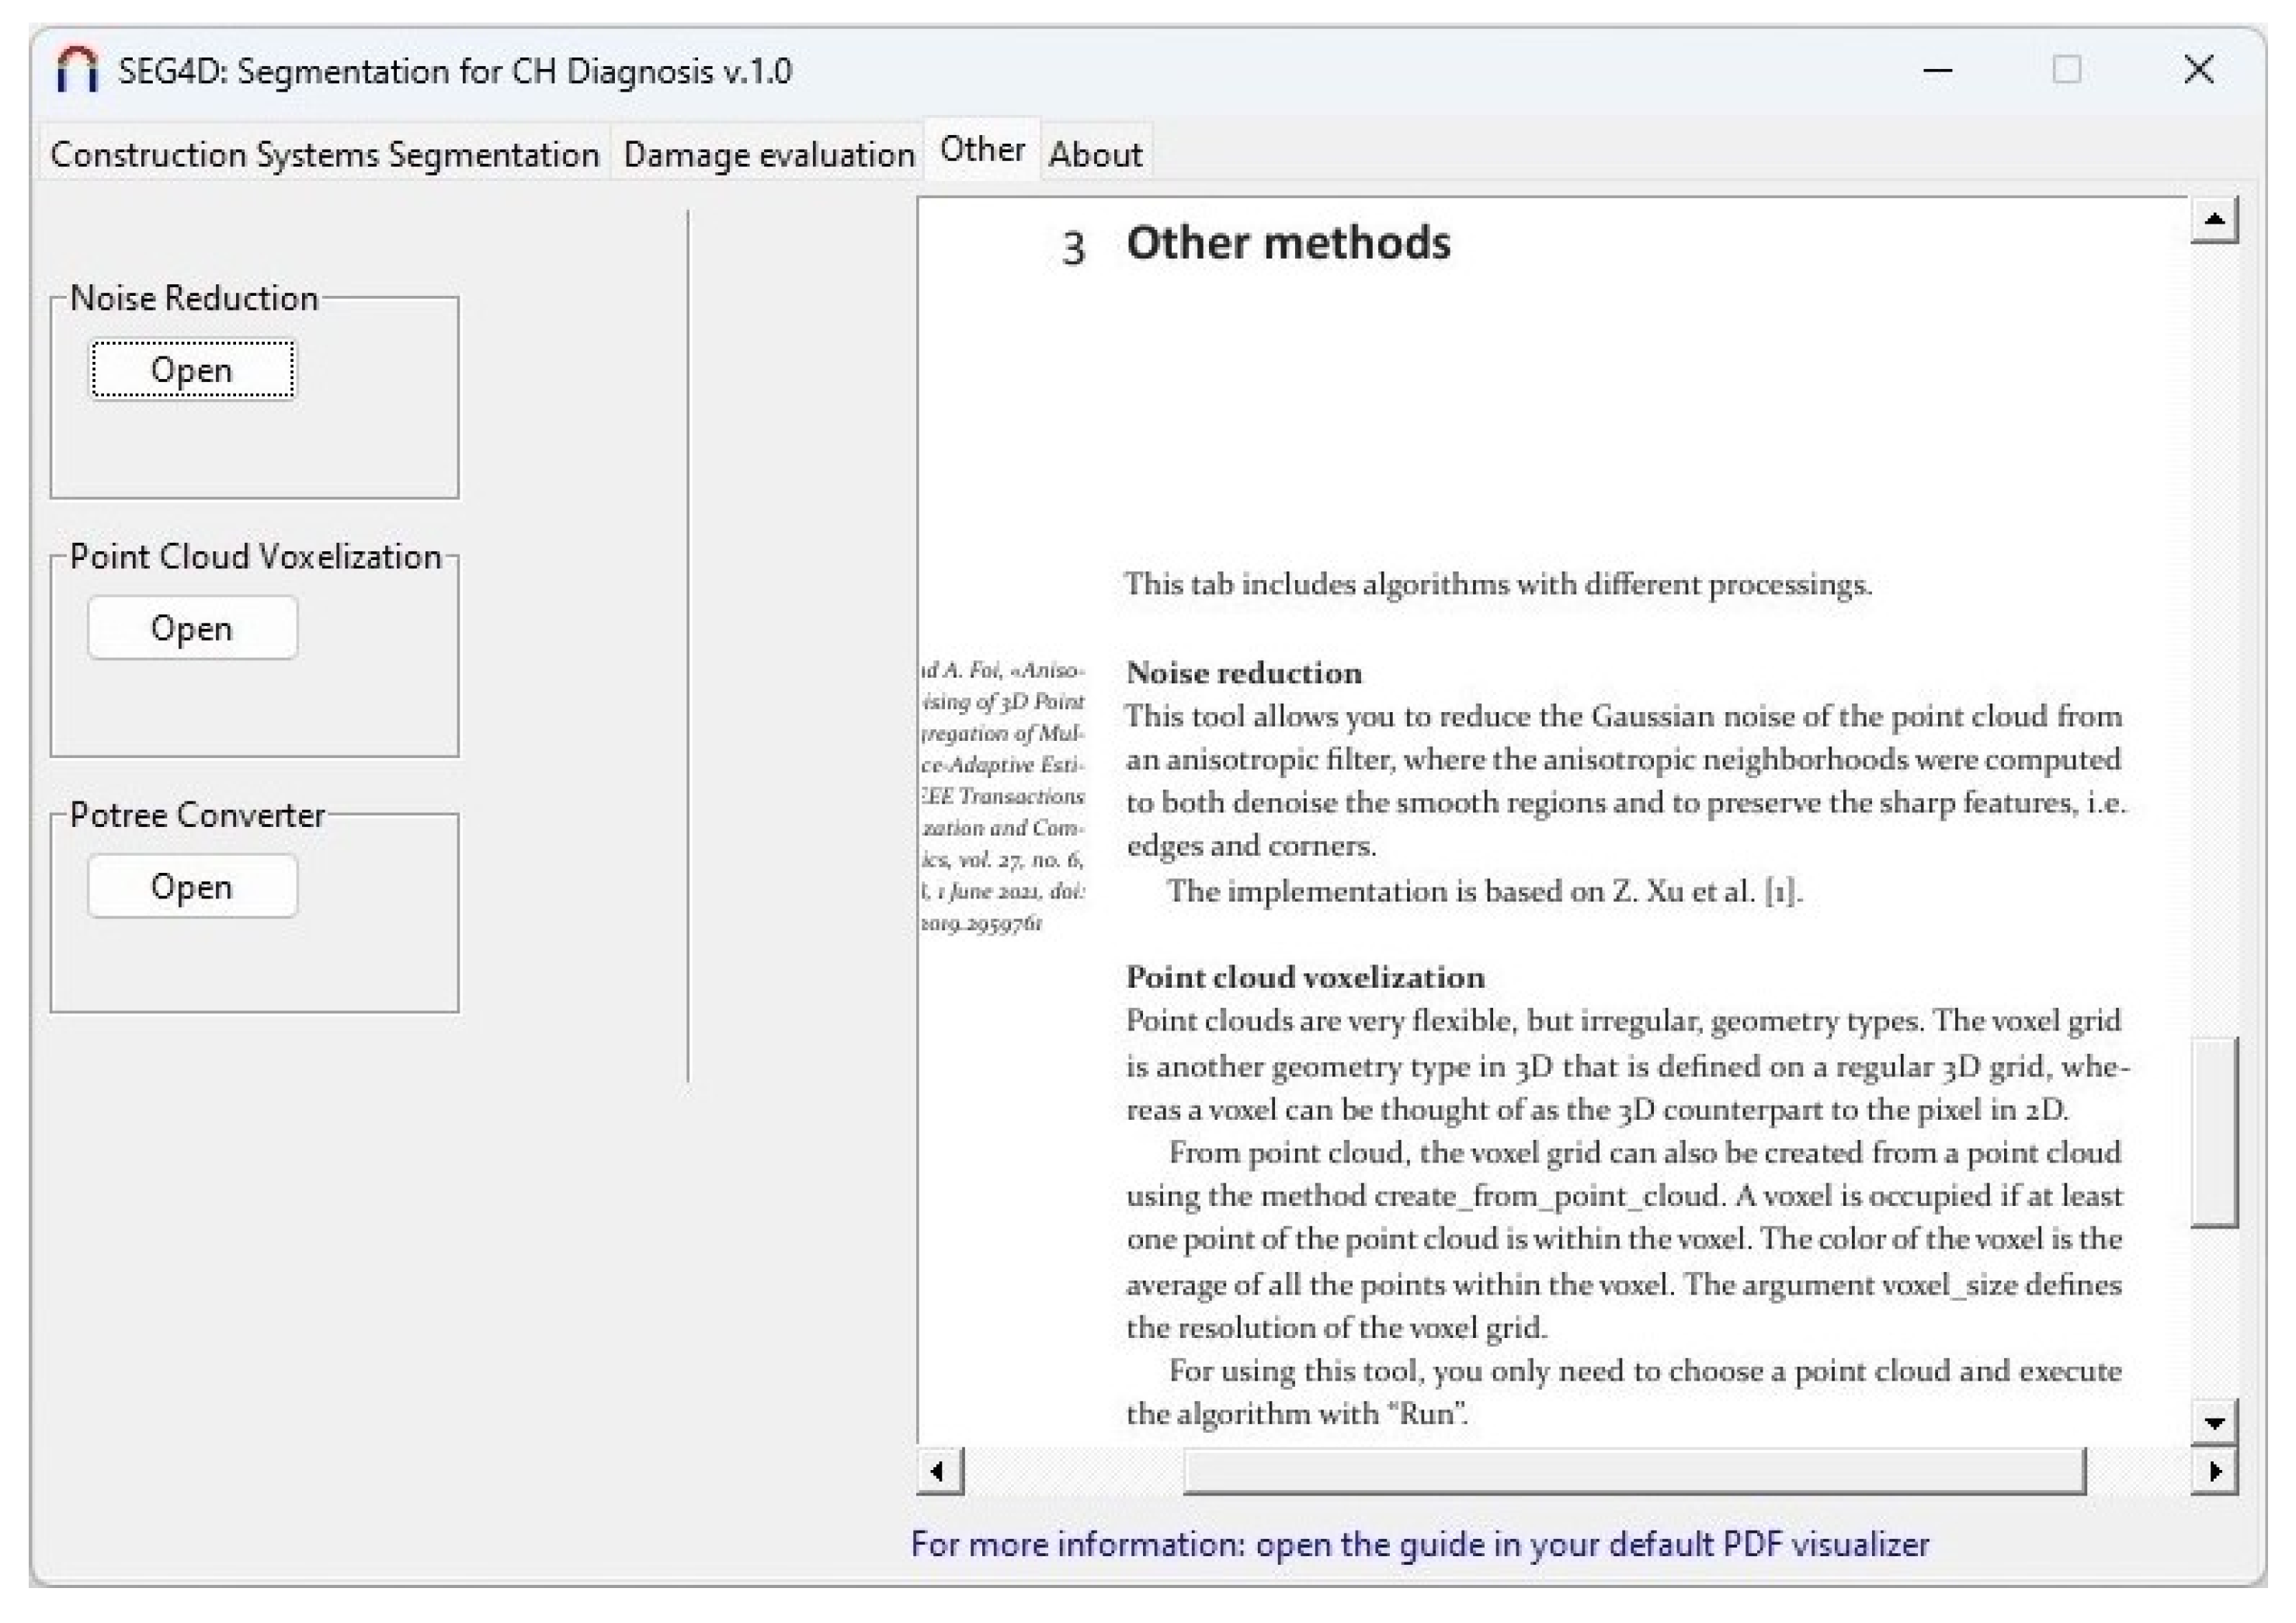
  • Tab for other methods: This tab includes additional algorithms that may be useful for the post-processing of 3D point clouds (e.g., noise reduction or voxelisation of the 3D point cloud).
Figure 2. Seg4D interface appearance: (a) visualization of the Seg4D GUI integrated within the software environment and (b) enlarged view of the main Seg4D interface.
Remotesensing 17 02018 g002
Following the structure outlined in the previous tabs, the evaluation of the 3D point cloud can proceed according to the following steps:
  • Pre-processing the point cloud: Removal of irrelevant parts using the Segment tool, and reduction of noise using the Noise Reduction tool available under the Other tab.
  • Construction system segmentation: Use the ML and DL methods available in the Construction Systems Segmentation tab to classify points based on the construction systems present in the building.
  • Selection of construction system: Choose the specific construction system or construction element for which the user intends to evaluate damage.
  • Damage extraction: Apply one of the strategies provided in the Damage Evaluation tab to identify and assess damage in the selected system.
Although the first step is highly recommended to minimise mismatches in later stages, it is important to note that Step 2 (segmentation) is not mandatory for Step 4 (damage detection). However, using ML or DL classification significantly enhances user efficiency, especially on repetitive structures. Accurate input data is crucial for reliable damage detection. For example, in deflection analysis of slabs, the tool requires precise input of the lower faces of beams. Inaccurate input can lead to incorrect plots and misleading results.

3.1. Constructive System Detection Tab

This tab is mainly structured into two columns. The left column of the tab features the integration of various algorithms. The right column includes a simplified guide in PDF format with the aim of properly preparing the 3D point cloud for further classifications (Figure 3).

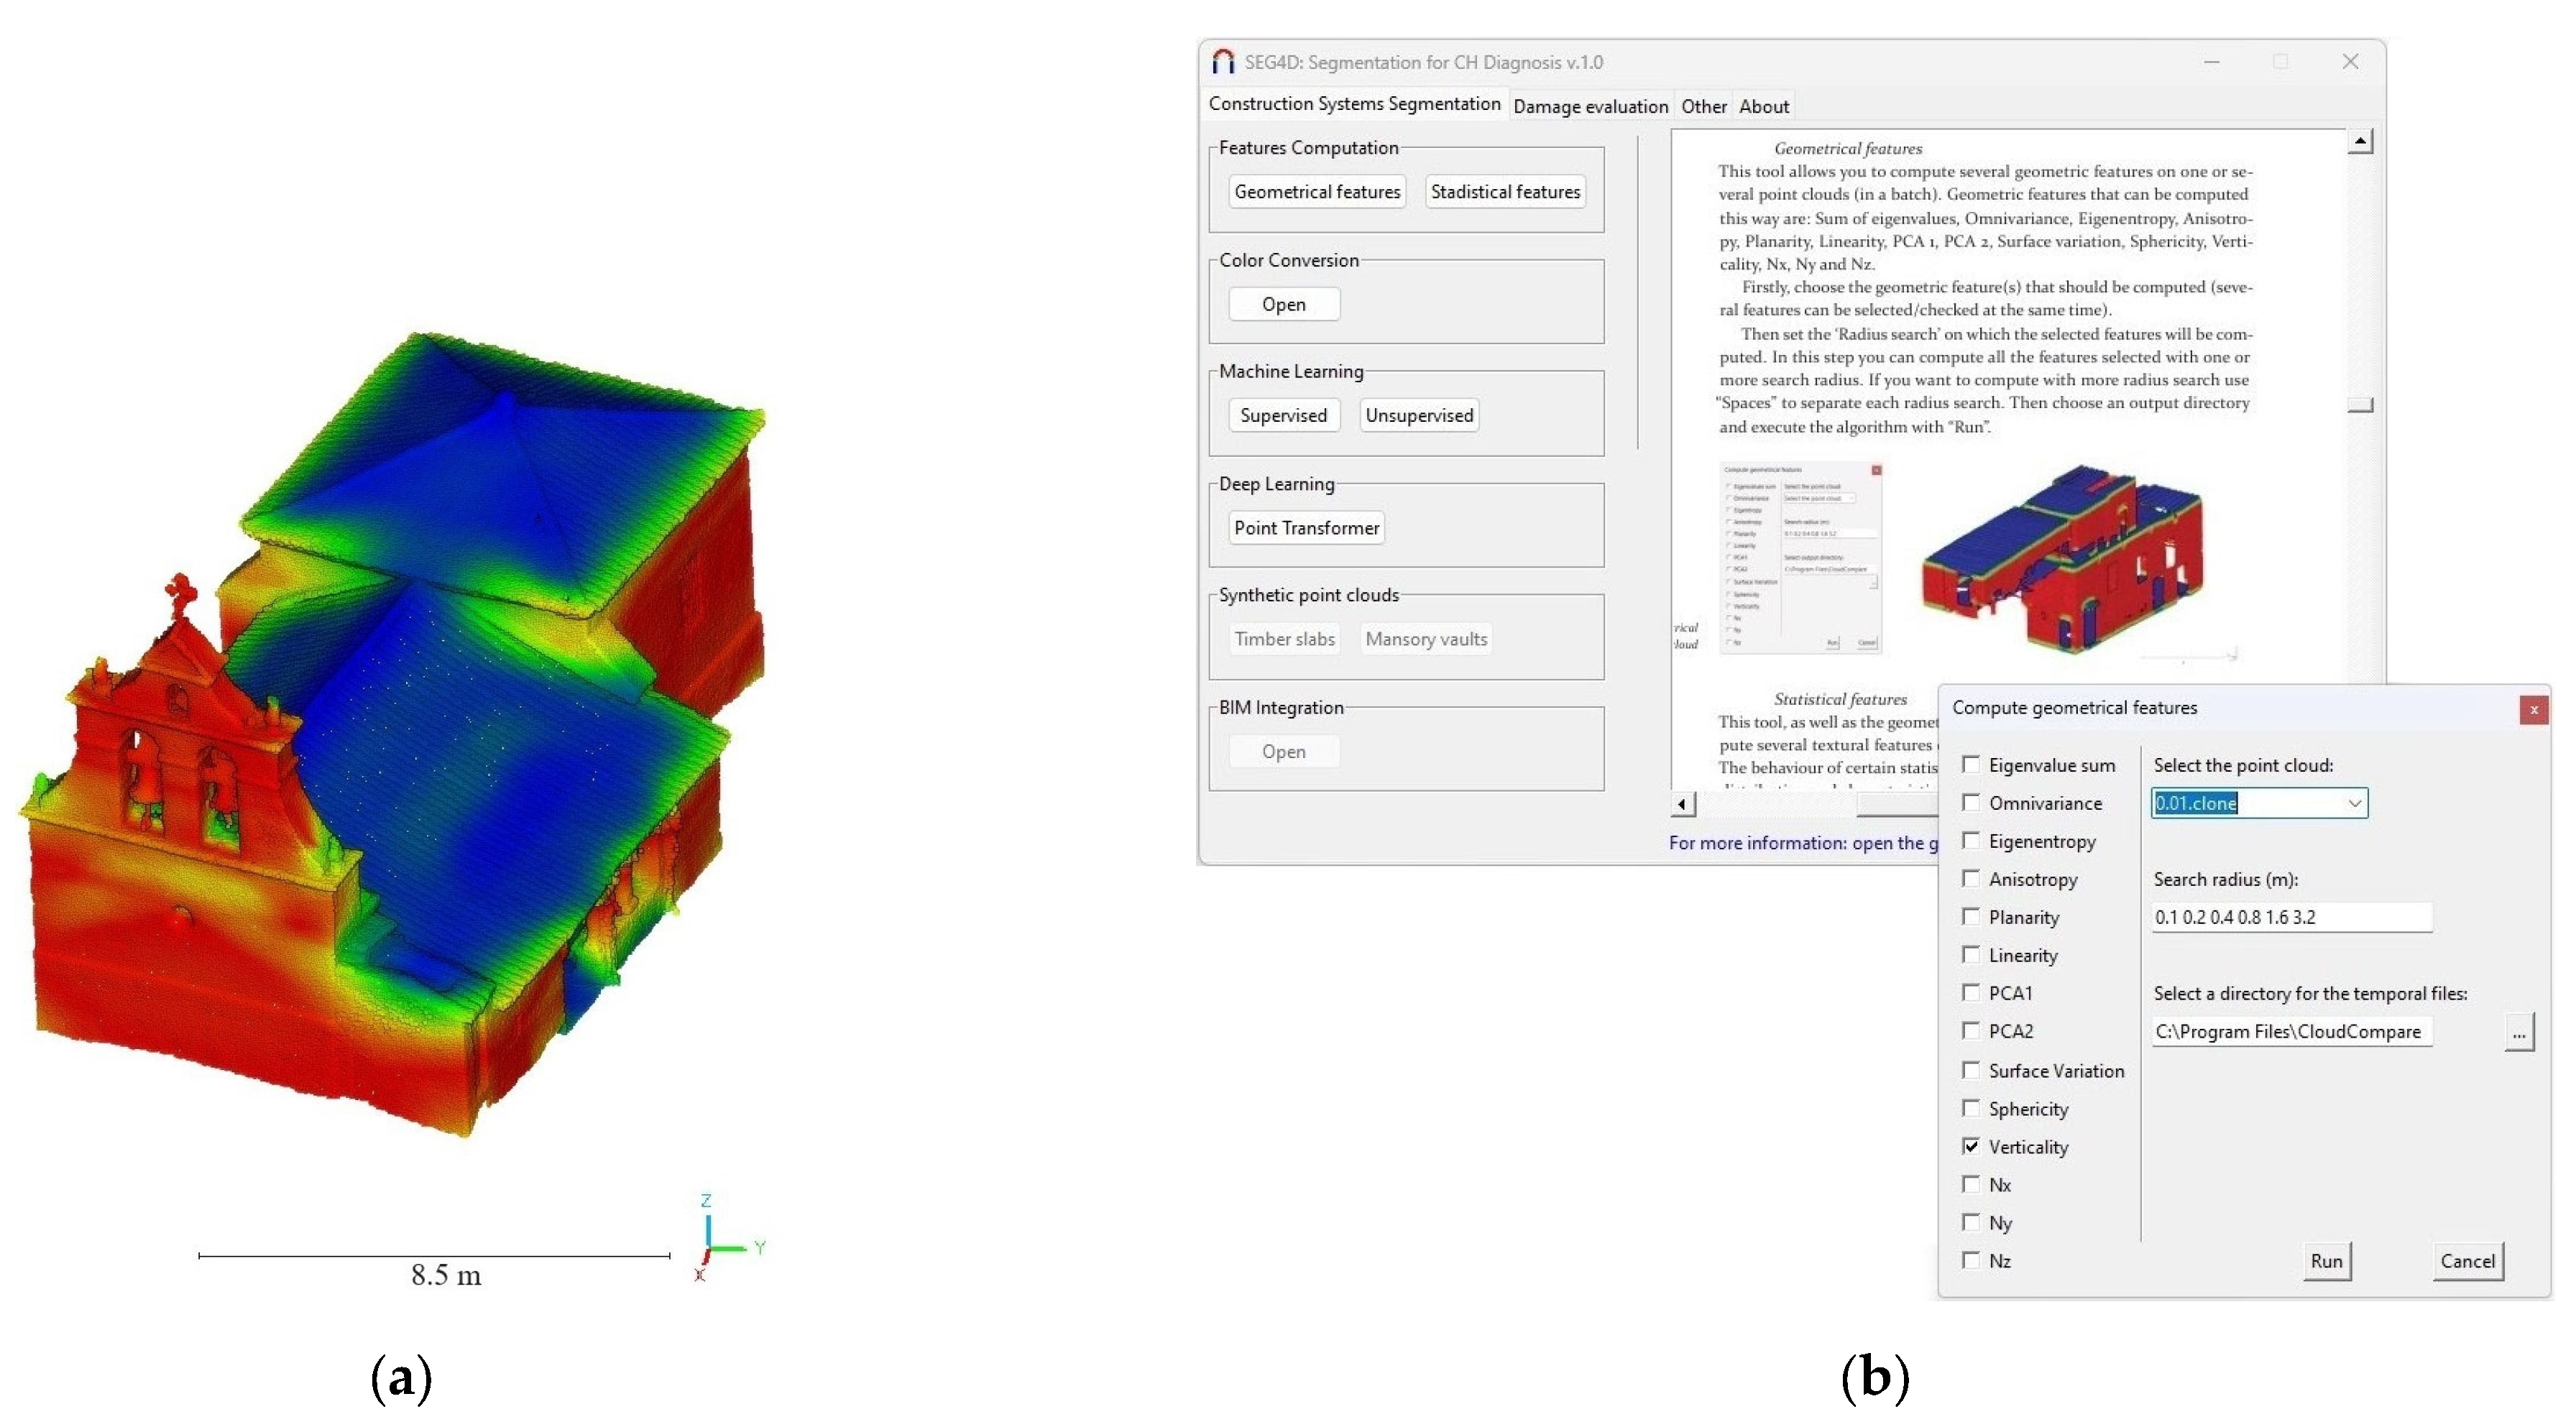
3.1.1. Feature Computation Module

This group is dedicated to the computation of features within 3D point clouds. The features are variables that characterise the geometry or radiometry of each point with respect to its neighbours (Figure 4):
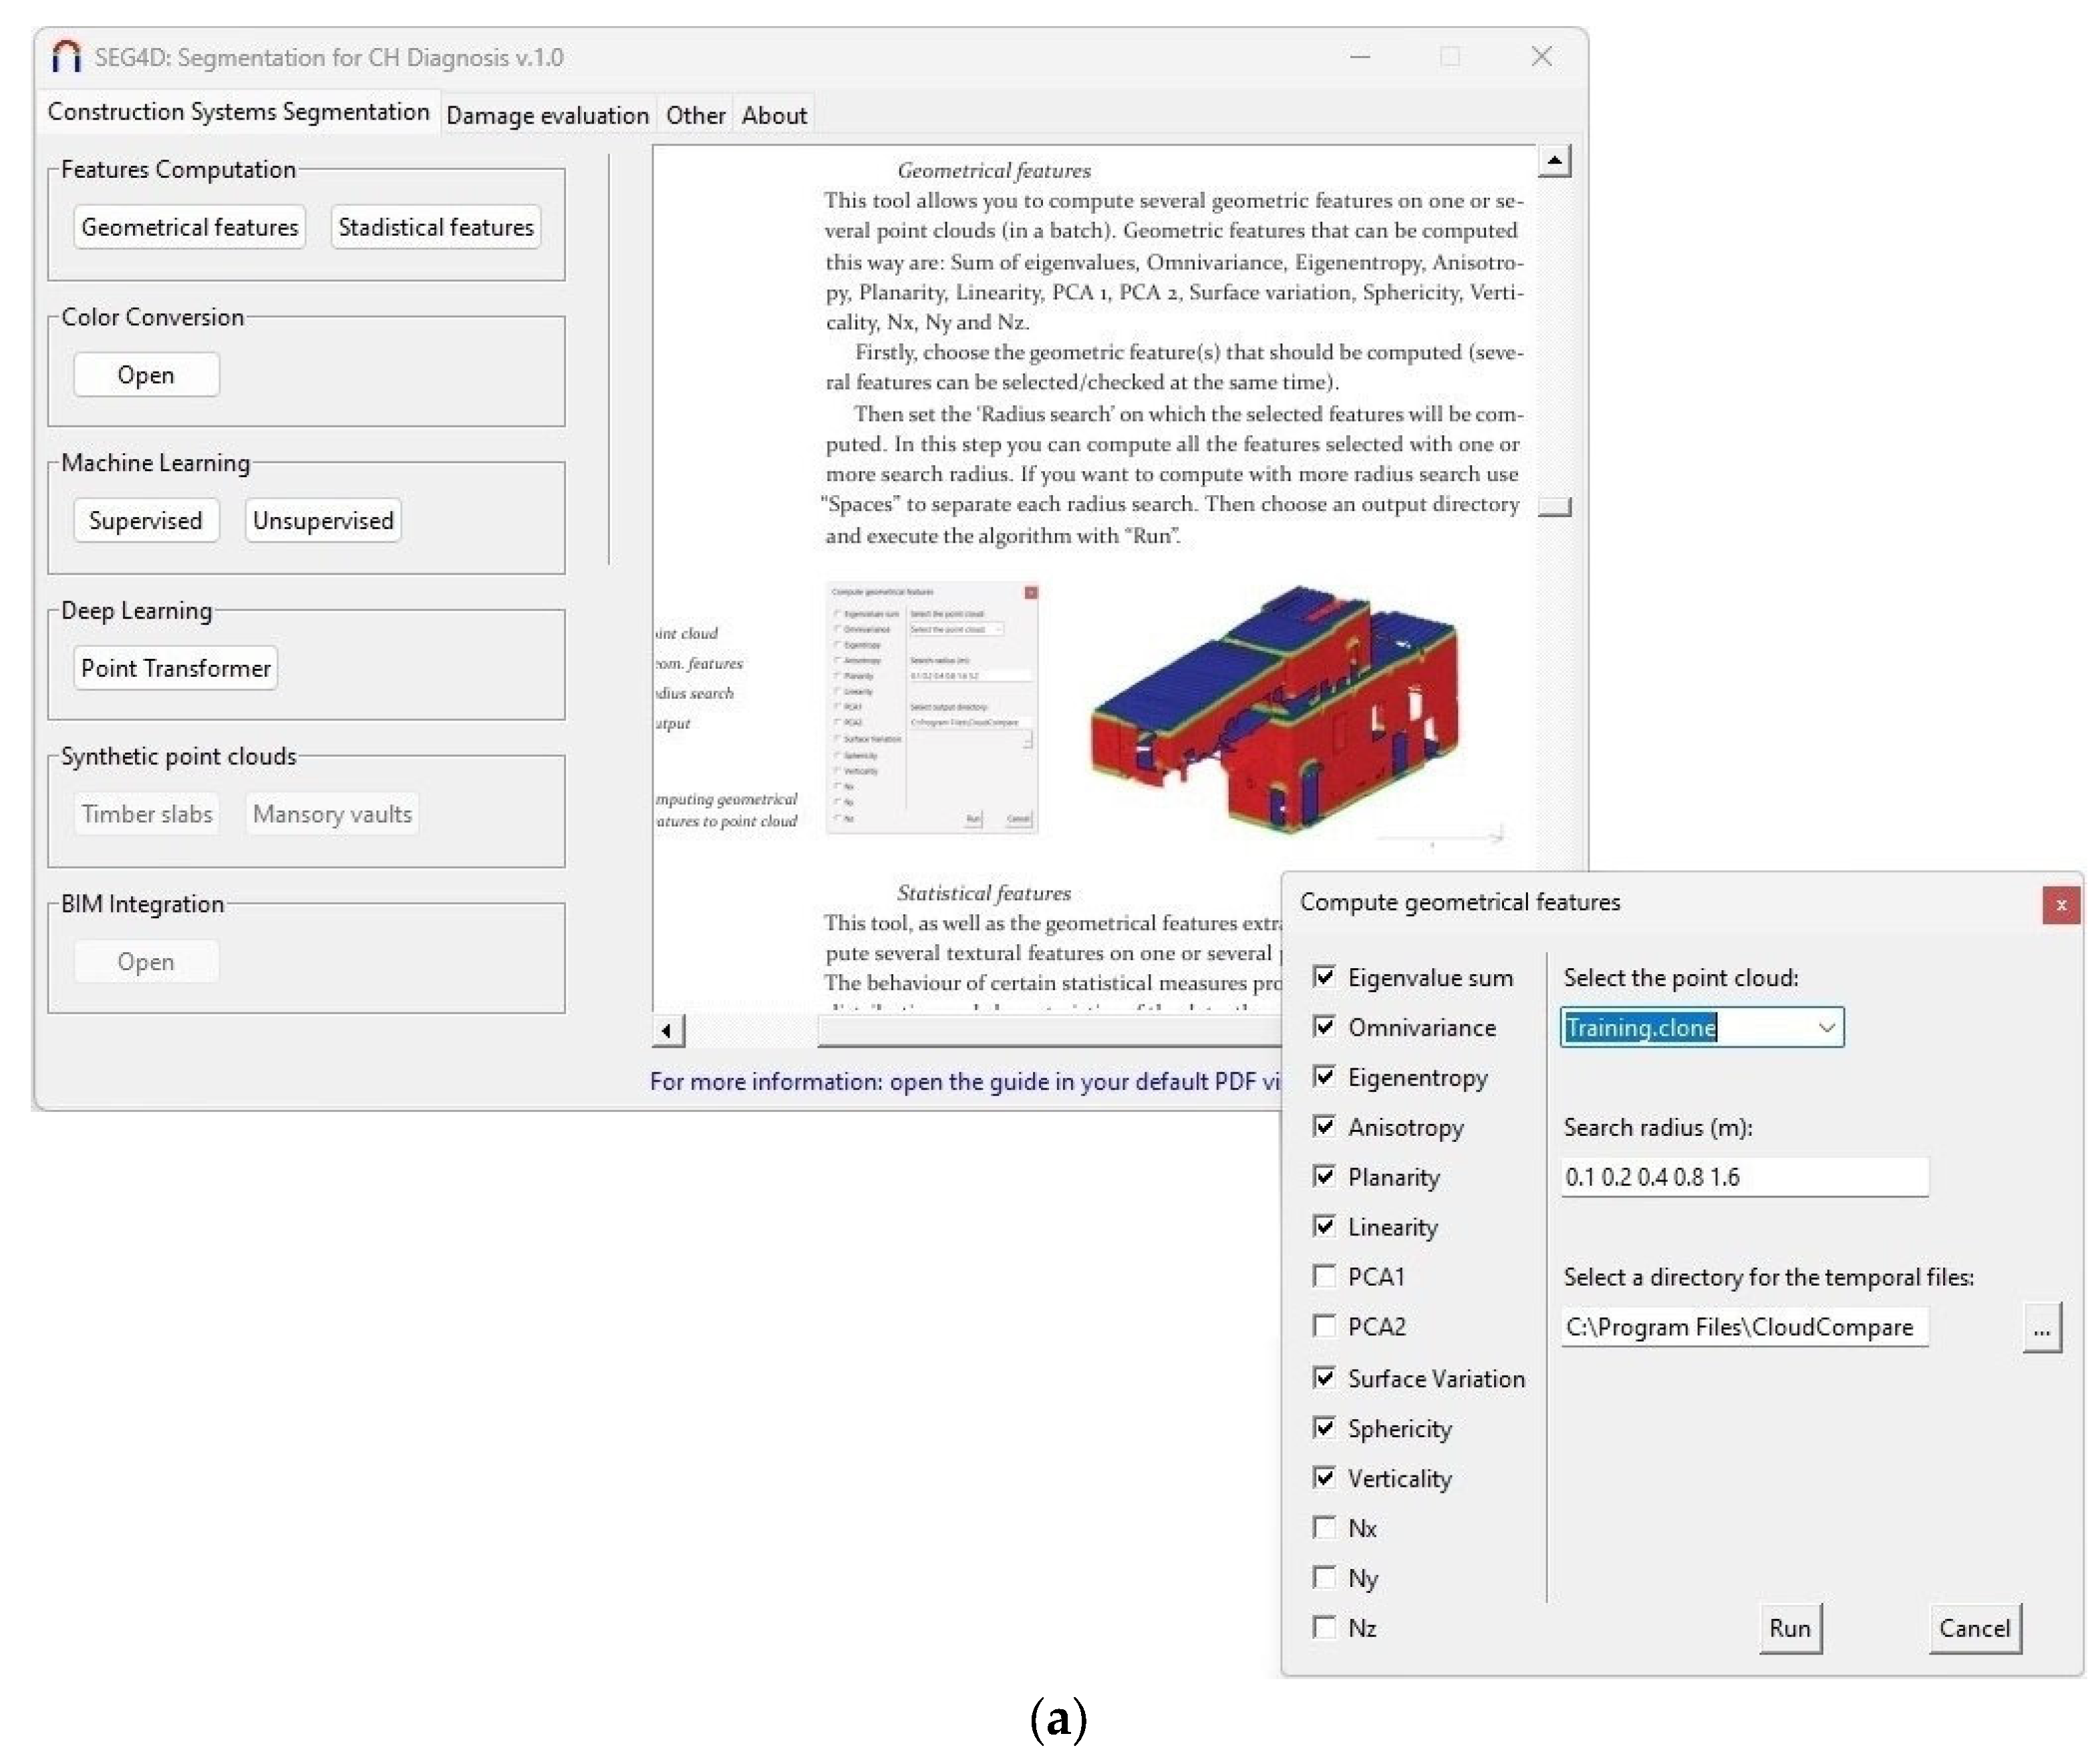
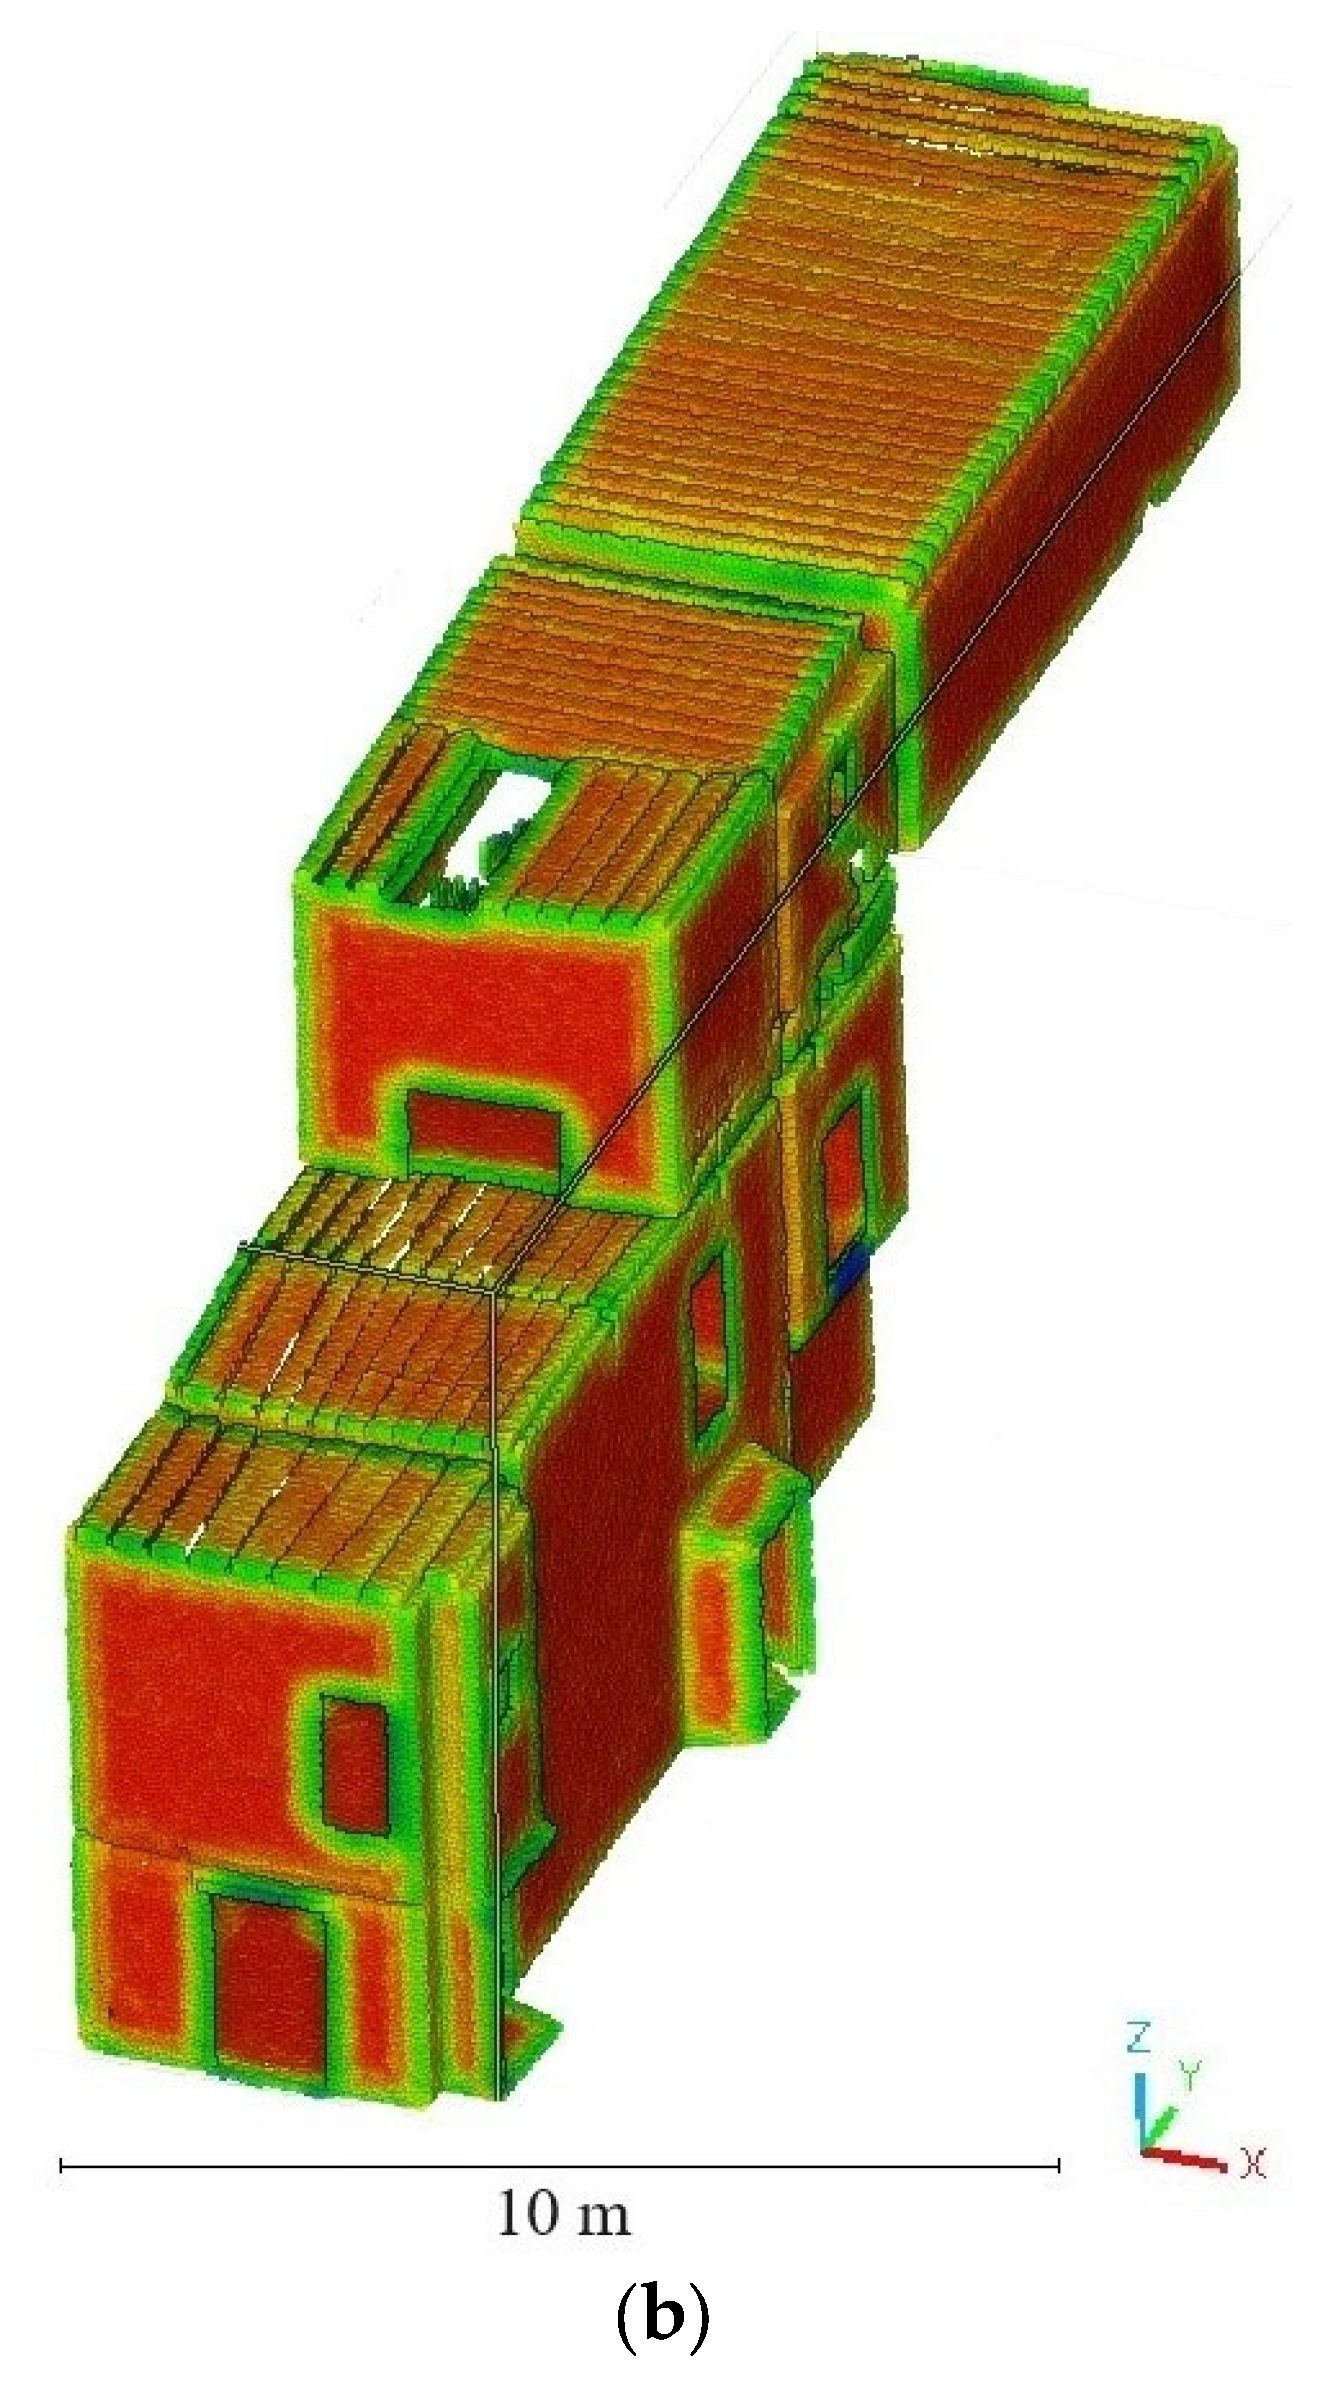
  • Geometrical features: This button allows users to compute the geometric features of the 3D point cloud by using the data extracted from the Principal Component Analysis (PCA) of each point. The current version of the software includes the geometric features defined by Weinmann et al. [49]. The Python library Jakteristics (https://jakteristics.readthedocs.io/en/latest (accessed on 7 February 2025)) was used for this purpose. A geometric feature is a variable that characterises the geometry surrounding a point within the point cloud. For instance, a high value of the geometric feature known as ‘planarity’ indicates that the region surrounding a given point is predominantly planar.
  • Statistical features: In addition to geometric features, the software can compute several statistical features related to the statistical indices between each point and its neighbours. The statistical features implemented in the current version include Mean value, Standard deviation, Range, Energy, Entropy, Kurtosis, and Skewness. These features allow for the evaluation of similarity between the neighbourhoods at different levels.
Figure 4. “Compute Geometrical Features” tab: (a) Results obtained after processing the verticality index of the 3D point cloud. Warm values indicate higher values of verticality. Meanwhile, cold values indicate lower values. (b) Appearance of the GUI.
Remotesensing 17 02018 g004
Both types of features have been demonstrated to be relevant for training artificial intelligence algorithms within the heritage field [10,50,51].

3.1.2. Colour Conversion Module

The button of this group allows the conversion of R (red), G (green), B (blue) values (which are the default colour values of 3D point clouds with visible information) to other colour systems (Figure 5):
  • HSV: This colour system refers to the layers Hue, Saturation, Value.
  • YCbCr: Y represents the luma component, and the Cb and Cr signals are the blue difference and red difference chrominance components, respectively.
  • YIQ: Y represents the luminance information; I and Q represent the chrominance information and the orange–blue and purple–green range, respectively.
  • YUV: Y represents the luminance information; U and V represent the chrominance information and the red and blue range, respectively.
Figure 5. “Color Conversion” tab: (a) results obtained after converting the RGB to HSV values of the 3D point cloud and (b) appearance of the GUI.
Remotesensing 17 02018 g005

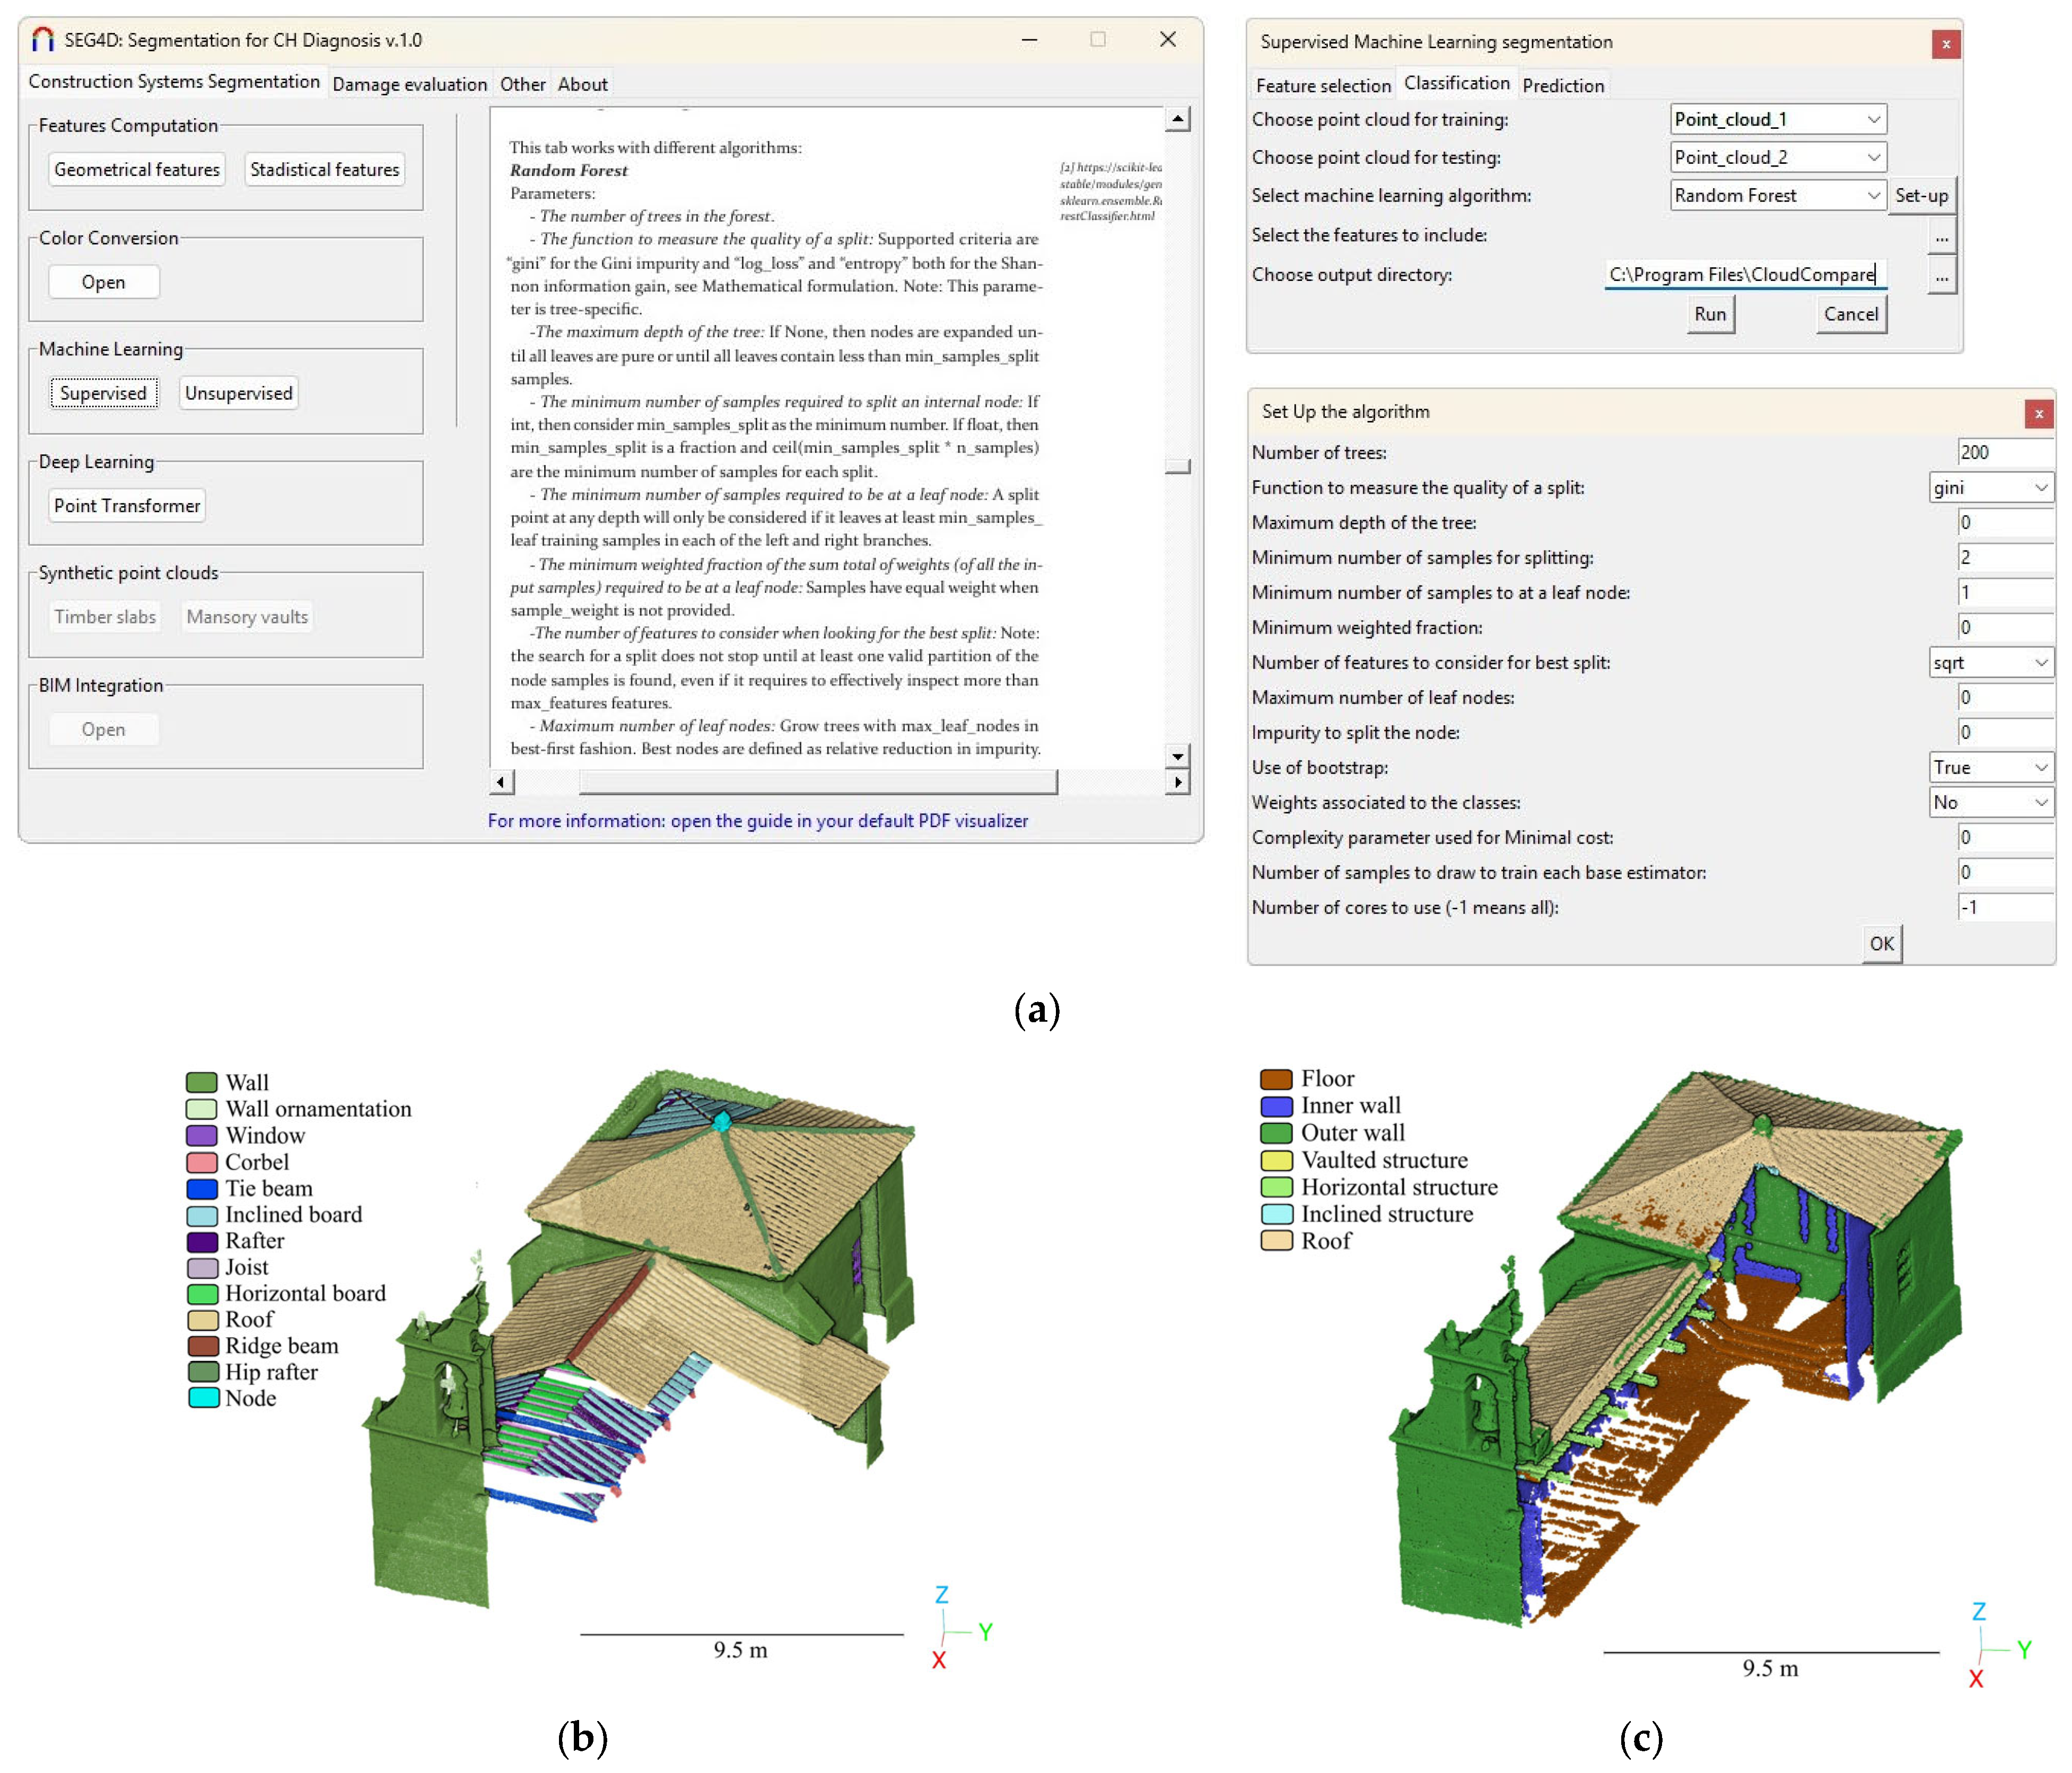
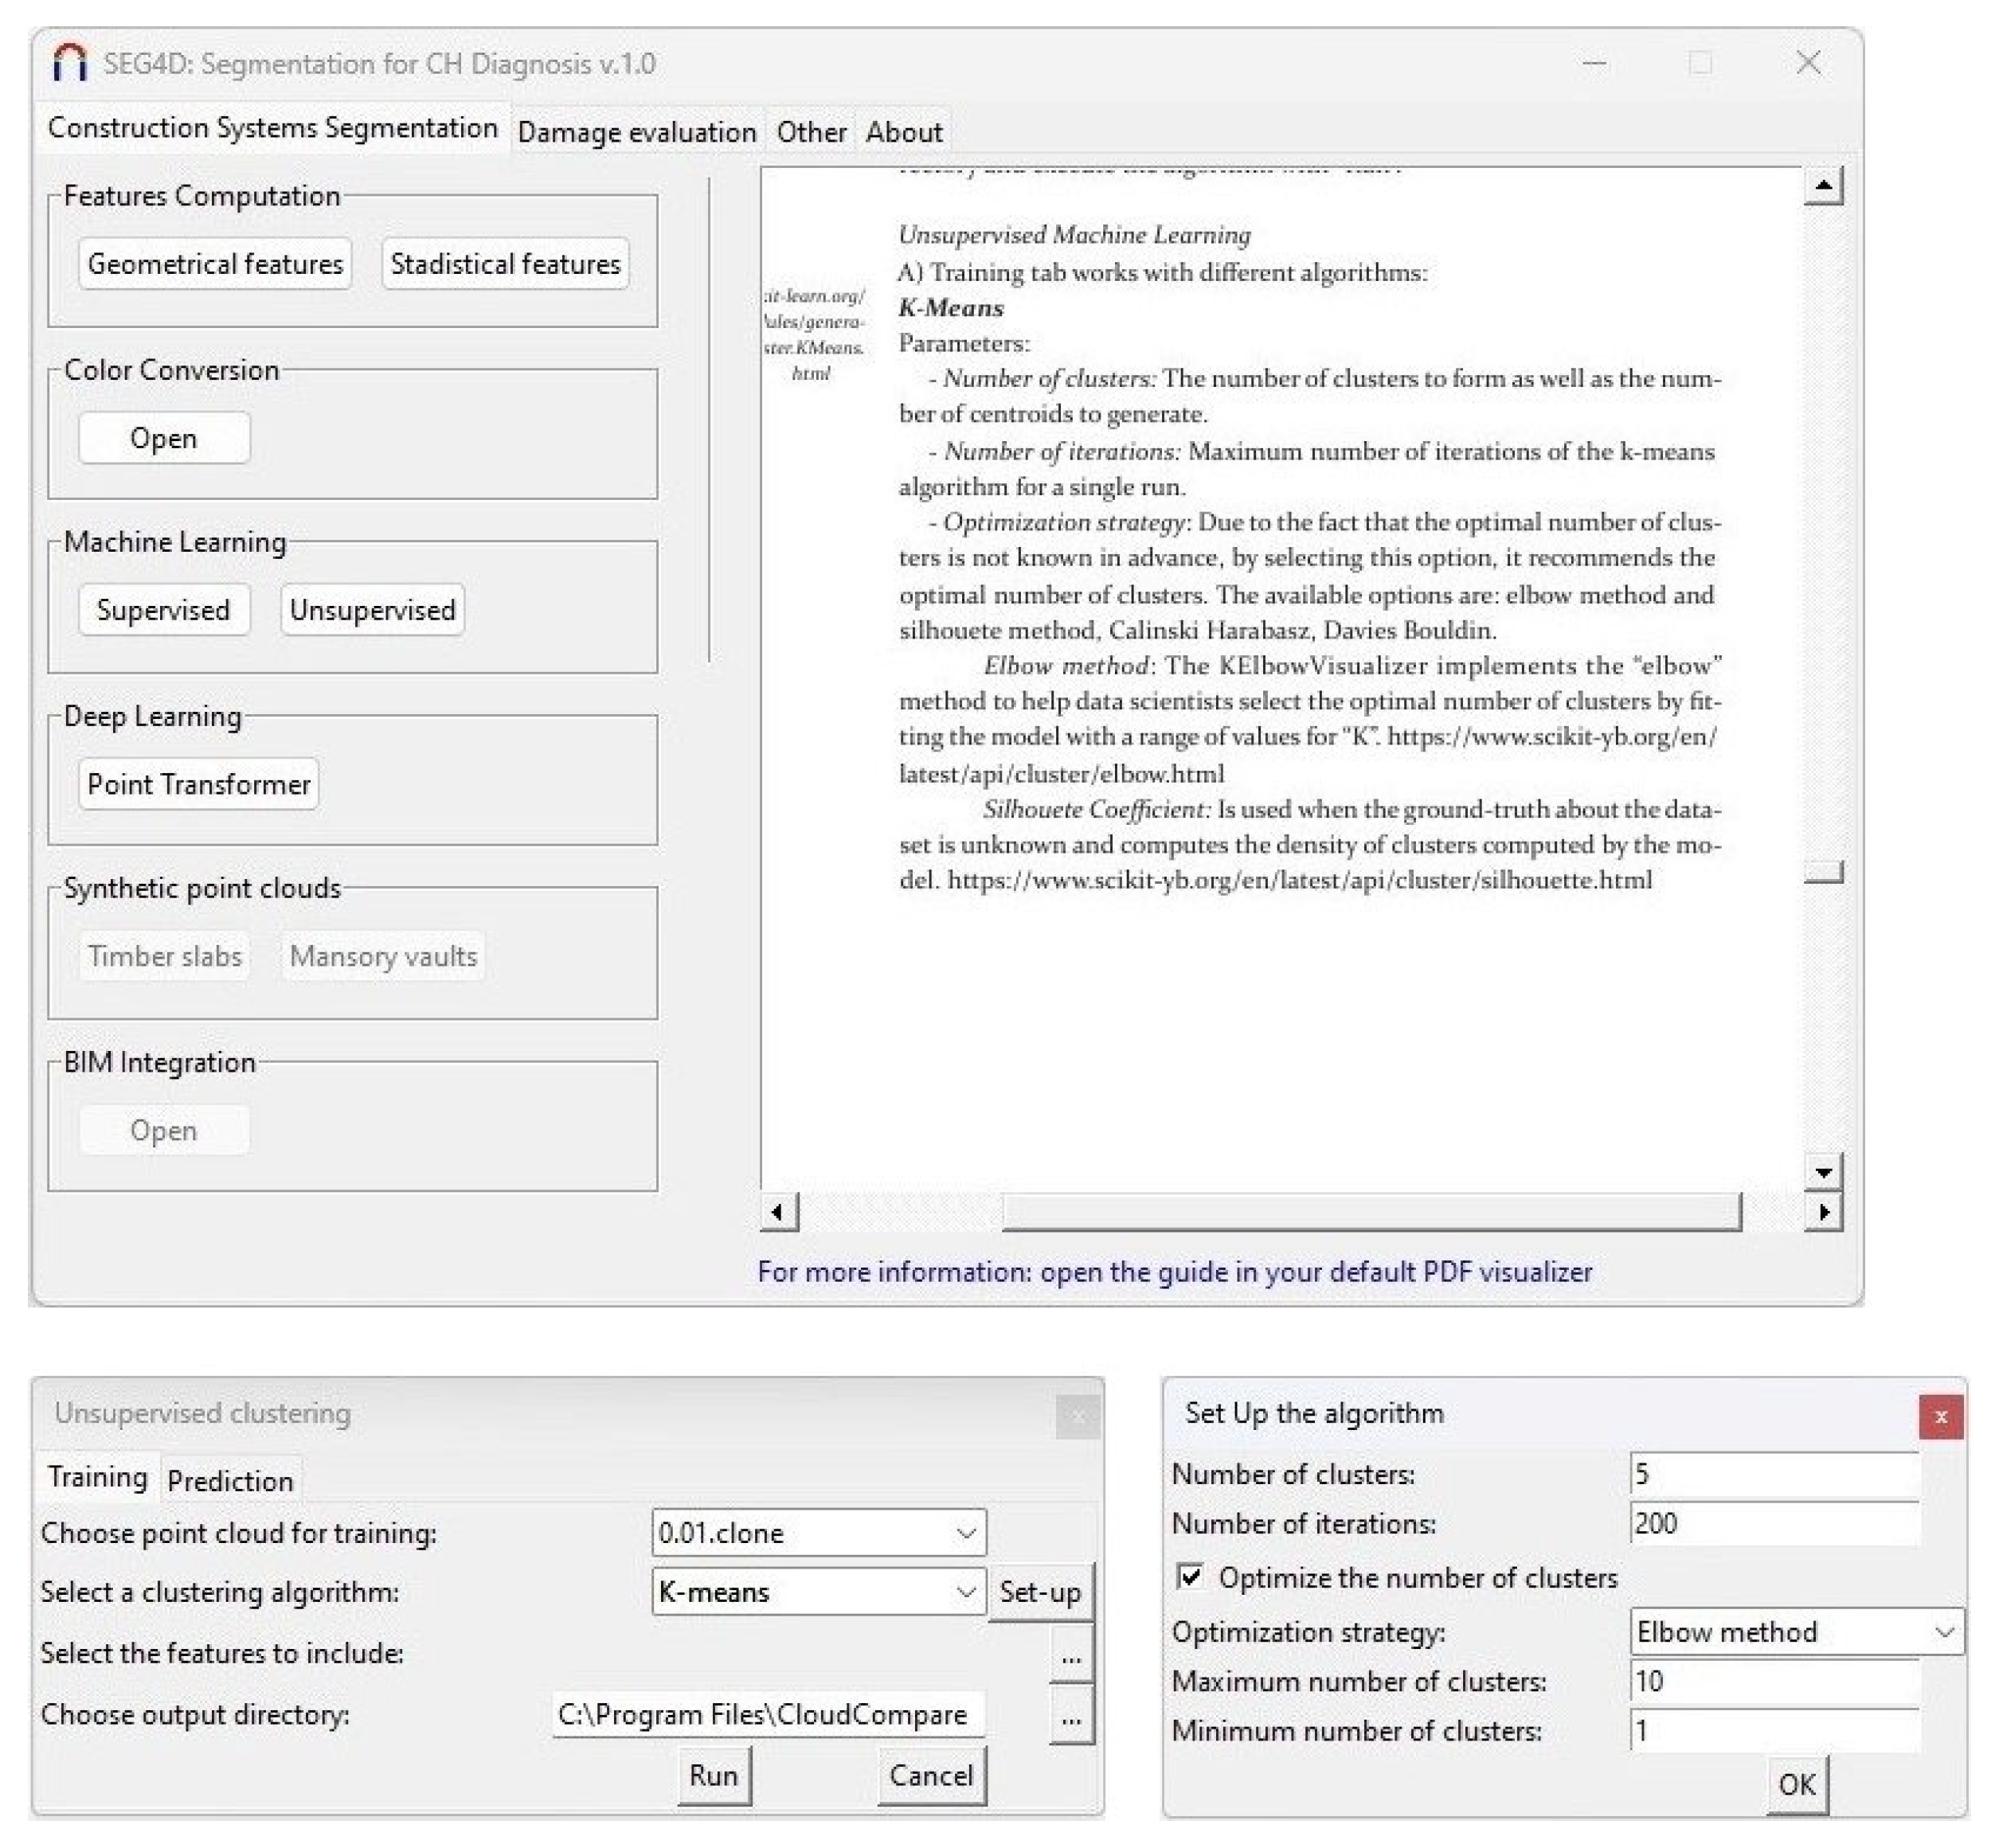
3.1.3. Machine and Deep Learning Modules

The next two sections (rows) contain different buttons that allow the execution of ML and DL algorithms for constructive system classification.
Seg4D includes the most relevant ML algorithms highlighted in the systematic reviews conducted by Yang et al. [7] and Sánchez-Aparicio et al. [8]. Supervised algorithms are trained on labelled datasets, where each input is paired with a corresponding correct output. In this case, the inputs are the features of each point (geometric and/or radiometric), while the output is the construction system to which each point belongs (Figure 4a). In this sense, Seg4D offers several pre-processing and processing options that enable the proper application of these methods (Figure 6):
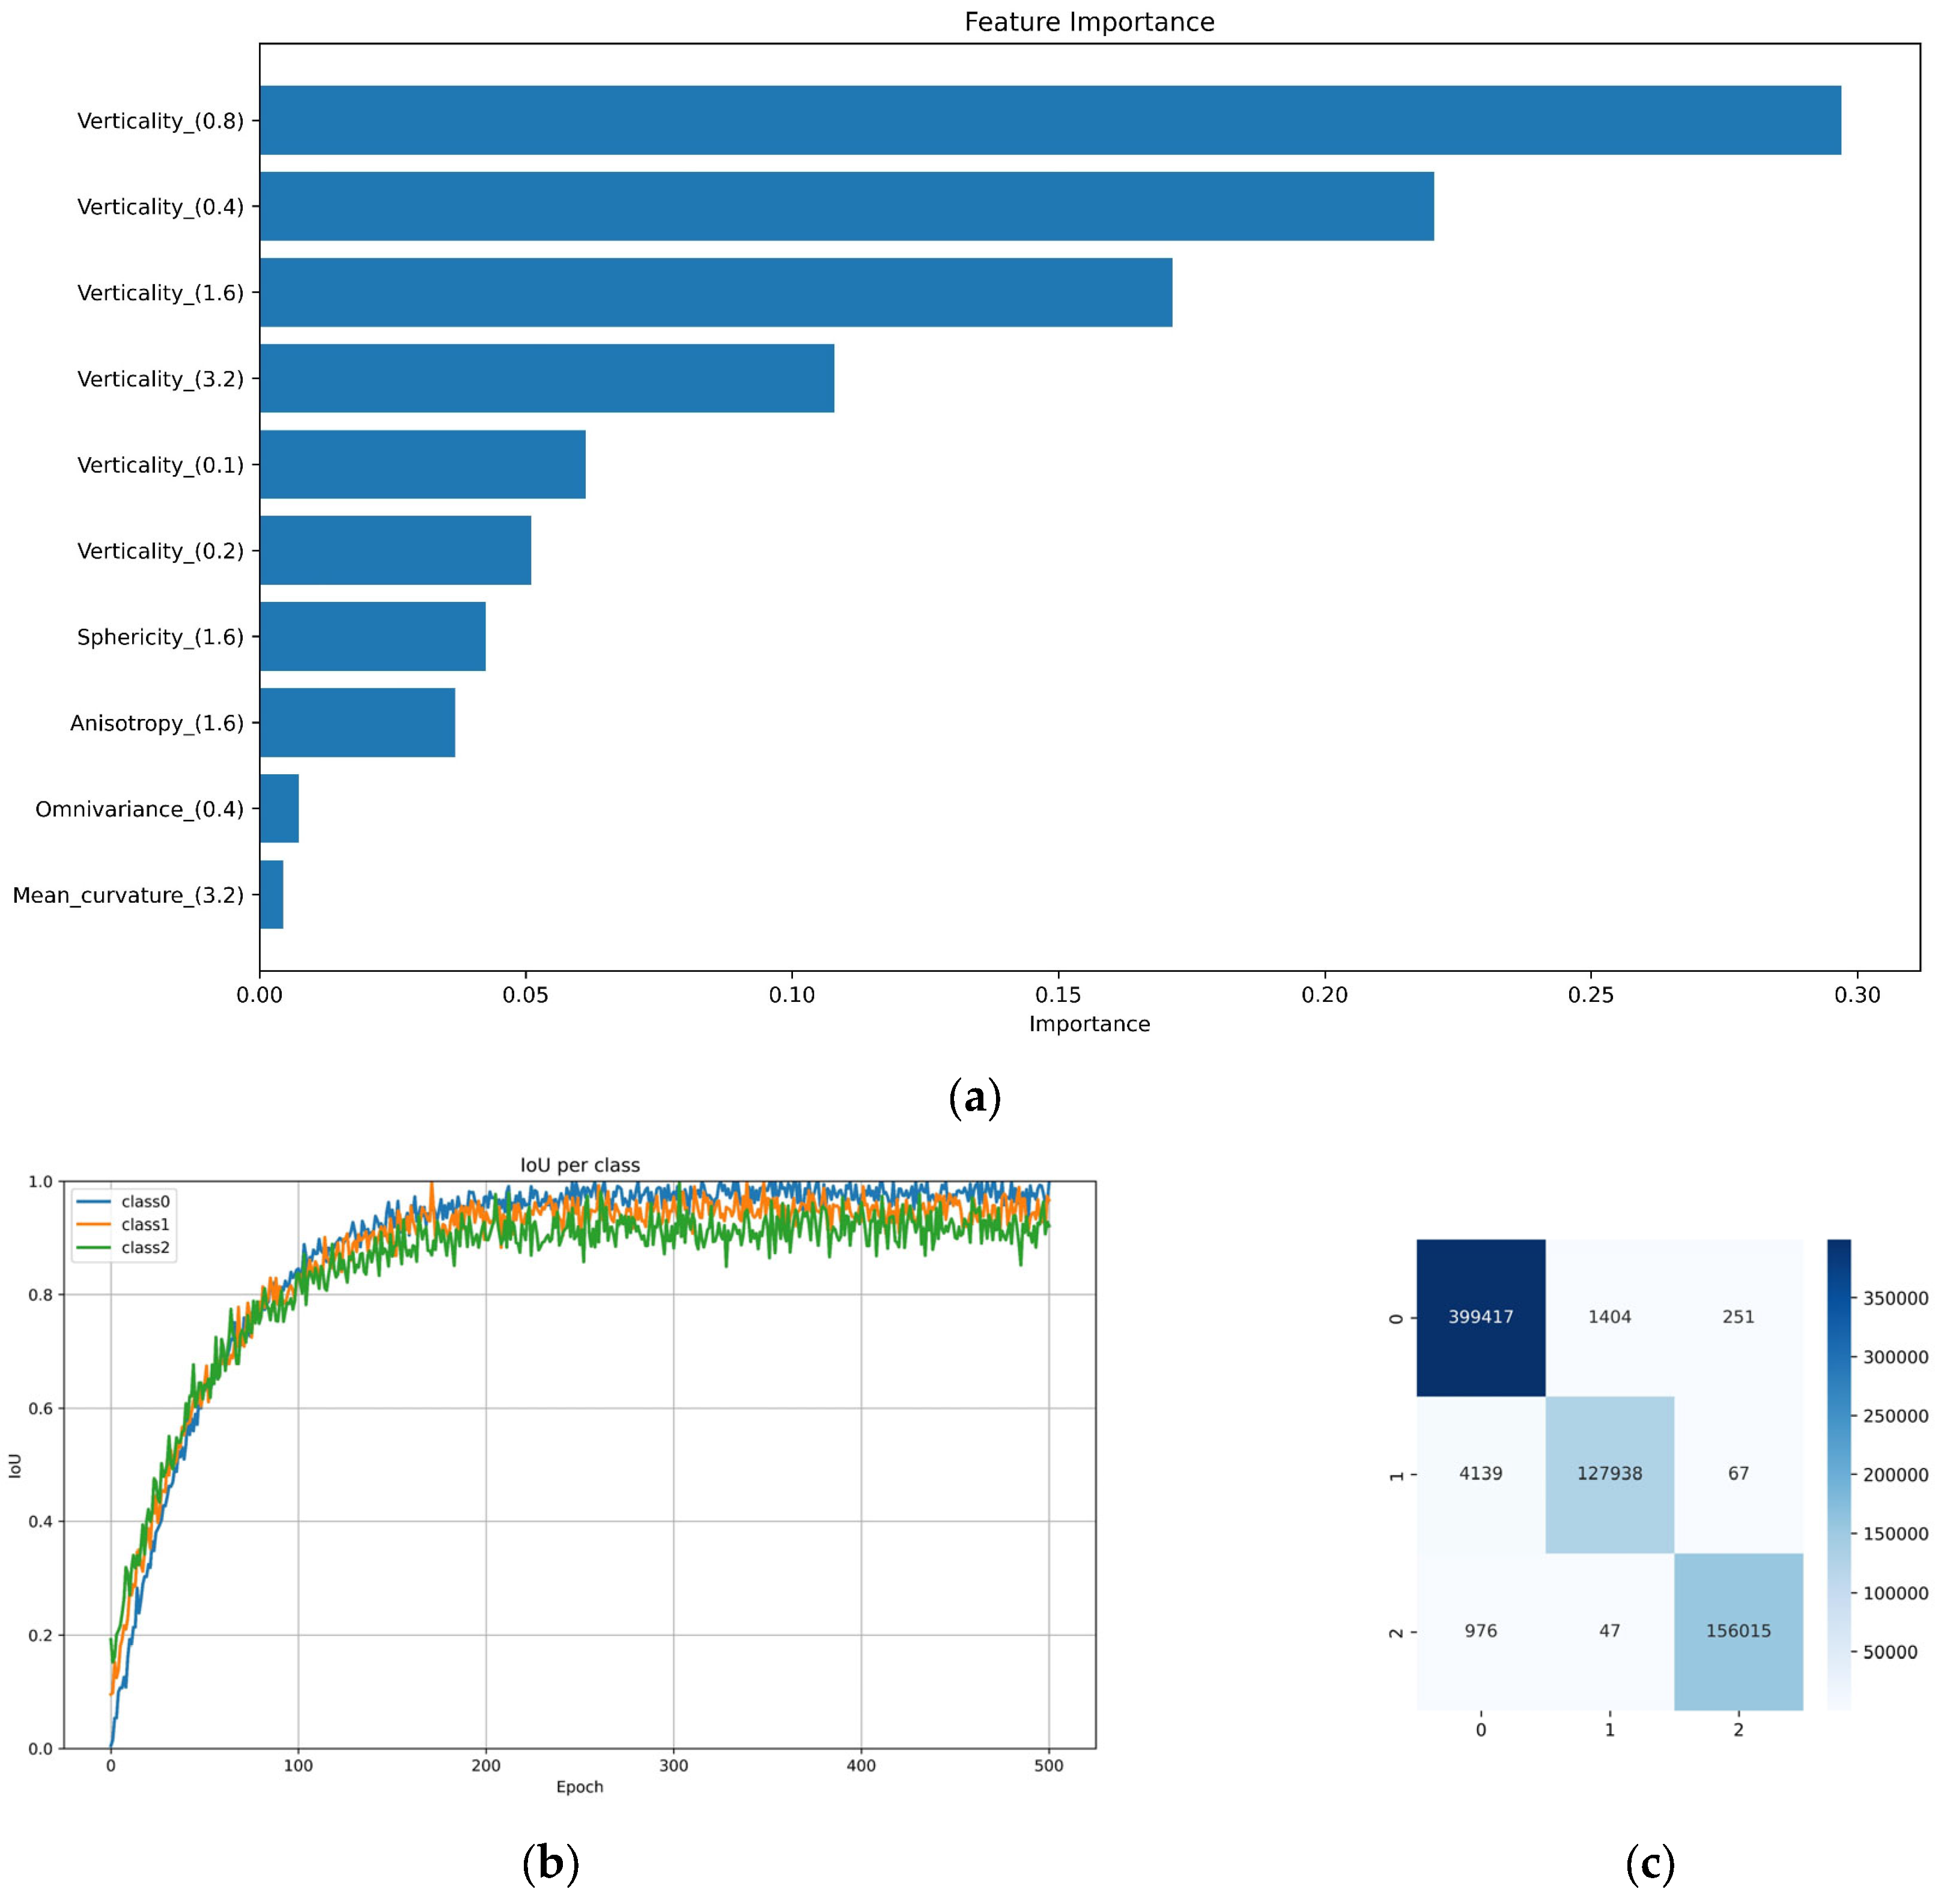
  • Feature selection: This option allows the evaluation of the relevance of the different features contained in the 3D point cloud to reduce the complexity of the ML models. Within this context, the current version of Seg4D includes the library Optimal-Flow [52]. The current version is 0.1.11 (https://optimal-flow.readthedocs.io/en/latest/ (accessed on 7 February 2025)). This library integrates several approaches to select the most relevant features for the ML model, as detailed in the user manual.
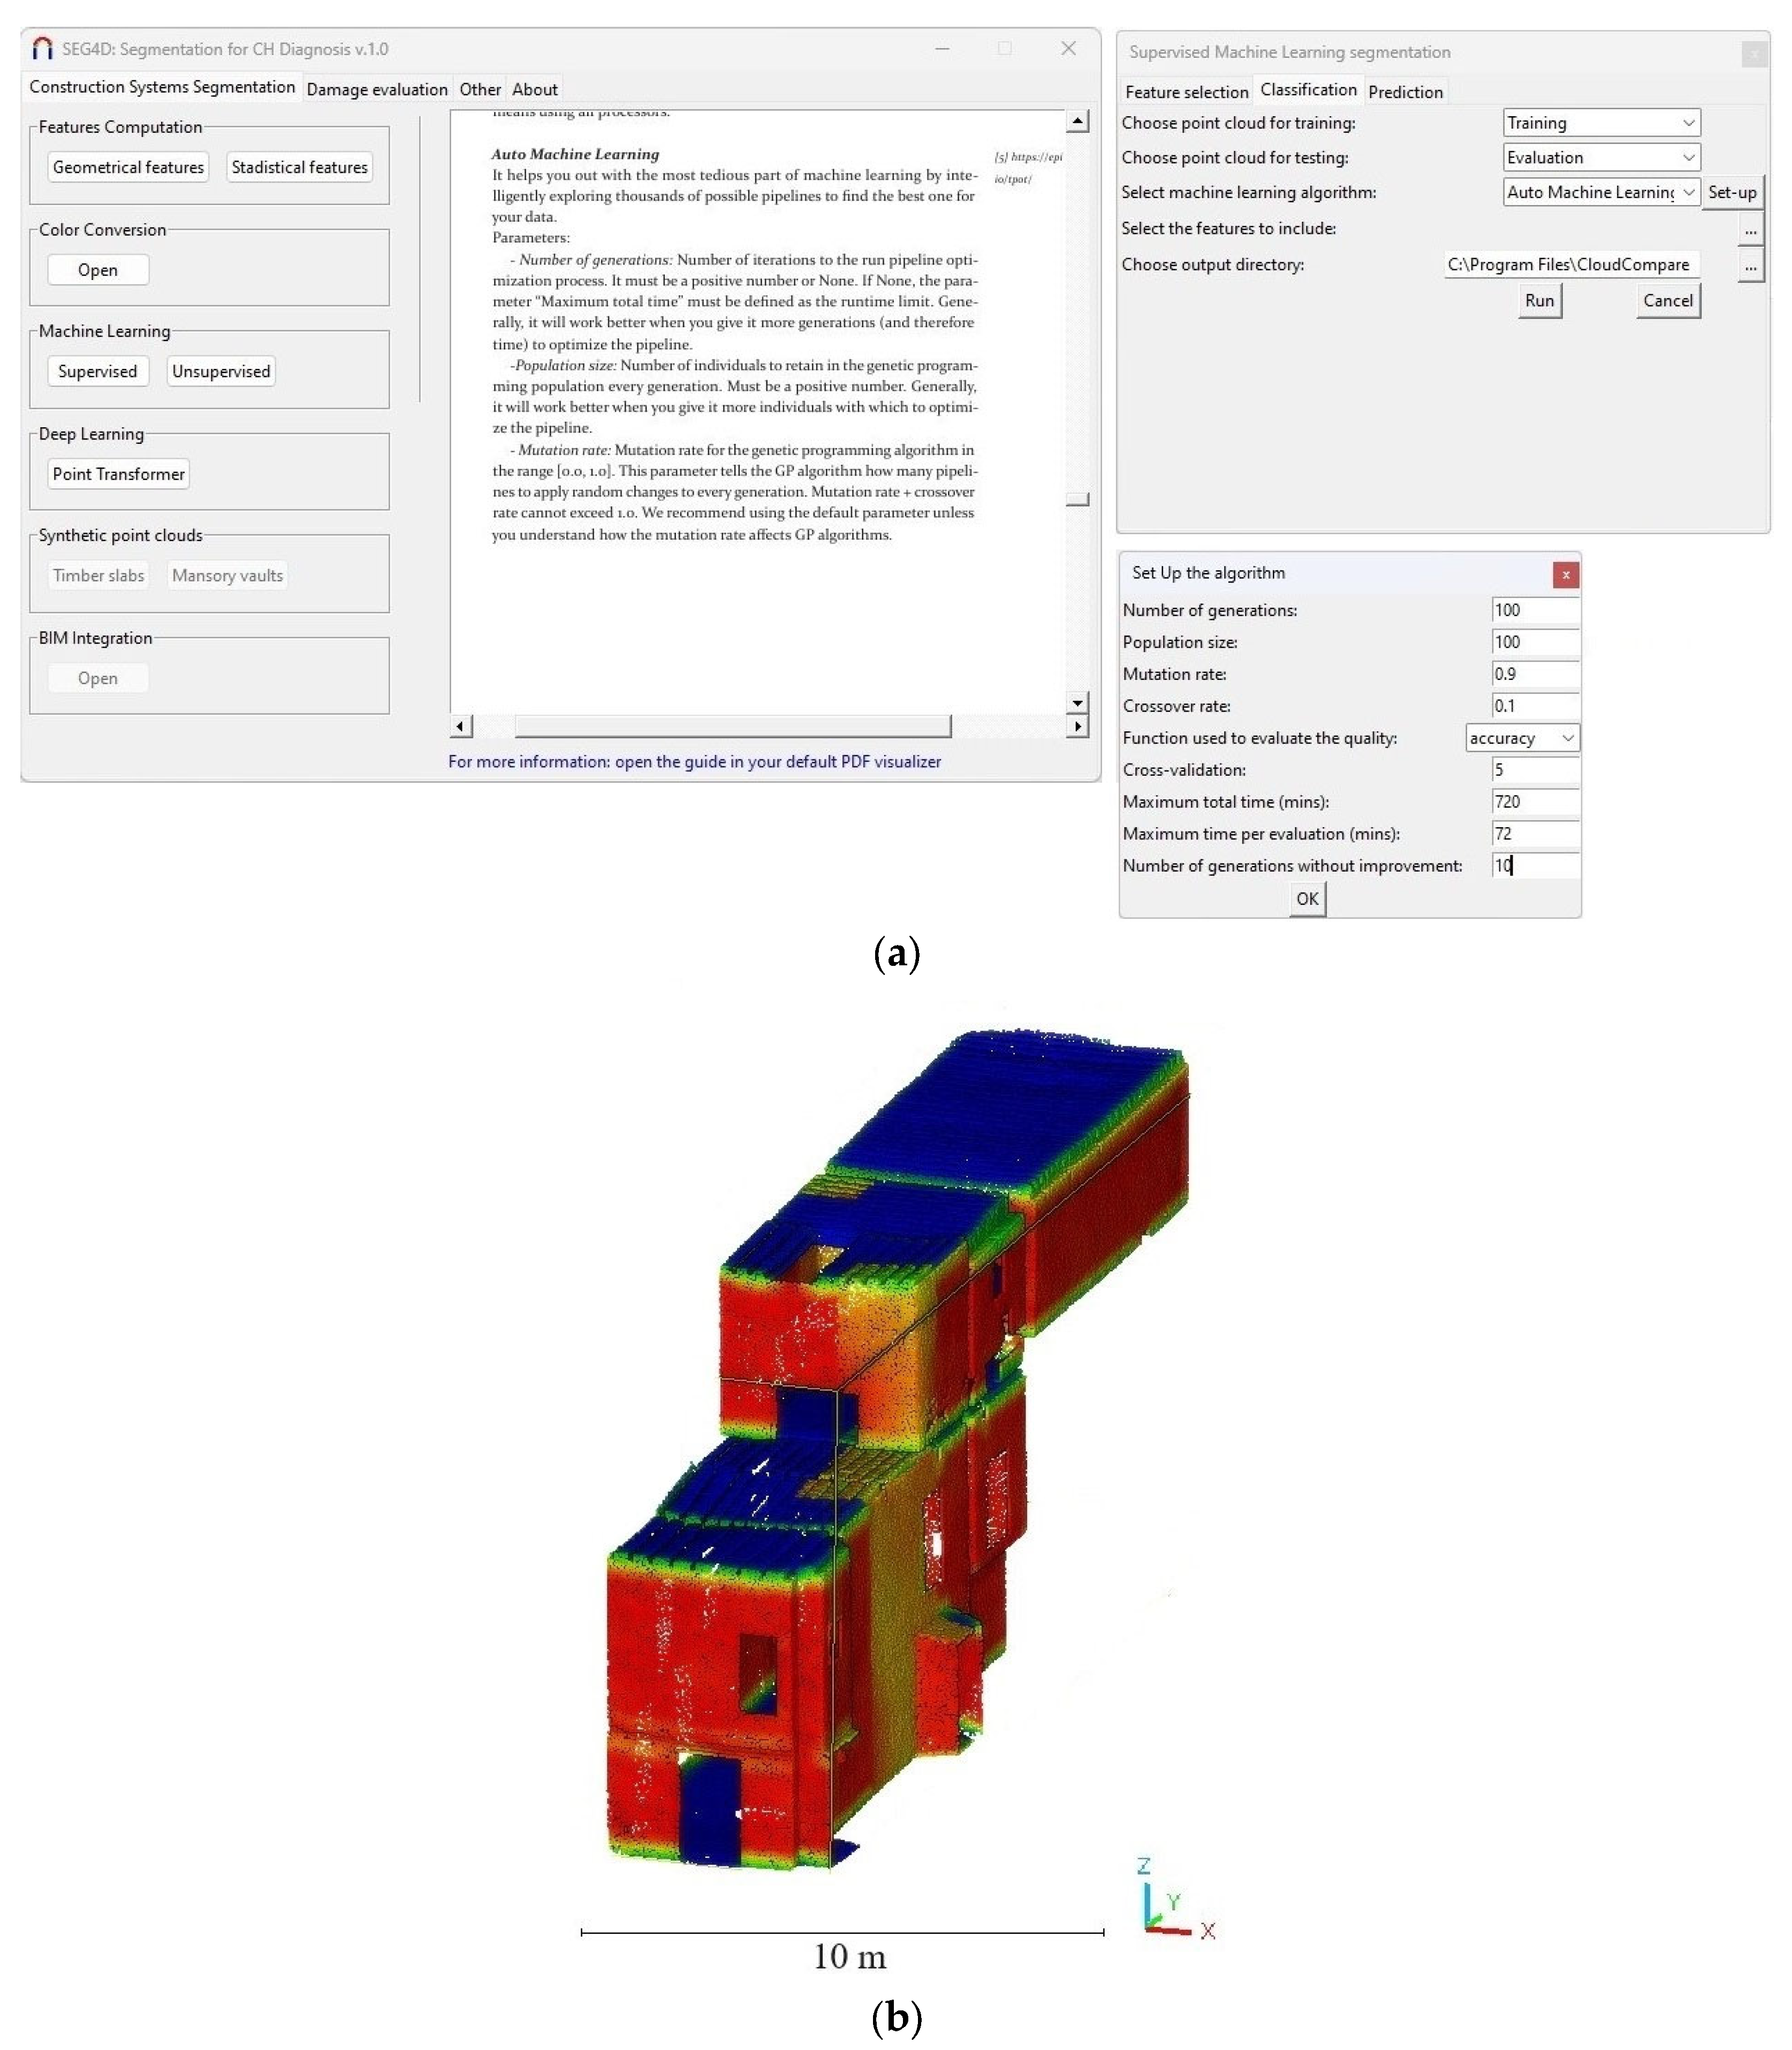
  • Classification: This option allows the setup of supervised ML algorithms. The current version of the software includes the common supervised ML algorithms used in the literature (Random Forest, Support Vector Machine and Linear Regression) [10] as well as an Auto-Machine Learning method. Automated machine learning refers to the process of automating the end-to-end workflow of applying ML algorithms. It involves automating tasks such as feature selection, selection of algorithms and hyperparameter tuning. To this end, the solution integrates the scikit-learn library (https://scikit-learn.org/stable/ (accessed on 7 February 2025)) for the supervised methods and the Tree-based Pipeline Optimization Tool library (https://epistasislab.github.io/tpot/ (accessed on 7 February 2025)) for automated machine learning. This library includes the most relevant ML algorithms and feature selection methods. The process iterates through multiple solutions until it reaches a predefined time limit or the desired level of accuracy. To this end, the approach uses an optimisation method that attempts to maximise a metric of accuracy (i.e., accuracy, precision, f1, etc.) by using a genetic algorithm. The user only needs to define the maximum number of iterations (or a time limit) for the genetic algorithm as well as the metric of accuracy that will be maximised.
  • Prediction: This option enables the application of a previously trained algorithm to an unclassified 3D point cloud. The user needs to select the 3D point cloud to be used and the file containing the parameters of the trained ML algorithm (in .pkl format).
Figure 6. Construction system segmentation conducted by supervised machine learning algorithm on 3D point clouds: (a) appearance of the GUI for different machine learning algorithms, (b) classification and (c) global classification generated by geometric features.
Remotesensing 17 02018 g006
The second group of ML algorithms are the unsupervised ones. These algorithms do not require a labelled point cloud as input. In this sense, the algorithm can be trained by using only a 3D point cloud with the features computed, as well as the number of labels on which the point cloud needs to be split. Like the supervised algorithms, the software integrates various options that include the algorithms to be used (K-means, Fuzzy K-means, DBSCAN, OPTICS, hierarchical clustering), their hyperparameters and several methods for the estimation of the optimal number of labels (the Elbow method, Silhouette method, Csalinksi–Harabasz index and Davies–Boulding index) (Figure 7).
Concerning DL methods, the current version of the plugin implements the well-known Point Transformer Neural Network (PTNN). This NN was initially proposed by Zhao et al. [53] in 2021 for the semantic segmentation of 3D point clouds. It applies self-attention networks to 3D point cloud processing, achieving promising results on several benchmarks such as the S3DIS dataset [54], Model-Net40 [55] and ShapeNetPart [56]. This NN has been extensively applied to different 3D point cloud domains [39,40]. In the case of selecting this option, the user can choose to train a new model or predict the labels on a new 3D point cloud from a previously trained model.
In both approaches, the features of the 3D point clouds are highly relevant (and can be computed with the feature computation module), as is the proper labelling of the 3D point cloud. Currently, there is no consensus regarding the definition of labels (classes) for segmenting a 3D point cloud into constructive systems within the heritage field. The scientific literature presents various classification proposals due to the uniqueness of heritage constructions. According to a recent review by Yang et al. [7], there are only a few public benchmarks that include labelled 3D point clouds of heritage constructions: (i) ArCH [57], (ii) WHU-TLS [58] and (iii) SEMANTIC3D.NET [59]. The only one purely devoted to CH is the ArCH dataset. This benchmark proposes the use of the following 10 classes for labelling a 3D point cloud [60]: (i) arches, (ii) columns, (iii) mouldings, (iv) floors, (v) door/window, (vi) wall, (vii) stairs, (viii) vaults, (ix) roof, and (x) others. This labelling scheme is the result of combining the CityGML, IFC and Art and Architecture Thesaurus proposals [18]. However, this proposal primarily focuses on masonry elements and requires updating to incorporate other relevant construction materials such as timber, steel and concrete. Taking this into consideration, the holistic solution Seg4D proposes to extend the ArCH classification system to include construction systems and elements that appear more frequently associated with timber, masonry, steel and concrete solutions (Figure 8).
The ArCH classification system includes the following classes: (i) arch, (ii) columns, (iii) mouldings, (iv) floor, (v) door/window, (vi) wall, (vii) stairs, (viii) vault, (ix) roof and (x) other. These classes have been incorporated into the new classification proposals, though organised within different elements. All classification trees have been reviewed by experts in diagnosis. Additionally, these classification trees have been validated through experimental testing by applying the software to the diagnosis of various historical buildings. Part of this validation is presented in Section 4.
It is worth mentioning that the classification trees proposed in Seg4D include different levels of classification in line with the multi-level and multi-resolution approach proposed by Teruggi et al. [10]. This approach has been demonstrated to be more efficient than a single-level classification system.
To support model performance evaluation, Seg4D produces several outputs tailored to the type of algorithm used. For supervised machine learning algorithms, Seg4D outputs several quality indices, namely (i) precision (Equation (1)), (ii) recall (Equation (2)), (iii) F1 score (Equation (3)) and (iv) accuracy (Equation (4)), computed per class and globally. Apart from these metrics, Seg4D generates a feature importance graph when the user runs a Random Forest classification (Figure 9a) and a confusion matrix in all the cases (Figure 9c). The feature importance graph allows for evaluating the impact of each feature on the final result. Meanwhile, the confusion matrix allows us to check which points are classified properly (trace of the matrix) and which points are misclassified (rest of values). For DL models, Seg4D also calculates the Intersection over Union (IoU) (Eq.5) in addition to the previous metrics. The evaluation of the IoU metrics is summarised in two plots (Figure 9b): (i) the per-class IoU plot and (ii) the mean IoU (mIoU) plot, the latter representing the average IoU across all classes. These outputs provide both quantitative insights and visual overviews of model performance, enabling fine-grained evaluation and comparison.
p r e c i s i o n = T p T p + F p
r e c a l l = T p T p + F n
F 1 s c o r e = 2 r e c a l l p r e c i s i o n r e c a l l + p r e c i s i o n
a c c u r a c y = T p + T n   T p + T n + F p + F n
I o U = T p T p + F p + F n
where Tp = true positive, Tn = true negative, Fp = false positive, Fn = false negative.

3.2. Damage Detection Tab

This tab is dedicated to damage detection using 3D point clouds as input, typically generated through construction system segmentation. This segmentation allows for the application of different strategies in a more efficient manner, thereby reducing time investment. The tab is divided into two columns. The left column includes different processing modules. Meanwhile, the right one includes a brief guide in PDF format that provides access to the recommended damage atlas (Figure 10).
It is worth mentioning that the PDF guide was created with the aim of facilitating proper damage detection in 3D point clouds. To this end, the damage is classified in accordance with the proposal of Sánchez-Aparicio et al. [8]. This classification framework draws inspiration from the illustrated glossary of ICOMOS for stones [60], which classifies damage according to its appearance. It is summarised as follows (Figure 11). Each type of damage is defined in a unique sheet that includes relevant fields such as a short description, some images, the algorithms that could be used to detect this damage or some related publications. Regarding the last point, Seg4D was built upon the classification of methodologies proposed by Sánchez-Aparicio et al. [8] (Table 1). As the reader can observe, Seg4D allows the application of all the strategies, extending the current capabilities of CloudCompare.

3.2.1. Feature Computation, Colour Conversion, Machine Learning and Deep Learning Modules

The first four modules of the damage detection tab are identical to those included in the construction system tab. This is due to the possibility of applying the same algorithms for damage detection as for constructive segmentation, as noted by Sánchez-Aparicio et al. [8].

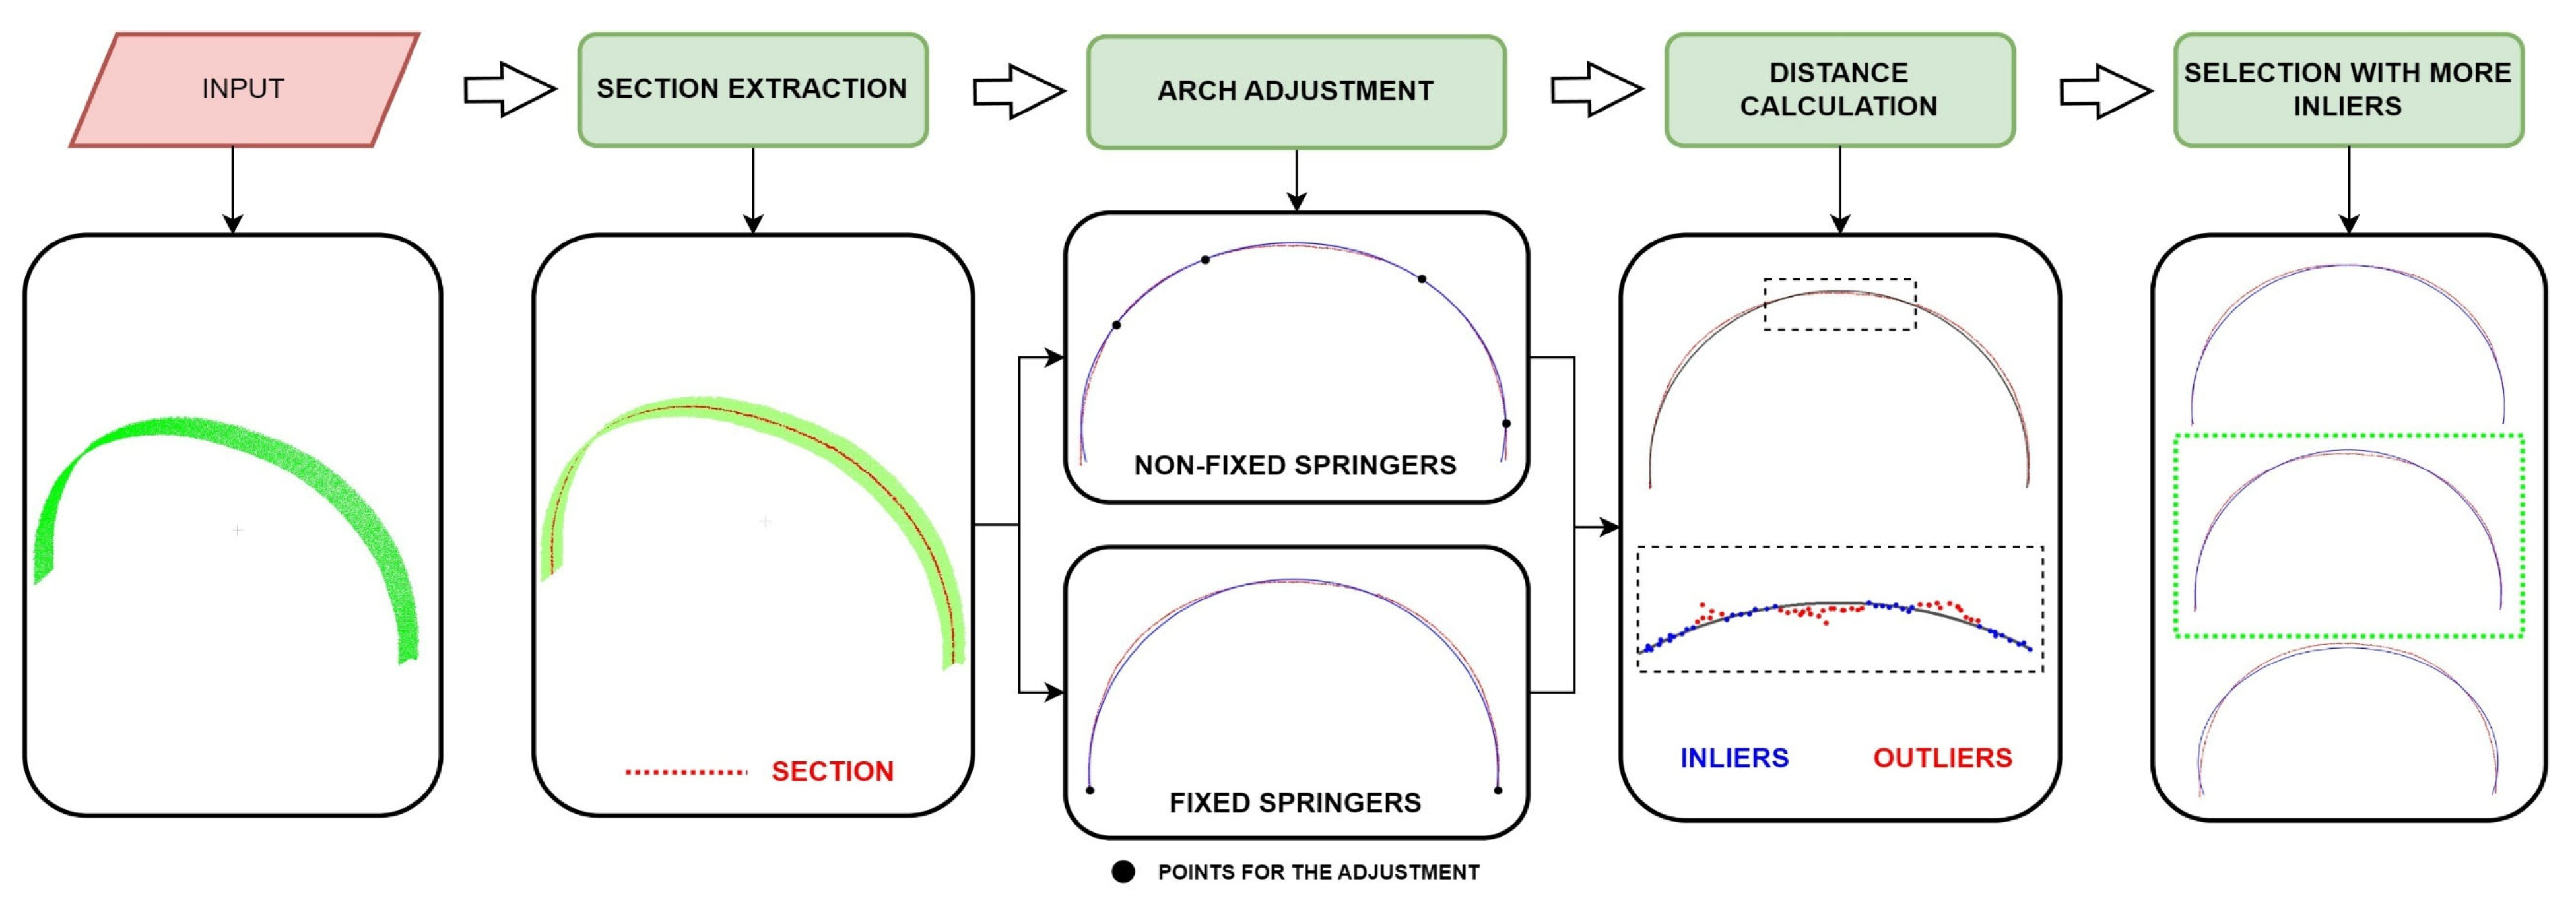
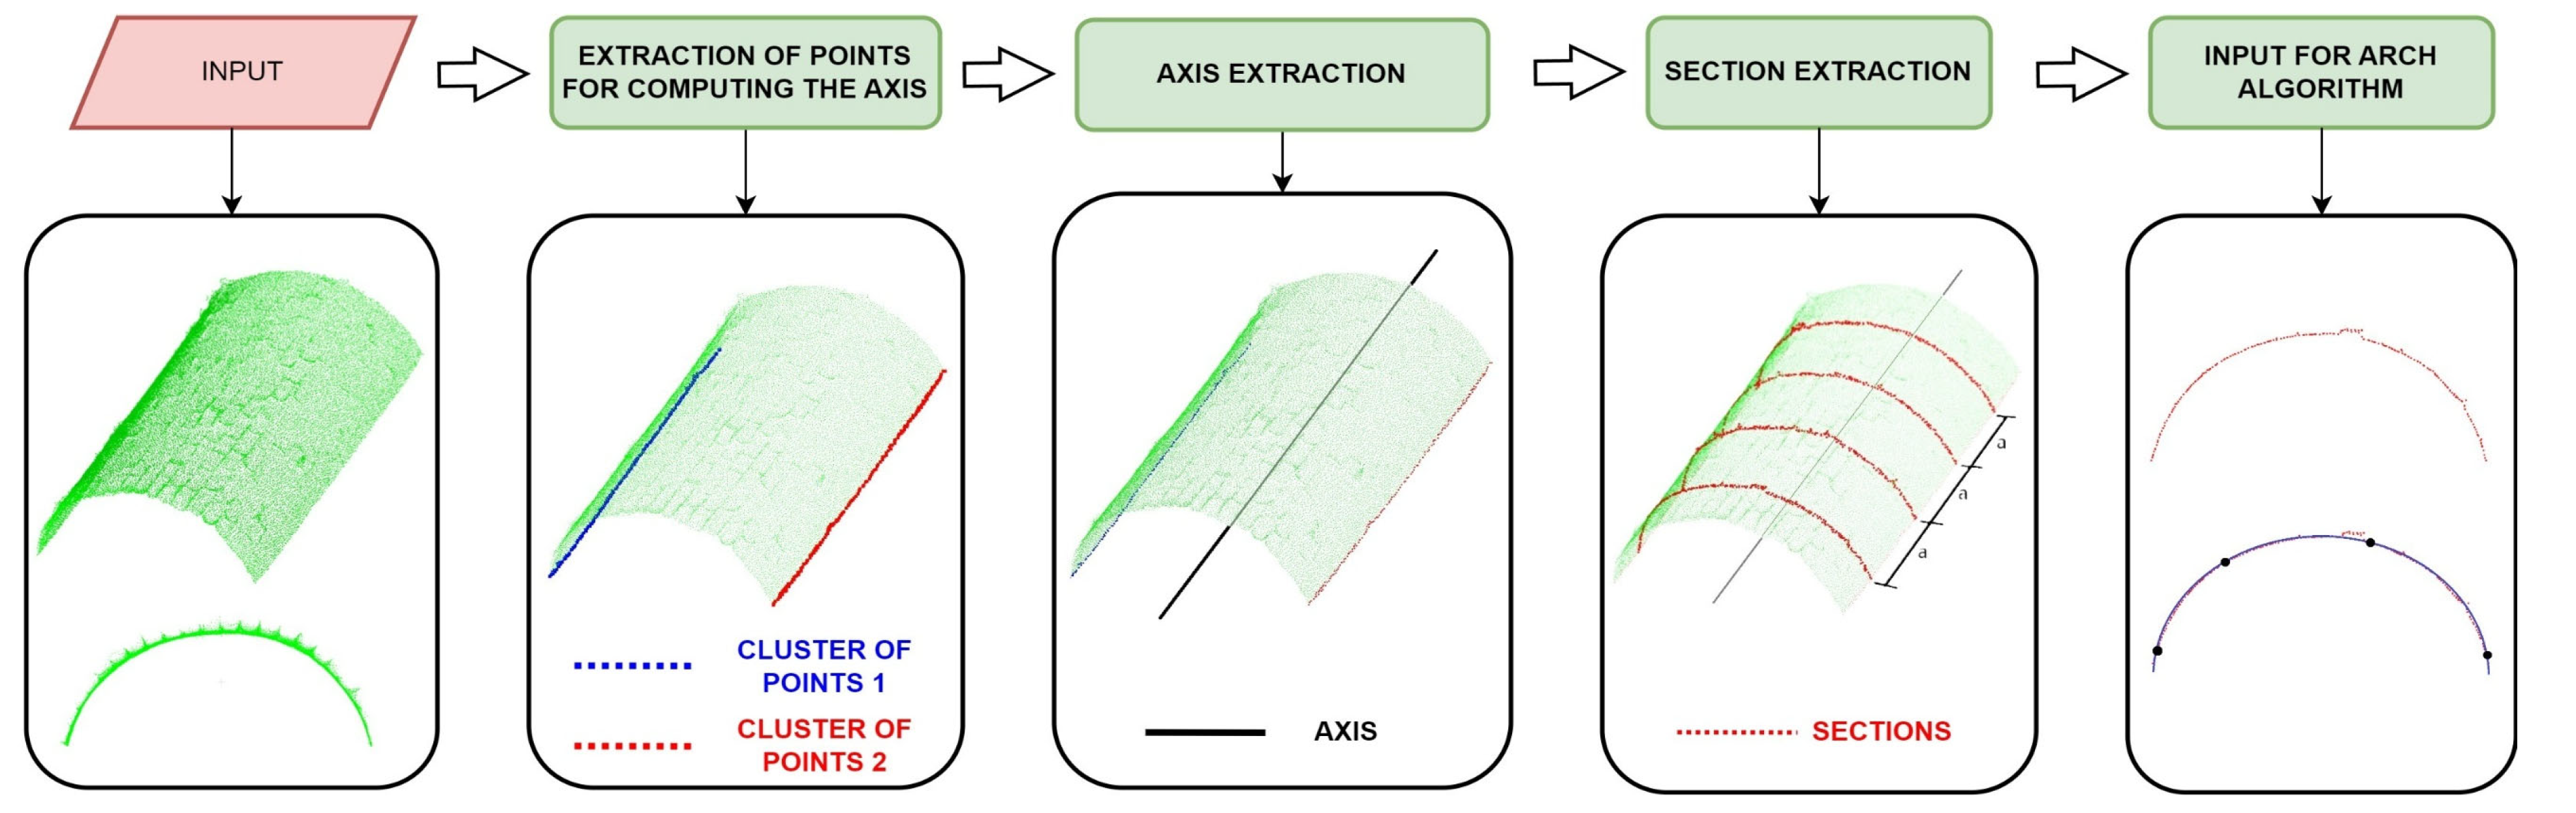
3.2.2. Module for Analysing the Deformation in Arches and Vaults

This module is devoted to helping in the evaluation of deformations and cracks in arches and vaults.
In the case of arches, Seg4D applies the methodology illustrated in Figure 12. This approach is based on previous studies that have demonstrated its effectiveness [61,62]. To this end, Seg4D estimates the best-fitting arch by applying the RANSAC approach to a section of the 3D point cloud using an adaptation of the method outlined in [63]. This algorithm, whose strategy is represented in the publication, can help in estimating arch deformations, as demonstrated in various studies. Apart from the traditional setup of the RANSAC algorithm, Seg4D allows the user to choose the type of arch to be computed. The current version of the software allows the computation of semi-circular, segmental, and pointed arches. Additionally, it is possible to consider the springs of the arch as fixed. This option considers only the springing line of the arches for computing the model if the supports of the arches remain fixed. In this sense, the user needs to define a percentage of the height that will be considered as the springing line.
In the case of the vaults, Seg4D proposes an extension of the previous approach. In this case, it is assumed that the stability of a vault can be defined by the stability of the arches that comprise the system [64]. According to this, the algorithm begins by extracting the springing line of the vault using a user-defined threshold. Then, the algorithm creates the central axis of the vault by approximating the data to a spline curve. Several sections of the vault are then extracted along this axis, with each section being perpendicular to the spline curve in this zone. To this end, the first derivative is computed, and then the normal vector to the derivative is estimated. Finally, the algorithm applies the arch estimation strategy to extract the deformation of the vault. Figure 13 graphically represents this algorithm. The current version of Seg4D allows the application of this methodology to barrel vaults.
The main output of this module is a set of images (one per arch or one per section of the vault) that highlights the deformed parts (outliers) in accordance with the RANSAC estimation (Figure 14).

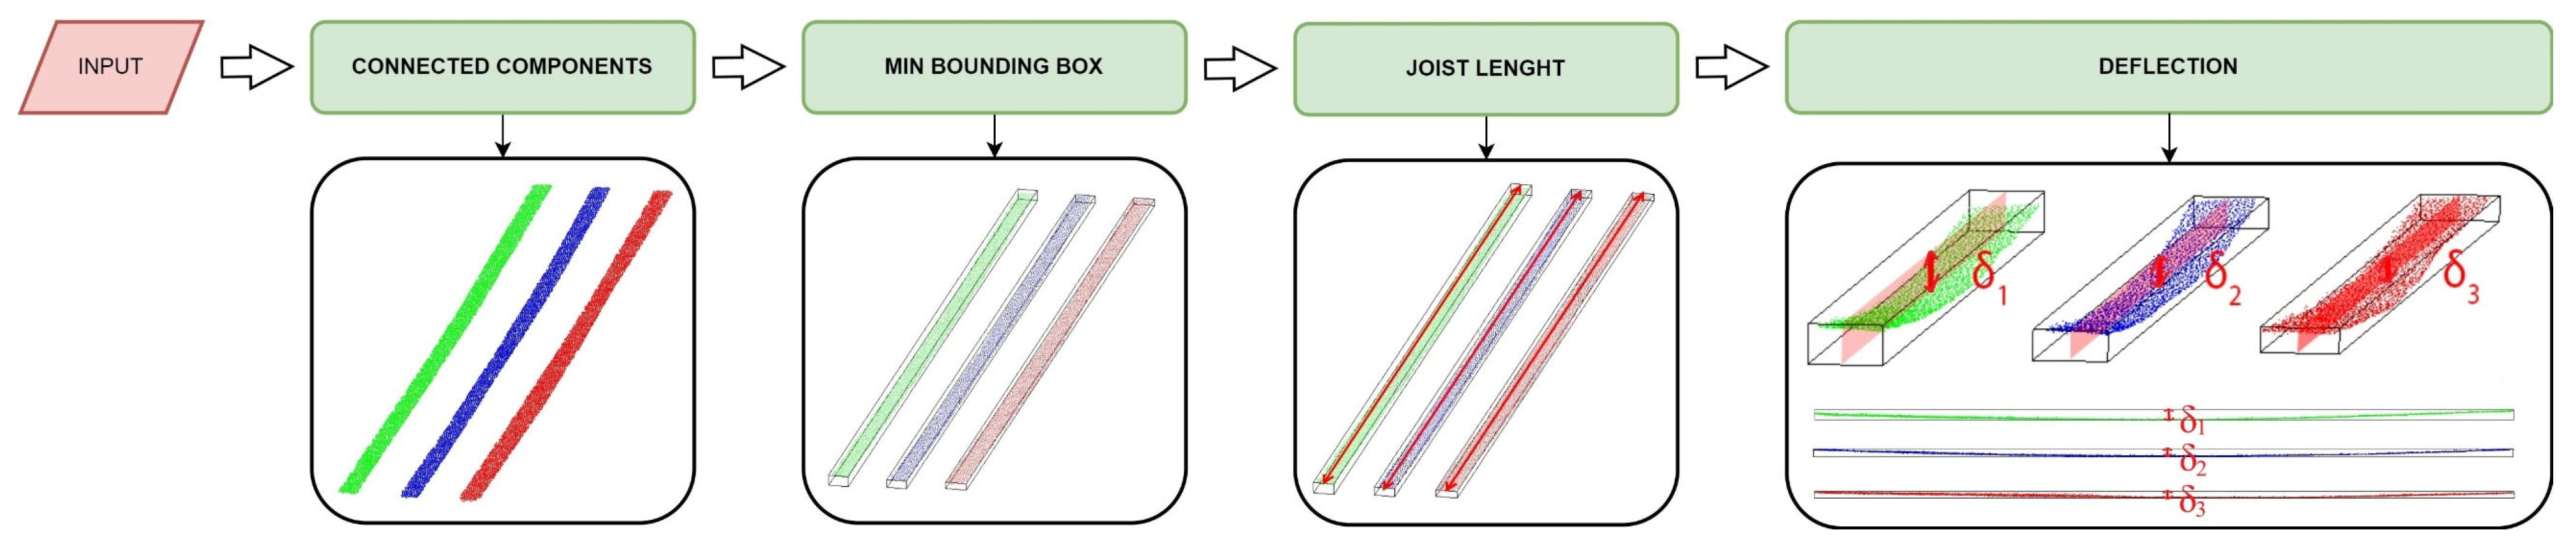
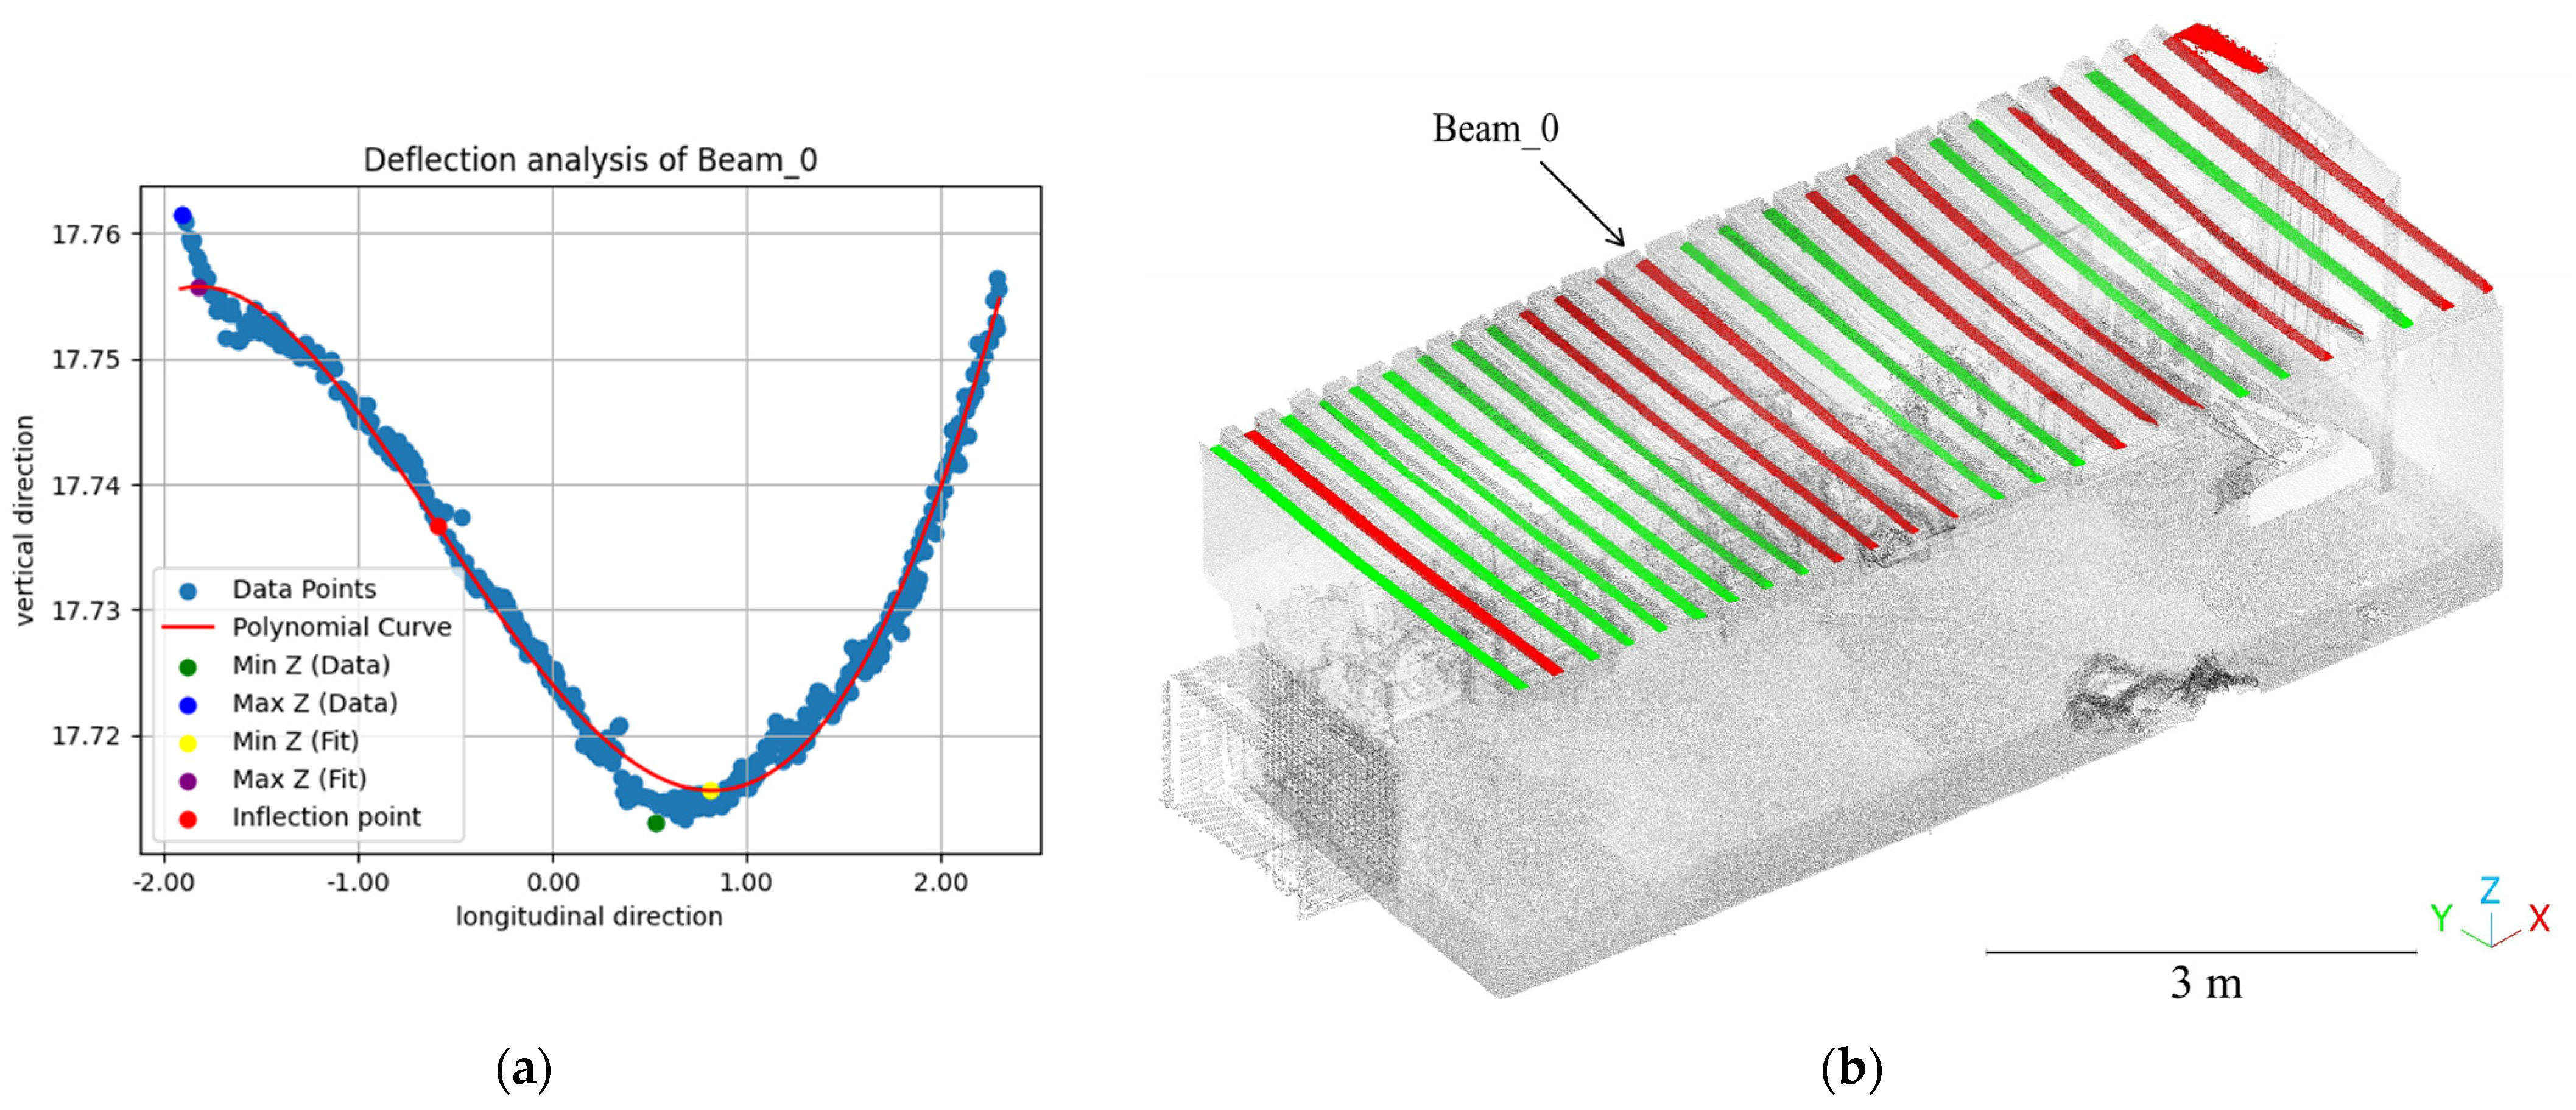
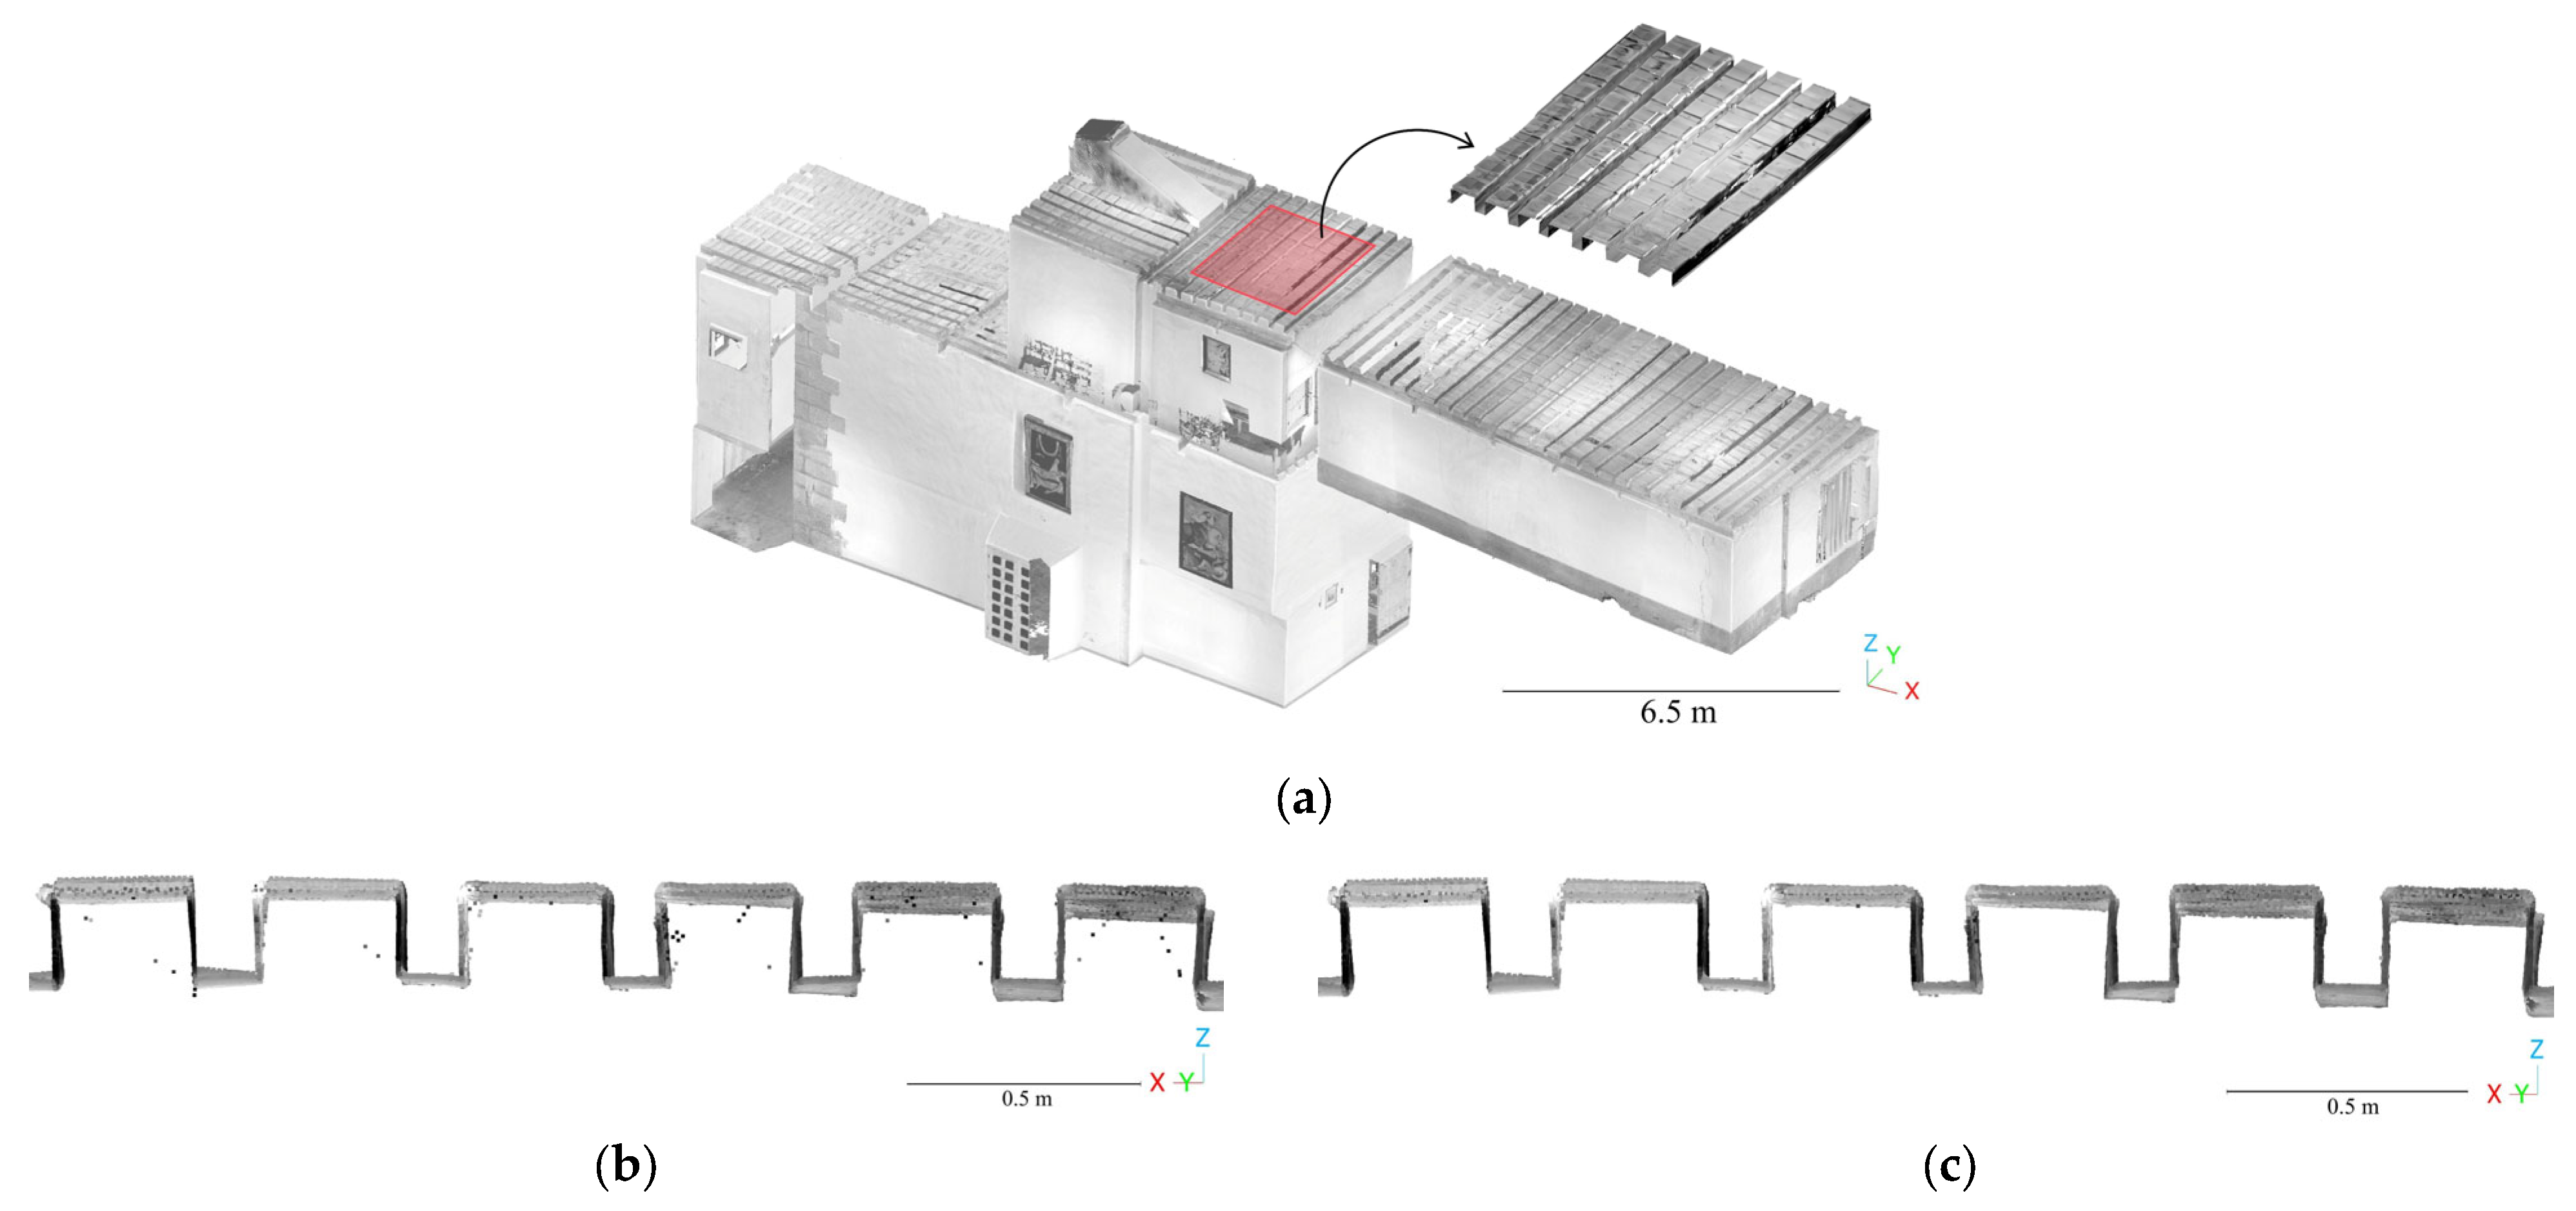
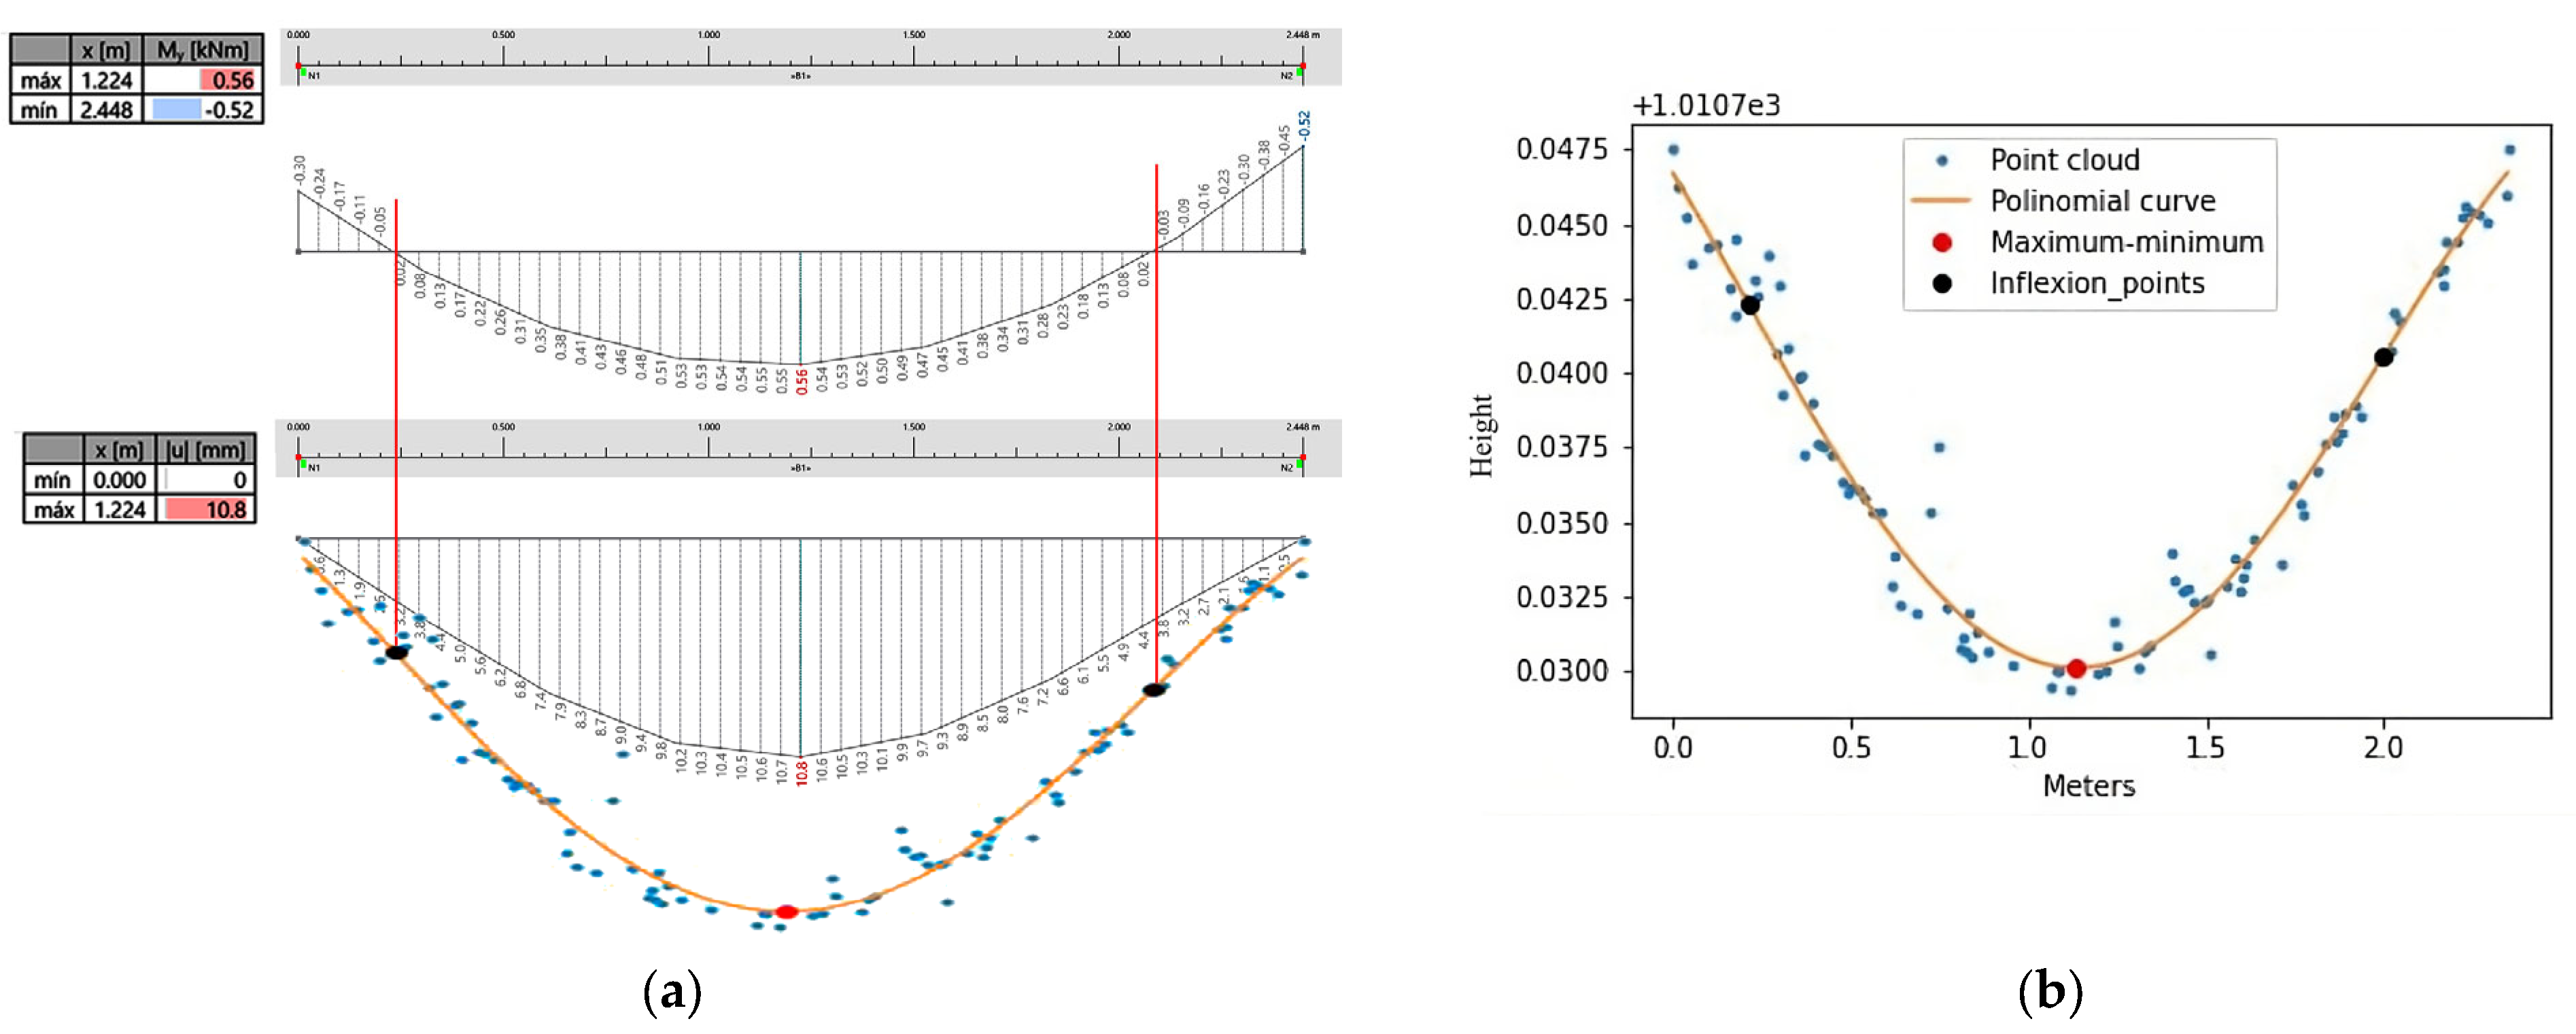
3.2.3. Module for Analysis of the Deflection in Slabs

This module allows the extraction of the deformation profile in beams, including the maximum deflection point, the best-fit polynomial curve and the inflection points. Figure 15 provides a graphical representation of the process followed for this algorithm. To compute this algorithm, the lower face of each beam (which can be extracted from the construction segmentation module) is required, as is the maximum allowable relative deflection. The outputs are the plot with the deformed shape and its best-fitting curve, as well as a new scalar field on the 3D point cloud, where the value of 0 is assigned to all beams whose deflection is below this threshold and 1 to all beams whose deflection exceeds it (Figure 16). This allows the inspector to quickly evaluate which beams meet the deflection requirements.

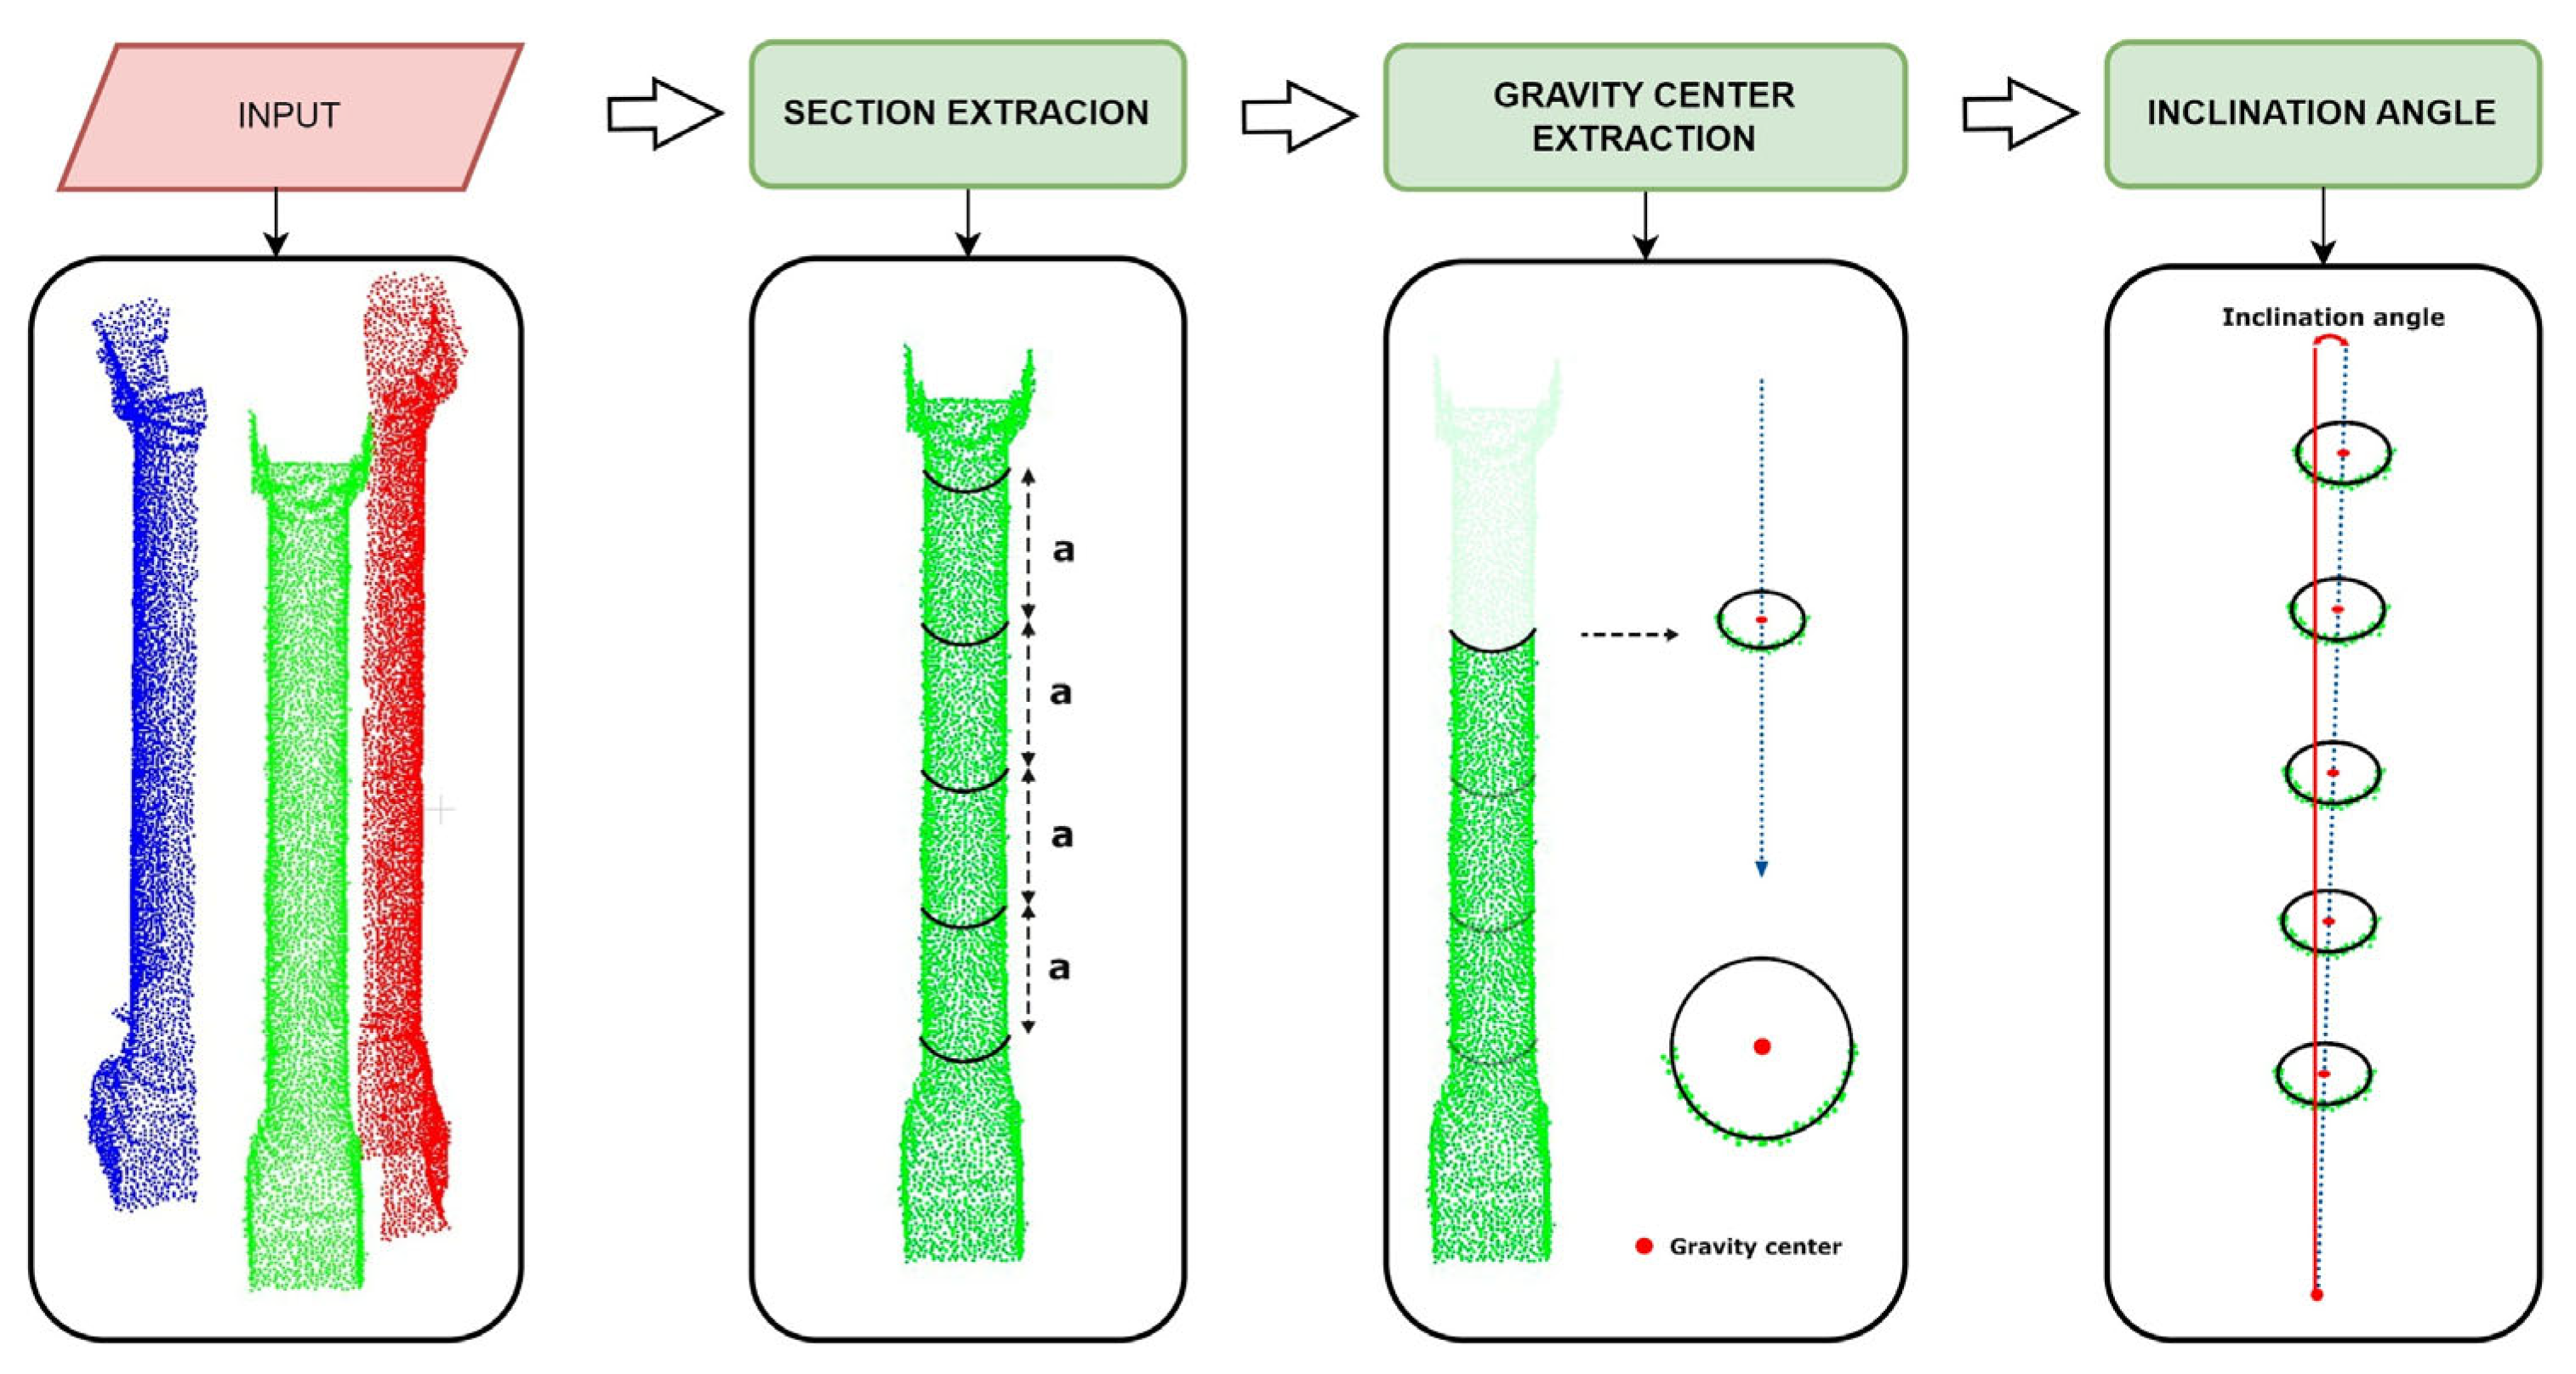
3.2.4. Module for Analysis of the Inclination in Columns and Buttresses

This algorithm allows for evaluating the inclination profile of vertical elements such as columns or pillars by the approach illustrated in Figure 17. The input consists of the vertical elements in independent point clouds. This can be obtained by using the constructive section tab (for the detection of elements as well as for the instance segmentation). Apart from this, the user should define the space between vertical sections, the fitting strategy of each section and the maximum allowable inclination. The output of this module is a graph of the inclination as well as a new scalar field on the 3D point cloud. This scalar field will have a value of 0 if the vertical element meets the maximum allowable inclination and 1 if the vertical element exceeds it. Thanks to this, the inspector can rapidly evaluate which elements meet the tolerance values.

3.3. Other Algorithms Tab

This is the last tab of the current version of Seg4D. It is devoted to including other algorithms that could be useful within the field of 3D point clouds applied to heritage buildings. This tab is built by following the same structure as the others. On the left is a column with different modules. On the right is a column with a guide in PDF format for properly applying the algorithms.
Currently, Seg4D includes three modules (Figure 18): (i) noise reduction, (ii) point cloud voxelisation and (iii) Potree converter.

3.3.1. Noise Reduction Module

In this module, the user can reduce the amount of noise in a 3D point cloud. The current version of Seg4D implements the anisotropic filter proposed by Xu and Foi [65]. This algorithm can reduce Gaussian noise in 3D point clouds while preserving sharp edges and ensuring smooth surfaces. Thanks to this, it has been applied in the heritage field in several case studies [17,66] (Figure 19).

3.3.2. Point Cloud Voxelisation Module

The user can reduce the complexity of a 3D point cloud by subsampling the points according to the distance between them or by voxelising the 3D point cloud. The latter allows the conversion of an irregular 3D geometry (typical of a 3D point cloud) into a regular 3D grid. This method of data representation simplifies complex 3D data and facilitates the efficient processing and analysis of such data, as demonstrated by Yang et al. in their systematic review [7].

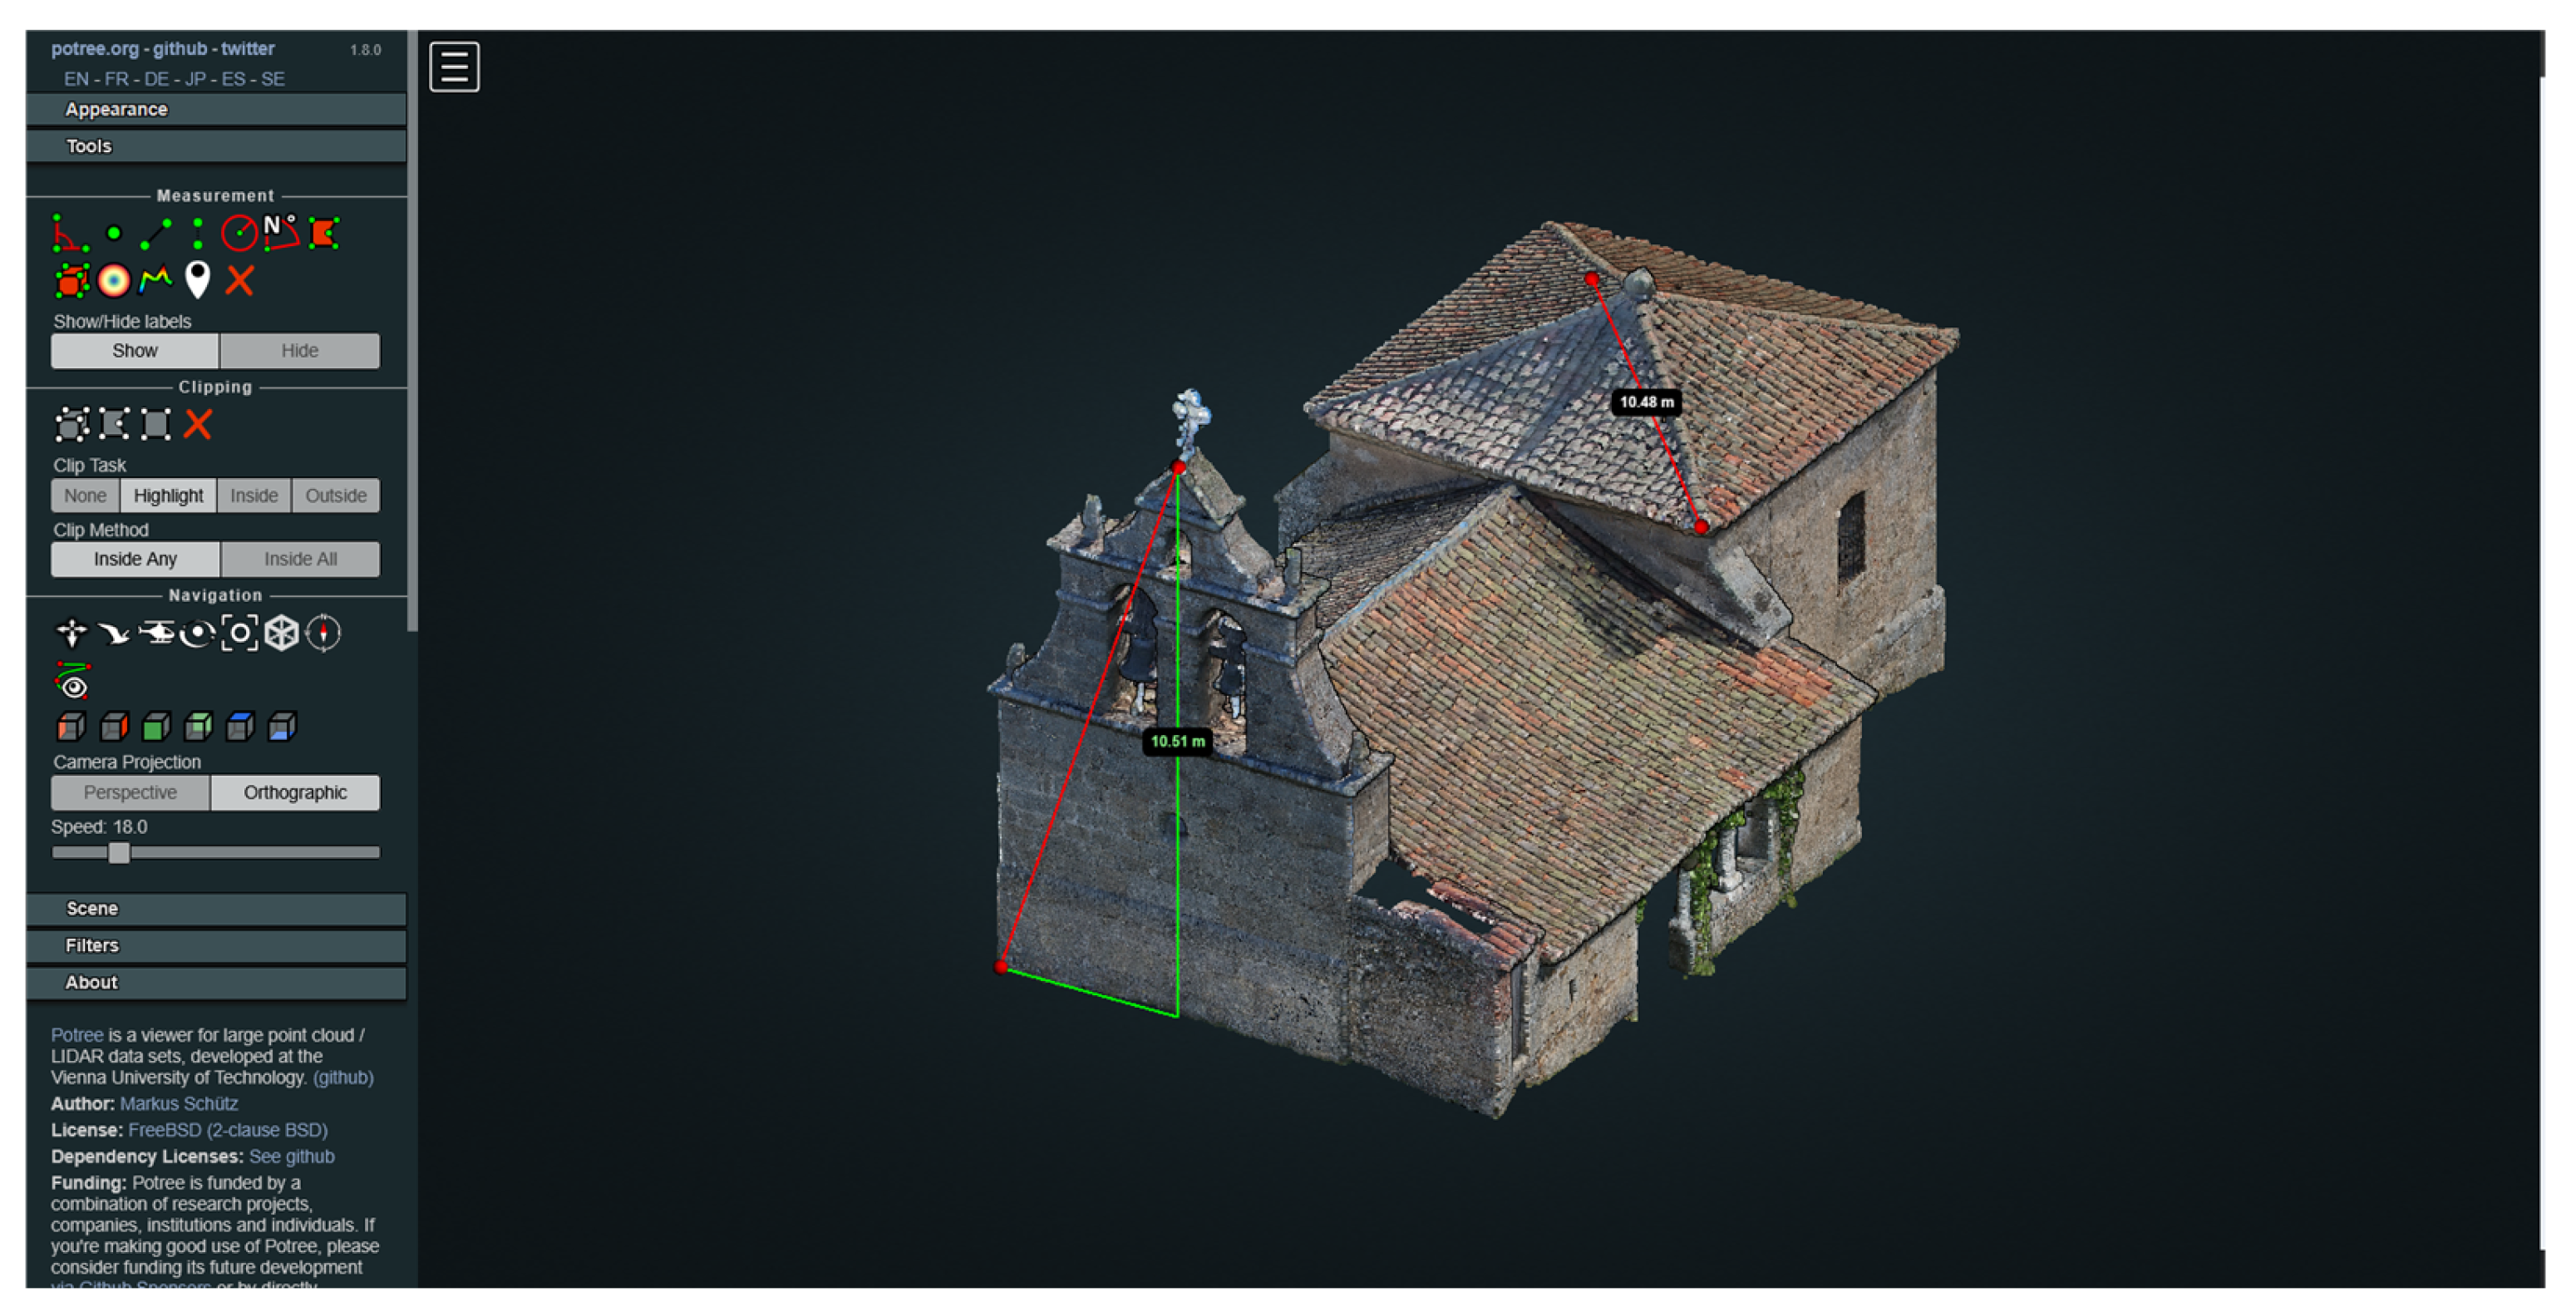
3.3.3. Potree Converter Module

Potree® is a web-based point cloud viewer (https://github.com/potree/potree (accessed on 7 February 2025)) widely used in the heritage field as demonstrated by Gaspari et al. [67]. This is due to the ability to handle large 3D point clouds thanks to its pyramidal loading scheme. Additionally, this visualiser allows various metric operations (measures or volume calculation), interactive sections and the visualisation of different scalar fields within the 3D point cloud. Based on this, this button enables the conversion of a 3D point cloud to the Potree format with all the web-based libraries needed for online visualisation. This tool also features several metric functions such as measuring point coordinates, lines, volumes or areas (Figure 20).

4. Experimental Results

This section presents the results obtained using the holistic software solution Seg4D in different study cases. The objective is to demonstrate the potential of the application for supporting the diagnosis of historical constructions. The selected applications cover a wide range for evaluating the performance of Seg4D in real, complex environments. For each case, an evaluation of the quality and level of automation of the process is provided.

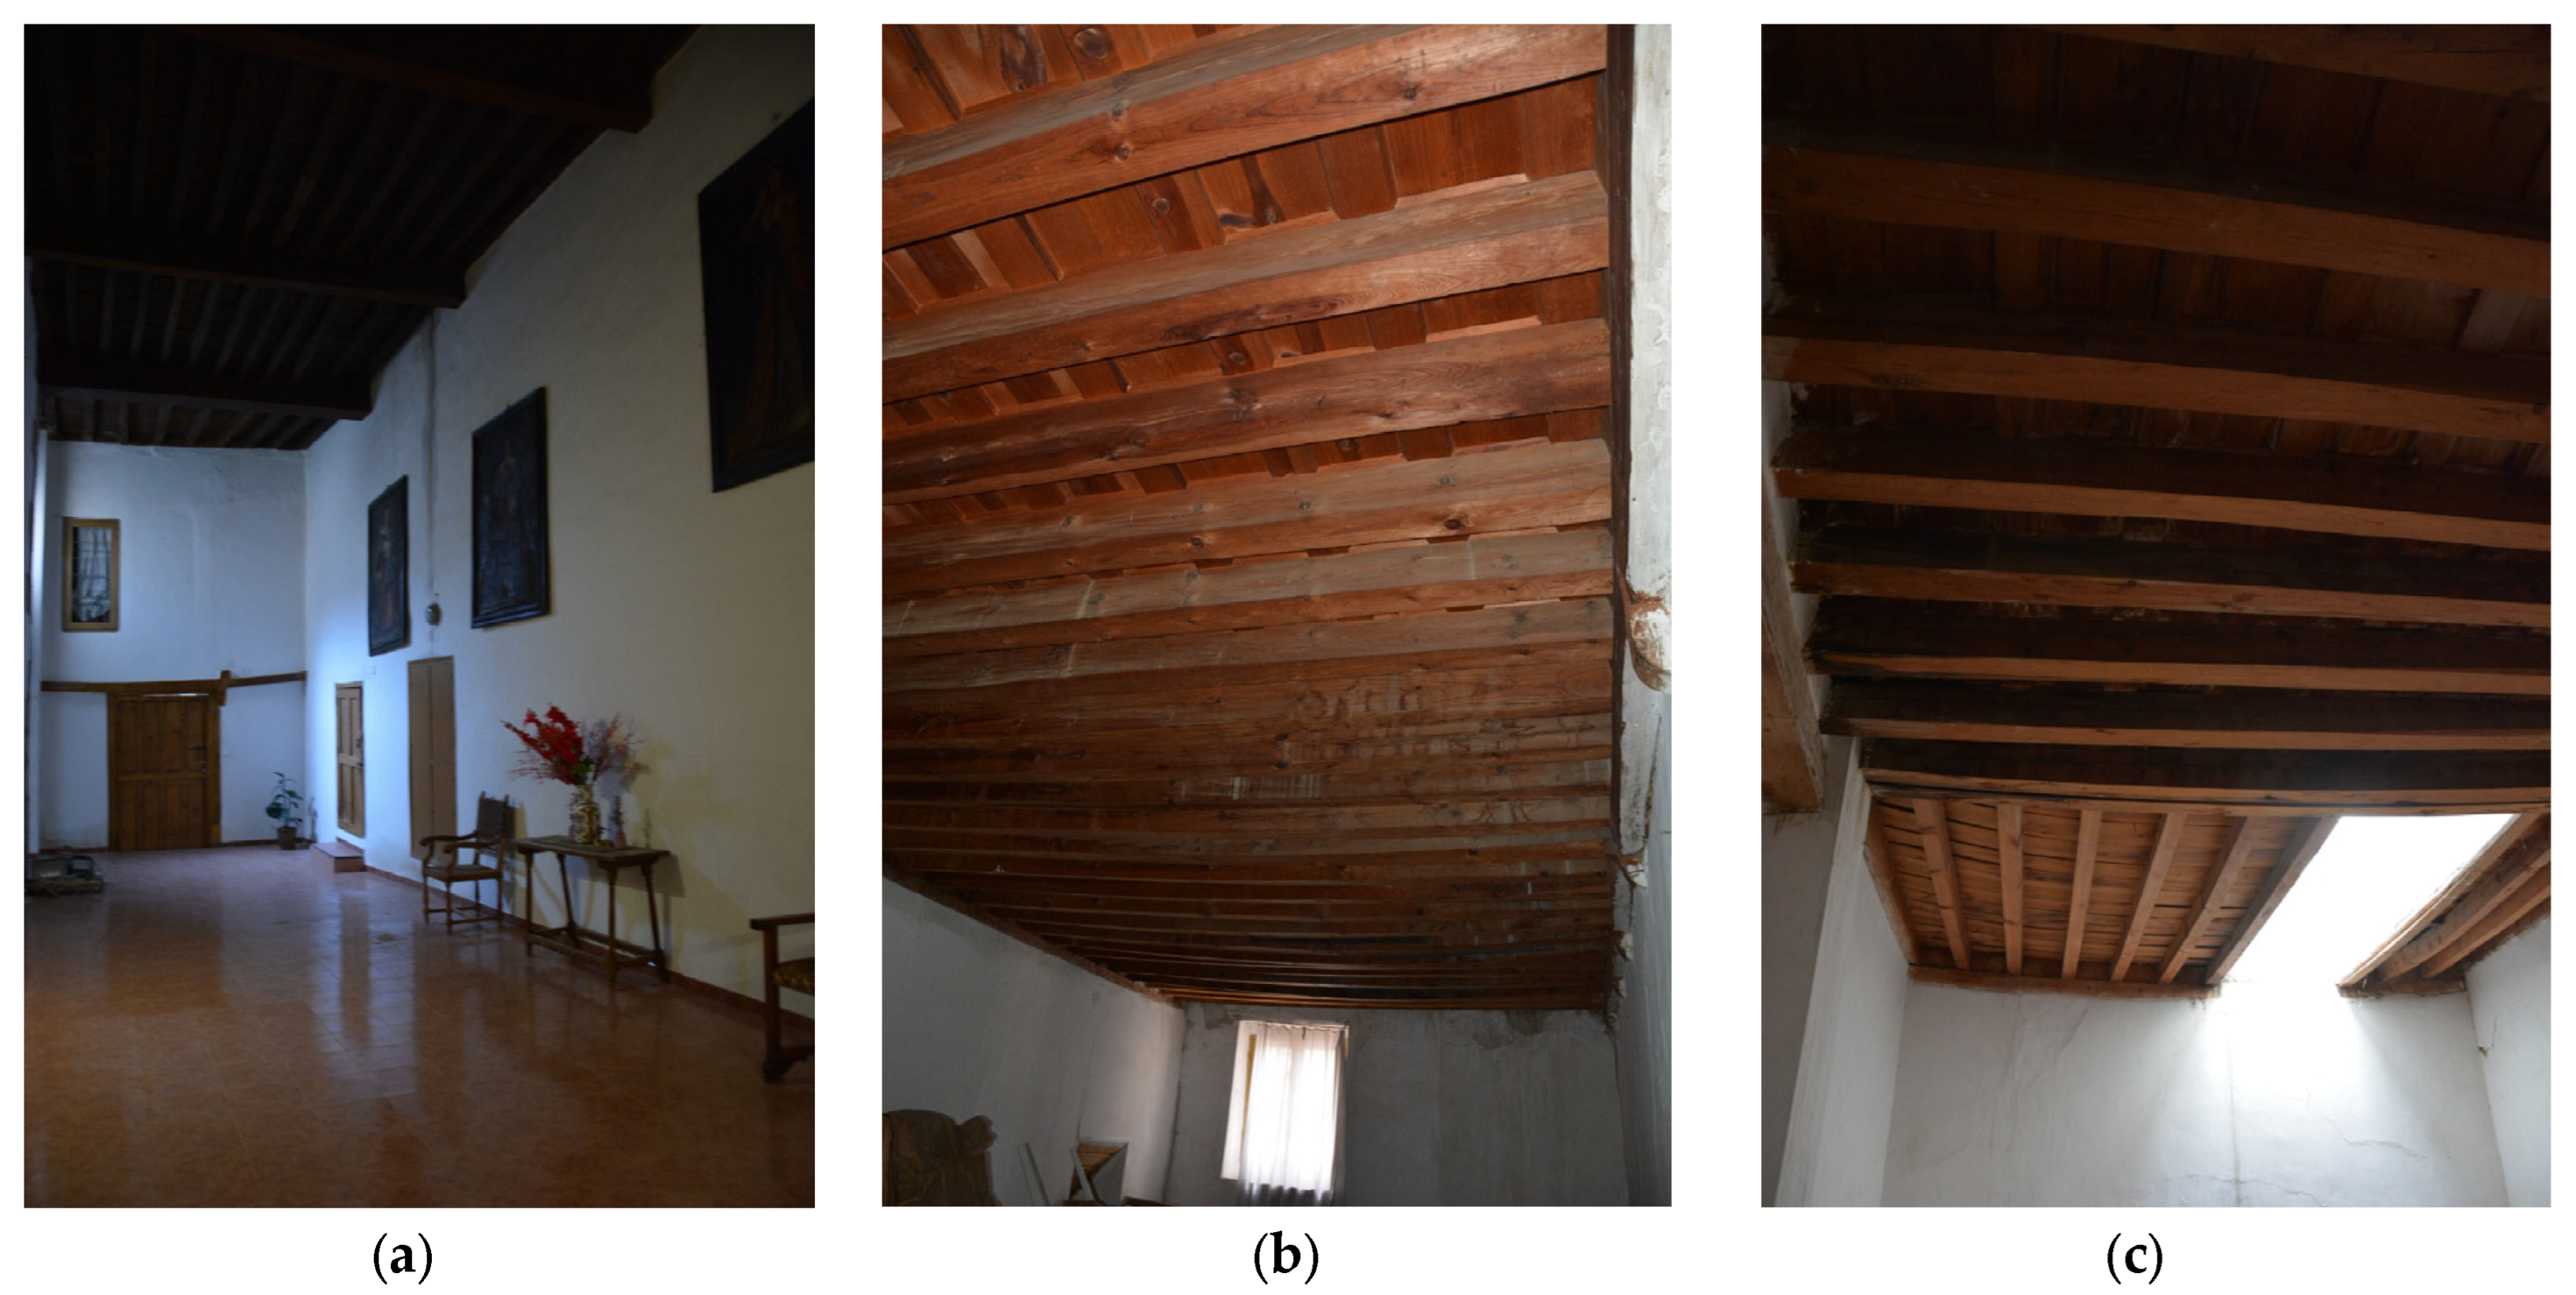
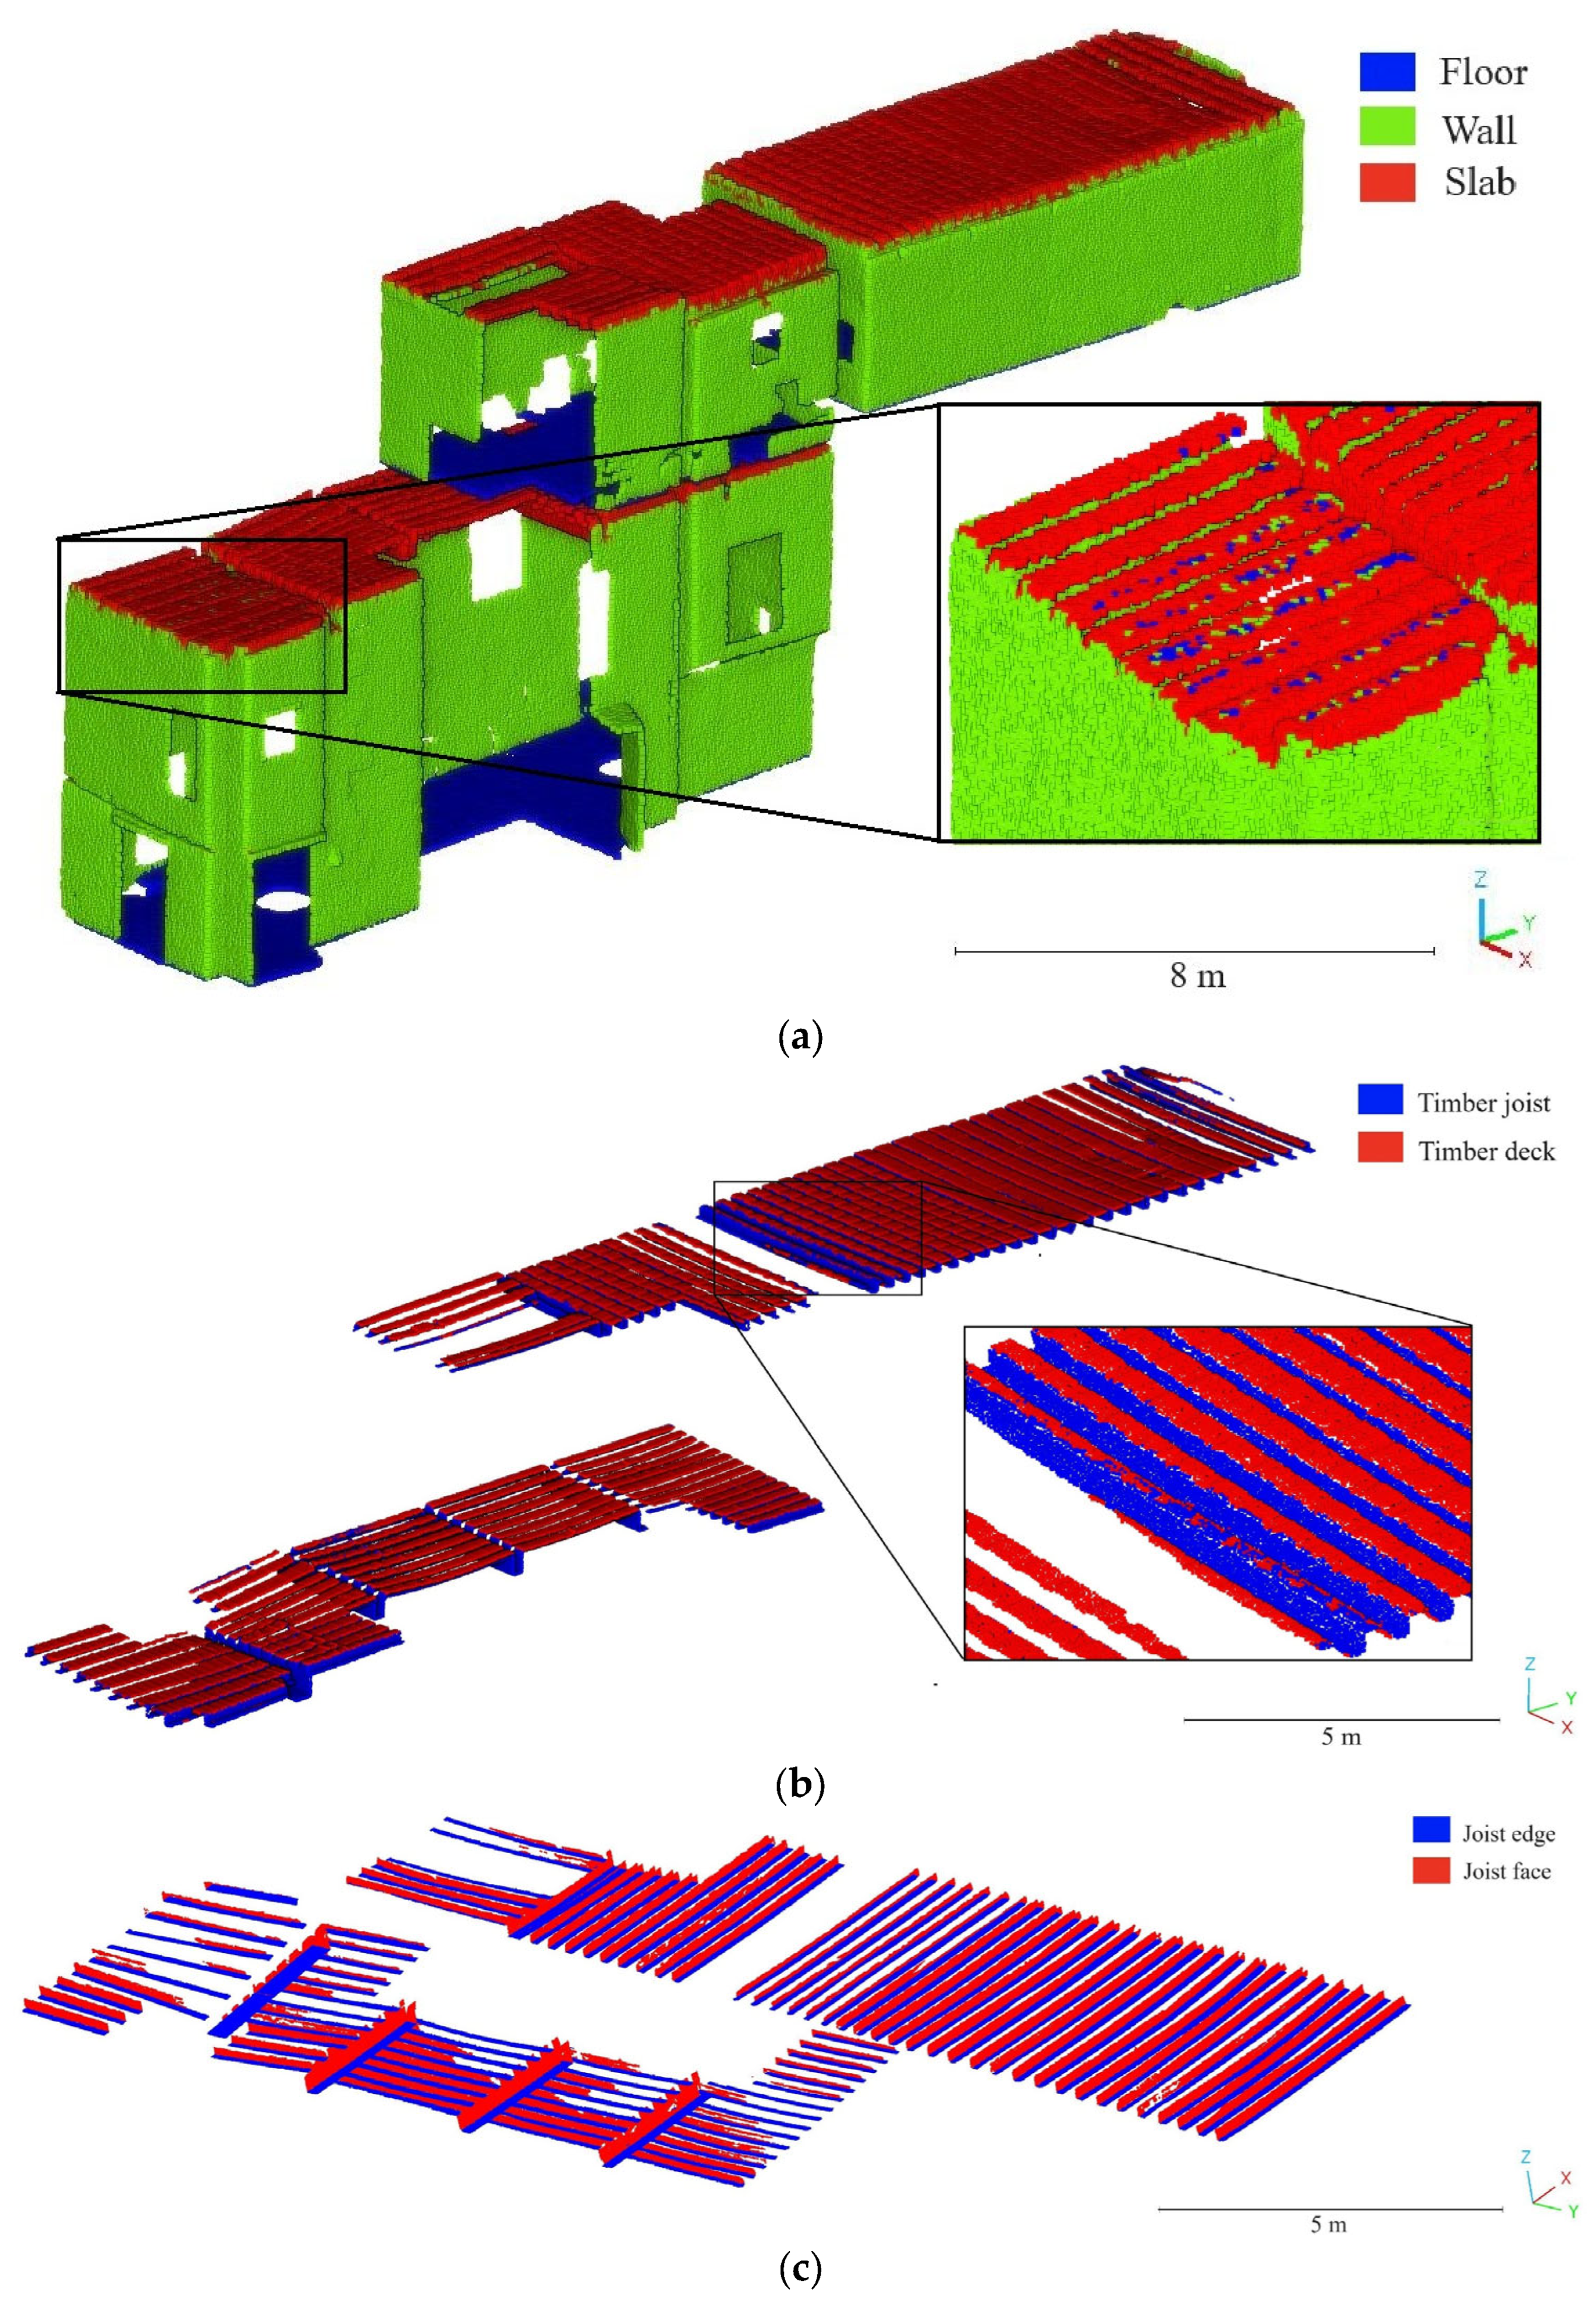
4.1. Evaluation of Deflection in Timber Slabs—Nuestra Señora de Gracia Convent

The chosen case study for evaluating the deflection algorithm in timber floors is the Nuestra Señora de Gracia convent in Avila, Spain. This historical architectural complex has been preserved since the 16th century and has undergone various modifications up to the 20th century. The structure consists of masonry walls and timber floors (Figure 21). For further information, readers are encouraged to refer to Villanueva-Llauradó et al. [68].
The software Seg4D was applied to selected timber slabs, specifically two that exhibited significant deflection issues related to the Serviceability Limit State. The primary aim of using this software is to support decision-making for architects and structural engineers. On the one hand, it is required to identify which beams do not meet the deflection requirements. On the other hand, it is also essential to analyse the deformation curve (including maximum deflection and inflection points) to determine if the numerical analysis aligns with experimental results; this second analysis allows for identifying beams that may have strength issues concerning the Ultimate Limit State. To this end, the 3D point cloud obtained during the experimental campaign conducted by Villanueva-Llauradó et al. [68] was used. This 3D point cloud was captured with a high-accuracy terrestrial laser scanner (TLS).
Initially, extraneous elements lacking contextual relevance, such as ornamental motifs or entities, were removed. Subsequently, the 3D point cloud underwent a process of subsampling across varying resolutions under the classification trees proposed in Figure 8. Finally, discernible features were derived (Figure 22).
For the segmentation of construction systems, an Auto-Machine Learning algorithm from Seg4D was applied at each level of the 3D point cloud, utilising the enriched 3D point cloud as input. The TPOT script was configured with the following parameters (Figure 23): (i) number of generations (100), (ii) population size (100), (iii) mutation rate (0.9), (iv) crossover rate (0.1), (v) function used to evaluate the quality (accuracy), (vi) cross-validation (5), (vii) maximum total time (720 min), (viii) maximum time per evaluation (72 min) and (ix) number of generations without improvement (10). The input features used in this case were intensity, relative position and the geometrical features computed (e.g., Sum of eigenvalues, Omnivariance, Eigenentropy, Anisotropy, Planarity, Linearity, Surface variation, Sphericity, Verticality) with their respective search radii (from 0.1 to 1.6 for the first level, 0.05 to 0.8 for the second level and 0.025 to 0.4 for the third level of classification). It is noteworthy to mention the use of a distinctive feature, which is the relative_position. This binary feature represents the position of each point within the 3D point cloud with respect to the laser scanner, with a value 0 if the point is below the laser scanner and 1 if it is above.
The Auto-Machine Learning algorithm enables the acquisition of a configuration with a nearly perfect quality index based on various ML strategies. These strategies include (i) a stacking estimation based on the Bernoulli Naive Bayes approach, (ii) a feature selection based on an ExtraTrees classifier and (iii) the Random Forest algorithm for 3D point cloud segmentation. The output indices are represented in Figure 24 and Table 2.
The third-level segmentation enables the extraction of joist faces with high accuracy, requiring only minor adjustments by the user to ensure proper input for deflection estimation, demanding a low time investment in comparison with a fully manual segmentation by the user. This indicates that the process can be fully automated. Subsequently, instance segmentation of the joist faces was conducted using the DBSCAN algorithm. Finally, the deflection curve, along with the corresponding maximum deflection value and locations of inflection points (if any), is plotted.
The maximum deflection enables the evaluation of which elements meet the deformation requirements set by the user, thus exhibiting adequate performance within the framework of historical building diagnosis. Meanwhile, the location of inflection points casts light upon the partial stiffness of connections (level of end-release of beams), which is relevant for structural health monitoring. This analysis enhances the understanding of overall structural performance. When combined with load testing, the modelling of the as-built structure can be significantly improved, thereby reducing uncertainties (Figure 25).

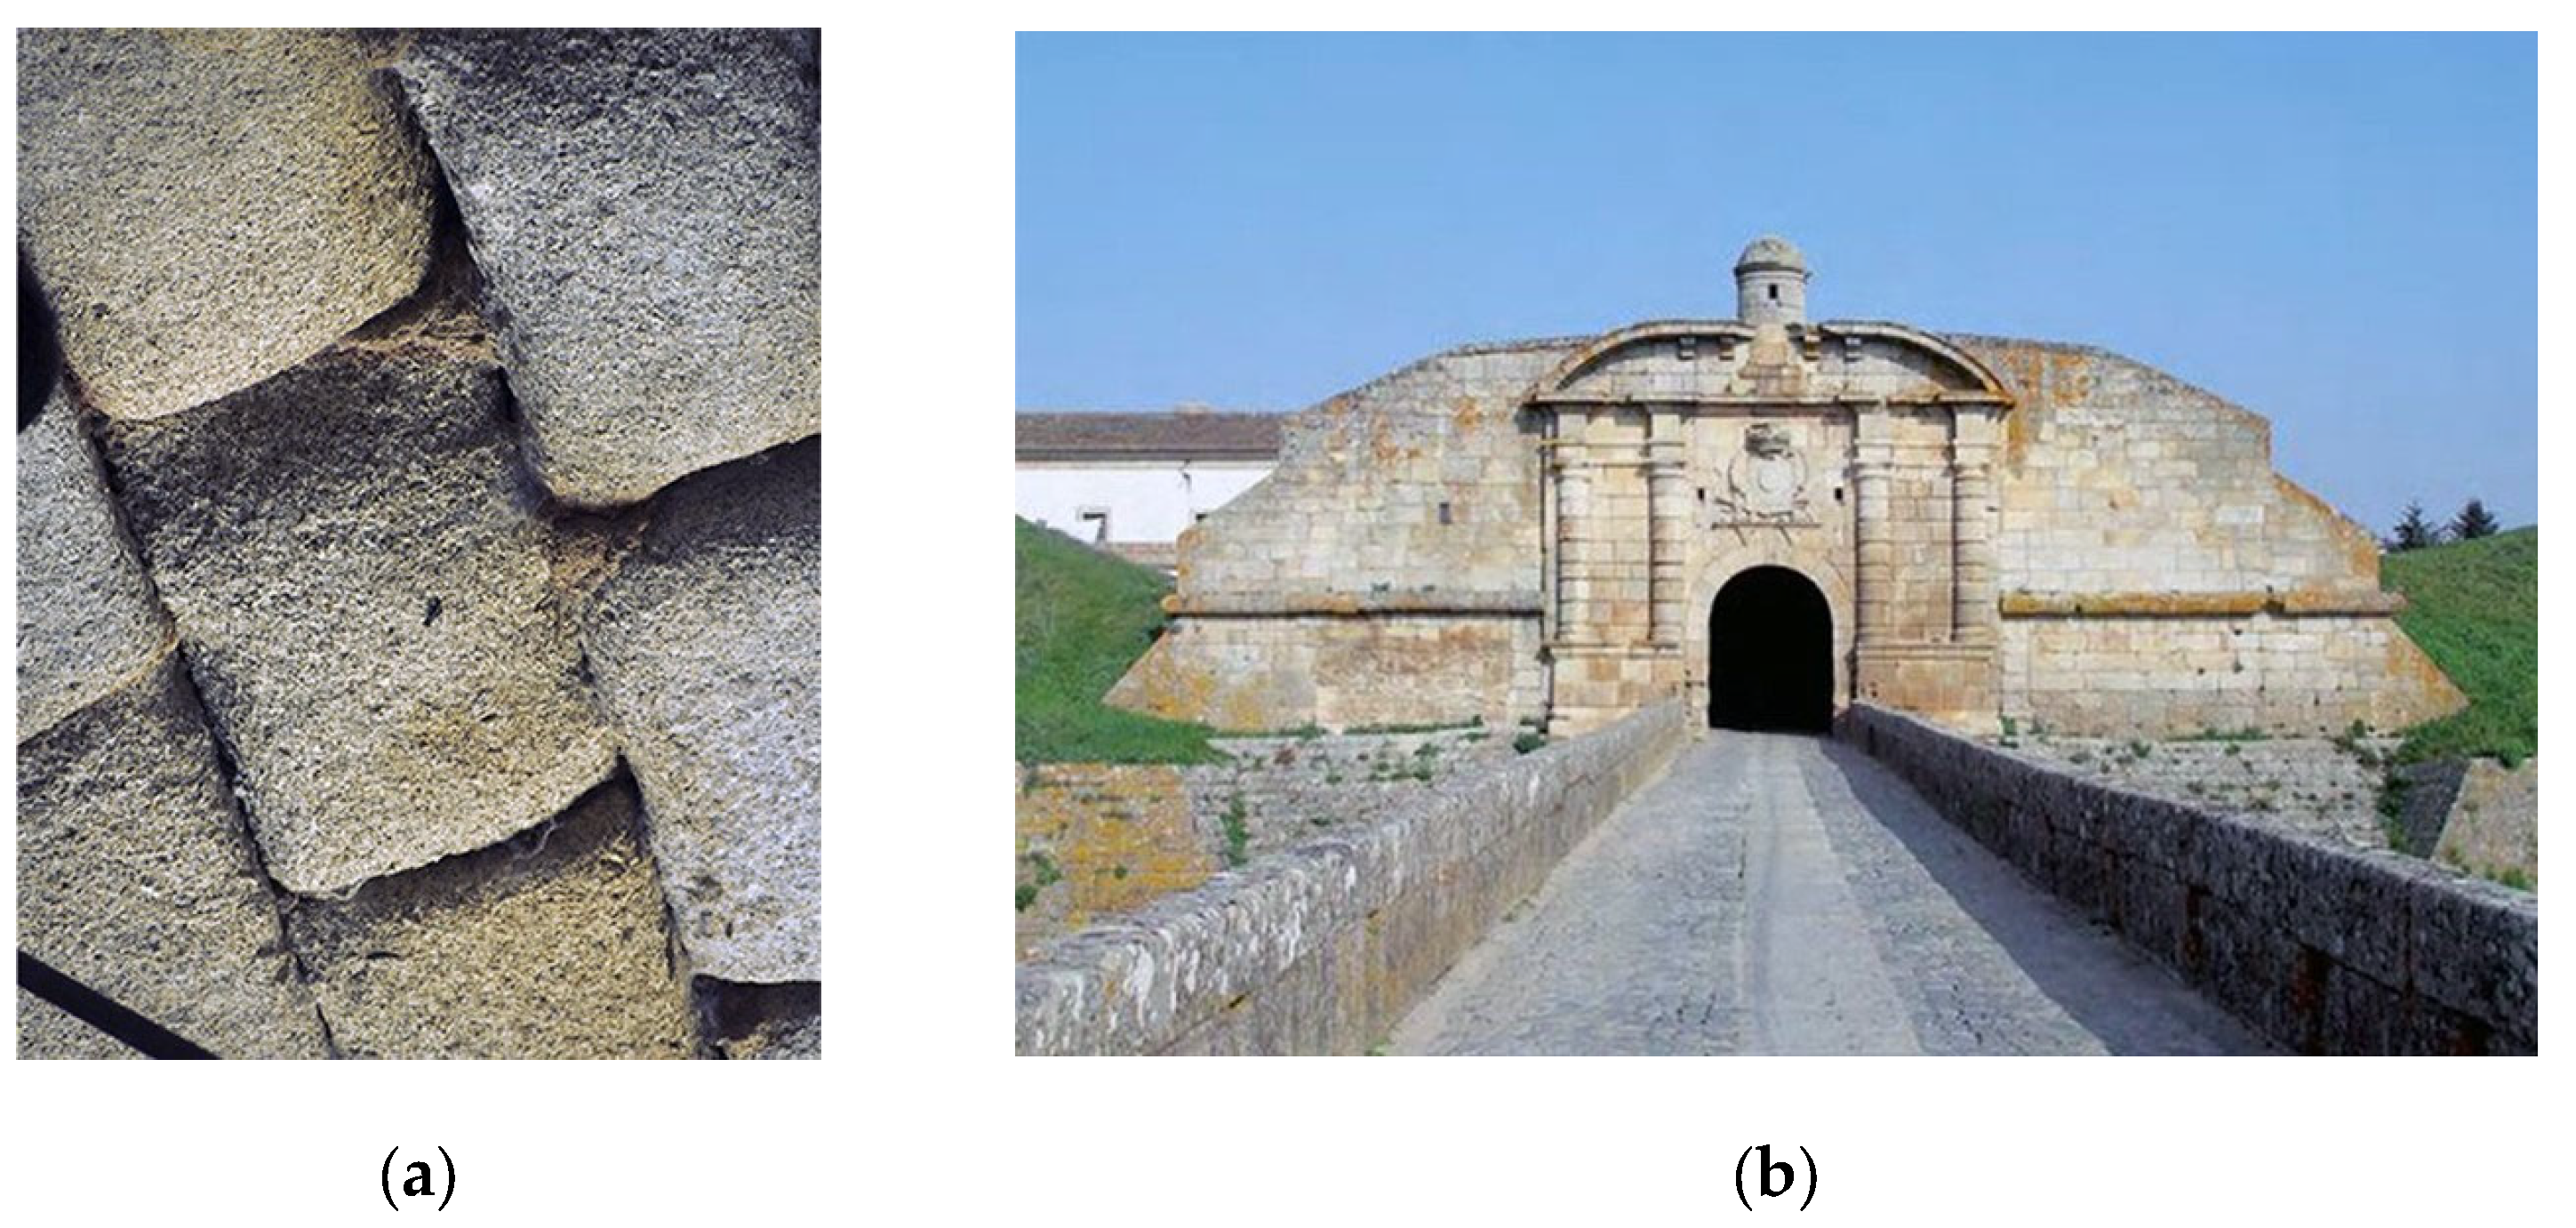
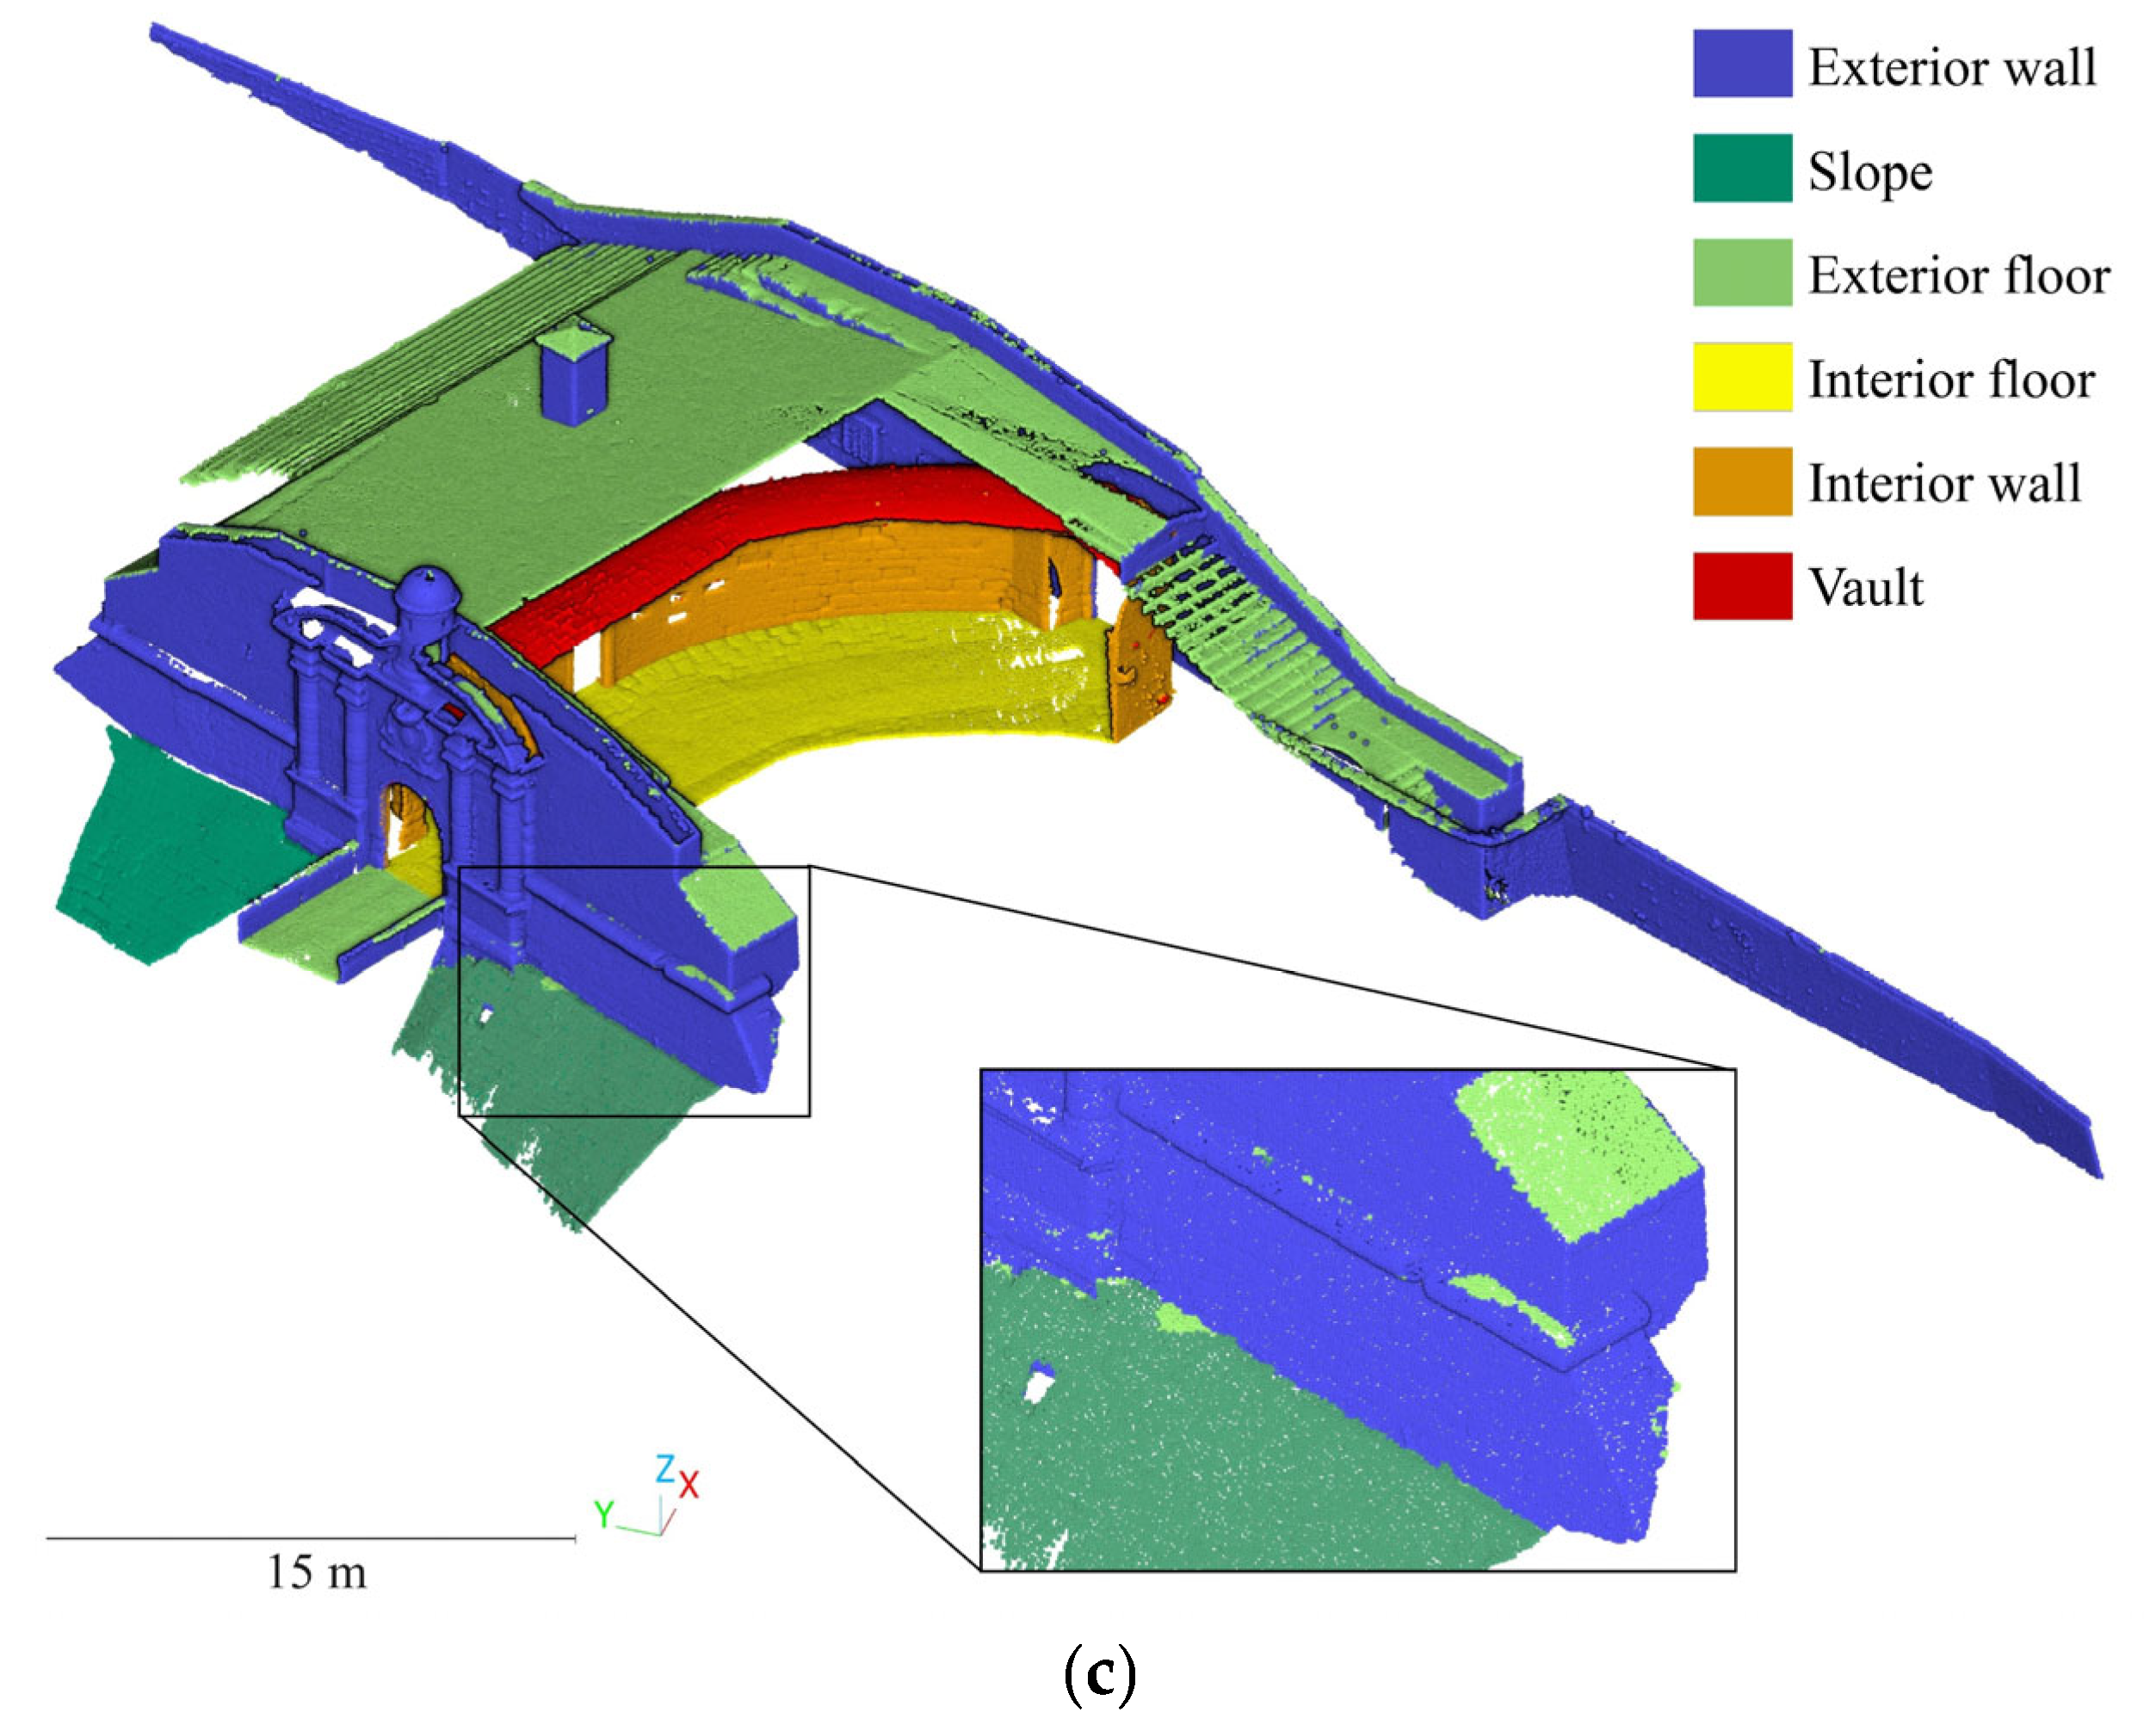
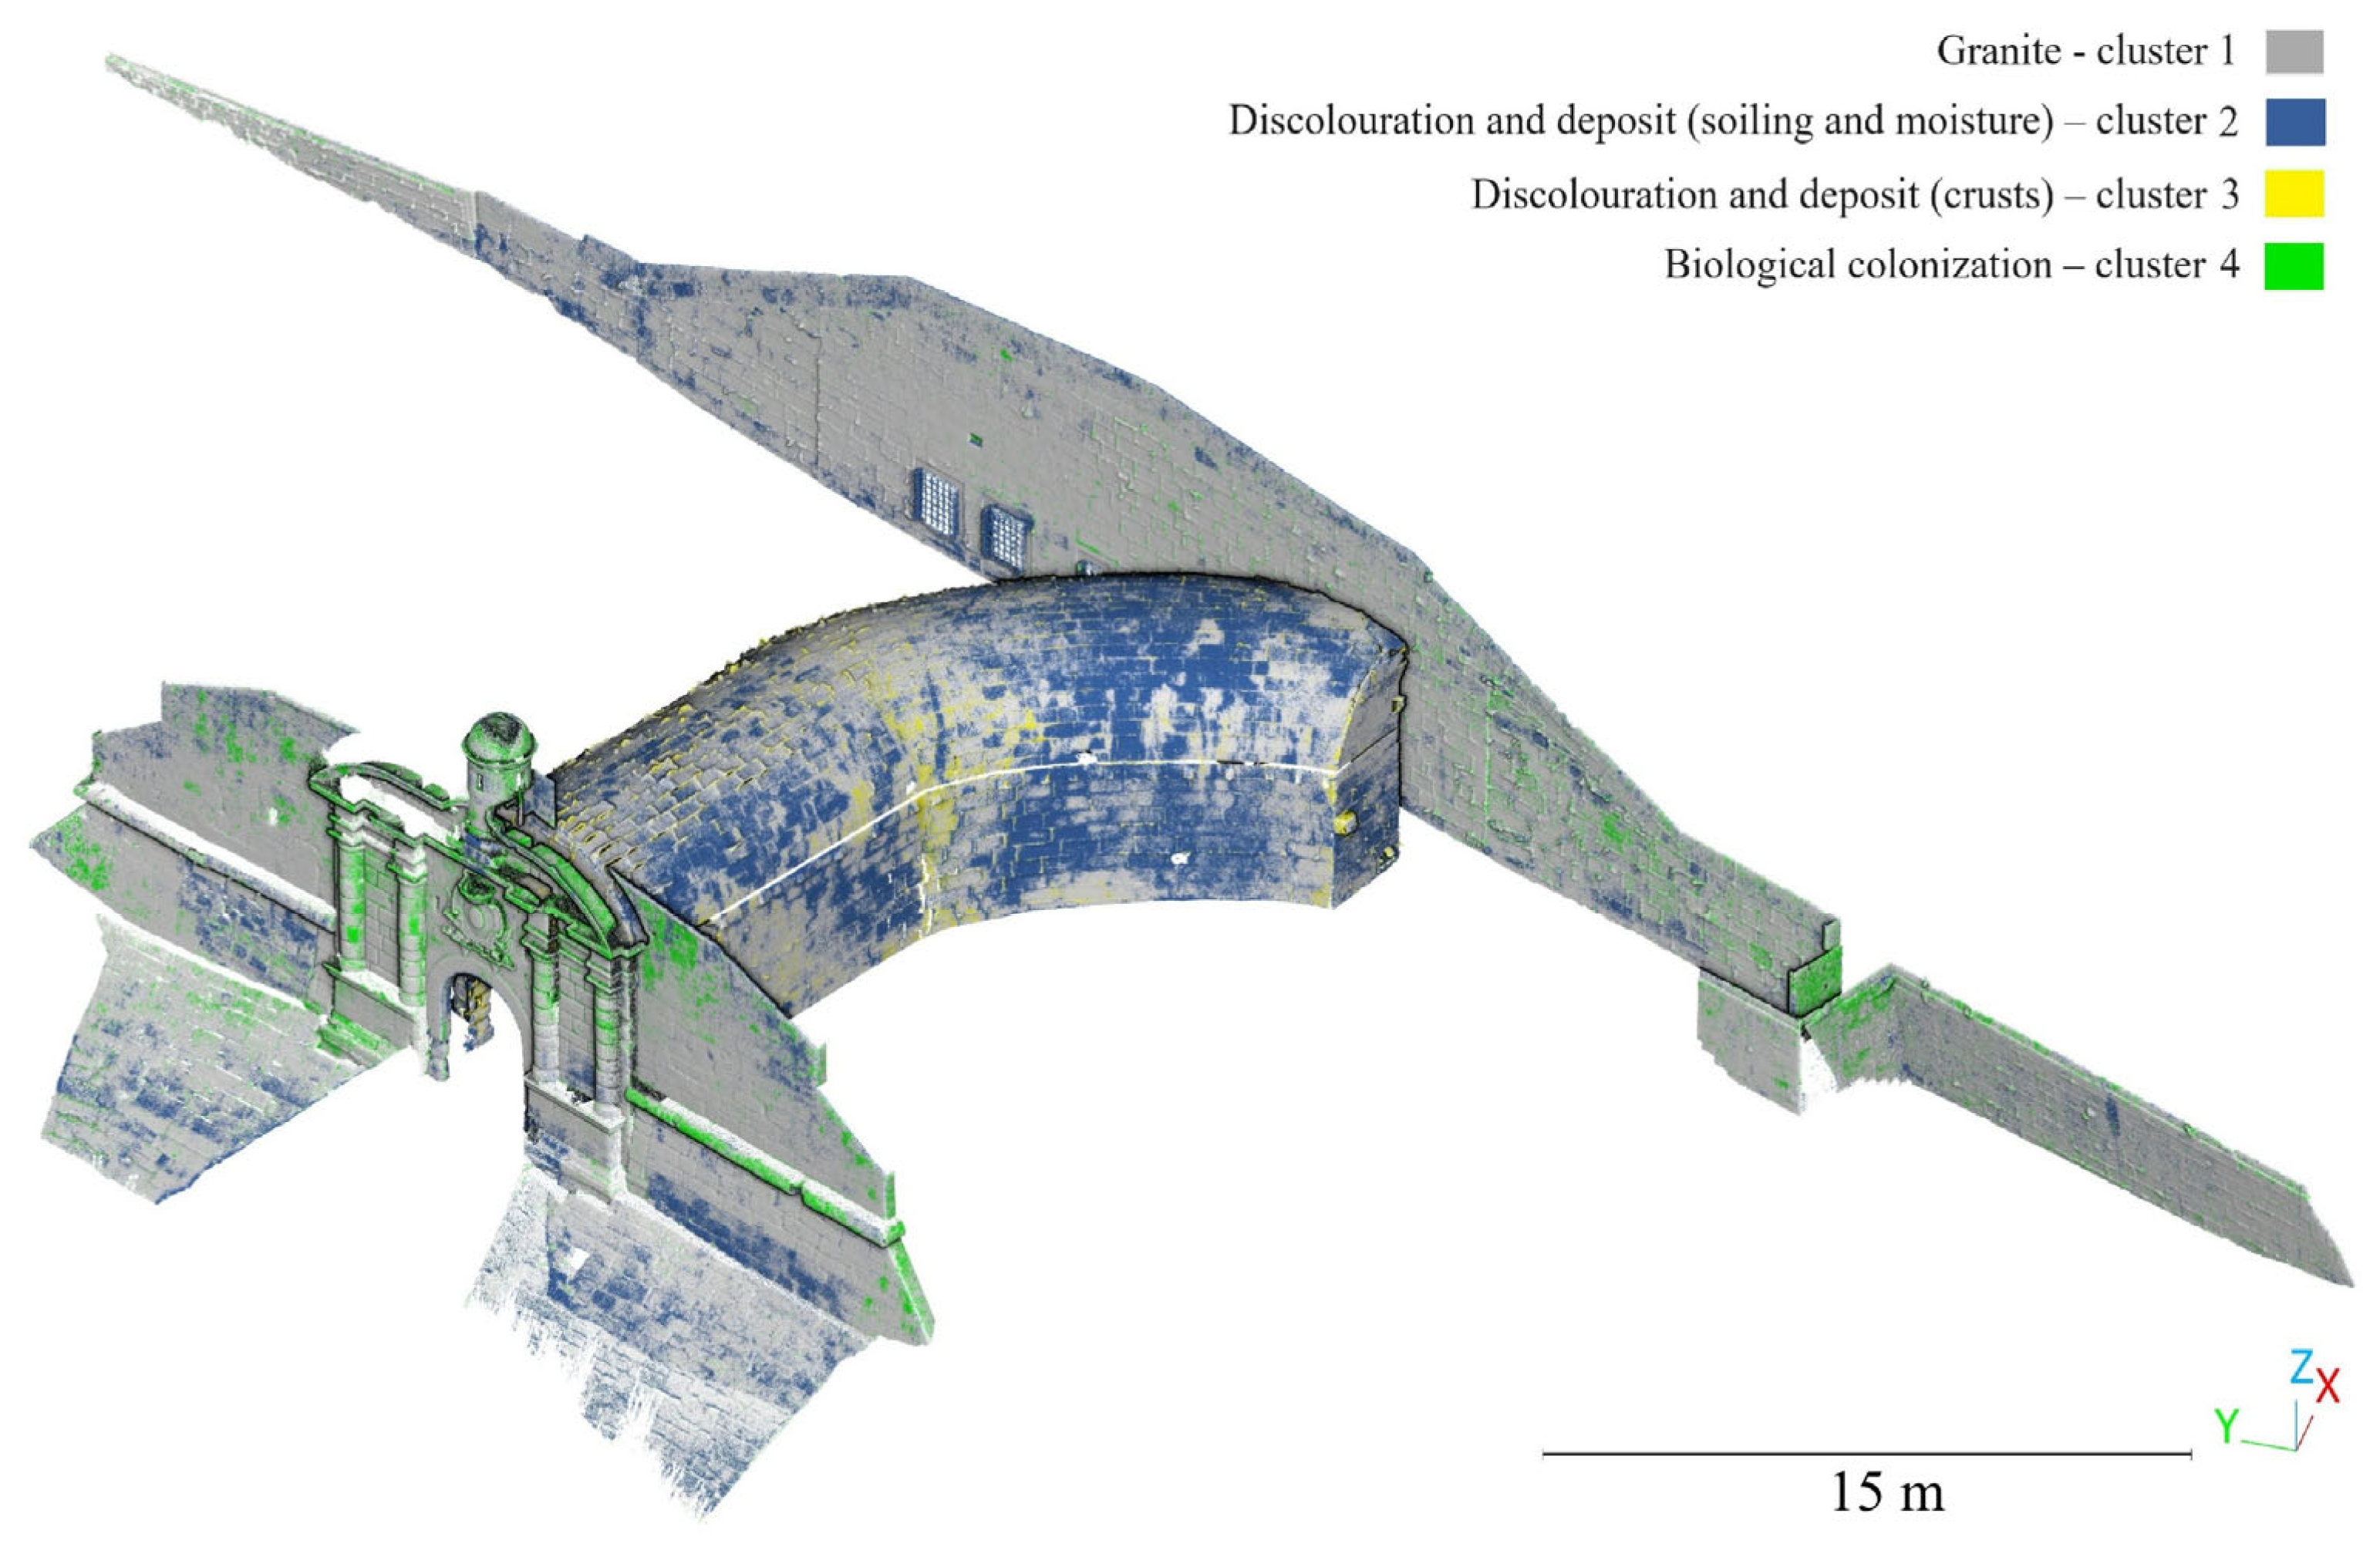
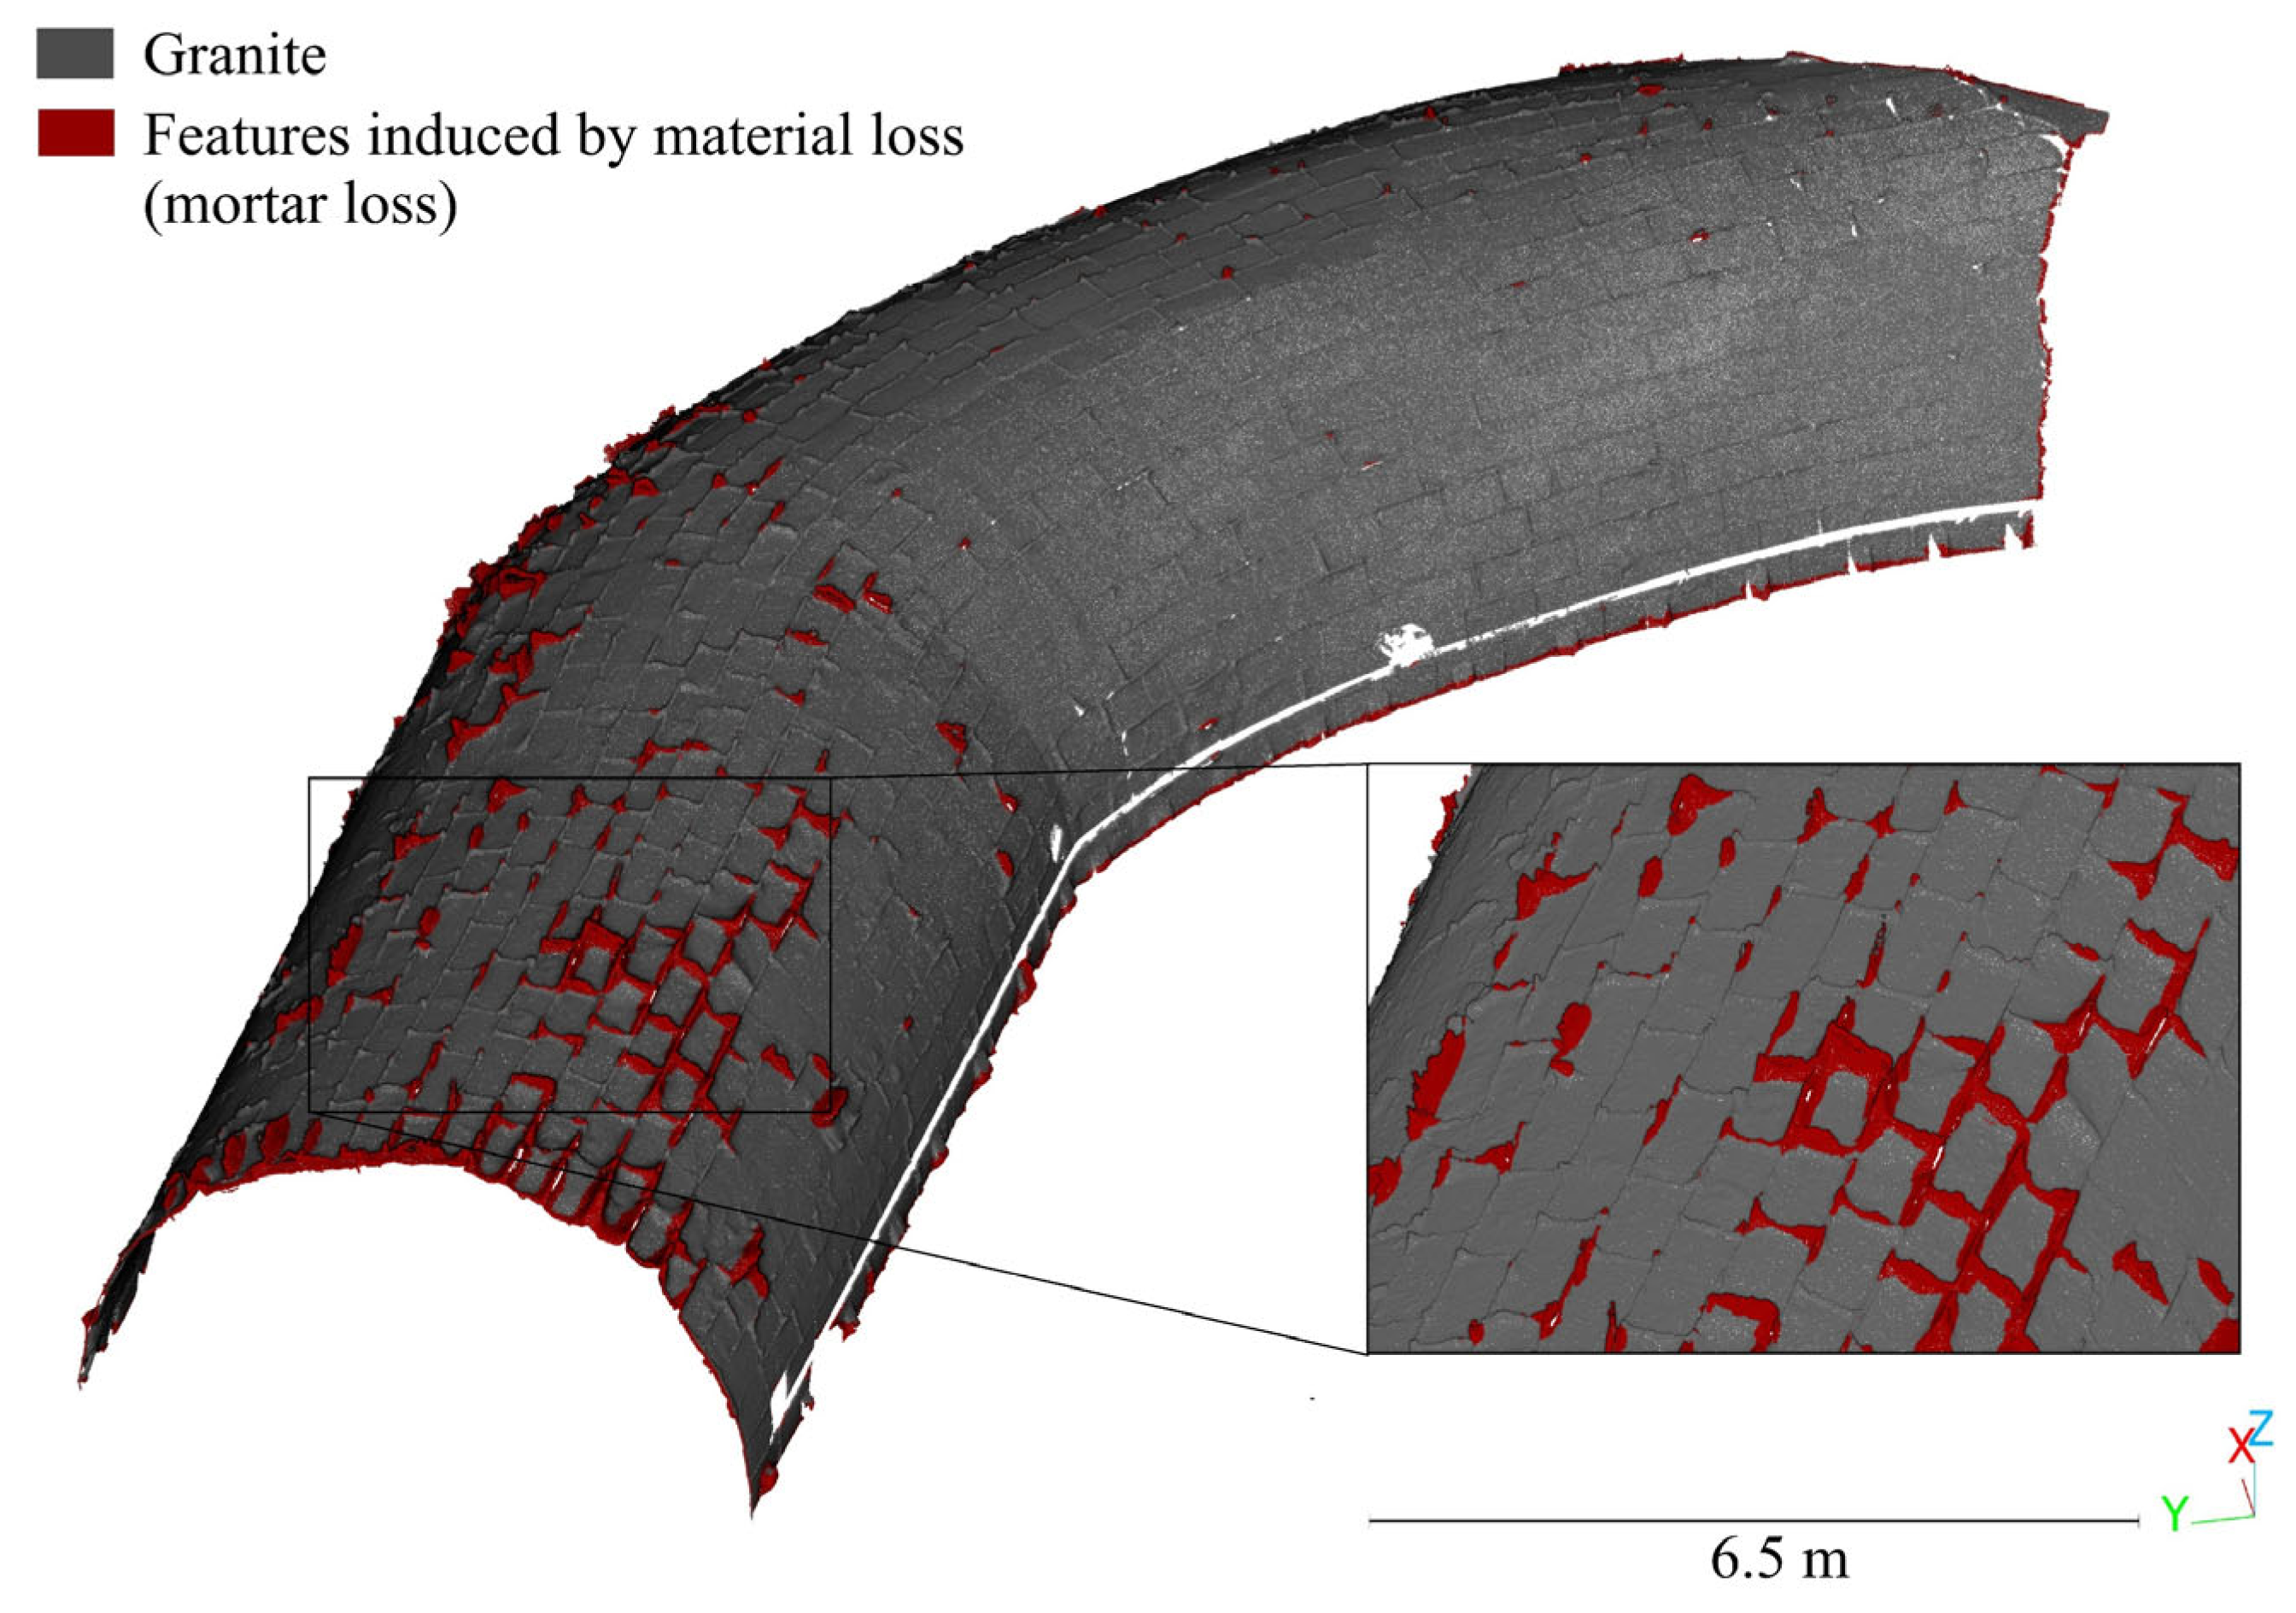
4.2. Three-Dimensional Mapping of Biological Colonies, Salts, Soiling and Material Loss—Saint Francisco Master Gate

The Magistral Gate of San Francisco in the Fortress of Almeida, Portugal, is a notable defensive structure constructed between 1661 and 1667. It features masonry walls, with an interior comprising a curved vaulted passageway and a side chamber that served as a residence for the guards. Despite suffering severe damage during the French invasion of 1810, the structure was restored in 1986, focusing on the consolidation and cleaning of the masonry. For further details about its history and constructive description, readers are encouraged to refer to Gago et al. [70] or Sánchez-Aparicio et al. [12]. This historic building serves as an ideal case study for 3D mapping of biological colonies, salts, dirt and material losses, which are present mainly on the façades and the connecting vault (Figure 26).
For damage identification, the 3D point cloud captured during the experimental campaign conducted by Sánchez-Aparicio et al. [12] was used. This point cloud was acquired using a TLS with radiometrically calibrated signal returns.
Prior to damage detection, the 3D point cloud was segmented into different construction systems using the PTNN algorithm. More specifically, two networks were trained, one for the outdoor dataset and another for the indoor dataset. Both networks were trained on 25% of the data over 500 iterations, utilising various geometric and radiometric features (e.g., Reflectance_values, Relative_position, Sum of eigenvalues, Omnivariance, Eigenentropy, Anisotropy, Planarity, Linearity, Surface variation, Sphericity, Verticality), with a neighbourhood radius ranging from 0.1 to 3.2 metres (Figure 27). The labels used during the training were (i) floor, (ii) wall, (iii) vault and (iv) roof for the outdoors and (i) floor, (ii) wall and (iii) vault for the indoors. These labels align with the classification proposal shown in Section 3.
The following figures illustrate the evolution of the Intersection over Union (IoU) index during training and the results obtained. The plot is generated by the software Seg4D to assess the performance of the network throughout its training.
The prediction of the network was very accurate except for some areas of the façade classified as floors. These parts were manually fixed by the user. In line with the previous case study, the time invested in this part is lower than a fully manual segmentation.
Next, damage detection was conducted using both radiometric-based and geometric-based methods. On the one hand, a clustering strategy (radiometric-based method) based on the K-means algorithm was used to identify areas with biological colonies, discolouration and deposits. In this case, the input was the reflectance values from the TLS. The number of clusters was determined by the Silhouette method. This unsupervised method accurately identified areas with biological colonies on the façades and colour changes due to the presence of crusts on the vault, moisture in the lower section of the walls and soiling areas on both façades and the vault (Figure 28).
On the other hand, material loss was determined by using the AutoML approach. This method was applied to the points classified as vault points. The TPOT script was configured with the following parameters: (i) number of generations (100), (ii) population size (100), (iii) mutation rate (0.9), (iv) crossover rate (0.1), (v) function used to evaluate the quality (accuracy), (vi) cross-validation (5), (vii) maximum total time (720 min), (viii) maximum time per evaluation (72 min) and (ix) number of generations without improvement (10). The input features were Omnivariance, Anisotropy, Planarity and Surface variation. The radii used were 0.05 m, 0.10 m, 0.20 m and 0.40 m, in line with the experiments performed in previous works [12].
As a result, Seg4D was able to configure an ML workflow made up of the following strategies: ExtraTreesClassifier with the following hyperparameters: (i) bootstrap (True), (ii) criterion (entropy), (iii) maximum features (0.9), (iv) minimum samples leaf (1), (v) minimum samples split (14) and (vi) number of estimators (100). The final accuracy was 99.6%. The results are presented in Figure 29. As the reader can observe, the segmentation is consistent. This new layer could assist structural engineers in deciding which areas are more degraded and require further structural analysis. This can also aid decision-making, as these concentration areas appear to be linked to the junction between the roof and the façade, as well as the large exposure to wind of the main façade.

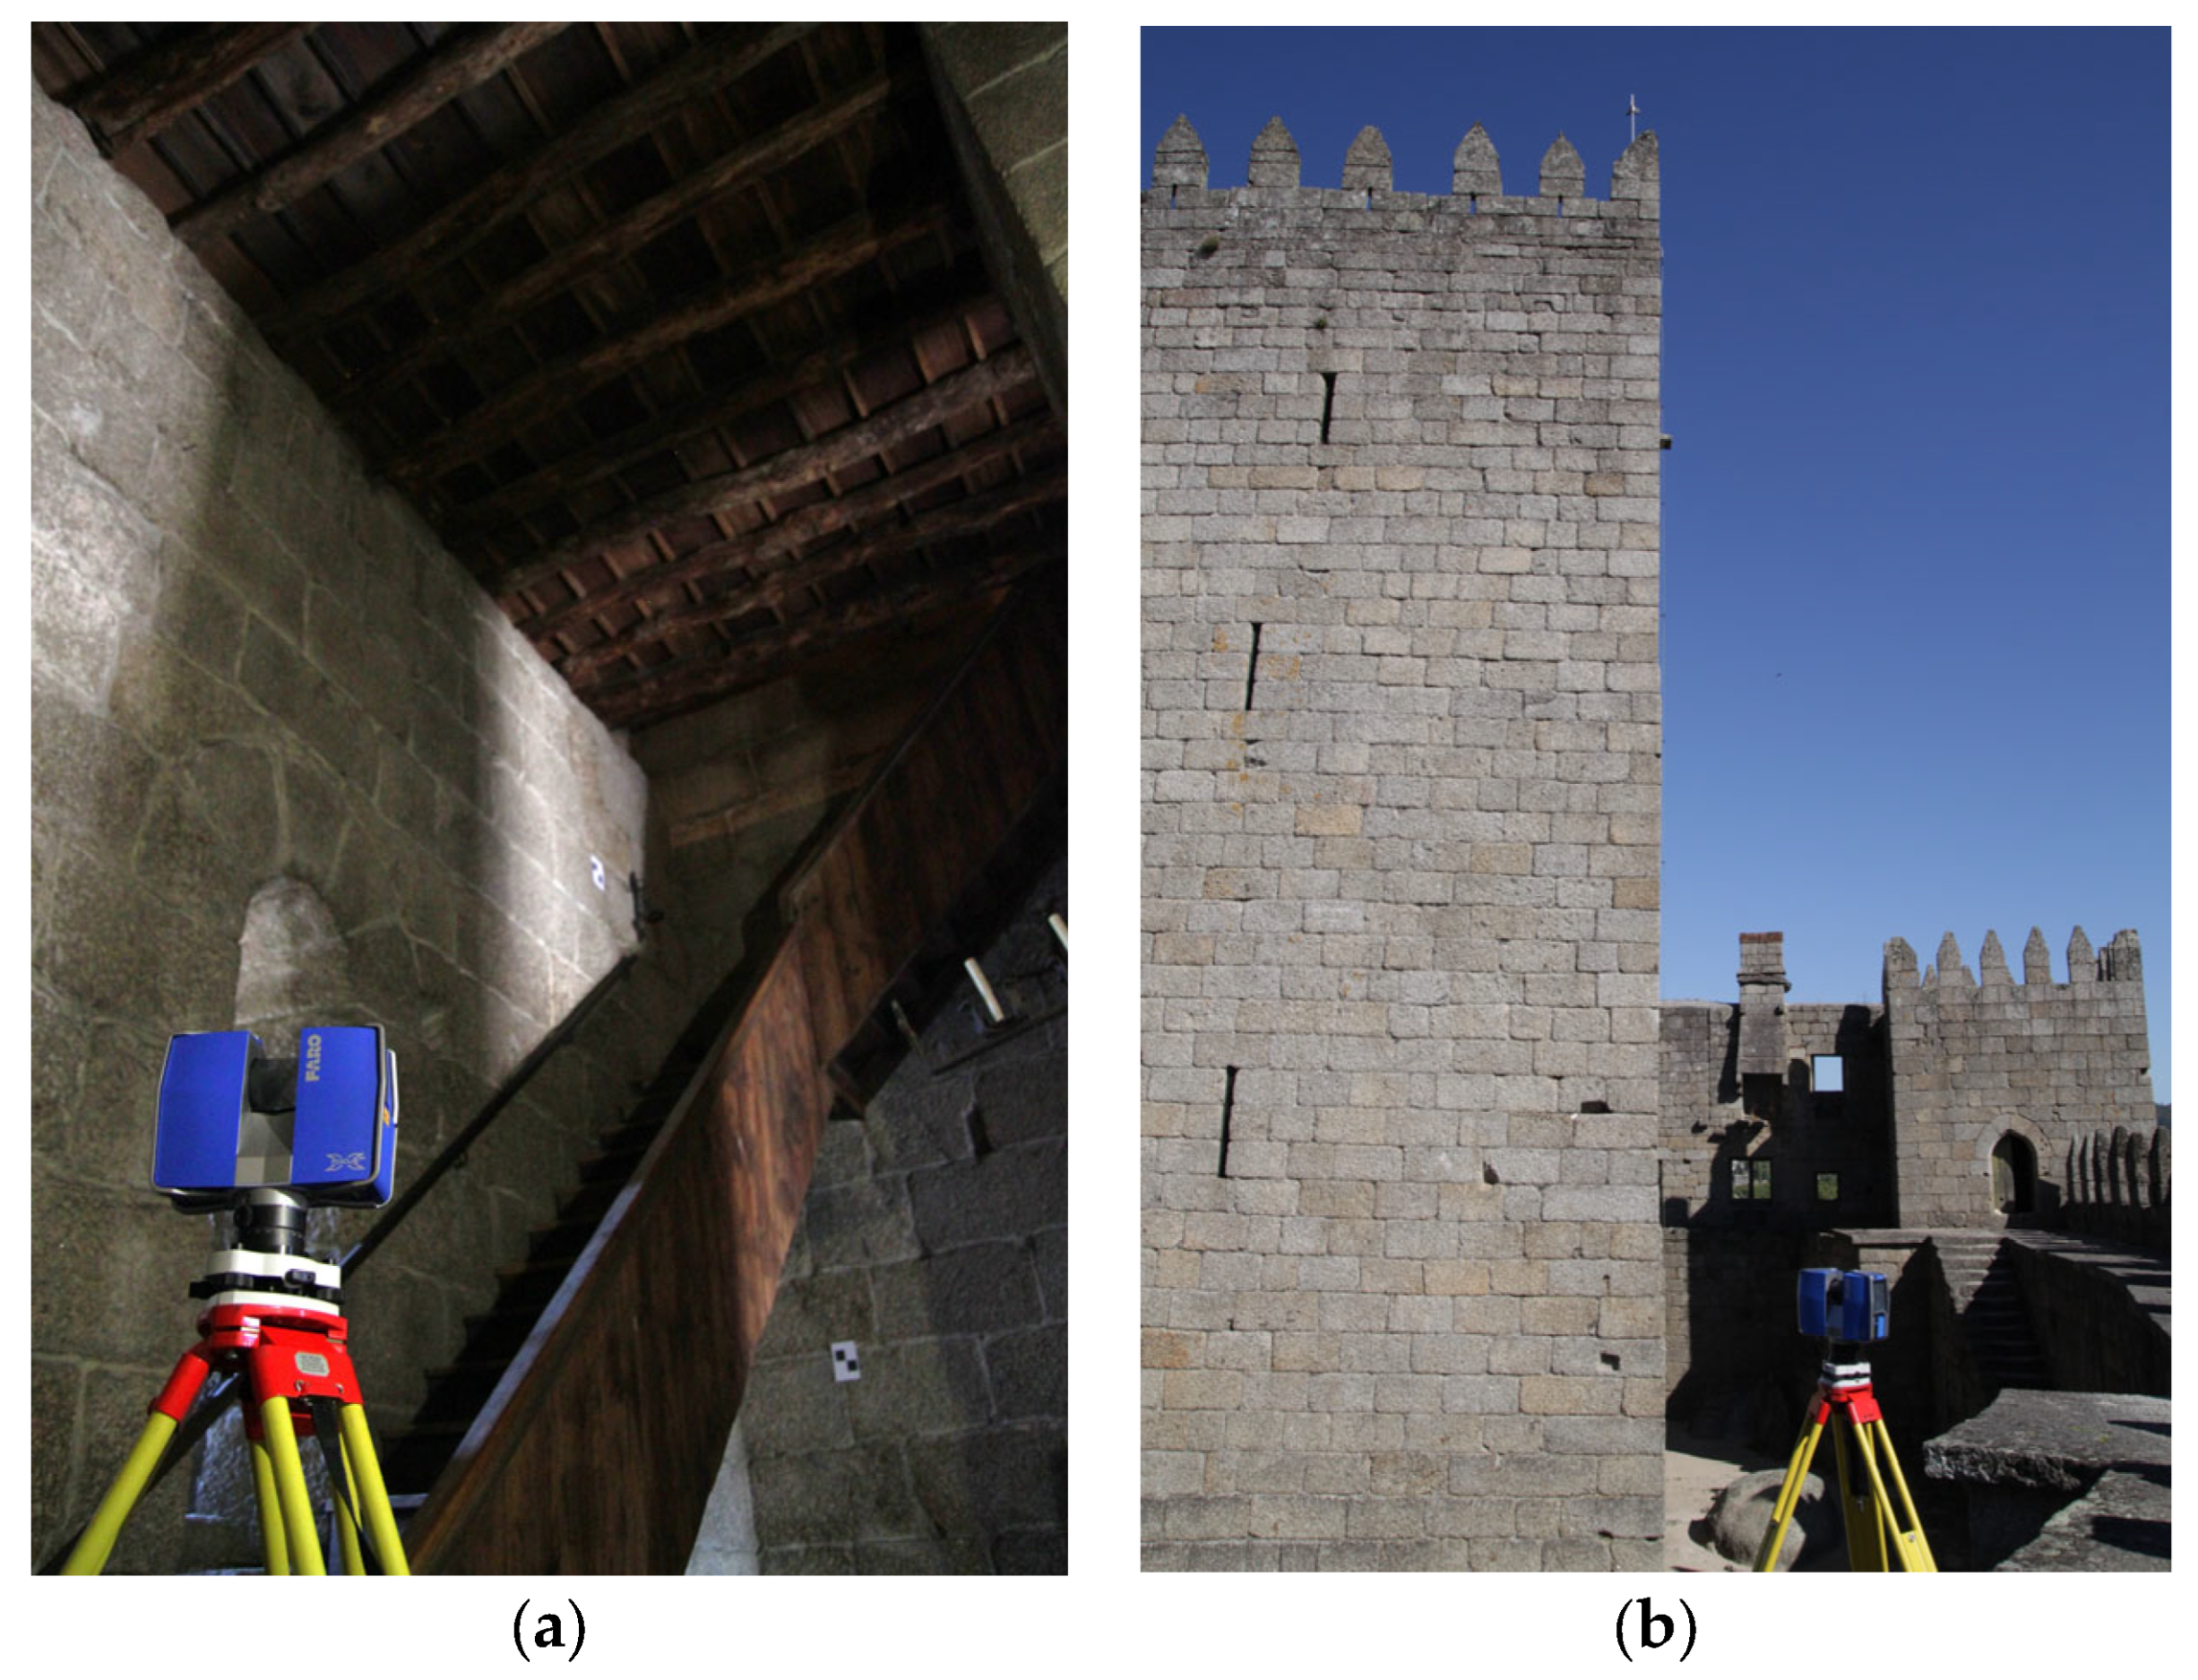
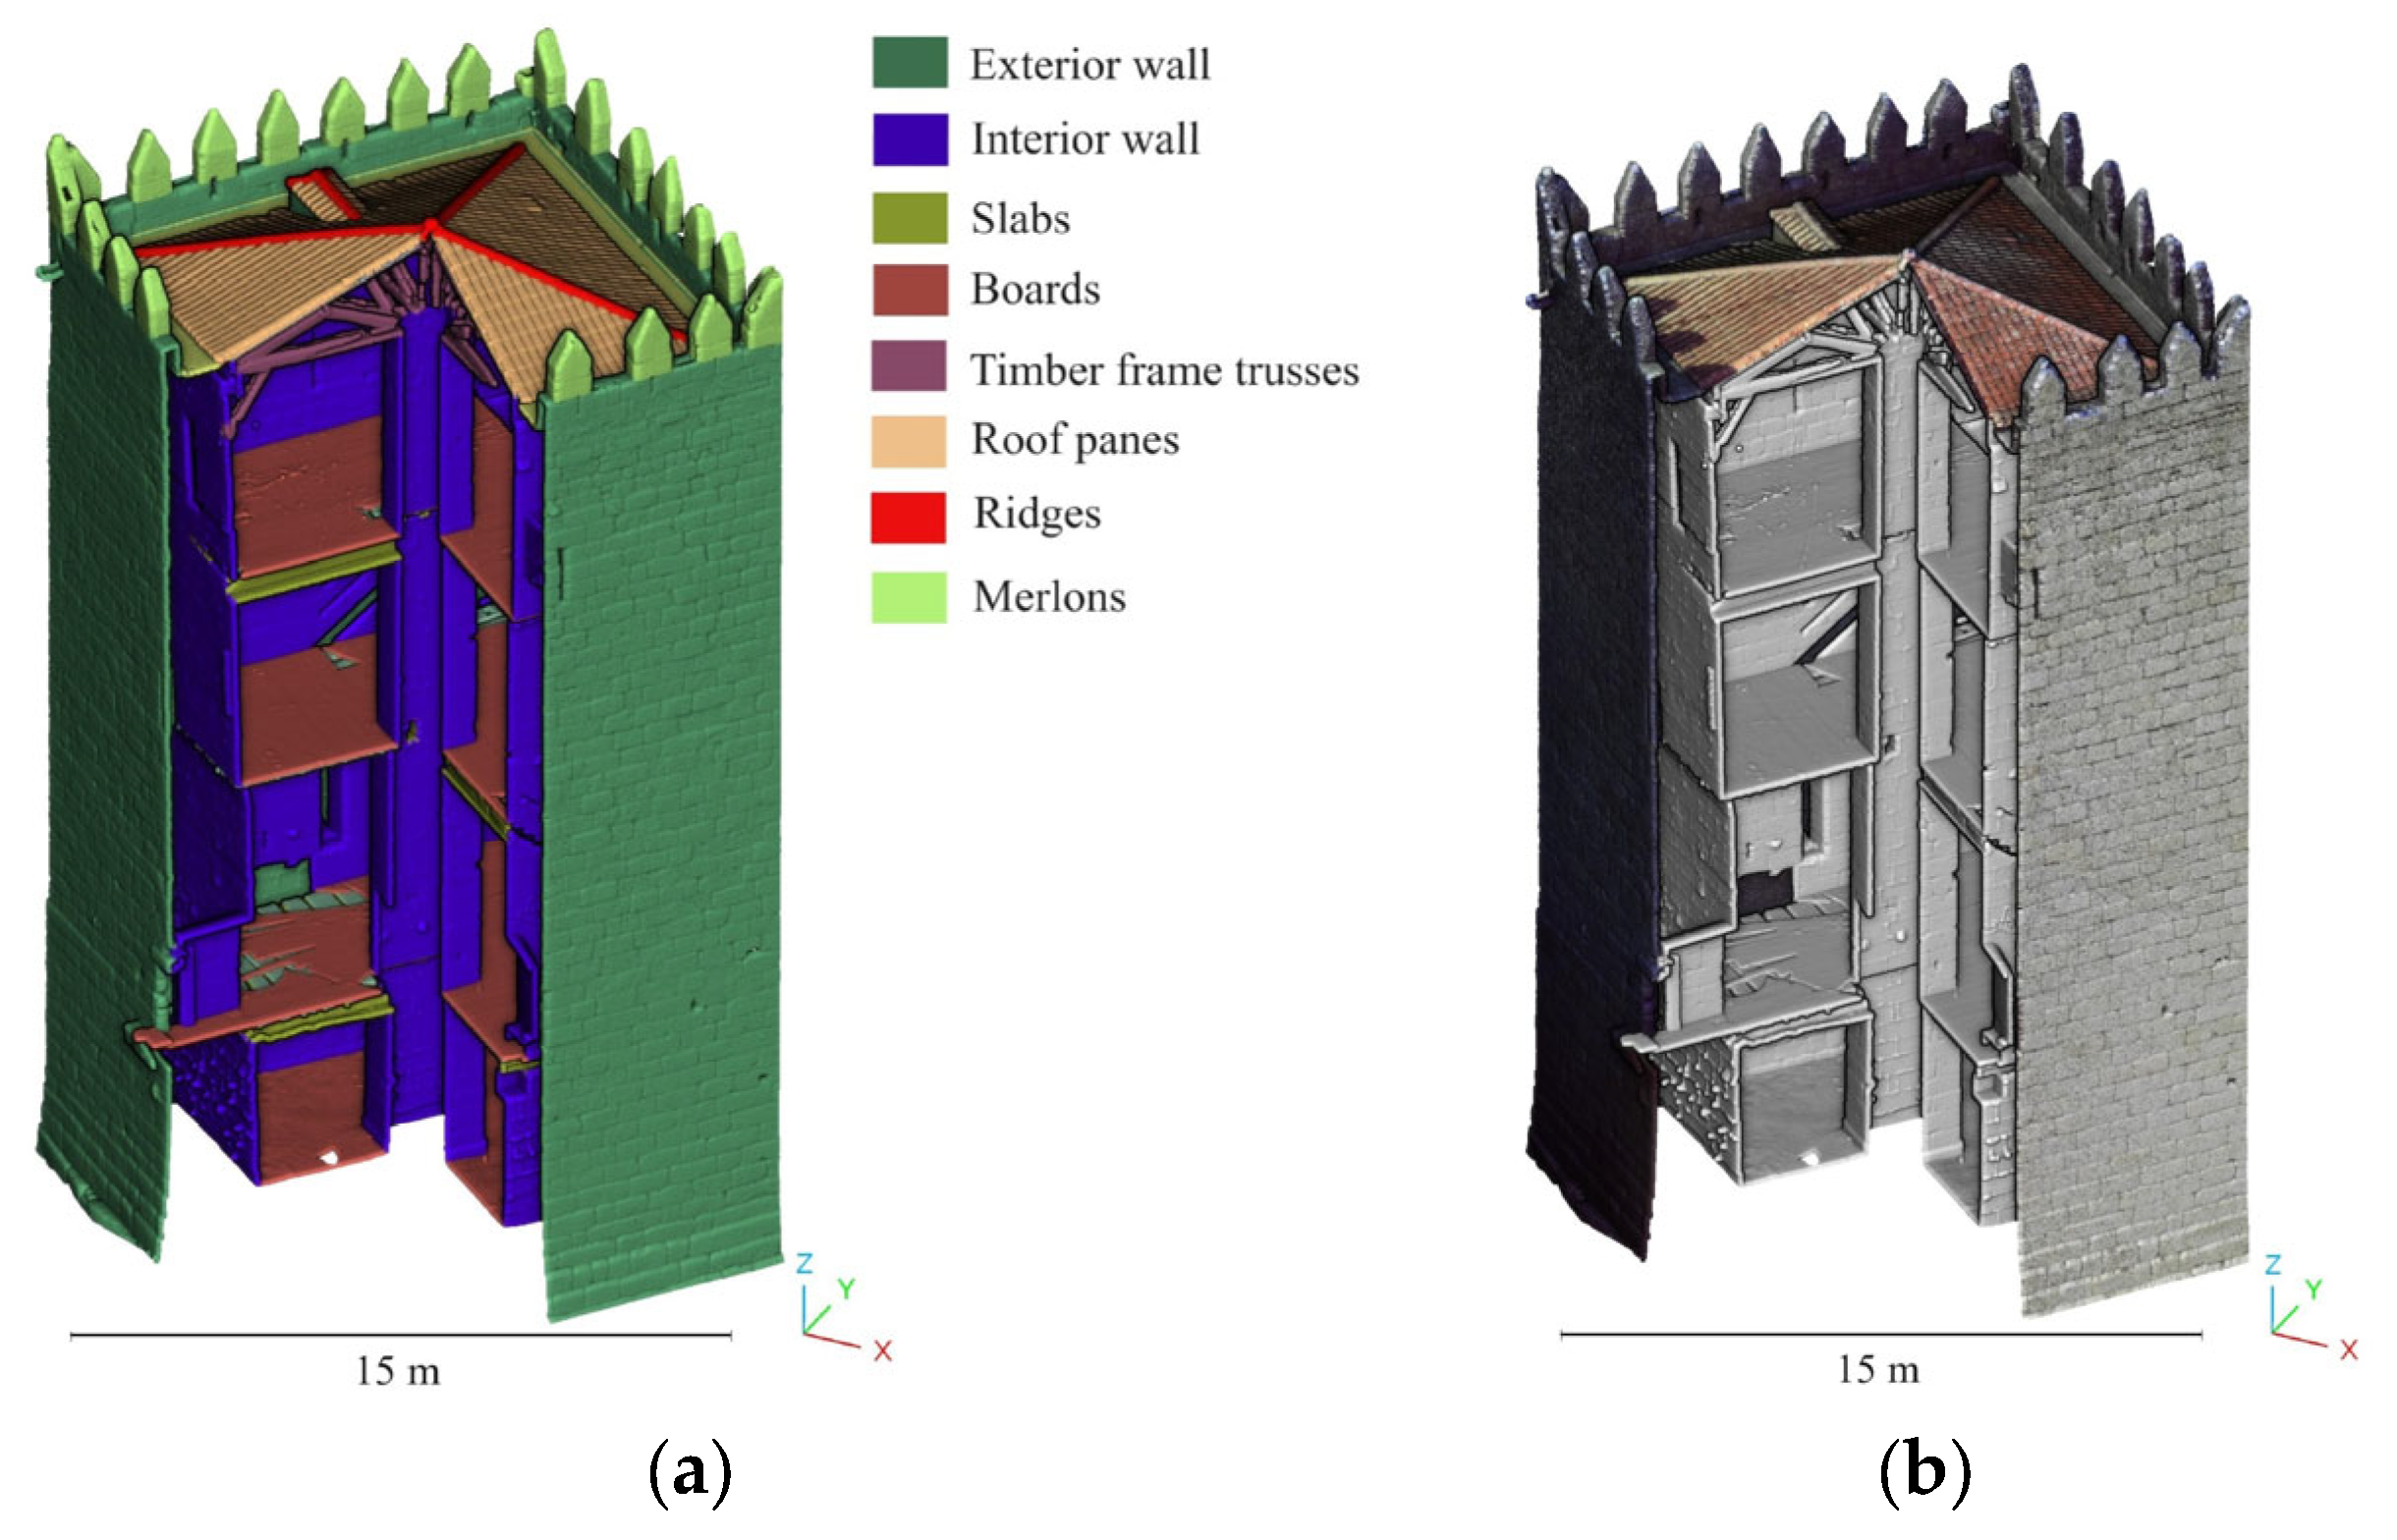
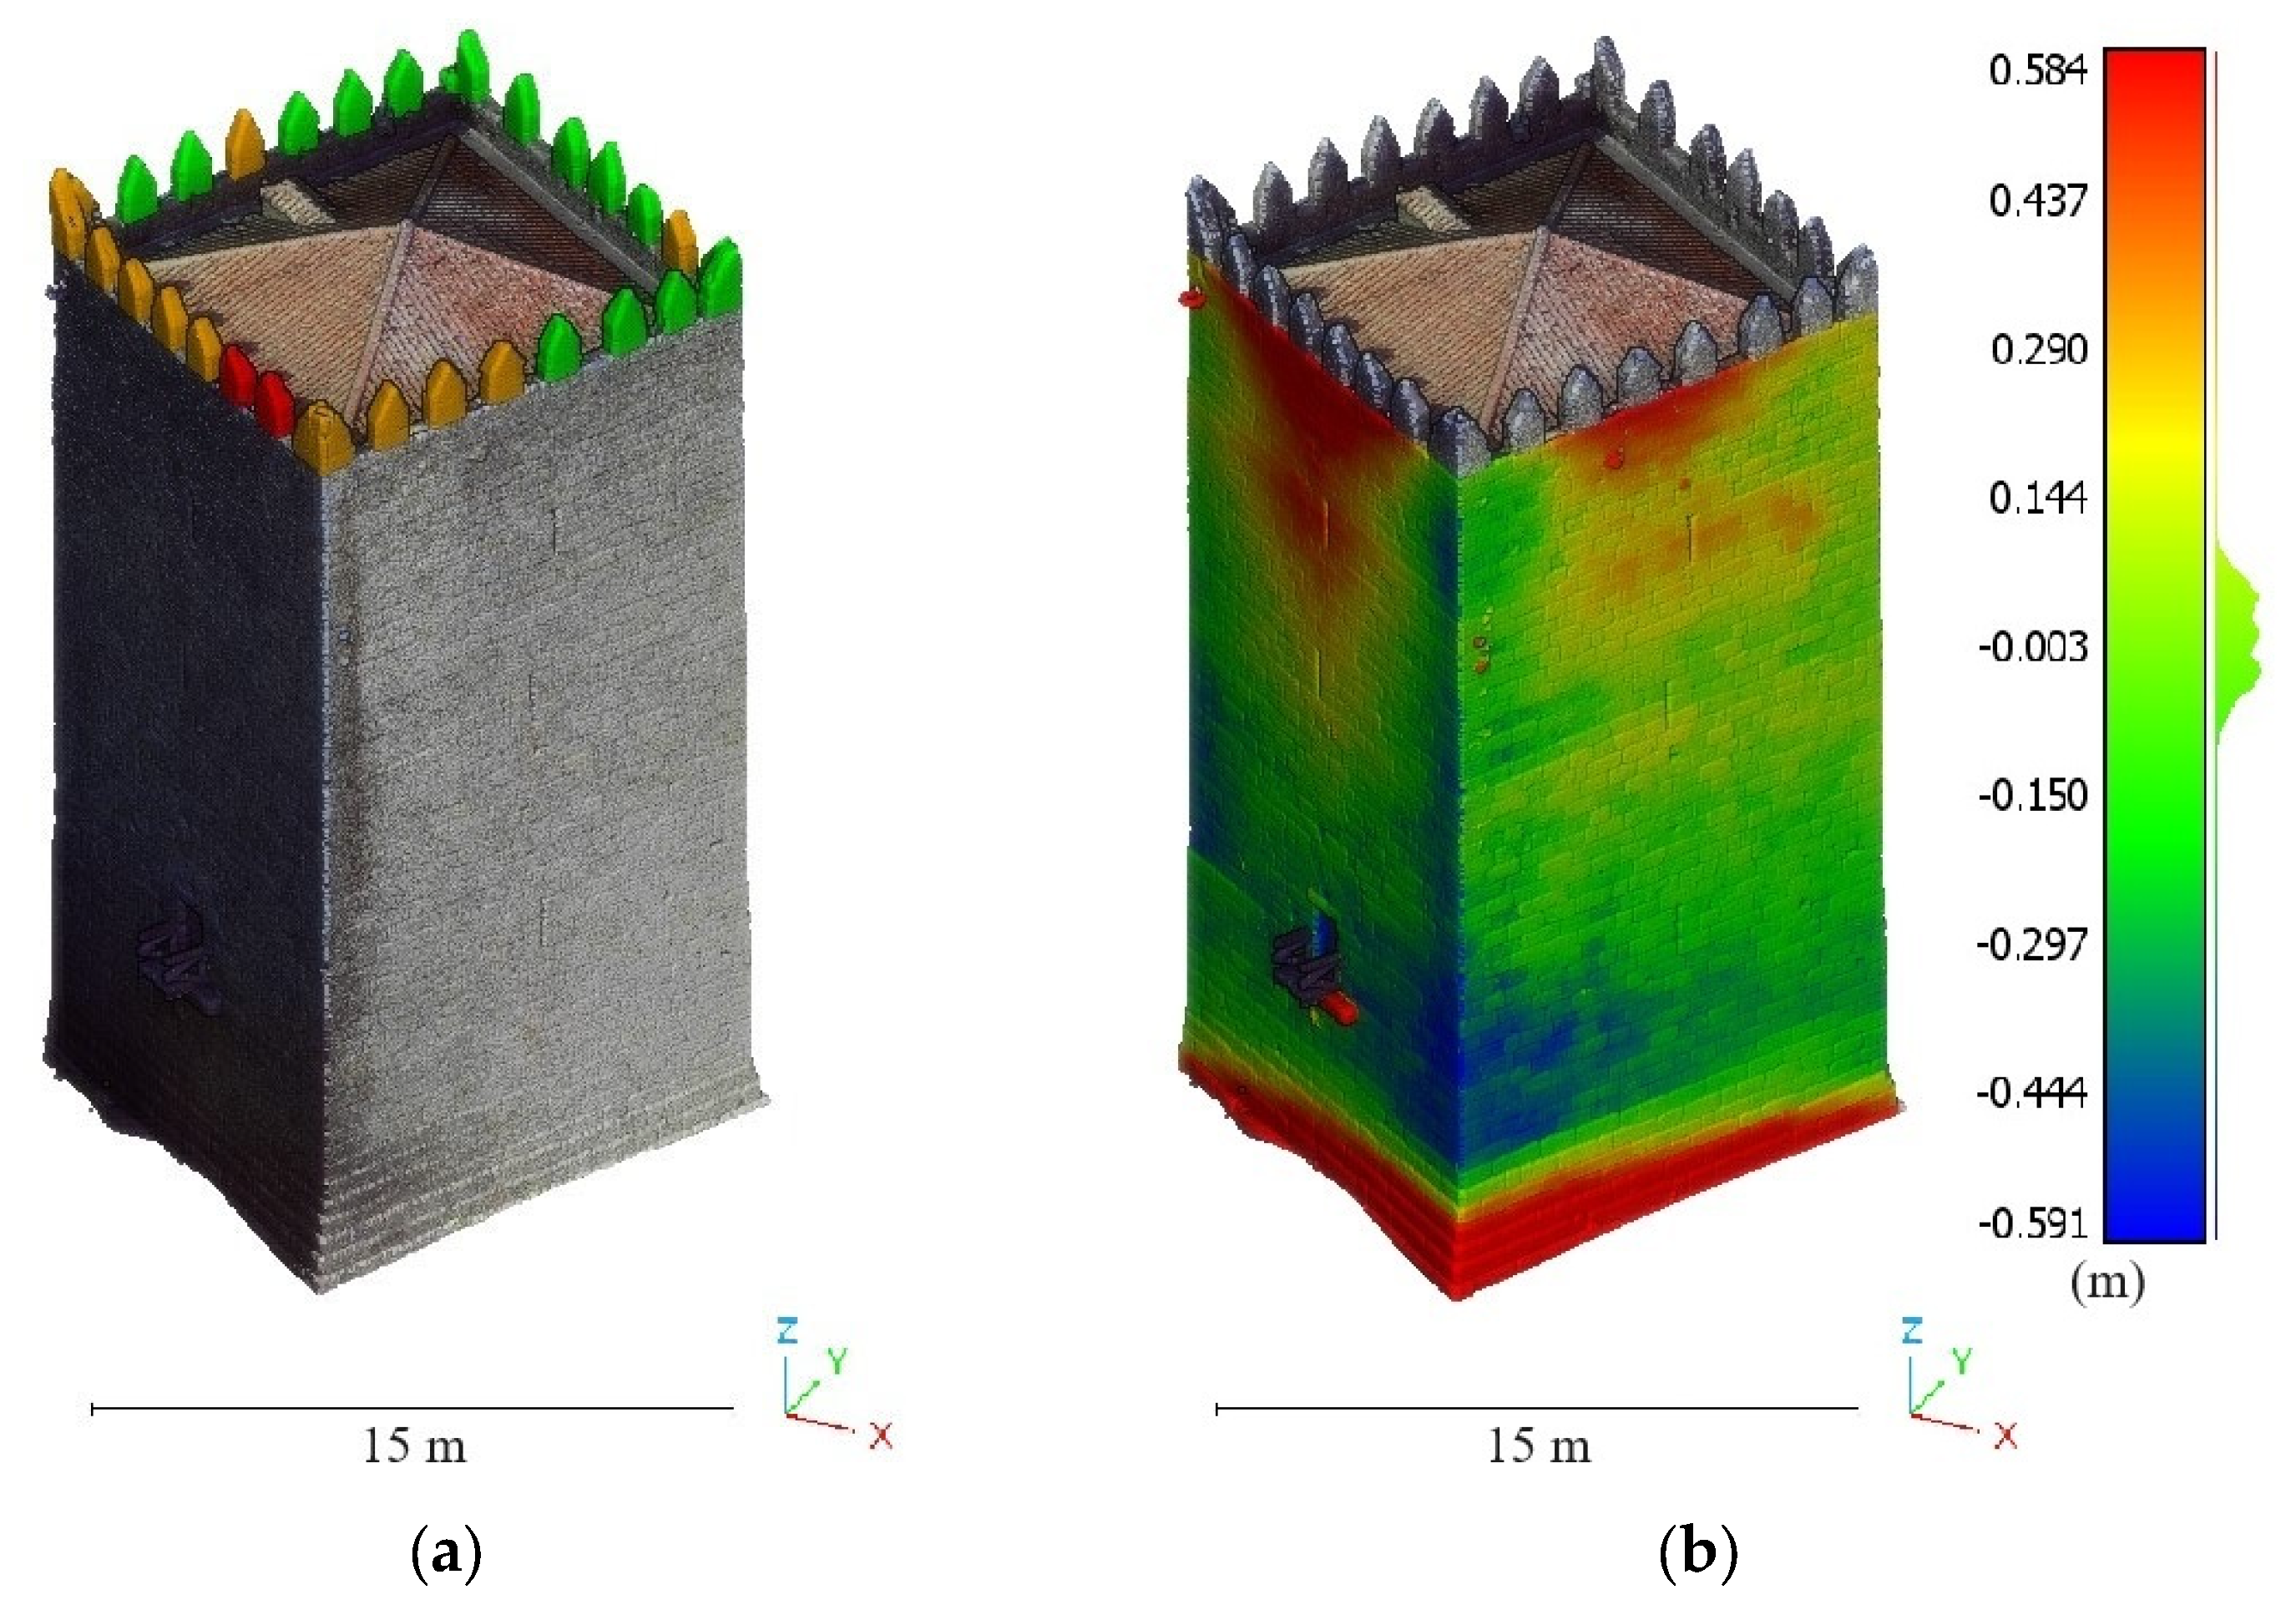
4.3. Analysis of Out-of-Plane Deformations in Masonry Walls and Timber Floors—Keep Tower of Guimaraes Castle

Guimaraes Castle was built in the 10th century to serve as a defensive structure for the neighbouring monastery (Figure 30b). Over time, it has undergone numerous alterations and restoration efforts, yet its formidable walls remain a testament to its historical significance, closely linked with Portugal’s first monarch, Afonso Henriques. For additional information regarding the layout of this building, readers are encouraged to refer to Viana da Fonseca et al. [71].
Currently, the keep tower of this defensive structure exhibits significant conservation issues, including out-of-plane deformations in the walls and floorboards, as well as merlon stability issues. Accordingly, the Seg4D plugin was employed to analyse these issues using geometric-based methods.
As previously mentioned in prior case studies, a supervised ML approach was applied. The input 3D point cloud was obtained from previous experimental campaigns [69]. This 3D point cloud was captured with a high-accuracy TLS (Figure 30) (Figure 31b).
The first step was to clean the 3D point cloud of exogenous elements such as people, as well as furniture assets. Then, the geometric features of the 3D point cloud were calculated for predefined radii ranging from 0.05 to 1.60. In this case, it was decided to use the same geometric features as those used in the previous study case.
After data preparation, the semi-automatic classification proceeded using a Random Forest algorithm with the default hyperparameters: (i) number of trees (200), (ii) function to measure the quality of a split (gini), (iii) maximum number of the trees (0), (iv) minimum number of samples for splitting (2), (v) minimum number of samples to at a leaf node (1), (vi) minimum weighted fraction (0), (vii) number of features to consider for best split (sqrt), (viii) maximum number of leaf nodes (0), (ix) impurity for splitting the node (0), (x) use of bootstrap (True), (xi) weights associated with the classes (No), (xii) complexity parameter used for minimal cost (0), (xiii) number of samples to draw to train each base estimation and (xiv) number of cores (All). To this end, the 3D point cloud was divided into two subsets, approximately 25% for training purposes and the remaining 75% for evaluation. It is worth mentioning that both the training subset and the evaluation subset were labelled in constructive systems to ensure proper training and performance analysis. In this sense, it was decided to use three levels of classification, ranging from coarse to fine identification (Figure 31a). The Random Forest classifier produced consistent predictions, nearing perfection with average values for precision, recall and F1-score of 99% in all the labels and classification levels. Although the accuracy was nearly perfect, the user had to revise the classification of the beams in order to obtain a proper evaluation. This step was not necessary in the evaluation of the inclinations of walls and merlons due to the high quality of the classification.
Regarding the previously discussed conservation issues, and taking the semantic classes provided by the ML classifier as a foundation, the following damage detection methods were employed to improve the building diagnosis processes:
  • A geometric-based method with a point-to-primitive distance strategy for evaluating the out-of-plane deformations of walls and floorboards.
  • A geometric-based method based on the extraction of vertical sections.
The out-of-plane deformations present on the masonry walls and floorboards were evaluated by using a strategy based on the computation of point-to-primitive distances. In the first case, the best-fitting plane was obtained thanks to the Least Squares method present in the library CloudCompare. As a result, a triangular collapse mechanism was observed, which seemed to be related to the truss of the roofing system (Figure 32b). In the second case, the point-to-primitive distance was measured relative to a horizontal reference plane, offering insights into the floorboards’ condition.
Regarding the merlons, they were evaluated and plotted in different colours according to their stability status. Firstly, instance segmentation was performed by using the unsupervised ML DBSCAN. The unique input defined was the minimum distance between instances. This was established as 0.5 metres. Once each merlon was separated, its stability was assessed using the equations devised by Heyman [72] for tower stability. For this purpose, the analysis of inclination was used for columns and buttresses (Figure 32a). This process was performed automatically.
The outputs derived from this analysis have revealed significant out-of-plane movement on two faces of the tower. Some merlons are perfectly vertical (plotted in green), while others show a slight inclination that is still considered safe. However, two merlons, plotted in red, exhibit inclinations close to the maximum estimated limit of 5 degrees. The movement of the merlons and the façade appears to be linked to the horizontal truss of the roof. This conclusion is highly valuable for future studies, as it allows research efforts to be focused on specific parts of the building.

5. Discussion and Conclusions

Three-dimensional point clouds have emerged as an extremely powerful source of information within the heritage field. Their geometry, as well as radiometry, can be useful for detecting construction systems and damage. However, there is a lack of software focused on exploiting this data specifically within the heritage field. On this basis, this paper presents a holistic software solution, Seg4D, for supporting the diagnosis of historic constructions from 3D point clouds.
This new software solution allows the centralisation of the most common strategies used for processing 3D point clouds in the heritage field, extending the potentialities of the well-known software solution CloudCompare. The main innovations introduced by Seg4D are
  • The capability to segment constructive systems by using ML and DL strategies.
  • The capability of applying Auto-Machine Learning methods to reduce the complexity of training ML algorithms.
  • The possibility of computing geometric and textural features for training artificial intelligence models.
  • The ability to implement all damage detection strategies identified in the recent systematic review performed by Sánchez-Aparicio et al. [8].
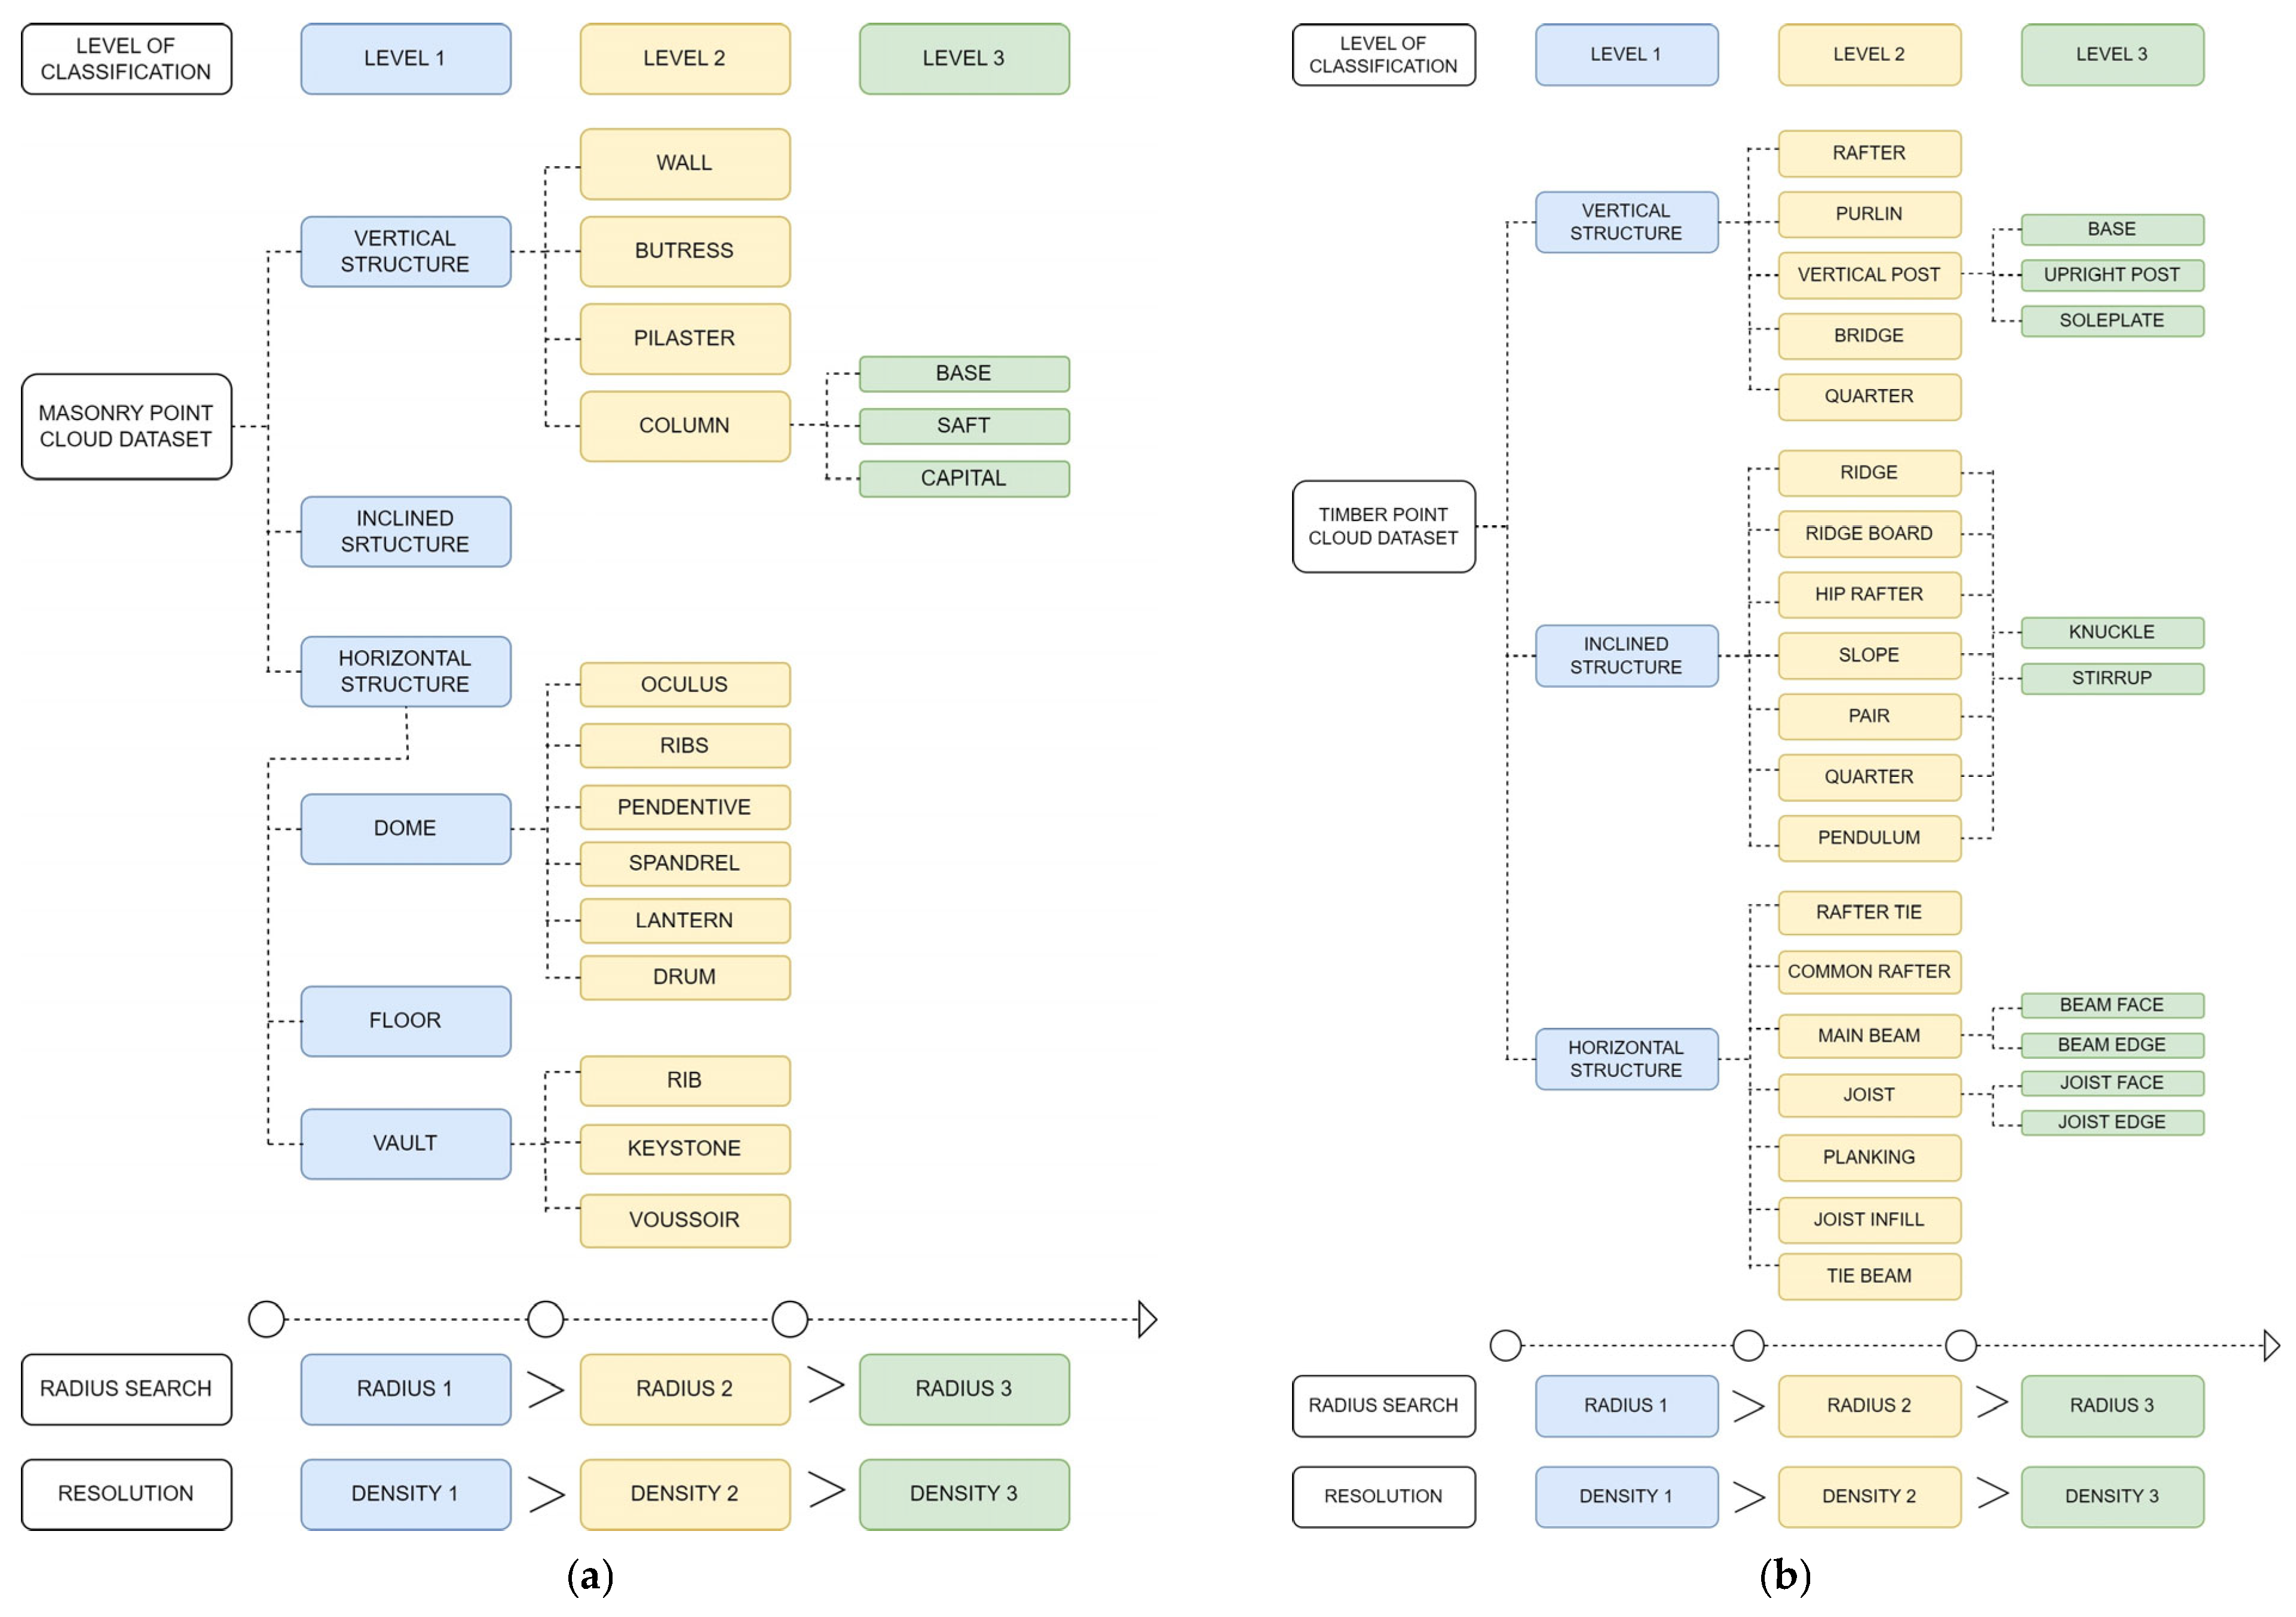
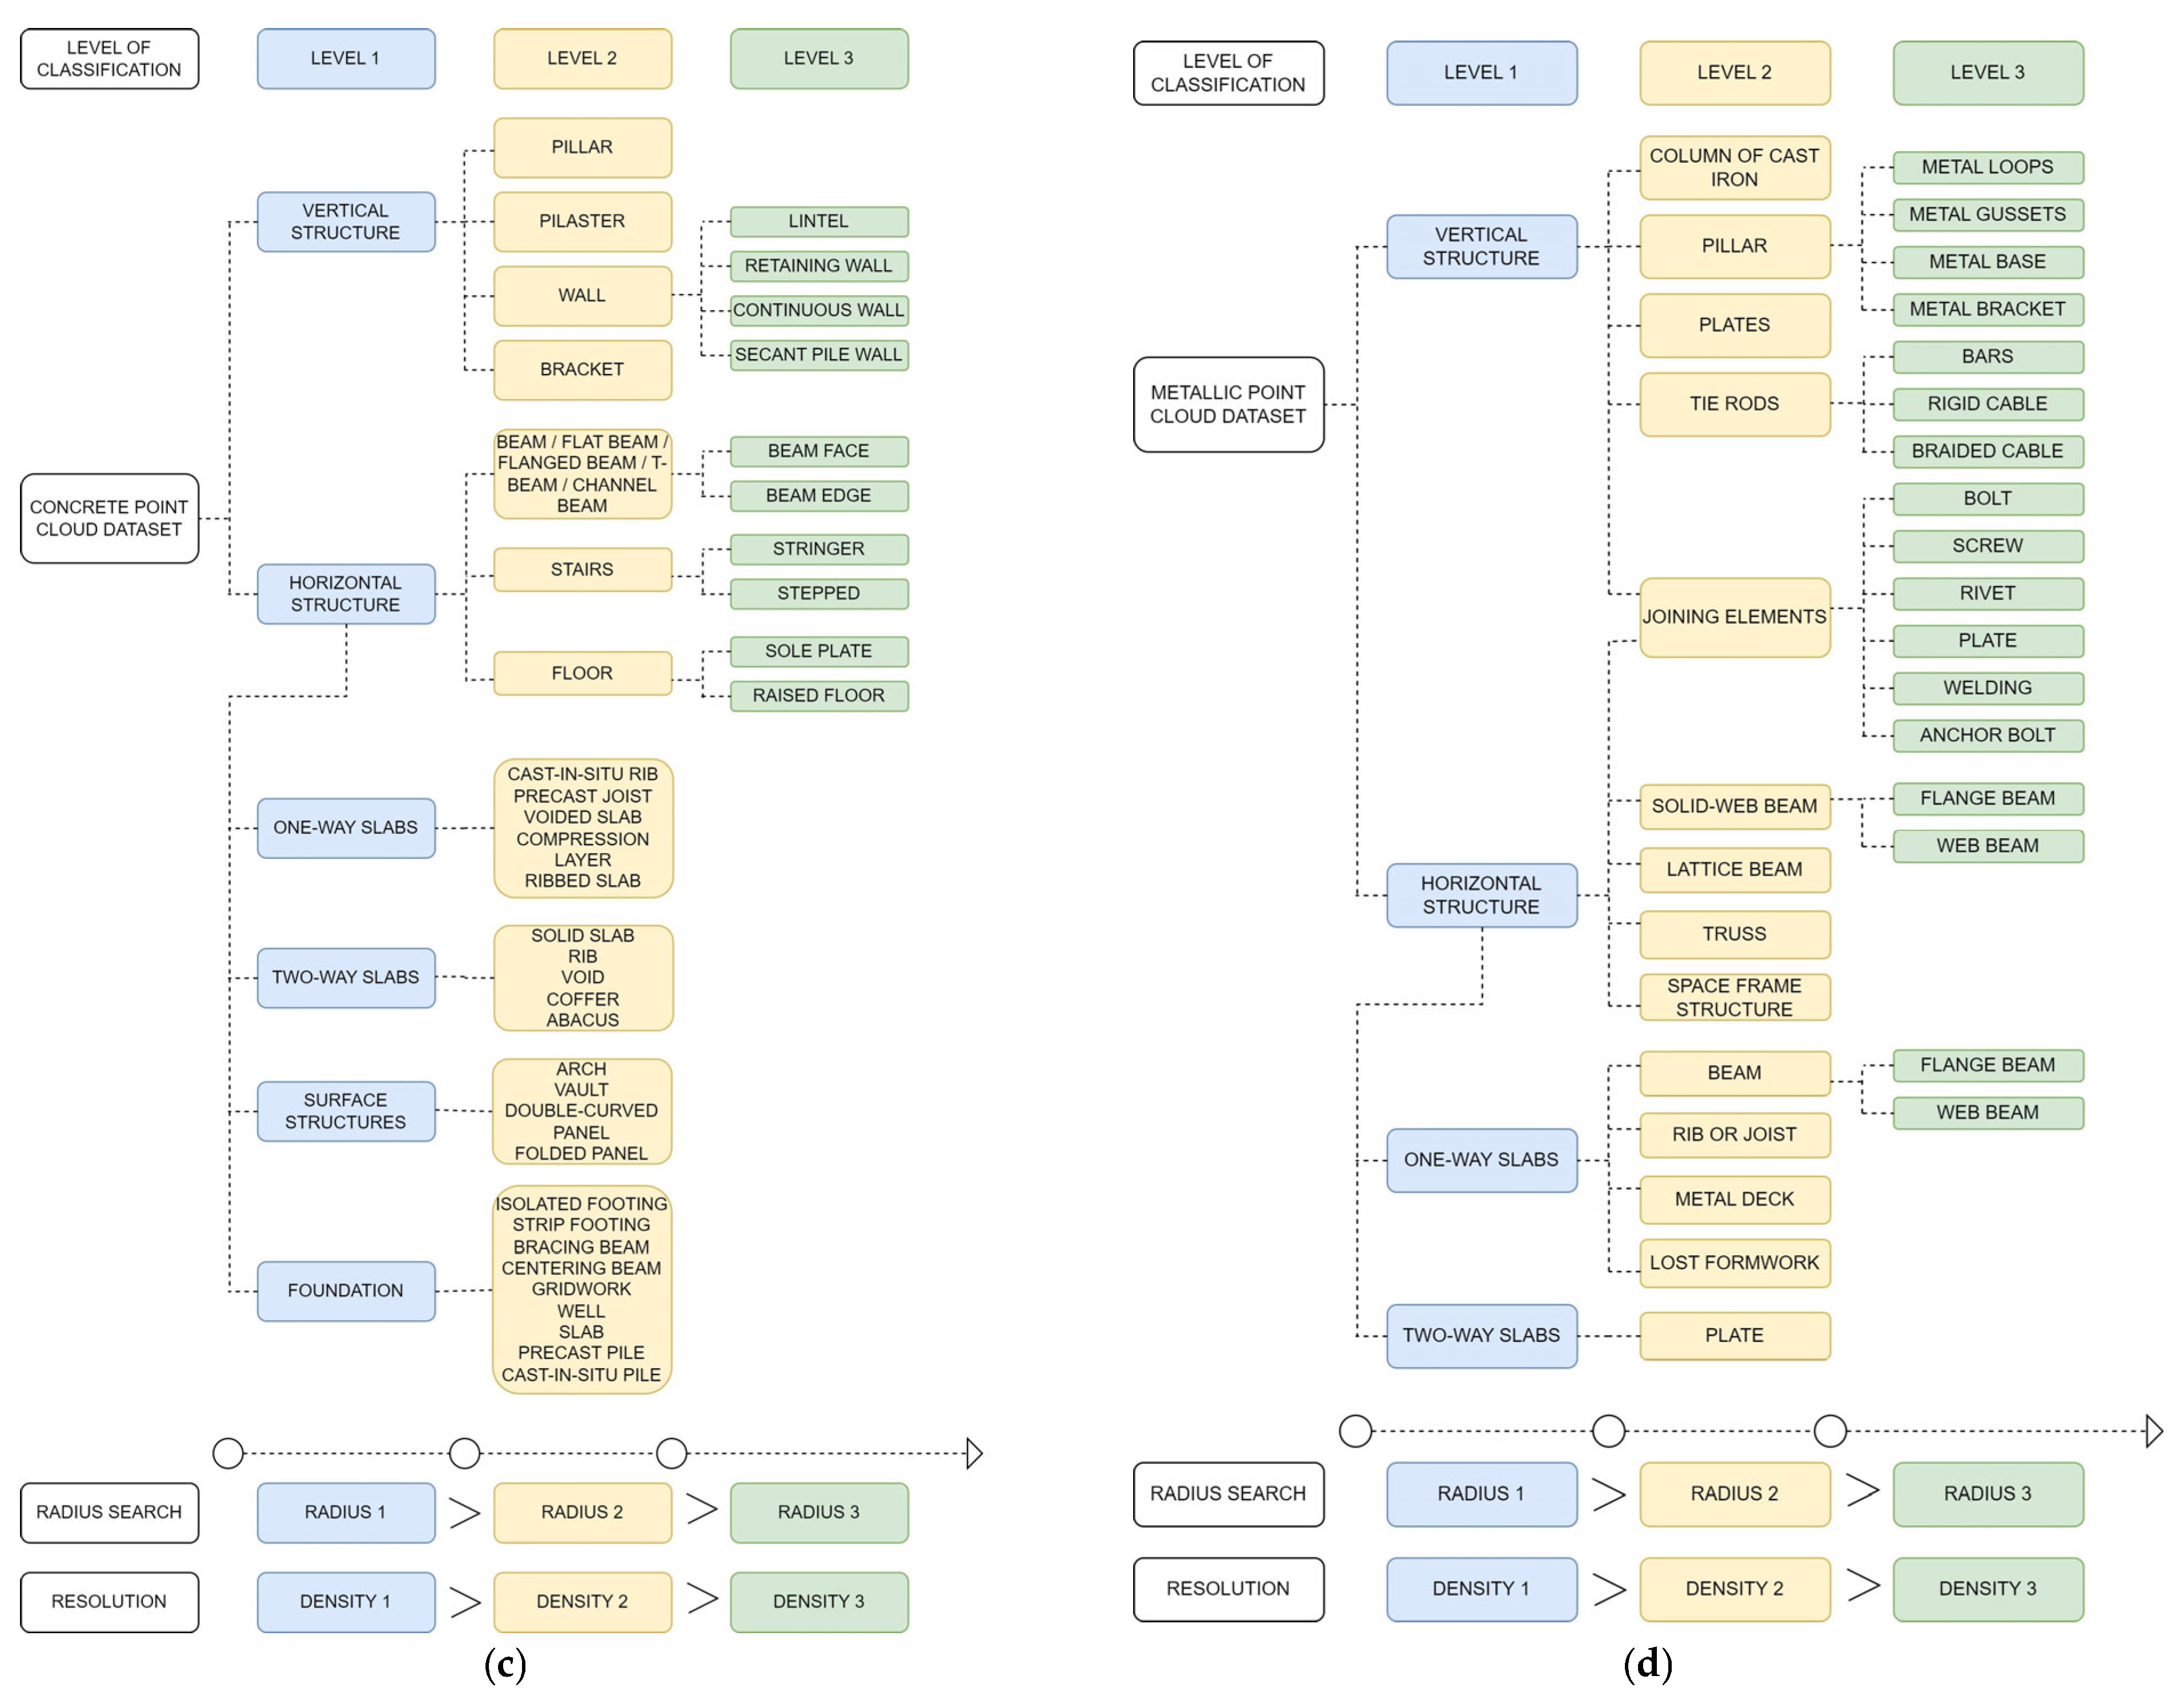
  • The proposal of several classification trees for constructive segmentation and damage detection.
  • The integration of novel strategies for evaluating deformations in arches and vaults, deflections in slabs, or inclinations in vertical elements.
  • The capacity to reduce the noise of the 3D point cloud, voxelise the 3D point cloud, or generate a web-viewer.
With respect to its GUI, the user-oriented interface has proven to be useful, particularly the user guide, which allows—with the help of several classification trees—the use of this tool in a user-friendly way.
Currently, the methodologies proposed show several limitations that could be used as the basis for planning future improvements and developments:
  • Training DL algorithms requires a large dataset, which could limit the application of these methods.
  • Both ML and DL methods show excellent performance. However, the results are not perfect and require the revision of the 3D point cloud by an expert user. The outcomes and performance in different situations were evaluated through a series of case studies on historical building diagnosis, presented in Section 4. In some cases, the process could not be fully automated, and minor manual adjustments were required. However, these adjustments demanded significantly less time compared to a fully manual segmentation.
  • The module devoted to the analysis of inclinations in vertical elements requires a point cloud with no shadows or that is mostly complete. This is because otherwise the fitting strategies could lead to a sub-optimal result.
  • The results cannot be translated directly to Building Information Modelling (BIM). It is necessary to develop ad hoc scripts.
  • Future works will focus on including new functionalities to the plugin, namely
  • Integration of synthetic 3D point clouds. This will enable the training of DL methods by following a similar strategy to that employed by Jing et al. [73].
  • Development of scripts for integrating the data extracted by the software in BIM environments. In this regard, there are plans to implement the approaches defined by Gago et al. [69] and Barontini et al. [74], among others.
  • Improvement of the module for analysing deformations in arches and vaults by adding more typologies.
  • Improvement of the module for analysing inclination in vertical elements in situations where there is a large portion of shadows by approximating the element to common shapes (e.g., IPE section for steel, rectangular sections, etc.).

Author Contributions

Conceptualisation, L.J.S.-A., R.S.-M., P.S.-H., P.V.-L., J.R.A.-Z. and D.G.-A.; methodology, L.J.S.-A., R.S.-M. and P.S.-H.; software, L.J.S.-A., R.S.-M., P.S.-H. and D.G.-A.; investigation, L.J.S.-A., R.S.-M., P.S.-H., P.V.-L. and J.R.A.-Z.; resources, L.J.S.-A. and D.G.-A.; data curation, R.S.-M., P.S.-H. and P.V.-L.; writing—original draft preparation, L.J.S.-A., R.S.-M. and P.S.-H.; writing—review and editing, L.J.S.-A., R.S.-M., P.S.-H., P.V.-L., J.R.A.-Z. and D.G.-A.; supervision, L.J.S.-A. and D.G.-A.; project administration, L.J.S.-A. and D.G.-A.; funding acquisition, L.J.S.-A. and D.G.-A. All authors have read and agreed to the published version of the manuscript.

Funding

This work has been supported by the Community of Madrid and the Higher Polytechnic School of Madrid through the Project CAREEN (desarrollo de nuevos métodos basados en inteligenCia ARtificial para la caracterización de daños en construccionEs históricas a través de nubEs de puNtos 3D) with reference APOYO-JOVENES-21-RCDT1L-85-SL9E1R. Pablo Sanz’s pre-doctoral contract is part of grant PID2022-140071OB-C21, funded by MCIN/AEI/10.13039/501100011033 and ESF+.

Data Availability Statement

The software is available at the following link: https://github.com/RECONupm/Seg4D.git (accessed on 1 March 2025).

Conflicts of Interest

The authors declare no conflicts of interest.

References

  1. Morel, H.; Megarry, W.; Potts, A.; Hosagrahar, J.; Roberts, D.; Arikan, Y.; Brondizio, E.; Cassar, M.; Flato, G.; Forgesson, S.; et al. Global Research and Action Agenda on Culture, Heritage and Climate Change; Project Report; ICOMOS & ISCM CHC: Charenton-le-Pont, France, 2022; pp. 1–69. [Google Scholar]
  2. Pritchard, D.; Rigauts, T.; Ripanti, F.; Ioannides, M.; Brumana, R.; Davies, R.; Avouri, E.; Cliffen, H.; Joncic, N.; Osti, G.; et al. Study on Quality in 3D Digitisation of Tangible Cultural Heritage. In Proceedings of the Arqueológica 2.0—9th International Congress & 3rd GEORES—Geomatics and Preservation, Virtual Event, 26–28 April 2021. [Google Scholar] [CrossRef]
  3. Román, A. Reconstruction—From the Venice Charter to the Charter of Cracow 2000. 2002. Available online: https://openarchive.icomos.org/id/eprint/555/ (accessed on 1 March 2025).
  4. Xiao, W.; Mills, J.; Guidi, G.; Rodríguez-Gonzálvez, P.; Gonizzi Barsanti, S.; González-Aguilera, D. Geoinformatics for the Conservation and Promotion of Cultural Heritage in Support of the UN Sustainable Development Goals. ISPRS J. Photogramm. Remote Sens. 2018, 142, 389–406. [Google Scholar] [CrossRef]
  5. Yang, X.; Grussenmeyer, P.; Koehl, M.; Macher, H.; Murtiyoso, A.; Landes, T. Review of Built Heritage Modelling: Integration of HBIM and Other Information Techniques. J. Cult. Herit. 2020, 46, 350–360. [Google Scholar] [CrossRef]
  6. Moyano, J.; León, J.; Nieto-Julián, J.E.; Bruno, S. Semantic Interpretation of Architectural and Archaeological Geometries: Point Cloud Segmentation for HBIM Parameterisation. Autom. Constr. 2021, 130, 103856. [Google Scholar] [CrossRef]
  7. Yang, S.; Hou, M.; Li, S. Three-Dimensional Point Cloud Semantic Segmentation for Cultural Heritage: A Comprehensive Review. Remote Sens. 2023, 15, 548. [Google Scholar] [CrossRef]
  8. Sánchez-Aparicio, L.J.; Blanco-García, F.L.; Mencías-Carrizosa, D.; Villanueva-Llauradó, P.; Aira-Zunzunegui, J.R.; Sanz-Arauz, D.; Pierdicca, R.; Pinilla-Melo, J.; Garcia-Gago, J. Detection of Damage in Heritage Constructions Based on 3D Point Clouds. A Systematic Review. J. Build. Eng. 2023, 77, 107440. [Google Scholar] [CrossRef]
  9. González-Aguilera, D.; Soilán, M.; Morcillo, A.; del Pozo, S.; Courtenay, L.A.; Rodríguez-Gonzálvez, P.; Hernández-López, D. Intelligent Recording of Cultural Heritage: From Point Clouds to Semantic Enriched Models. In Diagnosis of Heritage Buildings by Non-Destructive Techniques; Woodhead Publishing: Cambridge, UK, 2024; pp. 183–218. [Google Scholar] [CrossRef]
  10. Teruggi, S.; Grilli, E.; Russo, M.; Fassi, F.; Remondino, F. A Hierarchical Machine Learning Approach for Multi-Level and Multi-Resolution 3D Point Cloud Classification. Remote Sens. 2020, 12, 2598. [Google Scholar] [CrossRef]
  11. Del Pozo, S.; Herrero-Pascual, J.; Felipe-García, B.; Hernández-López, D.; Rodríguez-Gonzálvez, P.; González-Aguilera, D. Multispectral Radiometric Analysis of Façades to Detect Pathologies from Active and Passive Remote Sensing. Remote Sens. 2016, 8, 80. [Google Scholar] [CrossRef]
  12. Sánchez-Aparicio, L.J.; Del Pozo, S.; Ramos, L.F.; Arce, A.; Fernandes, F.M. Heritage Site Preservation with Combined Radiometric and Geometric Analysis of TLS Data. Autom. Constr. 2018, 85, 24–39. [Google Scholar] [CrossRef]
  13. Valero, E.; Bosché, F.; Forster, A. Automatic Segmentation of 3D Point Clouds of Rubble Masonry Walls, and Its Application to Building Surveying, Repair and Maintenance. Autom. Constr. 2018, 96, 29–39. [Google Scholar] [CrossRef]
  14. Historic England. Photogrammetric Applications for Cultural Heritage; Historic England: London, UK, 2017. [Google Scholar]
  15. Historic England. 3D Laser Scanning for Heritage: Advice and Guidance on the Use of Laser Scanning in Archaeology and Architecture; Historic England: London, UK, 2018. [Google Scholar]
  16. Gonizzi Barsanti, S.; Marini, M.R.; Malatesta, S.G.; Rossi, A. Evaluation of Denoising and Voxelization Algorithms on 3D Point Clouds. Remote Sens. 2024, 16, 2632. [Google Scholar] [CrossRef]
  17. Sánchez-Aparicio, L.J.; Villanueva-Llauradó, P.; Sanz-Honrado, P.; Aira-Zunzunegui, J.R.; Pinilla Melo, J.; González-Aguilera, D.; Oliveira, D.V. Evaluation of a Slam-Based Point Cloud for Deflection Analysis in Historic Timber Floors. Int. Arch. Photogramm. Remote Sens. Spat. Inf. Sci. 2023, XLVIII-M-2–2023, 1411–1418. [Google Scholar] [CrossRef]
  18. Yue, H.; Wang, Q.; Zhao, H.; Zeng, N.; Tan, Y. Deep Learning Applications for Point Clouds in the Construction Industry. Autom. Constr. 2024, 168, 105769. [Google Scholar] [CrossRef]
  19. Xiao, X.; Wang, K.; Zhong, Z.; Qu, W.; Wu, W.; Cui, Z.; Su, Y.; Li, A.; Gong, J.; Li, D. A Novel Data-Driven Based High-Precision Building Roof Contour Full-Automatic Extraction and Structured 3D Reconstruction Method Combining Stereo Images and LiDAR Points. Int. J. Digit. Earth 2025, 18, 2484668. [Google Scholar] [CrossRef]
  20. Poux, F.; Mattes, C.; Selman, Z.; Kobbelt, L. Automatic Region-Growing System for the Segmentation of Large Point Clouds. Autom. Constr. 2022, 138, 104250. [Google Scholar] [CrossRef]
  21. Ochmann, S.; Vock, R.; Klein, R. Automatic Reconstruction of Fully Volumetric 3D Building Models from Oriented Point Clouds. ISPRS J. Photogramm. Remote Sens. 2019, 151, 251–262. [Google Scholar] [CrossRef]
  22. Rauch, L.; Braml, T. Semantic Point Cloud Segmentation with Deep-Learning-Based Approaches for the Construction Industry: A Survey. Appl. Sci. 2023, 13, 9146. [Google Scholar] [CrossRef]
  23. Mirzaei, K.; Arashpour, M.; Asadi, E.; Masoumi, H.; Bai, Y.; Behnood, A. 3D Point Cloud Data Processing with Machine Learning for Construction and Infrastructure Applications: A Comprehensive Review. Adv. Eng. Inform. 2022, 51, 101501. [Google Scholar] [CrossRef]
  24. Bagate, A.; Shah, M. Human Activity Recognition Using RGB-D Sensors. In Proceedings of the 2019 International Conference on Intelligent Computing and Control Systems, ICCS 2019, Madurai, India, 15–17 May 2019; pp. 902–905. [Google Scholar] [CrossRef]
  25. Pushkar, A.; Senthilvel, M.; Varghese, K. Automated Progress Monitoring of Masonry Activity Using Photogrammetric Point Cloud. In Proceedings of the ISARC 2018—35th International Symposium on Automation and Robotics in Construction and International AEC/FM Hackathon: The Future of Building Things, Berlin, Germany, 20–25 July 2018. [Google Scholar] [CrossRef]
  26. Mohammadi, M.E.; Wood, R.L.; Wittich, C.E. Non-Temporal Point Cloud Analysis for Surface Damage in Civil Structures. ISPRS Int. J. Geo-Inf. 2019, 8, 527. [Google Scholar] [CrossRef]
  27. Galantucci, R.A.; Musicco, A.; Verdoscia, C.; Fatiguso, F. Machine Learning for the Semi-Automatic 3D Decay Segmentation and Mapping of Heritage Assets. Int. J. Archit. Herit. 2023, 19, 389–407. [Google Scholar] [CrossRef]
  28. Matrone, F.; Grilli, E.; Martini, M.; Paolanti, M.; Pierdicca, R.; Remondino, F. Comparing Machine and Deep Learning Methods for Large 3D Heritage Semantic Segmentation. ISPRS Int. J. Geo-Inf. 2020, 9, 535. [Google Scholar] [CrossRef]
  29. Grilli, E.; Özdemir, E.; Remondino, F. Application of Machine and Deep Learning Strategies for the Classification of Heritage Point Clouds. Int. Arch. Photogramm. Remote Sens. Spat. Inf. Sci. 2019, XLII-4-W18, 447–454. [Google Scholar] [CrossRef]
  30. Qi, C.R.; Su, H.; Mo, K.; Guibas, L.J. PointNet: Deep Learning on Point Sets for 3D Classification and Segmentation. In Proceedings of the 30th IEEE Conference on Computer Vision and Pattern Recognition, CVPR 2017, Honolulu, HI, USA, 21–26 July 2017; pp. 77–85. [Google Scholar] [CrossRef]
  31. Wu, X.; Jiang, L.; Wang, P.S.; Liu, Z.; Liu, X.; Qiao, Y.; Ouyang, W.; He, T.; Zhao, H. Point Transformer V3: Simpler, Faster, Stronger. In Proceedings of the IEEE Computer Society Conference on Computer Vision and Pattern Recognition, Seattle, WA, USA, 16–22 June 2024; pp. 4840–4851. [Google Scholar] [CrossRef]
  32. Kim, Y.; Nguyen, C.H.P.; Choi, Y. Automatic Pipe and Elbow Recognition from Three-Dimensional Point Cloud Model of Industrial Plant Piping System Using Convolutional Neural Network-Based Primitive Classification. Autom. Constr. 2020, 116, 103236. [Google Scholar] [CrossRef]
  33. Braun, A.; Tuttas, S.; Borrmann, A.; Stilla, U. Improving Progress Monitoring by Fusing Point Clouds, Semantic Data and Computer Vision. Autom. Constr. 2020, 116, 103210. [Google Scholar] [CrossRef]
  34. Tang, S.; Li, X.; Zheng, X.; Wu, B.; Wang, W.; Zhang, Y. BIM Generation from 3D Point Clouds by Combining 3D Deep Learning and Improved Morphological Approach. Autom. Constr. 2022, 141, 104422. [Google Scholar] [CrossRef]
  35. Pierdicca, R.; Paolanti, M.; Matrone, F.; Martini, M.; Morbidoni, C.; Malinverni, E.S.; Frontoni, E.; Lingua, A.M. Point Cloud Semantic Segmentation Using a Deep Learning Framework for Cultural Heritage. Remote Sens. 2020, 12, 1005. [Google Scholar] [CrossRef]
  36. Lou, Y.; Meng, S.; Zhou, Y. Deep Learning-Based Three-Dimensional Crack Damage Detection Method Using Point Clouds without Color Information. Struct. Health Monit. 2024, 24, 657–675. [Google Scholar] [CrossRef]
  37. Zhao, S.; Kang, F.; Li, J.; Ma, C. Structural Health Monitoring and Inspection of Dams Based on UAV Photogrammetry with Image 3D Reconstruction. Autom. Constr. 2021, 130, 103832. [Google Scholar] [CrossRef]
  38. Raushan, R.; Singhal, V.; Jha, R.K. Damage Detection in Concrete Structures with Multi-Feature Backgrounds Using the YOLO Network Family. Autom. Constr. 2025, 170, 105887. [Google Scholar] [CrossRef]
  39. Jiang, Y.; Pang, D.; Li, C.; Wang, J. A Method of Concrete Damage Detection and Localization Based on Weakly Supervised Learning. Comput.-Aided Civ. Infrastruct. Eng. 2024, 39, 1042–1060. [Google Scholar] [CrossRef]
  40. Zhang, W.J.; Wan, H.P.; Todd, M.D. An Efficient 2D-3D Fusion Method for Bridge Damage Detection Under Complex Backgrounds with Imbalanced Training Data. Adv. Eng. Inform. 2025, 65, 103373. [Google Scholar] [CrossRef]
  41. Yamane, T.; Chun, P.-j.; Honda, R. Detecting and Localising Damage Based on Image Recognition and Structure from Motion, and Reflecting It in a 3D Bridge Model. Struct. Infrastruct. Eng. 2024, 20, 594–606. [Google Scholar] [CrossRef]
  42. Shibano, K.; Morozova, N.; Ito, Y.; Shimamoto, Y.; Tachibana, Y.; Suematsu, K.; Chiyoda, A.; Ito, H.; Suzuki, T. Evaluation of Surface Damage for In-Service Deteriorated Agricultural Concrete Headworks Using 3D Point Clouds by Laser Scanning Method. Paddy Water Environ. 2024, 22, 257–269. [Google Scholar] [CrossRef]
  43. Ankerst, M.; Breunig, M.M.; Kriegel, H.P.; Sander, J. OPTICS. ACM SIGMOD Record 1999, 28, 49–60. [Google Scholar] [CrossRef]
  44. Brodu, N.; Lague, D. 3D Terrestrial Lidar Data Classification of Complex Natural Scenes Using a Multi-Scale Dimensionality Criterion: Applications in Geomorphology. ISPRS J. Photogramm. Remote Sens. 2012, 68, 121–134. [Google Scholar] [CrossRef]
  45. Lague, D.; Brodu, N.; Leroux, J. Accurate 3D Comparison of Complex Topography with Terrestrial Laser Scanner: Application to the Rangitikei Canyon (N-Z). ISPRS J. Photogramm. Remote Sens. 2013, 82, 10–26. [Google Scholar] [CrossRef]
  46. Costamagna, E.; Santana Quintero, M.; Bianchini, N.; Mendes, N.; Lourenço, P.B.; Su, S.; Paik, Y.M.; Min, A. Advanced Non-Destructive Techniques for the Diagnosis of Historic Buildings: The Loka-Hteik-Pan Temple in Bagan. J. Cult. Herit. 2020, 43, 108–117. [Google Scholar] [CrossRef]
  47. Dominici, D.; Alicandro, M.; Rosciano, E.; Massimi, V. Multiscale Documentation and Monitoring of l’aquila Historical Centre Using Uav Photogrammetry. Int. Arch. Photogramm. Remote Sens. Spat. Inf. Sci. ISPRS Arch. 2017, 42, 365–371. [Google Scholar] [CrossRef]
  48. Croce, V.; Caroti, G.; De Luca, L.; Jacquot, K.; Piemonte, A.; Véron, P. From the Semantic Point Cloud to Heritage-Building Information Modeling: A Semiautomatic Approach Exploiting Machine Learning. Remote Sens. 2021, 13, 461. [Google Scholar] [CrossRef]
  49. Weinmann, M.; Jutzi, B.; Hinz, S.; Mallet, C. Semantic Point Cloud Interpretation Based on Optimal Neighborhoods, Relevant Features and Efficient Classifiers. ISPRS J. Photogramm. Remote Sens. 2015, 105, 286–304. [Google Scholar] [CrossRef]
  50. Valero, E.; Forster, A.; Bosché, F.; Hyslop, E.; Wilson, L.; Turmel, A. Automated Defect Detection and Classification in Ashlar Masonry Walls Using Machine Learning. Autom. Constr. 2019, 106, 102846. [Google Scholar] [CrossRef]
  51. Grilli, E.; Farella, E.M.; Torresani, A.; Remondino, F. Geometric Features Analysis for the Classification of Cultural Heritage Point Clouds. Int. Arch. Photogramm. Remote Sens. Spat. Inf. Sci. 2019, XLII-2-W15, 541–548. [Google Scholar] [CrossRef]
  52. Dong, L.; Syed, K. OptimalFlow. 2020. Available online: https://github.com/tonyleidong/OptimalFlow.git (accessed on 1 February 2025).
  53. Zhao, H.; Jiang, L.; Jia, J.; Torr, P.; Koltun, V. Point Transformer. In Proceedings of the IEEE International Conference on Computer Vision, Seattle, WA, USA, 13–19 June 2020; pp. 16239–16248. [Google Scholar] [CrossRef]
  54. Armeni, I.; Sener, O.; Zamir, A.R.; Jiang, H.; Brilakis, I.; Fischer, M.; Savarese, S. 3D Semantic Parsing of Large-Scale Indoor Spaces. In Proceedings of the IEEE Conference on Computer Vision and Pattern Recognition, Las Vegas, NV, USA, 27–30 June 2016; pp. 1534–1543. [Google Scholar]
  55. Wu, Z.; Song, S.; Khosla, A.; Yu, F.; Zhang, L.; Tang, X.; Xiao, J. 3D ShapeNets: A Deep Representation for Volumetric Shapes. In Proceedings of the IEEE Computer Society Conference on Computer Vision and Pattern Recognition, Boston, MA, USA, 7–12 June 2015; pp. 1912–1920. [Google Scholar] [CrossRef]
  56. Yi, L.; Kim, V.G.; Ceylan, D.; Shen, I.C.; Yan, M.; Su, H.; Lu, C.; Huang, Q.; Sheffer, A.; Guibas, L. A Scalable Active Framework for Region Annotation in 3D Shape Collections. ACM Trans. Graph. 2016, 35, 210. [Google Scholar] [CrossRef]
  57. Matrone, F.; Lingua, A.; Pierdicca, R.; Malinverni, E.S.; Paolanti, M.; Grilli, E.; Remondino, F.; Murtiyoso, A.; Landes, T. A Benchmark For Large-Scale Heritage Point Cloud Semantic Segmentation. Int. Arch. Photogramm. Remote Sens. Spat. Inf. Sci. 2020, XLIII-B2-2020, 1419–1426. [Google Scholar] [CrossRef]
  58. Dong, Z.; Liang, F.; Yang, B.; Xu, Y.; Zang, Y.; Li, J.; Wang, Y.; Dai, W.; Fan, H.; Hyyppäb, J.; et al. Registration of Large-Scale Terrestrial Laser Scanner Point Clouds: A Review and Benchmark. ISPRS J. Photogramm. Remote Sens. 2020, 163, 327–342. [Google Scholar] [CrossRef]
  59. Hackel, T.; Savinov, N.; Ladicky, L.; Wegner, J.D.; Schindler, K.; Pollefeys, M. Semantic3D.Net: A New Large-Scale Point Cloud Classification Benchmark. ISPRS Ann. Photogramm. Remote Sens. Spat. Inf. Sci. 2017, 4, 91–98. [Google Scholar] [CrossRef]
  60. ICOMOS Illustrated Glossary on Stone Deterioration Patterns. Monum. Sitios XV 2008, 1, 82.
  61. Ye, C.; Acikgoz, S.; Pendrigh, S.; Riley, E.; DeJong, M.J. Mapping Deformations and Inferring Movements of Masonry Arch Bridges Using Point Cloud Data. Eng. Struct. 2018, 173, 530–545. [Google Scholar] [CrossRef]
  62. Sacco, G.L.S.; Battini, C.; Calderini, C. Damage Detection in Heritage Vaults Through Geometric Deformation Analysis. Lect. Notes Civ. Eng. 2024, 437, 171–179. [Google Scholar] [CrossRef]
  63. Schnabel, R.; Wahl, R.; Klein, R. Efficient RANSAC for Point-Cloud Shape Detection. Comput. Graph. Forum 2007, 26, 214–226. [Google Scholar] [CrossRef]
  64. Huerta Fernández, S. Mechanics of Masonry Vaults: The Equilibrium Approach. In Mechanics of Masonry Vaults: The Equilibrium Approach|En: Historical Constructions. Possibilities of Numerical and Experimental Techniques; Universidade do Minho: Braga, Portugal, 2001; pp. 47–70. [Google Scholar]
  65. Xu, Z.; Foi, A. Anisotropic Denoising of 3D Point Clouds by Aggregation of Multiple Surface-Adaptive Estimates. IEEE Trans. Vis. Comput. Graph. 2021, 27, 2851–2868. [Google Scholar] [CrossRef]
  66. Sánchez-Aparicio, L.J.; Mora, R.; Conde, B.; Maté-González, M.Á.; Sánchez-Aparicio, M.; González-Aguilera, D. Integration of a Wearable Mobile Mapping Solution and Advance Numerical Simulations for the Structural Analysis of Historical Constructions: A Case of Study in San Pedro Church (Palencia, Spain). Remote Sens 2021, 13, 1252. [Google Scholar] [CrossRef]
  67. Gaspari, F.; Barbieri, F.; Fascia, R.; Ioli, F.; Pinto, L. An Open-Source Web Platform for 3D Documentation and Storytelling of Hidden Cultural Heritage. Heritage 2024, 7, 517–536. [Google Scholar] [CrossRef]
  68. Villanueva Llauradó, P.; Maté González, M.Á.; Sánchez Aparicio, L.J.; Benito Pradillo, M.Á.; González Aguilera, D.; García Palomo, L.C. A Comparative Study Between a Static and a Mobile Laser Scanner for the Digitalization of Inner Spaces in Historical Constructions. In Proceedings of the Construction Pathology, Rehabilitation Technology and Heritage Management, Granada, Spain, 13–16 September 2022; pp. 2492–2498. [Google Scholar]
  69. Sánchez-Aparicio, L.J.; Masciotta, M.G.; Pellegrini, D.; Conde, B.; Girardi, M.; Padovani, C.; Ramos, L.F.; Riveiro, B. A Multidisciplinary Approach Integrating Geomatics, Dynamic Field Testing and Finite Element Modelling to Evaluate the Conservation State of the Guimarães Castle’s Tower Keep. In Proceedings of the International Conference on Structural Dynamic, EURODYN, Athens, Greece, 23–26 November 2020; Volume 1, pp. 2310–2322. [Google Scholar] [CrossRef]
  70. Garcia-Gago, J.; Sánchez-Aparicio, L.J.; Soilán, M.; González-Aguilera, D. HBIM for Supporting the Diagnosis of Historical Buildings: Case Study of the Master Gate of San Francisco in Portugal. Autom. Constr. 2022, 141, 104453. [Google Scholar] [CrossRef]
  71. Viana Da Fonseca, A.; Karam, K.; Ribeiro E Sousa, O.L. Studies and Investigations on Forts with Portuguese Legacy. In Proceedings of the 4th Central Asia Geotechnical Symposium on Geo-Engineering for Construction and Conservation of Cultural Heritage and Historical Site, Samarkand, Uzbekistan, 21–23 September 2012; pp. 67–72. [Google Scholar]
  72. Heyman, J. The Stone Skeleton. Int J Solids Struct 1966, 2, 249–279. [Google Scholar] [CrossRef]
  73. Jing, Y.; Sheil, B.; Acikgoz, S. Segmentation of Large-Scale Masonry Arch Bridge Point Clouds with a Synthetic Simulator and the BridgeNet Neural Network. Autom. Constr. 2022, 142, 104459. [Google Scholar] [CrossRef]
  74. Barontini, A.; Alarcon, C.; Sousa, H.S.; Oliveira, D.V.; Masciotta, M.G.; Azenha, M. Development and Demonstration of an HBIM Framework for the Preventive Conservation of Cultural Heritage. Int. J. Archit. Herit. 2022, 16, 1451–1473. [Google Scholar] [CrossRef]
Figure 1. Seg4D’s workflow.
Remotesensing 17 02018 g001
Figure 3. “Construction system segmentation” tab: (a) appearance of a 3D point cloud labelled by construction systems and (b) appearance of the GUI.
Remotesensing 17 02018 g003
Figure 7. The appearance of the GUI devoted to configuring the unsupervised machine learning algorithms.
Remotesensing 17 02018 g007
Figure 8. Proposal of classification trees for (a) masonry structures, (b) timber structures, (c) concrete structures and (d) steel structures.
Remotesensing 17 02018 g008aRemotesensing 17 02018 g008b
Figure 9. Example outputs of model evaluation produced by Seg4D: (a) confusion matrix, (b) evolution of IoU per class and (c) feature importance.
Remotesensing 17 02018 g009
Figure 10. “Damage Detection” tab: (a) out-of-plane deformation of the roof calculated as the distance between the 3D point cloud and some reference planes and (b) appearance of the GUI.
Remotesensing 17 02018 g010
Figure 11. Damage classification tree based on the systematic review of Sanchez-Aparicio et al. [8]. The first column is the level of classification that a 3D point cloud could discern.
Remotesensing 17 02018 g011
Figure 12. Graphical workflow for the estimation of deformation in arches.
Remotesensing 17 02018 g012
Figure 13. Scheme of the vault deformation analysis algorithm.
Remotesensing 17 02018 g013
Figure 14. Output deformation graph of the arch generated by the module: (a) example of a plot of the tested arch and (b) designated arch for testing the module.
Remotesensing 17 02018 g014
Figure 15. Graphical workflow for the deflection algorithm. The delta values reflect the maximum deflection value of each beam.
Remotesensing 17 02018 g015
Figure 16. Results obtained from applying the deflection algorithm on a timber slab: (a) example of a beam plot and (b) graphical results in the form of a new scalar field of the 3D point cloud. The beams plotted in red do not fullfil the deflection requirements. The beams in green fullfill the deflection requirements.
Remotesensing 17 02018 g016
Figure 17. Scheme of the inclination analysis algorithm.
Remotesensing 17 02018 g017
Figure 18. “Other methods” tab: appearance of the GUI.
Remotesensing 17 02018 g018
Figure 19. Noise reduction tool working on a 3D point cloud slab: (a) complete model in which the subset is marked in red; (b) the subset before the application of the noise reduction algorithm and (c) the subset after the application of the noise reduction algorithm.
Remotesensing 17 02018 g019
Figure 20. Results obtained after passing the 3D point cloud into the Potree viewer.
Remotesensing 17 02018 g020
Figure 21. General views of the timber slabs of the Nuestra Señora de Gracia convent. Adapted from [69]. (a) Biblical women’s room, (b) room 3 and (c) room 4.
Remotesensing 17 02018 g021
Figure 22. Geometrical feature computation algorithm of Seg4D software in operation: (a) Appearance of the GUI and (b) results obtained by computing the Eigenentropy of the 3D point cloud. Warm values indicate higher values. Meanwhile, the cold values indicate the lower ones.
Remotesensing 17 02018 g022aRemotesensing 17 02018 g022b
Figure 23. Auto-Machine Learning algorithm of the Seg4D software in operation: (a) appearance of the GUI and (b) results obtained after the application of the AutoML approach.
Remotesensing 17 02018 g023
Figure 24. Predicted labels for the different levels of classification: (a) first, (b) second and (c) third level.
Remotesensing 17 02018 g024
Figure 25. Results obtained during the application of the algorithm: (a) results obtained by the structural engineer after proper adjustment of the support stiffnesses and (b) example of one of the deflection curves.
Remotesensing 17 02018 g025
Figure 26. Current state of conservation of the San Francisco Master Gate: (a) detailed view of the vault’s masonry that connects both façades. Adapted from Sánchez-Aparicio et al. [12]; and (b) general view of the main entrance.
Remotesensing 17 02018 g026
Figure 27. Results from the DL classification: (a) evolution of the IoU index for the indoor classes (wall, vault, floor), (b) evolution of the IoU index for the outdoor classes (wall, slope, floor) and (c) predicted results based on PTNN for the validation dataset.
Remotesensing 17 02018 g027aRemotesensing 17 02018 g027b
Figure 28. Results obtained from the radiometric-based strategy on the walls, vault and slope.
Remotesensing 17 02018 g028
Figure 29. Detection of material losses on the vault by means of the AutoML approach.
Remotesensing 17 02018 g029
Figure 30. General view of Guimaraes Castle in Portugal: (a) indoors and (b) outdoors.
Remotesensing 17 02018 g030
Figure 31. Point cloud of the keep tower of Guimaraes Castle: (a) with labels representing the different construction systems and (b) with RGB colour.
Remotesensing 17 02018 g031
Figure 32. Damage detection of the tower of Guimaraes Castle: (a) labelled merlons in accordance with their stability risk and (b) out-of-plane deformations present in the masonry walls.
Remotesensing 17 02018 g032
Table 1. Relation of algorithms that could be used for damage detection. Note: Algorithms marked with an asterisk (*) are exclusive to the Seg4D software, while the remaining algorithms can be executed using CloudCompare independently.
Approaches that Could Be UsedDamage Class
Sections and curve fitting strategies
Point-to-point distance
Point to primitive
Geometrical features. Possible use of statistical features*
Threshold by using scalar fields. Possible use of statistical features *
Supervised machine learning *
Unsupervised machine learning *
Cracks and fissures
Sections and curve fitting strategies. Possible in-depth evaluation of deflection in slabs, inclination in pillars/columns/buttresses or deformation in arches and vaults *
Point-to-point distance
Point to primitive
Point to 3D model
Geometrical features. Possible use of statistical features *
Deformations
Geometrical features. Possible use of statistical features *
Threshold by using scalar fields. Possible use of statistical features *
Supervised machine learning *
Unsupervised machine learning *
Detachment
Sections and curve fitting strategies
Threshold by using scalar fields. Possible use of statistical features *
Supervised machine learning *
Unsupervised machine learning *
Features induced by material loss
Geometrical features. Possible use of statistical features *
Threshold by using scalar fields. Possible use of statistical features *
Supervised machine learning *
Unsupervised machine learning *
Discolouration and deposits
Threshold by using scalar fields. Possible use of statistical features*
Supervised machine learning *
Unsupervised machine learning *
Biological colonisation
Table 2. Classification metrics at different segmentation levels.
F1 Score (%)Recall (%)Precision (%)
Level 1
99.799.999.5Floor
98.598.099.0Wall
97.898.497.1Slab
98.798.898.5Macro average
98.598.598.5Weighted average
Level 2
97.898.197.5Timber joist
97.397.097.7Timber deck
97.697.697.6Macro average
97.697.697.6Weighted average
Level 3
99.199.199.2Joist edge
99.499.499.4Joist face
99.399.399.3Macro average
99.399.399.3Weighted average
Disclaimer/Publisher’s Note: The statements, opinions and data contained in all publications are solely those of the individual author(s) and contributor(s) and not of MDPI and/or the editor(s). MDPI and/or the editor(s) disclaim responsibility for any injury to people or property resulting from any ideas, methods, instructions or products referred to in the content.

