Next Article in Journal
A Holistic Solution for Supporting the Diagnosis of Historic Constructions from 3D Point Clouds
Previous Article in Journal
Mapping Mountain Permafrost via GPR-Augmented Machine Learning in the Northeastern Qinghai–Tibet Plateau
Previous Article in Special Issue
Joint-Pixel Inversion for Ground Phase and Forest Height Estimation Using Spaceborne Polarimetric SAR Interferometry
 
 
Due to scheduled maintenance work on our database systems, there may be short service disruptions on this website between 10:00 and 11:00 CEST on June 14th.
Article

Effects of Drought Stress on the Relationship Between Solar-Induced Chlorophyll Fluorescence and Gross Primary Productivity in a Chinese Cork Oak Plantation

1
Key Laboratory of Tree Breeding and Cultivation of State Forestry Administration, Research Institute of Forestry, Chinese Academy of Forestry, Beijing 100091, China
2
Henan Xiaolangdi Forest Ecosystem National Observation and Research Station, Jiyuan 454650, China
3
Collaborative Innovation Center of Sustainable Forestry in Southern China, Nanjing Forestry University, Nanjing 210037, China
*
Author to whom correspondence should be addressed.
These authors contributed equally to this work.
Remote Sens. 2025, 17(12), 2017; https://doi.org/10.3390/rs17122017
Submission received: 25 April 2025 / Revised: 4 June 2025 / Accepted: 8 June 2025 / Published: 11 June 2025

Abstract

:
Solar-induced chlorophyll fluorescence (SIF) is a powerful tool for the estimation of gross primary productivity (GPP), but the relationship between SIF and GPP under drought stress remains incompletely understood. Elucidating the response of the relationship between SIF and GPP to drought stress is essential in order to enhance the precision of GPP estimation in forests. In this study, we obtained SIF in the red (SIF687) and far-red (SIF760) bands and GPP data from tower flux observations in a Chinese cork oak plantation to explore the response of the diurnal GPP-SIF relationship to drought stress. The plant water stress index (PWSI) was used to quantify drought stress. The results show that drought reduced SIF and GPP, but GPP was more sensitive to drought stress than SIF. The diurnal non-linear relationship of GPP-SIF (R2) decreased with the increase in drought stress, but a significant non-linear correlation remained for GPP-SIF (R2_GPP-SIF760 = 0.30, R2_GPP-SIF687 = 0.23) under severe drought stress (PWSIbin: 0.8–0.9). Physiological coupling strengthened the GPP-SIF relationship under drought, while canopy structure effects were negligible. Random forest and path analyses revealed that VPD was the key factor reducing the GPP-SIF correlation during drought. Incorporating VPD into the GPP-SIF relationship improved the GPP estimation accuracy by over 48% under severe drought stress. The red SIF allowed for more accurate GPP estimations than the far-red SIF under drought conditions. Our results offer important perspectives on the GPP-SIF relationship under drought conditions, potentially helping to improve GPP model predictions in the face of climate change.

1. Introduction

Forest ecosystems are the largest carbon reservoirs on land and serve as the main drivers of terrestrial carbon sinks, playing a crucial role in regulating terrestrial ecosystems and the global carbon cycle [1,2]. Photosynthesis is a key process in forest ecosystems, with the amount of carbon dioxide (CO2) assimilated per unit time and area through photosynthesis defined as gross primary productivity (GPP), representing the carbon sequestration capacity of forest ecosystems [3,4]. Precisely estimating the GPP of forest ecosystems across varying climate conditions is essential in comprehending the carbon storage potential of terrestrial ecosystems amid global changes.
Solar-induced chlorophyll fluorescence (SIF) provides an essential method for the tracking of photosynthesis and estimation of GPP [5,6,7]. Light energy absorbed by photosynthetic pigments is partly re-emitted as SIF, and the SIF spectrum ranges from 650 to 800 nm, with two peaks at around 687 nm (red SIF) and 760 nm (far-red SIF) [8]. The absorbed light energy is primarily used in two key processes, namely photosynthesis and non-photochemical quenching (NPQ), with a small portion released as SIF [9,10]. Thus, SIF is biologically linked to the photosynthetic mechanism, and it is a potential indicator of photosynthetic activity in remote sensing applications [11]. Previous studies have reported that SIF from various observation platforms, including satellite, airborne, and ground-based ones, can allow the estimation of GPP at the leaf, canopy, and ecosystem scales [5,6,7,12,13,14,15,16].
The intensity and frequency of drought events are projected to increase further with future climate change, exacerbating the negative impacts on photosynthesis and productivity in forests [17,18]. Consequently, it is crucial to analyze the impact of drought on the relationship between SIF and GPP to improve the accuracy of GPP estimation in forest ecosystems.
Under drought stress, vegetation exhibits both stomatal and non-stomatal responses. The reduction in stomatal conductance caused by drought limits CO2 exchange, resulting in a lower carboxylation rate and a higher photorespiration rate (stomatal response); severe drought affects the activity of ribulose-1,5-bisphosphate carboxylase/oxygenase (Rubisco) and enzymes related to the Calvin cycle, leading to a decrease in the electron transport rate (ETR) and inhibiting or downregulating photosynthesis (non-stomatal response) [19]. These physiological responses decouple light and carbon reactions in photosynthesis over different time scales [20]. Since SIF is directly associated with light rather than carbon reactions, the GPP-SIF correlation may weaken or even disappear under drought conditions, as already proven in previous studies. Wohlfahrt et al. [21] reported that SIF initially declined slightly and then dropped sharply during a heatwave, while GPP decreased linearly. According to Wieneke et al. [22], drought conditions notably weakened the linear correlation between SIF and GPP, highlighting the limitations of using SIF to monitor GPP under drought stress. Martini et al. [23] revealed that heatwaves disrupted the SIF-GPP relationship via NPQ interference. Similarly, Li and Xiao [24] highlighted that the TROPOMI SIF-GPP correlation was robust under normal or wet conditions but diminished significantly under drought conditions. However, Song et al. [25] and Shekhar et al. [26] observed no significant change in the GPP-SIF relationship before and after drought events. Wu et al. [27] found that SIF and GPP exhibited consistent seasonal trends under drought conditions due to drought stress activating photoprotective mechanisms in light reactions, such as the xanthophyll de-epoxidation cycle, leading to increased NPQ. As NPQ competes with photosynthesis and SIF for absorbed light energy, its rise leads to decreased photochemical activity and reduced SIF, often occurring in parallel with this reduction. Consequently, a strong linkage is observed between GPP and SIF under drought conditions. However, the complex regulatory interactions between photochemistry, SIF, and NPQ further complicate the GPP-SIF relationship during droughts. The GPP-SIF relationship and its variation patterns under drought conditions have not been fully explored, limiting the application of SIF in estimating GPP and monitoring photosynthesis under environmental stress.
The fluorescence yield of photosystem II (PSII) is more sensitive to variations in light intensity, photochemical quenching (PQ), and NPQ than that of photosystem I (PSI). Since the red SIF contains more PSII information, it is considered a more effective photosynthetic indicator and exhibits a stronger correlation with GPP than the far-red SIF [11,28]. However, whether the red SIF is more suitable for GPP estimation under drought conditions than the far-red SIF remains unknown.
Based on Monteith’s light use efficiency model, GPP and SIF can be divided into physiological and non-physiological components [27,29]. The SIF quantum yield (ΦF) and light use efficiency (LUE) represent the physiological components of SIF and GPP, respectively. The diversity of the LUE-ΦF relationship determines variations in the GPP-SIF relationship [22,30,31], but how this physiological link changes under drought conditions remains unclear. Incident radiation or photosynthetically active radiation (PAR) is another crucial non-physiological component driving variations in SIF and GPP, determining their diurnal patterns and serving as a mediator in the SIF-GPP relationship [13,32]. Studies have shown that the promotive effect of PAR on SIF and GPP weakens under drought stress [27,31,33], but its impact on the GPP-SIF relationship requires further investigation. The canopy structure is another critical non-physiological component that drives SIF and GPP. The observed SIF by sensors from the canopy only represents a portion of the total SIF emitted by all leaves that escape from the canopy. In contrast, GPP represents the cumulative GPP of all leaves in the canopy. The processes of scattering and reabsorption within the canopy add complexity to GPP estimation derived from SIF. Numerous studies suggest that the canopy structure plays a significant role in affecting the quantitative relationship between SIF and GPP, especially canopy structural changes caused by drought stress, such as changes in the leaf angle, leaf area index, and chlorophyll content [15,34,35]. However, the impact of the canopy structure on SIF, GPP, and their relationship under drought stress remains unclear.
Drought alters the water status of vegetation by reducing the availability of water in the soil and atmosphere and affects plant photosynthesis. The plant water stress index (PWSI), derived from evapotranspiration, quantitatively represents drought stress through vegetation’s physiological responses and is regarded as a dependable indicator of drought conditions [36,37]. Generally, when a drought occurs, other meteorological factors, such as radiation, atmospheric moisture, and soil moisture, will all change, thus synergistically affecting vegetation. Therefore, exploring the sensitivity of the SIF-GPP relationship to drought synergistic effect factors will help to enhance the understanding of the relationship between SIF and GPP under drought stress.
Oak forests, as a representative forest type in warm temperate monsoon regions, contribute significantly to the carbon cycle of the global terrestrial ecosystem. With a broad geographical distribution, Chinese cork oak stands provide an ideal situation for the examination of forest carbon sinks. In this study, we focused on a Chinse cork oak plantation, conducting continuous observations of the canopy red and far-red SIF, flux, and micrometeorological data from the growing season to analyze the impacts of drought stress on the GPP-SIF relationship. In this study, it was hypothesized that there would be a logarithmic functional relationship between SIF and GPP in a diurnal cycle. Our objectives were (1) to explore the responses of SIF, GPP, and their relationship to drought stress; (2) to compare the differences in GPP estimation between the red SIF and far-red SIF under drought conditions; (3) to analyze the roles played by both physiological and non-physiological components of SIF and GPP, as well as assessing how drought synergistic factors influence the GPP-SIF relationship; and (4) based on the findings regarding the above objectives, to explore potential approaches to enhance SIF-based GPP estimation by identifying key drought synergistic factors under drought conditions.

2. Materials and Methods
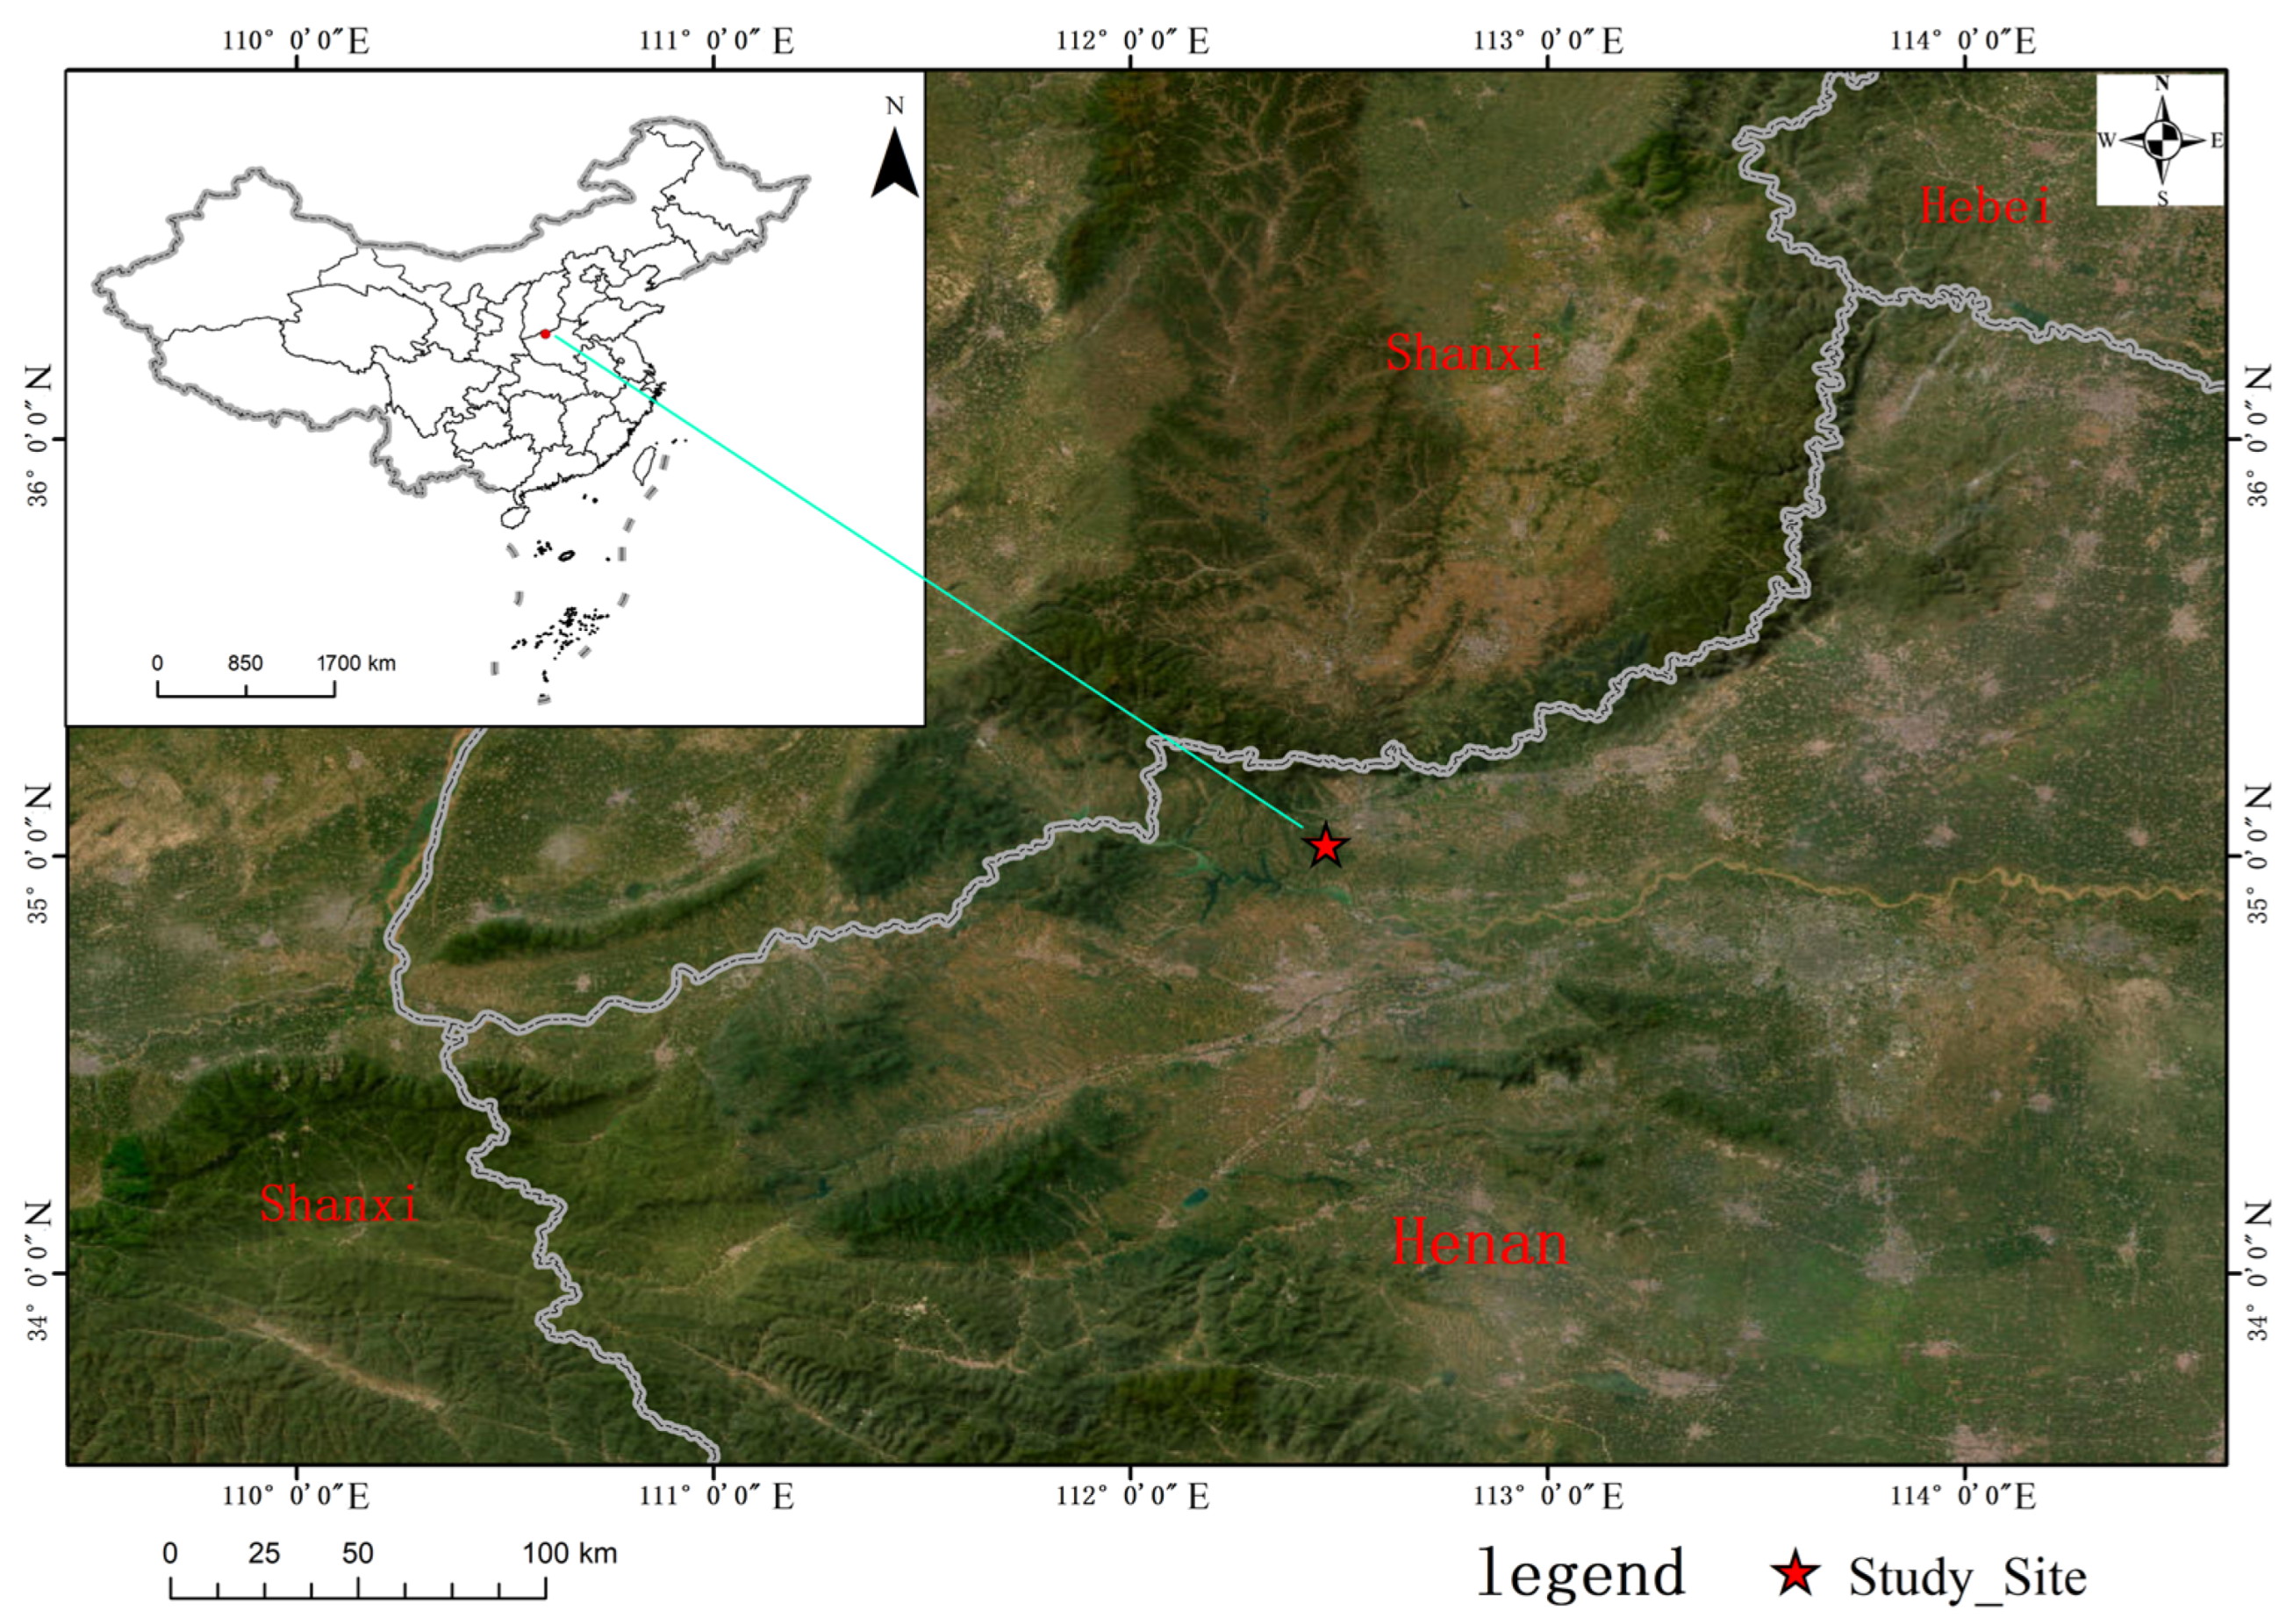
2.1. Study Area

The research site was the Henan Xiaolangdi Forest Ecosystem National Observation and Research Station (35°01′45″N, 112°28′08″E, average altitude: 410 m) (Figure 1). It is located in Jiyuan City, Henan Province, within the middle reaches of the Yellow River Basin. The station experiences a warm temperate continental monsoon climate with four distinct seasons. The average temperature is 13.4 °C. The annual rainfall was 641.70 mm from 2019 to 2021, and approximately 68.30% of the total precipitation falls in summer. Short-term seasonal drought stress frequently occurs in late spring and early autumn. The soil type is primarily leached brown soil (cinnamon soil) developed from limestone-weathered parent material, and the maximum soil depth is 40 cm. The Chinese cork oak plantation covers an area of approximately 7210 ha, with an average canopy height of 10 m. The growing season is from March to October, and the canopy remains closed from April to September. The observation periods in this study were from June to September in 2019 and from April to September in 2020 and 2021.

2.2. Data Observation

2.2.1. Flux and Meteorological Observations

The eddy covariance (EC) flux observation system includes an eddy correlation system with a fast-response infrared CO2/H2O analyzer (IRGA, Li-7500, Li-COR Inc., Lincoln, NE, USA) and a 3-D sonic anemometer (CSAT 3, Campbell Scientific Inc., Logan, UT, USA). The EC system was installed on a tower 36 m above the ground. Raw data were recorded at a frequency of 10 Hz using a data logger (CR 1000, Campbell Scientific Inc., Logan, UT, USA).
A meteorological observation system was installed in the observation tower. The air temperature (Ta) and relative humidity (RH) sensors (HMP 155, Vaisala Inc., Vantaa, Finland), along with the anemometer (WindSonic, Gill Inc., Hampshire, UK), were mounted on platforms at heights of 5, 8, 11, 14, 18, 26, and 32 m above ground, and data from 11 m were utilized in this study. A net radiometer (CNR 4, Kipp and Zonen Inc., Delft, The Netherlands), a rain gauge (TE 525 MM, Campbell Scientific Inc., Logan, UT, USA), and a linear photon sensor for the measurement of photosynthetically active radiation (RR-9753, RainRoot Inc., Beijing, China) were installed on the platform at 17 m above ground. Soil moisture probes (EC-5, METER Inc., Pullman, WA, USA) were placed at depths of 5 cm, 10 cm, and 20 cm within the soil. The soil water content (SWC) was the average value of the above three layers. Soil heat flux plates (HFT-3, Campbell Scientific Inc., Logan, UT, USA) were buried 5 cm beneath the surface in four directions surrounding the flux tower. Another CR1000 data logger controlled all of the above instruments, and data were recorded in 10 min intervals. The vapor pressure deficit (VPD) was determined based on Ta and RH:
V P D = 1 R H 100 × 0.611 × exp 17.27 × T a 237.3 + T a

2.2.2. Observation of the Fraction of Absorbed Photosynthetically Active Radiation (fPAR)

Four linear photon sensors (RR-9753, RainRoot Inc., Beijing, China), operating within the spectral range of 400 to 700 nm, were used to measure the fraction of absorbed photosynthetically active radiation (fPAR). One sensor was positioned 3 m above the forest canopy, oriented downward, to capture the photosynthetically active radiation reflected by the canopy (PARreflect). The other three sensors were installed, facing upward, below the canopy at varying locations 2.5 m above ground level and positioned 50 to 100 cm away from tree trunks to measure the photosynthetically active radiation penetrating the canopy (PARunder).
A P A R = P A R P A R r e f l e c t P A R u n d e r
f P A R = A P A R P A R

2.2.3. Observation of Solar-Induced Chlorophyll Fluorescence (SIF) and Canopy Spectra

The AutoSIF-1 (Bergsun Inc., Beijing, China), an automatic fluorescence observation system, was installed on a observation tower platform 20 m above the ground, 10 m above the canopy, with an observation radius of approximately 2.2 m. This system is equipped with a high-precision spectrometer (QE65, Ocean Optics Inc., Dunedin, FL, USA) with a spectral resolution of 0.31 nm and a working spectral range spanning 650 to 800 nm. An electronic switch was employed to connect two optical fibers to the spectrometer. At the terminal of one optical fiber, a cosine corrector (CC3-3-UV-S, Ocean Optics Inc., Dunedin, FL, USA) was mounted. The other bare optical fiber possessed a field of view (FOV) of 25°. These components facilitated the measurement of downward solar radiation and upward-reflected radiation from the canopy. Measurements were conducted in so-called “sandwich” mode. The spectrometer initially records solar radiation, swiftly transitions to capture canopy radiation, and then reverts to solar radiation measurement, effectively reducing errors stemming from radiation variability. The integration time for each measurement was adjusted to optimize the performance according to the intensity of ambient light. Using the spectral fitting method (SFM), we derived the red and far-red band canopy SIF signals (SIF). The observation system provided canopy reflectance data in the 650 to 800 nm range.

2.3. Determination of Drought Stress

The plant water stress index (PWSI) describes the drought stress gradient. The PWSI is defined as follows:
P W S I = 1 E T P E T
where ET is derived from the latent heat flux (LE) observed by the EC system, with ET = LE/λ (λ = 2.45 MJ kg−1—this is not a constant but varies with the barometric pressure and temperature; however, the value of 2.45 MJ kg−1 is commonly adopted for calculations); PET is the potential ET, calculated using the Shuttleworth–Wallace (S-W) model. For a detailed description, see Tong [36].

2.4. Calculations

The normalized vegetation index (NDVI), which serves as a representation of the canopy structure, is computed as follows:
N D V I = ρ n i r ρ r e d ρ n i r + ρ r e d
where ρnir and ρred represent canopy reflectance within 758–762 nm and 685–689 nm, respectively.
The observed SIF above the canopy (SIF) can be expressed as the product of photosynthetically active radiation (PAR), the fraction of PAR absorbed by chlorophyll in vegetation (fPAR), the fluorescence efficiency (ΦF), and the canopy escape ratio (fesc):
S I F = P A R × f P A R × Φ F × f e s c
The canopy escape ratio (fesc) describes the fraction of SIF that is not reabsorbed or scattered by the leaves in the canopy.
The methods for the calculation of f e s c for SIF in the different bands are given below.
For the red SIF [38]:
f e s c r e d R E D v f P A R
For the far-red SIF [39]:
f e s c f a r r e d N I R v f P A R
Here, REDv and NIRv represent the vegetation red-band reflectance and vegetation near-infrared-band reflectance, respectively, which can be calculated as follows:
R E D v N D V I 2 × ρ r e d
N I R v N D V I × ρ n i r
The canopy red SIF (SIF687) can also be expressed as follows:
S I F 687 P A R × R E D v × Φ F 687
The canopy far-red SIF (SIF760) can also be expressed as follows:
S I F 760 P A R × N I R v × Φ F 760
The fluorescence efficiencies (ΦF) are described as follows:
Φ F 687 S I F 687 P A R × R E D v
Φ F 760 S I F 760 P A R × N I R v
According to Monteith’s light use efficiency model [40], GPP can be described as follows:
G P P = P A R × f P A R × L U E
where LUE represents the light use efficiency of photosynthesis.

2.5. Data Processing and Statistical Analysis

The data from 7:00 to 17:30 were collected daily during the growing seasons from 2019 to 2021. We deleted the observational data on the days of rainfall and the following day, as well as the observational data for those days with missing values in the morning or afternoon. The final data distribution was as follows: 86 days from June to September in 2019, 135 days from April to September in 2020, and 99 days from April to September in 2021. The data from 2019 to 2020 were used for analysis and training, while the 2021 data were used for verification.

2.5.1. Classification of Drought Stress Levels

The range of the PWSI for all data was from 0.21 to 0.88. The PWSIbin with an average daily PWSI value ranging from 0.21 to 0.34 was recorded as 0.2–0.3; the PWSI with a range of 0.35 to 0.54 was 0.4–0.5; the PWSI with a range of 0.55 to 0.74 was 0.6–0.7; and the PWSI with a range of 0.75 to 0.88 was 0.8–0.9.

2.5.2. Comparison of Intergroup Differences

The Bartlett test was applied to assess the homogeneity of variances. If the variances were homogeneous, an analysis of variance (ANOVA) and least significant difference (LSD) tests were used to compare group differences. If the variances were not homogeneous, Welch ANOVA and Games–Howell tests were employed to compare intergroup differences.

2.5.3. Description of the GPP-SIF Relationship and Model Evaluation

The relationship between GPP and SIF within a daily cycle was described by a logarithmic regression model in the form of “GPP = K × ln(SIF) + b”. Here, K represents the regression coefficient, which reflects the sensitivity of GPP to various levels of SIF; R2 is the coefficient of determination, indicating the explanatory power of SIF for GPP. For the physiological relationship between GPP and SIF (LUE-ΦF), a univariate quadratic equation was used for regression, and the coefficient of determination (R2) was employed to characterize the LUE-ΦF relationship. The coefficient of determination (R2) and root mean square error (RMSE) served as quality indicators for GPP estimation models based on SIF and were used to evaluate the model performance.

2.5.4. Calculation of the Relative Importance of Components for SIF and GPP

The relative importance method was proposed by Lindeman, Merenda, and Gold (LMG, Grömping, 2007) [41]. The LMG method essentially decomposes the coefficient of determination (R2) from linear regression into the contributions of each regressor, quantifying how much of a variable’s variation is explained by individual regressors while accounting for their intercorrelations. We first transformed the light use efficiency models into a linear form by applying natural logarithmic transformations to all the variables in Equations (11), (12) and (15), resulting in Equations (18)–(20) [29]. We then loaded the R 4.3.3 package “relaimpo”for calculation.
ln S I F 687 = ln P A R + ln R E D v + ln Φ F 687
ln S I F 760 = ln P A R + ln N I R v + ln Φ F 760
ln G P P = ln P A R + ln f P A R + ln L U E

2.5.5. Factor Importance Based on Random Forest Analysis

Several drought-related meteorological factors were selected, including radiation (represented by PAR), the atmospheric and soil moisture content (VPD and SWC), and canopy structural factors (NIRv, REDv, and fPAR), which could indirectly influence the GPP-SIF relationship under drought conditions. A random forest model was used to assess the importance scores of the meteorological and canopy structural factors in explaining the R2 and K of the GPP-SIF relationship. We adopted the random forest method using the R 4.3.3 package “randomForest” for analysis.

2.5.6. Path Analysis Based on Structural Equation Model (SEM)

To determine how drought stress, in synergy with micrometeorological factors, affects the relationship of GPP-SIF, we used structural equation modeling (SEM) to examine the direct or indirect effects of the meteorological factors on the R2 and K of the GPP-SIF relationship. The goodness-of-fit index (GFI), comparative fit index (CFI), and root mean squared error of approximation (RMSEA) were employed as fit indices to evaluate the model fitness. The SEM and path analysis were performed using the R 4.3.3 package “lavaan”.

2.5.7. Construction of GPP Estimation Model Based on SIF Considering the Key Drought Synergistic Effect Factor

To mitigate the adverse effects of drought stress on the SIF-based GPP estimation ac-curacy, we introduced key drought synergistic effect factors into the GPP-SIF relationship. In our results (Section 3.5), the key factor VPD was incorporated into the GPP-SIF model. We separately attempted to use SIF, VPD, and SIF × VPD as independent variables to estimate GPP. When SIF and VPD were used as independent variables, considering the influence of multicollinearity, we performed transformations on SIF and VPD through logarithmic, square, and square root methods, etc. The model “GPP = c + a × ln(SIF) + b × VPD2” demonstrated the best performance (details in the Supplementary Materials), effectively compensating for the negative impact of drought stress on GPP estimation using SIF.

3. Results

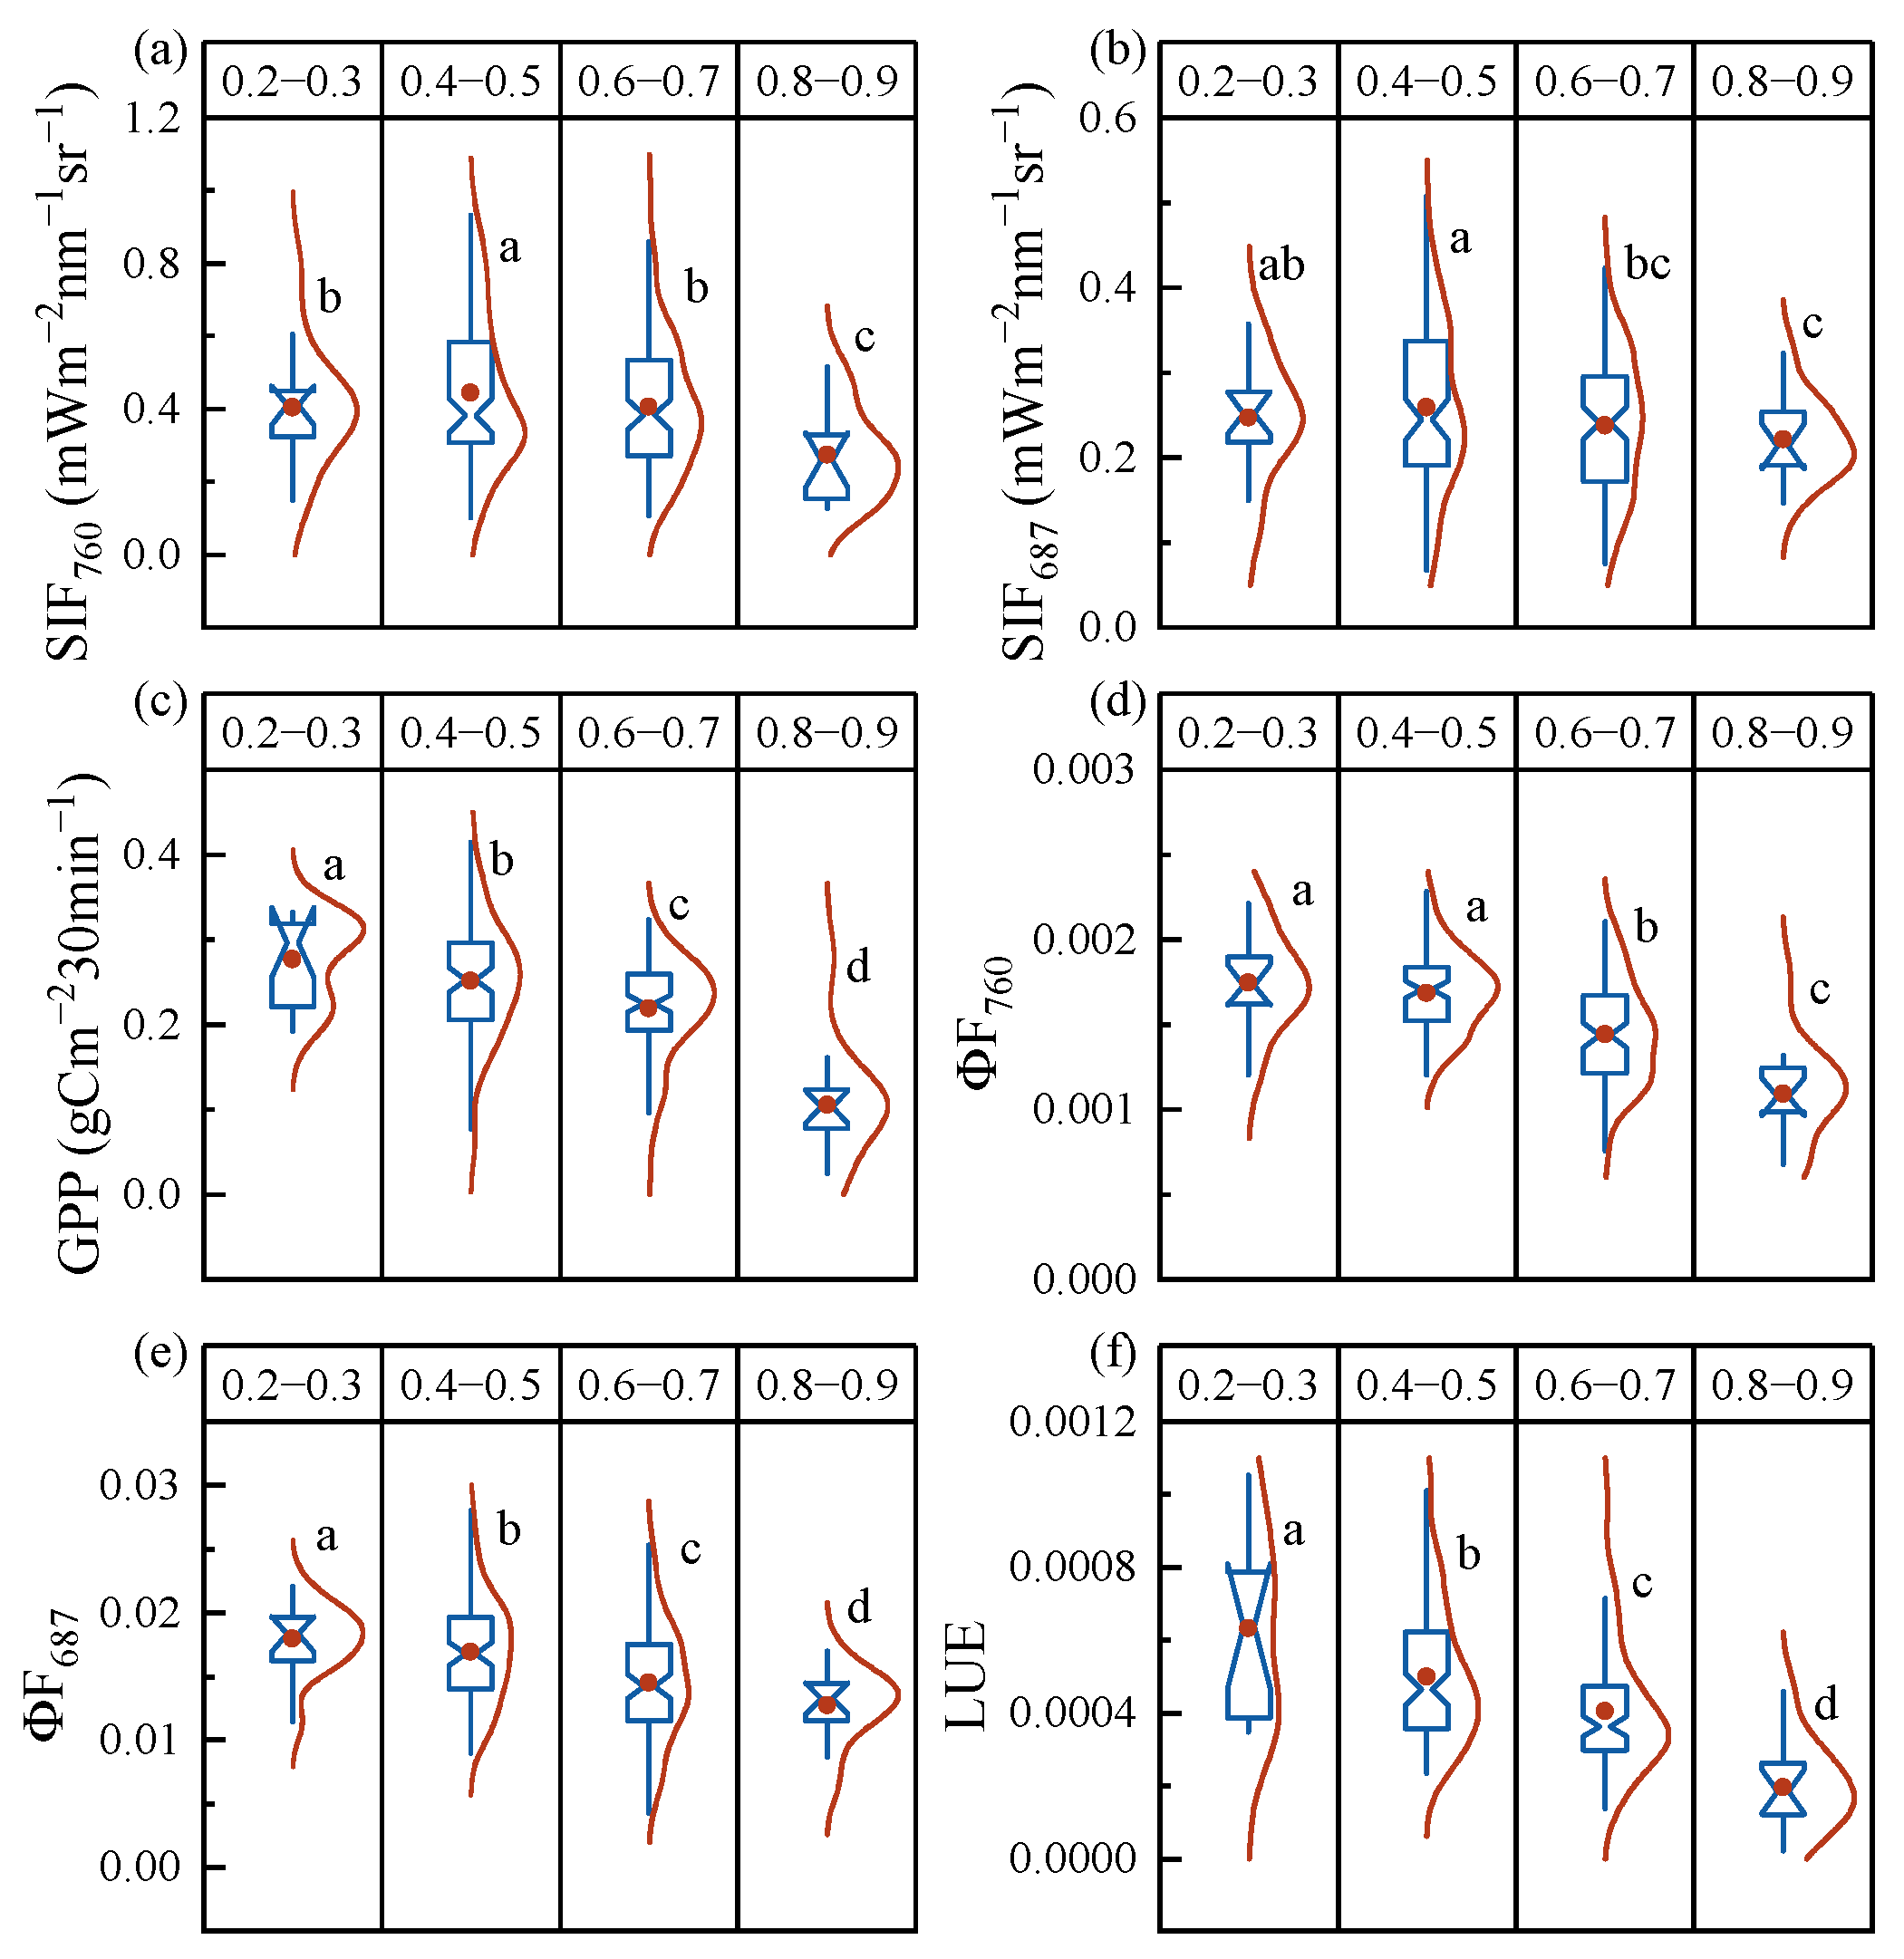
3.1. The Responses of SIF and GPP to Drought Stress

Figure 2a,b depict the variation patterns of SIF in response to PWSI. SIF760 and SIF687 exhibited a slight increase when PWSIbin was 0.4–0.5 but decreased when PWSIbin was higher. The turning point of the response of SIF to drought stress was around 0.4–0.5. Before this point, SIF760 showed a positive response to drought most of the time, while SIF687 showed a positive response in the morning and a negative response in the afternoon; afterwards, both SIFs showed negative responses in terms of diurnal dynamics (Figure 3a,b). When PWSIbin was higher than the 0.4–0.5 level, the response of SIF to drought was also different within a daily cycle. Roughly before 8:00–9:00, SIF showed a positive response to drought, while it showed a negative response afterwards.
GPP was more sensitive than SIF to drought stress, continuing to decrease as PWSIbin increased (Figure 2c), and the average rate of decrease in GPP with each increase in PWSIbin was higher than that for SIF760 and SIF687, especially after the turning point (Table S1). When PWSIbin was low, the response of the diurnal GPP to drought was not evident in the early morning (Figure 3c). However, as PWSIbin increased, GPP decreased and had an earlier peak time.
The values of ΦF and LUE decreased with the increase in PWSIbin (Figure 2d–f). The diurnal ΦF and LUE maintained a negative response to drought (Figure 3d–f). However, the responses of ΦF760 and ΦF687 were not apparent before 8:00 in the morning, and even ΦF687 showed an unobvious response to drought at around 17:00.

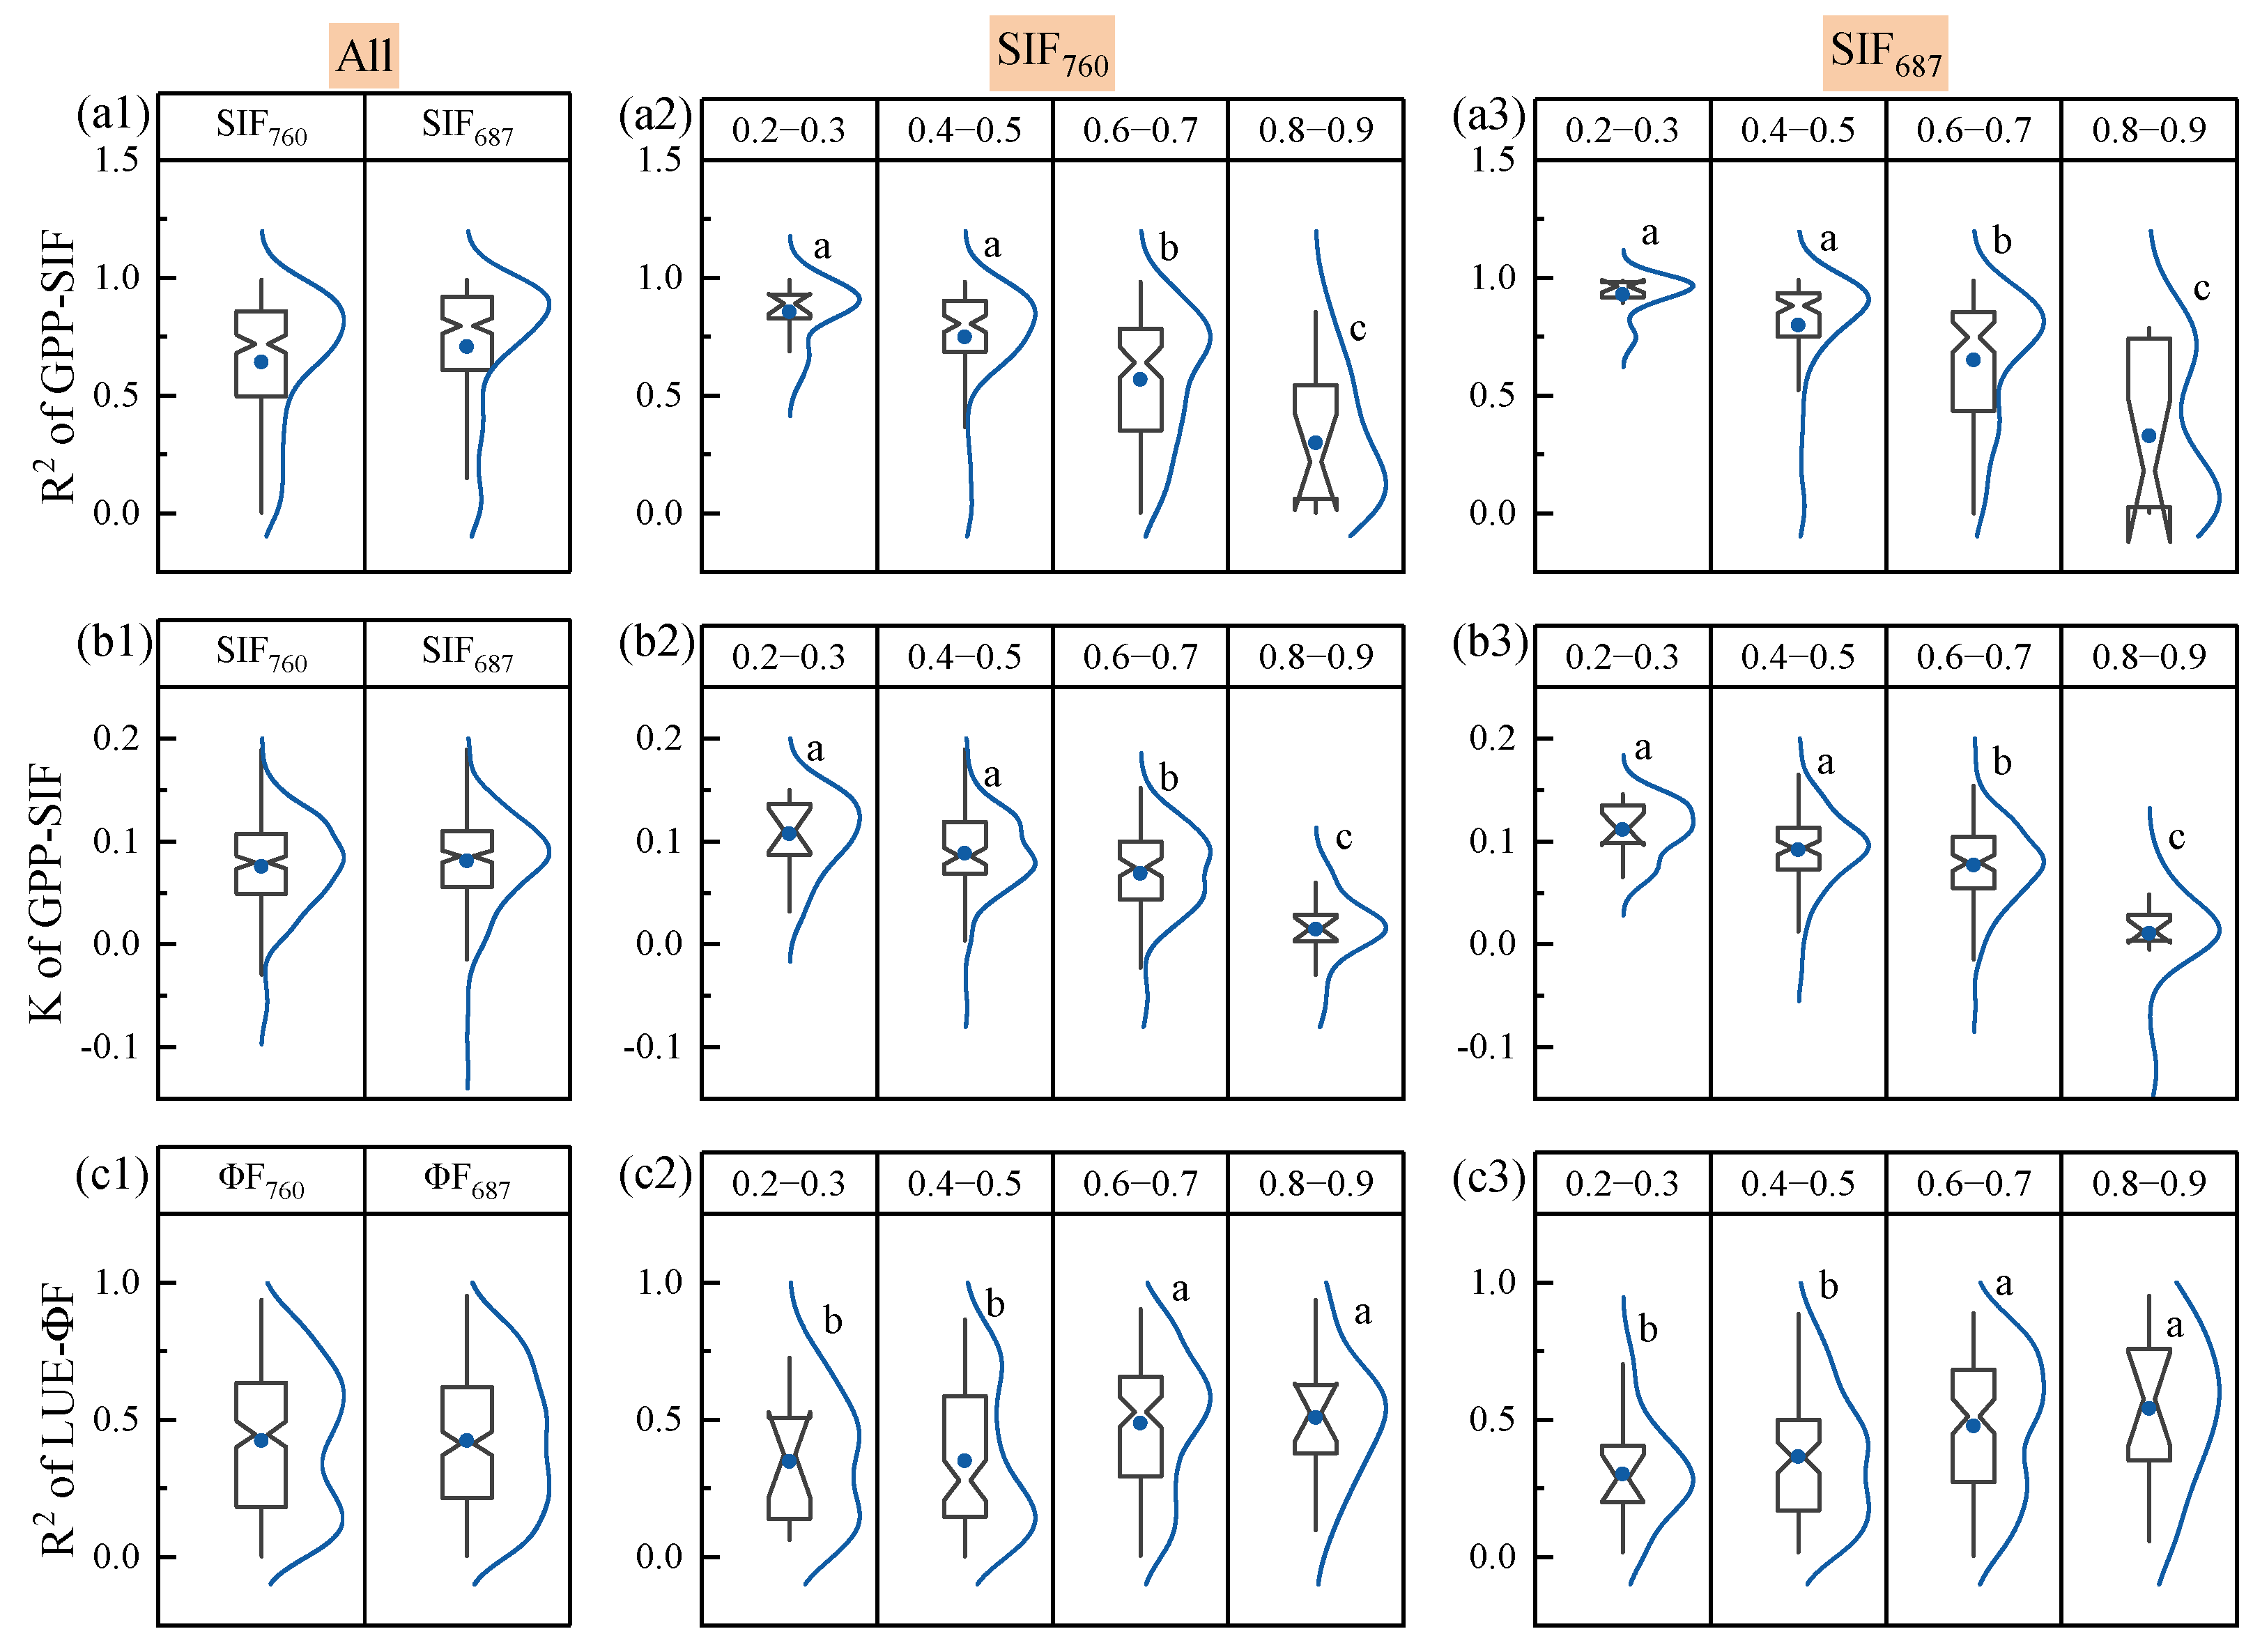
3.2. The Response of the GPP-SIF Relationship to Drought

There was a significant logarithmic relationship (GPP = K × ln(SIF) + b) between the diurnal GPP and SIF (Figure 4a,b). Drought stress led to a decrease in the R2 and K of GPP-SIF, but GPP and SIF retained a significant non-linear correlation (R2_GPP-SIF760 = 0.30, R2_GPP-SIF687 = 0.23) under severe drought stress (PWSIbin: 0.8–0.9). The same results were observed on all observation days (Figure 5a,b).
At the physiological level, there was a quadratic functional relationship between LUE and ΦF (Figure 4c,d). The R2 between LUE and ΦF generally showed a trend of increasing as PWSIbin increased, except for a slight decrease in R2 under severe stress (PWSIbin: 0.8–0.9). The R2 of LUE-ΦF consistently increased as PWSIbin increased on all observation days (Figure 5c), indicating that drought stress positively impacted the relationship between LUE and ΦF.
It was observed that SIF687 had a higher R2 with respect to GPP than SIF760 (Figure 4a1,b1 and Figure 5a1). The relationship between LUE and ΦF687 was closer than that between LUE and ΦF760 (Figure 4c1,d1 and Figure 5a1). These results indicate that the red SIF has greater potential to capture GPP than the far-red SIF. The average decreasing rate of the R2 for GPP-SIF687 was lower than that for GPP-SIF760 as PWSIbin increased. Similarly, the average increasing rate of R2 for LUE-ΦF687 was higher than that for LUE-ΦF760 (Table S1). Thus, drought stress had a less pronounced negative effect on the relationship between the red SIF and GPP in comparison to its impact on the relationship between the far-red SIF and GPP.

3.3. Relative Importance of Individual Components to SIF and GPP Under Drought Stress

The analysis of the relative importance showed that the contributions of the components in the LUE models to SIF and GPP variations changed as the drought stress levels increased. PAR played a significant role in driving SIF and GPP, but its importance declined as the PWSIbin levels increased (Figure 6). Conversely, the importance of physiological components (ΦF760, ΦF687, and LUE) increased with increases in the drought stress levels. At a high PWSIbin level (0.8–0.9), the importance of ΦF760 exceeded that of PAR. These results indicate that, with increasing drought stress, the contribution of radiation to SIF and GPP diminishes, whereas physiological factors become more significant. The positive response of the physiological link between GPP and SIF (LUE-ΦF) to drought stress suggests that other factors, potentially synergistic with drought, may be the key reason for the weakening of the SIF-GPP coupling. The contribution of canopy structural components (NIRv, REDv, and fPAR) to SIF and GPP was relatively minor, accounting for less than 13%.
The low correlations between PWSI and NIRv, REDv, and fPAR on the observation days suggested the minimal interference of drought stress in the canopy structure. These results reveal that the canopy structure effects were negligible.

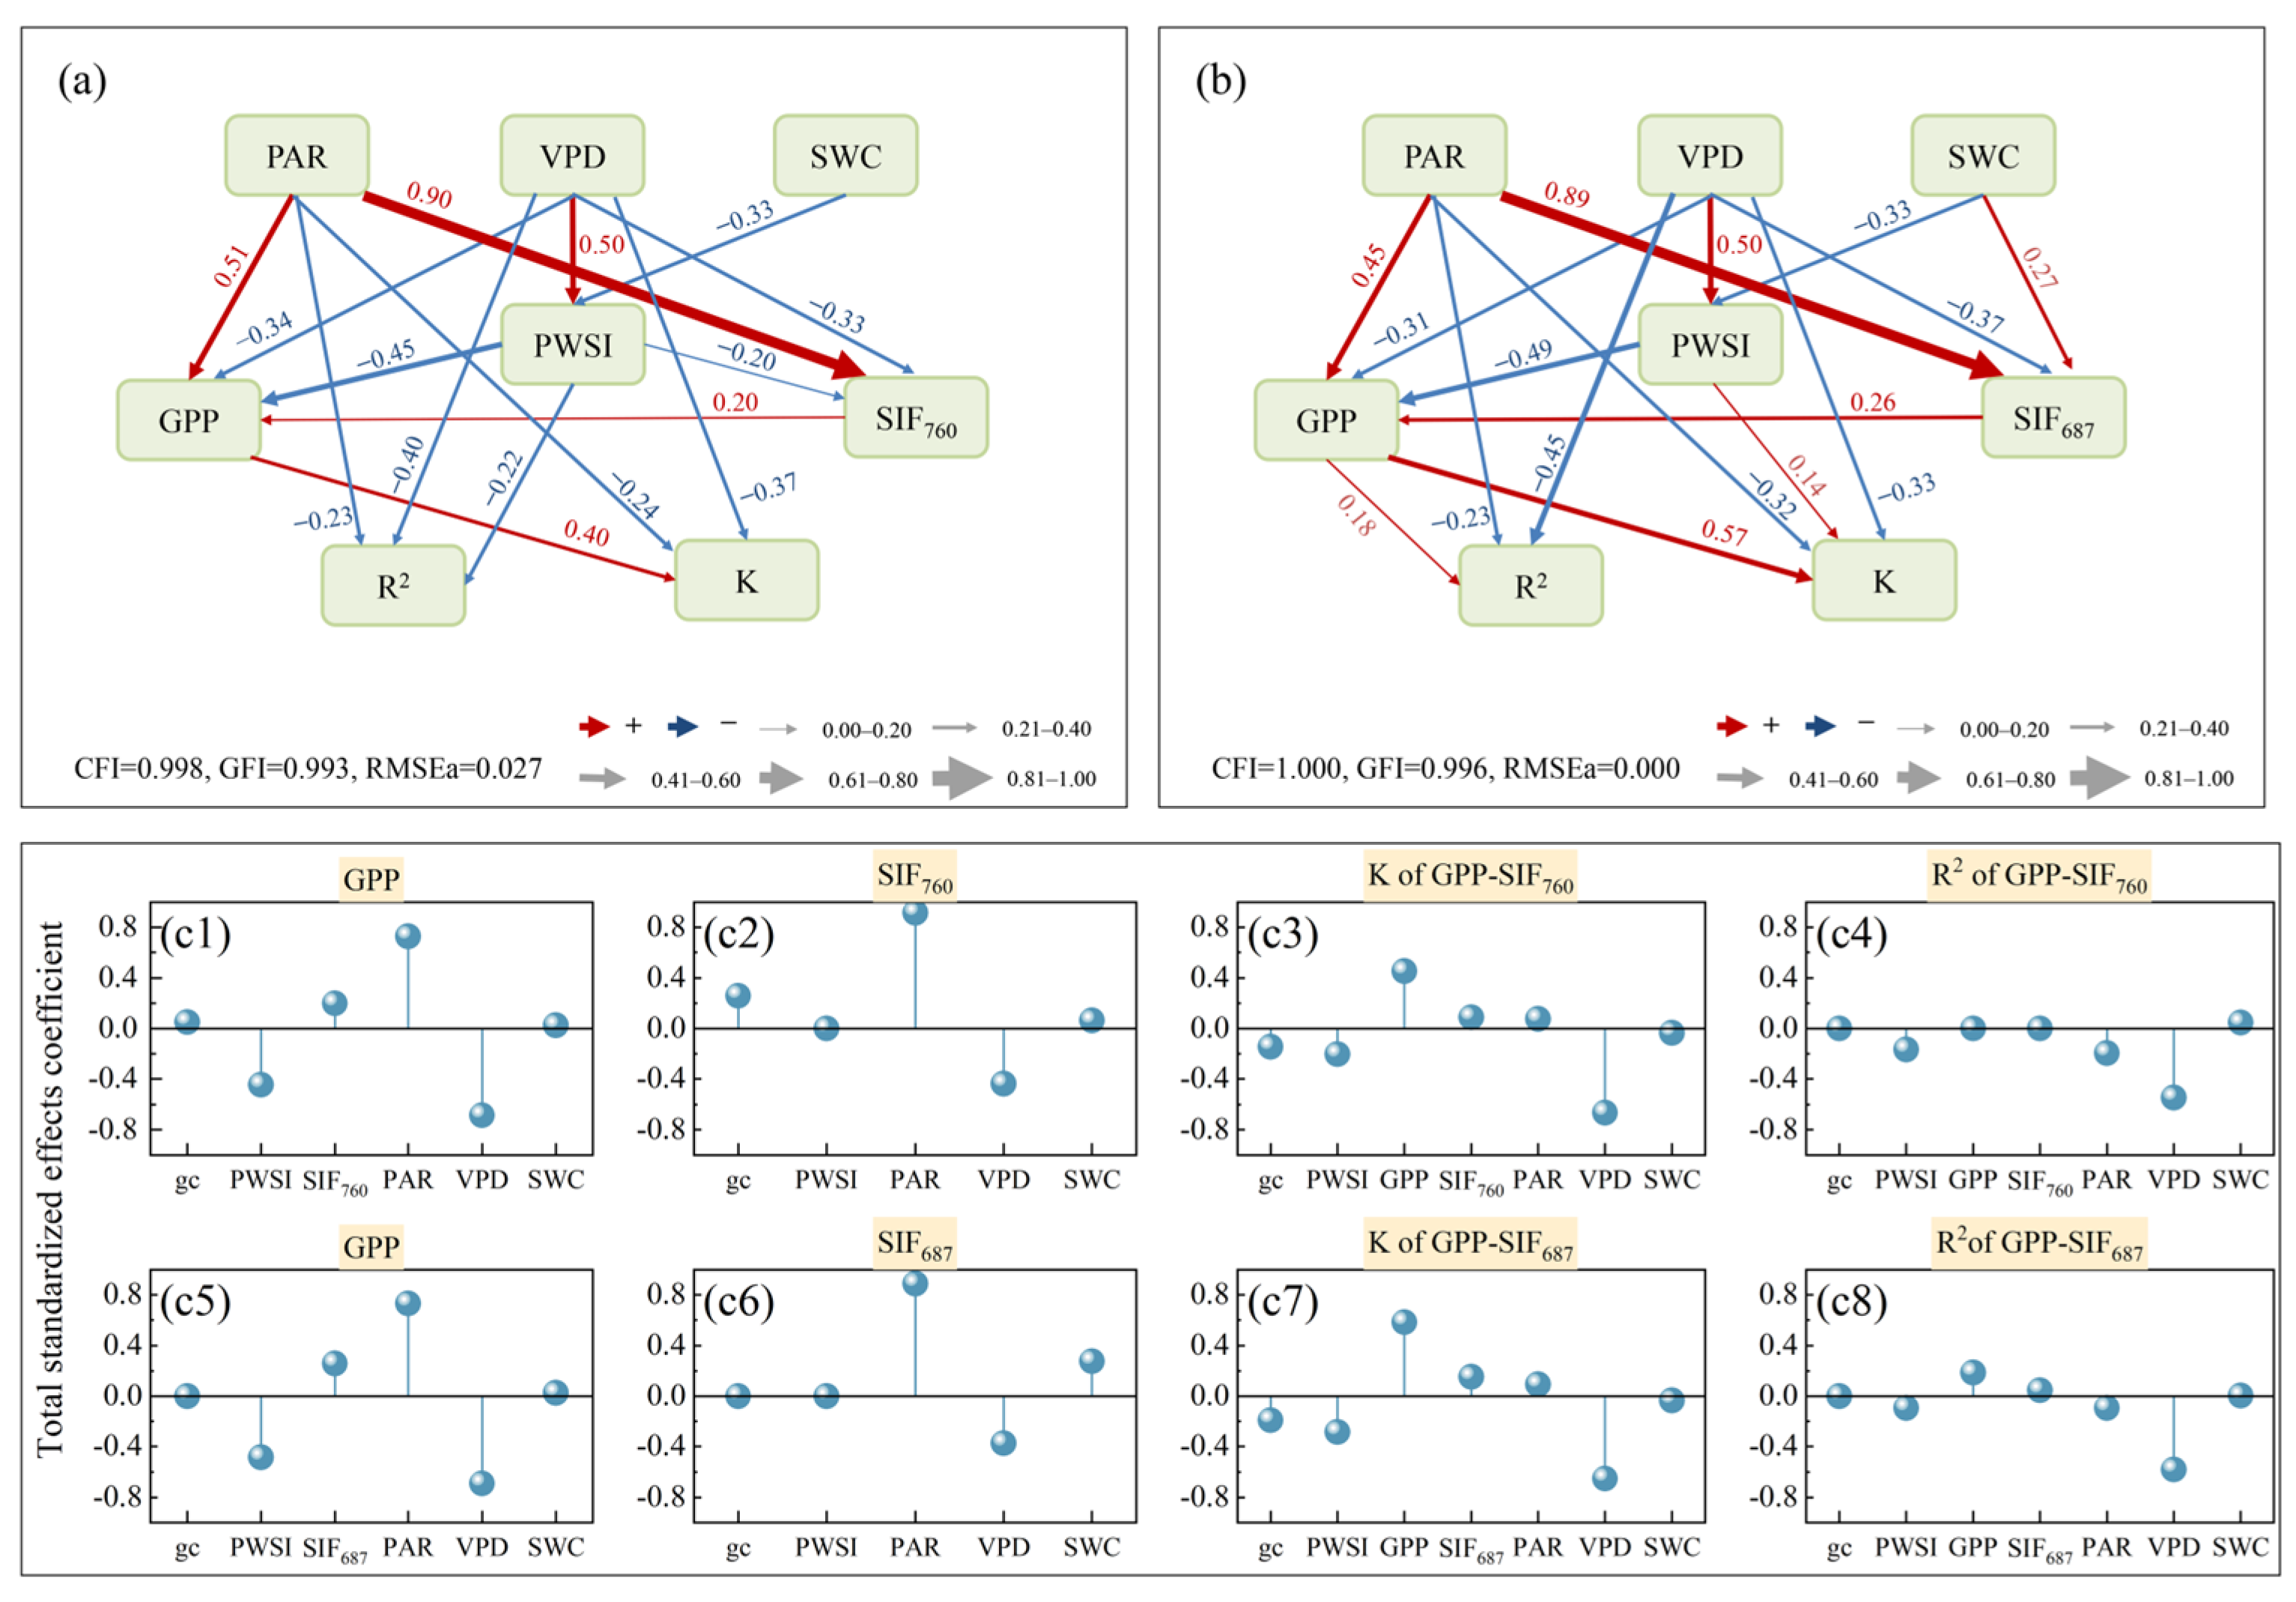
3.4. The Key Drought Synergistic Effect Factor for the GPP-SIF Relationship

The results of the random forest model indicated that meteorological factors generally had greater explanatory power for the GPP-SIF relationship than canopy structural factors (Figure 7). The low correlations between PWSI and NIRv, REDv, and fPAR on the observation days suggest the minimal interference of drought stress in the canopy structure, and, owing to the minimal contribution of the canopy structure to SIF and GPP (Figure 6), the effects of the canopy structure could be neglected.
A path analysis-based structural equation model (SEM) was constructed to further examine the synergistic effects of meteorological factors on the GPP-SIF relationship under drought conditions. The results are shown in Figure 8. The GPP-SIF relationship was mainly influenced by VPD: in comparison to PAR and SWC, VPD had greater direct and total effects on R2 and K. The direct effect of PAR on R2 and K was greater than its total effect, but the total effect of PAR on GPP and SIF was greater than that of VPD, demonstrating the main driving role of PAR on GPP and SIF. SWC had a positive but low total effect on R2 and K. The effect of SWC on GPP and SIF was also weaker than that of VPD. Therefore, VPD was the key meteorological factor with a drought synergistic effect on the relationship between GPP and SIF.

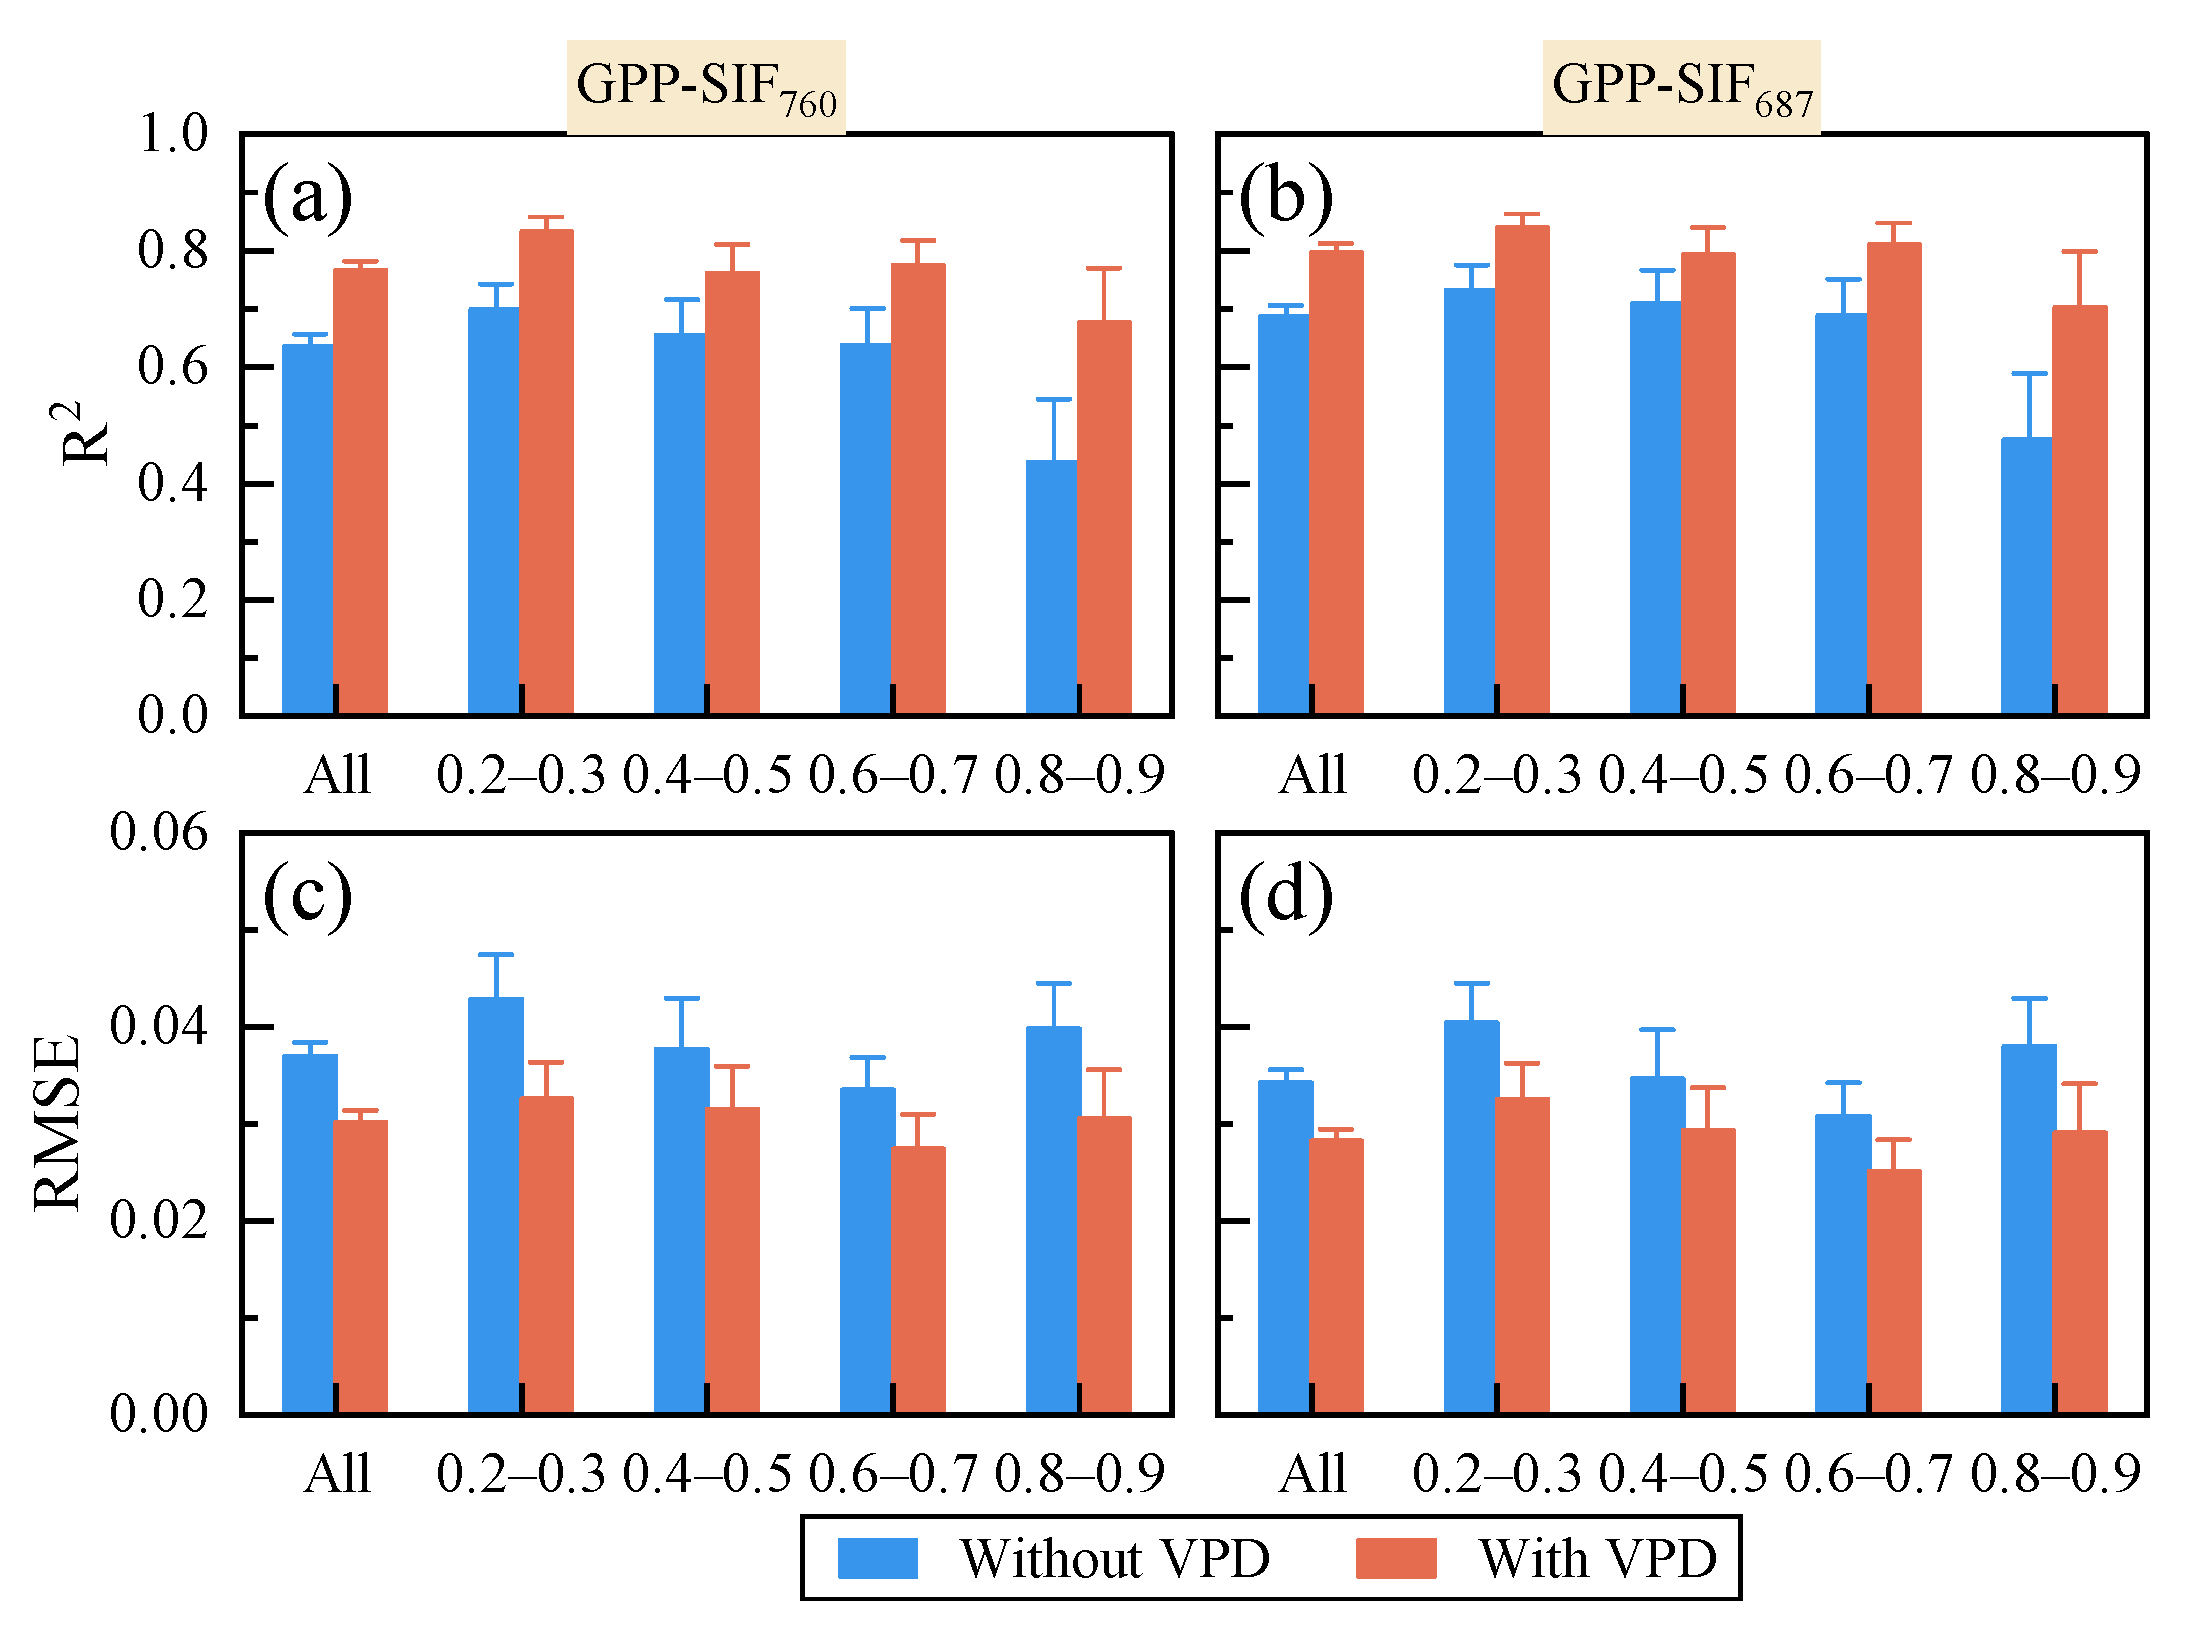
3.5. The Response of the GPP-SIF Relationship to Drought by Considering the Key Drought Synergistic Effect Factor

We attempted to incorporate VPD into the diurnal GPP-SIF relationship to mitigate the decoupling effect of drought stress. The R2 of GPP-SIF with the VPD effect was significantly improved (Figure 9a,b), and the R2 of GPP-SIF760 and GPP-SIF687 increased by 29% and 24%, respectively, on all observation days. Moreover, the higher the level of PWSIbin, the more pronounced the improvement in R2. The RMSE of GPP-SIF with the VPD effect was decreased (Figure 9c,d).
The results of independent sample verification showed that SIF, when considering the synergistic effect of VPD, could capture more than 89% of GPP (Figure 10). The accuracy of GPP estimation (R2) based on SIF with VPD improved by 20% (SIF760) and 16% (SIF687), respectively, on all observation days (Figure 11a,b), and the RMSE decreased by 19% and 18%, respectively (Figure 11c,d). The R2 improved by 55% and 48%, respectively, under severe drought stress (PWSIbin was 0.8–0.9), and the RMSE decreased by 23% and 24%, respectively.

4. Discussion

In this study, tower-based SIF observation data from a Chinese cork oak plantation were combined with synchronized eddy covariance measurements to evaluate the potential of using SIF to monitor GPP under drought stress. Our results revealed a difference in the sensitivity to drought stress between SIF and GPP. Secondly, a significant logarithmic relationship between SIF and GPP was observed, but the strength of this non-linear relationship diminished as the drought stress levels increased. In contrast, the physiological GPP-SIF connection—that is, the relationship between ΦF and LUE—became stronger as the drought stress level increased. We decomposed the physiological and non-physiological components of SIF and GPP through logarithmic transformation based on the light use efficiency model. We found that drought stress weakened the contribution of the non-physiological components and enhanced the contribution of the physiological components. The close physiological connection was the basis for using SIF to capture GPP under drought stress. The weakening of the coupling degree between GPP and SIF is more likely to have stemmed from the differential impacts of the environmental factors that induce drought. We analyzed how drought stress influenced the GPP-SIF relationship through a structural equation model (SEM) combined with the major meteorological elements that cause drought and found that the atmospheric humidity (VPD) was the key synergistic effect factor affecting the response of the GPP-SIF relationship to drought. Considering the VPD effect significantly improved the estimation accuracy of SIF for GPP, especially under severe drought stress. Our findings are of great significance in accurately estimating GPP in the context of climate change.

4.1. Relationship of GPP-SIF Under Drought Stress

We observed a significant non-linear correlation between GPP and SIF within a daily cycle, consistent with the findings from previous studies [23,42]. Although the strength of this relationship decreased with increases in the drought stress level, the R2 of GPP-SIF was above 0.30 on all observed days (Figure 5). The non-linear correlation between ΦF and LUE became stronger as the drought stress level increased. This strong physiological connection highlights how SIF can be used to estimate GPP, in contrast with previous research reporting weak GPP-SIF correlations in cropland and forests under drought conditions [21,23], demonstrating that SIF remains a powerful tool for the monitoring of GPP in temperate deciduous broad-leaved forests under drought stress.
However, the reduction in the GPP-SIF correlation due to drought stress was not negligible. Our results reveal a relationship between GPP and SIF in the form of “GPP = K × ln(SIF) + b”; the K and R2 within a daily cycle decreased with the increase in the drought stress level (PWSIbin). These results are consistent with those reported in previous studies [12,20,22]. We believe that the phenomena observed are attributable to the inconsistency in the responses of SIF and GPP to drought stress. It has been reported that SIF exhibits a slightly weaker response than GPP under drought and heatwave conditions [21,22,43]. Our results also emphasized the asymmetric impact of drought stress on GPP and SIF (Figure 2 and Figure 3). GPP continuously decreased as PWSIbin increased. However, there was an inflection point for SIF, which was approximately within the range of 0.4–0.5 for PWSIbin. This result is consistent with our previous findings [33]. After the turning point, SIF continued to decrease, but the rate of decrease in SIF was still lower than that for GPP (Table S1). The response of GPP to drought stress was more intense than that of SIF. The results of the SEM analysis showed that the decrease in K was more dependent on GPP than on SIF (Figure 8). Under drought stress, the stomatal response occurs faster than SIF-associated photosynthetic electron transport, leading to a decrease in the net photosynthetic carbon assimilation rate due to an insufficient supply of CO2. Therefore, GPP was directly affected by drought stress. When the water supply is limited, plants employ various strategies to regulate photosynthesis, such as redistributing energy between photosystems via the thermal dissipation of excitation energy [11,27], which results in decreased GPP and SIF. The rise in NPQ and the decline in the fraction of open PSII reaction centers (qL) offset the reduction in photochemical activity, thus alleviating the effect on SIF [20]. Thus, the response of the light reaction may be more muted than the stomatal response.
The midday/afternoon depression in photosynthesis caused the peak time of GPP to advance under moderate to severe drought stress, resulting in morning values that were higher than the afternoon values (Figure 3c). However, the peak time of SIF did not change significantly, even though SIF showed more significant variation in the afternoon under a higher level of drought stress (Figure 3a,b). This observation aligns with the findings of Qiu et al. [10], who reported that the SIF levels were higher in the morning than in the afternoon. The midday/afternoon depression in photosynthesis may be due to differences in vegetation’s daily water allocation and use during drought. Under drought conditions, physiological water stress is commonly relieved overnight, and plants tend to exhibit greater drought sensitivity in the afternoon, leading to photosynthetic productivity being higher in the morning than in the afternoon [10,44,45]. The midday/afternoon depression does not affect the reduction in synchrony between SIF and GPP in the afternoon; however, the advancement of the GPP peak time disrupts the synchrony between SIF and GPP in the morning, leading to a more pronounced reduction in the R2 of GPP-SIF within a daily cycle.
We observed a LUE-ΦF relationship that increased as PWSIbin increased within a daily cycle (Figure 4 and Figure 5), reflecting the strong interdependence between ΦF and LUE and, notably, the close link between photosynthetic light reactions and carbon assimilation pathways under drought stress. This observation serves as the theoretical basis for the use of SIF in tracking GPP under drought conditions [20,22,23,27]. Our results showed that the LUE-ΦF relationship varied non-linearly (quadratically) within a daily cycle, with a positive linear relationship in the morning and a negative linear relationship in the afternoon (Figure 4c,d). This relationship pattern illustrates the link between fluorescence and photosynthesis at the photochemical stage. Under drought stress, increasing NPQ reduced the efficiency of fluorescence emission and photochemical reactions [46]. The ETC and photochemistry, limited by absorbed light energy and NPQ, showed a simultaneous decrease; consequently, ΦF and LUE showed a synchronous decline in the morning. Due to the midday/afternoon depression, the stomata closed, carbon assimilation substrates became insufficient, the photochemical pathway was limited, the NPQ pathway became saturated, and more light energy was allocated to fluorescence emission, resulting in asynchronous changes between ΦF and LUE in the afternoon. There was always a close correlation between LUE and ΦF, regardless of whether the fluctuations were in the same or opposite directions. We quantified the importance of the physiological and non-physiological components of SIF and GPP by performing a logarithmic transformation on the light use efficiency model (Figure 6). The results showed that the importance of the non-physiological components decreased. In contrast, the importance of the physiological components increased under drought stress. This finding explains the increasingly close LUE-ΦF relationship under drought stress, indicating that SIF remains a good indicator of photosynthesis.
There were also differences in the relationship between GPP and different SIF bands. We observed that, under the same drought stress level, the relationship between GPP and the red SIF was closer than that with the far-red SIF (Figure 5 and Figure 6). This was attributed to the fact that the red SIF carries more detailed information about PSII, whose fluorescence emission is commonly utilized to reflect the photosynthetic capacity. At the photosystem level, the red SIF is expected to provide more accurate estimates of GPP. We also observed that the relationship between GPP and SIF687 was less sensitive than that with SIF760 to drought stress (Figure 6). Therefore, the red SIF is a stable proxy for photosynthesis under drought stress.

4.2. The Synergistic Effects of Other Factors on the GPP-SIF Relationship Under Drought Stress

During drought, there were usually changes in other factors that synergistically impacted the GPP-SIF relationship. The canopy structure is a key factor influencing the SIF-GPP relationship [34], and its response to drought stress would also indirectly affect the GPP-SIF relationship. During the entire observation period, the canopy structure remained relatively stable (Figure S1b), with an NDVI of approximately 0.87, showing no obvious seasonal dynamics in response to changes in PWSI. This indicates that short-term drought stress had a minimal impact on the canopy structure of the cork oak plantation. Therefore, as the level of drought stress increased, the contribution of canopy structure components to SIF and GPP remained almost unchanged, consistently staying at a low level (Figure 5). One possible explanation is that the deep-rooted nature of the forest allows for the preservation of photosynthesis and canopy stability over prolonged periods under short-term water deficit conditions. Another possible reason is that cork oak is a drought-tolerant species with a higher response threshold for morphological changes under drought stress. Although the results of the random forest analysis show that the impact of the canopy structure on the relationship of SIF-GPP was lower than that of meteorological factors, the potential influence of the canopy structure on the relationship under drought stress still needs to be considered. The PWSI still had a significant correlation with the canopy structure parameters on an instantaneous scale (half-hour) (Figure S3). Slight changes in the leaf pigment content and leaf angle caused by drought stress interfere with the observation of photosynthesis and fluorescence, which may have been one of the factors contributing to the uncertainty of our results.
Under low drought stress (Figure 3), SIF and GPP exhibited a similar pattern regarding the incoming PAR, rising from morning until noon and decreasing thereafter in the afternoon. However, as the drought stress level increased, the responses of SIF and GPP to PAR did not change proportionally. Except in the early morning, when SIF and GPP showed no obvious drought stress responses, their responses to PAR synchronously decreased, with higher PAR corresponding to lower SIF and GPP due to drought stress. The contribution of PAR to SIF and GPP was also reduced with the increase in drought stress (Figure 6). Moreover, ΦF and LUE remained at higher levels in the early morning, potentially because of the lower water demand of photosynthesis under low PAR. Another explanation is that, with lower nighttime transpiration, the water content of vegetation is more derived from soil and the atmosphere [47]. Photosynthesis requires more water as radiation increases, leading to the gradual emergence of the limiting effect of water on SIF and GPP. The GPP-SIF relationship was negatively affected by PAR (Figure S4), a finding that is consistent with previous studies [27,48]. Drought stress is often accompanied by high PAR, which offsets, to some extent, the negative impact of drought on the physiological components of SIF. This can explain why, although the direct correlation between GPP and SIF decreases under drought stress, a close physiological connection still exists [49]. The reduction in GPP-SIF caused by PAR may have been due to the different responses of SIF and GPP to PAR. Under low-PAR conditions, an increased diffuse light rate enables deeper penetration into the canopy, boosting canopy photosynthesis [50,51]—a phenomenon referred to as the “diffuse fertilization effect”, which influences GPP more than SIF. At high PAR levels, light saturation limits GPP, whereas SIF remains unaffected by this constraint [52]. The finding that the direct effect of PAR on SIF was greater than that on GPP in the path analysis (Figure 8) also illustrates this point.
At around midday, plants often partially or completely close their stomata to minimize or halt stomatal transpiration, thereby preventing water loss [19]. Stomata regulate the carbon assimilation process of photosynthesis by controlling CO2 exchange, while the light reaction is less sensitive to stomatal regulation. Under drought stress, a decrease in canopy conductance (gc) will lead to a reduction in the CO2 partial pressure parameter in the chloroplast stroma (Cc) and qL, thereby resulting in a weakening reduction in the linear relationship between GPP and SIF (GPP/SIF) [16]. We did not specifically investigate the influence of gc on the relationship between GPP and SIF. However, gc is mainly regulated by VPD, which explains the crucial role of VPD as a drought synergistic effect.
Soil moisture was considered an essential factor in controlling photosynthesis and had direct or indirect effects on SIF and GPP (Figure 7). However, the results of the path analysis revealed that the effect of SWC on the relationship between GPP and SIF was weak (Figure 7), a finding that may have been related to the thin soil layer of the plantation examined.
Our correlation analysis showed that the PWSI exhibited a strong correlation with both SWC and VPD, with the PWSI-VPD relationship being stronger (Figure S3). The path analysis showed that VPD had a greater direct effect than SWC on the PWSI (Figure 7). VPD describes the intense evaporative effect of the atmosphere and promotes drought occurrence. The results of the random forest analysis showed that VPD could explain more than 40% of the variation in K and R2 (Figure 6). Based on the results, we consider VPD the key factor with respect to its synergistic effect in terms of drought stress. We attempted to incorporate VPD into the GPP-SIF relationship to offset the weakening effect of drought stress and improve the accuracy of SIF in capturing GPP under drought stress for the specific introduction method given in Table S3. Eventually, we chose the approach with better verification results: “GPP = c + a × ln(SIF) + b × VPD2” Our results significantly alleviated the negative impact of drought stress on the estimation accuracy of GPP.

4.3. Advantages and Limitations

Previous reports have used the GPP/SIF ratio as a diagnostic indicator of the relationship between GPP and SIF to explore their sensitivity to environmental factors [53,54,55]. Due to the light saturation point, some limitations exist at a higher-resolution temporal scale, such as the intraday scale. In this study, we evaluated the intraday GPP-SIF relationship using a logarithmic relationship, and, consequently, the results obtained are more reliable. Our results contribute to the formation of a more comprehensive understanding of the relationship between SIF and GPP under drought stress. Through machine learning and process-based analyses, we identified the primary drought synergistic factor contributing to the weakened GPP-SIF connection under drought stress, namely VPD, and incorporated it into the empirical GPP-SIF relationship to offset the accuracy loss of GPP estimation caused by drought stress. The results of independent verification confirmed that our attempt was significantly effective, reducing the decline in GPP-SIF coupling (R2) caused by drought stress and considerably improving the GPP estimation accuracy under drought stress. Chen et al. (2021) [20] introduced canopy stomatal conductance (gc) and used gc × SIF as an independent variable to improve the accuracy of estimating GPP based on SIF under drought stress, finding that VPD data were more easier to obtain than gc. Compared to machine learning models that integrate various canopy-related, physiological, and environmental factors, our approach clarified the main contributing factors to a greater extent, and it was more straightforward and physiologically based.
However, our results were based on the assumption that there is a simple empirical relationship between SIF and GPP, constituting a limitation of this study. Numerous earlier studies have demonstrated that the SIF-GPP relationship is complex due to the mechanical linkage between SIF and GPP. According to the mechanistic light response (MLR) model, the SIF-GPP relationship can be understood as being mediated by the electron transport rate (J), which can be divided into the SIF-J relationship (determined by the initial energy allocation in the light reaction) and the J-GPP relationship (defined by carbon assimilation in the carbon reaction) [16,56]. The MLR model separates the light and carbon reactions, providing new approaches to exploring the SIF-GPP relationship under drought stress. It is critical to further improve GPP estimation models in the context of climate change by using the mechanistic linkage between SIF and GPP to explore their relationship under drought stress.

5. Conclusions

In this study, we used continuous tower-based SIF and EC flux observations to investigate the response characteristics of the relationship between GPP and SIF to drought stress in a Chinese cork oak plantation. We compared the differences in the responses of SIF and GPP to drought stress, analyzed the GPP-SIF relationship under different drought stress levels, and evaluated the roles of both physiological and non-physiological components in and the influence of drought synergistic factors on the GPP-SIF relationship under drought stress. The results showed that SIF was less sensitive to drought stress than GPP, and the non-linear relationship between SIF and GPP decreased as the drought stress level increased. At the physiological level, the higher the drought stress level, the stronger the coupling between LUE and ΦF. The red SIF captures GPP more accurately than the far-red SIF under drought stress. The contribution of the canopy structure to SIF and GPP was small. The contribution of radiation to SIF and GPP decreased as the level of drought stress increased, while the contribution of the physiological components increased. The close physiological connection between GPP and SIF is the basis for the use of SIF to capture the dynamics of GPP under drought. VPD was the key contributing factor to the decrease in GPP-SIF coupling among the drought synergistic factors, and considering the effects of VPD can improve the estimation accuracy of GPP from SIF under drought stress. Our results provide a new idea with which to improve the accuracy in estimating GPP from SIF under environmental stress. This study focused on a single Chinese cork oak plantation, so the results for other species or forest ecosystems may differ. Nevertheless, our findings enhance the understanding of the GPP-SIF relationship under drought and will contribute to improving GPP models in the context of climate change.

Supplementary Materials

The following supporting information can be downloaded at: https://www.mdpi.com/article/10.3390/rs17122017/s1, Figure S1: Seasonal dynamics of PWSI in the Chinese cork oak plantation; Figure S2: Frequency diagram of PWSI; Figure S3: Heatmap of the correlations between environmental factors and canopy structural factors; Figure S4: Heatmap of the correlations between environmental factors and K and R2 of GPP-SIF; Table S1: The changes in SIF760, SIF687, GPP, ΦF760, ΦF687, and LUE with each increase in the level of PWSIbin; Table S2: The changes in the relationship of GPP-SIF and LUE-ΦF with each increase in the level of PWSIbin; Table S3. GPP estimation models based on SIF incorporating VPD and differences in the coefficient of determination (R2) and root mean square error (RMSE) across water stress gradients; Table S4. Differences in the coefficient of determination (R2) and root mean square error (RMSE) for SIF-GPP models based on different VPD incorporation methods.

Author Contributions

Conceptualization, Q.P.; methodology, C.H. and X.W.; software, X.C. and M.H.; validation, Q.P. and X.C.; writing—original draft preparation, Q.P.; writing—review and editing, S.S. and J.Z.; visualization, Q.P. and C.H.; supervision, S.S. and J.Z.; funding acquisition, S.S. All authors have read and agreed to the published version of the manuscript.

Funding

This research was funded by CAFYBB2022ZA00102.

Data Availability Statement

Data will be made available on request.

Acknowledgments

We thank Chongfan Guan and Xiaochuang Hu from the Chinese Academy of Forestry for contributing to the field measurements and data analysis.

Conflicts of Interest

The authors declare no conflicts of interest.

References

  1. Forzieri, G.; Dakos, V.; McDowell, N.G.; Ramdane, A.; Cescatti, A. Emerging signals of declining forest resilience under climate change. Nature 2022, 608, 534–539. [Google Scholar] [CrossRef] [PubMed]
  2. Liu, M.; Trugman, A.T.; Peñuelas, J.; Anderegg, W.R.L. Climate-driven disturbances amplify forest drought sensitivity. Nat. Clim. Change 2024, 14, 746–752. [Google Scholar] [CrossRef]
  3. Xiao, X. Modeling gross primary production of temperate deciduous broadleaf forest using satellite images and climate data. Remote Sens. Environ. 2004, 91, 256–270. [Google Scholar] [CrossRef]
  4. Damm, A.; Elbers, J.A.N.; Erler, A.; Gioli, B.; Hamdi, K.; Hutjes, R.; Kosvancova, M.; Meroni, M.; Miglietta, F.; Moersch, A.; et al. Remote sensing of sun-induced fluorescence to improve modeling of diurnal courses of gross primary production (GPP). Glob. Change Biol. 2009, 16, 171–186. [Google Scholar] [CrossRef]
  5. Frankenberg, C.; Fisher, J.B.; Worden, J.; Badgley, G.; Saatchi, S.S.; Lee, J.-E.; Toon, G.C.; Butz, A.; Jung, M.; Kuze, A.; et al. New global observations of the terrestrial carbon cycle from GOSAT: Patterns of plant fluorescence with gross primary productivity. Geophys. Res. Lett. 2011, 38, 17. [Google Scholar] [CrossRef]
  6. Yang, X.; Tang, J.; Mustard, J.F.; Lee, J.E.; Rossini, M.; Joiner, J.; Munger, J.W.; Kornfeld, A.; Richardson, A.D. Solar-induced chlorophyll fluorescence that correlates with canopy photosynthesis on diurnal and seasonal scales in a temperate deciduous forest. Geophys. Res. Lett. 2015, 42, 2977–2987. [Google Scholar] [CrossRef]
  7. Zhang, Z.; Zhang, Y.; Zhang, Q.; Chen, J.M.; Porcar-Castell, A.; Guanter, L.; Wu, Y.; Zhang, X.; Wang, H.; Ding, D.; et al. Assessing bi-directional effects on the diurnal cycle of measured solar-induced chlorophyll fluorescence in crop canopies. Agric. For. Meteorol. 2020, 295, 108147. [Google Scholar] [CrossRef]
  8. Mohammed, G.H.; Colombo, R.; Middleton, E.M.; Rascher, U.; van der Tol, C.; Nedbal, L.; Goulas, Y.; Pérez-Priego, O.; Damm, A.; Meroni, M.; et al. Remote sensing of solar-induced chlorophyll fluorescence (SIF) in vegetation: 50 years of progress. Remote Sens. Environ. 2019, 231, 111177. [Google Scholar] [CrossRef]
  9. Baker, N.R. Chlorophyll Fluorescence: A Probe of Photosynthesis In Vivo. Annu. Rev. Plant Biol. 2008, 59, 89–113. [Google Scholar] [CrossRef]
  10. Qiu, R.; Han, G.; Li, X.; Xiao, J.; Liu, J.; Wang, S.; Li, S.; Gong, W. Contrasting responses of relationship between solar-induced fluorescence and gross primary production to drought across aridity gradients. Remote Sens. Environ. 2024, 302, 113984. [Google Scholar] [CrossRef]
  11. Porcar-Castell, A.; Tyystjärvi, E.; Atherton, J.; van der Tol, C.; Flexas, J.; Pfündel, E.E.; Moreno, J.; Frankenberg, C.; Berry, J.A. Linking chlorophyll a fluorescence to photosynthesis for remote sensing applications: Mechanisms and challenges. J. Exp. Bot. 2014, 65, 4065–4095. [Google Scholar] [CrossRef] [PubMed]
  12. Guanter, L.; Frankenberg, C.; Dudhia, A.; Lewis, P.E.; Gómez-Dans, J.; Kuze, A.; Suto, H.; Grainger, R.G. Retrieval and global assessment of terrestrial chlorophyll fluorescence from GOSAT space measurements. Remote Sens. Environ. 2012, 121, 236–251. [Google Scholar] [CrossRef]
  13. Yang, P.; van der Tol, C. Linking canopy scattering of far-red sun-induced chlorophyll fluorescence with reflectance. Remote Sens. Environ. 2018, 209, 456–467. [Google Scholar] [CrossRef]
  14. Zhang, L.; Qiao, N.; Huang, C.; Wang, S. Monitoring Drought Effects on Vegetation Productivity Using Satellite Solar-Induced Chlorophyll Fluorescence. Remote Sens. 2019, 11, 378. [Google Scholar] [CrossRef]
  15. Li, Z.; Zhang, Q.; Li, J.; Yang, X.; Wu, Y.; Zhang, Z.; Wang, S.; Wang, H.; Zhang, Y. Solar-induced chlorophyll fluorescence and its link to canopy photosynthesis in maize from continuous ground measurements. Remote Sens. Environ. 2020, 236, 111420. [Google Scholar] [CrossRef]
  16. Gu, L.; Han, J.; Wood, J.D.; Chang, C.Y.Y.; Sun, Y. Sun-induced Chl fluorescence and its importance for biophysical modeling of photosynthesis based on light reactions. New Phytol. 2019, 223, 1179–1191. [Google Scholar] [CrossRef]
  17. Zheng, Y.; Unger, N.; Tadić, J.M.; Seco, R.; Guenther, A.B.; Barkley, M.P.; Potosnak, M.J.; Murray, L.T.; Michalak, A.M.; Qiu, X.; et al. Drought impacts on photosynthesis, isoprene emission and atmospheric formaldehyde in a mid-latitude forest. Atmos. Environ. 2017, 167, 190–201. [Google Scholar] [CrossRef]
  18. Bonan, G.B. Forests and Climate Change: Forcings, Feedbacks, and the Climate Benefits of Forests. Science 2008, 320, 1444–1449. [Google Scholar] [CrossRef]
  19. Flexas, J. Drought-inhibition of Photosynthesis in C3 Plants: Stomatal and Non-stomatal Limitations Revisited. Ann. Bot. 2002, 89, 183–189. [Google Scholar] [CrossRef]
  20. Chen, J.; Liu, X.; Du, S.; Ma, Y.; Liu, L. Effects of Drought on the Relationship Between Photosynthesis and Chlorophyll Fluorescence for Maize. IEEE J. Sel. Top. Appl. Earth Obs. Remote Sens. 2021, 14, 11148–11161. [Google Scholar] [CrossRef]
  21. Wohlfahrt, G.; Gerdel, K.; Migliavacca, M.; Rotenberg, E.; Tatarinov, F.; Müller, J.; Hammerle, A.; Julitta, T.; Spielmann, F.M.; Yakir, D. Sun-induced fluorescence and gross primary productivity during a heat wave. Sci. Rep. 2018, 8, 14169. [Google Scholar] [CrossRef] [PubMed]
  22. Wieneke, S.; Burkart, A.; Cendrero-Mateo, M.P.; Julitta, T.; Rossini, M.; Schickling, A.; Schmidt, M.; Rascher, U. Linking photosynthesis and sun-induced fluorescence at sub-daily to seasonal scales. Remote Sens. Environ. 2018, 219, 247–258. [Google Scholar] [CrossRef]
  23. Martini, D.; Sakowska, K.; Wohlfahrt, G.; Pacheco-Labrador, J.; van der Tol, C.; Porcar-Castell, A.; Magney, T.S.; Carrara, A.; Colombo, R.; El-Madany, T.S.; et al. Heatwave breaks down the linearity between sun-induced fluorescence and gross primary production. New Phytol. 2022, 233, 2415–2428. [Google Scholar] [CrossRef] [PubMed]
  24. Li, X.; Xiao, J. TROPOMI observations allow for robust exploration of the relationship between solar-induced chlorophyll fluorescence and terrestrial gross primary production. Remote Sens. Environ. 2022, 268, 112748. [Google Scholar] [CrossRef]
  25. Song, Y.; Wang, L.; Wang, J. Improved understanding of the spatially-heterogeneous relationship between satellite solar-induced chlorophyll fluorescence and ecosystem productivity. Ecol. Indic. 2021, 129, 107949. [Google Scholar] [CrossRef]
  26. Shekhar, A.; Buchmann, N.; Gharun, M. How well do recently reconstructed solar-induced fluorescence datasets model gross primary productivity? Remote Sens. Environ. 2022, 283, 113282. [Google Scholar] [CrossRef]
  27. Wu, Y.; Zhang, Z.; Wu, L.; Zhang, Y. Solar-induced chlorophyll fluorescence tracks canopy photosynthesis under dry conditions in a semi-arid grassland. Agric. For. Meteorol. 2024, 356, 110174. [Google Scholar] [CrossRef]
  28. Magney, T.S.; Bowling, D.R.; Logan, B.A.; Grossmann, K.; Stutz, J.; Blanken, P.D.; Burns, S.P.; Cheng, R.; Garcia, M.A.; Köhler, P.; et al. Mechanistic evidence for tracking the seasonality of photosynthesis with solar-induced fluorescence. Proc. Natl. Acad. Sci. USA 2019, 116, 11640–11645. [Google Scholar] [CrossRef]
  29. Miao, G.; Guan, K.; Suyker, A.E.; Yang, X.; Arkebauer, T.J.; Walter-Shea, E.A.; Kimm, H.; Hmimina, G.Y.; Gamon, J.A.; Franz, T.E.; et al. Varying Contributions of Drivers to the Relationship Between Canopy Photosynthesis and Far-Red Sun-Induced Fluorescence for Two Maize Sites at Different Temporal Scales. J. Geophys. Res. Biogeosci. 2020, 125, e2019JG005051. [Google Scholar] [CrossRef]
  30. Badgley, G.; Field, C.B.; Berry, J.A.J.S.A. Canopy near-infrared reflectance and terrestrial photosynthesis. Sci. Adv. 2017, 3, e1602244. [Google Scholar] [CrossRef]
  31. Miao, G.; Guan, K.; Yang, X.; Bernacchi, C.J.; Berry, J.A.; DeLucia, E.H.; Wu, J.; Moore, C.E.; Meacham, K.; Cai, Y.; et al. Sun-Induced Chlorophyll Fluorescence, Photosynthesis, and Light Use Efficiency of a Soybean Field from Seasonally Continuous Measurements. J. Geophys. Res. Biogeosci. 2018, 123, 610–623. [Google Scholar] [CrossRef]
  32. Guanter, L.; Zhang, Y.; Jung, M.; Joiner, J.; Voigt, M.; Berry, J.A.; Frankenberg, C.; Huete, A.R.; Zarco-Tejada, P.; Lee, J.-E.; et al. Global and time-resolved monitoring of crop photosynthesis with chlorophyll fluorescence. Proc. Natl. Acad. Sci. USA 2014, 111, E1327–E1333. [Google Scholar] [CrossRef]
  33. Pan, Q.; Cheng, X.; Hu, M.; Liu, L.; Wang, X.; Zhang, J.; Li, Z.; Yuan, W.; Gao, X. The Afternoon/Morning Ratio of Tower-Based Solar-Induced Chlorophyll Fluorescence Can Be Used to Monitor Drought in a Chinese Cork Oak Plantation. Remote Sens. 2024, 16, 1897. [Google Scholar] [CrossRef]
  34. Dechant, B.; Ryu, Y.; Badgley, G.; Zeng, Y.; Berry, J.A.; Zhang, Y.; Goulas, Y.; Li, Z.; Zhang, Q.; Kang, M.; et al. Canopy structure explains the relationship between photosynthesis and sun-induced chlorophyll fluorescence in crops. Remote Sens. Environ. 2020, 241, 111733. [Google Scholar] [CrossRef]
  35. Chen, Z.; Liu, Z.; Han, S.; Jiang, H.; Xu, S.; Zhao, H.; Ren, S. Using the diurnal variation characteristics of effective quantum yield of PSII photochemistry for drought stress detection in maize. Ecol. Indic. 2022, 138, 108842. [Google Scholar] [CrossRef]
  36. Tong, X.; Mu, Y.; Zhang, J.; Meng, P.; Li, J. Water stress controls on carbon flux and water use efficiency in a warm-temperate mixed plantation. J. Hydrol. 2019, 571, 669–678. [Google Scholar] [CrossRef]
  37. Liu, L.; Gao, X.; Cao, B.; Ba, Y.; Chen, J.; Cheng, X.; Zhou, Y.; Huang, H.; Zhang, J. Comparing Different Light Use Efficiency Models to Estimate the Gross Primary Productivity of a Cork Oak Plantation in Northern China. Remote Sens. 2022, 14, 5905. [Google Scholar] [CrossRef]
  38. Liu, X.; Liu, L.; Hu, J.; Guo, J.; Du, S. Improving the potential of red SIF for estimating GPP by downscaling from the canopy level to the photosystem level. Agric. For. Meteorol. 2020, 281, 107846. [Google Scholar] [CrossRef]
  39. Zeng, Y.; Badgley, G.; Dechant, B.; Ryu, Y.; Chen, M.; Berry, J.A. A practical approach for estimating the escape ratio of near-infrared solar-induced chlorophyll fluorescence. Remote Sens. Environ. 2019, 232, 111209. [Google Scholar] [CrossRef]
  40. Monteith, J.L. Solar Radiation and Productivity in Tropical Ecosystems. J. Appl. Ecol. 1972, 9, 747–766. [Google Scholar] [CrossRef]
  41. Grömping, U. Estimators of relative importance in linear regression based on variance decomposition. Am. Stat. 2007, 61, 139–147. [Google Scholar] [CrossRef]
  42. Kim, J.; Ryu, Y.; Dechant, B.; Lee, H.; Kim, H.S.; Kornfeld, A.; Berry, J.A. Solar-induced chlorophyll fluorescence is non-linearly related to canopy photosynthesis in a temperate evergreen needleleaf forest during the fall transition. Remote Sens. Environ. 2021, 258, 112362. [Google Scholar] [CrossRef]
  43. Stocker, B.D.; Zscheischler, J.; Keenan, T.F.; Prentice, I.C.; Seneviratne, S.I.; Peñuelas, J. Drought impacts on terrestrial primary production underestimated by satellite monitoring. Nat. Geosci. 2019, 12, 264–270. [Google Scholar] [CrossRef]
  44. Xiao, J.; Fisher, J.B.; Hashimoto, H.; Ichii, K.; Parazoo, N.C. Emerging satellite observations for diurnal cycling of ecosystem processes. Nat. Plants 2021, 7, 877–887. [Google Scholar] [CrossRef]
  45. Xu, H.j.; Wang, X.p.; Zhao, C.y.; Yang, X.m. Assessing the response of vegetation photosynthesis to meteorological drought across northern China. Land Degrad. Dev. 2020, 32, 20–34. [Google Scholar] [CrossRef]
  46. Porcar-Castell, A.; Malenovsky, Z.; Magney, T.; Van Wittenberghe, S.; Fernandez-Marin, B.; Maignan, F.; Zhang, Y.; Maseyk, K.; Atherton, J.; Albert, L.P.; et al. Beyond APAR and NPQ: Factors Coupling and Decoupling SIF and GPP Across Scales. In Proceedings of the 2021 IEEE International Geoscience and Remote Sensing Symposium IGARSS, Brussels, Belgium, 12–16 July 2021; pp. 1925–1927. [Google Scholar]
  47. Ritchie, J.T. Water dynamics in the soil-plant-atmosphere system. In Soil Water and Nitrogen in Mediterranean-Type Environments; Springer: Berlin/Heidelberg, Germany, 1981; pp. 81–96. [Google Scholar]
  48. Rogers, C.A.; Chen, J.M.; Zheng, T.; Croft, H.; Gonsamo, A.; Luo, X.; Staebler, R.M. The Response of Spectral Vegetation Indices and Solar-Induced Fluorescence to Changes in Illumination Intensity and Geometry in the Days Surrounding the 2017 North American Solar Eclipse. J. Geophys. Res. Biogeosci. 2020, 125, e2020JG005774. [Google Scholar] [CrossRef]
  49. Li, X.; Xiao, J.; He, B. Higher absorbed solar radiation partly offset the negative effects of water stress on the photosynthesis of Amazon forests during the 2015 drought. Environ. Res. Lett. 2018, 13, 044005. [Google Scholar] [CrossRef]
  50. Hemes, K.S.; Verfaillie, J.; Baldocchi, D.D. Wildfire-Smoke Aerosols Lead to Increased Light Use Efficiency Among Agricultural and Restored Wetland Land Uses in California’s Central Valley. J. Geophys. Res. Biogeosci. 2020, 125, e2019JG005380. [Google Scholar] [CrossRef]
  51. Cheng, S.J.; Bohrer, G.; Steiner, A.L.; Hollinger, D.Y.; Suyker, A.; Phillips, R.P.; Nadelhoffer, K.J. Variations in the influence of diffuse light on gross primary productivity in temperate ecosystems. Agric. For. Meteorol. 2015, 201, 98–110. [Google Scholar] [CrossRef]
  52. Van der Tol, C.; Berry, J.A.; Campbell, P.K.E.; Rascher, U. Models of fluorescence and photosynthesis for interpreting measurements of solar-induced chlorophyll fluorescence. J. Geophys. Res. Biogeosci. 2014, 119, 2312–2327. [Google Scholar] [CrossRef]
  53. Chen, A.; Mao, J.; Ricciuto, D.; Xiao, J.; Frankenberg, C.; Li, X.; Thornton, P.E.; Gu, L.; Knapp, A.K. Moisture availability mediates the relationship between terrestrial gross primary production and solar-induced chlorophyll fluorescence: Insights from global-scale variations. Glob. Change Biol. 2020, 27, 1144–1156. [Google Scholar] [CrossRef]
  54. Chen, A.; Mao, J.; Ricciuto, D.; Lu, D.; Xiao, J.; Li, X.; Thornton, P.E.; Knapp, A.K. Seasonal changes in GPP/SIF ratios and their climatic determinants across the Northern Hemisphere. Glob. Change Biol. 2021, 27, 5186–5197. [Google Scholar] [CrossRef]
  55. Cheng, X.; Hu, M.; Zhou, Y.; Wang, F.; Liu, L.; Wang, Y.; Huang, H.; Zhang, J. The divergence of micrometeorology sensitivity leads to changes in GPP/SIF between cork oak and poplar. Agric. For. Meteorol. 2022, 326, 109189. [Google Scholar] [CrossRef]
  56. Liu, Z.; Zhao, F.; Liu, X.; Yu, Q.; Wang, Y.; Peng, X.; Cai, H.; Lu, X. Direct estimation of photosynthetic CO2 assimilation from solar-induced chlorophyll fluorescence (SIF). Remote Sens. Environ. 2022, 271, 112893. [Google Scholar] [CrossRef]
Figure 1. The location of the study region.
Remotesensing 17 02017 g001
Figure 2. Distributions of (a) SIF760, (b) SIF687, (c) GPP, (d) ΦF760, (e) ΦF687, and (f) LUE with respect to drought stress level. The red curve represents a kernel density estimate (KDE). The letters a, b, c, and d indicate significant differences at the 0.05 level among the drought stress levels.
Remotesensing 17 02017 g002
Figure 3. Diurnal patterns of (a) SIF760, (b) SIF687, (c) GPP, (d) ΦF760, (e) ΦF687, (f) LUE, and (g) PAR under different drought stress levels.
Remotesensing 17 02017 g003
Figure 4. The relationship of (a1a5) GPP-SIF760, (b1b5) GPP-SIF687, (c1c5) LUE-ΦF760, and (d1d5) LUE-ΦF687 within a daily cycle. The points in the subfigures represent the average values of all data at the same moment under the same PWSIbin level, and the color mapping represents different moments in a day. The curves represent the logarithmic fitting curves in rows (a,b) and the quadratic fitting curves in rows (c,d).
Remotesensing 17 02017 g004
Figure 5. Distributions of (a1a3) R2 of GPP-SIF, (b1b3) K of GPP-SIF, and (c1c3) R2 of LUE-ΦF within a daily cycle with respect to drought stress levels. The blue curve represents a kernel density estimate (KDE). The letters a, b, and c indicate significant differences at the 0.05 level among the drought stress levels.
Remotesensing 17 02017 g005
Figure 6. The relative importance metrics of the natural-log-transformed PAR, ΦF760, NIRv, ΦF687, REDv, LUE, and fPAR as drivers of (a) transformed SIF760, (b) transformed SIF687, and (c) transformed GPP at different PWSIbin levels.
Remotesensing 17 02017 g006
Figure 7. Random forest analysis indicating the influence of major meteorological factors and canopy structural factors, highlighting the synergistic effects of drought on (a,b) R2 (R2 = 0.53) and K (R2 = 0.44) of GPP-SIF760, (c,d) R2 (R2 = 0.45) and K (R2 = 0.41) of GPP-SIF687. “*” indicates significance at the 0.05 level.
Remotesensing 17 02017 g007
Figure 8. Results of path analysis. Subfigures (a,b) are path diagrams where the path coefficients show the direct effects between variables. Subfigure (c) describes the total effects of variables on (c1,c5) GPP, (c2,c6) SIF760 and SIF687, (c3,c7) K of GPP-SIF760 and GPP-SIF687, and (c4,c8) R2 of GPP-SIF760 and GPP-SIF687. The path coefficients with p < 0.05 are shown in the figure.
Remotesensing 17 02017 g008
Figure 9. The R2 of (a) GPP-SIF760 and (b) GPP-SIF687, and RMSE of (c) GPP-SIF760 and (d) GPP-SIF687 with and without the VPD effect within a daily cycle. The whiskers represent the standard error (SE).
Remotesensing 17 02017 g009
Figure 10. The relationship between the observed GPP in the validation set and the predicted GPP based on (a) SIF760 and (b) SIF687 with the VPD effect. The grey dotted line represents the 1:1 line, and the red line represents the linear fitting.
Remotesensing 17 02017 g010
Figure 11. The R2 of (a) GPP-SIF760 and (b) GPP-SIF687, and RMSE of (c) GPP-SIF760 and (d) GPP-SIF687 with and without the VPD effect within a daily cycle in the verification data. The whiskers represent the standard error (SE).
Remotesensing 17 02017 g011
Disclaimer/Publisher’s Note: The statements, opinions and data contained in all publications are solely those of the individual author(s) and contributor(s) and not of MDPI and/or the editor(s). MDPI and/or the editor(s) disclaim responsibility for any injury to people or property resulting from any ideas, methods, instructions or products referred to in the content.

