Article

MTCDNet: Multimodal Feature Fusion-Based Tree Crown Detection Network Using UAV-Acquired Optical Imagery and LiDAR Data

by
Heng Zhang
,
Can Yang
and
Xijian Fan
*
College of Information Science and Technology & Artificial Intelligence, Nanjing Forestry University, Nanjing 210037, China
*
Author to whom correspondence should be addressed.
Remote Sens. 2025, 17(12), 1996; https://doi.org/10.3390/rs17121996
Submission received: 15 April 2025 / Revised: 2 June 2025 / Accepted: 5 June 2025 / Published: 9 June 2025
(This article belongs to the Special Issue Digital Modeling for Sustainable Forest Management)

Abstract

Accurate detection of individual tree crowns is a critical prerequisite for precisely extracting forest structural parameters, which is vital for forestry resources monitoring. While unmanned aerial vehicle (UAV)-acquired RGB imagery, combined with deep learning-based networks, has demonstrated considerable potential, existing methods often rely exclusively on RGB data, rendering them susceptible to shadows caused by varying illumination and suboptimal performance in dense forest stands. In this paper, we propose integrating LiDAR-derived Canopy Height Model (CHM) with RGB imagery as complementary cues, shifting the paradigm of tree crown detection from unimodal to multimodal. To fully leverage the complementary properties of RGB and CHM, we present a novel Multimodal learning-based Tree Crown Detection Network (MTCDNet). Specifically, a transformer-based multimodal feature fusion strategy is proposed to adaptively learn correlations among multilevel features from diverse modalities, which enhances the model’s ability to represent tree crown structures by leveraging complementary information. In addition, a learnable positional encoding scheme is introduced to facilitate the fused features in capturing the complex, densely distributed tree crown structures by explicitly incorporating spatial information. A hybrid loss function is further designed to enhance the model’s capability in handling occluded crowns and crowns of varying sizes. Experiments conducted on two challenging datasets with diverse stand structures demonstrate that MTCDNet significantly outperforms existing state-of-the-art single-modality methods, achieving AP50 scores of 93.12% and 94.58%, respectively. Ablation studies further confirm the superior performance of the proposed fusion network compared to simple fusion strategies. This research indicates that effectively integrating RGB and CHM data offers a robust solution for enhancing individual tree crown detection.

1. Introduction

Forests, covering approximately 30% of the Earth’s land surface, play a vital role in soil and water conservation, environmental enhancement, and the maintenance of ecological balance [1,2]. Individual trees, serving as the primary functional units of forests, demand precise extraction of tree-level information as an essential prerequisite for comprehending forest growth status and spatial distribution changes [3,4]. The objective of individual tree crown detection is to identify trees at the single-tree level from remote sensing imagery. Thus, precise detection of individual tree crowns enables more accurate extraction of tree-specific information, facilitating forest resource monitoring and assessments.
Owing to their capacity to deliver ultra-high spatial resolution imagery, Unmanned Aerial Vehicles (UAVs) have emerged as a critical tool for individual tree crown detection [5,6,7,8]. In contrast to satellite remote sensing, UAV-based remote sensing provides distinct advantages, including greater flexibility, lower operational costs, and reduced susceptibility to cloud interference [9,10], thereby facilitating the acquisition of detailed information at the individual tree level [10,11,12]. Existing methods for tree detection utilizing UAV-acquired optical imagery can be broadly classified into two categories: traditional image processing and deep learning-based methods [13].
Traditional image processing-based methods, such as Local Maxima Filtering, Region Growing, and Watershed Segmentation [14,15], rely primarily on pixel values. However, these methods are significantly affected by spectral pattern variations induced by changes in weather and season, which can substantially degrade their detection performance and lead to poor generalization [8]. Furthermore, image processing techniques often depend heavily on manually set threshold parameters, further limiting their adaptability. Due to their superb ability to represent 2-dimensional (2D) images, deep Convolutional Neural Network (CNN)-based object detection methods have been widely applied to individual tree crown detection [16,17,18,19] using UAV images. For instance, Santos et al. [20] conducted experimental comparisons of three deep learning-based object detection methods—Faster R-CNN, YOLOv3, and RetinaNet—assessing their performance in detecting Brazil nut tree (Dipteryx alata Vogel) canopies from drone-based visible imagery. Similarly, Jintasuttisak et al. [21] and Wu et al. [18] optimized and enhanced YOLO-based one-stage detection frameworks, achieving fast and accurate individual tree detection on publicly available datasets, including the palm tree dataset and the NEON dataset. Compared to traditional image processing methods, deep learning-based method for tree crown detection offer the advantage of end-to-end while exhibiting greater robustness [22]. Compared to one-stage methods like YOLO, two-stage methods typically offer higher detection accuracy, particularly in scenarios requiring greater precision. For instance, Mask R-CNN [23] first generates candidate boxes and then performs more refined processing, enabling it to better locate targets in complex scenes. However, two-stage methods generally come with higher computational costs and slower speeds. Therefore, this study selects a one-stage detection framework to ensure sufficient detection accuracy while maintaining detection speed.
Nevertheless, as a passive imaging technique, optical imagery is fundamentally constrained by its inability to adequately resolve vertical canopy details, a limitation rooted in its imaging principles. Tree crowns typically display a vertical gradient, with heights diminishing from the central peak toward the outer margins that is a key structural feature essential for precise individual tree delineation. Integrating vertical height data with optical imagery thus emerges as a promising strategy to improve the accuracy of tree crown segmentation in challenging forest settings, especially in dense stands. Canopy Height Models (CHMs), which offer detailed elevation profiles of forest canopies [24,25], provide a robust source of such vertical information. Qin et al. [12] combined various sets of vertical structural, spectral, and textural features from UAV-based LiDAR, hyperspectral, and RGB data, and employed a random forest classifier for the classification of tree species. However, this work utilizes traditional feature fusion techniques rather than deep learning-based feature fusion, and thus does not achieve end-to-end learning. Similarly, Luo et al. [26] applies a simple framework to integrate optical and LiDAR data, which relies on a simple spatial correlation strategy for alignment. However, the feature fusion strategy used in these two works is insufficient to fully exploit the complementary and informative characteristics of the two modalities.
Motivated by advancements in multi-modal feature learning, this study explores the integration of optical imagery and CHM data to enhance tree crown detection by leveraging their complementary strengths. While simple concatenation or addition strategies might appear intuitive for combining these two modalities, such approaches often fail to capture their complementary information due to the inherent heterogeneity between RGB and CHM data. To address this limitation, we propose a feature fusion network designed for individual tree crown detection from UAV multimodal data. Specifically, a multilevel transformer-based mechanism is employed to establish long-range dependencies between multi-level features derived from different modalities, thereby adaptively enhancing complementary information flow across modalities. Furthermore, recognizing the intrinsic limitations of transformers in perceiving spatial information, we introduce a learnable positional encoding scheme, which enhances the ability of multi-modal features to interpret spatial relationships between tree crowns within the image, particularly in challenging scenarios involving overlapping objects or close proximity. To further strengthen the tree crown identification capability of the proposed network, a hybrid loss function is employed, integrating Focal loss for classification and CIoU loss for bounding box regression. The Focal loss enables the model to concentrate on challenging tree crowns such as partially occluded or densely clustered instances, while the CIoU loss markedly improves the robustness in detecting tree crowns across a range of sizes.
The main contributions of this research can be summarized as follows:
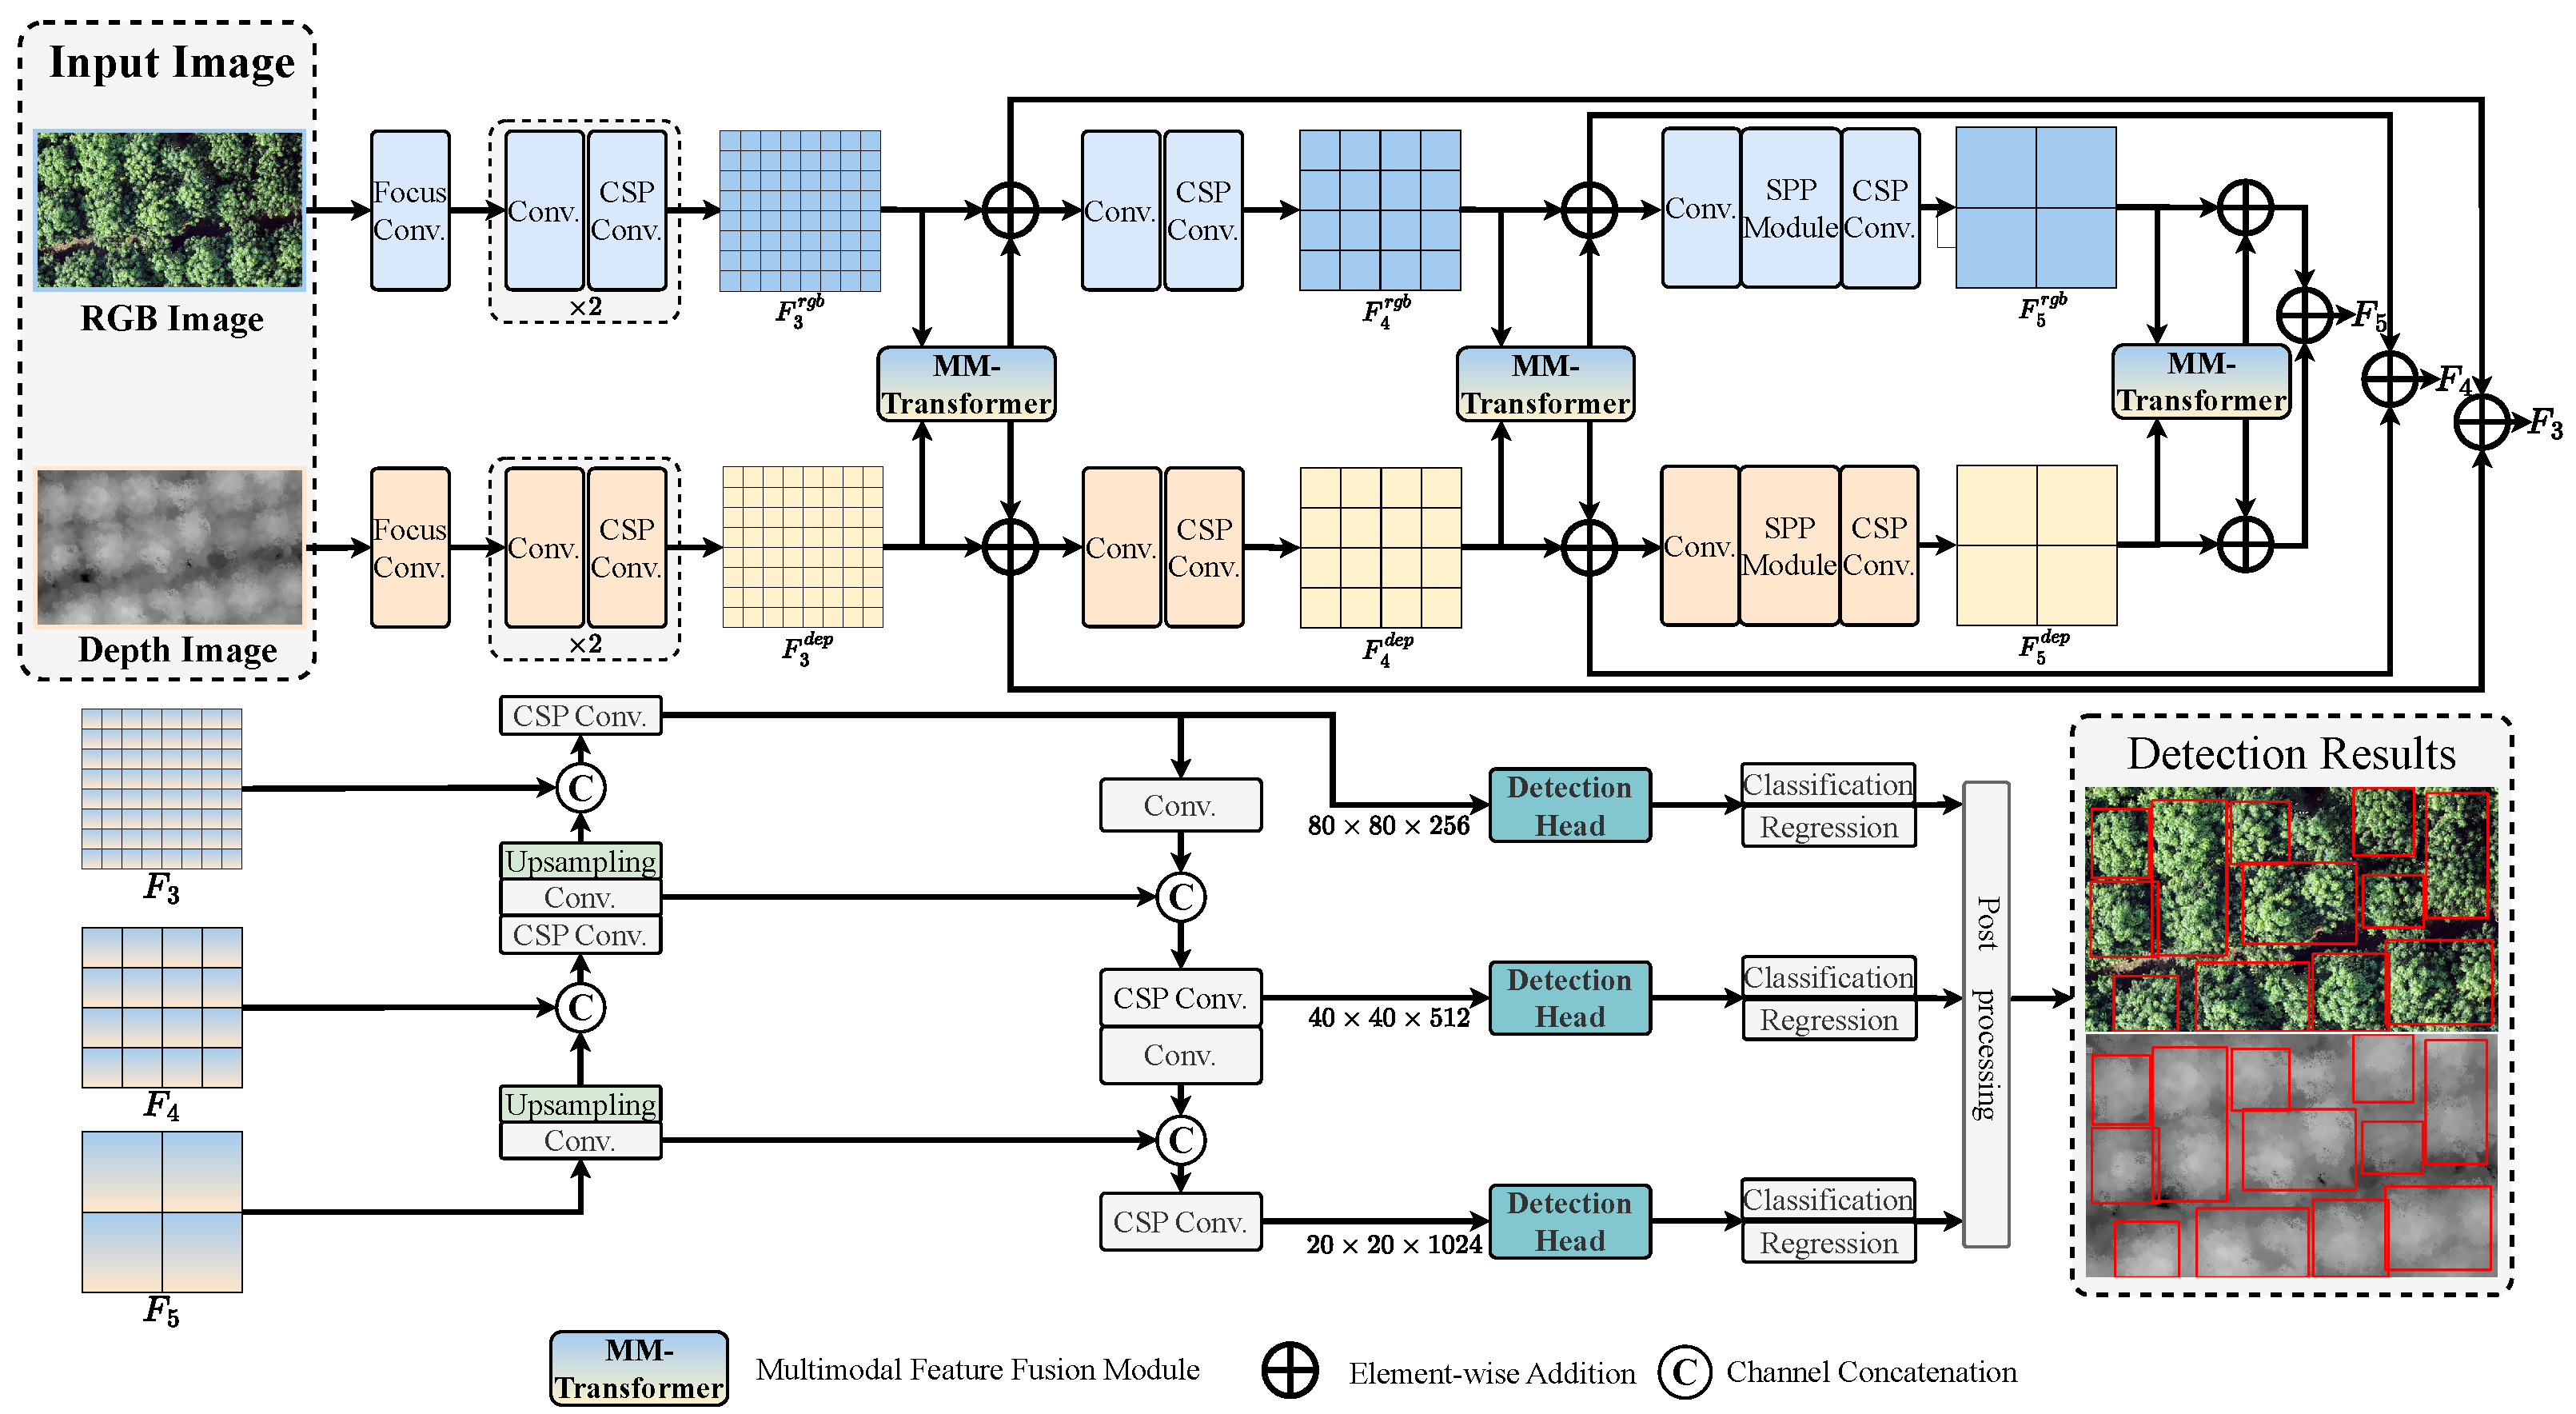
  • This paper proposes an end-to-end crown detection network, MTCDNet, based on multimodal feature fusion. By integrating RGB images and CHM data, the model enhances detection performance in dense forest environments.
  • We designed a Transformer-based cross-modal feature fusion module, which improves the interaction between heterogeneous features and enhances the representation of canopy structures.
  • A learnable positional encoding scheme was introduced in the Transformer-based feature fusion framework, explicitly embedding spatial context to precisely locate densely distributed canopies.
  • Extensive experiments conducted on two forest datasets show that the proposed method outperforms existing single-modal detection frameworks in evaluation metrics, validating the effectiveness of the multimodal feature fusion strategy.

2. Materials and Methods

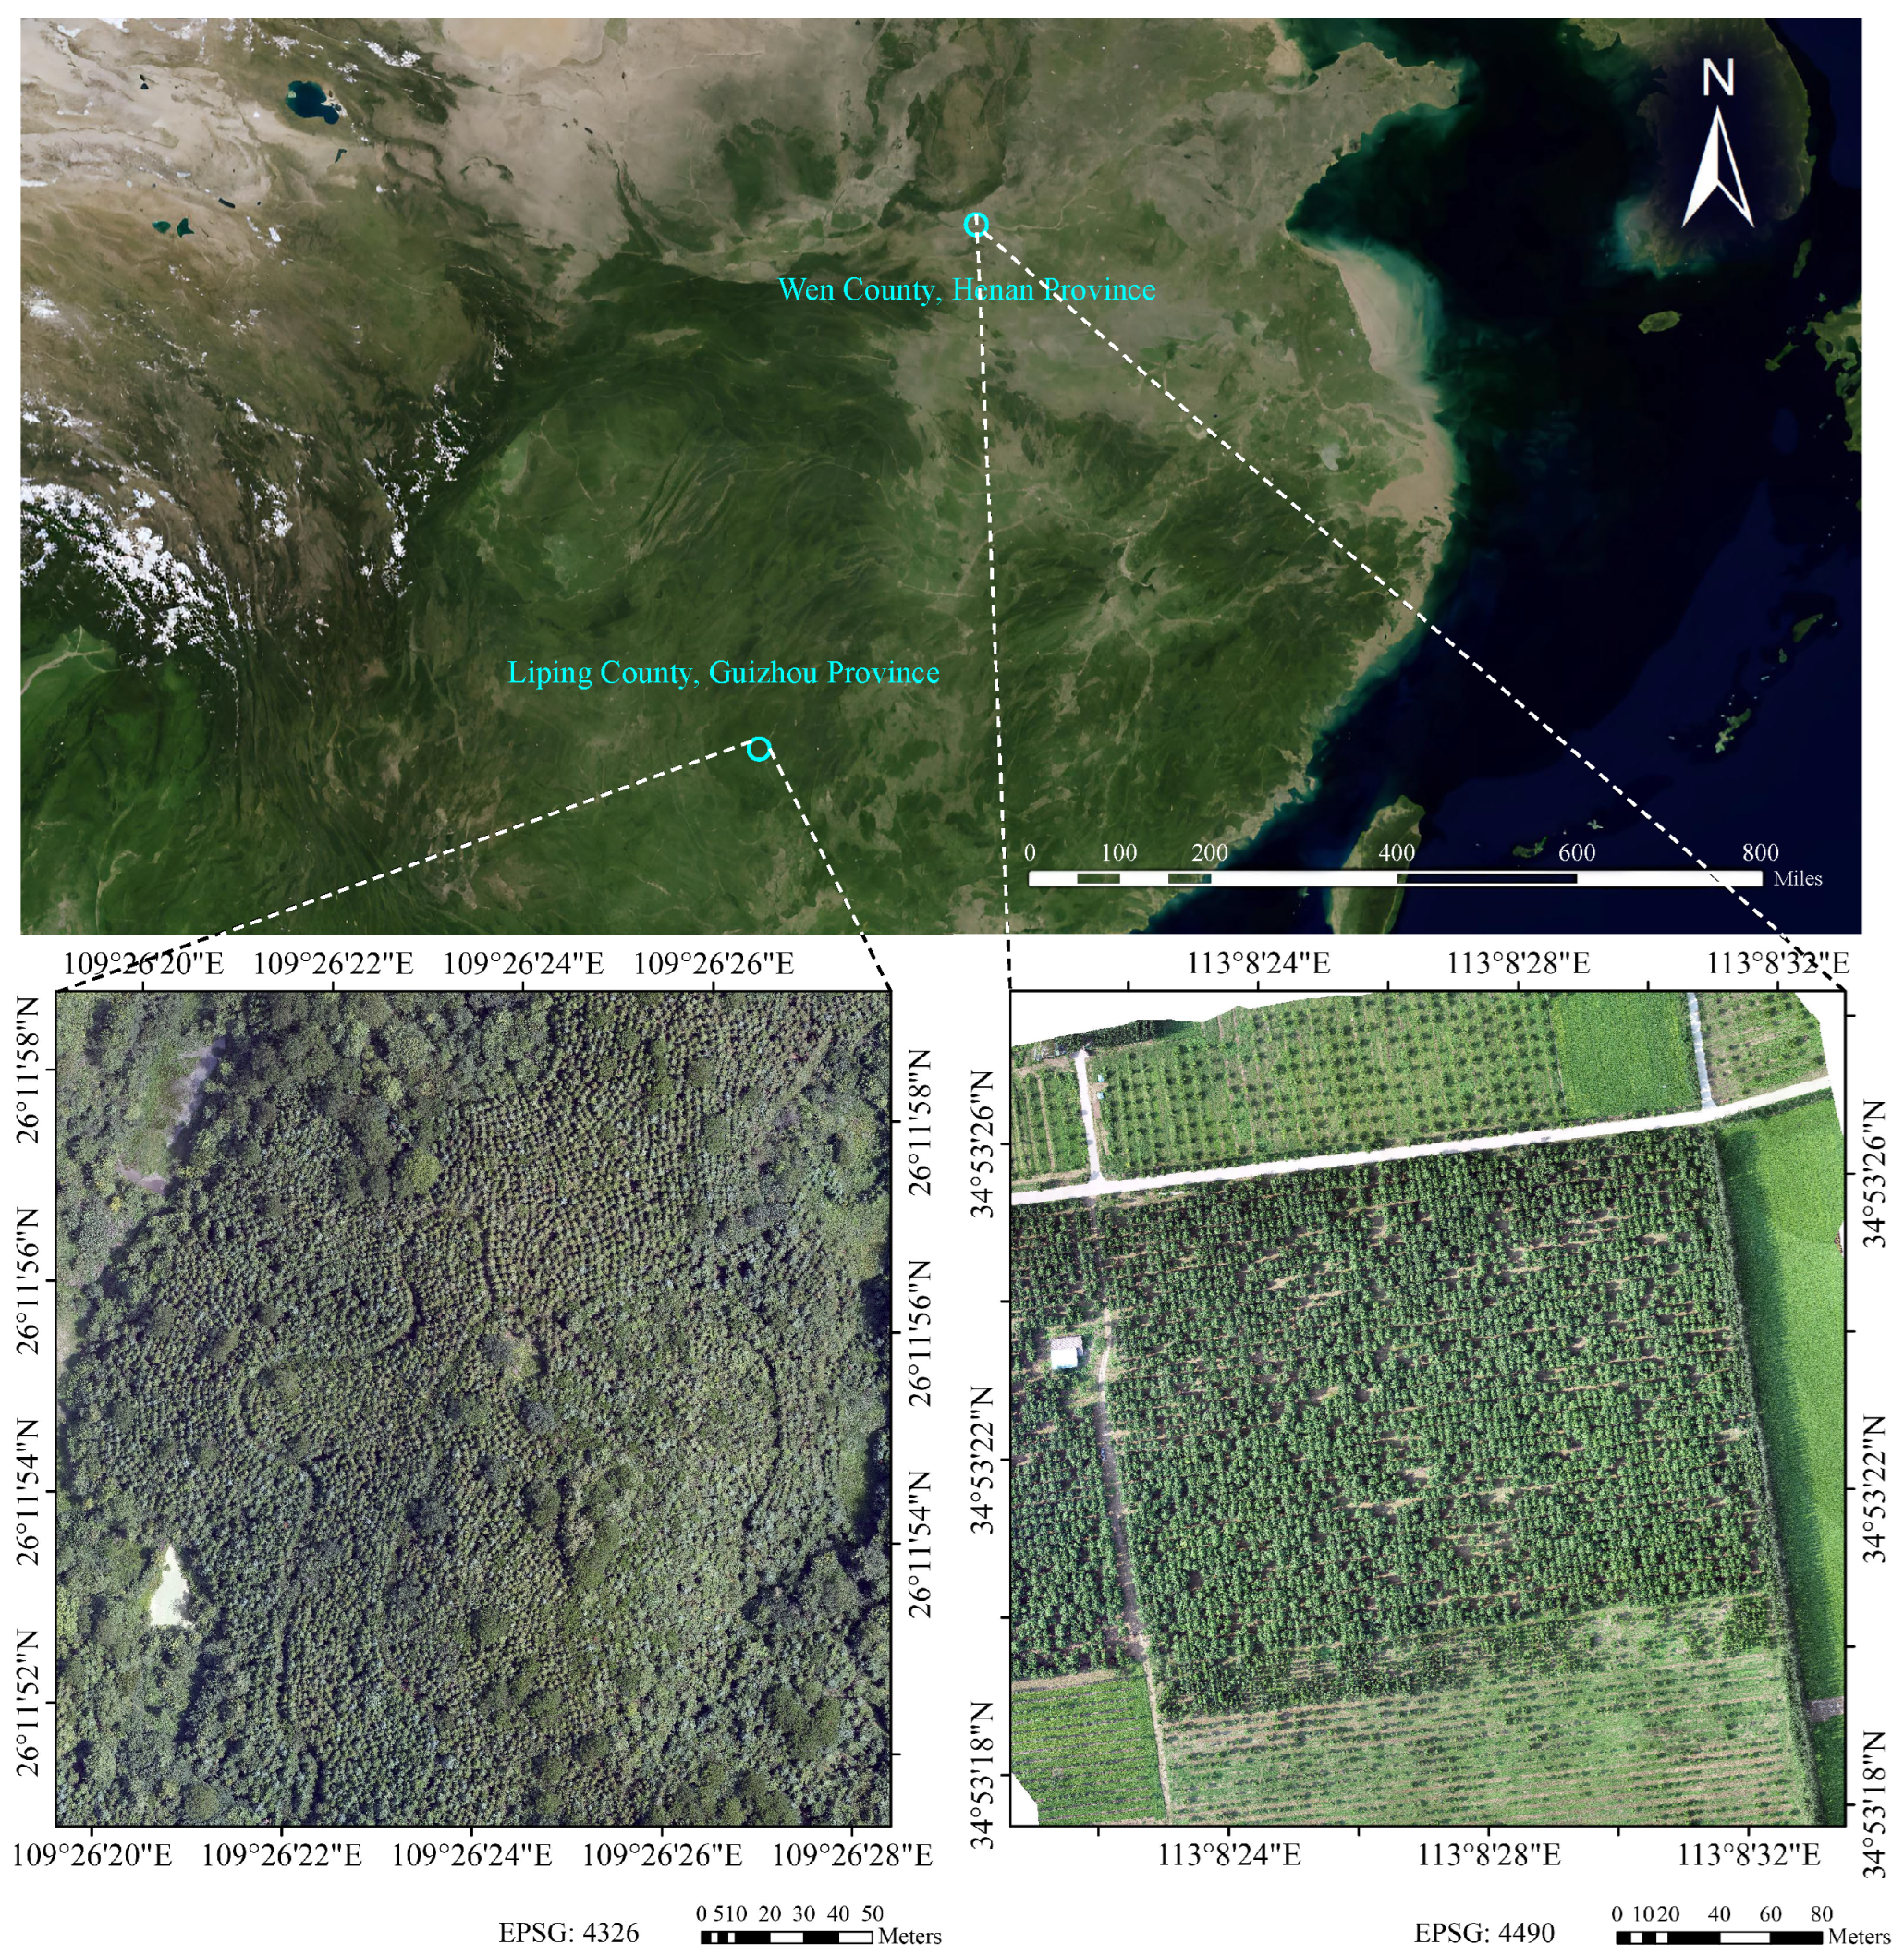
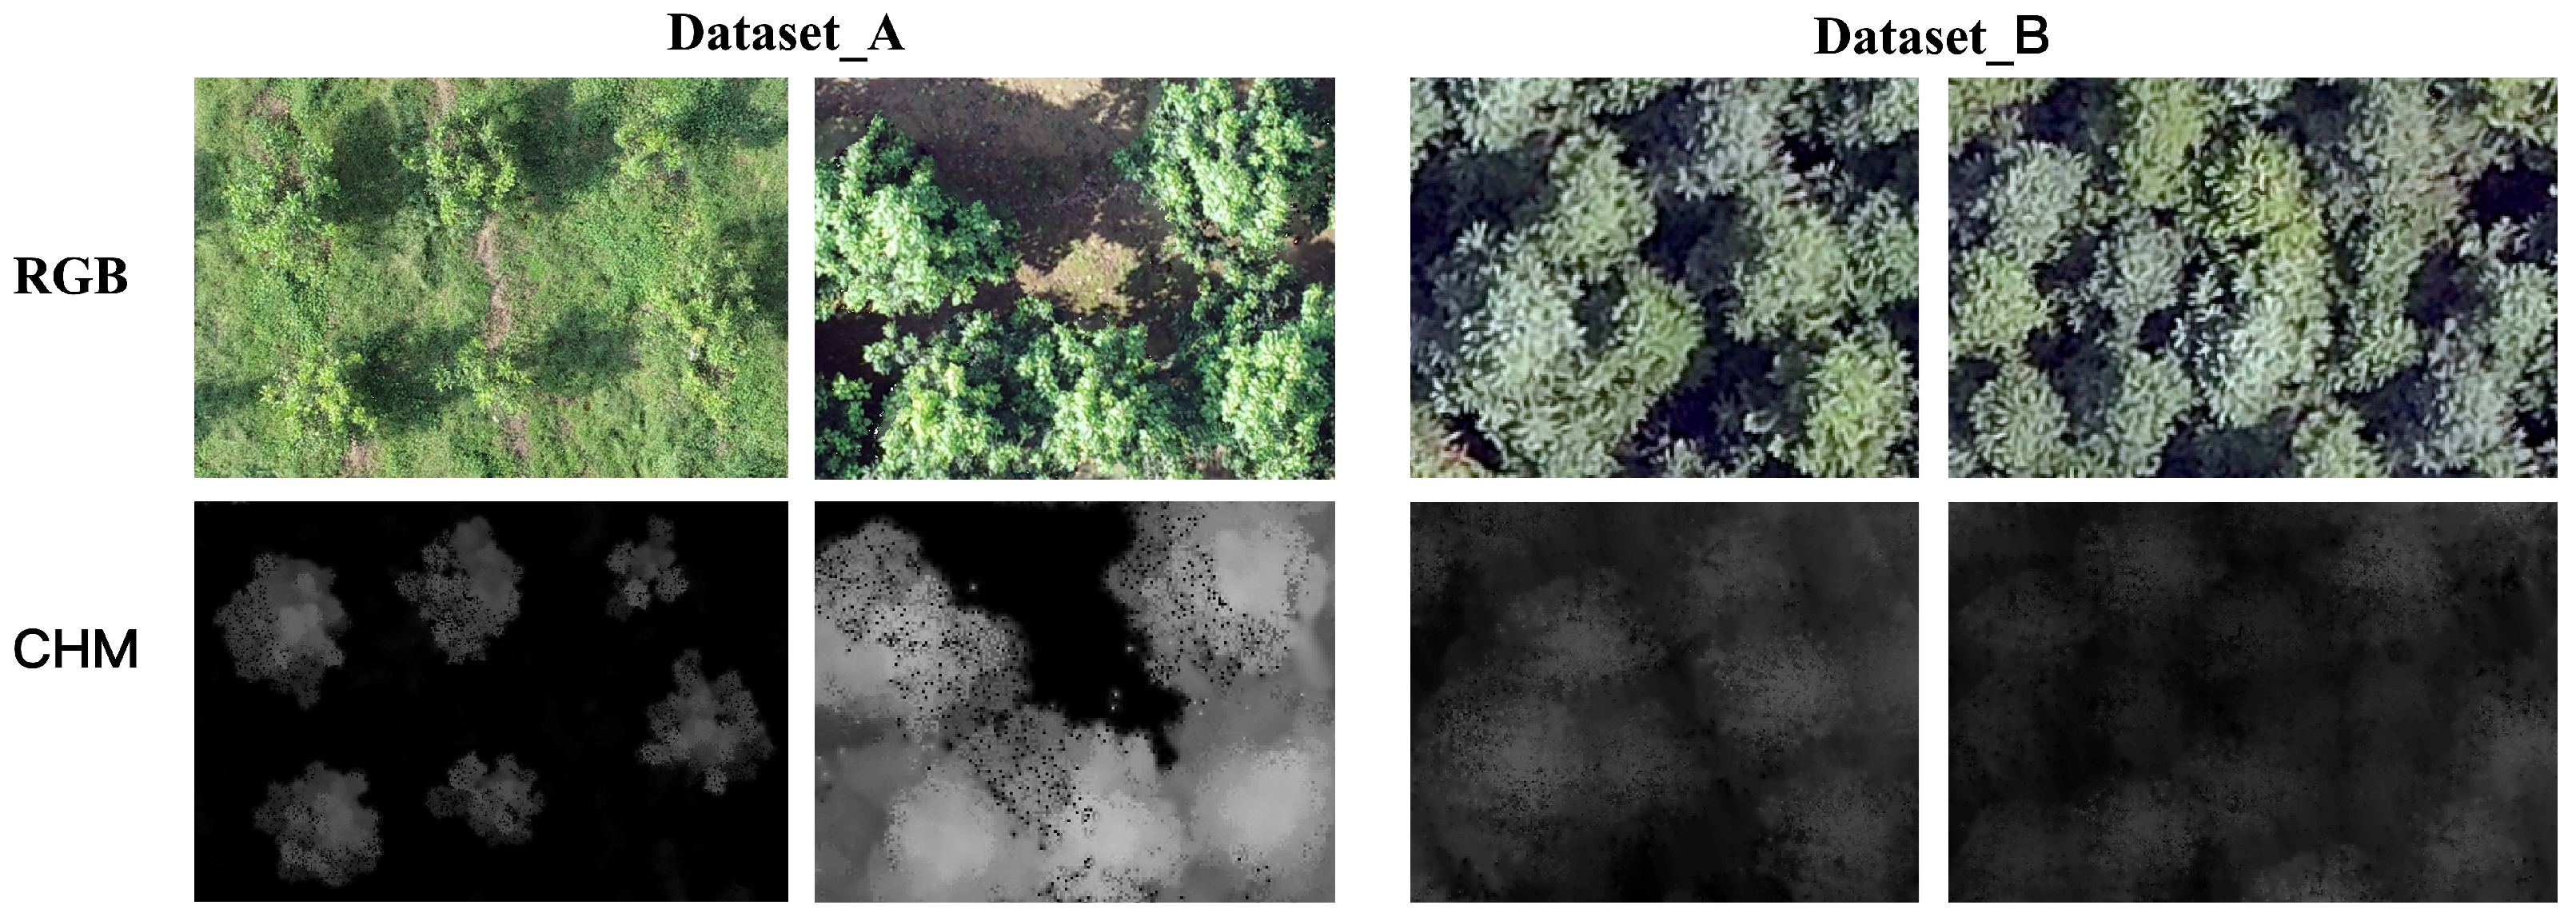
2.1. Study Area and Dataset

This study conducts experiments on two forest remote sensing datasets collected using UAV (see Figure 1): one is a broadleaf forest dataset (Dataset_A) collected in 2023 from Wenxian County, Henan Province (113°08′26″E, 34°53′24″N), and the other is a mixed conifer forest dataset (Dataset_B) collected in 2023 from Liping County, Guizhou Province (109°26′24″E, 26°11′54″N). Both datasets exhibit high tree density and a certain degree of crown overlap, which increases the difficulty of crown detection tasks. These regions represent typical geographic and climatic zones in China, providing a solid foundation for evaluating the model’s adaptability in different ecological environments.
The region of Dataset_A is characterized by a temperate continental monsoon climate with relatively flat terrain, primarily composed of Catalpa bungei. The crowns of Catalpa bungei are typically spherical or oval, with dense branches and thick canopies. Especially in the late growth stages, the crowns often overlap, posing a significant challenge for crown detection. The dataset contains a total of 879 trees. In contrast, the region of Dataset_B experiences a subtropical monsoon climate with complex and varied terrain. The main tree species include Pinus massoniana and Cunninghamia lanceolata. The crowns of Pinus massoniana are generally conical or umbrella-shaped, with sparse branches that grow upward, resulting in larger gaps between crowns. However, in high-density forest areas, the crowns may overlap due to crowded growth. Cunninghamia lanceolata has broader crowns, typically dome-shaped with dense branches. In densely vegetated areas, crown overlap is likely to occur, causing boundary blurring. Additionally, the crowns of both Cunninghamia lanceolata and Pinus massoniana are susceptible to shadowing and lighting conditions, which may lead to partial occlusion or unclear boundaries in the images, further increasing the difficulty of detection. The dataset contains a total of 1618 trees. Data collection was carried out using a DJI Matrice 300 RTK UAV (DJI, Shenzhen, China) equipped with a GNSS-RTK positioning system. The platform integrated the Zenmuse L1 module, which includes a LiDAR sensor, RGB camera, and high-precision Inertial Measurement Unit. The flight altitude for both datasets was set to 80 m. The raw data were preprocessed using DJI Terra 3.4 software. RGB data were registered and stitched together, and orthophotos with a resolution of 3 cm were generated using flight height and camera intrinsic parameters. LiDAR point cloud data were filtered and denoised using LiDAR360 software and classified for ground points. Subsequently, the point cloud data were normalized based on ground points and clipped to extract valid points within the study area. The CHM was generated from the normalized point cloud data using inverse distance weighting interpolation, with a spatial resolution of 3 cm, to facilitate pixel-level fusion with the RGB images.
To enhance the diversity of the datasets and improve the robustness of the model, we applied commonly used data augmentation techniques during the training process, including random rotation, flipping, cropping, and color adjustments. These techniques effectively expanded the training sample size, alleviated overfitting, and enhanced the model’s generalization ability in practical applications. Specifically, the random rotation angle range was set between −30° and 30°, with a 0.5 probability for image flipping, cropping ratios between 80% and 100% of the original image, and color adjustments including brightness, contrast, and saturation changes. Each image underwent at least one of these transformations. Both RGB and CHM data were cropped and resampled into 640 × 640 pixel image patches for training. Figure 2 shows sample images from the two datasets. As shown, Dataset_A exhibits large variations in crown size, with shadow interference and uneven crown density. In contrast, Dataset_B has a higher density with some crown overlap, and shadows obscure the crown edges, making the detection task more challenging. Therefore, both datasets represent highly challenging scenarios in crown detection, which are used to validate the effectiveness of the proposed multimodal feature fusion method.

2.2. Methods

This study proposes a multimodal tree crown detection framework leveraging feature fusion of UAV-acquired RGB imagery and LiDAR-derived CHM data. The overall architecture is illustrated in Figure 3. The MTCDNet receives a paired RGB image I r g b R 3 × W × H and depth image I d e p R 1 × W × H , where W and H represent the width and height of the images, respectively. The input image pair is separately fed into the corresponding branch’s Focus convolution and two feature extraction modules composed of 2D convolution and cross stage partial (CSP) convolution [27], yielding a 3× downsampled RGB feature map F 3 r g b R C 3 × W 4 × H 4 and depth feature map F 3 d e p R C 3 × W 4 × H 4 , which can be represented by Equations (1) and (2):
F 3 r g b = CSP ( Conv ( Focus ( I r g b ) ) )
F 3 d e p = CSP ( Conv ( Focus ( I d e p ) ) )
where CSP(·), Conv(·), and Focus(·) represent CSP convolution, 2D convolution, and Focus convolution, respectively. The Focus convolution module, introduced in YOLOv5, spatially reorganizes input images into higher-channel feature maps by slicing and concatenating, effectively reducing computational complexity while preserving critical information, while the CSP convolution splits input features into two branches for separate processing and cross-stage fusion, optimizing gradient flow and computational efficiency while enhancing multi-scale feature representation [27].
Subsequently, the downsampled feature maps F 3 r g b and F 3 d e p are fed into the multimodal feature fusion module MM-Transformer, resulting in a fused multimodal feature map F 3 M M . The multimodal feature map is then added to the corresponding unimodal feature maps to ensure feature connectivity, which can be expressed by Equations (3) and (4):
F 3 M M = MMT ( F 3 r g b , F 3 d e p )
F 3 = ( F 3 M M F 3 r g b ) ( F 3 M M F 3 d e p )
where MMT(·) represents the MM-Transformer fusion module, and F 3 represents the features after interaction with multimodal features. Following the above steps, 4× downsampled multimodal features F 4 and 5× downsampled features F 5 are extracted sequentially. Subsequently, these features are fed into a PANet-like structure, undergoing multiple CSP convolutions, 2D convolutions, and upsampling operations, allowing different scale features to interact fully and ensuring the extraction of rich multi-scale features. These multi-scale feature maps are then passed to detection heads for classification and regression, producing preliminary detection results, which are then filtered through post-processing to obtain the final detection results.

2.2.1. MM-Transformer

Conventional multimodal feature fusion methods, such as addition or channel concatenation, exhibit limited capacity to fully exploit complementary information. To address this, we propose a transformer-based multimodal fusion module, termed the MM-Transformer, which leverages the robust representational power of transformers to effectively integrate features from RGB imagery and CHM data. The primary strength of this method lies in its ability to capture long-range dependencies and adaptively learn inter-modal correlations, resulting in superior fusion performance. The model architecture is illustrated in Figure 4. The proposed module builds upon the transformer encoder framework, utilizing features from both modalities as token inputs and incorporating a learnable positional encoding scheme to enhance spatial feature representation. Specifically, multimodal tokens undergo fusion through a multi-head self-attention mechanism, followed by a feed-forward network for non-linear transformation to bolster representational capacity, and conclude with a projection layer to align dimensions for subsequent fusion stages.
Feature Input. First, the two modal features extracted by the two branches, RGB features and depth features, denoted as F r g b and F d e p respectively, undergo a Flatten operation to convert them into one-dimensional vectors, and then the two vectors are concatenated along the channel dimension, as shown in Equation (5):
F 1 = Concat ( Flatten F rgb ) , Flatten ( F dep ) )
where Flatten(·) is the operation to convert features into vectors, and C o n c a t ( · ) represents feature concatenation. The resulting feature F is then fed into a multi-head self-attention mechanism for feature interactive fusion.
Multi-Head Self-Attention. After obtaining the concatenated feature F R C × W × H , it is added to a learnable positional encoding (explained in detail in the next subsection) to provide more positional information for each pixel, and then fed into a multi-head self-attention module for interaction. This process is shown as follows:
F 2 = F 1 E p o s
Q = F 2 · W Q , K = F 2 · W K , V = F 2 · W V
Attention ( Q , K , V ) = softmax ( Q K T d k ) V
where E p o s represents the learnable positional encoding; W Q , W K , and W V represent the linear layer weights for mapping Q, K, and V, used to map feature values to another dimension; d k represents the dimension of K. This self-attention mechanism is then formulated as multi-head attention, as shown in Equations (9) and (10):
MultiHead ( Q , K , V ) = Concat ( h e a d 1 , h e a d 2 , , h e a d h ) W O
h e a d i = Attention ( Q W i Q , K W i K , V W i V )
where the mapping W is the parameter matrix, W i Q R d m o d e l × d Q , W i K R d m o d e l × d K , W i V R d m o d e l × d V ; h represents the number of heads, which is set to 8 in this study. This step uses multi-head attention to allow multimodal features to interact fully, obtaining richer fused features.
Feed-Forward Layer. The feature obtained through multi-head attention, denoted as F 3 , is added to F 2 through a residual connection to obtain F 4 , as shown in Equation (11):
F 3 = MultiHead ( Q , K , V ) , F 4 = F 2 F 3
F 4 then undergoes layer normalization and a SiLU activation function before being fed into a feed-forward layer, followed by another residual connection with F 4 to ensure no information is lost. The entire process is as follows:
F 5 = FFN ( SiLU ( Norm ( F 4 ) ) )
F M M = MLP ( SiLU ( Norm ( F 4 F 5 ) ) )
where FFN(·) is the feed-forward layer; SiLU(·) represents the SiLU activation function; Norm(·) represents layer normalization; and F M M R C × W × H is the final output multimodal feature.

2.2.2. Learnable Positional Encoding

In transformer-based computer vision tasks, positional encoding is a critical component that embeds positional information into sequential data elements. Unlike convolutional neural networks (CNNs), which inherently capture spatial structure, transformers lack intrinsic awareness of input data order or spatial arrangement, necessitating explicit positional encoding to model these relationships. Positional encoding enables the model to discern relative or absolute positional relationships among pixels or image patches, thereby enhancing the capture of spatial contextual information. Common approaches to positional encoding include fixed positional encoding, such as sinusoidal or cosine functions, and learnable positional encoding. Fixed positional encoding employs predefined mathematical functions (e.g., sine and cosine) to generate positional representations, as illustrated in Figure 5a. This method, widely validated in natural language processing, offers robust generalization and theoretical grounding. However, in our tree crown detection task, where images exhibit more complex spatial structures, fixed encoding may fall short in adequately capturing both local and global spatial relationships. Thus, we introduce a learnable positional encoding that adaptively learns positional information through the training process, providing more flexible adaptation to specific task requirements, especially effective positional representation when dealing with complex multimodal features, as shown in Figure 5b. Specifically, learnable positional encoding is implemented through the following steps. First, position indices are processed through a 1D convolutional layer. Convolution operations can capture local features of input data, which is particularly important for extracting positional information as it helps the model recognize the importance of different positions in a sequence. Next, the feature maps processed by convolution pass through a batch normalization layer. Batch normalization helps accelerate the training process while reducing the model’s sensitivity to weight initialization, thereby improving its generalization ability. Then, a ReLU activation function is used to perform non-linear transformation on the normalized features. The ReLU function introduces non-linearity, enabling the model to learn more complex feature representations. Finally, the features activated by ReLU pass through another 1D convolutional layer to further extract and refine positional information. Assuming the input position index is P i n and the output positional encoding is E p o s , this process is as follows:
X 1 = Conv 1 ( P i n , W 1 ) + b 1
X 2 = BN ( X 1 , γ , β )
X 3 = ReLU ( X 2 )
E p o s = Conv 2 ( X 3 , W 2 ) + b 2
where W 1 , W 2 , b 1 and b 2 represent the corresponding convolution kernel parameters and biases; γ and β are learnable parameters for batch normalization; BN represents batch normalization. Through this series of operations, learnable positional encoding can adaptively adjust its parameters to better suit our task. This design enables the effective capture of intricate, densely distributed tree crown structures through explicit spatial context embedding. Unlike traditional sinusoidal encoding, which depends on fixed periodic patterns, learnable positional encoding adapts to positional information through data-driven learning, offering superior performance in handling tree crowns with uneven distributions.

2.2.3. Loss Function

MTCDNet employs a one-stage detection algorithm structure with a loss function comprising three components: object classification, confidence classification, and bounding box regression, denoted as L c l s , L o b j , and L b o x , respectively, used to optimize object category and detection box precision. For object classification and confidence classification, the Focal Loss function is used to deal with tree crowns such as partially occluded or densely clustered instance, as shown in Equations (18) and (19):
L o b j = α ( 1 p ^ t ) γ o b j log p ^ t
L c l s = c = 1 C α c ( 1 p ^ i c ) γ c l s log ( p ^ i c )
where p ^ t is the confidence value predicted by the model; for positive samples, p ^ t is the predicted confidence, and for negative samples, ( 1 p ^ t ) is the probability of being predicted as background; α is a balancing factor used to adjust the weight of positive and negative samples, set to 0.25; γ o b j and γ c l s are modulating factors used to reduce the loss contribution from easily classified samples, set to 1.5; p ^ i c is the probability value of category c predicted by the model; and α c is a balancing factor for category c used to adjust the weights of different categories, set to 0.25. For bounding box regression, the CIoU loss function is used, which improves the robustness in detecting tree crowns with varying sizes, as follows:
L b o x = 1 I o U + ρ 2 c 2 + α b o x ν
IoU = b x × b y a x × a y + b x × b y b x × b y
ρ = ( p x g x ) 2 + ( p y g y ) 2
c = a x + b x 2 + a y + b y 2
ν = 4 π 2 arctan a w a h + 4 π 2 arctan b w b h 4 π 2 arctan a m + b m a h + b h
where I o U is the intersection over union between the predicted bounding box and the ground truth bounding box; ρ is the Euclidean distance between the center points of the predicted bounding box and the ground truth bounding box; c is the diagonal length of the smallest enclosing rectangle containing both the predicted bounding box and the ground truth bounding box; v is an aspect ratio consistency term used to measure the consistency of the aspect ratios between the predicted bounding box and the ground truth bounding box; α b o x is a weight coefficient used to balance the influence of the aspect ratio consistency term; ( a x , a y ) is the width and height of the ground truth bounding box, ( b x , b y ) is the width and height of the predicted bounding box, ( p x , p y ) and ( g x , g y ) are the center point coordinates of the predicted bounding box and the ground truth bounding box, respectively; and ( b w , b h ) are the width and height of the predicted bounding box, and ( a w , a h ) are the width and height of the ground truth bounding box. The total loss function can be expressed as:
L t o t a l = λ box L box + λ obj L obj + λ cls L cls
where λ b o x , λ o b j , and λ c l s are the weight coefficients for each part of the loss, set to 0.05, 1, and 0.5, respectively.

3. Results and Discussion

3.1. Experiment Setting

All experiments were conducted on a single NVIDIA RTX 3090 GPU with 24 GB memory. The proposed MTCDNet was trained using Stochastic Gradient Descent (SGD) as the optimizer. The initial learning rate was set to 0.01, with weight decay and momentum parameters configured to 0.0005 and 0.937, respectively. For learning rate scheduling, we implemented the OneCycle policy, where the learning rate first increases to the maximum value and then gradually decreases to a final value of 0.002, which effectively improved convergence stability and training efficiency. Input images were resized to 640 × 640 pixels for both training and testing phases, maintaining a balance between computational efficiency and preservation of visual details. The batch size was configured to four to accommodate GPU memory constraints while ensuring stable gradient updates. The model was trained for 100 epochs to guarantee sufficient convergence of the multimodal feature fusion components.

3.1.1. Metrics

To assess the effectiveness of the proposed method, we employ three widely recognized metrics in object detection: mean Average Precision (mAP), AP50, and AP75. AP50 is determined using a single Intersection over Union (IoU) threshold of 0.5, while AP75 is evaluated at an IoU threshold of 0.75. The mean mAP is computed by averaging the precision across multiple IoU thresholds, providing a comprehensive assessment of model performance.
mAP = 1 N i = 1 N AP i

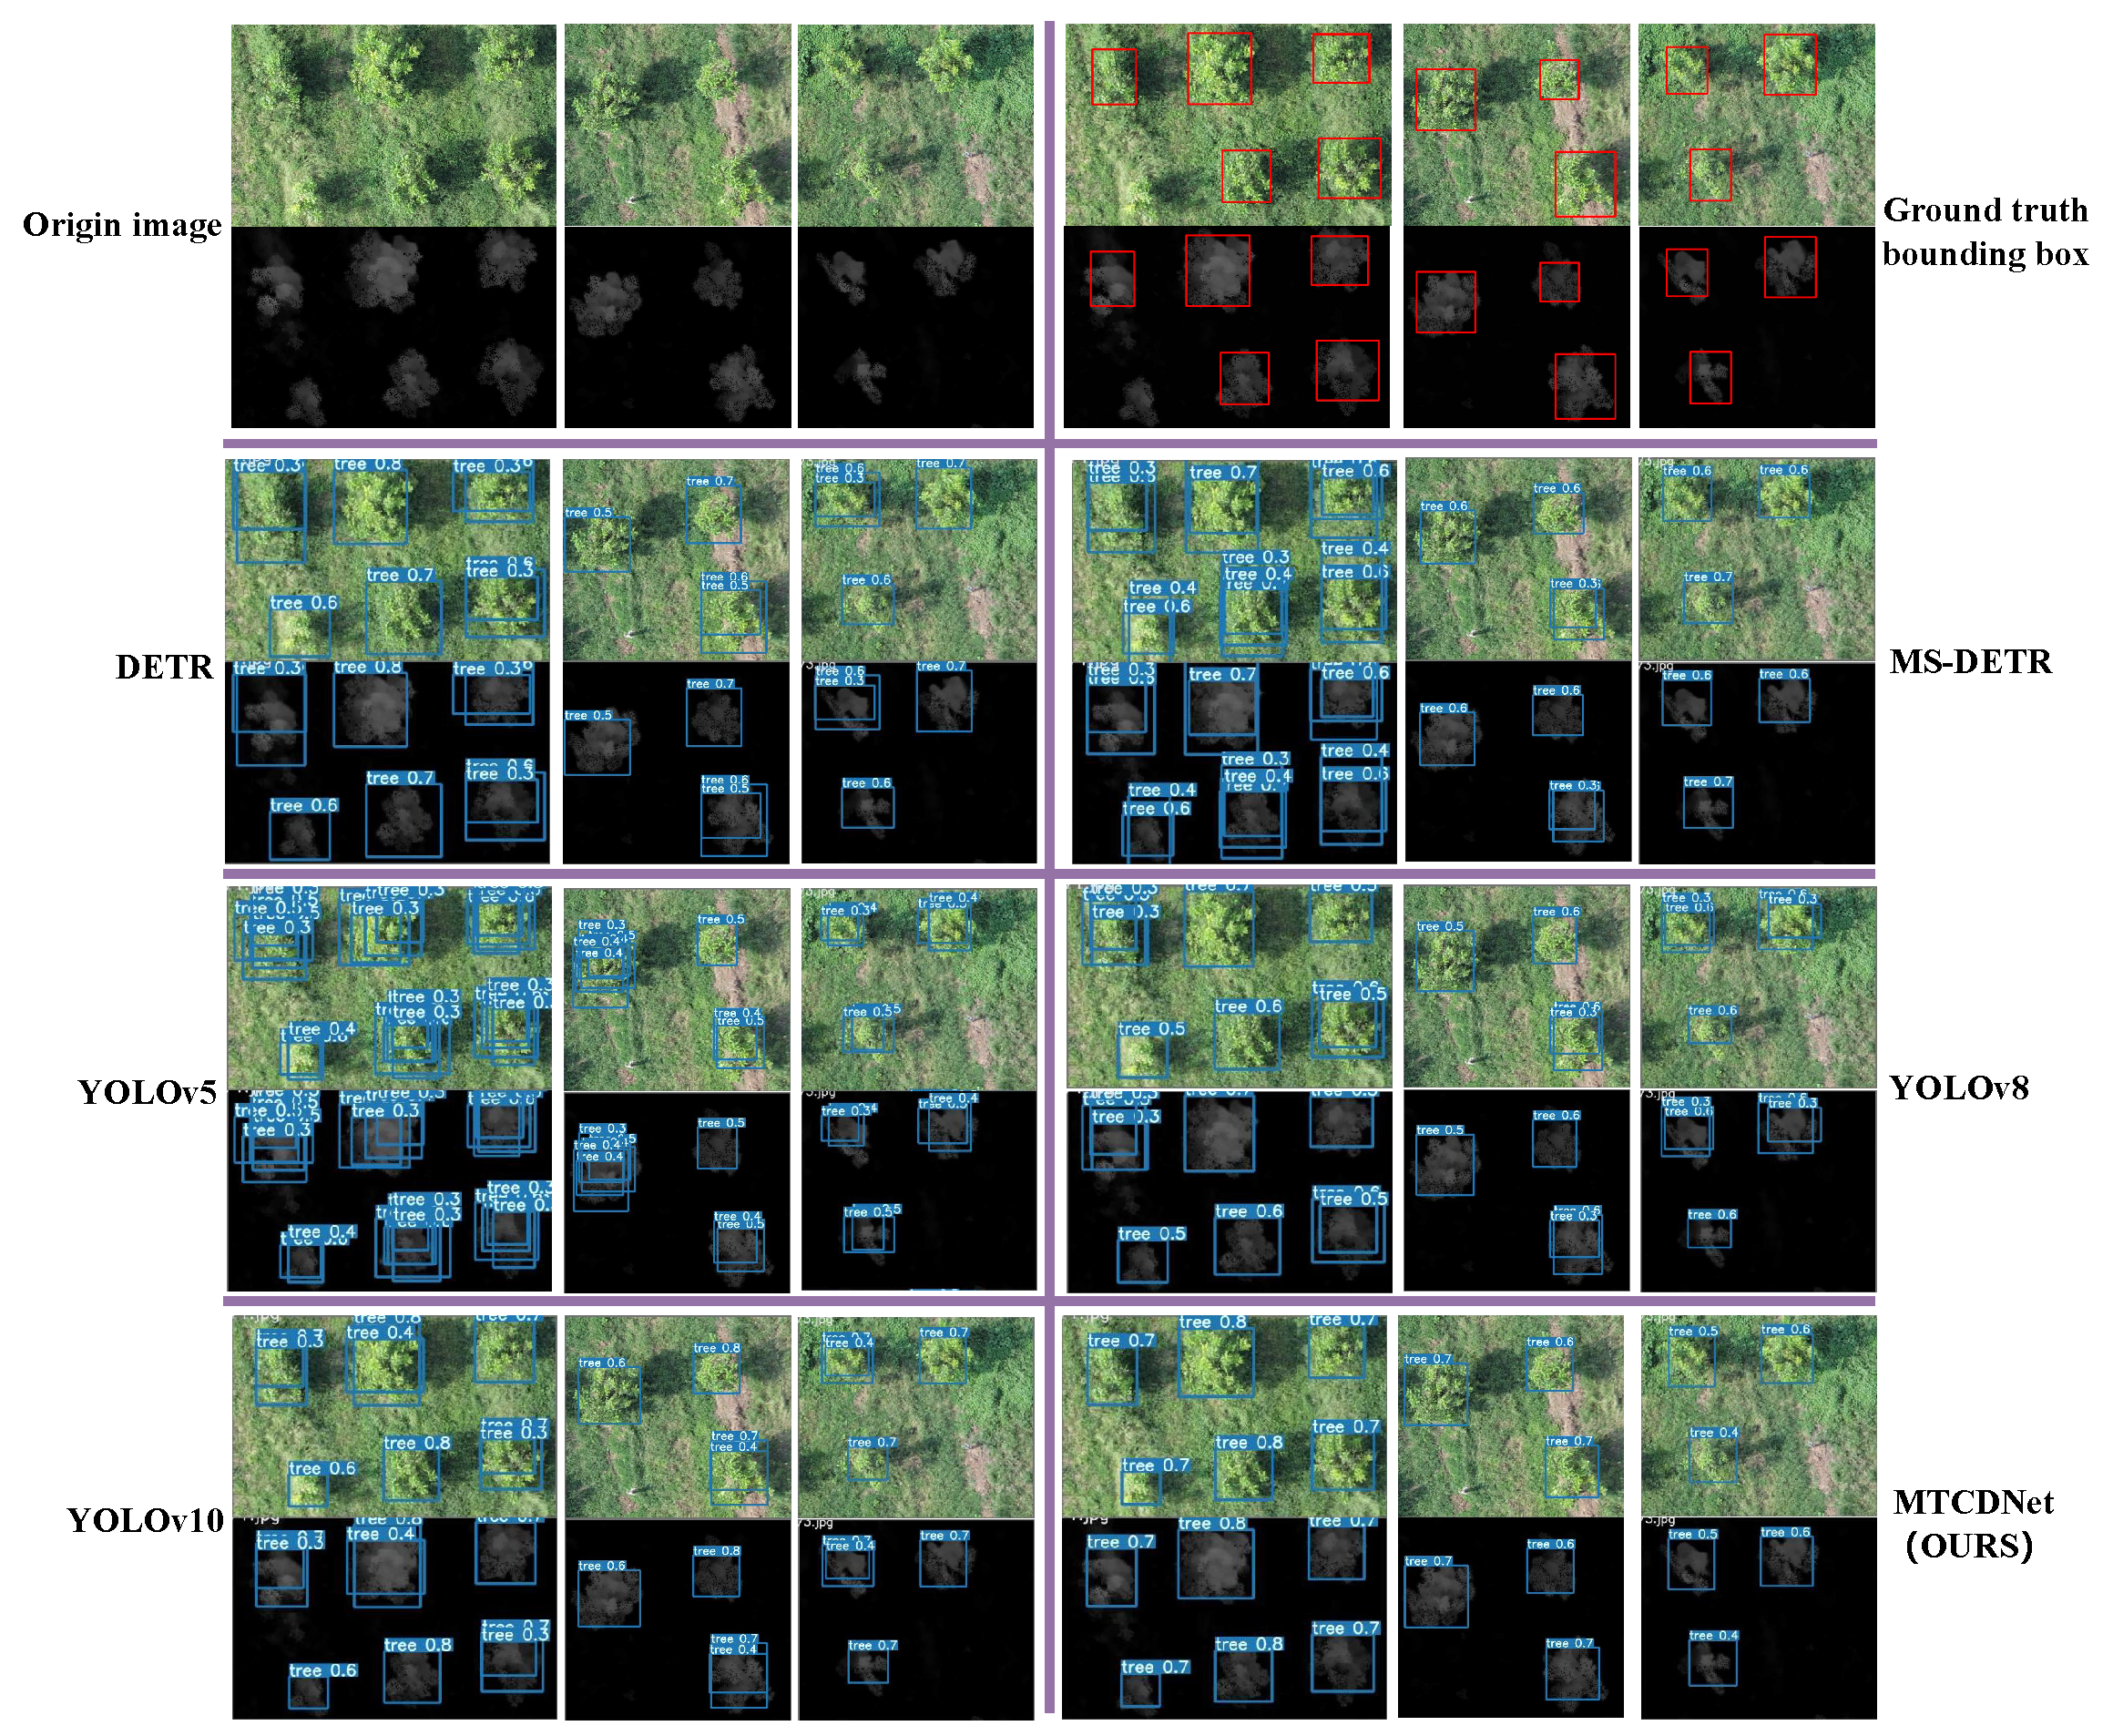
3.1.2. Comparative Experiments

To evaluate the effectiveness of the proposed MTCDNet, we compared it with several state-of-the-art detection methods including DETR [28], MS-DETR [29], YOLOX [30], YOLOV5 [31], YOLOV8 [32], and YOLOV10 [33]. These methods represent different approaches to object detection: DETR employs a transformer-based architecture for end-to-end object detection; MS-DETR extends DETR with multi-scale feature processing; YOLOX is an anchor-free variant of YOLO that improves detection accuracy; and YOLOV5 is a highly efficient single-stage detector widely used in real-time applications. YOLOv8 and YOLOv10 are new versions of the YOLO series, which further optimize accuracy, speed, and flexibility compared to previous YOLO models, particularly demonstrating stronger robustness in object detection tasks in high-density and complex scenes. YOLOv8 introduces more technical improvements, including a finer feature fusion mechanism and an improved loss function design, aimed at better handling object detection tasks across different scales and complex backgrounds. YOLOv10, building upon YOLOv8, further enhances the model’s real-time performance and computational efficiency, improves the network architecture, and optimizes the use of computational resources through more efficient convolutional calculations and model pruning techniques. For a fair comparison, all methods were trained and evaluated under identical conditions using the same datasets, with the only difference being that our MTCDNet leverages both RGB and depth modalities, while other methods use only RGB data. To further explore the different effects of multimodal fusion strategies, we also conducted a comparison experiment with the Early Fusion strategy. In this experimental setup, we fused the RGB and depth modality data at the input layer, i.e., concatenating the two modalities before sending them into the network for feature extraction [34]. We compared this Early Fusion strategy with our proposed MTCDNet to evaluate the impact of both fusion strategies on object detection performance.
Table 1 presents the performance comparison results on the Dataset_A. The experimental results clearly demonstrate that MTCDNet outperforms all unimodal models across all evaluation metrics, highlighting the advantage of the multimodal fusion strategy in object detection. Specifically, MTCDNet achieved 45.38% mAP, 2.35 percentage points higher than the best-performing unimodal model, YOLOV10 (43.03%), indicating that the combination of multimodal data significantly enhances detection accuracy. Under the AP50 metric, MTCDNet achieved 93.12%, clearly outperforming other methods, especially at the more relaxed IoU threshold, where MTCDNet demonstrated excellent detection capabilities, and was better identifying various tree species. Although YOLOV10 and other unimodal models (such as YOLOV5 and YOLOV8) already perform well, MTCDNet still shows a strong advantage, particularly in terms of adaptability and accuracy improvements in complex scenarios. For example, MTCDNet reached 35.74% in the AP75 metric, which is 2.53 percentage points higher than YOLOV10 (33.21%), and the performance improvement at the higher IoU threshold is particularly important as it directly reflects the model’s ability to precisely locate and reduce false positives. Additionally, while the YOLO series models (such as YOLOX and YOLOV8) have adopted more refined feature extraction mechanisms and optimization strategies, MTCDNet, through multimodal data fusion, effectively mitigates issues such as lighting variation and background clutter that may arise in a single modality (such as RGB images), improving robustness and accuracy in complex scenarios. To further evaluate different fusion strategies, we also conducted a comparison experiment with the Early Fusion strategy. In the Early Fusion strategy, RGB images and depth modality data are concatenated at the input layer and fed into the network for feature extraction. Compared to the MM-Transformer-based MTCDNet fusion module, the early fusion method yielded a slightly lower mAP of 44.25%. Nevertheless, the early fusion approach still outperforms all unimodal methods, especially when compared to YOLOV10 (43.03%), where its mAP improved by 1.22 percentage points. In the AP50 and AP75 metrics, the early fusion achieved 92.50% and 33.17%, respectively. However, the Early Fusion strategy performs lower than the proposed MTCDNet. In summary, MTCDNet’s performance not only surpasses that of unimodal models in overall accuracy but also exhibits stable detection capabilities across all evaluation metrics, verifying the potential and advantages of multimodal fusion in object detection. While the early fusion strategy can also effectively improve model performance, compared to the MM-Transformer-based MTCDNet, the latter shows a more significant advantage in detection accuracy and robustness, particularly when handling complex scenes.
To further validate the robustness of our method, we conducted additional experiments on the more challenging Dataset_B. This dataset contains denser forest coverage, more complex terrain backgrounds, and more severe canopy occlusion, imposing higher demands on the model’s detection capabilities. As shown in Table 2, MTCDNet achieved the best results across all evaluation metrics. Specifically, the mAP reached 48.41%, which is 1.53 percentage points higher than the second-best unimodal method, YOLOV10 (46.88%), demonstrating a significant accuracy gain from multimodal information in complex natural scenes. Under the AP50 metric, MTCDNet achieved the highest score of 94.58%, reflecting its strong recognition ability for targets under relaxed matching conditions. More notably, under the stricter AP75 (i.e., higher IoU matching conditions), MTCDNet achieved an excellent score of 40.65%, significantly outperforming YOLOV10’s 38.25%, which fully demonstrates its advantage in precise localization and fine-grained discrimination. Even compared to the Early Fusion strategy, which also uses multimodal data, MTCDNet exhibited stronger detection capabilities. On Dataset_B, MTCDNet achieved mAP, AP50, and AP75 scores of 45.31%, 93.22%, and 31.79%, respectively. This further validates the stronger adaptability and robustness of MTCDNet in tackling real-world challenges such as high-density targets, complex backgrounds, and occlusion interference. It also highlights the significant potential of our proposed multimodal fusion strategy in improving UAV-based forestry image object detection performance.
However, it is worth noting that under the stricter evaluation standard of AP75, all methods exhibited a significant decline in scores compared to AP50. This phenomenon can be attributed to the higher requirements for target localization accuracy and stricter target matching conditions set by AP75. In particular, in dense forest environments, the overlap and occlusion between trees make it more challenging to achieve a higher IoU threshold. The tree distribution in Dataset_B is relatively dense, with occlusion phenomena that make it difficult to clearly distinguish the boundaries between targets, especially under high IoU thresholds, where the model struggles to precisely predict the boundaries of each target. Nevertheless, MTCDNet, with its multimodal fusion strategy, is better able to capture the fine details in complex environments. Especially in cases of significant tree crown overlap or partial occlusion, MTCDNet still maintains a relatively high AP75 score, outperforming other methods. This indicates that our model is capable of providing more accurate target localization under high IoU standards and effectively reducing both false positives and missed detections.
To provide more intuitive insights into model performance, we visualized detection results on both datasets. Figure 6 shows the detection outcomes on the Dataset_A. The results clearly demonstrate MTCDNet’s ability to effectively eliminate false positives while accurately detecting true positives, even in regions with significant occlusion. This highlights the model’s advantage in processing complex scenes with tree occlusions, enabling more precise target identification and improving overall detection performance.
Figure 7 presents visualization results on the more challenging Dataset_B, which features denser tree distribution and more complex backgrounds. In this demanding environment, MTCDNet continues to demonstrate excellent performance, successfully distinguishing and identifying individual trees in dense clusters. Compared to other methods, MTCDNet achieves higher detection precision and lower false detection rates. Particularly in scenarios where trees are closely spaced, our approach accurately identifies individual targets, while baseline methods such as DETR often miss detections or erroneously merge multiple targets into a single detection. These qualitative results further validate the effectiveness and superiority of our multimodal fusion approach in addressing challenging detection scenarios, suggesting broad application potential for similar remote sensing tasks.
To further investigate the performance of MTCDNet under complex scenarios, we selected and visualized representative failure cases from two datasets, as illustrated in Figure 8. In the left image, the model fails to detect two small-sized tree crowns located in a densely populated region. This may be attributed to the close spatial proximity between targets and the presence of blurred texture and edge information, which makes it challenging for the model to accurately delineate individual boundaries. The right image highlights the model’s limitations in handling tree crowns with large size, where it fails to detect a sizable tree crown. This suggests that the model still exhibits weaknesses when faced with targets of significant scale variation or irregular contours. These failure cases reveal that, despite the overall strong performance of MTCDNet, it still encounters challenges in scenarios involving densely packed small objects and singular large targets. This underscores potential areas for improvement in terms of multi-scale ability. Future work may explore more effective multi-scale feature fusion strategies to further improve the model’s generalization ability and robustness in complex environments.
To validate the adaptability of our method across different datasets, we conducted two sets of cross-dataset validation experiments: Dataset_A-to-B (training on the Dataset_A and testing on the Dataset_B) and Dataset_B-to-A (training on the Dataset_B and testing on the Dataset_A). The experimental results are shown in Table 3. As observed, in the Dataset_A-to-B experiment, MTCDNet achieved a mAP of 43.5% on Dataset_B. Although the performance slightly decreased, it still demonstrated strong detection capabilities. In the Dataset_B-to-A experiment, MTCDNet achieved a mAP of 44.17% on Dataset_A, confirming the model’s excellent transferability and adaptability. Despite the differences in tree distribution, background complexity, and environmental conditions between the two datasets, MTCDNet was able to maintain relatively stable detection accuracy.
In the Dataset_A-to-B experiment, MTCDNet reached an AP50 of 92.65%, indicating its ability to maintain high accuracy under the relatively relaxed IoU threshold. However, the AP75 value was 28.87%, suggesting a performance drop under stricter IoU thresholds, though the model still demonstrated strong adaptability. In the Dataset_B-to-A experiment, MTCDNet achieved an AP50 of 92.13%, slightly lower than the Dataset_A-to-B experiment, but still maintaining high accuracy. On the AP75 metric, MTCDNet reached 34.22%, slightly improving over the performance in the Dataset_A-to-B experiment, thus demonstrating the model’s excellent transfer capability across different datasets. These results indicate that despite differences in tree distribution, background complexity, and environmental conditions between the two datasets, MTCDNet can maintain stable detection accuracy, showcasing its cross-dataset transferability and robustness. Particularly in the Dataset_A-to-B experiment, despite the higher tree density and more complex background in Dataset_B, MTCDNet was still able to maintain a high mAP, demonstrating its adaptability in more challenging environments. In the Dataset_B-to-A experiment, MTCDNet achieved favorable results, further validating that our proposed multimodal method has strong applicability and transferability. Overall, these experimental results suggest that our multimodal approach is highly robust and can play a crucial role in various remote sensing tasks.

3.2. Ablation Studies

To evaluate the effectiveness of each component in MTCDNet, we conducted a series of ablation experiments, focusing on the MM-Transformer and learnable position encoding components. As shown in Table 4, we used a baseline model configuration that excludes these two modules, where feature fusion is achieved through simple addition of the features from RGB and depth images [35]. Although this method provides an initial integration of multimodal information, the fusion effect is limited, resulting in a model mAP of 41.27%, significantly lower than the configuration with MM-Transformer and learnable position encoding. Meanwhile, this approach has the lowest parameter count and computational cost (such as GFLOPs), offering the fastest inference speed, making it suitable for scenarios where real-time performance is crucial, but precision can be tolerated at a higher margin. When the MM-Transformer was introduced without the learnable position encoding, the mAP increased to 43.93%, a 2.66 percentage point improvement over the baseline. While this setting led to a noticeable performance improvement, it also increased the model complexity, with the parameter count and computational cost rising by approximately 1.4 M and 3.23 G, respectively. This indicates that the Transformer-based fusion mechanism requires more computational resources to improve performance. When both the MM-Transformer and learnable position encoding were used together, the model achieved the best performance with a mAP of 45.38%, further increasing by 1.45 percentage points compared to the MM-Transformer-only configuration. This result fully validates the importance of the learnable position encoding in enhancing multimodal feature space relationship modeling. The combination also resulted in the highest parameter count and computational cost, reflecting a stronger feature modeling capability in exchange for better detection accuracy. Despite the increased computational cost, considering the accuracy requirements in UAV-based crown detection tasks, we believe that this performance–efficiency trade-off is reasonable and acceptable [36].
To further validate the effectiveness of multimodal fusion, we conducted experiments using only RGB and only depth map data, and compared the results with those of the MTCDNet model using fused RGB and depth map data. The experimental results are shown in Table 5. It is evident that when RGB and depth map data are fused, MTCDNet exhibits a significant performance improvement. Specifically, when only RGB data is used, the model’s mAP is 42.96%; when only depth data is used, the model’s mAP is 37.2%. In contrast, after fusing RGB and depth map data, the mAP increases significantly to 45.38%. Although depth maps provide three-dimensional spatial information, in densely distributed or heavily occluded tree environments, the depth data often lacks the fine details present in the RGB images, such as color and texture, making it difficult for the model to distinguish the crowns [37]. Therefore, fusing RGB and depth map data allows for better integration of both advantages, significantly enhancing detection performance. This comparative experiment further demonstrates the importance of multimodal data in improving detection accuracy, particularly in complex forest environments, where both visual and depth information are crucial for distinguishing tree crowns.
We further investigated the impact of the number of attention heads in the MM-Transformer on model performance and computational cost, as shown in Table 6. With an increase in the number of attention heads, the model performance changed significantly. When the number of attention heads increased from one to four, the mAP improved by 1.47 percentage points (from 43.46% to 44.93%), indicating that the multi-head mechanism is capable of capturing richer feature representations. Notably, under the AP50 metric, four attention heads (94.76%) outperformed eight heads (93.12%), while under the stricter AP75 metric, eight attention heads (35.74%) significantly outperformed other configurations. This phenomenon suggests that more attention heads help improve the model’s detection ability when handling difficult samples, especially those that require higher IoU thresholds for proper matching. More attention heads allow the model to focus on different spatial regions and feature channels, enhancing the model’s ability to perceive subtle feature differences, particularly in areas with dense and overlapping trees, enabling better differentiation of tree boundaries and improving detection accuracy [38]. This phenomenon reveals the trade-off between boundary localization accuracy and target recall ability in the model. Specifically, the AP50 metric measures a lower IoU threshold (0.5), focusing more on target recall ability. Fewer attention heads might make the model more focused on capturing rough features of the targets, leading to a higher recall rate. On the other hand, for the AP75 metric (IoU threshold of 0.75), more attention heads allow the model to capture finer details, especially between densely occluded targets, significantly improving the localization ability through precise boundary modeling. This difference further reflects the need for the model to consciously trade off between “high recall but coarse localization” and “low recall but precise localization”. For example, in UAV-based crown detection, if the task focuses more on comprehensively detecting all trees (such as monitoring forest coverage), fewer attention heads may provide a higher recall rate, making it a more suitable choice. However, when the task demands higher boundary precision (such as for precise counting or fine-grained change detection), more attention heads should be prioritized to improve the accuracy of target localization.
However, increasing the number of attention heads significantly raises the model’s computational overhead (e.g., FLOPs rising from 22.32 G to 45.31 G), especially with the configuration of eight attention heads. This overhead poses a challenge for real-time deployment on resource-constrained platforms like UAVs. Additionally, more attention heads may increase the risk of overfitting, especially when the training dataset is limited. Therefore, in practical applications, while more attention heads can improve the model’s ability to recognize complex targets, they also require more computational resources, which may not be efficiently deployable in resource-limited scenarios. Considering both computational efficiency and accuracy, four attention heads may be a more reasonable choice, as it can achieve nearly optimal detection performance while maintaining a relatively low computational burden, making it suitable for practical deployment. Through the aforementioned ablation experiments, we further validated that the Transformer-based feature fusion method outperforms traditional additive fusion, and also demonstrated the effectiveness of learnable position encoding in enhancing spatial information modeling.

4. Conclusions

In this paper, we proposed MTCDNet, a novel multimodal feature fusion network for tree detection in UAV-captured imagery. Addressing the limitations of traditional single-modality detection methods in complex environments, we introduced an innovative fusion strategy that effectively combines RGB and depth imagery to achieve precise tree localization and identification. The core of our approach is the MM-Transformer module, which adaptively learns correlations between different modality features through a multi-head attention mechanism, significantly enhancing feature expressiveness and discriminability. Our experimental results on two distinct datasets, Wenxian and Guizhou, demonstrate that MTCDNet consistently outperforms state-of-the-art single-modality detection methods. On the Dataset_A, MTCDNet achieves 45.38% mAP, surpassing the best-performing single-modality model by 5.13 percentage points. Similarly, on the more challenging Dataset_B with denser forest scenes, MTCDNet maintains its superior performance with 48.41% mAP. Through comprehensive ablation studies, we verified the contribution of each key component in MTCDNet. The MM-Transformer module brings a substantial performance gain of 2.66 percentage points over simple fusion methods, while the incorporation of learnable positional encoding further improves performance by 1.45 percentage points. The investigation into attention head configurations revealed that while eight heads optimize overall mAP and high-precision detection (AP75), four heads provide a better balance between performance and computational efficiency.
The MTCDNet architecture demonstrates exceptional robustness across varying forest environments, effectively addressing challenges such as occlusion, lighting variations, and background interference. This makes it particularly valuable for applications in forest health monitoring, fire prevention, biodiversity assessment, and other environmental protection tasks. The integration of depth information with RGB imagery provides complementary insights that significantly enhance detection reliability in complex real-world scenarios. Future research directions include extending the model to multi-class detection for tree species identification, optimizing the architecture for deployment on resource-constrained platforms, and exploring the integration of additional modalities such as multispectral imagery. The promising results of this study highlight the potential of multimodal feature fusion approaches in advancing remote sensing-based forest monitoring technologies.

Author Contributions

Software, H.Z.; Writing—original draft, H.Z.; Visualization, C.Y.; Writing—review and editing, C.Y. and X.F.; Supervision, X.F.; Project administration, X.F. All authors have read and agreed to the published version of the manuscript.

Funding

This research was funded by Key Laboratory of Natural Resources Monitoring and Super vision in Southern Hilly Region, Ministry of Natural Resources, Changsha, China (grant number: NRMSSHR2023Y07).

Data Availability Statement

The data used in this study are available from the corresponding author upon reasonable request.

Conflicts of Interest

The authors declare no conflicts of interest.

References

  1. Fassnacht, F.E.; Latifi, H.; Stereńczak, K.; Modzelewska, A.; Lefsky, M.; Waser, L.T.; Straub, C.; Ghosh, A. Review of studies on tree species classification from remotely sensed data. Remote Sens. Environ. 2016, 186, 64–87. [Google Scholar] [CrossRef]
  2. Zhen, Z.; Quackenbush, L.J.; Zhang, L. Trends in automatic individual tree crown detection and delineation—Evolution of LiDAR data. Remote Sens. 2016, 8, 333. [Google Scholar] [CrossRef]
  3. Hirschmugl, M.; Ofner, M.; Raggam, J.; Schardt, M. Single tree detection in very high resolution remote sensing data. Remote Sens. Environ. 2007, 110, 533–544. [Google Scholar] [CrossRef]
  4. White, J.C.; Coops, N.C.; Wulder, M.A.; Vastaranta, M.; Hilker, T.; Tompalski, P. Remote sensing technologies for enhancing forest inventories: A review. Can. J. Remote Sens. 2016, 42, 619–641. [Google Scholar] [CrossRef]
  5. Torresan, C.; Berton, A.; Carotenuto, F.; Di Gennaro, S.F.; Gioli, B.; Matese, A.; Miglietta, F.; Vagnoli, C.; Zaldei, A.; Wallace, L. Forestry applications of UAVs in Europe: A review. Int. J. Remote Sens. 2017, 38, 2427–2447. [Google Scholar] [CrossRef]
  6. Gan, Y.; Wang, Q.; Iio, A. Tree crown detection and delineation in a temperate deciduous forest from UAV RGB imagery using deep learning approaches: Effects of spatial resolution and species characteristics. Remote Sens. 2023, 15, 778. [Google Scholar] [CrossRef]
  7. Panagiotidis, D.; Abdollahnejad, A.; Surovỳ, P.; Chiteculo, V. Determining tree height and crown diameter from high-resolution UAV imagery. Int. J. Remote Sens. 2017, 38, 2392–2410. [Google Scholar] [CrossRef]
  8. Safonova, A.; Hamad, Y.; Dmitriev, E.; Georgiev, G.; Trenkin, V.; Georgieva, M.; Dimitrov, S.; Iliev, M. Individual tree crown delineation for the species classification and assessment of vital status of forest stands from UAV images. Drones 2021, 5, 77. [Google Scholar] [CrossRef]
  9. Osco, L.P.; Junior, J.M.; Ramos, A.P.M.; de Castro Jorge, L.A.; Fatholahi, S.N.; de Andrade Silva, J.; Matsubara, E.T.; Pistori, H.; Gonçalves, W.N.; Li, J. A review on deep learning in UAV remote sensing. Int. J. Appl. Earth Obs. Geoinf. 2021, 102, 102456. [Google Scholar] [CrossRef]
  10. Guimarães, N.; Pádua, L.; Marques, P.; Silva, N.; Peres, E.; Sousa, J.J. Forestry remote sensing from unmanned aerial vehicles: A review focusing on the data, processing and potentialities. Remote Sens. 2020, 12, 1046. [Google Scholar] [CrossRef]
  11. Dash, J.P.; Watt, M.S.; Pearse, G.D.; Heaphy, M.; Dungey, H.S. Assessing very high resolution UAV imagery for monitoring forest health during a simulated disease outbreak. ISPRS J. Photogramm. Remote Sens. 2017, 131, 1–14. [Google Scholar] [CrossRef]
  12. Qin, H.; Zhou, W.; Yao, Y.; Wang, W. Individual tree segmentation and tree species classification in subtropical broadleaf forests using UAV-based LiDAR, hyperspectral, and ultrahigh-resolution RGB data. Remote Sens. Environ. 2022, 280, 113143. [Google Scholar] [CrossRef]
  13. Diez, Y.; Kentsch, S.; Fukuda, M.; Caceres, M.L.L.; Moritake, K.; Cabezas, M. Deep learning in forestry using uav-acquired rgb data: A practical review. Remote Sens. 2021, 13, 2837. [Google Scholar] [CrossRef]
  14. Gu, J.; Grybas, H.; Congalton, R.G. Individual tree crown delineation from UAS imagery based on region growing and growth space considerations. Remote Sens. 2020, 12, 2363. [Google Scholar] [CrossRef]
  15. Huang, H.; Li, X.; Chen, C. Individual tree crown detection and delineation from very-high-resolution UAV images based on bias field and marker-controlled watershed segmentation algorithms. IEEE J. Sel. Top. Appl. Earth Obs. Remote Sens. 2018, 11, 2253–2262. [Google Scholar] [CrossRef]
  16. Zhao, H.; Morgenroth, J.; Pearse, G.; Schindler, J. A systematic review of individual tree crown detection and delineation with convolutional neural networks (CNN). Curr. For. Rep. 2023, 9, 149–170. [Google Scholar] [CrossRef]
  17. Weinstein, B.G.; Marconi, S.; Aubry-Kientz, M.; Vincent, G.; Senyondo, H.; White, E.P. DeepForest: A Python package for RGB deep learning tree crown delineation. Methods Ecol. Evol. 2020, 11, 1743–1751. [Google Scholar] [CrossRef]
  18. Wu, W.; Fan, X.; Qu, H.; Yang, X.; Tjahjadi, T. TCDNet: Tree crown detection from UAV optical images using uncertainty-aware one-stage network. IEEE Geosci. Remote Sens. Lett. 2022, 19, 6517405. [Google Scholar] [CrossRef]
  19. Zhang, J.; Lei, F.; Fan, X. Parameter-Efficient Fine-Tuning for Individual Tree Crown Detection and Species Classification Using UAV-Acquired Imagery. Remote Sens. 2025, 17, 1272. [Google Scholar] [CrossRef]
  20. Santos, A.A.d.; Marcato Junior, J.; Araújo, M.S.; Di Martini, D.R.; Tetila, E.C.; Siqueira, H.L.; Aoki, C.; Eltner, A.; Matsubara, E.T.; Pistori, H.; et al. Assessment of CNN-based methods for individual tree detection on images captured by RGB cameras attached to UAVs. Sensors 2019, 19, 3595. [Google Scholar] [CrossRef]
  21. Jintasuttisak, T.; Edirisinghe, E.; Elbattay, A. Deep neural network based date palm tree detection in drone imagery. Comput. Electron. Agric. 2022, 192, 106560. [Google Scholar] [CrossRef]
  22. Weinstein, B.G.; Marconi, S.; Bohlman, S.; Zare, A.; White, E. Individual tree-crown detection in RGB imagery using semi-supervised deep learning neural networks. Remote Sens. 2019, 11, 1309. [Google Scholar] [CrossRef]
  23. He, K.; Gkioxari, G.; Dollár, P.; Girshick, R. Mask r-cnn. In Proceedings of the IEEE International Conference on Computer Vision, Venice, Italy, 22–29 October 2017; pp. 2961–2969. [Google Scholar]
  24. Barnes, C.; Balzter, H.; Barrett, K.; Eddy, J.; Milner, S.; Suárez, J.C. Individual tree crown delineation from airborne laser scanning for diseased larch forest stands. Remote Sens. 2017, 9, 231. [Google Scholar] [CrossRef]
  25. Li, Y.; Xie, D.; Wang, Y.; Jin, S.; Zhou, K.; Zhang, Z.; Li, W.; Zhang, W.; Mu, X.; Yan, G. Individual tree segmentation of airborne and UAV LiDAR point clouds based on the watershed and optimized connection center evolution clustering. Ecol. Evol. 2023, 13, e10297. [Google Scholar] [CrossRef]
  26. Luo, T.; Rao, S.; Ma, W.; Song, Q.; Cao, Z.; Zhang, H.; Xie, J.; Wen, X.; Gao, W.; Chen, Q.; et al. YOLOTree-Individual Tree Spatial Positioning and Crown Volume Calculation Using UAV-RGB Imagery and LiDAR Data. Forests 2024, 15, 1375. [Google Scholar] [CrossRef]
  27. Wang, C.Y.; Bochkovskiy, A.; Liao, H.Y.M. Scaled-yolov4: Scaling cross stage partial network. In Proceedings of the IEEE/Cvf Conference on Computer Vision and Pattern Recognition, Nashville, TN, USA, 20–25 June 2021; pp. 13029–13038. [Google Scholar]
  28. Carion, N.; Massa, F.; Synnaeve, G.; Usunier, N.; Kirillov, A.; Zagoruyko, S. End-to-end object detection with transformers. In Proceedings of the European Conference on Computer Vision, Glasgow, UK, 23–28 August 2020; Springer: Berlin/Heidelberg, Germany, 2020; pp. 213–229. [Google Scholar]
  29. Zhao, C.; Sun, Y.; Wang, W.; Chen, Q.; Ding, E.; Yang, Y.; Wang, J. Ms-detr: Efficient detr training with mixed supervision. In Proceedings of the IEEE/Cvf Conference on Computer Vision and Pattern Recognition, Seattle, WA, USA, 16–22 June 2024; pp. 17027–17036. [Google Scholar]
  30. Ge, Z.; Liu, S.; Wang, F.; Li, Z.; Sun, J. Yolox: Exceeding yolo series in 2021. arXiv 2021, arXiv:2107.08430. [Google Scholar]
  31. Jocher, G.; Stoken, A.; Borovec, J.; Changyu, L.; Hogan, A.; Diaconu, L.; Ingham, F.; Poznanski, J.; Fang, J.; Yu, L.; et al. ultralytics/yolov5, Version v3.1. Bug Fixes and Performance Improvements. Zenodo: Genève, Switzerland, 2020.
  32. Jocher, G.; Qiu, J.; Chaurasia, A. Ultralytics YOLO, Version 8.0.0; Zenodo: Genève, Switzerland, 2023.
  33. Wang, A.; Chen, H.; Liu, L.; Chen, K.; Lin, Z.; Han, J.; Ding, G. Yolov10: Real-time end-to-end object detection. Adv. Neural Inf. Process. Syst. 2024, 37, 107984–108011. [Google Scholar]
  34. Tziafas, G.; Kasaei, H. Early or late fusion matters: Efficient RGB-D fusion in vision transformers for 3D object recognition. In Proceedings of the 2023 IEEE/RSJ International Conference on Intelligent Robots and Systems (IROS), Detroit, MI, USA, 23–27 October 2023; IEEE: Piscataway, NJ, USA, 2023; pp. 9558–9565. [Google Scholar]
  35. Eitel, A.; Springenberg, J.T.; Spinello, L.; Riedmiller, M.; Burgard, W. Multimodal deep learning for robust RGB-D object recognition. In Proceedings of the 2015 IEEE/RSJ International Conference on Intelligent Robots and Systems (IROS), Hamburg, Germany, 28 September–2 October 2015; IEEE: Piscataway, NJ, USA, 2015; pp. 681–687. [Google Scholar]
  36. Lv, L.; Li, X.; Mao, F.; Zhou, L.; Xuan, J.; Zhao, Y.; Yu, J.; Song, M.; Huang, L.; Du, H. A deep learning network for individual tree segmentation in UAV images with a coupled CSPNet and attention mechanism. Remote Sens. 2023, 15, 4420. [Google Scholar] [CrossRef]
  37. Zheng, J.; Yuan, S.; Li, W.; Fu, H.; Yu, L.; Huang, J. A Review of Individual Tree Crown Detection and Delineation From Optical Remote Sensing Images: Current progress and future. IEEE Geosci. Remote Sens. Mag. 2025, 13, 209–236. [Google Scholar] [CrossRef]
  38. Vaswani, A.; Shazeer, N.; Parmar, N.; Uszkoreit, J.; Jones, L.; Gomez, A.N.; Kaiser, Ł.; Polosukhin, I. Attention is all you need. Adv. Neural Inf. Process. Syst. 2017, 30. [Google Scholar] [CrossRef]
Figure 1. Map of dataset collection.
Remotesensing 17 01996 g001
Figure 2. Samples from both two used datasets.
Remotesensing 17 01996 g002
Figure 3. Overall structure of the proposed MTCDNet.
Remotesensing 17 01996 g003
Figure 4. Structure of the MM-Transformer module.
Remotesensing 17 01996 g004
Figure 5. Comparison between positional encoding based on sine and cosine functions and learnable positional encoding.
Remotesensing 17 01996 g005
Figure 6. Visualization of detection results using different methods on the Dataset_A.
Remotesensing 17 01996 g006
Figure 7. Visualization of detection results using different methods on the Dataset_B.
Remotesensing 17 01996 g007
Figure 8. Representative failure cases of MTCDNet on two different datasets. The red dashed boxes indicate the missed detections by the model.
Remotesensing 17 01996 g008
Table 1. Comparison of MTCDNet with other state-of-the-art methods on Dataset_A.
MethodmAP (%)AP50 (%)AP75 (%)
DETR38.0388.3529.67
MS-DETR39.4689.9230.92
YOLOX40.2590.3731.29
YOLOV538.9889.2133.87
YOLOV842.8391.2933.21
YOLOV1043.0391.2933.21
Early Fusion44.2592.5033.17
MMFTNet (Ours)45.3893.1235.74
Table 2. Comparison of MTCDNet with other state-of-the-art methods on Dataset_B.
MethodmAP (%)AP50 (%)AP75 (%)
DETR37.6189.5019.12
MS-DETR42.5690.8727.68
YOLOX42.4992.2029.50
YOLOV545.1692.9832.84
YOLOV845.6393.0532.74
YOLOV1046.8893.6938.25
Early Fusion45.3193.2231.79
MTCDNet (Ours)48.4194.5840.65
Table 3. Performance of MTCDNet on cross-dataset validation (Dataset_A-to-B and Dataset_B-to-A).
MethodmAP (%)AP50 (%)AP75 (%)
Dataset_A-to-B43.5092.6528.87
Dataset_B-to-A44.1792.1334.22
Table 4. Performance impact of each component in the proposed MTCDNet.
MM-TransformerLearnable PEmAP (%)AP50 (%)AP75 (%)Params (M)FLOPs (G)
××41.2791.2532.5643.1041.84
×43.9391.8633.2144.5045.07
45.3893.1235.7444.5245.31
Table 5. Performance comparison of MTCDNet with using single modality.
ModalitymAP (%)AP50 (%)AP75 (%)
Only RGB42.9691.3133.20
Only Depth Map37.2086.0126.54
RGB + Depth Map (Ours)45.3893.1235.74
Table 6. Impact of attention head count in MM-Transformer.
Number of HeadsmAP (%)mAP@.50 (%)mAP@.75 (%)Params (M)FLOPs (G)
143.4693.9133.0944.5122.32
243.9691.4831.7444.5129.76
444.9394.7632.9044.5237.14
845.3893.1235.7444.5245.31
Disclaimer/Publisher’s Note: The statements, opinions and data contained in all publications are solely those of the individual author(s) and contributor(s) and not of MDPI and/or the editor(s). MDPI and/or the editor(s) disclaim responsibility for any injury to people or property resulting from any ideas, methods, instructions or products referred to in the content.

