Article

Forest Three-Dimensional Reconstruction Method Based on High-Resolution Remote Sensing Image Using Tree Crown Segmentation and Individual Tree Parameter Extraction Model

1
School of Information Science and Technology, Beijing Forestry University, Beijing 100083, China
2
Hebei Key Laboratory of Smart National Park, Beijing 100083, China
3
Engineering Research Center for Forestry-Oriented Intelligent Information Processing, National Forestry and Grassland Administration, Beijing 100083, China
4
School of Economics, Minzu University of China, Beijing 100081, China
*
Author to whom correspondence should be addressed.
Remote Sens. 2025, 17(13), 2179; https://doi.org/10.3390/rs17132179
Submission received: 17 May 2025 / Revised: 19 June 2025 / Accepted: 23 June 2025 / Published: 25 June 2025
(This article belongs to the Special Issue Digital Modeling for Sustainable Forest Management)

Abstract

Efficient and accurate acquisition of tree distribution and three-dimensional geometric information in forest scenes, along with three-dimensional reconstructions of entire forest environments, hold significant application value in precision forestry and forestry digital twins. However, due to complex vegetation structures, fine geometric details, and severe occlusions in forest environments, existing methods—whether vision-based or LiDAR-based—still face challenges such as high data acquisition costs, feature extraction difficulties, and limited reconstruction accuracy. This study focuses on reconstructing tree distribution and extracting key individual tree parameters, and it proposes a forest 3D reconstruction framework based on high-resolution remote sensing images. Firstly, an optimized Mask R-CNN model was employed to segment individual tree crowns and extract distribution information. Then, a Tree Parameter and Reconstruction Network (TPRN) was constructed to directly estimate key structural parameters (height, DBH etc.) from crown images and generate tree 3D models. Subsequently, the 3D forest scene could be reconstructed by combining the distribution information and tree 3D models. In addition, to address the data scarcity, a hybrid training strategy integrating virtual and real data was proposed for crown segmentation and individual tree parameter estimation. Experimental results demonstrated that the proposed method could reconstruct an entire forest scene within seconds while accurately preserving tree distribution and individual tree attributes. In two real-world plots, the tree counting accuracy exceeded 90%, with an average tree localization error under 0.2 m. The TPRN achieved parameter extraction accuracies of 92.7% and 96% for tree height, and 95.4% and 94.1% for DBH. Furthermore, the generated individual tree models achieved average Peak Signal-to-Noise Ratio (PSNR) and Structural Similarity Index (SSIM) scores of 11.24 and 0.53, respectively, validating the quality of the reconstruction. This approach enables fast and effective large-scale forest scene reconstruction using only a single remote sensing image as input, demonstrating significant potential for applications in both dynamic forest resource monitoring and forestry-oriented digital twin systems.

1. Introduction

Forests, as a crucial component of global ecosystems, contain abundant structural information that is essential for forest resource surveys, carbon stock estimation, and the development of digital forestry [1]. Although technologies such as LiDAR and stereo vision have made significant progress in urban modeling and terrain reconstruction, current methods still face considerable challenges in forest environments due to complex structures, severe occlusions, and intricate geometric details. These challenges include high data acquisition costs, difficult data processing, and limited modeling accuracy. Particularly for large-scale forest areas, existing techniques find it challenging to efficiently and accurately capture the complete 3D morphology of individual trees.
However, investigations show that in typical forestry applications, the most critical information is not necessarily the geometric details of individual trees, but their spatial distribution and key structural parameters such as DBH, tree height, and crown width.
In response to this, this study proposes a reconstruction framework that enables tree distribution extraction, structural parameter estimation, and 3D modeling based solely on a single high-resolution remote sensing image—without the need for multi-view imagery or LiDAR data. The proposed method emphasizes accurate crown segmentation and parameter extraction at the individual tree level, effectively avoiding the high cost and complexity associated with traditional 3D point cloud modeling.
As shown in Figure 1, the proposed method includes three main modules:
  • The crown segmentation and distribution extraction module uses an optimized Mask R-CNN to identify and extract crown regions and tree distribution from high-resolution remote sensing images.
  • The parameter extraction and 3D tree modeling module applies the proposed TPRN network to analyze crown images, obtain structural parameters, and generate individual tree models using a parameter-based approach.
  • The forest scene synthesis module constructs the forest scene based on the extracted distribution and reconstructed tree models.
Our method can generate a 3D forest scene based solely on a single high-resolution remote sensing image. The resulting scene not only faithfully captures the spatial distribution of trees but also provides reliable key structural parameters for each individual tree. The main contributions of this study are as follows:
(1) We propose a forest 3D reconstruction method based on high-resolution remote sensing imagery, that enables automated modeling from 2D images to 3D scenes.
(2) We present an individual tree parameter extraction and 3D reconstruction method using top-view crown images.
(3) To address the lack of per-tree ground-truth data in existing datasets, we propose a synthetic–real data fusion strategy and construct a hybrid dataset for crown segmentation and parameter extraction tasks.

2. Related Work

This study involves forest 3D reconstruction, tree crown segmentation, and individual tree 3D reconstruction. In the following sections, we provide a detailed introduction to each of these three areas of related work.

2.1. Forest 3D Reconstruction

The core methods of forest 3D reconstruction include manual modeling, point cloud-based reconstruction, and stereo vision-based reconstruction. Manual modeling is often used to create virtual forest scenes; however, as the tree distribution and geometry are artificially created, it cannot reflect the reality of actual forest areas [2]. LiDAR technology, including terrestrial laser scanning (TLS) and airborne laser scanning (ALS), have been widely applied in forest 3D reconstruction [3,4]. TLS provides high-precision point cloud data but is limited in scanning angle and speed, whereas ALS can rapidly acquire high-density point clouds over large areas, though with lower lateral resolution. Stereo vision techniques have attracted considerable attention due to their low cost and ease of use [5]. Forest 3D reconstruction can be achieved by utilizing UAV imagery combined with various image processing and deep learning algorithms [6,7,8,9]. However, owing to complex forest environment, unstable lighting, and dense tree distributions with significant occlusion, stereo vision-based methods still face challenges in terms of accuracy and efficiency [10].
In recent years, new techniques have emerged in the fields of 3D reconstruction and virtual scene generation. Notably, Mildenhall et al. [11] introduced Neural Radiance Fields (NeRF), a groundbreaking deep learning-based rendering method. NeRF employs fully connected neural networks to implicitly model and render complex static 3D scenes, enabling not only novel view synthesis but also 3D structure reconstruction. Castorena [12] explored the integration of NeRF with remote sensing data. Despite NeRF’s outstanding performance in high-quality static reconstruction, it suffers from considerable computational cost and low optimization efficiency, particularly in real-time high-resolution rendering and dynamic scene editing. The recent introduction of 3D Gaussian Splatting (3DGS) [13] represents a significant advancement. 3DGS adopts an explicit Gaussian point representation, enabling more efficient capture and rendering of 3D scene information. For instance, Tian et al. [14] captured multi-view images of forest plots using multiple imaging devices and utilized NeRF and 3DGS to achieve dense forest 3D reconstruction. Though effective for photorealistic rendering, these methods are not designed to extract structured information essential for forest resource inventory, such as tree distribution and structural parameters.

2.2. Tree Crown Segmentation Based on Remote Sensing Images

Tree crown segmentation is a critical task in forest remote sensing image analysis, forming the basis for subsequent 3D modeling and parameter extraction. Traditional image processing methods for crown segmentation include thresholding [15], active contour models [16], and clustering in feature space [17]. Although these methods have achieved some success, the complexity of spectral values, diverse target outlines, textures, and color features in remote sensing images make traditional techniques insufficiently robust. As an advanced machine learning approach, deep learning can automatically learn and extract complex features that are beyond the capability of traditional methods, playing a significant role in remote sensing data analysis [18]. Studies have shown that deep learning can effectively overcome the limitations of traditional methods in forest remote sensing imagery. For example, Lou et al. [19] applied various object detection algorithms such as YOLOv3 and SSD to identify and detect pine tree crowns, validating their effectiveness for tree detection tasks. However, these methods are based on semantic segmentation, which lacks instance-level segmentation cannot accurately separate individual crowns.
In this work, we focus on instance segmentation of tree crowns, utilizing independent masks to label individual crowns. Over the past decade, tree crown instance segmentation based on remote sensing imagery has attracted growing attention and achieved substantial progress [20]. Mask R-CNN, as a representative instance segmentation framework, has been widely used in crown segmentation. Proposed by He et al. [21], Mask R-CNN extends Faster R-CNN with an additional segmentation branch to achieve pixel-level instance segmentation, greatly improving detection and segmentation accuracy. For instance, Safonova et al. [22] applied Mask R-CNN to segment olive tree crowns and shadows and estimated individual tree biomass for forestry evaluation. Similarly, Chakraborty and Deka [23] extracted lychee tree crowns using UAV imagery, while Lassalle et al. [24] detected individual mangrove crowns from large-scale, high-resolution satellite images, addressing the locality limitations of UAV imagery. However, existing methods continue to experience boundary prediction errors, leading to reduced segmentation accuracy, especially for densely distributed and irregularly shaped crowns. Small crowns may be overlooked during feature extraction, resulting in missed detections. To overcome these limitations, this study optimizes the Mask R-CNN method to improve detection performance for small-sized tree crowns, minimize boundary prediction errors, and enhance overall segmentation accuracy.

2.3. Individual Tree Reconstruction

Individual tree reconstruction is a key task in forest 3D modeling, focusing on accurately capturing the geometric structure of individual trees. Based on the modeling approach, individual tree reconstruction methods can be categorized into parameter-based and image-based methods. Parameter-based reconstruction methods construct tree models by defining geometric parameters. Recursive algorithms [25] and L-systems [26] are commonly used to simulate tree growth and morphology. To improve modeling efficiency, Weber and Penn [27] proposed a tree creation and rendering model based on geometric observables, enabling rapid generation of diverse tree structures with only a few parameters. Although these methods offer high flexibility in model generation, they often require extensive manual parameter tuning, limiting their practical applicability. Image-based methods utilize multi-view imagery and computer vision techniques (e.g., Structure from Motion, SfM) [28] combined with deep learning for 3D modeling.
A key challenge in single-image-based tree reconstruction is the inference of 3D structures from limited 2D information. Tan et al. [29] inferred 3D tree shapes from 2D branch projections by assuming maximal projection angles or inter-branch distances. Argudo et al. [30] applied dilation algorithms to convert 2D silhouettes into 3D shapes and integrated shadow cues to enhance surface detail. However, these methods heavily rely on manually designed heuristics, limiting their ability to realistically simulate tree 3D structures. Recently, neural network-based tree modeling methods have advanced reconstruction accuracy by directly learning 3D geometries from 2D images [31,32,33].
Although parameter-based tree modeling offers flexibility, it demands per-tree specification of numerous parameters, rendering manual tuning impractical. Most existing methods for reconstructing 3D tree models from image data rely on frontal or multi-view images of individual trees. However, in large-scale forest environments, acquiring frontal views per tree is infeasible, thereby hindering efficient forest-scale reconstruction. To address these gaps, this study integrates deep learning with parameter-based tree modeling to propose a reconstructing method using individual tree crown top-view images.

3. Study Areas and Material

3.1. Study Area and UAV Data Collection

The high-resolution UAV imagery used in this study was collected in July 2021 at Gaofeng Forest Farm, located in Nanning City, Guangxi Province, China (108.338–108.372°E, 22.9727–22.9623°N; see Figure 2). The forest is managed and dominated by species such as Eucalyptus robusta Smith, Castanopsis hystrix Miq., Cunninghamia lanceolata (Lamb.) Hook., Magnolia denudata Desr., etc. The area features varied topography, with elevations ranging from 140 to 260 m and slopes between 0° and 32°. UAV images were acquired using a DJI M210 multi-rotor drone (DJI, Shenzhen, China) at a flight altitude of 100 m and speed of 6 m/s, optimized for clarity and resolution. This study focused on three sample plots, with their IDs, dominant tree species, and image counts summarized in Table 1.

3.2. Dataset Preparation

The original image resolution was 5472 × 3648. To accommodate the training requirements of deep learning models, an image partitioning strategy was employed in this study. Each image was cropped into 12 smaller patches of 1024 × 1024 pixels to reduce edge distortion and overlap, thereby improving training efficiency. A total of 209 image patches were processed and annotated using LabelMe to delineate crown boundaries and assign tree species labels. The dataset was split into 152 images for training, 30 for validation, and 27 for testing.
To achieve spatial alignment between tree crown images and field-measured tree data, this study performed georeferencing using the QGIS platform(version 3.34, QGIS Development Team, Open Source Geospatial Foundation, Beaverton, OR, USA). First, a shapefile containing tree inventory data was imported to extract spatial coordinates and attributes for each tree, including plot ID, species, DBH, height, and crown width. Then, UAV imagery was loaded into QGIS, and the embedded EXIF metadata were used to obtain the geographic coordinates of each photo for initial spatial referencing.
Based on this, a crown segmentation module was applied to extract tree crown regions and their centroid positions from the remote sensing images. By calculating the spatial distance between each crown centroid and the field tree locations and verifying their correspondence using local distribution patterns and attribute information, crown images were matched to individual field-measured trees. As a result, 576 crown instances were identified across three sample plots, of which 279 were successfully matched to field inventory data.

3.3. Generationof Virtual Forest Dataset

However, the number of field-measured samples from Gaofeng Forest Farm was limited, with only 279 individual trees having complete measurement data, which was insufficient to fully satisfy the training requirements. To overcome this limitation, we proposed a hybrid strategy that combined both real and synthetic data. A virtual forest dataset was constructed to augment the scarce field data by simulating remote sensing imagery under diverse stand conditions. This synthetic dataset enabled flexible control over tree geometry and spatial distribution density, thereby providing a more diverse and abundant set of training samples for model development. To overcome the limitations of real-world training data, this study introduced a parametric tree modeling approach, where the geometry of individual trees was defined using structural parameters. A Blender-based plugin was developed to efficiently generate 3D models of representative species, including fir, eucalyptus, and maple, while producing corresponding crown images, as shown in Figure 3.
Based on these parameterized models, we generated a synthetic forest dataset by randomly distributing trees using the Poisson-Disk Sampling algorithm. This method effectively avoids excessive clustering or overly uniform layouts by maintaining a minimum inter-tree distance, thereby closely approximating the natural spatial patterns observed in real forests.
Once the trees were positioned, virtual remote sensing images were rendered using a controllable virtual camera setup. By varying the camera’s position and viewing angle, we generated multi-view crown images with diverse perspectives (Figure 3c), which enhancing the variability and generalization capability of the dataset. The number of trees per image and total number of generated samples were carefully controlled to ensure representativeness and coverage.
The generated synthetic remote sensing images were manually annotated to ensure that the crown shape of each individual tree was clearly delineated. These annotations served as accurate ground truth (GT) data for the crown segmentation task. The labeled virtual images were then used to train and evaluate the segmentation network, leading to highly accurate segmentation results.
To establish a precise correspondence between the segmented crown images and the associated individual tree parameters, an automated matching algorithm was employed. During crown segmentation, the spatial location of each tree was preserved, and since the positions were predefined during the virtual forest generation, the known coordinates can be used to accurately associate each segmented crown with its corresponding structural parameters.

4. Methods

4.1. Tree Crown Segmentation and Tree Distribution Extraction Based on Mask R-CNN

In forest 3D reconstruction based on high-resolution remote sensing images, tree crown segmentation and tree distribution extraction serve as critical preprocessing steps. This study adopted Mask R-CNN for its strong performance in object detection and segmentation but addressed its limitations in dense forest scenes—specifically, weak response to small crowns and incorrect segmentation of adjacent crowns—by optimizing the loss function and modifying its architecture to output spatial distribution data.

4.1.1. Network Architecture and Optimization

The standard architecture of Mask R-CNN comprises a backbone network, a region proposal network (RPN), a RoIAlign layer, bounding box and classification branches, and a mask branch. In this study, we introduced several modifications to optimize its performance for the forest crown segmentation. Since most forest plots are dominated by a single tree species, and the original Mask R-CNN struggles to simultaneously perform accurate crown segmentation, species classification, and tree counting in large-scale, mixed-species forests, we omitted the species classification component. By removing the classification branch, computational complexity and parameter load were significantly reduced.
To capture spatial distribution information for individual trees, we integrated distribution extraction module to the mask branch. Additionally, the mask loss function was refined to improve segmentation accuracy. The revised architecture is illustrated in Figure 4. The network accepts a 1024 × 1024 × 3 remote sensing image as input, which provides rich crown texture and geometric details. The backbone was ResNet-101 [34], integrated with a Feature Pyramid Network (FPN) to generate multi-scale feature representations.
The original mask loss function in Mask R-CNN inadequately addresses boundary predictions accuracy, particularly compromising the segmentation performance for small-scale and densely clustered crown regions. To enhance the model’s capability in detecting such critical areas, we refined the loss function.
In conventional crown segmentation tasks, Mask R-CNN employs a binary cross-entropy -based loss function to produce distinct masks for each category. The network generally generates a k × m2 matrix for each region of interest (RoI), where k denotes the number of categories and m2 represents the fixed mask resolution. However, since this study focused on crown region extraction rather than species classification, we set k = 1 to treat all targets as a single category. This approach streamlined the mask prediction process by removing category-dependent segmentation, thereby lowering computational costs and enhance training stability. The mask loss function was as follows:
L mask = 1 m 2 i , j M ^ i j log M i j + ( 1 M ^ i j ) log ( 1 M i j )
However, the traditional cross-entropy loss function in segmentation tasks fails to account for prediction error at the boundary regions, resulting in reduced boundary segmentation accuracy [35]. In this study, the segmentation task focused on densely distributed and irregularly shaped individual crowns, which frequently led to segmentation errors or omissions. To address this issue, we incorporated a boundary-weighted loss (BWL) into the standard segmentation loss function L mask , thereby constructing a Dual Topology-Weighted Loss (DTWL). This loss function improved segmentation performance, especially in boundary areas, as DTWL used a distance loss L dist to regulate the continuity, positioning, and shape of segmentation boundaries. Additionality, the boundary loss coefficient helped balance the learning strength of the boundary and region, while the mask loss coefficient controlled the weight of global structure constraints. Both served as hyperparameters during training to optimize overall performance. The optimized loss function L dtwl was defined as follows:
L dtwl = α L dist   + β L mask = α M i j B M ^ i j M dist M i j + β 1 m 2 i , j M ^ i j log M i j + ( 1 M ^ i j ) log ( 1 M i j )

4.1.2. Tree Distribution Extraction

After successfully obtaining the crown mask information, this study employed a centroid-based algorithm to extract tree distribution information. By calculating the geometric center of each crown contour, the spatial position of individual trees was determined. To clearly visualize each tree crown, distinct masks were used to display distinct crown contours in Figure 5a, allowing for intuitive identification of each tree’s position within the image.
Subsequently, the image was binarized to generate binary representations of individual crowns, as shown in Figure 5b. This binarization step simplified data complexity and improved the efficiency of downstream analyses. Next, the morphological gradient method was applied to extract the edge contours of the binary crown masks, restore their original colors, and generate the object surface outlines, as shown in Figure 5c. This approach emphasizes boundary information by computing the difference between the dilated and eroded versions of the image, as defined by the following formulas:
G ( I ) = ( I B ) ( I B )
Dilation expands the target boundaries, while erosion contracts them; the difference corresponds to the object’s contour.
In the binarized image, the following zeroth and first-order moments are defined to quantify the total pixel value of each crown region and the sum of their x and y coordinates, respectively, with the formulas as follows:
M 00 = i j F i , j , M 10 = i j i F i , j , M 01 = i j j F i , j
In the equations, F i , j represents the grayscale value of all contour pixels, while M 00 denotes the sum of pixel values in the entire white region. M 10 and M 01 represent the sum of the x and y coordinates of all pixels in the white region, respectively.
Using the first-order moments derived above, these centroid coordinates of the crown region can be computed. In this study, these centroid coordinates served as indicators of tree spatial distribution. The calculation formulas were as follows:
x c = M 10 M 00 , y c = M 01 M 00

4.2. Individual Tree Parameter Extraction and 3D Reconstruction Module Based on Deep Neural Networks

Individual tree crown images were successfully extracted using crown segmentation methods and high-resolution remote sensing data. The objective of this study was to generate a 3D mesh model for each tree based on its crown image. To accomplish this, we designed TPRN to infer key structural parameters of trees parameters from top-view crown images. Subsequently, a parameter-based tree modeling approach was applied to construct the 3D geometric model of each tree using the extracted parameters.
Most existing image-based 3D tree reconstruction methods typically rely on frontal or multi-view images of individual trees. In contrast, our approach reconstructs tree models using top-view crown images from high-resolution remote sensing data. According to forestry research, there is a strong correlation between crown size and shape and key structural parameters of trees. Crown area and crown width are among the most commonly used variables for predicting DBH and tree height. For example, Hemery et al. [36] analyzed 11 common broadleaf tree species in the UK and established linear relationships between DBH and crown spread. Similarly, Calama et al. [37] incorporated regional variation in developing height–DBH models for stone pine. Gonzalez et al. [38] used field measurement data to develop models that predict DBH and usable stem volume from pine crown area. Thus, our methodology for extracting structural parameters from crown images is supported by both theoretical and empirical evidence.

4.2.1. Individual Tree Parameters

Before extracting parameters and performing parametric modeling of trees in forest scenes, it was necessary to define representative tree parameters that support model construction. Inspired by the parametric strategy of Weber et al., this study introduced a feature-parameter-based method for constructing tree models generation.
Tree parameters were classified into two main types: fixed category-level parameters and variable individual-level parameters. Category-level parameters are consistent across all trees of the same species, describing fundamental morphological and structural traits, including tree type, number of crown layers, number of lateral branches, and leaf size (see Table 2 for examples). In contrast, individual-level parameters vary stochastically among trees, affecting overall proportions and height, thereby introducing diversity and realism to the generated models (examples listed in Table 3).
Due to the limited structural detail contained in crown images and the relatively high dimensionality of the defined parameters, relying solely on crown images makes it challenging to accurately extract all necessary parameters. Therefore, species information was treated as a known input and combined with crown images as input to the TPRN model. This approach fixed the category-level parameters during training, reducing the complexity of the model and improving training efficiency. In the experimental dataset, the category-level parameter dictionaries for Chinese fir and eucalyptus were defined based on real-world images, while the individual-level parameters were randomly varied within a biologically reasonable range. This not only provides essential data for constructing 3D tree models but also enhances model diversity while maintaining overall structural consistency.

4.2.2. TPRN Architecture

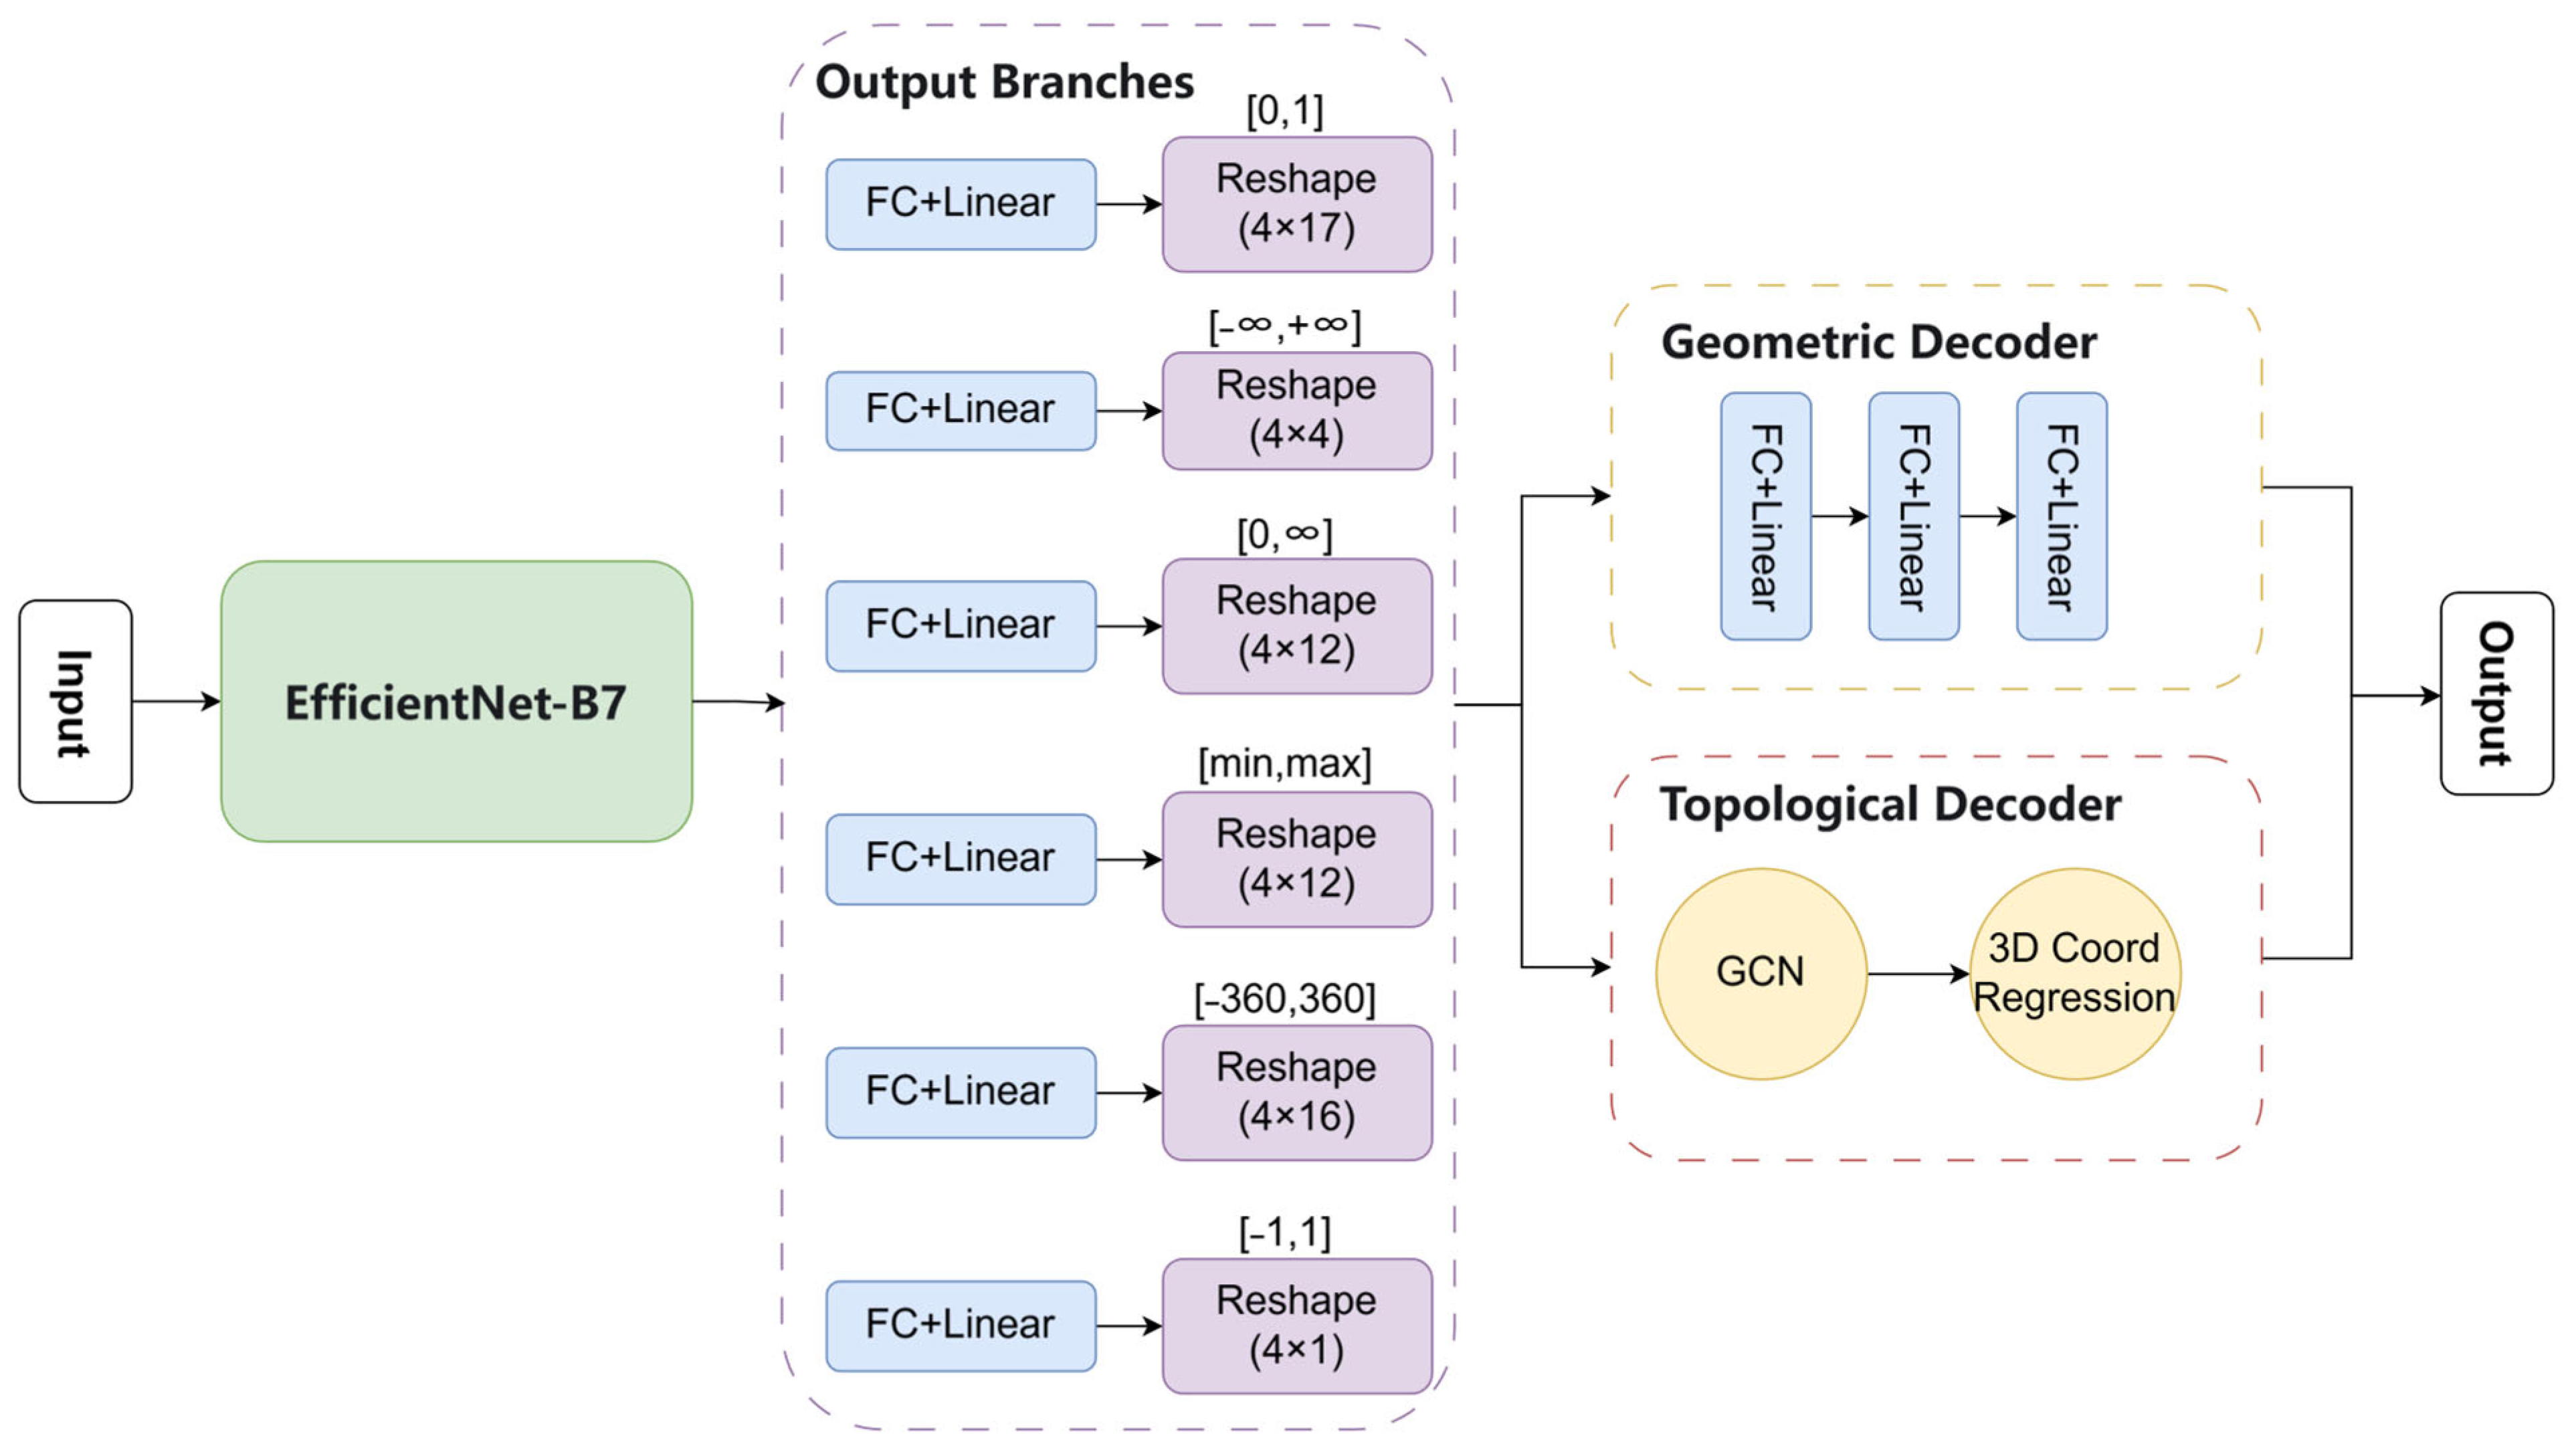
The TPRN was designed to convert input crown images into structural feature parameters of individual trees. Consequently, its network architecture must effectively establish a mapping from images to numerical parameters. The TPRN was constructed based on a deep neural network (DNN) framework, utilizing EfficientNet-B7 [39] as the core feature extractor. By leveraging depth wise separable convolutions and a compound scaling strategy, EfficientNet-B7 significantly improves feature representation while maintaining computational efficiency.
As shown in Figure 6, the network architecture consists of multiple sub-modules, with each branch corresponding to a subset of parameters. This design accommodates varying magnitudes of feature parameters, thereby improving the model’s learning capacity and parameter fitting accuracy. To enable the high-precision reconstruction of individual trees, the network includes a dual-branch decoder after the feature extraction stage: one branch predicts key structural parameters, while the other models the tree’s topological structure.
In convolutional neural network training, lower input image resolutions often lead to improve performance [40]. Research indicates that the accuracy improvements of the Efficient-Net baseline model tend to plateau beyond a certain resolution, suggesting that further increasing image resolution provides marginal accuracy gains while substantially raising computational cost. The input to the TPRN network consists of crown images extracted from high-resolution remote sensing imagery after segmentation, typically with a resolution not exceeding 512 × 512 pixels, aligning well with the network’s processing capabilities.
Given the strong correlation between crown area and DBH, the calculated crown area was incorporated as an additional input feature during training to enhance the model’s predictive capability. To precisely compute the actual crown area from the image, the following formula was used to determine the ratio between the number of pixels within the crown region and those within the bounding rectangle:
S t = S r × P t P r
where St represents the actual area of the tree crown, and Sr represents the actual area of the bounding rectangle. Pt and Pr denote the number of pixels in the tree crown region and the rectangular region, respectively.
In this study, the TPRN model employ supervised learning, where each input image is paired with a corresponding set of tree feature parameters. These parameters are output in matrix form, referred to as the target matrix, which includes all category-level and individual-level feature parameters. Each row of the target matrix represents a unique feature parameter, and each column indicates the value of that parameter. The matrix has dimensions of n × m, where n is the number of parameters, and each parameter has a dimensionality of either 4 or 1. Parameters with a dimensionality of 1 are replicated across all columns.
Initially, a single-output branch was employed to directly predict the entire target matrix. However, experimental results demonstrated severe underfitting with this approach, as the model failed to effectively capture data patterns, leading to reduced parameter extraction accuracy. This limitation stemmed from the significant magnitude variations among different parameters in the target matrix. Outputting the entire matrix at once made it difficult for the network to accommodate these disparities, thereby restricting its ability to extract meaningful features.
To resolve this issue, the output structure of TPRN was refined by partitioning the original target matrix into six submatrices based on the order of magnitude of the parameter values. Each submatrix is processed by an independent output branch. The dimensionality of each submatrix is n1 × m, where n1 denotes the number of parameters within a specific value range. This partitioning strategy is guided by the heterogeneity of the tree feature parameter dictionary—different parameters exhibit significantly different data distributions. By adjusting the network to separately model these magnitudes, the representation capacity for parameters of various scales was improved.
The initial part of the network consists of a base convolutional layer to extract critical features. Subsequently, six independent output branches were deployed, each responsible for predicting parameters within a specific scale range. Each branch contains a fully connected layer with a linear activation function and a reshape layer to align the output with the target matrix dimensions.
Finally, a dual-branch decoder was introduced after the matrix outputs to extract both key structural parameters and topological features of trees. The Geometric Decoder specializes in structural parameter prediction and consists of three fully connected layers that output tree height and DBH. The Topological Decoder, on the other hand, models tree topology using a graph convolutional network (GCN) augmented with a 3D coordinate regression head to predict the spatial coordinates of branching points and their respective radii.
For feature allocation, the encoded features were uniformly distributed between the two decoder branches to ensure that the model captures both global parameter information and local structural features. The loss functions for the corresponding branches were defined as follows:
L geo = H pred H gt 2 + D pred D gt 2
L topo = 1 N i = 1 N B i pred B i gt 2 + R i pred R i gt 2
where H pred and H gt represent the predicted and ground-truth tree height, respectively; D pred and D gt represent the predicted and ground-truth DBH; B i pred and B i gt denote the predicted and ground-truth coordinates of the i-th branching point; and R i pred and R i gt represent the predicted and ground-truth radius of the i-th branch.

4.2.3. Parameter-Based 3D Reconstruction of Individual Trees

After extracting parameters using TPRN, this study proposed a feature-parameter-based tree modeling method. This method summarizes the geometric shapes and topological structures of various tree species and expresses them using a unified set of feature parameters. In combination with the growth patterns of different tree species, a general growth rule was designed to reconstruct the tree’s skeletal structure and branching architecture of the tree based on the extracted parameters. Once all branches were modeled, the total number and distribution of leaves were estimated using the Pipe Model Theory [41]. Finally, texture details were added to improve the visual fidelity of the reconstructed tree model.
The growth direction and length of secondary branches were determined by multiple factors. According to the plant growth equation [42], the diameter of a child branch is proportional to that of its parent branch, and a larger diameter corresponds to a longer branch length, consistent with the physiological growth principles of trees. The specific calculation formula was as follows:
l e n g t h c h i l d = l e n g t h c h i l d , m a x ( l e n g t h p a r e n t 0.6 × o f f s e t c h i l d )
where l e n g t h p a r e n t is the length of the parent branch, l e n g t h c h i l d is the length of the child branch, and o f f s e t child represents the distance of the child branch from the base of the parent branch.
After processing the crown image through TPRN, six submatrices containing the predicted feature parameter values were generated. To utilize these predictions for tree model generation, it was first necessary to denormalize the submatrices. Specifically, each submatrix was multiplied by its corresponding normalization matrix stored during the training phase, thereby restoring the original data scale. This operation effectively transformed the predicted parameter matrix into a valid input for the tree modeling method and enables subsequent 3D reconstruction.
In terms of parameter format conversion, the six submatrices must be rearranged to match the structure of the Blender parameter dictionary. Each column of a submatrix corresponds to a specific key in the dictionary, representing an individual tree feature parameter. When a parameter is expected to be a single scalar rather than a four-element vector, only the first element of the vector is extracted as the final value to ensure data consistency and usability. After conversion, the parameter dictionary can be correctly interpreted and used to drive the generation of the 3D tree model.
According to the Pipe Model Theory, there exists a linear positive correlation between leaf biomass and the cross-sectional area of the stem at the base of the crown for a given tree species. Once all branches have been modeled, the tree model construction method calculates the total number of leaves needed based on this theory. The leaves are then generated and distributed along the branches following biologically realistic patterns.
Additionally, for different tree species, the model loads the corresponding trunk and leaf textures and applies them to the model. This ensures that both the visual appearance and structural characteristics of the reconstructed tree realistically reflect natural growth patterns.
For a given tree species, the category-level feature parameters remain consistent across all individual trees. These parameters describe the species’ typical structural characteristics. In contrast, the individual-level feature parameters are assigned randomly within predefined ranges, allowing for variation in geometric proportions, tree height, and branching structure. The individual parameters were modulated through random variation to generate representative 3D tree models. This species-driven modeling strategy not only accurately reflects key morphological traits of typical species but also demonstrates strong generalizability to a wide range of forest types and complex tree crown structures.

4.3. Forest 3D Scene Synthesis

In the 3D reconstruction of forest scenes, the scene synthesis module utilizes previously extracted tree distribution data and parameterized individual tree models to generate a complete forest environment. First, it reconstructs the overall tree distribution by integrating the spatial information extracted from cropped sub-images. Then, based on the synthesized index map, the corresponding individual tree models are retrieved and placed according to the distribution information.
Furthermore, considering that the cropping process may result in fragmented tree crowns, this study proposed an overlapping cropping strategy to minimize information loss and improve stitching accuracy. A deduplication mechanism was also introduced to address redundant placements caused by overlapping crops.
The deduplication mechanism consisted of the following two steps:
  • Distance-based deduplication strategy: Since duplicate positions of the same tree typically occur in adjacent sub-images, their spatial distance is relatively small. To identify such duplicates, a predefined distance threshold was applied. When the distance between two points fell below this threshold, they were considered to represent the same tree and are merged accordingly.
  • Tree crown area-based selection mechanism: During the merging process, more complete tree crowns generally provide more accurate geometric parameters. Therefore, point locations and feature parameters extracted from crowns with larger areas were given priority and retained.

4.4. Accuracy Verification

To quantify the accuracy of individual tree stand measurement in the proposed crown segmentation method, this study adopted Precision, Recall, and F1-Score as evaluation metrics.
Precision = TP T P + F P
R e c a l l = T P T P + F N
F 1 = 2 × p × r p + r
Here, true positives ( T P ) represent the number of actual trees correctly detected, false positives ( F P ) refer to the number of incorrectly detected trees (i.e., non-existent trees), and false negatives ( F N ) indicate the number of actual trees that were not detected (i.e., missed trees). Here, T P + F P represents the total number of trees detected by the model, while the actual total number of trees is denoted as T P + F N .
To comprehensively evaluate the accuracy of individual tree parameter extraction, this study used the field-measured DBH and tree height as reference standards to assess the model’s performance in predicting structural parameters of trees.
Three evaluation metrics were employed to assess the fitting quality and prediction accuracy of the TPRN in extracting individual tree parameters: Mean Absolute Error (MAE), Coefficient of Determination (R2), and Root Mean Squared Error (RMSE). The calculation formulas are as follows:
M A E = 1 n × i = 1 n | t i p i |
R 2 = 1 i = 1 n ( t i p i ) 2 i = 1 n ( t i t ¯ ) 2
R M S E = i = 1 n ( t i p i ) 2 n
To evaluate the similarity between the tree models and the input images from the same viewpoint, and to verify the effectiveness of the individual tree 3D reconstruction method, this study adopted two widely used image quality assessment metrics: PSNR and SSIM [43].
P S N R = 10 × lg M a x V a l u e 2 M S E
S S I M ( x , y ) = [ l ( x , y ) ] α [ c ( x , y ) ] β [ s ( x , y ) ] γ

4.5. Model Training

The model training was conducted on a high-performance computing platform using standard deep learning libraries and optimization strategies. Key hyperparameters and training strategies are detailed in Appendix A.

5. Results

5.1. Visualization Results

Figure 7 presents the results of forest 3D reconstruction using the proposed method. The left panel shows the input high-resolution remote sensing image, while the right panel displays the reconstructed forest from the same top-down perspective.
The proposed forest 3D reconstruction approach enabled rapid generation of large-scale forest scenes. To quantitatively evaluate the efficiency of the algorithm, Table 4 summarizes the runtime and resource consumption data for 3D reconstruction across three sample plots.
Experimental results show that the reconstruction time for each sample plot remained within approximately 220 s, with processing time primarily dependent on tree density and the number of trees. For instance, although Plot 79 covered a larger area than Plot 93, its reconstruction time was shorter because buildings and open spaces that reduced the number of effective trees. This demonstrates a strong correlation between reconstruction efficiency and forest stand density.
When comparing different forest types, the eucalyptus plot exhibited significantly faster reconstruction speeds than the Chinese fir plot. This is likely attributed to the clear crown boundaries and simpler tree crown textures of eucalyptus trees, which facilitated more efficient crown segmentation and parameter extraction.
To further assess the computational cost, we recorded RAM and GPU VRAM consumption for each plot during the reconstruction process. Results show that all sample plots consumed less than 22 GB of RAM and under 9 GB of VRAM, demonstrating the proposed method’s strong adaptability to computational resources and its suitability for large-scale forest scene reconstruction.

5.2. Accuracy Evaluation of Individual Tree Crown Segmentation

This study selected a subset of samples from the tree crown segmentation dataset to assess the segmentation performance of the proposed method. Nine unlabeled images were randomly selected from each plot as test samples, and tree crown segmentation experiments were performed on these samples. Evaluation metrics such as Precision, Recall, and F1-Score were calculated. The experimental results are presented in Table 5.
From the experimental data, it can be observed that the proposed method achieved high accuracy and reliability in the tree crown segmentation of eucalyptus trees, with both precision and recall exceeding 90%. This outstanding performance was likely attributable to the growth characteristics of eucalyptus: compared to Chinese fir, eucalyptus stands had lower density and less crown overlap, allowing the network to more clearly distinguish object boundaries and thereby enhance segmentation performance. In contrast, for the denser Chinese fir, the segmentation performance was slightly weaker, possibly due to stronger occlusion between target regions and greater similarity in texture features, which increases the difficulty of detection. Additionally, Figure 8 presents the results on a high-resolution remote sensing image of eucalyptus trees. Further analysis indicates that the crown segmentation results meet the accuracy requirements of forestry surveys, with errors remaining within an acceptable range.

5.3. Accuracy Evaluation of Tree Distribution Information Extraction

Experimental data show that there were 35 trees in the sample image. A comparative analysis of the distribution information was conducted for the individual trees that could be paired. As shown in Figure 9, the comparison between the measured and extracted tree positions on the left indicates that the proposed tree distribution extraction method can accurately determine the specific location of each tree within the plot, and its positioning results exhibit a high degree of consistency with field measurements. The extracted coordinates were georeferenced using a projected coordinate system based on WGS 84 with UTM projection, ensuring spatial accuracy and consistency with field survey data. The right side of the figure shows the residual distribution maps in the horizontal and vertical directions. The results demonstrate that the overall positioning error of all point pairs within the plot was controlled within 0.2 m, and the residuals were clearly concentrated around zero. This further verifies the accuracy of the model’s positioning [44]. Combined with findings from previous studies [45], this error range fully meets the allowable threshold for individual tree measurement accuracy in forestry.

5.4. Accuracy Evaluation of Individual Tree Parameter Extraction

Therefore, this study selected 73 eucalyptus trees and conducted linear regression analysis between the DBH and tree height data extracted by the TPRN model from tree crown images and the corresponding field-measured data. The fitting results for the key structural parameters are shown in Figure 10.
For tree height, the regression line was expressed as y = 1.04x − 0.55, with an R2 value of 0.927, indicating that the vast majority of data points were tightly clustered around the fitted line (see Figure 10a). In terms of error metrics, the MAE for tree height was 0.46 m, the RMSE was 0.57 m, and the maximum error remained within 10%, demonstrating the model’s strong performance in tree high accuracy.
As for DBH fitting, the regression curve was y = 1.03x − 0.35, with an R2 value of 0.96, showing that most data points were closely symmetrically distributed around of the regression line (see Figure 10b). Meanwhile, the MAE for DBH was 0.24 cm, and the RMSE was 0.16 cm, indicating very high accuracy in DBH prediction.
Overall, although the DBH fitting performed slightly better than the tree height fitting, both results achieved high levels of accuracy. This confirms that the individual tree parameter extraction module can effectively capture the intrinsic relationship between crown area and structural parameters such as tree height and DBH, thereby providing a reliable foundation for accurate parameter prediction.

5.5. Similarity Evaluation of Individual Tree 3D Reconstruction

After extracting parameters using TPRN, a tree modeling method based on these feature parameters was applied to generate the corresponding 3D tree models, as shown in Figure 11.
In the experiments, this study evaluated both eucalyptus and Chinese fir datasets, selecting five samples for each species. Two evaluation metrics were used to quantify the visual similarity of the reconstructed trees, with the detailed results shown in Table 6. As indicated by the data, the proposed method performed well in terms of the image quality assessment indicators PSNR and SSIM. The PSNR values for all tree species were at a relatively high level, with Chinese fir achieving slightly higher PSNR than eucalyptus. This may be attributed to the clearer and more regular texture and shape of Chinese fir canopies. Meanwhile, the SSIM scores were all above 0.5, indicating the method’s strong capability in preserving structural integrity of the images. In summary, the reconstruction model can accurately reproduce the 3D morphology of trees, and the similarity between the reconstructed tree crown images and the real tree crown images was relatively high, which fully validates the effectiveness of the proposed individual tree reconstruction method.

5.6. Validation of the Effectiveness of DTWL and the Virtual Dataset

Building upon traditional segmentation loss functions, this study proposed a novel boundary-aware loss function, namely the DTWL, which integrated boundary weighting to enhance the precision of crown edge prediction. In parallel, a virtual dataset augmentation strategy was employed during the training phase to enrich data diversity and mitigate generalization error. Furthermore, the feature extraction capability of the model was inherently dependent on the depth of the backbone network. While deeper networks such as ResNet101 tend to offer stronger representational power, they may also incur higher computational costs and a heightened risk of overfitting.
To systematically evaluate the proposed modules and design choices, we conducted a series of ablation studies. First, the contribution of the DTWL component was assessed by training models with and without DTWL under identical conditions, comparing their segmentation performance to validate its impact on boundary prediction accuracy. Second, the effect of virtual dataset augmentation was tested by comparing models trained solely on real images versus those trained on a hybrid dataset of real and synthetic forest imagery, to assess improvements in generalization. Finally, the influence of backbone depth was examined using ResNet50 and ResNet101 as feature extractors, with all other settings fixed, analyzing their performance differences in capturing complex crown boundaries.
The experimental results in Table 7 demonstrate that the improved Mask R-CNN model outperformed other baseline models in terms of segmentation accuracy. This is attributed to the DTWL loss function, which enforces boundary continuity regularization for densely distributed tree crowns, thereby significantly enhancing target boundary segmentation precision. Additionally, during the training phase, the virtual dataset expansion strategy was incorporated to augment the available data. The experimental results show that this strategy enhanced segmentation performance across different network depths, with particularly significant improvements when ResNet-101 was used as the backbone network. Furthermore, to explore the impact of network depth on the model’s feature extraction capabilities, this section compares the detection and segmentation performance of two backbone networks, ResNet-50 and ResNet-101. The results indicate that deeper networks exhibited stronger recognition ability to recognize complex tree crown boundaries.
Figure 12 compares the performance of networks using two different loss functions in the crown segmentation task. For ease of analysis, representative areas in the segmentation results are highlighted with yellow rectangles to emphasize key differences. The model without the DTWL loss function showed weak recognition ability for small-scale tree crowns, resulting in missed detections. Additionally, in densely distributed crown areas, where multiple crowns were closely spaced, the unmodified network erroneously merged the closely connected crowns as a single object. However, the network with the DTWL loss function, which introduced boundary-aware constraints, demonstrated improved ability to distinguish adjacent crown boundaries, thereby achieving more accurate segmentation of interconnected crowns.

5.7. Impact of Different Backbone Networks on Parameter Extraction

In designing the TPRN architecture, this paper first conducted comparative experiments across multiple deep neural networks to select the most suitable core network for processing the input crown image data. Initially, VGG-16 [46] was tested as the core network. However, the experiments showed that VGG-16 was prone to overfitting in the parameter extraction task, with certain branches experiencing sharp increases in the loss values of some branches, resulting in poor generalization performance. Therefore, a more computationally efficient network architecture that could effectively suppress overfitting was needed.
To this end, the study further evaluated ResNet-50 [34], AlexNet [47], and CoAtNet [48]. As a classic network, ResNet-50 performed stably in many computer vision tasks but showed slower convergence and was prone to overfitting in complex backgrounds when applied to crown image processing tasks. AlexNet performed well in simpler tasks, but due to its limited network depth and capacity, its performance in crown image extraction and reconstruction tasks was significantly poorer to other deeper networks. CoAtNet, one of the most advanced vision models currently, combines convolutional neural networks (CNN) and self-attention mechanisms, performing well across multiple visual tasks. Although it surpassed other networks in terms of performance from the [−360, 360] viewpoint, the overall experimental results indicated that EfficientNet-B7 had a clear advantage in terms of overall accuracy.
To evaluate the performance of each core network, this paper conducted comparative tests across multiple models. Each test used 27 crown images for evaluation, with each core network architecture trained for 2000 iterations. During the evaluation process, the 1-RMSE metric was employed, which combined the comparison between the predicted results and the GT parameters to quantitatively assess the performance of each network in the crown image processing task. Table 8 presents the comparison results of each model on the test set. The experimental results indicate that EfficientNet-B7 achieved the highest overall accuracy, confirming its advantage in crown image parameter extraction tasks.

6. Discussion

6.1. False Segmentation

The proposed method still exhibits certain limitations in crown segmentation, particularly in areas with high forest tree crown closure, where the misclassification rate tends to be higher. For example, as highlighted by the red box labeled “False 2” in Figure 13b, some tree crowns were missed during detection. Additionally, there were cases where two adjacent crowns were mistakenly identified as a single crown, as shown in the red box labeled “False 1” in the same figure. Nevertheless, the method typically managed to segment at least one of the crowns effectively, which did not substantially affect the estimation of tree count. However, for closely connected crowns, the current approach still struggles with boundary delineation, often resulting in blurred or merged crown edges, as can be clearly observed in Figure 13d.
The primary factors contributing to these issues include: (1) the high tree crown closure in Chinese fir stands led to occlusion and overlap among individual crowns, causing partial crown information to be incomplete in UAV images; (2) in eucalyptus stands with lower tree crown closure, crowns tended to be more regular in shape with clearer edges, making feature extraction and matching easier; in contrast, Chinese fir crowns were more complex and variable in size, with lower structural similarity, posing significant challenges for feature matching.
Although edge inaccuracies remained in some segmentation results, the method can overall identify multiple individual crowns, and the segmentation outcomes retained good usability for subsequent individual tree parameter extraction.

6.2. Applicability to Complex and Natural Forests

Although Figure 7 illustrates a reconstruction example from a relatively uniform plantation forest, the proposed method is not limited to such settings. The framework was designed with generalizability in mind and can be extended to more complex, heterogeneous, and multi-layered forest environments. While the segmentation and parameter estimation accuracy may be affected in denser or mixed-species forests due to crown overlap and structural diversity, the core methodology remains applicable.
To better cope with these complex scenes, future work could explore the integration of more advanced instance segmentation networks, such as BlendMask [49] and Segment Anything Model [50] (SAM), which have shown promising performance in fine-grained object delineation tasks. These models may improve segmentation accuracy, particularly in resolving overlapping and small-sized tree crowns, which are common in spatially heterogeneous forests.
Moreover, crown occlusion poses another challenge, as the segmented crowns may be partially incomplete. This incompleteness can negatively affect the accuracy of downstream single-tree parameter estimation. One potential solution is to introduce a crown completion module before parameter inference, which reconstructs plausible full crown shapes based on learned morphological patterns. This could enhance the reliability of subsequent parameter regression models.
Another limitation lies in the availability of ground-truth individual tree data (e.g., DBH, height, species), especially in natural or primary forest environments. This scarcity makes it difficult to quantitatively validate the reconstruction performance in such regions. As more high-quality field datasets become available, we plan to expand our experiments to include forests with greater ecological and structural diversity.

6.3. Limitations and Future Directions

The proposed method still has certain limitations. Since only tree crown information can be extracted from remote sensing images, the available features are relatively limited and cannot provide sufficiently rich structural details of trees. In addition, the tree crown segmentation and distribution extraction module lacks a tree species recognition function, resulting in a reliance on manually input species information to select the corresponding trunk textures. To address these limitations, future work may focus on the following aspects:
(1) Introducing multimodal learning methods [51]: Future research could attempt to integrate UAV-based LiDAR data or terrestrial close-range photogrammetry data. Through multi-source collaborative prediction, the accuracy of individual tree parameter extraction can be further improved. For example, the Tree Species Classification Multimodal Deep Learning (TSCMDL) method proposed by Liu et al. [52], which fuses 2D and 3D features, combines point cloud data with image data to achieve more accurate parameter extraction, thereby overcoming the limitations of traditional single-source models.
(2) Development of tree species recognition and texture generation techniques: Future studies could integrate high-precision tree species recognition into the tree crown segmentation and distribution extraction module to enable automatic identification of tree species. Additionally, realistic trunk and leaf texture generation algorithms can be developed using generative adversarial networks (GANs) to achieve more automated and realistic reconstruction results.

7. Conclusions

This study proposed a novel and efficient forest 3D reconstruction technique, where users could reconstruct a three-dimensional forest scene using only a single high-resolution remote sensing image. The reconstructed scene not only accurately reflected the spatial distribution of individual trees but also enabled reliable extraction of key structural parameters for each tree. The main contributions are summarized as follows:
(1) Forest 3D reconstruction based on high-resolution remote sensing images: The method first employed an optimized Mask R-CNN-based crown segmentation network to segment individual tree crowns from the input image, thereby obtaining precise crown regions and tree distribution information. Then, using the extracted crown images, a tree parameter regression network estimated the structural features of each tree. Based on these features, individual tree models were reconstructed. Finally, by integrating the spatial layout and geometric models, a complete 3D forest scene was generated. After model training, users could automatically generate a 3D forest reconstruction from a UAV or satellite image within minutes.
(2) Individual tree parameter extraction and 3D modeling based on crown top-view images: To enable accurate estimation of structural parameters, this study designed the TPRN model using EfficientNet-B7 as the backbone. The model introduced a dual-branch decoder to separately handle structural parameter regression and topological structure modeling, allowing effective extraction of parameters from top-view crown images. These predicted parameters were then used to construct the individual tree’s 3D geometric model.
(3) Construction of a hybrid dataset: To address the issue of insufficient real data, a virtual–real mixed dataset was constructed. This dataset combined remote sensing imagery from Gaofeng Forest and on-site measurement data to generate crown segmentation and parameter extraction data. Additionally, virtual remote sensing images were introduced to augment the sample size, significantly improving the model’s generalization ability.
In future research, on one hand, multi-source data such as LiDAR or terrestrial close-range photogrammetry data can be integrated to further improve the accuracy of single-tree parameter extraction; on the other hand, high-precision tree species identification functionality could be incorporated into the canopy segmentation module to achieve automated species recognition. Additionally, the application of the proposed method in more complex, heterogeneous, and multi-layered forest environments could be explored.

Author Contributions

Conceptualization, G.M., H.L. and G.Y.; data curation, H.L.; formal analysis, G.M.; funding acquisition, H.L. and G.Y.; investigation, G.M. and H.L.; resources, H.L. and G.Y.; software, G.M.; visualization, G.M.; writing—original draft, G.M.; writing—review and editing, G.M., G.Y. and X.Z. All authors have read and agreed to the published version of the manuscript.

Funding

This research was funded by the Fundamental Research Funds for the Central Universities (Grant number BFUKF202528, PTYX202559).

Data Availability Statement

The datasets generated and/or analyzed during the current study are available from the corresponding author on reasonable request.

Acknowledgments

We are very grateful to all the students assisted with data collection and the experiments. We also thank anonymous reviewers for helpful comments and suggestions to this paper.

Conflicts of Interest

The authors declare no conflicts of interest.

Appendix A

For the software environment configuration, this study built the development environment on the Ubuntu 20.04 operating system, utilizing tensorflow-gpu-1.13.1 and keras-2.1.5 as the core deep learning frameworks. In addition, to enhance computational performance and accelerate the execution of deep learning tasks, NVIDIA’s high-performance computing toolkit CUDA and the cuDNN deep learning optimization library were installed and configured. The hardware configuration included an Intel i9-13900 central processing unit (CPU), NVIDIA GTX 4090 graphics processor unit (GPU) with 24 GB VRAM, 1T solid-state drive, and 64GB RAM.
The hyperparameter settings used during training, as shown in Table A1, covered key parameters in the training process, including the learning rate, batch size, and optimization algorithm.
Table A1. Hyperparameter settings.
HyperparameterValues
Epochs500
Batch Size4
Learning Rate0.01
OptimizerAdam
Momentum0.9
Learning Rate SchedulerCosineAnnealingLR
Weight Decay0.0002
To improve training efficiency and prevent gradient updates from interfering with the overall model architecture, a two-stage strategy was adopted during training. In the initial training phase, only the geometric decoder was optimized, while other parameters remained frozen to ensure that the model first learned stable structural parameter estimation capabilities. As training progressed, the topological decoder was progressively unfrozen, and the entire network was jointly optimized to simultaneously improve the performance of structural parameter prediction and backbone structure reconstruction. Adam [53] was maintained as the optimizer, with the learning rate dynamically adjusted to meet the training needs of different network layers.

References

  1. Chirico, G.B.; Bonavolontà, F. Metrology for Agriculture and Forestry 2019. Sensors 2020, 20, 3498. [Google Scholar] [CrossRef] [PubMed]
  2. Dietrich, A.; Colditz, C.; Deussen, O.; Slusallek, P. Realistic and Interactive Visualization of High-Density Plant Ecosystems; KOPS: Konstanz, Germany, 2005. [Google Scholar]
  3. Lechner, A.M.; Foody, G.M.; Boyd, D.S. Applications in Remote Sensing to Forest Ecology and Management. One Earth 2020, 2, 405–412. [Google Scholar] [CrossRef]
  4. Yu, R.; Ren, L.; Luo, Y. Early detection of pine wilt disease in Pinus tabuliformis in North China using a field portable spectrometer and UAV-based hyperspectral imagery. For. Ecosyst. 2021, 8, 44. [Google Scholar] [CrossRef]
  5. Berveglieri, A.; Imai, N.N.; Tommaselli, A.M.; Casagrande, B.; Honkavaara, E. Successional stages and their evolution in tropical forests using multi-temporal photogrammetric surface models and superpixels. ISPRS J. Photogramm. Remote Sens. 2018, 146, 548–558. [Google Scholar] [CrossRef]
  6. Xu, C.; Lu, Z.; Xu, G.; Feng, Z.; Tan, H.; Zhang, H. 3d Reconstruction of Tree-Crown Based on the Uav Aerial Images. Math. Probl. Eng. 2015, 2015, 318619. [Google Scholar] [CrossRef]
  7. Zhu, R.; Guo, Z.; Zhang, X. Forest 3d Reconstruction and Individual Tree Parameter Extraction Combining Close-Range Photo Enhancement and Feature Matching. Remote Sens. 2021, 13, 1633. [Google Scholar] [CrossRef]
  8. Liu, Z.; Chen, Z.; Zhang, X.; Chen, S. CDP-MVS: Forest Multi-View Reconstruction with Enhanced Confidence-Guided Dynamic Domain Propagation. Remote Sens. 2024, 16, 3845. [Google Scholar] [CrossRef]
  9. Yan, X.; Chai, G.; Han, X.; Lei, L.; Wang, G.; Jia, X.; Zhang, X. Sa-Pmnet: Utilizing Close-Range Photogrammetry Combined with Image Enhancement and Self-Attention Mechanisms for 3d Reconstruction of Forests. Remote Sens. 2024, 16, 416. [Google Scholar] [CrossRef]
  10. Xu, G.; Wang, Y.; Cheng, J.; Tang, J.; Yang, X. Accurate and Efficient Stereo Matching Via Attention Concatenation Volume. IEEE Trans. Pattern Anal. Mach. Intell. 2023, 46, 2461–2474. [Google Scholar] [CrossRef]
  11. Mildenhall, B.; Srinivasan, P.P.; Tancik, M.; Barron, J.T.; Ramamoorthi, R.; Ng, R. Nerf: Representing Scenes as Neural Radiance Fields for View Synthesis. Commun. ACM 2021, 65, 99–106. [Google Scholar] [CrossRef]
  12. Castorena, J. Learning Neural Radiance Fields of Forest Structure for Scalable and Fine Monitoring. In Proceedings of the Mexican International Conference on Artificial Intelligence, Yucatán, Mexico, 13–18 November 2023; Springer: Berlin/Heidelberg, Germany, 2023. [Google Scholar]
  13. Kerbl, B.; Kopanas, G.; Leimkühler, T.; Drettakis, G. 3d Gaussian Splatting for Real-Time Radiance Field Rendering. ACM Trans. Graph. 2023, 42, 139. [Google Scholar] [CrossRef]
  14. Tian, G.; Chen, C.; Huang, H. Comparative Analysis of Novel View Synthesis and Photogrammetry for 3d Forest Stand Reconstruction and Extraction of Individual Tree Parameters. Remote Sens. 2025, 17, 1520. [Google Scholar] [CrossRef]
  15. Wang, X.-H.; Zhang, Y.-Z.; Xu, M.-M. A Multi-Threshold Segmentation for Tree-Level Parameter Extraction in a Deciduous Forest Using Small-Footprint Airborne Lidar Data. Remote Sens. 2019, 11, 2109. [Google Scholar] [CrossRef]
  16. Hua, Z.; Xu, Z.; Liu, Y. Individual Tree Segmentation from Side-View Lidar Point Clouds of Street Trees Using Shadow-Cut. Remote Sens. 2022, 14, 5742. [Google Scholar] [CrossRef]
  17. Liu, T.; Im, J.; Quackenbush, L.J. A Novel Transferable Individual Tree Crown Delineation Model Based on Fishing Net Dragging and Boundary Classification. ISPRS J. Photogramm. Remote Sens. 2015, 110, 34–47. [Google Scholar] [CrossRef]
  18. Zhu, X.X.; Tuia, D.; Mou, L.; Xia, G.S.; Zhang, L.; Xu, F.; Fraundorfer, F. Deep Learning in Remote Sensing: A Comprehensive Review and List of Resources. IEEE Geosci. Remote Sens. Mag. 2017, 5, 8–36. [Google Scholar] [CrossRef]
  19. Lou, X.; Huang, Y.; Fang, L.; Huang, S.; Gao, H.; Yang, L.; Hung, I.K.U. Measuring Loblolly Pine Crowns with Drone Imagery through Deep Learning. J. For. Res. 2022, 33, 227–238. [Google Scholar] [CrossRef]
  20. Coomes, D.A.; Dalponte, M.; Jucker, T.; Asner, G.P.; Banin, L.F.; Burslam, D.F.R.P.; Lewis, S.L.; Nilus, R.; Phillips, O.L.; Phua, M.-H.; et al. Area-Based Vs Tree-Centric Approaches to Mapping Forest Carbon in Southeast Asian Forests from Airborne Laser Scanning Data. Remote Sens. Environ. 2017, 194, 77–88. [Google Scholar] [CrossRef]
  21. He, K.; Gkioxari, G.; Dollár, P.; Girshick, R. Mask R-Cnn. In Proceedings of the IEEE International Conference on Computer Vision, Venice, Italy, 22–29 October 2017. [Google Scholar]
  22. Safonova, A.; Guirado, E.; Maglinets, Y.; Alcaraz-Segura, D.; Tabik, S. Olive Tree Biovolume from Uav Multi-Resolution Image Segmentation with Mask R-Cnn. Sensors 2021, 21, 1617. [Google Scholar] [CrossRef]
  23. Chakraborty, D.; Deka, B. Uav Sensing-Based Semantic Image Segmentation of Litchi Tree Crown Using Deep Learning. In Proceedings of the 2023 IEEE Applied Sensing Conference (APSCON), Bengaluru, India, 23–25 January 2023. [Google Scholar]
  24. Lassalle, G.; Ferreira, M.P.; Cué La Rosa, L.E.C.; De Souza Filho, C.R. Deep Learning-Based Individual Tree Crown Delineation in Mangrove Forests Using Very-High-Resolution Satellite Imagery. ISPRS J. Photogramm. Remote Sens. 2022, 189, 220–235. [Google Scholar] [CrossRef]
  25. Bloomenthal, J. Modeling the Mighty Maple. ACM SIGGRAPH Comput. Graph. 1985, 19, 305–311. [Google Scholar] [CrossRef]
  26. Lindenmayer, A. Mathematical Models for Cellular Interactions in Development, I. Filaments with One-Sided Inputs. J. Theor. Biol. 1968, 18, 280–299. [Google Scholar] [CrossRef] [PubMed]
  27. Weber, J.; Penn, J. Creation and Rendering of Realistic Trees. In Proceedings of the 22nd Annual Conference on Computer Graphics and Interactive Techniques, Los Angeles, CA, USA, 6–11 August 1995; Association for Computing Machinery: New York, NY, USA, 1995. [Google Scholar]
  28. Ni, Z.; Burks, T.F.; Lee, W.S. 3d Reconstruction of Plant/Tree Canopy Using Monocular and Binocular Vision. J. Imaging 2016, 2, 28. [Google Scholar] [CrossRef]
  29. Tan, P.; Fang, T.; Xiao, J.; Zhao, P.; Long, Q. Single Image Tree Modeling. ACM Trans. Graph. (TOG) 2008, 27, 1–7. [Google Scholar] [CrossRef]
  30. Argudo, O.; Chica, A.; Andujar, C. Single-Picture Reconstruction and Rendering of Trees for Plausible Vegetation Synthesis. Comput. Graph. 2016, 57, 55–67. [Google Scholar] [CrossRef]
  31. Liu, Z.; Wu, K.; Guo, J.; Wang, Y.; Deussen, O.; Cheng, Z. Single Image Tree Reconstruction Via Adversarial Network. Graph. Models 2021, 117, 101115. [Google Scholar] [CrossRef]
  32. Li, B.; Kałużny, J.; Klein, J.; Michels, D.L.; Pałubicki, W.; Benes, B.; Pirk, S. Learning to Reconstruct Botanical Trees from Single Images. ACM Trans. Graph. (TOG) 2021, 40, 1–15. [Google Scholar] [CrossRef]
  33. Huang, H.; Kalogerakis, E.; Yumer, E.; Mech, R. Shape Synthesis from Sketches Via Procedural Models and Convolutional Networks. IEEE Trans. Vis. Comput. Graph. 2016, 23, 2003–2013. [Google Scholar] [CrossRef]
  34. He, K.; Zhang, X.; Ren, S.; Sun, J. Deep Residual Learning for Image Recognition. In Proceedings of the IEEE conference on Computer Vision and Pattern Recognition, Las Vegas, NV, USA, 26 June–1 July 2016. [Google Scholar]
  35. Zhu, Q.; Du, B.; Yan, P. Boundary-Weighted Domain Adaptive Neural Network for Prostate Mr Image Segmentation. IEEE Trans. Med. Imaging 2019, 39, 753–763. [Google Scholar] [CrossRef]
  36. Hemery, G.E.; Savill, P.S.; Pryor, S.N. Applications of the Crown Diameter–Stem Diameter Relationship for Different Species of Broadleaved Trees. For. Ecol. Manag. 2005, 215, 285–294. [Google Scholar] [CrossRef]
  37. Calama, R.; Montero, G. Interregional Nonlinear Height Diameter Model with Random Coefficients for Stone Pine in Spain. Can. J. For. Res. 2004, 34, 150–163. [Google Scholar] [CrossRef]
  38. Gonzalez-Benecke, C.A.; Gezan, S.A.; Samuelson, L.J.; Cropper, W.P., Jr.; Leduc, D.J.; Martin, T.A. Estimating Pinus Palustris Tree Diameter and Stem Volume from Tree Height, Crown Area and Stand-Level Parameters. J. For. Res. 2014, 25, 43–52. [Google Scholar] [CrossRef]
  39. Tan, M.; Le, Q. Efficientnet: Rethinking Model Scaling for Convolutional Neural Networks. In Proceedings of the International Conference on Machine Learning, Long Beach, CA, USA, 9–15 June 2019. [Google Scholar]
  40. Thambawita, V.; Strümke, I.; Hicks, A.S.; Halvorsen, P.; Parasa, S.; Riegler, M.A. Impact of Image Resolution on Deep Learning Performance in Endoscopy Image Classification: An Experimental Study Using a Large Dataset of Endoscopic Images. Diagnostics 2021, 11, 2183. [Google Scholar] [CrossRef] [PubMed]
  41. McDowell, N.G.; Allen, C.D. Darcy’s Law Predicts Widespread Forest Mortality under Climate Warming. Nat. Clim. Change 2015, 5, 669–672. [Google Scholar] [CrossRef]
  42. Hunt, R. Plant Growth Analysis. ResearchGate. Available online: https://www.researchgate.net/publication/321267971_Plant_growth_analysis (accessed on 22 June 2025).
  43. Kok, E.; Wang, X.; Chen, C. Obscured Tree Branches Segmentation and 3d Reconstruction Using Deep Learning and Geometrical Constraints. Comput. Electron. Agric. 2023, 210, 107884. [Google Scholar] [CrossRef]
  44. Ferreira, M.P.; Zortea, M.; Zanotta, D.C.; Shimabukuro, Y.E.; de Souza Filho, C.R. Mapping Tree Species in Tropical Seasonal Semi-Deciduous Forests with Hyperspectral and Multispectral Data. Remote Sens. Environ. 2016, 179, 66–78. [Google Scholar] [CrossRef]
  45. Ferreira, M.P.; Wagner, F.H.; Aragão, L.E.; Shimabukuro, Y.E.; de Souza Filho, C.R. Tree Species Classification in Tropical Forests Using Visible to Shortwave Infrared Worldview-3 Images and Texture Analysis. ISPRS J. Photogramm. Remote Sens. 2019, 149, 119–131. [Google Scholar] [CrossRef]
  46. Simonyan, K.; Zisserman, A. Very Deep Convolutional Networks for Large-Scale Image Recognition. arXiv 2014, arXiv:1409.1556. [Google Scholar]
  47. Krizhevsky, A.; Sutskever, I.; Hinton, G.E. Imagenet Classification with Deep Convolutional Neural Networks. Commun. ACM 2017, 60, 84–90. [Google Scholar] [CrossRef]
  48. Dai, Z.; Liu, H.; Le, Q.V.; Tan, M. Coatnet: Marrying Convolution and Attention for All Data Sizes. Adv. Neural Inf. Process. Syst. 2021, 34, 3965–3977. [Google Scholar]
  49. Chen, H.; Sun, K.; Tian, Z.; Shen, C.; Huang, Y.; Yan, Y. Blendmask: Top-Down Meets Bottom-up for Instance Segmentation. In Proceedings of the IEEE/CVF Conference on Computer Vision and Pattern Recognition, Seattle, WA, USA, 13–19 June 2020. [Google Scholar]
  50. Kirillov, A.; Mintun, E.; Ravi, N.; Mao, H.; Rolland, C.; Gustafson, L.; Xiao, T.; Whitehead, S.; Berg, A.C.; Lo, W.-Y.; et al. Segment Anything. In Proceedings of the IEEE/CVF International Conference on Computer Vision, Paris, France, 2–3 October 2023. [Google Scholar]
  51. Lin, Z.; Yu, S.; Kuang, Z.; Pathak, D.; Ramanan, D. Multimodality Helps Unimodality: Cross-Modal Few-Shot Learning with Multimodal Models. In Proceedings of the IEEE/CVF Conference on Computer Vision and Pattern Recognition, Paris, France, 2–3 October 2023. [Google Scholar]
  52. Liu, B.; Hao, Y.; Huang, H.; Chen, S.; Li, Z.; Chen, E.; Tian, X.; Ren, M. Tscmdl: Multimodal Deep Learning Framework for Classifying Tree Species Using Fusion of 2-D and 3-D Features. IEEE Trans. Geosci. Remote Sens. 2023, 61, 1–11. [Google Scholar] [CrossRef]
  53. Kingma, D.P.; Ba, J. Adam: A Method for Stochastic Optimization. arXiv 2014, arXiv:1412.6980. [Google Scholar]
Figure 1. Overview of our method.
Remotesensing 17 02179 g001
Figure 2. Data acquisition overview: (a) schematic map of the forest site location; (b) distribution of UAV image acquisition tiles; (c) Plot_145; (d) Plot_92; (e) Plot_92.
Remotesensing 17 02179 g002
Figure 3. Individual tree modeling: (a) adjustment of individual tree representation parameters in the developed Blender plugin; (b) tree models generated based on the adjusted parameters; (c) a virtual forest constructed using the individual tree models.
Remotesensing 17 02179 g003
Figure 4. Adjusted Mask R-CNN network architecture diagram. (The components highlighted in green represent the improvements proposed in this study.).
Remotesensing 17 02179 g004
Figure 5. Tree crown contour center and location information extraction: (a) simulation of different tree crown; (b) grayscale images of different tree crown; (c) individual tree crown contour extraction; (d) individual tree crown centroid extraction.
Remotesensing 17 02179 g005
Figure 6. The architecture of TPRN.
Remotesensing 17 02179 g006
Figure 7. Forest scene reconstruction based on high-resolution remote sensing images.
Remotesensing 17 02179 g007
Figure 8. Tree crown segmentation and distribution extraction: (a) input remote sensing image; (b) predicted bounding box; (c) predicted mask (red areas); (d) tree distribution information (red dots).
Remotesensing 17 02179 g008
Figure 9. Comparison of extracted tree distribution information with measured values and residual distribution in each direction.
Remotesensing 17 02179 g009
Figure 10. Regression relationship of eucalyptus trees: (a) regression between predicted tree height and measured tree height; (b) regression between predicted DBH and measured DBH.
Remotesensing 17 02179 g010
Figure 11. Single tree reconstruction results: (a) input tree crown image; (b) tree crown reconstruction result; (c) single tree reconstruction model.
Remotesensing 17 02179 g011
Figure 12. Effect of loss function optimization on tree crown segmentation: (a) before optimization; (b) after optimization.
Remotesensing 17 02179 g012
Figure 13. Tree crown segmentation in high tree crown density conditions: (a,c) input remote sensing images; (b,d) segmentation results with highlighted errors.
Remotesensing 17 02179 g013
Table 1. Details of selected plots.
Plot IDsDominant Tree SpeciesNumber of ImagesImage ID
79Chinese Fir116DJI_0114-0228
92Chinese Fir96DJI_0230-0325
145Eucalyptus83DJI_0031-0113
Table 2. Category feature parameters and ranges.
Category Feature ParametersDescriptionMinMax
LevelsNumber of tree branching levels04
ChildNNumber of lateral branches0
dRateDiameter ratio between parent and child branches01
CurveCurvature angle of branches−360360
splitNumber of branch bifurcations04
splitAngleBranch bifurcation angle−360360
leafScaleLeaf size0
lealScale_XLeaf aspect ratio01
Table 3. Individual feature parameters and ranges.
Individual Feature ParametersDescriptionMinMax
scaleOverall scale factor01
scaleVVariation range of the overall scale01
lengthTree height0
lengthVVariation range of tree height0
ratioRatio of tree height to trunk base width−∞1
scale0Weight coefficient for ratio scaling01
scaleV0Variation range of scale001
taperTree top width01
Table 4. Efficiency and resource usage analysis of reconstruction algorithms.
IDsTree Species#Imgs#TreesArea
(×104 m2)
Time (s)RAM (GB)GPU Mem (GB)
79Chinese Fir1117522.921421.38.5
92Chinese Fir1024202.024021.18.2
145Eucalyptus914021.718421.88.7
Table 5. Analysis of tree count prediction accuracy.
IDsTree SpeciesTPFPFNPrecision (%)Recall (%)F1-Score (%)
79Chinese Fir195232889.4587.4488.44
92Chinese Fir149182089.2288.1788.69
145Eucalyptus170131492.9092.3992.64
Table 6. Evaluation of the similarity of reconstructed images using different metrics.
Tree SpeciesIDsPSNRSSIM
Eucalyptus110.76 0.50
Eucalyptus210.75 0.47
Eucalyptus311.24 0.58
Eucalyptus410.81 0.45
Eucalyptus511.56 0.66
Average 11.02 0.53
Chinese Fir111.32 0.53
Chinese Fir211.19 0.53
Chinese Fir311.33 0.51
Chinese Fir411.17 0.50
Chinese Fir511.19 0.50
Average 11.24 0.51
Table 7. Ablation study results.
BackboneDTWLWith Virtual DataPrecision (%)Recall (%)F1-Score (%)
ResNet-50 89.0788.5988.83
ResNet-101 89.6289.1389.37
ResNet-50 90.1689.6789.92
ResNet-101 90.7190.2290.46
ResNet-50 91.2690.7691.01
ResNet-101 91.8091.3091.55
ResNet-5092.3591.8592.10
ResNet-10192.9092.3992.64
ResNet-50 89.0788.5988.83
Table 8. Core net comparisons.
Core Nets[−∞, ∞][−360, 360][0, 1][0, ∞][min, max][−1, 1]Overall
VGG-160.80220.95520.79880.94540.97720.98090.9115
ResNet-500.78850.95860.80330.95820.95790.96070.9009
AlexNet0.77910.95520.79590.95490.97920.98120.8992
CoAtNet0.80030.96070.80170.95760.97690.98990.913
EfficientNet-B7 (our)0.81130.95430.80970.96890.98620.99320.9253
Disclaimer/Publisher’s Note: The statements, opinions and data contained in all publications are solely those of the individual author(s) and contributor(s) and not of MDPI and/or the editor(s). MDPI and/or the editor(s) disclaim responsibility for any injury to people or property resulting from any ideas, methods, instructions or products referred to in the content.

