


Characterizing Crop Distribution and the Impact on Forest Conservation in Central Africa

 ,
,  , , and
Abstract

1. Introduction
2. Materials and Methods
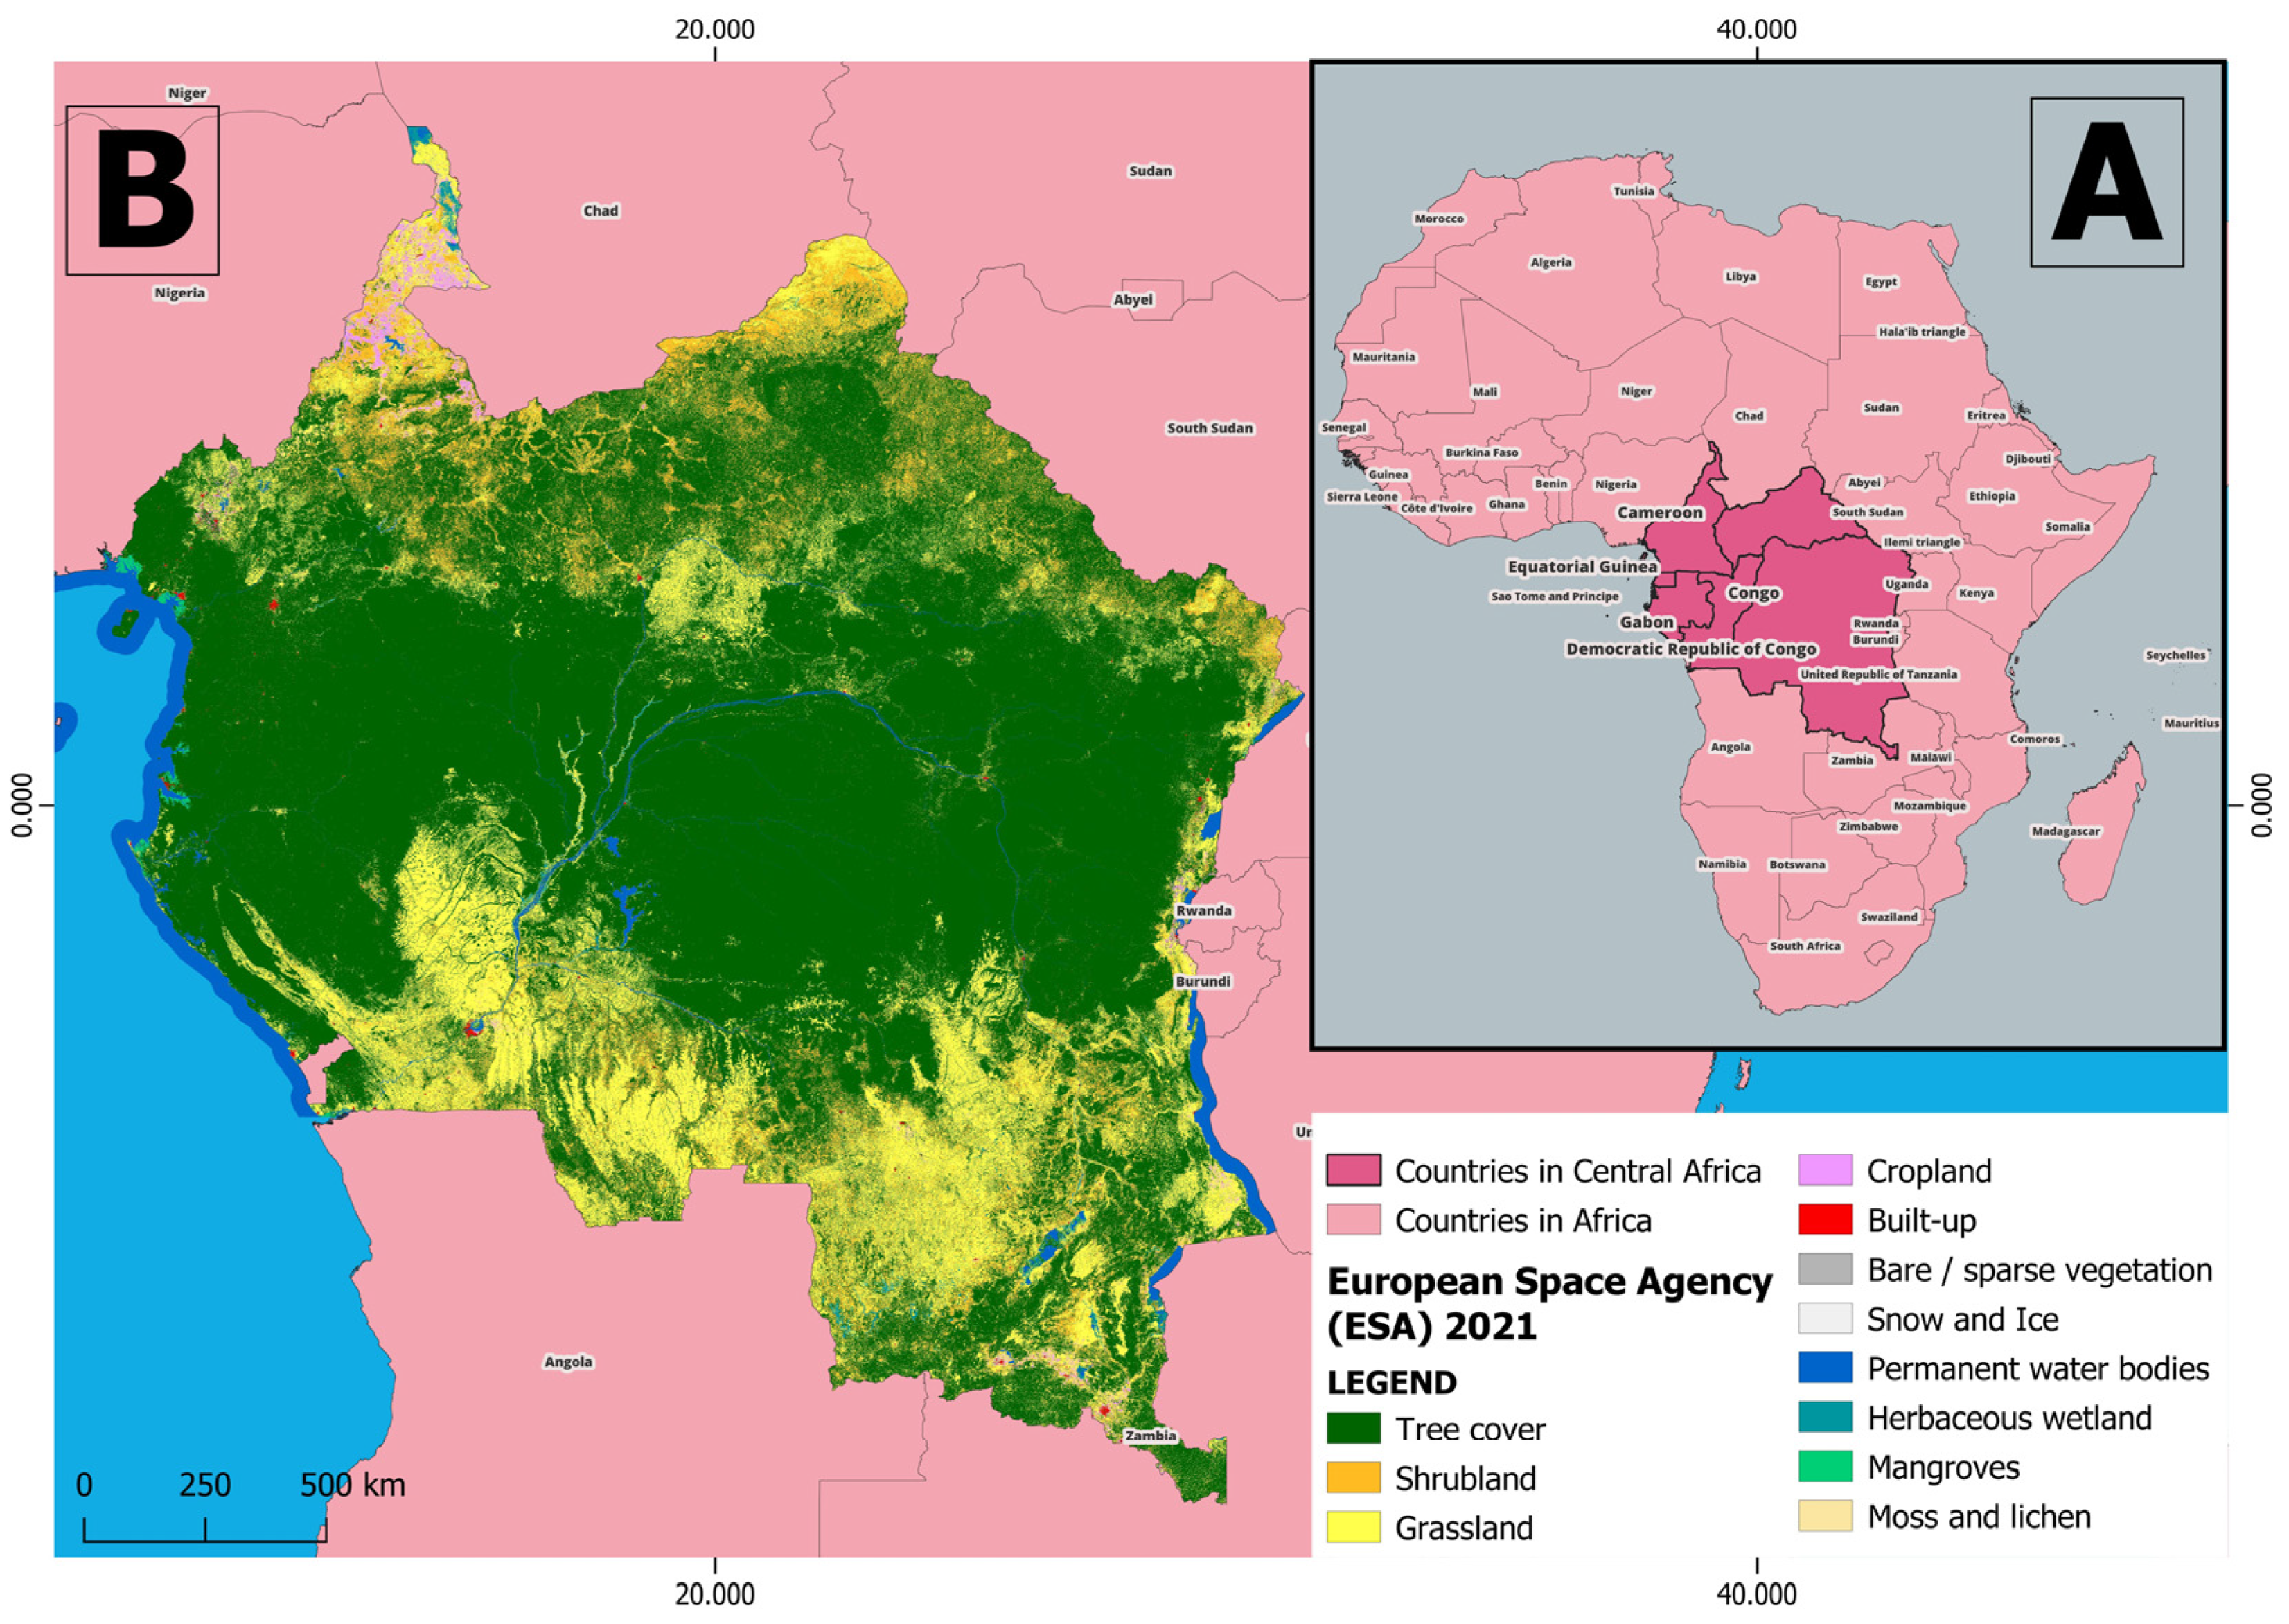
2.1. Study Area
2.2. Input Variables
2.2.1. Sentinel-1
2.2.2. Sentinel-2
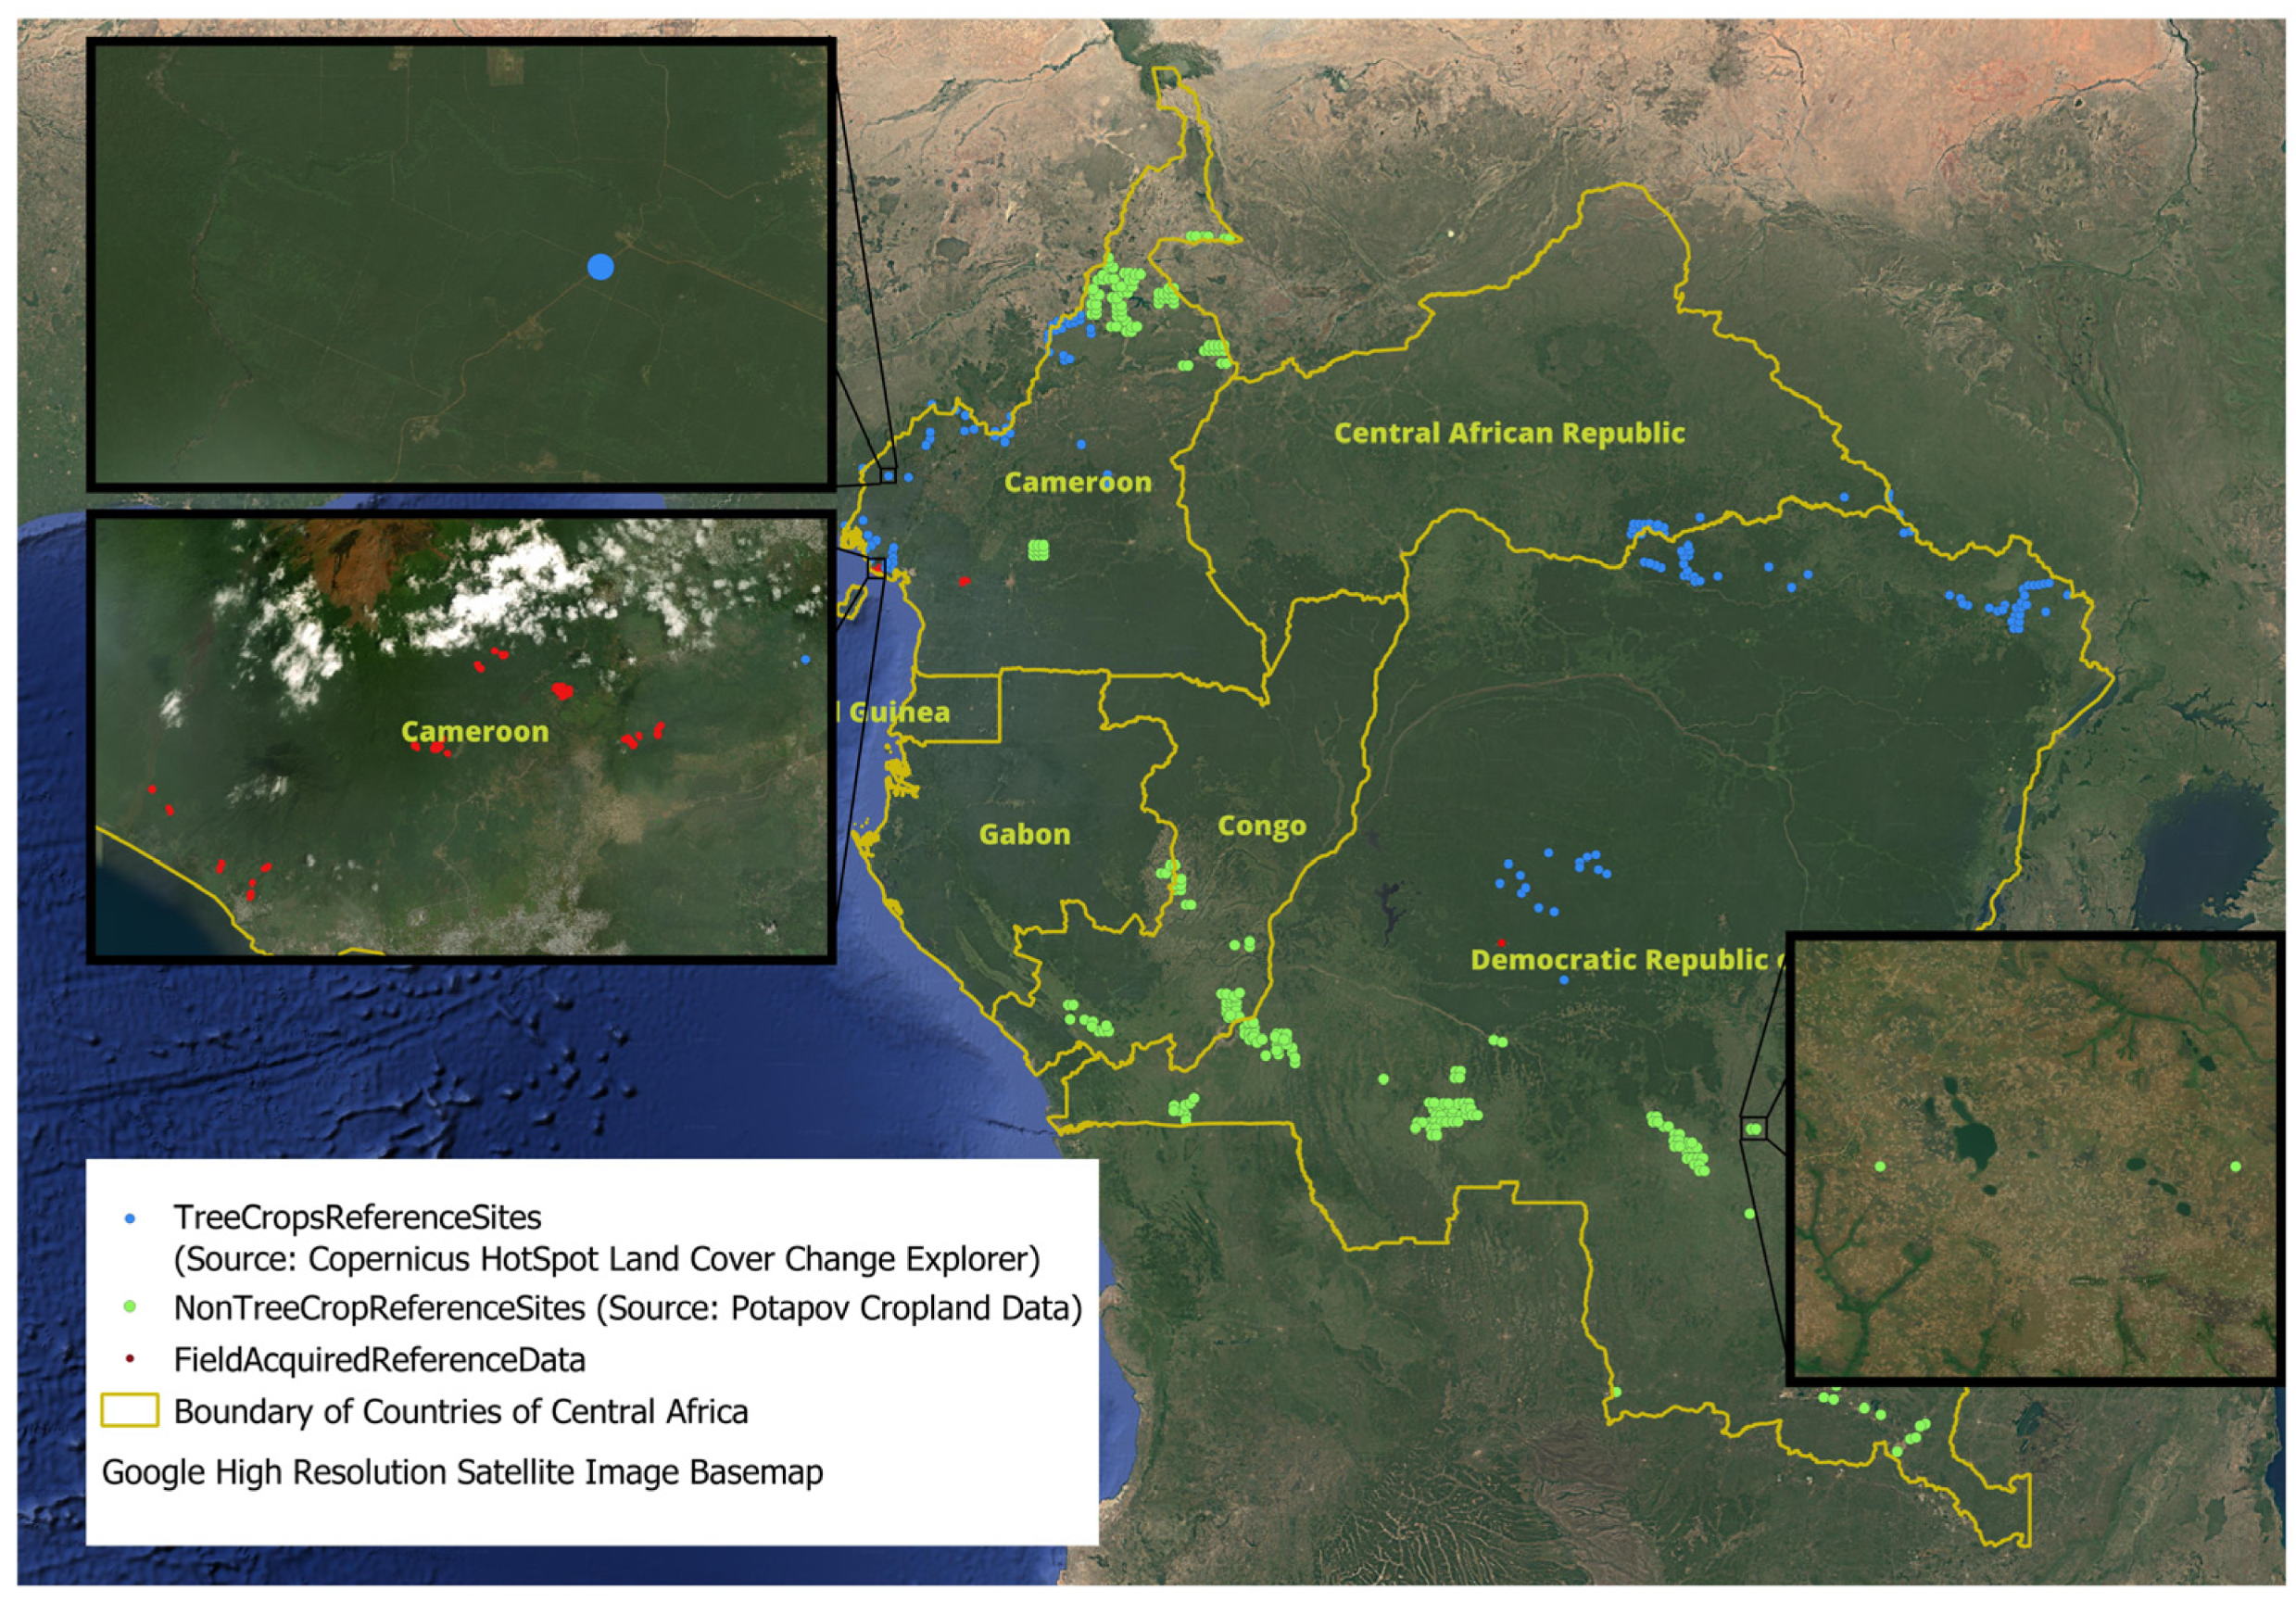
2.3. Reference Data
2.4. Definition of Classes into Large- and Small-Scale Cultivation
2.5. Training and Validation Samples
2.6. Forest Masking and Exclusion from Composite Image
2.7. Image Classification Using the U-Net with ResNet-50 Encoder
2.8. Forest to Cropland Conversion
3. Results
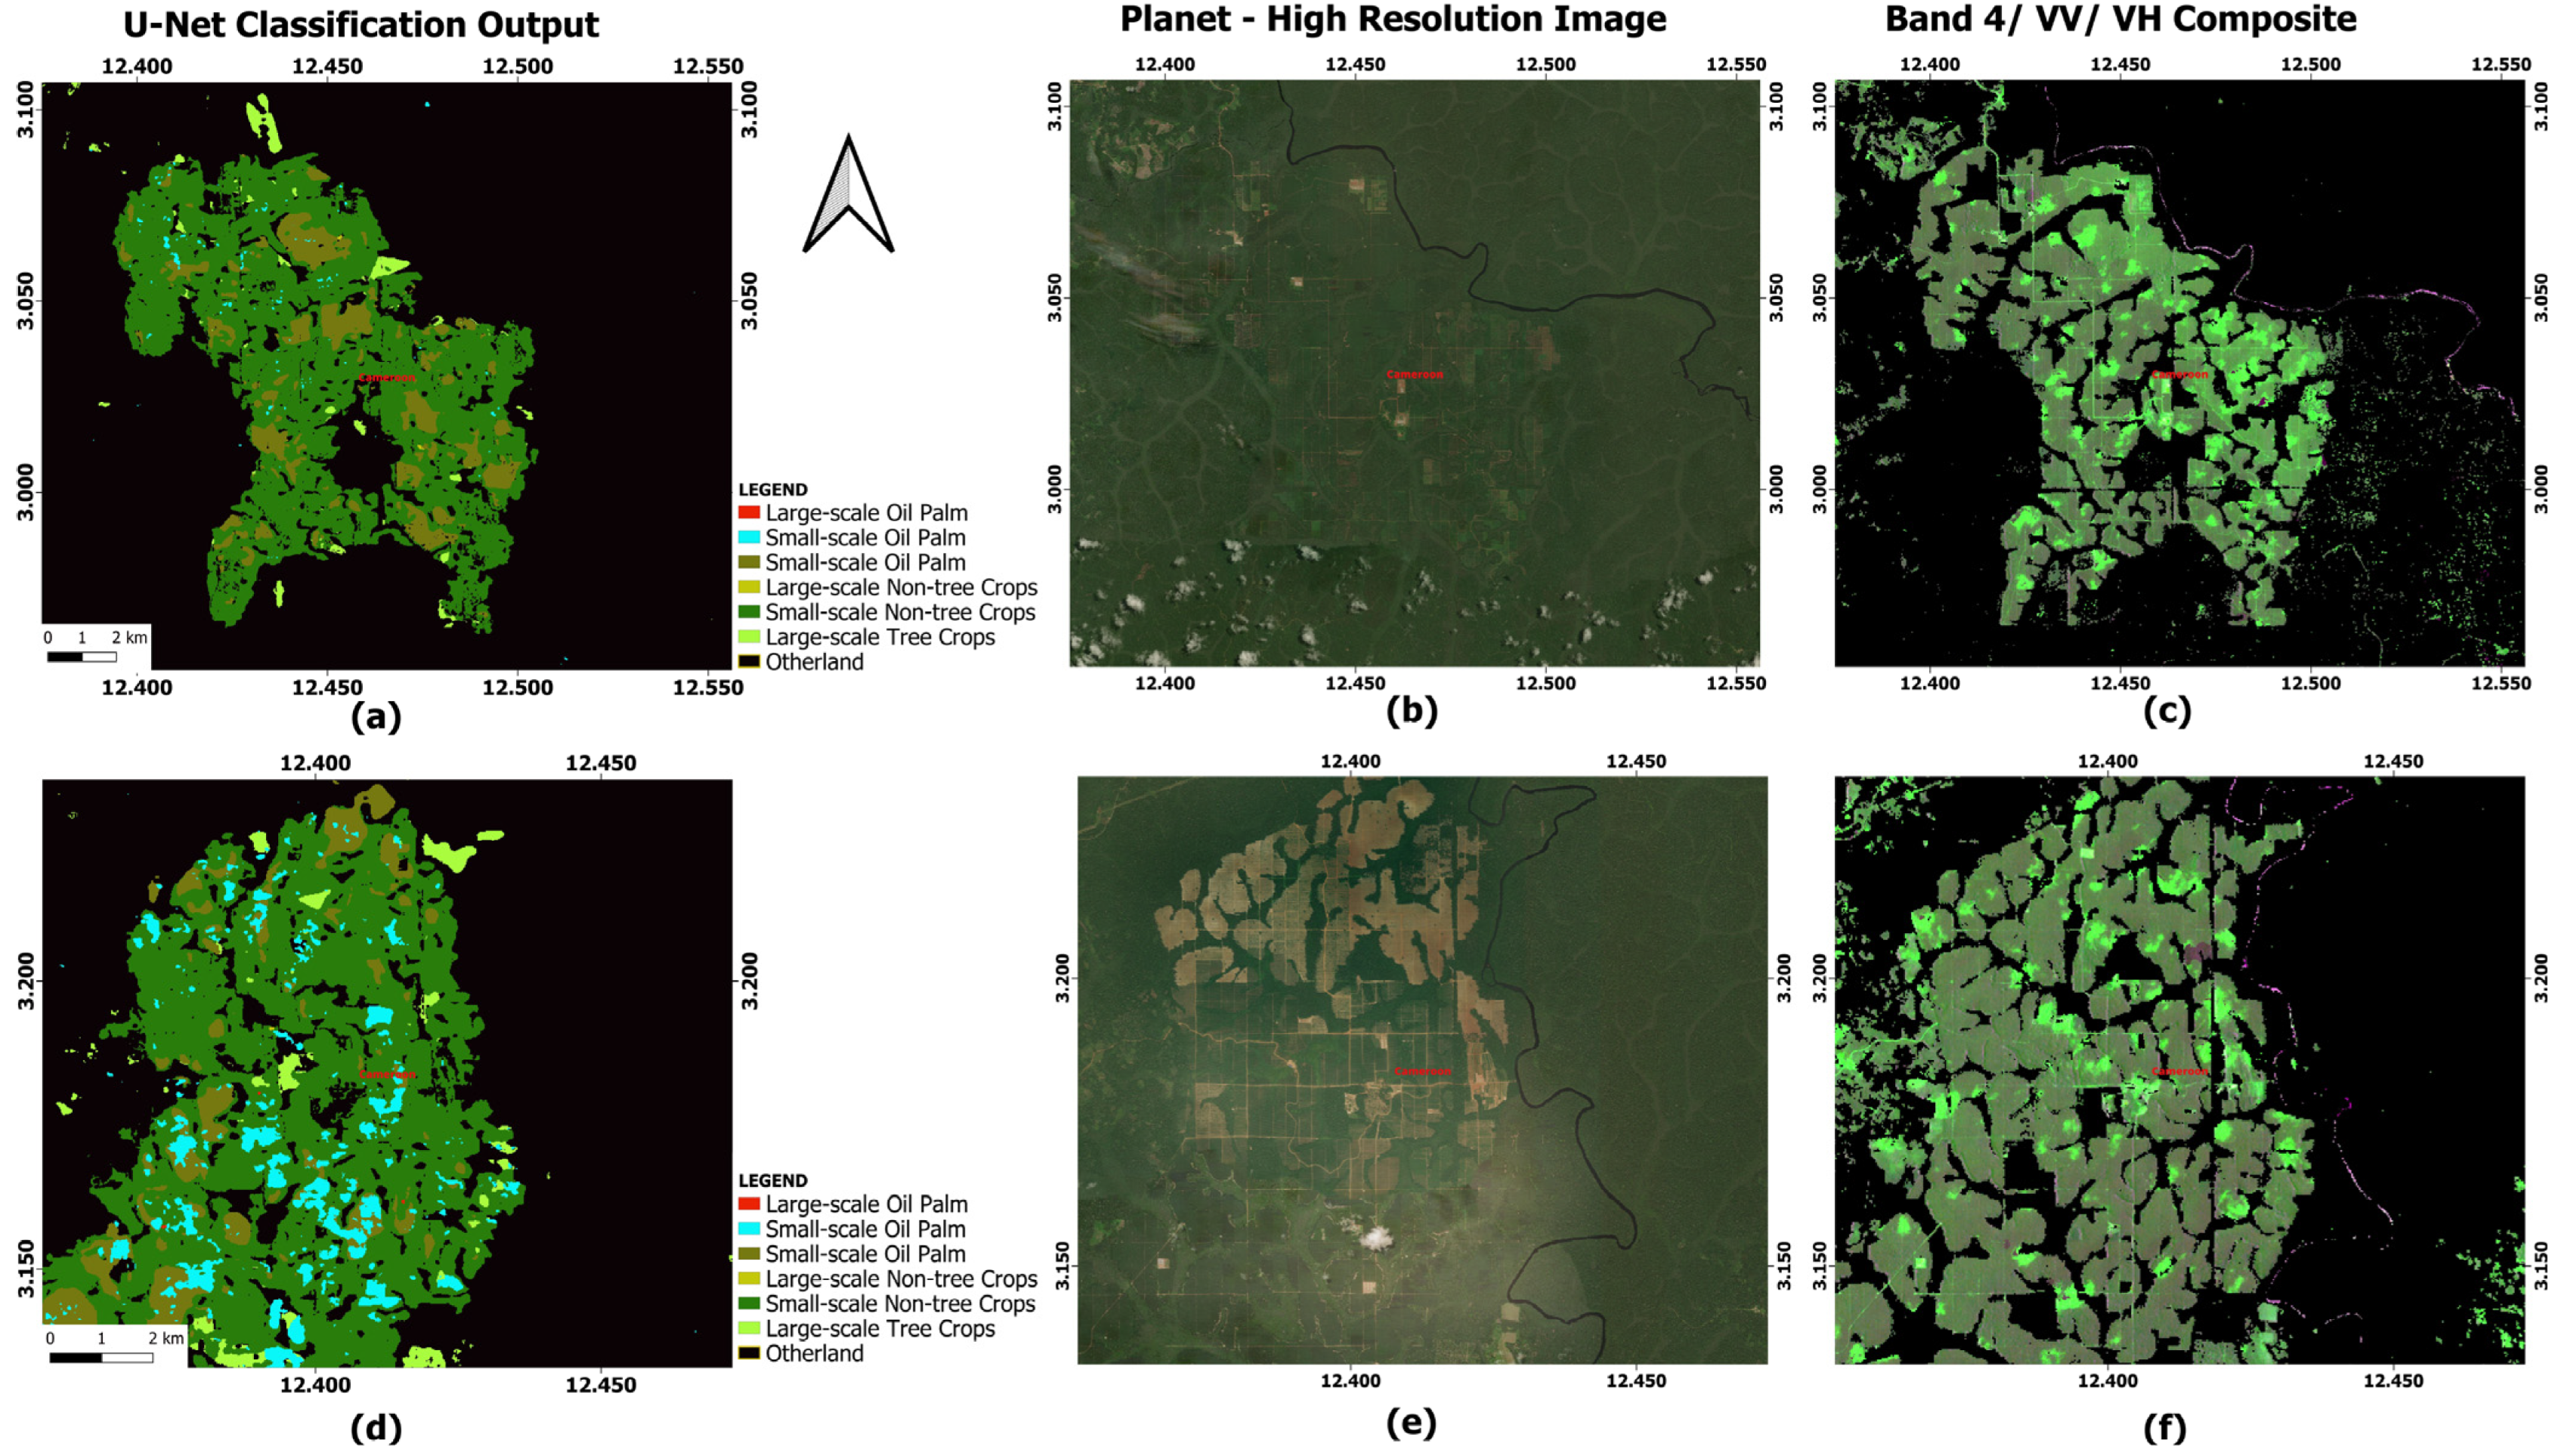
3.1. Classification Output and Class Accuracy
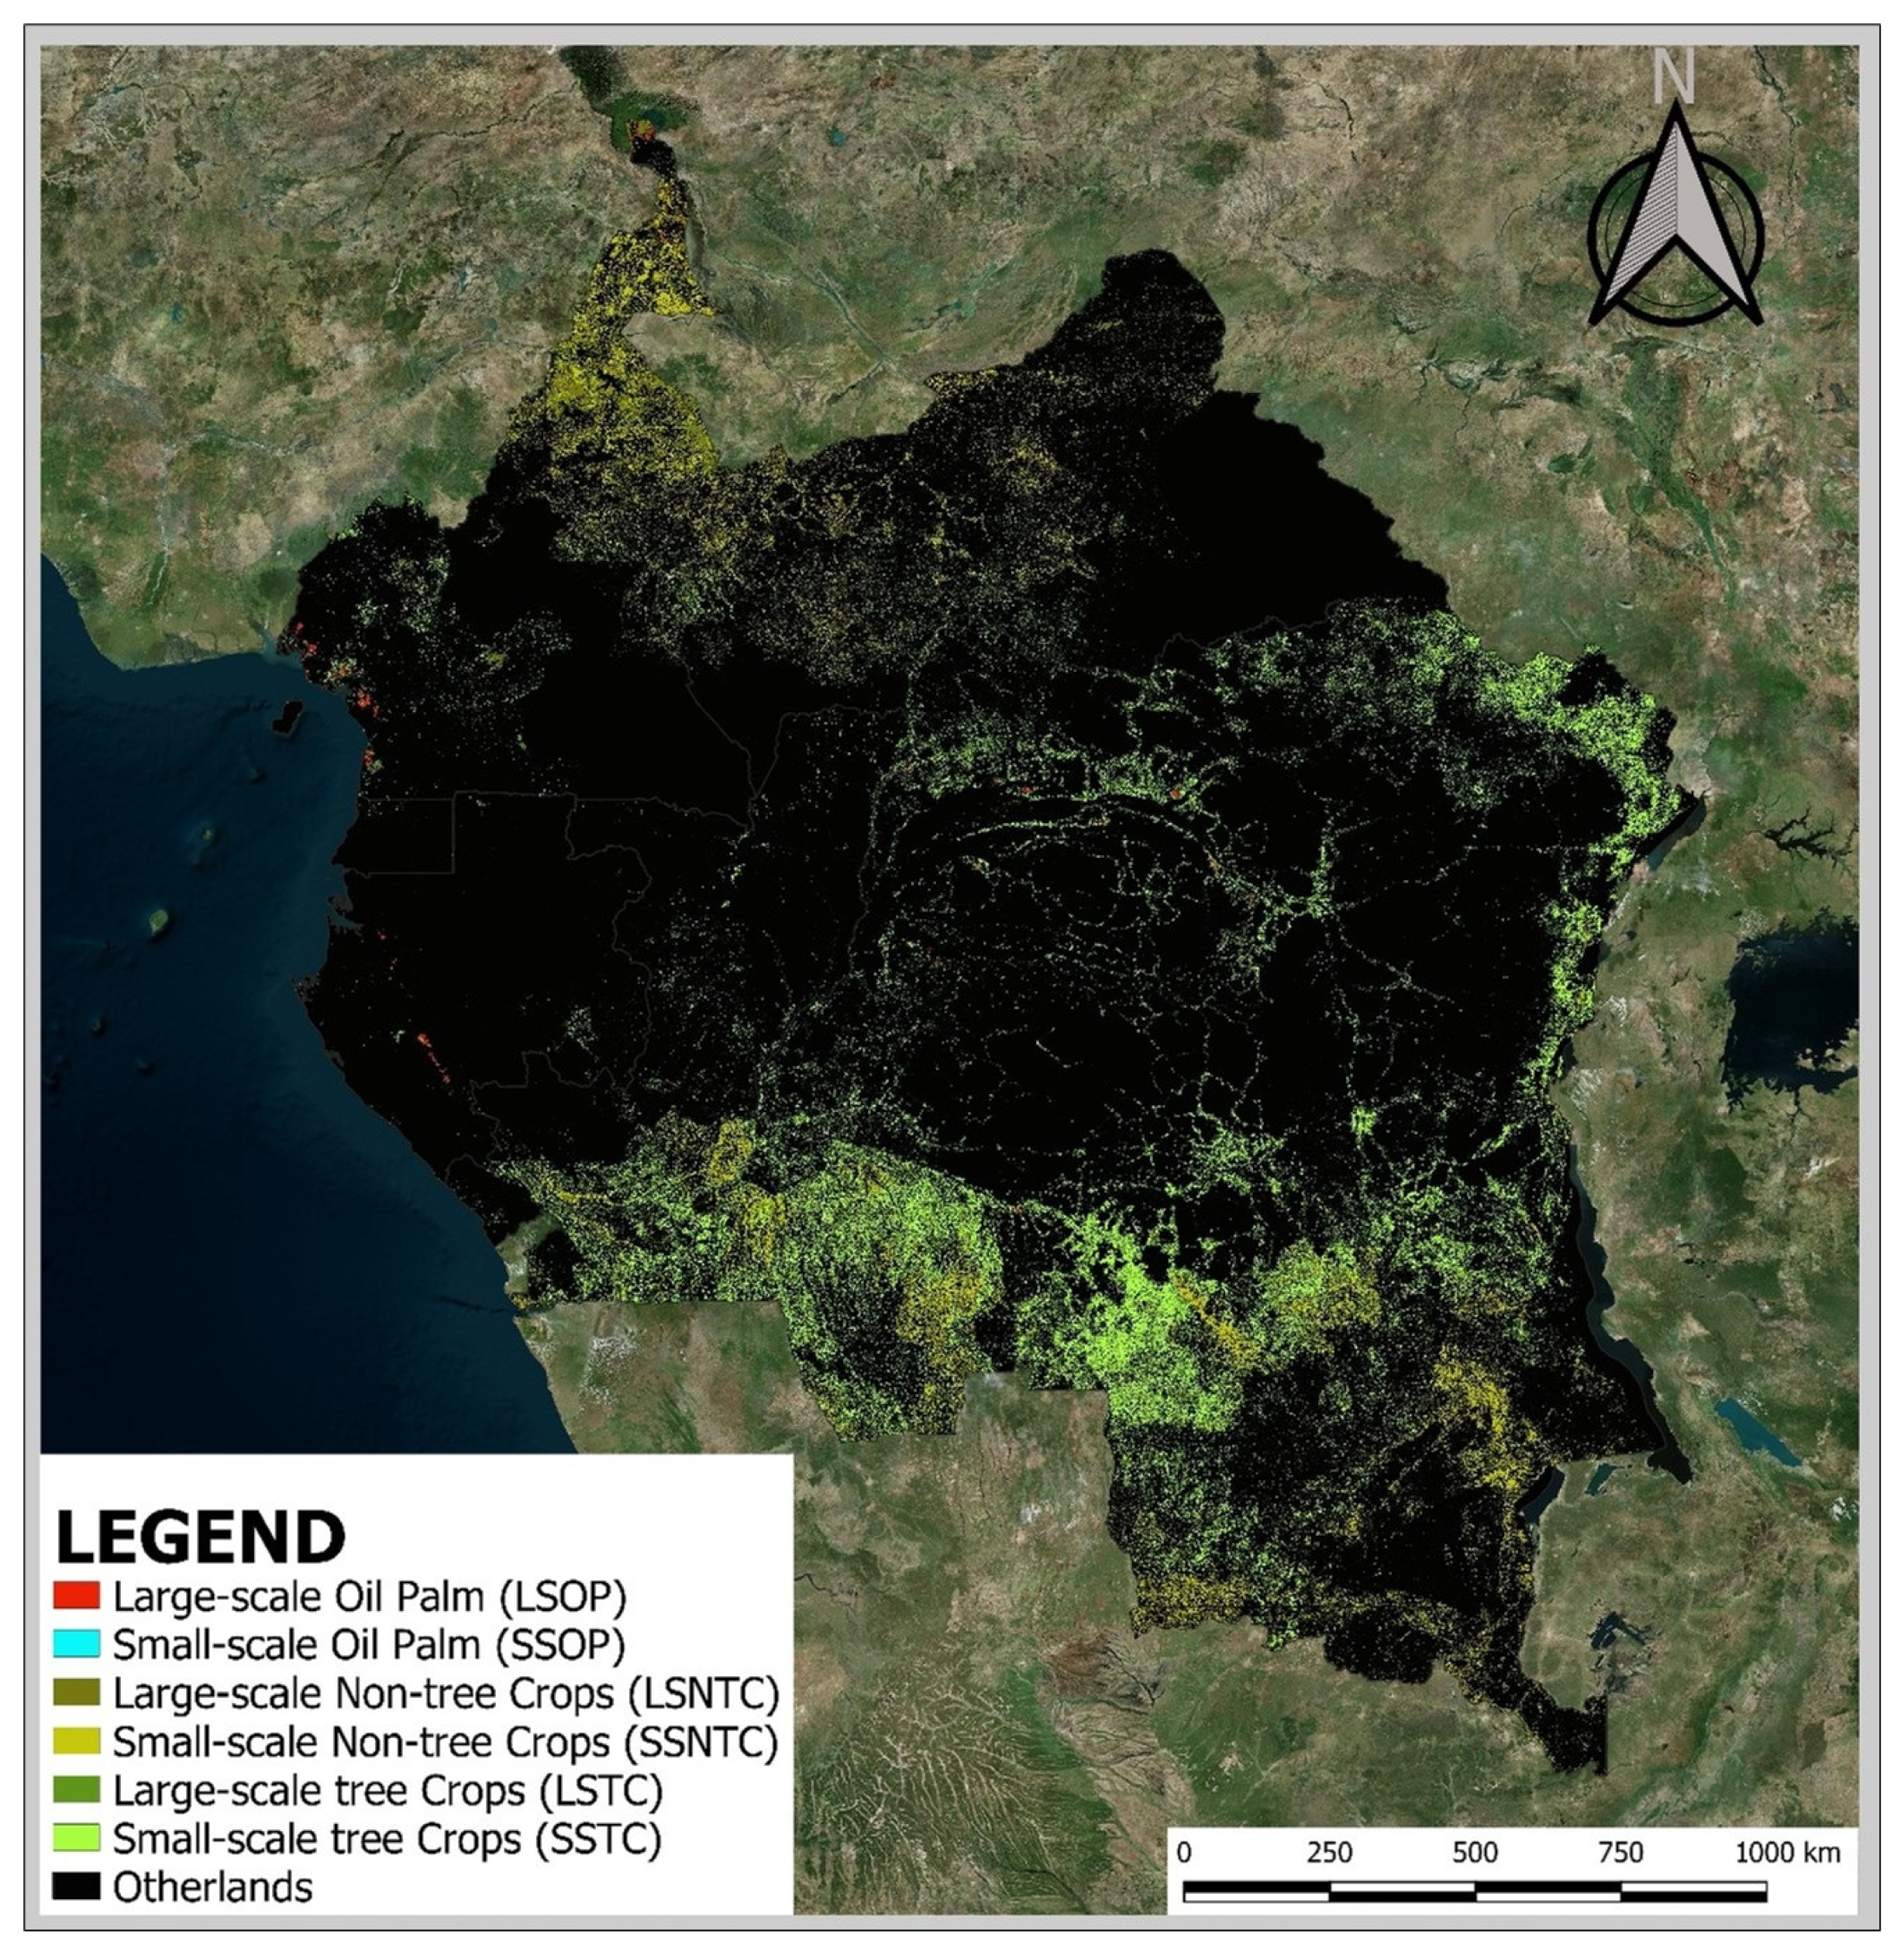
3.2. Area Coverage and Estimate for Central Africa
3.3. Crop Cover Characteristics
3.4. Country Level Assessment of Crop Cover
3.5. Assessment of Crop Encroachment into Forest
4. Discussion
4.1. The Results from the Study
4.2. Limitation of the Study
4.3. Implications for Forest Change and Biodiversity Conservation
4.4. Policy Recommendations That Integrate All Facets
5. Conclusions
Author Contributions
Funding
Data Availability Statement
Acknowledgments
Conflicts of Interest
Appendix A
Appendix B

Appendix C
Appendix C.1

| Tree Crop | Countries | Importance | Uses |
|---|---|---|---|
| Cocoa | Cameroon, Gabon, DRC | Significant export crop, especially in Cameroon. | Processed into cocoa butter, powder, and chocolate. |
| Coffee | Cameroon, DRC, CAR | Major cash crop, particularly Robusta coffee. | Beans processed into coffee. |
| Palm Oil | Cameroon, Gabon, DRC, CAR | Critical for domestic consumption and export. | Used in cooking, food products, cosmetics, and biofuel. |
| Rubber | Cameroon, Gabon, DRC | Key industrial crop. | Used in tires, footwear, and industrial products. |
| Banana and Plantain | Cameroon, DRC, Gabon, CAR | Staple food and important cash crops. | Consumed as staple food and in various forms. |
| Timber Trees | Cameroon, Gabon, DRC, CAR | Major export product from tropical forests. | Used in furniture, construction, and wood products. |
| Kola Nut | DRC, CAR, DRC | Culturally significant and widely used. | Chewed as a stimulant and in traditional medicine. |
| Citrus Fruits | Cameroon, DRC, Gabon | Important for local consumption and export. | Consumed fresh, in juices, and food products. |
| Mango | Cameroon, Gabon, DRC | Popular fruit crop with regional demand. | Consumed fresh, in juices, jams, and dried fruits. |
| Cashew | DRC, Cameroon | Growing cash crop with increasing demand. | Processed nuts and cashew apple for beverages. |
| Avocado | Cameroon, Gabon, DRC | Gaining popularity due to high demand. | Consumed fresh, in salads, and for oil production. |
| Shea | DRC, CAR | Source of shea butter; valuable in cosmetics and food. | Used in cosmetics, cooking, and traditional medicine. |
| Papaya | Cameroon, Gabon, DRC | Widely consumed fruit with export potential. | Consumed fresh, in juices, and as an ingredient. |
Appendix C.2
| Crop | Countries | Importance | Uses |
|---|---|---|---|
| Maize | All Central African countries | Staple food; major carbohydrate source. | Porridge, boiled, roasted, and animal feed. |
| Cassava | All Central African countries | Key staple; drought resistant. | Flour, garri, and thickening soups. |
| Yams | Cameroon, Gabon, DRC | Culturally significant; used in traditional ceremonies. | Boiled, fried, and fufu. |
| Rice | Wetter regions of Central Africa | Increasing staple and high imports. | Cooked grain accompanying sauces and stews. |
| Sorghum | Semi-arid regions of Central Africa | Drought-tolerant and critical in less fertile regions. | Local beers, porridges, and flour. |
| Millet | Drier parts of Central Africa | Essential for food security and drought resistance. | Porridge, traditional beers, and bread. |
| Peanuts | Throughout Central Africa | Significant protein and economic value. | Raw, roasted, soups, sauces, oil, and peanut butter. |
| Beans | All Central African countries | Important protein source. | Side or main dish, with rice or maize, and soups. |
| Soybeans | Cameroon, DRC | Rising importance for protein and oil. | Cooking oil, animal feed, and food ingredients. |
References
- Becker-Reshef, I.; Barker, B.; Whitcraft, A.; Oliva, P.; Mobley, K.; Justice, C.; Sahajpal, R. Crop Type Maps for Operational Global Agricultural Monitoring. Sci. Data 2023, 10, 172. [Google Scholar] [CrossRef] [PubMed]
- Food and Agriculture Organization of the United Nations (FAO). Crops and Livestock Products. Online Database. Available online: https://sdd.spc.int/dataset/df_crops (accessed on 2 February 2024).
- Blickensdörfer, L.; Schwieder, M.; Pflugmacher, D.; Nendel, C.; Erasmi, S.; Hostert, P. Mapping of Crop Types and Crop Sequences with Combined Time Series of Sentinel-1, Sentinel-2 and Landsat 8 Data for Germany. Remote Sens. Environ. 2022, 269, 112831. [Google Scholar] [CrossRef]
- Ewert, F.; Rounsevell, M.; Reginster, I.; Metzger, M.; Leemans, R. Future Scenarios of European Agricultural Land Use: I. Estimating Changes in Crop Productivity. Agric. Ecosyst. Environ. 2005, 107, 101–116. [Google Scholar] [CrossRef]
- Tilman, D.; Fargione, J.; Wolff, B.; D’antonio, C.; Dobson, A.; Howarth, R.; Schindler, D.; Schlesinger, W.H.; Simberloff, D.; Swackhamer, D. Forecasting Agriculturally Driven Global Environmental Change. Science 2001, 292, 281–284. [Google Scholar] [CrossRef] [PubMed]
- Gomiero, T. Alternative Land Management Strategies and Their Impact on Soil Conservation. Agriculture 2013, 3, 464–483. [Google Scholar] [CrossRef]
- Gomiero, T.; Pimentel, D.; Paoletti, M.G. Environmental Impact of Different Agricultural Management Practices: Conventional vs. Organic Agriculture. Crit. Rev. Plant Sci. 2011, 30, 95–124. [Google Scholar] [CrossRef]
- Gomiero, T.; Pimentel, D.; Paoletti, M.G. Is There a Need for a More Sustainable Agriculture? Crit. Rev. Plant Sci. 2011, 30, 6–23. [Google Scholar] [CrossRef]
- FAO. GIEWS Country Brief: Global Information and Early Warning System. 2024. Available online: https://www.fao.org/giews/en/ (accessed on 3 September 2024).
- Butler, S.J.; Vickery, J.A.; Norris, K. Farmland Biodiversity and the Footprint of Agriculture. Science 2007, 315, 381–384. [Google Scholar] [CrossRef]
- Geiger, F.; Bengtsson, J.; Berendse, F.; Weisser, W.W.; Emmerson, M.; Morales, M.B.; Ceryngier, P.; Liira, J.; Tscharntke, T.; Winqvist, C. Persistent Negative Effects of Pesticides on Biodiversity and Biological Control Potential on European Farmland. Basic Appl. Ecol. 2010, 11, 97–105. [Google Scholar] [CrossRef]
- Pendrill, F.; Gardner, T.A.; Meyfroidt, P.; Persson, U.M.; Adams, J.; Azevedo, T.; Bastos Lima, M.G.; Baumann, M.; Curtis, P.G.; De Sy, V.; et al. Disentangling the Numbers behind Agriculture-Driven Tropical Deforestation. Science 2022, 377, eabm9267. [Google Scholar] [CrossRef]
- Ickowitz, A.; Slayback, D.; Asanzi, P.; Nasi, R. Agriculture and Deforestation in the Democratic Republic of the Congo: A Synthesis of the Current State of Knowledge; Center for International Forestry Research: Bogor, Indonesia, 2015. [Google Scholar]
- Makana, J.-R.; Thomas, S.C. Impacts of Selective Logging and Agricultural Clearing on Forest Structure, Floristic Composition and Diversity, and Timber Tree Regeneration in the Ituri Forest, Democratic Republic of Congo. Biodivers. Conserv. 2006, 15, 1375–1397. [Google Scholar] [CrossRef]
- Shapiro, A.; d’Annunzio, R.; Desclée, B.; Jungers, Q.; Kondjo, H.K.; Iyanga, J.M.; Gangyo, F.; Nana, T.; Obame, C. Small scale agriculture continues to drive deforestation and degradation in fragmented forests in the Congo Basin (2015–2020). Land Use Policy 2023, 134, 106922. [Google Scholar] [CrossRef]
- Tyukavina, A.; Hansen, M.C.; Potapov, P.; Parker, D.; Okpa, C.; Stehman, S.V.; Kommareddy, I.; Turubanova, S. Congo Basin Forest Loss Dominated by Increasing Smallholder Clearing. Sci. Adv. 2018, 4, eaat2993. [Google Scholar] [CrossRef]
- Shapiro, A.C.; Aguilar-Amuchastegui, N.; Hostert, P.; Bastin, J.-F. Using Fragmentation to Assess Degradation of Forest Edges in Democratic Republic of Congo. Carbon Balance Manag. 2016, 11, 11. [Google Scholar] [CrossRef]
- World Wildlife Fund (WWF). Sustainable Agriculture in the Congo Basin: Challenges and Opportunities; WWF Report; World Wildlife Fund (WWF): Washington, DC, USA, 2019. [Google Scholar]
- Angelsen, A.; Martius, C.; De Sy, V.; Duchelle, A.E.; Larson, A.M.; Pham, T.T. REDD+ Projects and Their Impacts on Forests and Local Communities: A Review of the Evidence Base. Clim. Policy 2018, 18, 1–20. [Google Scholar]
- Meijaard, E.; Unus, N.; Ariffin, T.; Dennis, R.; Ancrenaz, M.; Wich, S.; Wunder, S.; Goh, C.S.; Sherman, J.; Ogwu, M.C.; et al. Apes and Agriculture. Front. Conserv. Sci. 2023, 4, 1225911. [Google Scholar] [CrossRef]
- Achille, L.S.; Zhang, K.; Anoma, C.J.K. Dynamics of Deforestation and Degradation of Forests in the Democratic Republic of Congo from 1990 to 2018. Open J. Ecol. 2021, 11, 451–461. [Google Scholar] [CrossRef]
- Tegegne, Y.T.; Lindner, M.; Fobissie, K.; Kanninen, M. Evolution of Drivers of Deforestation and Forest Degradation in the Congo Basin Forests: Exploring Possible Policy Options to Address Forest Loss. Land Use Policy 2016, 51, 312–324. [Google Scholar] [CrossRef]
- Feintrenie, L. Agro-Industrial Plantations in Central Africa, Risks and Opportunities. Biodivers. Conserv. 2014, 23, 1577–1589. [Google Scholar] [CrossRef]
- Ordway, E.M.; Naylor, R.L.; Nkongho, R.N.; Lambin, E.F. Oil Palm Expansion and Deforestation in Southwest Cameroon Associated with Proliferation of Informal Mills. Nat. Commun. 2019, 10, 114. [Google Scholar] [CrossRef]
- Kleinschroth, F.; Laporte, N.; Laurance, W.F.; Goetz, S.J.; Ghazoul, J. Road Expansion and Persistence in Forests of the Congo Basin. Nat. Sustain. 2019, 2, 628–634. [Google Scholar] [CrossRef]
- Laurance, W.F.; Sloan, S.; Weng, L.; Sayer, J.A. Estimating the Environmental Costs of Africa’s Massive Development Corridors. Curr. Biol. 2015, 25, 3202–3208. [Google Scholar] [CrossRef]
- Laurance, W.F.; Campbell, M.J.; Alamgir, M.; Mahmoud, M.I. Road Expansion and the Fate of Africa’s Tropical Forests. Front. Ecol. Evol. 2017, 5, 75. [Google Scholar] [CrossRef]
- Lhoest, S.; Fonteyn, D.; Daïnou, K.; Delbeke, L.; Doucet, J.-L.; Dufrêne, M.; Josso, J.-F.; Ligot, G.; Oszwald, J.; Rivault, E. Conservation Value of Tropical Forests: Distance to Human Settlements Matters More than Management in Central Africa. Biol. Conserv. 2020, 241, 108351. [Google Scholar] [CrossRef]
- Mosnier, A.; Havlik, P.; Obersteiner, M.; Aoki, K.; Schmid, E.; Fritz, S.; McCallum, I.; Leduc, S. Modeling Impact of Development Trajectories and a Global Agreement on Reducing Emissions from Deforestation on Congo Basin Forests by 2030. Environ. Resour. Econ. 2014, 57, 505–525. [Google Scholar] [CrossRef]
- Edwards, D.P.; Sloan, S.; Weng, L.; Dirks, P.; Sayer, J.; Laurance, W.F. Mining and the African Environment. Conserv. Lett. 2014, 7, 302–311. [Google Scholar] [CrossRef]
- Weng, L.; Boedhihartono, A.K.; Dirks, P.H.; Dixon, J.; Lubis, M.I.; Sayer, J.A. Mineral Industries, Growth Corridors and Agricultural Development in Africa. Glob. Food Secur. 2013, 2, 195–202. [Google Scholar] [CrossRef]
- Justice, C.; Wilkie, D.; Zhang, Q.; Brunner, J.; Donoghue, C. Central African Forests, Carbon and Climate Change. Clim. Res. 2001, 17, 229–246. [Google Scholar] [CrossRef]
- Laurance, W.F.; Alonso, A.; Lee, M.; Campbell, P. Challenges for Forest Conservation in Gabon, Central Africa. Futures 2006, 38, 454–470. [Google Scholar] [CrossRef]
- Mangaza, L.; Sonwa, D.J.; Batsi, G.; Ebuy, J.; Kahindo, J.-M. Building a Framework towards Climate-Smart Agriculture in the Yangambi Landscape, Democratic Republic of Congo (DRC). Int. J. Clim. Chang. Strateg. Manag. 2021, 13, 320–338. [Google Scholar] [CrossRef]
- Kpienbaareh, D.; Sun, X.; Wang, J.; Luginaah, I.; Bezner Kerr, R.; Lupafya, E.; Dakishoni, L. Crop Type and Land Cover Mapping in Northern Malawi Using the Integration of Sentinel-1, Sentinel-2, and Planetscope Satellite Data. Remote Sens. 2021, 13, 700. [Google Scholar] [CrossRef]
- Jiao, X.; McNairn, H.; Yekkehkhany, B.; Dingle Robertson, L.; Ihuoma, S. Integrating Sentinel-1 SAR and Sentinel-2 Optical Imagery with a Crop Structure Dynamics Model to Track Crop Condition. Int. J. Remote Sens. 2022, 43, 6509–6537. [Google Scholar] [CrossRef]
- Orynbaikyzy, A.; Gessner, U.; Conrad, C. Crop Type Classification Using a Combination of Optical and Radar Remote Sensing Data: A Review. Int. J. Remote Sens. 2019, 40, 6553–6595. [Google Scholar] [CrossRef]
- Rao, P.; Zhou, W.; Bhattarai, N.; Srivastava, A.K.; Singh, B.; Poonia, S.; Lobell, D.B.; Jain, M. Using Sentinel-1, Sentinel-2, and Planet Imagery to Map Crop Type of Smallholder Farms. Remote Sens. 2021, 13, 1870. [Google Scholar] [CrossRef]
- Masolele, R.N.; Marcos, D.; De Sy, V.; Abu, I.-O.; Verbesselt, J.; Reiche, J.; Herold, M. Mapping the Diversity of Land Uses Following Deforestation across Africa. Sci. Rep. 2024, 14, 1681. [Google Scholar] [CrossRef] [PubMed]
- Descals, A.; Wich, S.; Meijaard, E.; Gaveau, D.L.; Peedell, S.; Szantoi, Z. High Resolution Global Map of Smallholder and Industrial Closed-Canopy Oil Palm Plantations. Earth Syst. Sci. Data 2021, 13, 1211–1231. [Google Scholar] [CrossRef]
- Ozigis, M.S.; Wich, S.; Descals, A.; Szantoi, Z.; Meijaard, E. Mapping Oil Palm Plantations and Their Implications on Forest and Great Ape Habitat Loss in Central Africa? Remote Sens. Ecol. Conserv. 2024. early access. [Google Scholar] [CrossRef]
- Soliday, V.; Louat, A.; Miezi, E.; Fruth, B. Investigating the Impact of a Long-Term Research and Conservation Project on the Expansion of Land Use and Land Cover in a Remote Area of Central DRC. Trees For. People 2023, 11, 100368. [Google Scholar] [CrossRef]
- Potapov, P.; Turubanova, S.; Hansen, M.C.; Tyukavina, A.; Zalles, V.; Khan, A.; Song, X.-P.; Pickens, A.; Shen, Q.; Cortez, J. Global Maps of Cropland Extent and Change Show Accelerated Cropland Expansion in the Twenty-First Century. Nat. Food 2022, 3, 19–28. [Google Scholar] [CrossRef]
- Zanaga, D.; Van De Kerchove, R.; Daems, D.; De Keersmaecker, W.; Brockmann, C.; Kirches, G.; Wevers, J.; Cartus, O.; Santoro, M.; Fritz, S.; et al. ESA WorldCover 10 m 2021 v200 [Data set]. [CrossRef]
- Chen, B.; Jin, Y.; Brown, P. Automatic mapping of planting year for tree crops with Landsat satellite time series stacks. ISPRS J. Photogramm. Remote Sens. 2019, 151, 176–188. [Google Scholar] [CrossRef]
- Shammi, S.A.; Meng, Q. Use Time Series NDVI and EVI to Develop Dynamic Crop Growth Metrics for Yield Modeling. Ecol. Indic. 2021, 121, 107124. [Google Scholar] [CrossRef]
- Azhar, B.; Saadun, N.; Puan, C.L.; Kamarudin, N.; Aziz, N.; Nurhidayu, S.; Fischer, J. Promoting Landscape Heterogeneity to Improve the Biodiversity Benefits of Certified Palm Oil Production: Evidence from Peninsular Malaysia. Glob. Ecol. Conserv. 2015, 3, 553–561. [Google Scholar] [CrossRef]
- Descals, A.; Szantoi, Z.; Meijaard, E.; Sutikno, H.; Rindanata, G.; Wich, S. Oil Palm (Elaeis guineensis) Mapping with Details: Smallholder versus Industrial Plantations and Their Extent in Riau, Sumatra. Remote Sens. 2019, 11, 2590. [Google Scholar] [CrossRef]
- Oon, A.; Ngo, K.D.; Azhar, R.; Ashton-Butt, A.; Lechner, A.M.; Azhar, B. Assessment of ALOS-2 PALSAR-2L-Band and Sentinel-1 C-Band SAR Backscatter for Discriminating between Large-Scale Oil Palm Plantations and Smallholdings on Tropical Peatlands. Remote Sens. Appl. Soc. Environ. 2019, 13, 183–190. [Google Scholar] [CrossRef]
- Olofsson, P.; Foody, G.M.; Herold, M.; Stehman, S.V.; Woodcock, C.E.; Wulder, M.A. Good Practices for Estimating Area and Assessing Accuracy of Land Change. Remote Sens. Environ. 2014, 148, 42–57. [Google Scholar] [CrossRef]
- Giri, C.; Zhu, Z.; Reed, B. A Comparative Analysis of the Global Land Cover 2000 and MODIS Land Cover Data Sets. Remote Sens. Environ. 2005, 94, 123–132. [Google Scholar] [CrossRef]
- Ronneberger, O.; Fischer, P.; Brox, T. U-Net: Convolutional Networks for Biomedical Image Segmentation. In Proceedings of the Medical Image Computing and Computer-Assisted Intervention? MICCAI 2015: 18th International Conference, Munich, Germany, 5–9 October 2015; Part 2015. Volume II, pp. 234–241. [Google Scholar]
- Congalton, R.G. A Review of Assessing the Accuracy of Classifications of Remotely Sensed Data. Remote Sens. Environ. 1991, 37, 35–46. [Google Scholar] [CrossRef]
- Amede, T.; Lemenih, M. The Highland Mixed Farming System of Africa: Diversifying Livelihoods in Fragile Ecosystems. In Farming Systems and Food Security in Africa; Routledge: London, UK, 2019; pp. 248–281. [Google Scholar]
- Jabbar, M. Energy and the Evolution of Farming Systems: The Potential of Mixed Farming in the Moist Savannah of Sub-Saharan Africa. Outlook Agric. 1996, 25, 27–36. [Google Scholar] [CrossRef]
- Kassam, A.; Kueneman, E.; Lott, R.; Friedrich, T.; Lutaladio, N.; Norman, D.; Bwalya, M.; Poisot, A.-S.; Mkomwa, S. The Cereal-Root Crop Mixed Farming System: A Potential Bread Basket Transitioning to Sustainable Intensification. In Farming Systems and Food Security in Africa; Routledge: London, UK, 2019; pp. 214–247. [Google Scholar]
- Sumberg, J. Mixed Farming in Africa: The Search for Order, the Search for Sustainability. Land Use Policy 1998, 15, 293–317. [Google Scholar] [CrossRef]
- Schut, M.; van Asten, P.; Okafor, C.; Hicintuka, C.; Mapatano, S.; Nabahungu, N.L.; Kagabo, D.; Muchunguzi, P.; Njukwe, E.; Dontsop-Nguezet, P.M. Sustainable Intensification of Agricultural Systems in the Central African Highlands: The Need for Institutional Innovation. Agric. Syst. 2016, 145, 165–176. [Google Scholar] [CrossRef]
- Vanlauwe, B.; Pypers, P.; Birachi, E.A.; Nyagaya, M.; Schagen, B.V.; Huising, J.; Ouma, E.A.; Blomme, G.; van Asten, P.J. Integrated Soil Fertility Management in Central Africa: Experiences of the Consortium for Improving Agriculture Based Livelihoods in Central Africa (CIALCA); International Center for Tropical Agriculture: Cali, Colombia, 2012. [Google Scholar]
- Daryanto, S.; Fu, B.; Zhao, W.; Wang, S.; Jacinthe, P.-A.; Wang, L. Ecosystem Service Provision of Grain Legume and Cereal Intercropping in Africa. Agric. Syst. 2020, 178, 102761. [Google Scholar] [CrossRef]
- Aweto, A.O. Shifting Cultivation and Secondary Succession in the Tropics; CABI: Wallingford, UK, 2012. [Google Scholar]
- Bjornlund, V.; Bjornlund, H.; Van Rooyen, A.F. Why Agricultural Production in Sub-Saharan Africa Remains Low Compared to the Rest of the World? A Historical Perspective. Int. J. Water Resour. Dev. 2020, 36 (Suppl. S1), S20–S53. [Google Scholar] [CrossRef]
- Justus, O.; Knerr, B.; Owuor, G.; Ouma, E. Agricultural Commercialization and Household Food Security: The Case of Smallholders in Great Lakes Region of Central Africa. In Proceedings of the International Association of Agricultural Economists (IAAE) 2015 Conference, Milan, Italy, 9–14 August 2015. [Google Scholar]
- Mwaniki, A. Achieving Food Security in Africa: Challenges and Issues. UN Office of the Special Advisor on Africa (OSAA). 2006. Available online: https://www.foretiafoundation.org/wp-content/uploads/2013/06/african-children1.pdf (accessed on 3 September 2024).
- Timberlake, J.; Chidumayo, E.; Sawadogo, L. Distribution and Characteristics of African Dry Forests and Woodlands. In The Dry Forests and Woodlands of Africa; Routledge: London, UK, 2010; pp. 11–41. [Google Scholar]
- Braun, A.; Hochschild, V. A SAR-Based Index for Landscape Changes in African Savannas. Remote Sens. 2017, 9, 359. [Google Scholar] [CrossRef]
- Holechek, J.L.; Cibils, A.F.; Bengaly, K.; Kinyamario, J.I. Human Population Growth, African Pastoralism, and Rangelands: A Perspective. Rangel. Ecol. Manag. 2017, 70, 273–280. [Google Scholar] [CrossRef]
- Kapiri, M.M.; Mahamba, J.A.; Mulondi, G.K.; Sahani, W.M. Assessment of Land Use and Land Cover Changes (LULC) in the North Talihya River Watershed (Lubero Territory, Eastern DR Congo). J. Geosci. Environ. Prot. 2023, 11, 189–210. [Google Scholar] [CrossRef]
- Moïse, M.K.; Ozer, P.; Gloire, M.K.; Jonathan, A.M.; Isaac, U.D.; Muyisa, M.K.; Hintou, K.M.; Walere, M.S. Dynamics of Land Use and Land Cover Change in the South Talihya Watershed North Kivu, Eastern Democratic Republic of Congo. Indones. J. Soc. Environ. Issues IJSEI 2022, 3, 179–193. [Google Scholar] [CrossRef]
- Nkendah, R. The Informal Cross-Border Trade of Agricultural Commodities between Cameroon and Its CEMAC’S Neighbours. In Proceedings of the NSF/AERC/IGC Conference, Mombasa, Kenya, 4 December 2010. [Google Scholar]
- ESA CCI. European Space Agency Climate Change Initiative Landcover; ESA CCI: Paris, France, 2017. [Google Scholar]
- Shen, W.-f.; Tang, H.-w.; Li, J.-b.; Li, X.; Chen, S. Multimodal Data Fusion for Supervised Learning-Based Identification of USP7 Inhibitors: A Systematic Comparison. J. Cheminform. 2023, 15, 5. [Google Scholar] [CrossRef]
- Megevand, C.; Mosnier, A. Deforestation Trends in the Congo Basin: Reconciling Economic Growth and Forest Protection; World Bank Publications: Washington, DC, USA, 2013. [Google Scholar]
- Bakehe, N.P. The Impact of Agricultural Productivity on Deforestation in Central Africa; African Economic Research Consortium: Nairobi, Kenya, 2023. [Google Scholar]
- Majambu, E.; Demaze, M.T.; Ongolo, S. The Politics of Forest Governance Failure in the Democratic Republic of Congo (DRC): Lessons from 35 Years of Political Rivalries. Int. For. Rev. 2021, 23, 321–337. [Google Scholar] [CrossRef]
- Abraham, M.; Pingali, P. Transforming Smallholder Agriculture to Achieve; Springer: Cham, Switzerland, 2020. [Google Scholar]
- Pimbert, M.P. Transforming Food and Agriculture: Competing Visions and Major Controversies. Mondes Dev. 2022, 199–200, 361–384. [Google Scholar] [CrossRef]
- Searchinger, T.; Waite, R.; Hanson, C.; Ranganathan, J.; Dumas, P.; Matthews, E.; Klirs, C. Creating a Sustainable Food Future: A Menu of Solutions to Feed Nearly 10 Billion People by 2050; Final report; World Resources Institute: Washington, DC, USA, 2019. [Google Scholar]
- Phelps, J.; Carrasco, L.R.; Webb, E.L.; Koh, L.P.; Pascual, U. Agricultural Intensification Escalates Future Conservation Costs. Proc. Natl. Acad. Sci. USA 2013, 110, 7601–7606. [Google Scholar] [CrossRef]
- Terasaki Hart, D.E.; Yeo, S.; Almaraz, M.; Beillouin, D.; Cardinael, R.; Garcia, E.; Kay, S.; Lovell, S.T.; Rosenstock, T.S.; Sprenkle-Hyppolite, S.; et al. Priority Science Can Accelerate Agroforestry as a Natural Climate Solution. Nat. Clim. Change 2023, 13, 1179–1190. [Google Scholar] [CrossRef]
- Mbow, C.; Van Noordwijk, M.; Luedeling, E.; Neufeldt, H.; Minang, P.A.; Kowero, G. Agroforestry Solutions to Address Food Security and Climate Change Challenges in Africa. Curr. Opin. Environ. Sustain. 2014, 6, 61–67. [Google Scholar] [CrossRef]
- Roupsard, O.; Audebert, A.; Ndour, A.P.; Clermont-Dauphin, C.; Agbohessou, Y.; Sanou, J.; Koala, J.; Faye, E.; Sambakhe, D.; Jourdan, C.; et al. How Far Does the Tree Affect the Crop in Agroforestry? New Spatial Analysis Methods in a Faidherbia Parkland. Agric. Ecosyst. Environ. 2020, 296, 106928. [Google Scholar] [CrossRef]


| Classes | OL | LSOP | SSOP | LSNTC | SSNTC | LSTC | SSTC | Total | UA | PA |
|---|---|---|---|---|---|---|---|---|---|---|
| OL | 36,488 | 27 | 25 | 163 | 1557 | 65 | 2867 | 41,192 | 0.99 | 0.89 |
| LSOP | 20 | 455 | 34 | 0 | 0 | 6 | 0 | 515 | 0.91 | 0.88 |
| SSOP | 2 | 12 | 67 | 0 | 0 | 0 | 0 | 81 | 0.52 | 0.83 |
| LSNTC | 83 | 2 | 0 | 68 | 9 | 4 | 4 | 170 | 0.18 | 0.40 |
| SSNTC | 353 | 1 | 0 | 150 | 415 | 9 | 144 | 1072 | 0.21 | 0.39 |
| LSTC | 10 | 2 | 2 | 2 | 0 | 135 | 2 | 153 | 0.61 | 0.88 |
| SSTC | 86 | 0 | 0 | 0 | 5 | 4 | 165 | 260 | 0.05 | 0.63 |
| Total | 37,042 | 499 | 128 | 383 | 1986 | 223 | 3182 | 43,443 |
| Crop Cover Classes | Adjusted Area (m2) | 95% C.I. |
|---|---|---|
| Other Land | 3,555,997.91 | 8011.09 |
| Large-scale Oil Palm | 2811.80 | 57.24 |
| Small-scale Oil Palm | 1385.72 | 83.38 |
| Large-scale Non-tree Crops | 20,152.83 | 1194.84 |
| Small-scale Non-tree Crops | 164,823.92 | 4223.87 |
| Large-scale Tree Crops | 7436.12 | 279.72 |
| Small-scale Tree Crops | 293,248.81 | 12,694.77 |
| Classes | Adjusted Area (km2) | Confidence Interval (C.I.) | ||||||||||
|---|---|---|---|---|---|---|---|---|---|---|---|---|
| Congo | CAR | Gabon | DRC | Cam | Eq.G | Congo | CAR | Gabon | DRC | Cam | Eq. G | |
| OL | 318,680 | 576,274 | 262,360 | 1,967,400 | 404,354.85 | 26,885.65 | 1383.2 | 4470.73 | 1045.72 | 5593.59 | 2852.61 | 547.77 |
| LSOP | 10 | - | 400 | 700 | 1646.38 | - | 1.52 | - | 34.69 | 26.43 | 36.55 | - |
| SSOP | 50 | - | 130 | 600 | 639.85 | - | - | - | 25.48 | 158.71 | 44.41 | - |
| LSNTC | 350 | 1393 | 120 | 2200 | 16,051.43 | 71.66 | 61.39 | 275.49 | 35 | 185.96 | 1762.21 | - |
| SSNTC | 7510 | 32,992 | 40 | 90,500 | 33,830.49 | - | 936.82 | 2020 | 7.3 | 3191.73 | 1691.57 | - |
| LSTC | 0 | 530 | 180 | 4000 | 1818.80 | - | - | 162.28 | 17.82 | 296.3 | 78.77 | - |
| SSTC | 13,100 | 8396 | 790 | 263,800 | 7163.49 | - | 2818.67 | 1299.93 | 244.77 | 14,646.35 | 625.89 | - |
Disclaimer/Publisher’s Note: The statements, opinions and data contained in all publications are solely those of the individual author(s) and contributor(s) and not of MDPI and/or the editor(s). MDPI and/or the editor(s) disclaim responsibility for any injury to people or property resulting from any ideas, methods, instructions or products referred to in the content. |
© 2025 by the authors. Licensee MDPI, Basel, Switzerland. This article is an open access article distributed under the terms and conditions of the Creative Commons Attribution (CC BY) license (https://creativecommons.org/licenses/by/4.0/).
Share and Cite
Ozigis, M.S.; Wich, S.; Abdolshahnejad, M.; Descals, A.; Szantoi, Z.; Sheil, D.; Meijaard, E. Characterizing Crop Distribution and the Impact on Forest Conservation in Central Africa. Remote Sens. 2025, 17, 1958. https://doi.org/10.3390/rs17111958
Ozigis MS, Wich S, Abdolshahnejad M, Descals A, Szantoi Z, Sheil D, Meijaard E. Characterizing Crop Distribution and the Impact on Forest Conservation in Central Africa. Remote Sensing. 2025; 17(11):1958. https://doi.org/10.3390/rs17111958
Chicago/Turabian StyleOzigis, Mohammed S., Serge Wich, Mahsa Abdolshahnejad, Adrià Descals, Zoltan Szantoi, Douglas Sheil, and Erik Meijaard. 2025. "Characterizing Crop Distribution and the Impact on Forest Conservation in Central Africa" Remote Sensing 17, no. 11: 1958. https://doi.org/10.3390/rs17111958
APA StyleOzigis, M. S., Wich, S., Abdolshahnejad, M., Descals, A., Szantoi, Z., Sheil, D., & Meijaard, E. (2025). Characterizing Crop Distribution and the Impact on Forest Conservation in Central Africa. Remote Sensing, 17(11), 1958. https://doi.org/10.3390/rs17111958