1. Introduction
Over recent decades, the emergence and advancement of Digital Radio Frequency Memory (DRFM) technology have enabled jammers to generate active deceptive signals highly coherent with radar-transmitted waveforms, posing significant challenges to accurate target identification [
1,
2,
3]. By leveraging diverse modulation schemes and flexible parameter configurations, jammers further exacerbate the difficulty of radar recognition. To counter such threats, researchers have explored anti-jamming strategies from multiple dimensions. However, whether focusing on signal-level countermeasures [
4] or radar network-layer defenses [
5], the core objective remains focused on improving target identification accuracy. In real-world electronic warfare scenarios, rapidly and effectively distinguishing jamming signals is critical to maintaining operational superiority.
In studies on DRFM repeater jamming, Hill identified that DRFM jammers introduce harmonic components during signal interception and storage due to sampling and quantization processes [
6]. He pioneered the use of harmonic effects from sampling quantization as a means for jamming detection. Lu further developed a theoretical harmonic model for DRFM deception signals and validated the regularity of harmonic components using the fractional Fourier transform (FRFT) [
7], clarifying their correlation with jammer parameters. Zhang theoretically confirmed the harmonic effects induced by DRFM sampling quantization and demonstrated the distinct differences between jamming signals and target echoes through time–frequency domain analysis [
8]. Ding proposed a novel detection method by extracting singular values of jamming signals [
9], normalizing them into histogram features (e.g., variance, skewness, entropy, and kurtosis), and training an SVM classifier using these feature vectors. Li employed singular spectrum analysis (SSA) and introduced a constant false alarm rate (CFAR) detection framework [
10]. Conversely, the aforementioned studies predominantly focus on the harmonic effects of DRFM-based jammers. In addition to utilizing the harmonic effects of DRFM jammers to counteract active deception jamming, Hao proposed a dense false target jamming recognition method based on time–frequency atomic decomposition theory and an SVM. The extracted time–frequency parameters of Gabor atoms can effectively characterize the intrinsic features of both target jamming and dense false target jamming [
11]. Dong introduced a blind source separation method based on tensor decomposition (TD-BSS) to suppress mainlobe DRFM jamming, enabling the separation of target echo signals and jamming signals [
12]. However, both studies share similar limitations: Traditional time–frequency domain analysis struggles to extract frequency–phase coupling features of DRFM deception jamming signals. Since jammers cannot fully simulate the entire radar signal transmission process, nonlinear phase distortion during modulation cannot be accurately characterized, leading to differences in frequency–phase coupling between deceptive jamming signals and genuine target echoes. Moreover, in low signal-to-noise ratio (SNR) scenarios, the time–frequency feature resolution deteriorates sharply. Methods based on the short-time Fourier transform (STFT) or the Wigner–Ville distribution fail to distinguish time–frequency energy distribution differences between genuine target echoes and jamming signals, resulting in increased false alarms and reduced detection probability. With the continuous advancement of deep learning models, an increasing number of studies have applied such models to signal recognition tasks. Yang proposed a neural network architecture based on a hybrid attention module (HAM) and transformer to identify DRFM deception jamming, achieving a balance between accuracy and computational complexity [
13]. Kong designed a deep convolutional separation network with a dilation mechanism that was inspired by the principle of blind source separation. This approach expands the receptive field of the convolution and enhances the network’s ability to capture the temporal dependencies of the input signals [
14]. Although deep learning techniques have demonstrated their effectiveness in signal recognition, most existing methods still suffer from the following limitations: (1) low classification accuracy under low-JSR conditions and (2) a large number of network parameters, which hinder their deployment on resource-constrained mobile and embedded devices.
To address these issues, this study introduces bispectral analysis for distinguishing genuine target echoes and jamming signals. The bispectrum retains phase information, extracts phase coupling characteristics, and suppresses Gaussian noise, enabling the extraction of subtle features that traditional methods overlook. Among the existing research methods, Li compared the distinct characteristics of target echoes and deception jamming in terms of higher-order cumulants and the bispectrum. Simulation results revealed notable differences between target echoes and deception jamming in these higher-order statistical domains [
15]. However, the study directly processed the bispectral data, which resulted in relatively high computational complexity. To reduce the computational complexity of the algorithm, it is advisable to consider applying dimensionality reduction to the bispectrum. Existing research shows that a dimensionality-reduced bispectrum performs well under harmonic conditions [
16]. To address these limitations, this paper proposes an innovative solution by pioneering the application of higher-order statistical analysis (HOSA) to deception jamming detection, particularly HOSA. HOSA excels in capturing phase information, phase coupling, and non-Gaussian characteristics while maintaining phase preservation and scale invariance, significantly enhancing signal processing robustness.
As a powerful tool in signal processing, a higher-order spectrum (HOS) can intuitively reveal the frequency and phase coupling relationships between harmonic components in signals. In recent years, it has demonstrated broad application potential in fields such as image processing and object recognition. Particularly, the bispectrum—the lowest-order HOS—offers minimal computational complexity while retaining all the advantageous properties of HOS, including complete suppression of Gaussian noise interference. This makes bispectral analysis the preferred choice in HOS applications. However, despite being the lowest-order HOS, the bispectrum is inherently a two-dimensional function due to its computational formulation. Direct computation imposes a significant computational burden, making it impractical for real-time monitoring requirements. To address computational complexity, Li [
17] proposed an innovative approach by extracting only the diagonal slices of the bispectrum for analysis, thereby reducing the computational load. Meng [
18] adopted another method, leveraging diagonal integration to compress the originally high-dimensional bispectral data into two dimensions. Both strategies enhance efficiency and lower algorithmic complexity for specific applications, demonstrating practical utility. A critical consideration lies in preserving the intrinsic discriminative features between genuine and deceptive targets within the bispectral space during dimensionality reduction, thereby avoiding information obscuration caused by compression. The core challenge resides in designing dimensionality reduction mapping functions that maintain the nonlinear separability of target categories—originally embedded in the full-dimensional bispectrum—within the compressed feature space.
To address the above challenges, this study proposes a difference-guided dimensionality reduction mechanism—bispectral projection based on diagonal integration paths. By constraining the alignment between the integration path and the principal components of signal nonlinear coupling, this method ensures that dimensionality reduction not only compresses data dimensions but also directionally enhances discriminative features between genuine and deceptive targets. Specifically, DRFM deception jamming manifests in the bispectral domain as phase coupling distortion at specific frequency points. The diagonal integration path accumulates these distortion features through integration along interference-sensitive directions, thereby amplifying inter-class separability in the low-dimensional space.
This study proposes a diagonal integrated bispectrum (DIB)-based DRFM deception jamming detection method, leveraging the unique advantages of bispectral analysis in extracting nonlinear phase coupling through third-order cumulants while inherently suppressing Gaussian noise due to the vanishing third-order cumulants of Gaussian processes. By computing the bispectrum of the received signal, the method captures essential discriminative features between jamming and genuine targets, particularly under low-SNR conditions. To address the computational complexity of high-dimensional bispectral data, a dimensionality reduction strategy is implemented via diagonal integration along the bispectral sub-diagonal, which not only compresses the feature space but also concentrates the nonlinear distortion patterns induced by DRFM artifacts. Two discriminative metrics—Diagonal Integrated Bispectrum Relative Peak Height (DIBRP) and Diagonal Integrated Bispectrum Approximate Entropy (DIBAE)—are subsequently extracted to quantify energy concentration and dynamic complexity, respectively. These features are fed into a polynomial kernel support vector machine (SVM) to resolve nonlinear separability challenges in the compressed feature space. The framework achieves robust detection performance by directionally amplifying DRFM-specific phase coupling signatures, enabling reliable discrimination even in noise-dominated environments, as validated through simulations and field-measured data experiments.
The structure of this paper is organized as follows:
Section 2 constructs a signal model of DRFM deceptive jamming, serving as the theoretical foundation of this study.
Section 3 provides a systematic explanation of bispectral analysis, introduces the symmetry properties of the bispectrum, and demonstrates the rationality and superiority of the bispectral dimensionality reduction method employed in this work.
Section 4 investigates the differences between DRFM deceptive jamming and genuine target echoes in the diagonal integrated bispectrum and further analyzes the theoretical basis and discriminative effectiveness of the proposed features.
Section 5 validates the proposed method through a series of simulation experiments, covering performance evaluations under various jamming scenarios. A comparative analysis with existing methods is conducted to verify the superiority and robustness of the proposed approach. Moreover, experiments based on measured data are designed across multiple datasets with different types of jamming to further demonstrate the practical applicability of the algorithm. Finally,
Section 6 summarizes the main conclusions of this work.
2. DRFM-Based Deception Jamming Signal Model
In this section, a signal model for deception jamming based on DRFM is constructed. The variations in the central frequency and chirp rate of the jamming signal are analyzed, providing a foundation for subsequent research. This facilitates the use of bispectral analysis to characterize the differences between deception jamming signals and real target echoes.
Given that pulse compression technology effectively addresses the trade-off between detection range and range resolution in conventional pulse radar systems, this study will consistently adopt the commonly used linear frequency modulation (LFM) signal for subsequent analyses. Let the transmitted radar signal have a bandwidth of
, a pulse width of
, a chirp rate of
, and a pulse repetition period of
, with a central frequency of
. The transmitted radar signal can be expressed in terms of these parameters as follows [
8]:
Once the DRFM receiver successfully intercepts the radar signal, it first performs frequency conversion, modulating the signal to the receiver’s intermediate frequency (IF). Subsequent modulation is then carried out in the IF domain. Let the intermediate frequency of the DRFM receiver be
. After down-conversion, the received signal at the DRFM receiver can be expressed as follows:
Assuming that the quantization bit number of the jammer receiver during sampling quantization is
and it undergoes
bit quantization, according to reference [
19], the signal after
bit quantization can be expressed as
A DRFM jammer modulates signals that have undergone phase quantization by introducing false Doppler shifts and time delays. The signal is then upconverted to restore carrier information before being transmitted. The emitted signal can be expressed as
In the above equation,
represents the false Doppler shift, while
is a time delay function. It is typically assumed that
follows a linear function; however, in practical DRFM jammers, it is often approximated using a staircase function. Consequently,
is quantized into a piecewise continuous time function denoted as
. Based on this, a mathematical model for the deceptive jamming signal generated by a DRFM jammer can be established.
Thus, after down-conversion, the radar receiver detects the deceptive jamming LFM signal retransmitted by the DRFM jammer, which can be expressed as follows:
After receiving the deception signal retransmitted by the DRFM jammer at the radar receiver, it is necessary to further analyze the spectral characteristics of the signal. Therefore, for ease of representation, the above equation can be rewritten as
Let the primary term be denoted as
, and the secondary term is denoted as
. Performing a Fourier transform on the secondary term yields
. Given the complexity of the primary term, a fractional Fourier transform is considered for its analysis [
20].
According to the principles of the Fourier transform, the spectrum of the product of
and
in the time domain corresponds to the convolution of their respective spectra,
and
, in the frequency domain. Considering the frequency-domain representation of
, this operation results in an
-to-
spectral shift. Under the condition of
, we obtain
where
represents the spectrum of
. The spectrum of the interference signal
, as can be seen from the above equation, is composed of multiple distinct components.
The component of when lies within the same frequency band as the genuine target echo is important. Therefore, the component of when can play a deceptive role. Thus, the component of when is referred to as the main term. Aside from the main term, the interference spectrum still contains components for , which are referred to as harmonic components or interference spurious terms. As observed from the frequency spectrum analysis of in Equation (9), the amplitude term decreases with increasing m, while the bandwidth of the spurious terms increases accordingly. The intensity of the spurious terms is primarily determined by , and it undergoes attenuation by a factor of . These harmonic components, exhibiting a certain regularity, provide the potential for distinguishing between true and false targets.
Based on the above analysis, the following conclusion can be drawn: the frequency information of both the main and spurious components in the deceptive jamming signal can be calculated. For clarity, let
denote the modulation frequency of the harmonic components under a quantization bit depth of
and
, and let
represent the center frequency of the harmonic components under the same quantization condition. In practical applications, since the towing rate is generally on the order of
[
7],
is approximately equal to 1. Thus, the following equation holds [
7]:
In the above equation, . Based on this equation, the center frequency and modulation frequency of both the main component and harmonic components in the jamming signal can be uniquely determined. Specifically, the center frequency depends on two variables, and , indicating that the center frequency of the interference harmonics is related to the quantization bit depth of the jammer. Here, is given by ,where represents the down-conversion frequency of the jammer and corresponds to the Doppler frequency of the target. Similarly, the modulation frequency also depends on two variables, and , meaning that the modulation frequency of the interference harmonics is determined by both the quantization bit depth of the jammer and the modulation frequency of the radar-transmitted signal.
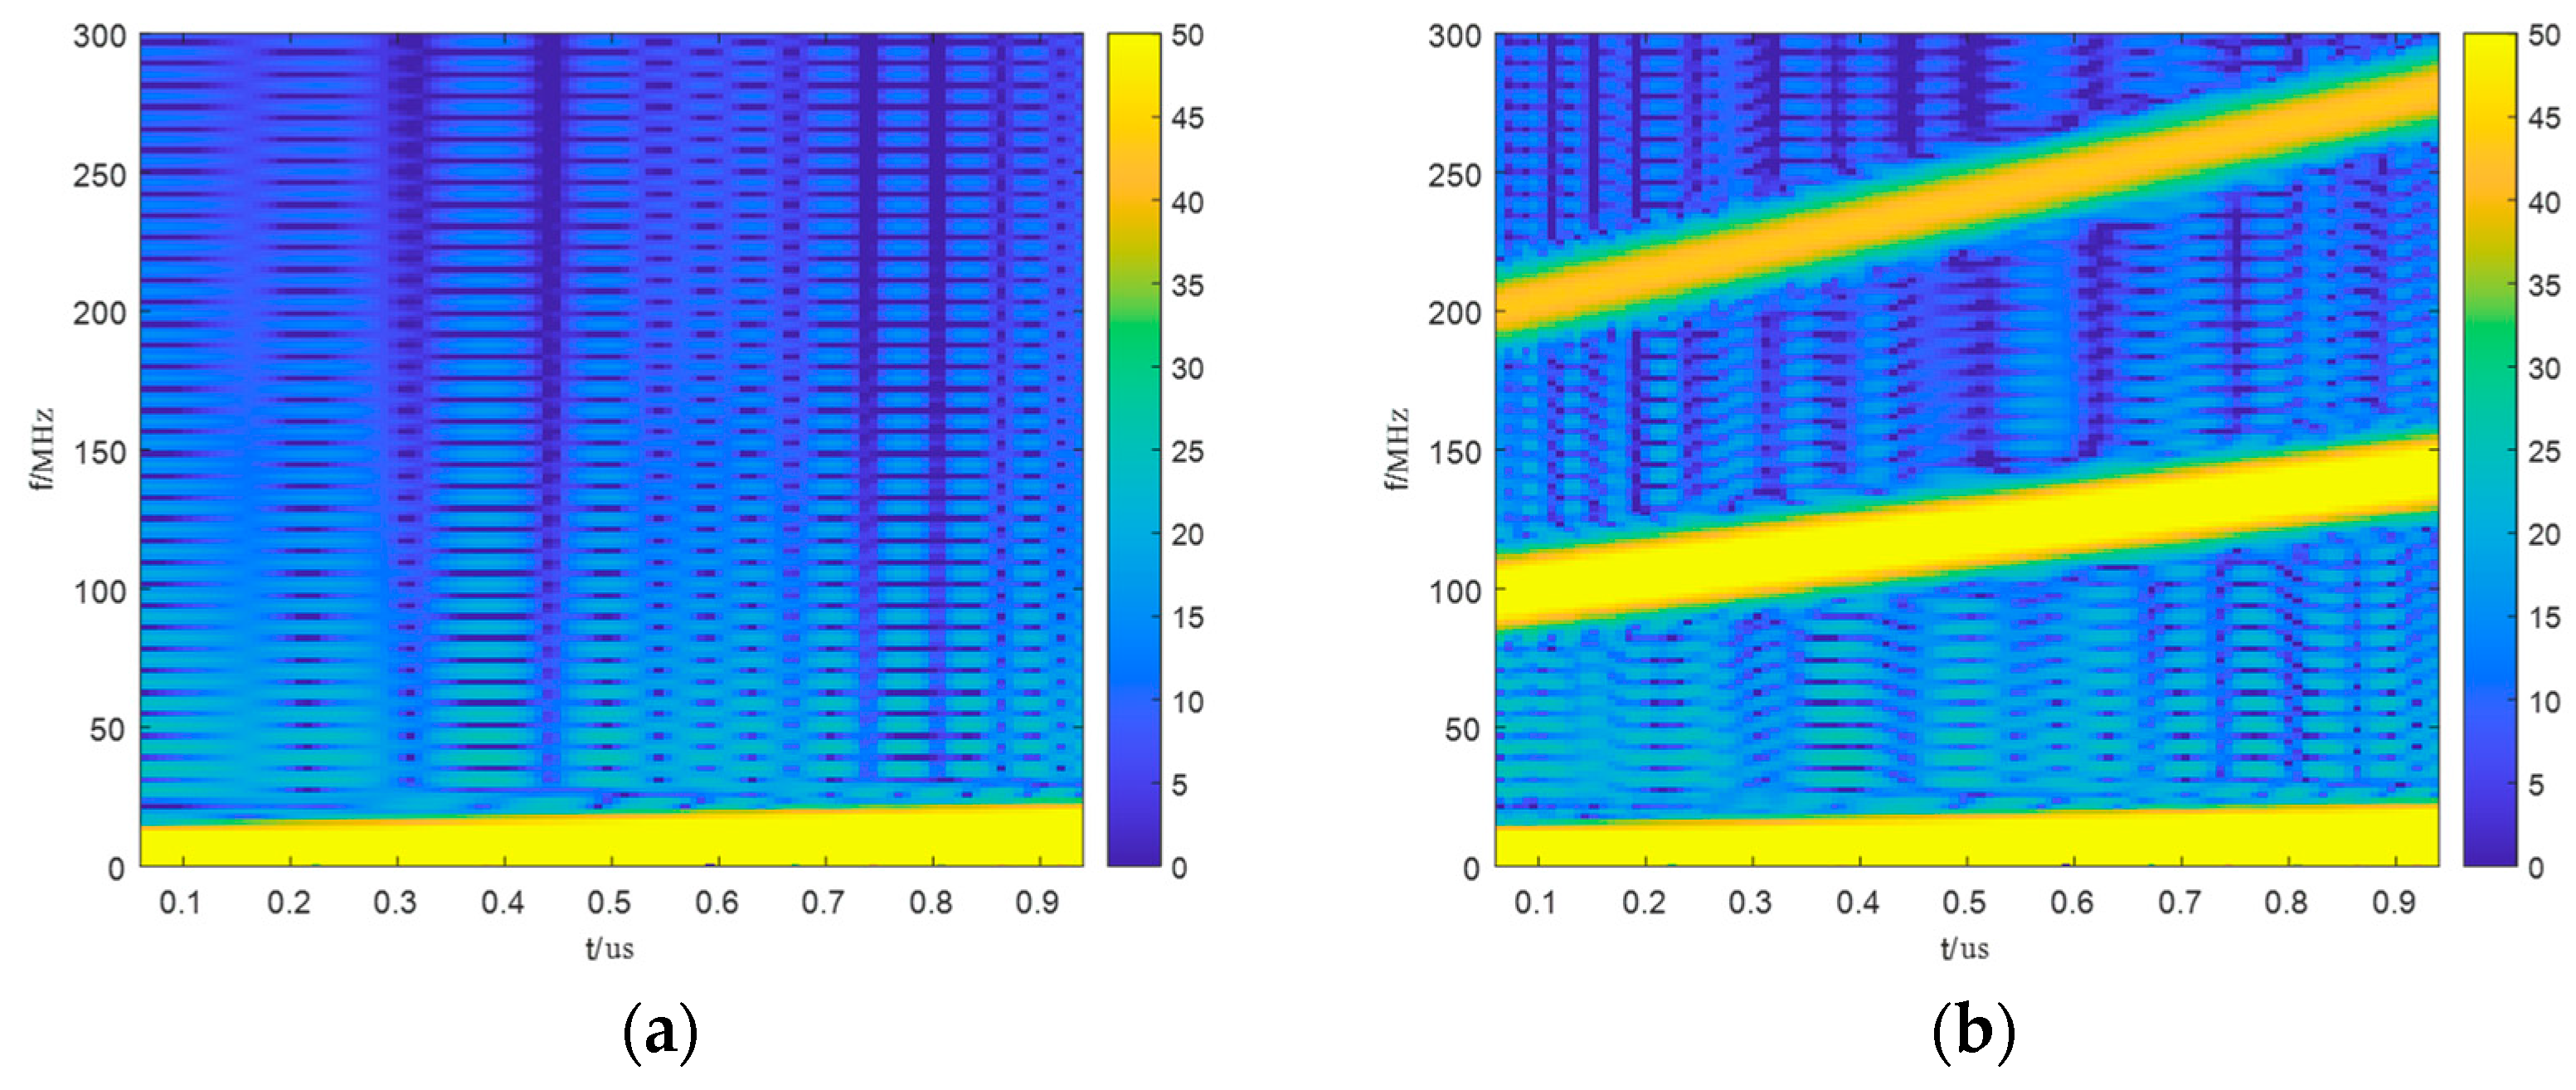
Next, simulations will be conducted to validate the aforementioned theoretical analysis. The experiment simulates two types of signals: the genuine target echo and the deceptive jamming signal generated by a DRFM jammer. A time–frequency domain comparison of these two signal types is performed.
Figure 1 presents a time–frequency domain comparison between the true genuine echo and the deceptive jamming signal generated by the DRFM jammer, as received by the radar receiver in a noise-free environment. The interference signal is an LMF signal with a bandwidth of 10 MHz, a sampling frequency of 1.024/2 GHz, and a pulse width of 1 µs. From the figure, the modulation characteristics of the spurious components can be clearly observed. In the left panel, only a single linear modulation component is present. However, in the right panel, in addition to the frequency modulation characteristic similar to that in the left panel, two additional modulation components with steeper slopes can be observed. Since the slope corresponds to the modulation frequency, a steeper slope indicates a higher modulation frequency. These steeper modulation components represent the modulation characteristics of the spurious terms.
In conclusion, when the radar echo contains only the genuine target echo, it appears as a single independent LFM signal. However, once the radar receives a deceptive jamming signal modulated and generated by the DRFM jammer, the harmonic effect causes multiple LFM signals with specific frequency characteristics to appear simultaneously in the received echo [
7]. The theoretical analysis aligns well with the experimental results.
3. Bispectral Analysis and Dimensionality-Reduced Bispectrum via Diagonal Integration
Through the analysis in the previous section, it is established that when radar receives deceptive jamming signals forwarded by DRFM jammers, multiple LFM signals will simultaneously appear in radar echoes. Within this research framework, this section introduces higher-order cumulants and the bispectrum based on the definition of higher-order statistics. Theoretical validation was conducted to demonstrate the feasibility of bispectral analysis in addressing this specific problem. Furthermore, we propose the implementation of diagonal integration as a dimensionality reduction technique for bispectral features. This approach enables directional focusing of nonlinear phase coupling characteristics in DRFM jamming signals through bispectral feature concentration and extraction.
To achieve accurate radar signal identification and detection, it is essential to extract discriminative key parameters from signal characteristics. Compared with traditional time–frequency analysis methods, higher-order cumulants exhibit significant theoretical advantages in feature extraction. Notably, their inherent blindness to Gaussian noise stems from the theoretical property that third-order and higher cumulants vanish for Gaussian processes, thereby effectively suppressing interference from additive Gaussian noise. Moreover, compared to second-order statistical methods, higher-order cumulants not only preserve the phase information, non-Gaussian characteristics, and discriminative classification properties of signals but also enable the extraction of higher-order spectral domain features through multidimensional Fourier transforms, thereby transcending the inherent limitations of second-order statistics in feature representation dimensionality. Consequently, this study adopts bispectral features derived from higher-order cumulants as the core analytical framework.
Let
be defined as a random variable, where
, and let
denote the probability density function of random variable
. The first and second characteristic functions are defined as follows [
21]:
The kth-order cumulant,
, of random variable
is defined as
For a stationary random signal
, the third-order cumulant with time delays
is defined as [
18]
The bispectrum is defined as the two-dimensional Fourier transform of the third-order cumulant, expressed mathematically as [
18]
Based on the analysis in the preceding section, when radar systems are subjected to DRFM-based deception jamming, the received echoes will contain multiple LFM signal components. Conversely, in the absence of DRFM jamming, only a single LFM component corresponding to the genuine target echo exists. This section conducts bispectral analysis on both signal models and theoretically investigates whether discriminative bispectral features exist between genuine target echoes and DRFM-generated deceptive jamming signals.
Let the DRFM jamming signal be represented as , where . Here, denotes the amplitude envelope (typically a constant). , where represents the initial frequency and corresponds to the chirp rate. Similarly, for the genuine target echo , an analogous parameterization can be expressed as .
To simplify computation, the bispectrum is defined as the expectation of the triple product of the signal’s Fourier transform [
19]:
where
denotes the Fourier transform of signal
,
represents the expectation operator, and
indicates complex conjugation.
In the frequency domain, the Fourier transform of the DRFM jamming signal is expressed as
Substituting this representation into the bispectrum formula yields
A detailed expansion of the aforementioned equation reveals that the bispectrum of the DRFM jamming signal comprises 27 combinatorial terms, categorized into self-product terms and cross-product terms. The self-product terms, such as , account for 3 terms, which are analogous to the bispectrum of a single LFM signal. The remaining 24 cross-product terms arise from nonlinear interactions between distinct signal components; here, it refers to the phase coupling phenomena induced by DRFM modulation mechanisms.
The bispectrum of the genuine target echo, which corresponds to a single LFM signal, is expressed as
Since no multiple signal components are present in this scenario, cross-product terms are inherently absent, leaving only self-product terms in the bispectral representation.
By comparing Equation (18) and Equation (19), the following conclusions can be drawn: The bispectrum of DRFM jamming signals contains three self-product terms and multiple cross terms, resulting in a higher number of coupling frequencies and bispectral peaks compared to genuine target echoes. Consequently, bispectral analysis serves as an effective tool for discriminating between genuine target returns and DRFM deception jamming in this context.
Prior to bispectral dimensionality reduction, the symmetry properties of the bispectrum must be thoroughly investigated to ensure that the selected reduction approach effectively extracts discriminative bispectral features between the two genuine and DRFM-jammed signals.
The third-order cumulant,
, of a real-valued stationary random sequence
satisfies the following six fundamental symmetry relations in the two-dimensional temporal domain [
19]:
In radar systems, complex-valued signals are conventionally employed due to their inherent capability to simultaneously preserve both amplitude and phase information. This necessity underscores the critical importance of bispectral analysis for complex signals in such applications.
For a complex-valued stationary signal
, the conjugation operator in the third-order cumulant definition (Equation (14)) may be applied to any one term or two terms within the product. However, for each distinct conjugation configuration, only one of the six symmetry relations in Equation (18) remains valid. The bispectrum of a complex signal typically exhibits symmetry about a specific axis
in the
frequency plane, where
.
Table 1 enumerates the six conjugation configurations and their corresponding bispectral symmetry relations [
19], where
denotes the Fourier transform of the complex signal
.
The analysis in this study adopts the first definition, as enumerated in
Table 1.
Third-order cumulant: .
Bispectrum: .
Symmetry axis: ; this implies symmetry about the principal diagonal.
To address the high computational complexity inherent in bispectral analysis due to the massive data volume of two-dimensional bispectral representations, dimensionality reduction techniques are conventionally employed in higher-order spectral analysis.
In this study, the bispectral data is processed as follows: it is integrated along the sub-diagonal direction, and the resulting output is termed the DIB [
18]. Due to the inherent symmetry of the bispectrum about the main diagonal, sub-diagonal integration superimposes symmetrical discriminative features with respect to the main diagonal, thereby amplifying their distinctiveness. The mathematical representation is given by [
22]:
The coordinate system,
, is derived by rotating the original
coordinate system 45° counterclockwise about the origin [
22].
Subsequent experimental validation of the theoretical analysis was conducted using both simulated and field-measured datasets [
23,
24,
25,
26,
27]. The bispectral characteristics and diagonally integrated bispectral profiles of genuine and DRFM-jammed signals were systematically analyzed. Experimental results are summarized as follows:
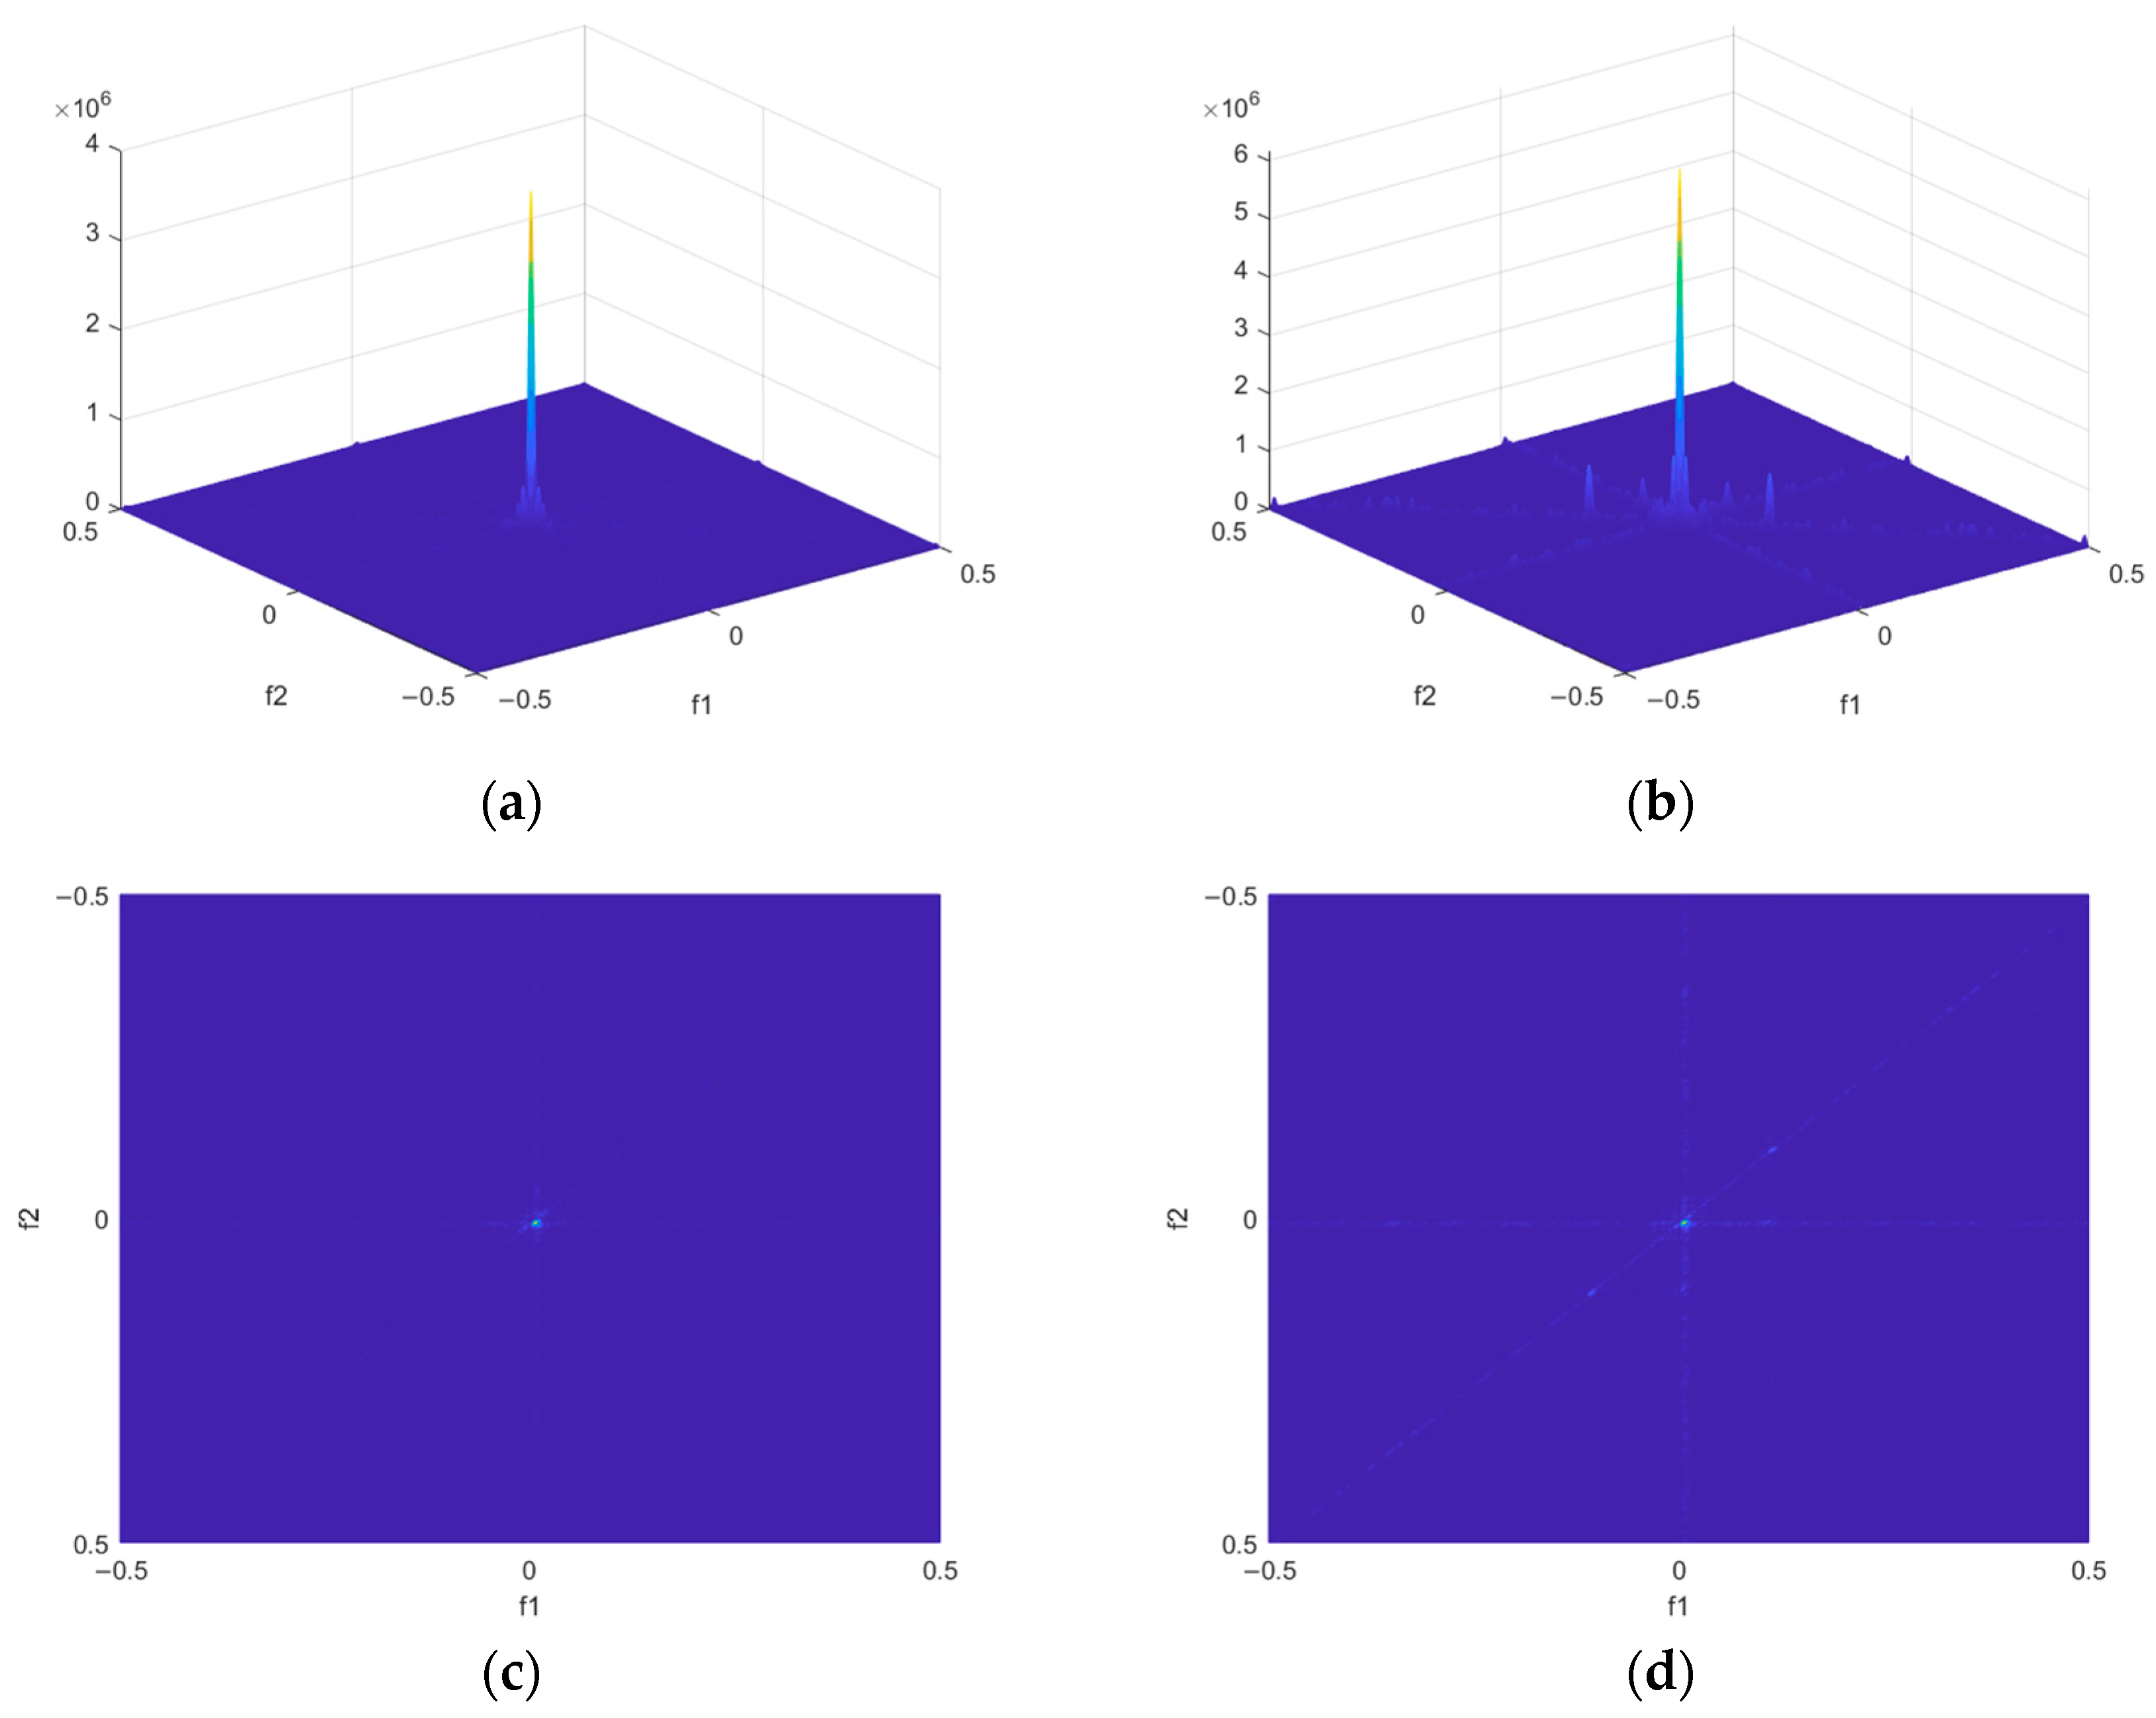
Figure 2 shows the bispectra of DRFM-jammed signals and genuine target echoes obtained through simulations. The simulation parameters were set as follows: a sampling frequency of 150 MHz, a bandwidth of 10 MHz, a pulse width of 1 μs, and an SNR of 0 dB. The Fourier transform length is set to 1024; the window length is 128; the sliding step is 64, and the direct method is used to estimate the bispectrum. As can be seen from the figure, the bispectrum of the authentic target echoes exhibits more concentrated energy, while the bispectrum of the deceptive jamming signals displays numerous glitches and distinct peaks at specific frequency positions, corresponding to the cross-product terms and self-product terms mentioned in the theoretical analysis above.
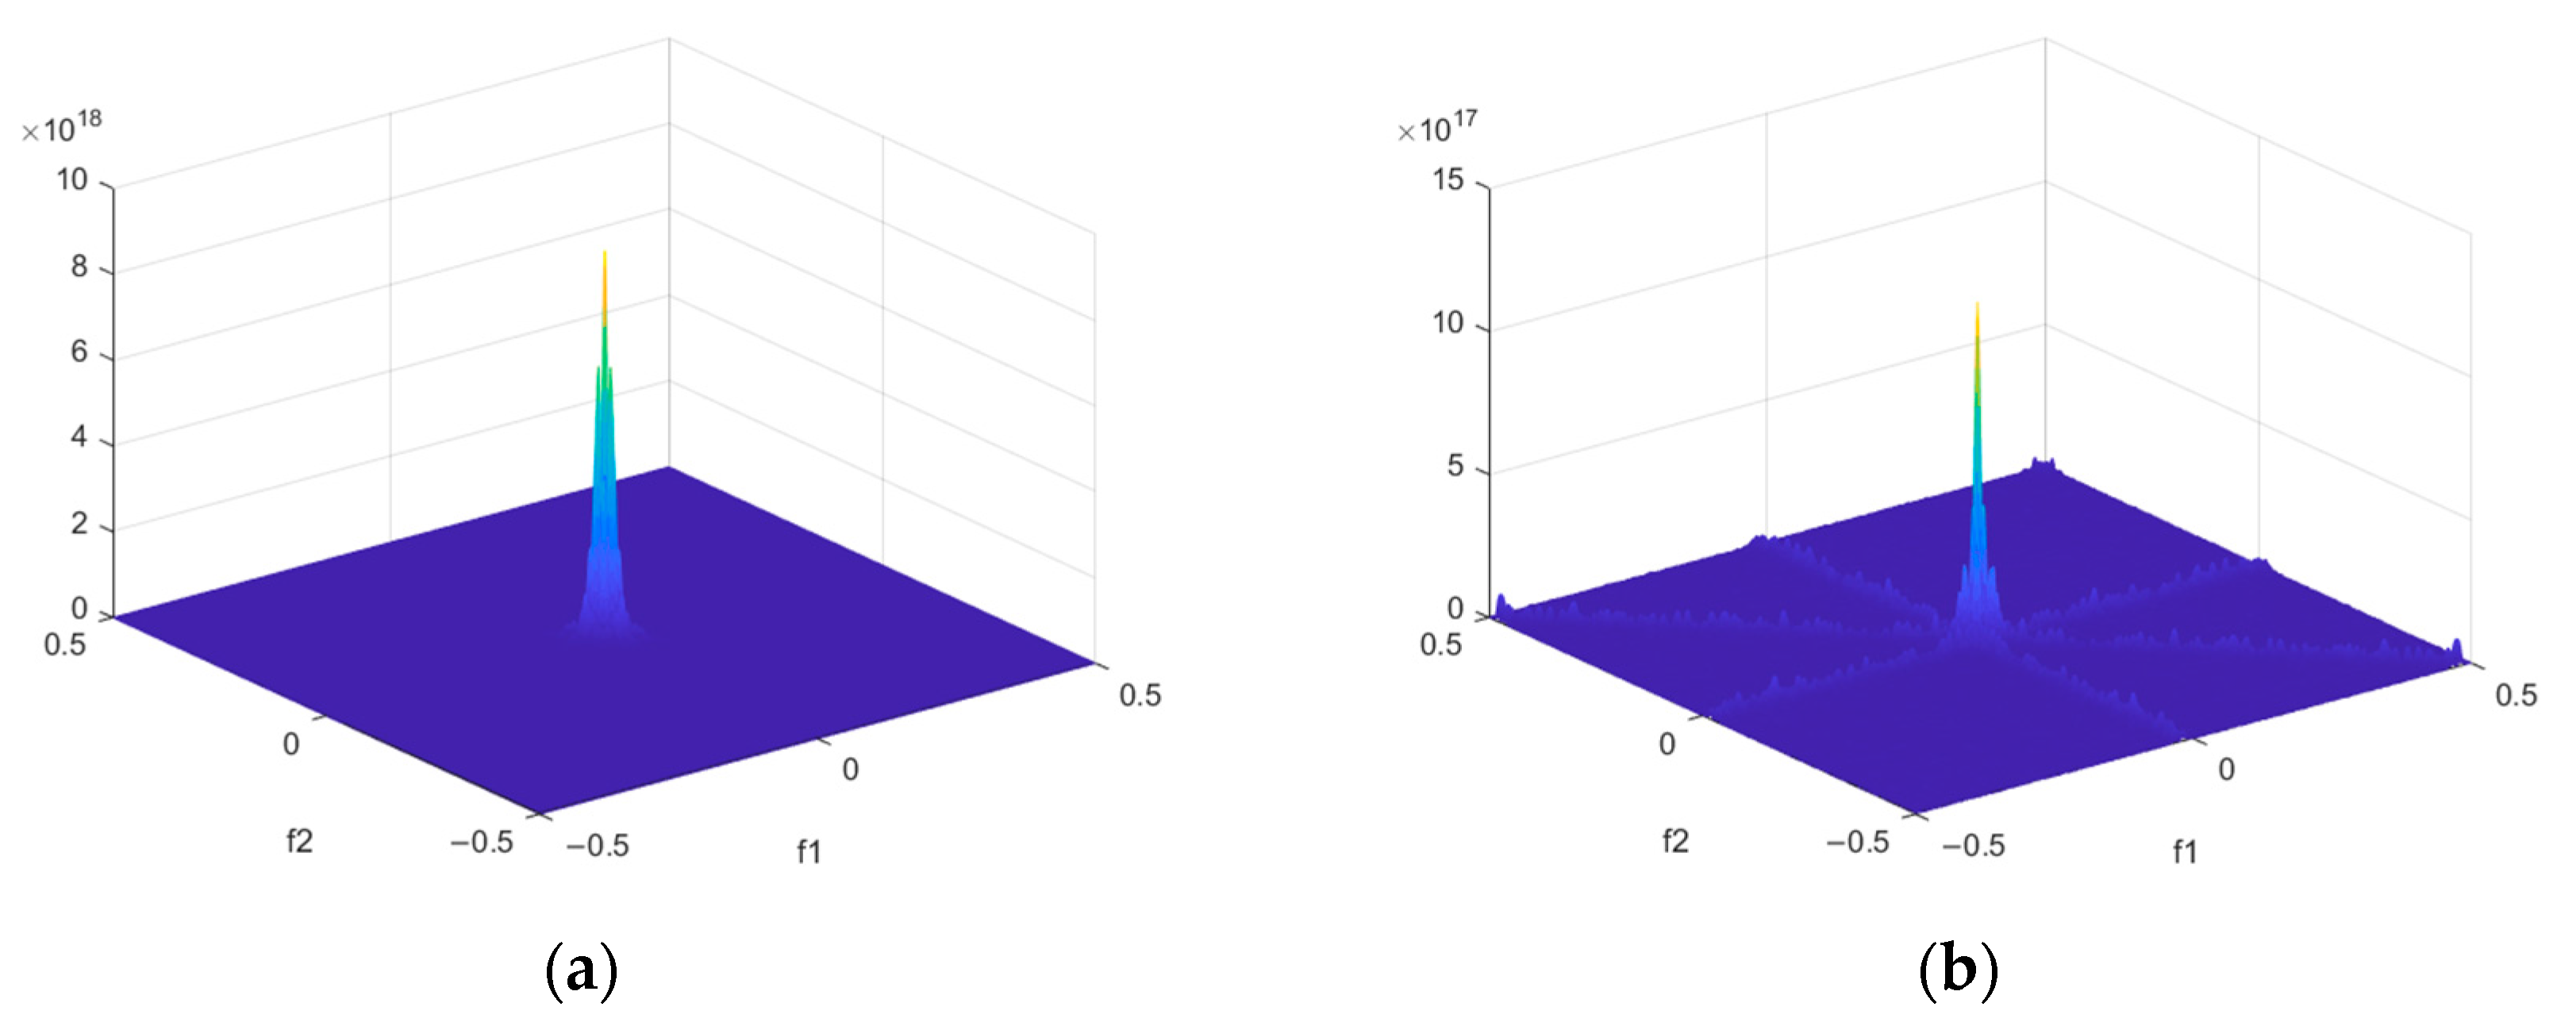
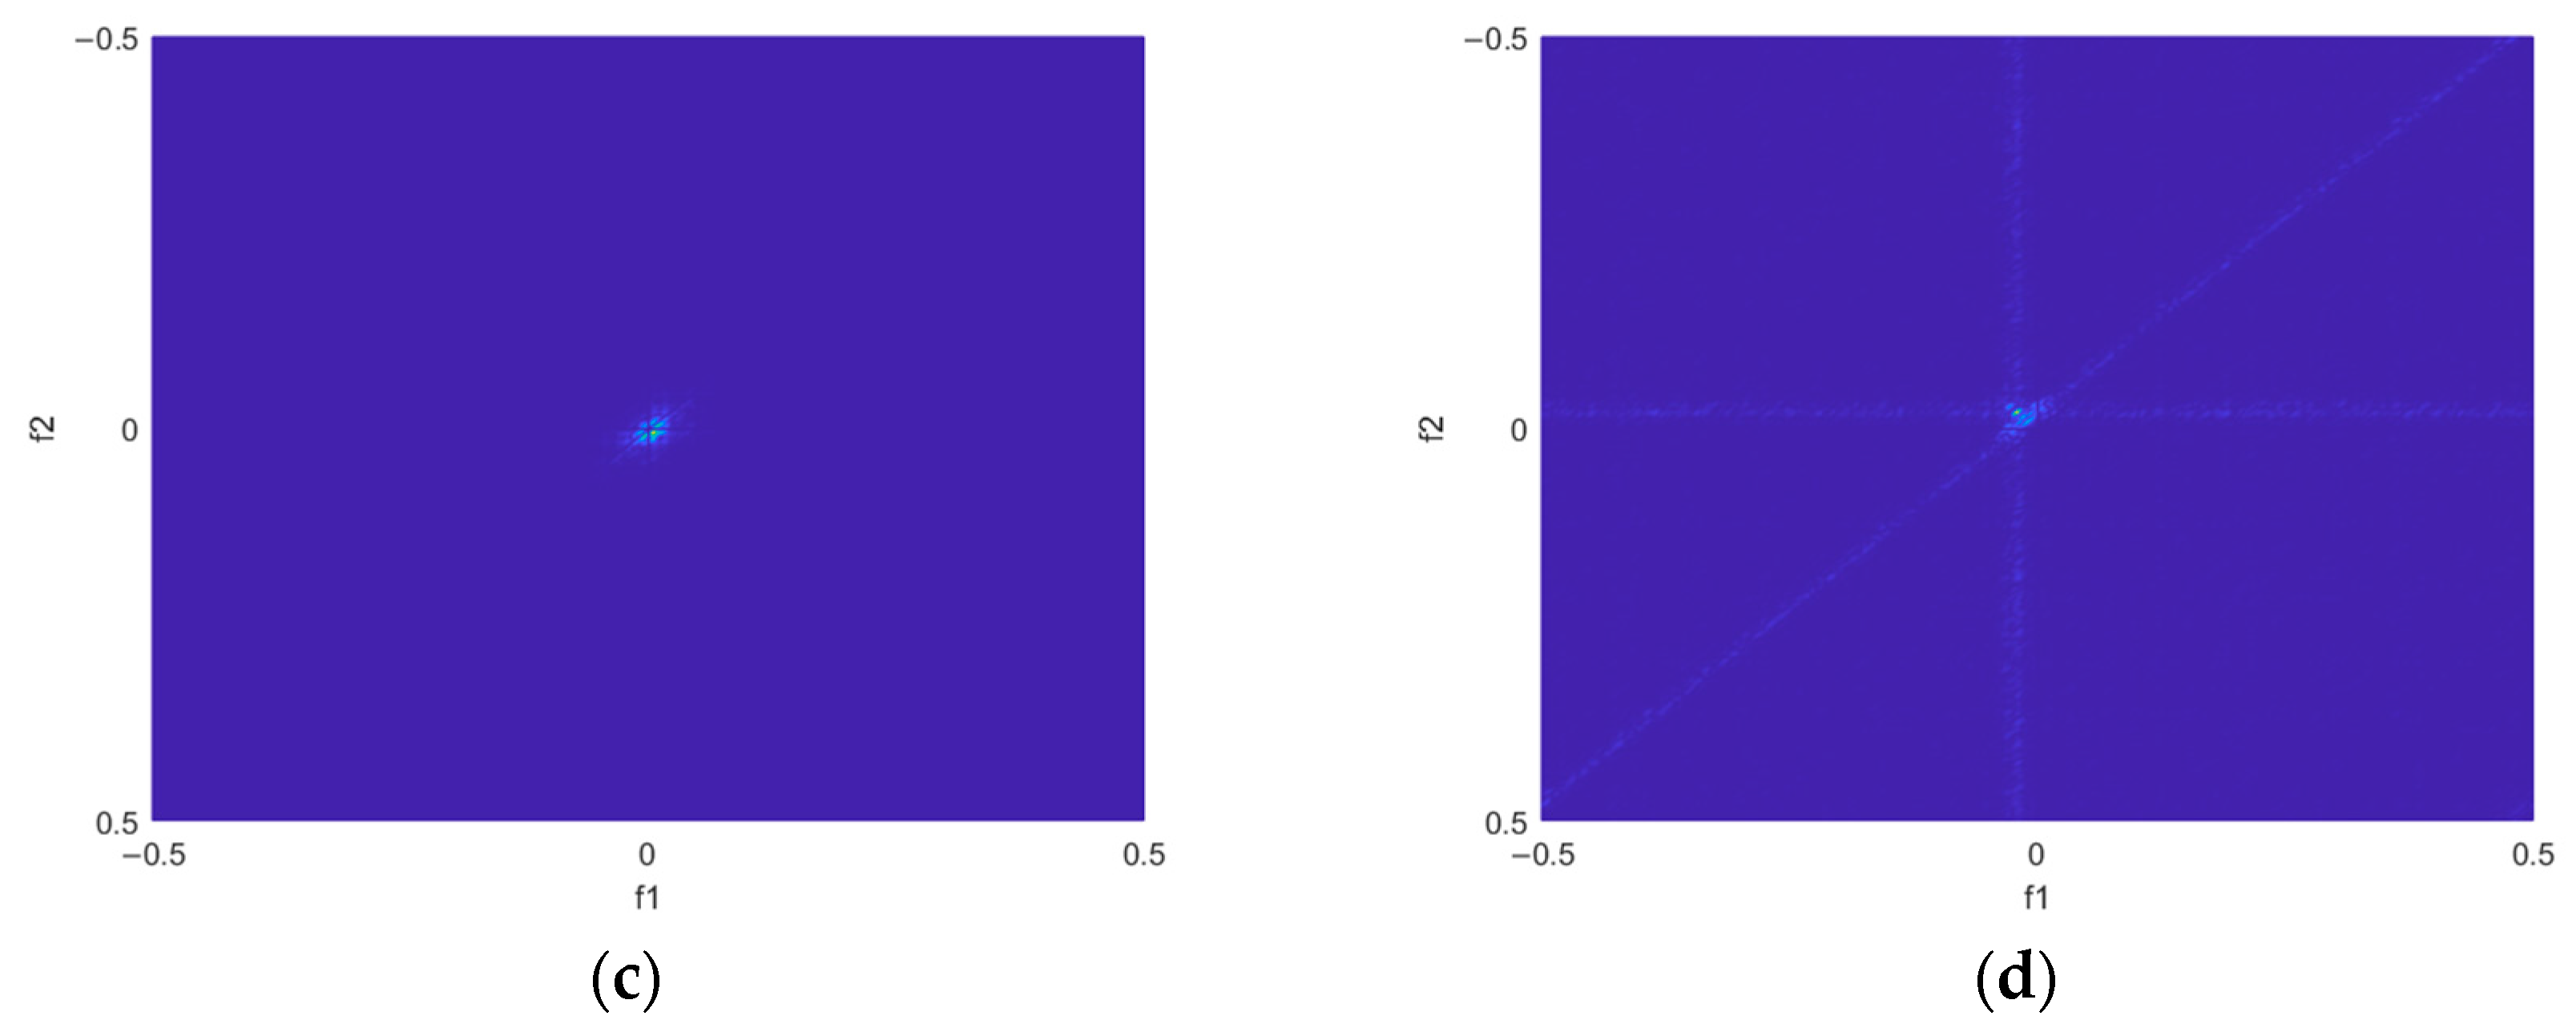
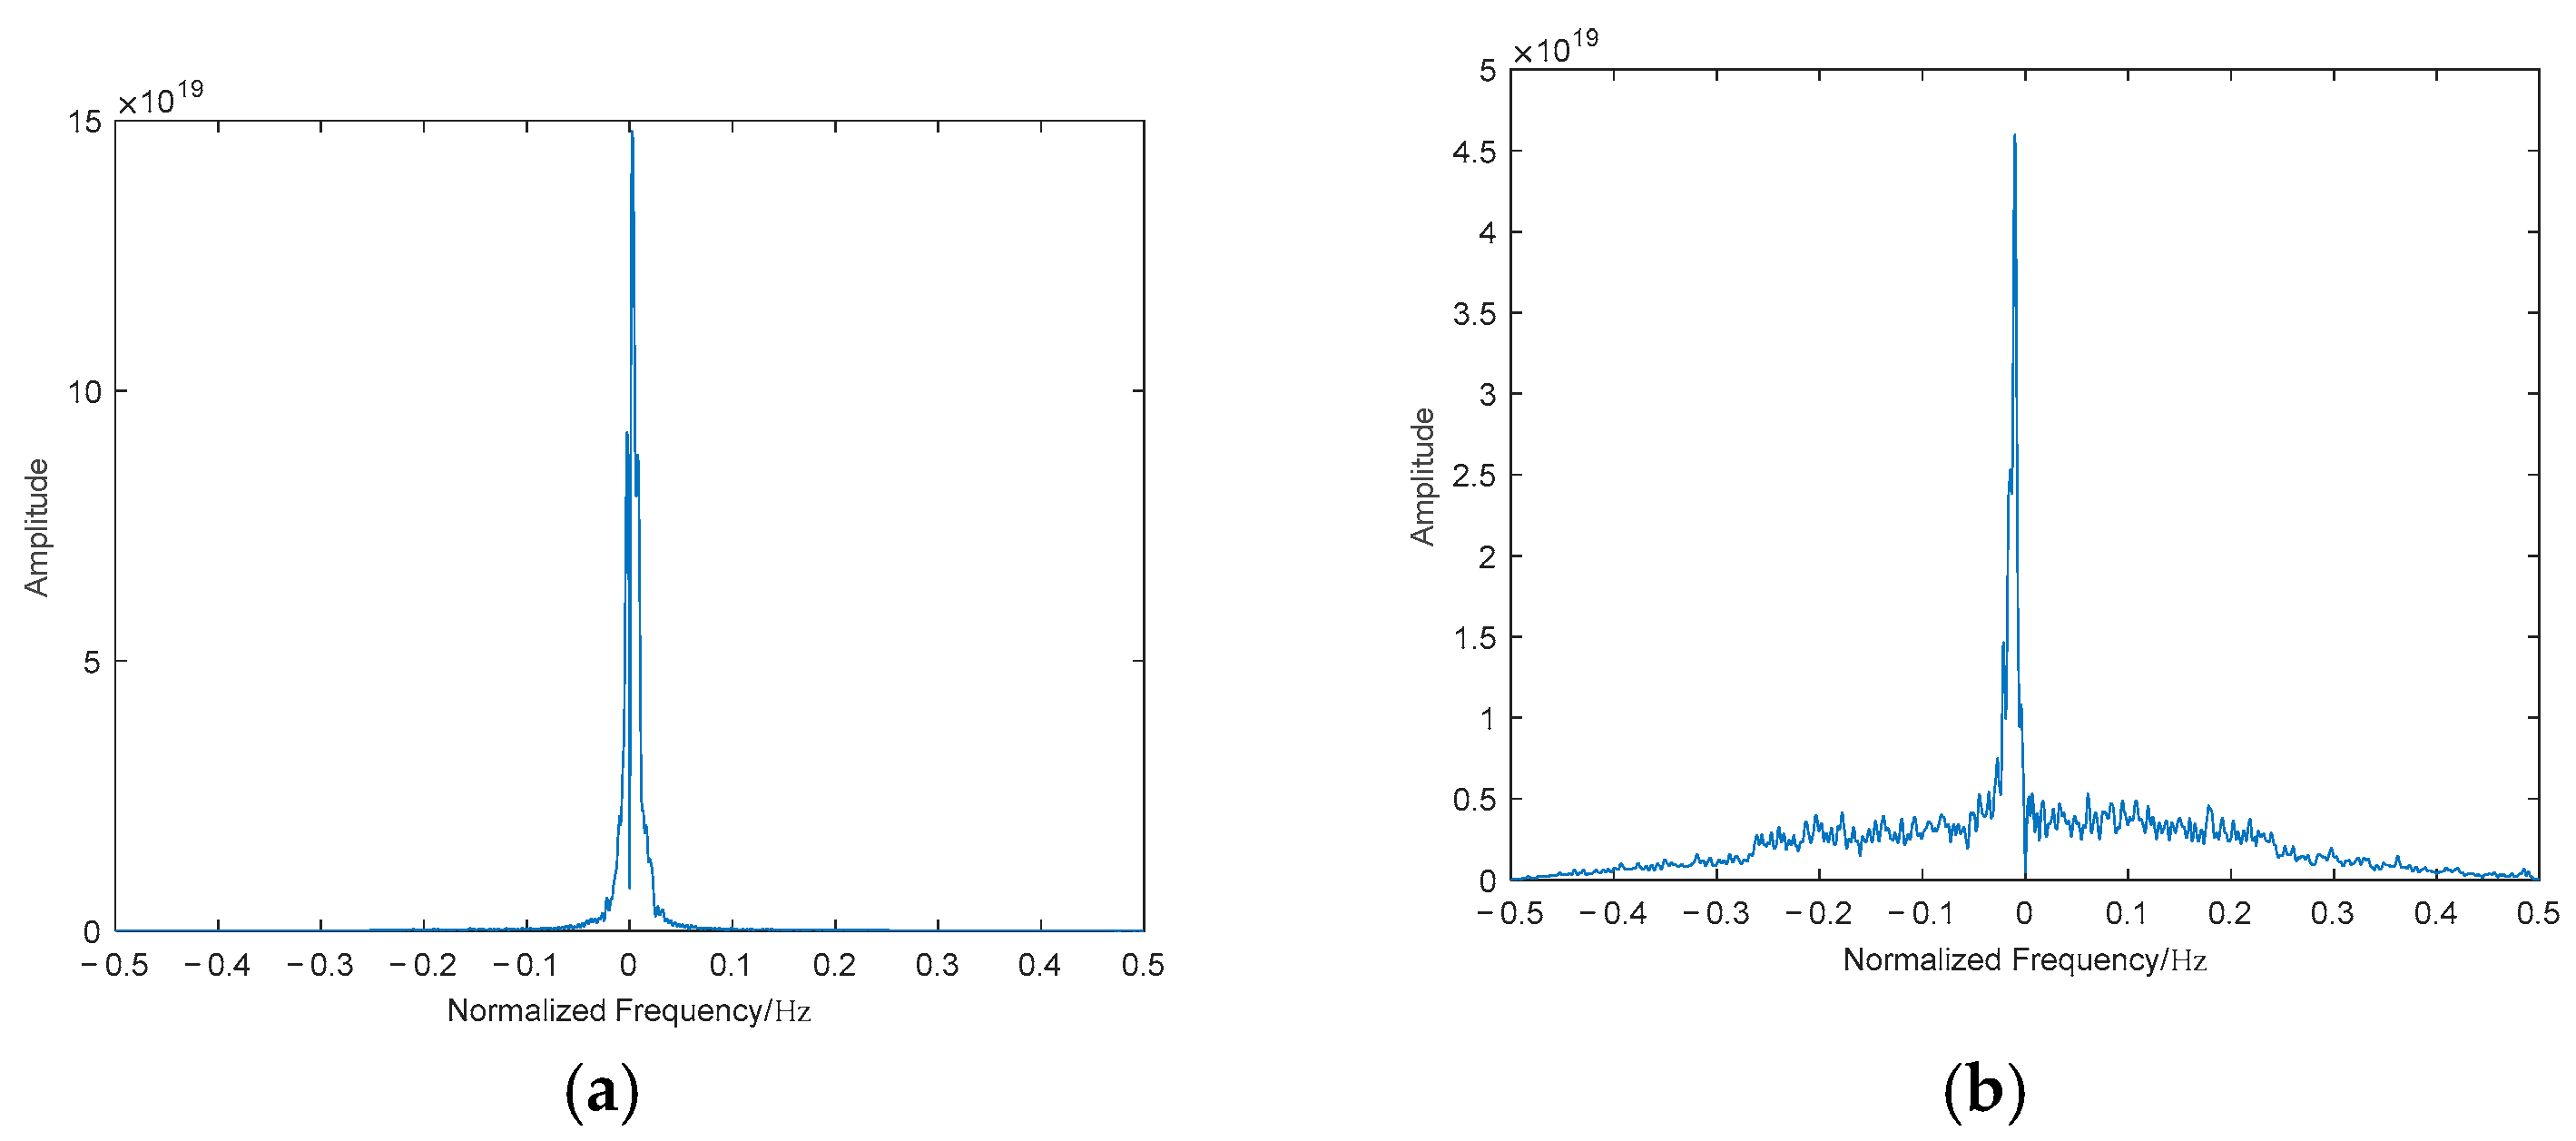
Figure 3 and
Figure 4 present the bispectrum and DIB of genuine target echoes and DRFM deceptive jamming signals derived from field-measured datasets [
23,
24,
25,
26,
27].
A comparative analysis of bispectral plots between simulated genuine target echoes and DRFM deception jamming signals demonstrates that the simulated signals exhibit high fidelity in replicating measured data, thereby corroborating the theoretical feasibility of the proposed framework.
A comparative analysis of the dimensionally reduced bispectral plots between the two signal classes reveals significant discrepancies in their diagonally integrated bispectral profiles. As illustrated in the plots (generated from field-measured datasets), the diagonally integrated bispectrum of the genuine target exhibits a localized energy peak with minimal surrounding fluctuations (left panel). In stark contrast, the diagonally integrated bispectrum of the DRFM-jammed signal demonstrates extensive undulations around the primary energy concentration, particularly along the frequency axis and principal diagonal (right panel). These distinctive fluctuations originate from spurious modulation artifacts introduced by DRFM-generated false components during frequency-agile deception.
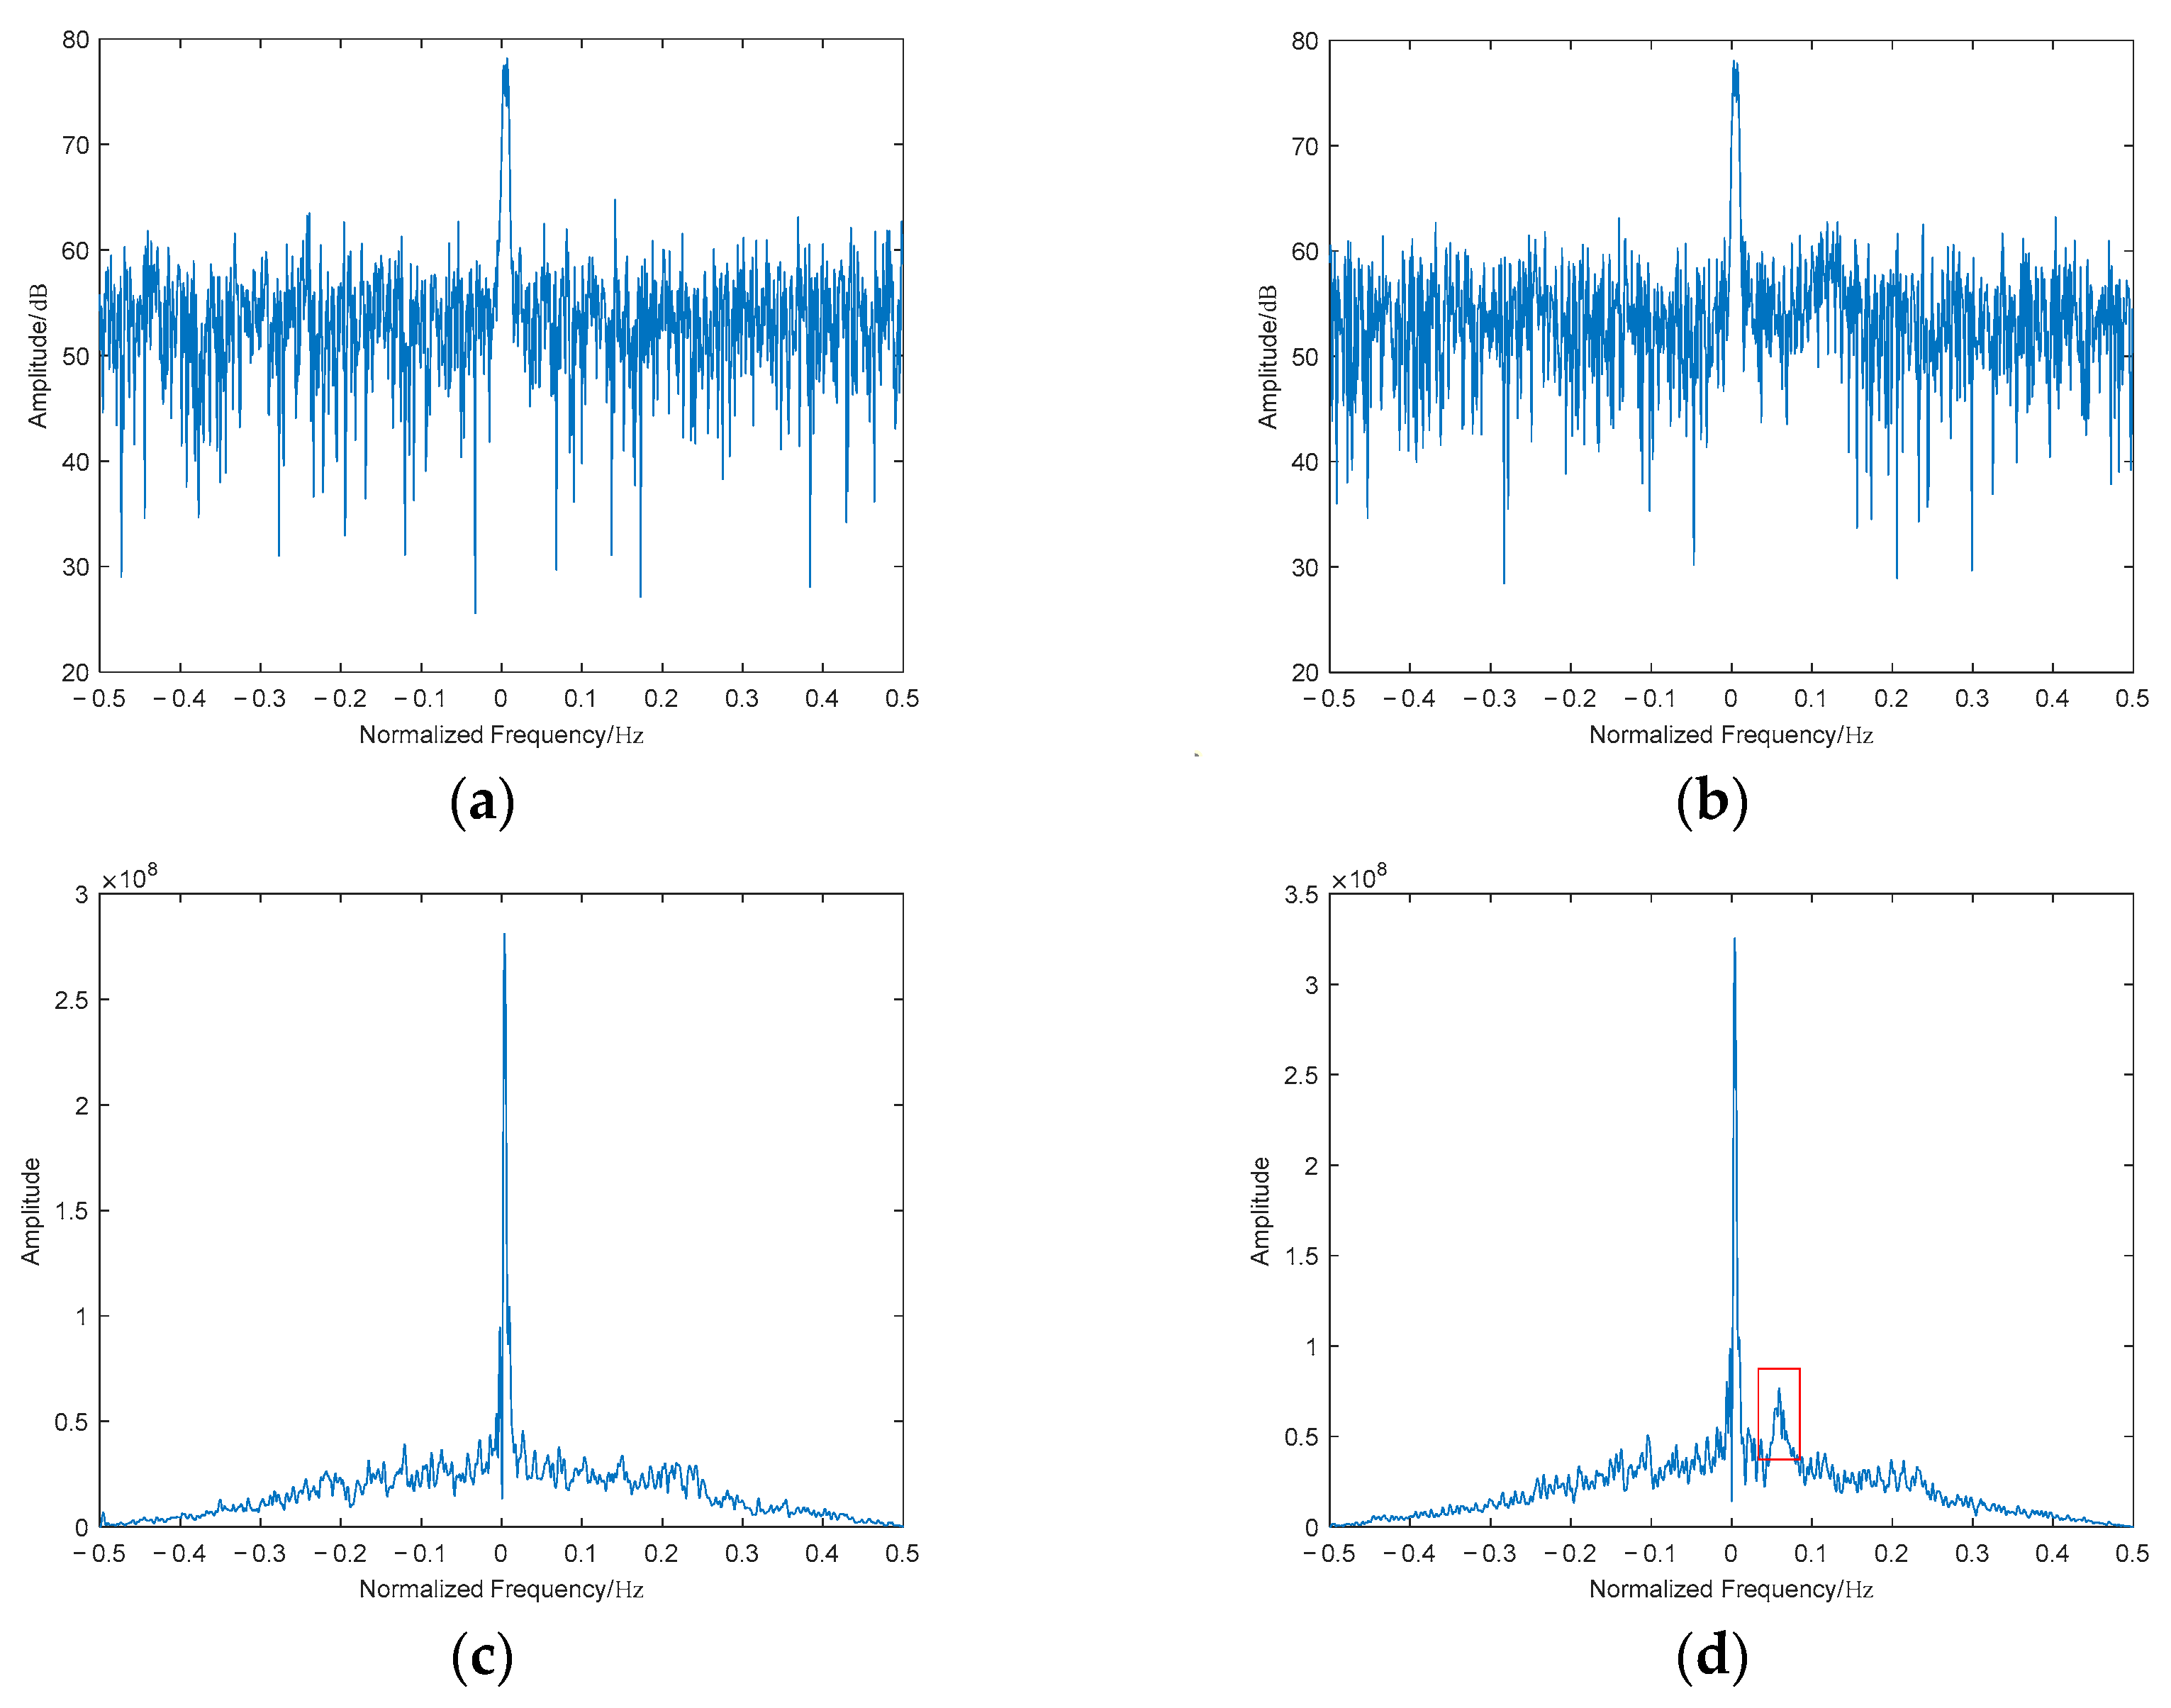
Figure 5 presents the feature extraction results for DRFM deception jamming signals under 0 dB SNR conditions, obtained through spectral analysis and DIB analysis. This study demonstrates that both methodologies effectively detect spurious modulation features inherent in the jamming signals. To validate the robustness of bispectral analysis in low-SNR environments, comparative experiments were conducted at a reduced SNR of −5 dB, with results illustrated in
Figure 6.
As shown in
Figure 6, conventional spectral analysis exhibits significant degradation in spurious component detection under low-SNR conditions, while the diagonal integrated bispectrum maintains high feature discriminability. This observation aligns with the theoretical analysis of bispectral noise suppression: The third-order cumulant calculation in bispectral analysis inherently suppresses Gaussian noise while retaining critical phase information neglected by conventional power spectrum methods.
4. Discriminative Feature Extraction from Diagonally Integrated Bispectral Differences
As demonstrated in the preceding analysis, significant discriminative disparities exist between genuine radar targets and DRFM deception jamming signals within the bispectral domain. The diagonal integration method not only reduces bispectral dimensionality but also accentuates and extracts these discriminative features, thereby amplifying the observable differences between the two signal classes in the DIB domain. To establish an effective detection model, this approach requires the transformation of morphological differences in diagonal integrated bispectra into quantifiable statistical features, providing a foundation for subsequent classifier design based on third-order statistical properties.
4.1. Diagonal Integral Bispectrum Relative Peak Height Feature
To enable quantitative detection, a systematic analysis was conducted. As illustrated in
Figure 4, the DIB of genuine target echoes demonstrates a compact energy concentration profile, whereas the DIB of DRFM deception jamming exhibits significant spurious fluctuations characterized by pronounced glitches. This disparity motivates the extraction of relative peak height discrepancies in their diagonal integrated bispectral representations. Accordingly, we propose the DIBRP metric to quantify the energy concentration disparity between the two signal types through third-order statistical analysis. The DIBRP parameter effectively captures the fundamental difference in energy aggregation patterns caused by nonlinear phase coupling characteristics inherent to genuine radar returns.
The DIBRP is mathematically defined as the ratio of the DIB peak amplitude in the test unit to the average DIB peak amplitude of reference units. This metric reflects the energy magnitudes contained in different signal components.
The calculation formula of DIBRP is as follows:
In Equation (22), denotes the normalized frequency of the DIB, while represents the magnitude spectrum obtained through bispectral diagonal integration.
In Equation (24), where , δ1 denotes the interval width of reference units for the DIB; δ2 represents the maximum possible bandwidth of the target; Δ is the set composed of reference units; and #Δ indicates the number of elements in the set Δ.
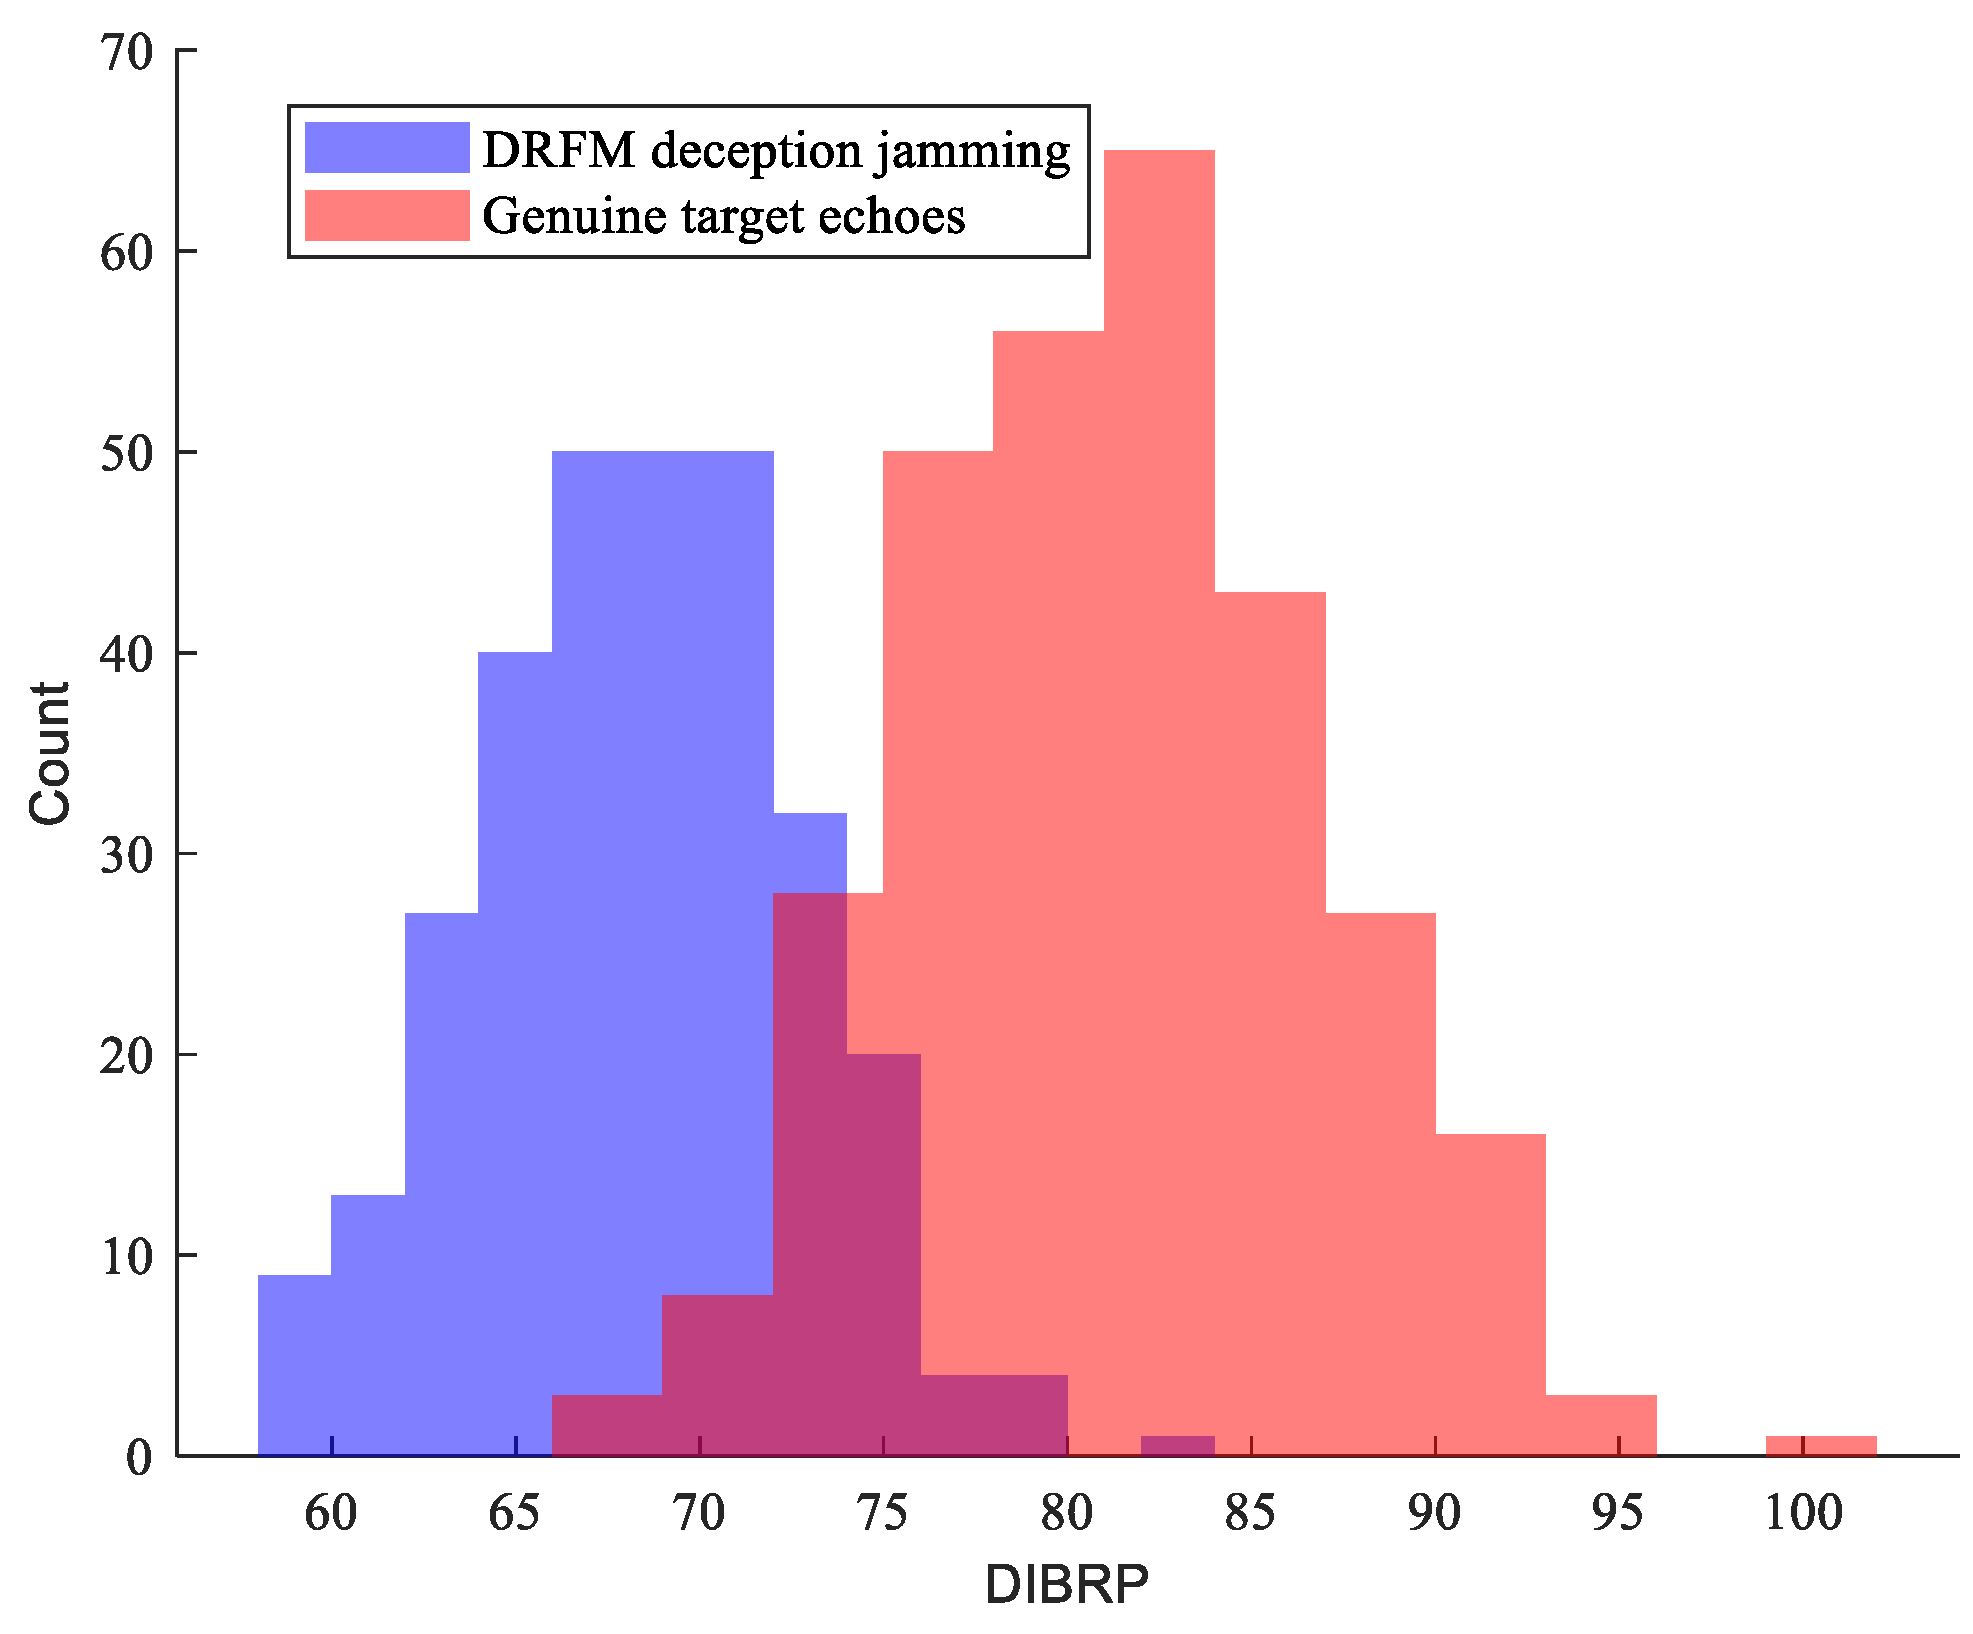
Building upon the theoretical analysis of the DIBRP, the following conclusion is derived: the concentrated energy distribution in the DIB of genuine target echoes results in significantly higher DIBRP values compared to DRFM deception jamming signals, whose dispersed bispectral energy profiles yield attenuated DIBRP magnitudes. To validate this hypothesis, a comparative simulation study was conducted using 300 samples of radar returns from both genuine targets and DRFM-generated deception jamming signals under an SNR of 5 dB. The DIBRP features extracted from these datasets were statistically analyzed, with the resultant feature histogram presented in the figure below:
As evidenced in the
Figure 7, the DIBRP exhibits substantial discriminative capability between genuine radar target echoes and DRFM-generated deception signals. The experimental results align rigorously with theoretical predictions, thereby validating DIBRP as an effective discriminative feature for integration into the proposed detection algorithm.
4.2. Diagonally Integrated Bispectrum Approximate Entropy Feature
As illustrated in
Figure 4, the energy concentration characteristics of genuine target echoes and DRFM deception jamming signals exhibit significant divergence, which can be conceptualized as restructured signal ensembles. These restructured ensembles exhibit distinct complexity profiles, a disparity that can be quantified using entropy features—a well-established metric for evaluating signal sequence complexity—as demonstrated in prior studies [
28,
29].
Considering that approximate entropy (ApEn) serves as a robust method for detecting sequence randomness and unpredictability, it effectively quantifies the complexity of signal sequences and the likelihood of novel information generation. By incorporating permutation concepts, this metric combines inherent noise resistance with computational efficiency. This paper proposes the Diagonal Integral Bispectrum Approximate Entropy (DIBAE) to measure the structural complexity of diagonal integrated bispectral sequences and quantify their discriminative characteristics. The DIBAE is formally defined as
For an n-point
sequence, the sequence is sequentially partitioned into m-dimensional pattern vectors
, where
. The distance between two pattern vectors,
and
, is defined as the Chebyshev distance (maximum absolute difference):
Given a threshold tolerance
r, count the number of pattern vectors
u(
j) whose Chebyshev distance from
u(
i) is less than
r. For
, compute the ratio of
to
:
For all pattern vectors
u, take the natural logarithm of their corresponding
values and compute the average:
Repeating the aforementioned procedure in the
m + 1 dimensional space yields
. The approximate entropy of the DIB sequence, termed DIBAE, is then computed as
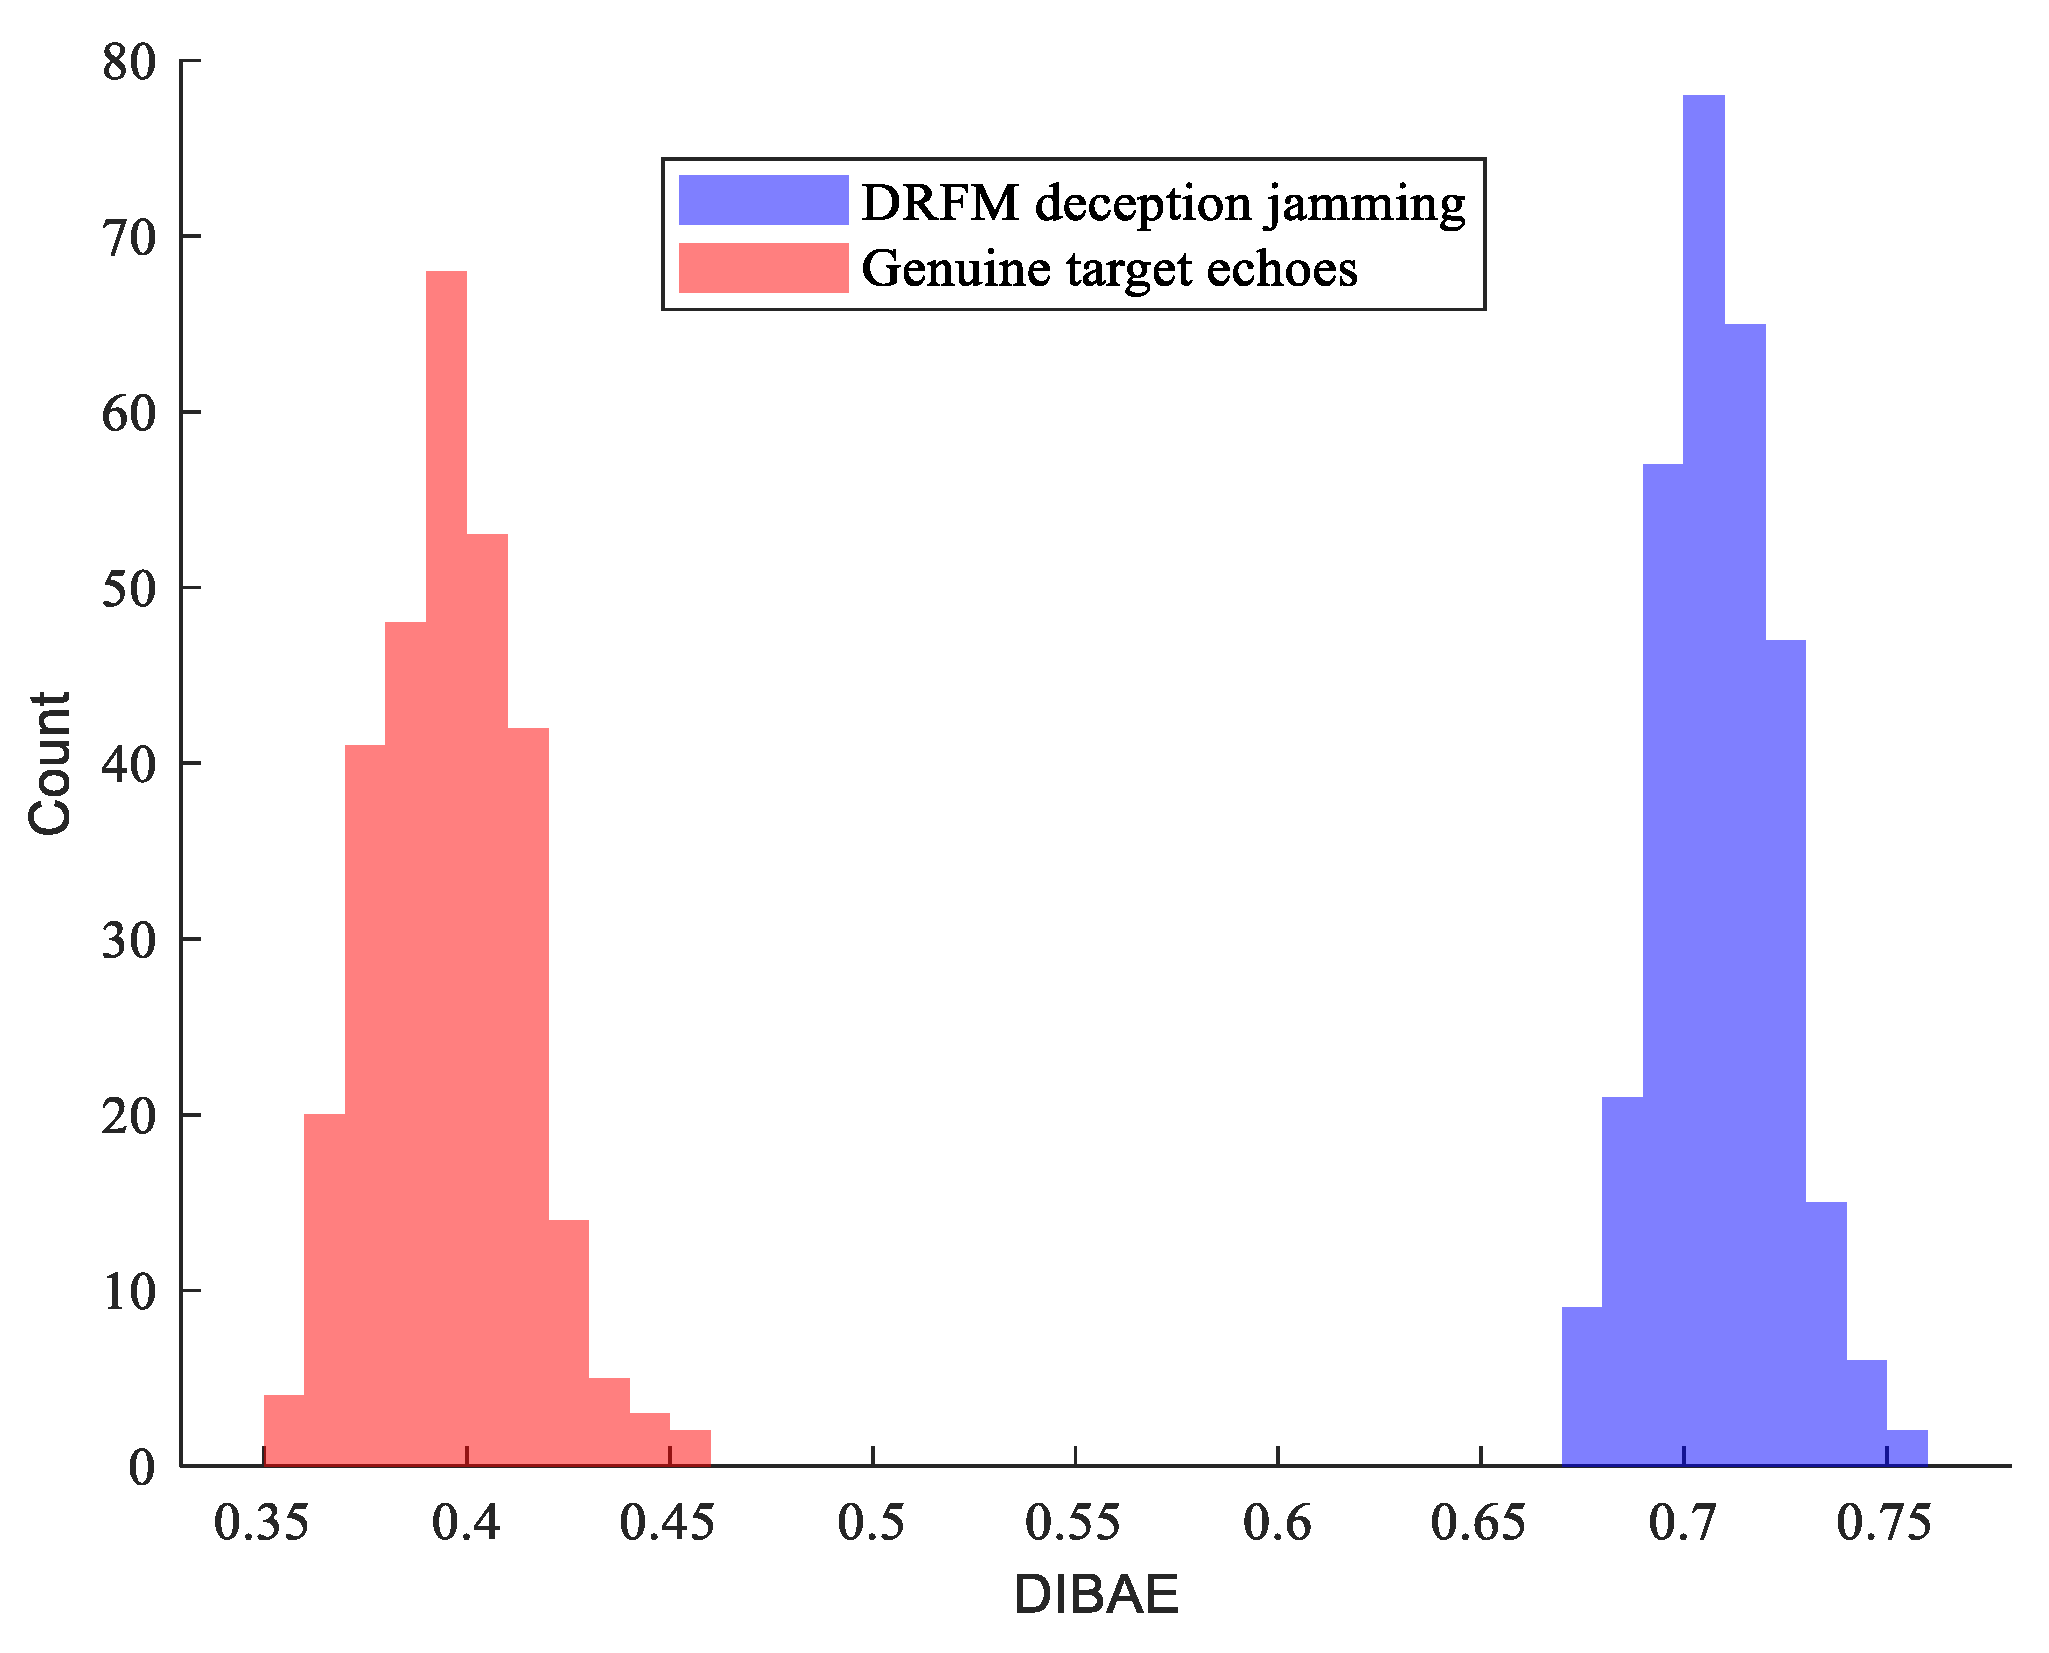
Building upon the theoretical analysis of the DIBAE, the following conclusion is derived: due to the inherently higher complexity of DRFM deception signals in the DIB domain compared to the relatively stable and low-complexity DIB profiles of genuine target radar echoes, the DIBAE values extracted from genuine target returns are expected to be significantly lower than those of DRFM-jammed signals. To validate this hypothesis and empirically assess the discriminative capability of DIBAE, a simulation study was conducted using 300 independent samples of radar returns—150 from genuine targets and 150 from DRFM-based deception jammers—under an SNR of 5 dB. The computed DIBAE distributions for both signal classes are statistically summarized in
Figure 6.
As can be seen from the
Figure 8, the DIBAE feature can completely distinguish between genuine radar target echoes and DRFM interference signal echoes, without any aliasing. This indicates that DIBAE exhibits strong discriminative capability in feature separation. The experimental results are consistent with the theoretical analysis. Therefore, DIBAE can be used as an effective feature for algorithm detection in this paper.
4.3. Nonlinear Decision Modeling Based on Polynomial Kernel SVM
To address the nonlinear separability characteristics inherent in the authentic/deceptive target classification task, this study employs a polynomial kernel-based support vector machine (SVM) to construct nonlinear decision boundaries, significantly enhancing classification robustness under low-SNR conditions. Unlike conventional linear SVM that only generates linear hyperplanes, the polynomial kernel effectively captures interaction effects between DIBAE and DIBRP feature spaces through kernel-induced mapping into the higher-dimensional Hilbert space [
30].
The polynomial kernel function is defined as , where d denotes the polynomial degree, γ represents the kernel coefficient, and r indicates the bias term. This kernel mapping projects the original 2D feature space into a d-th-order polynomial-combined space, thereby transforming the originally nonlinearly inseparable deceptive jamming signals and genuine target echoes into linearly separable representations within the transformed space. By adjusting the polynomial degree d, the complexity of the decision boundary can be dynamically controlled: Lower degrees (e.g., d = 2) construct smooth nonlinear boundaries to mitigate overfitting, while higher degrees (e.g., d = 3) precisely capture localized nonlinear structures in the feature distribution.
After obtaining the two types of discriminative features mentioned above, the true and false targets are separately subjected to feature extraction of these differences. These two categories of discriminative features are then input into a polynomial kernel SVM classifier, resulting in a well-defined decision boundary.
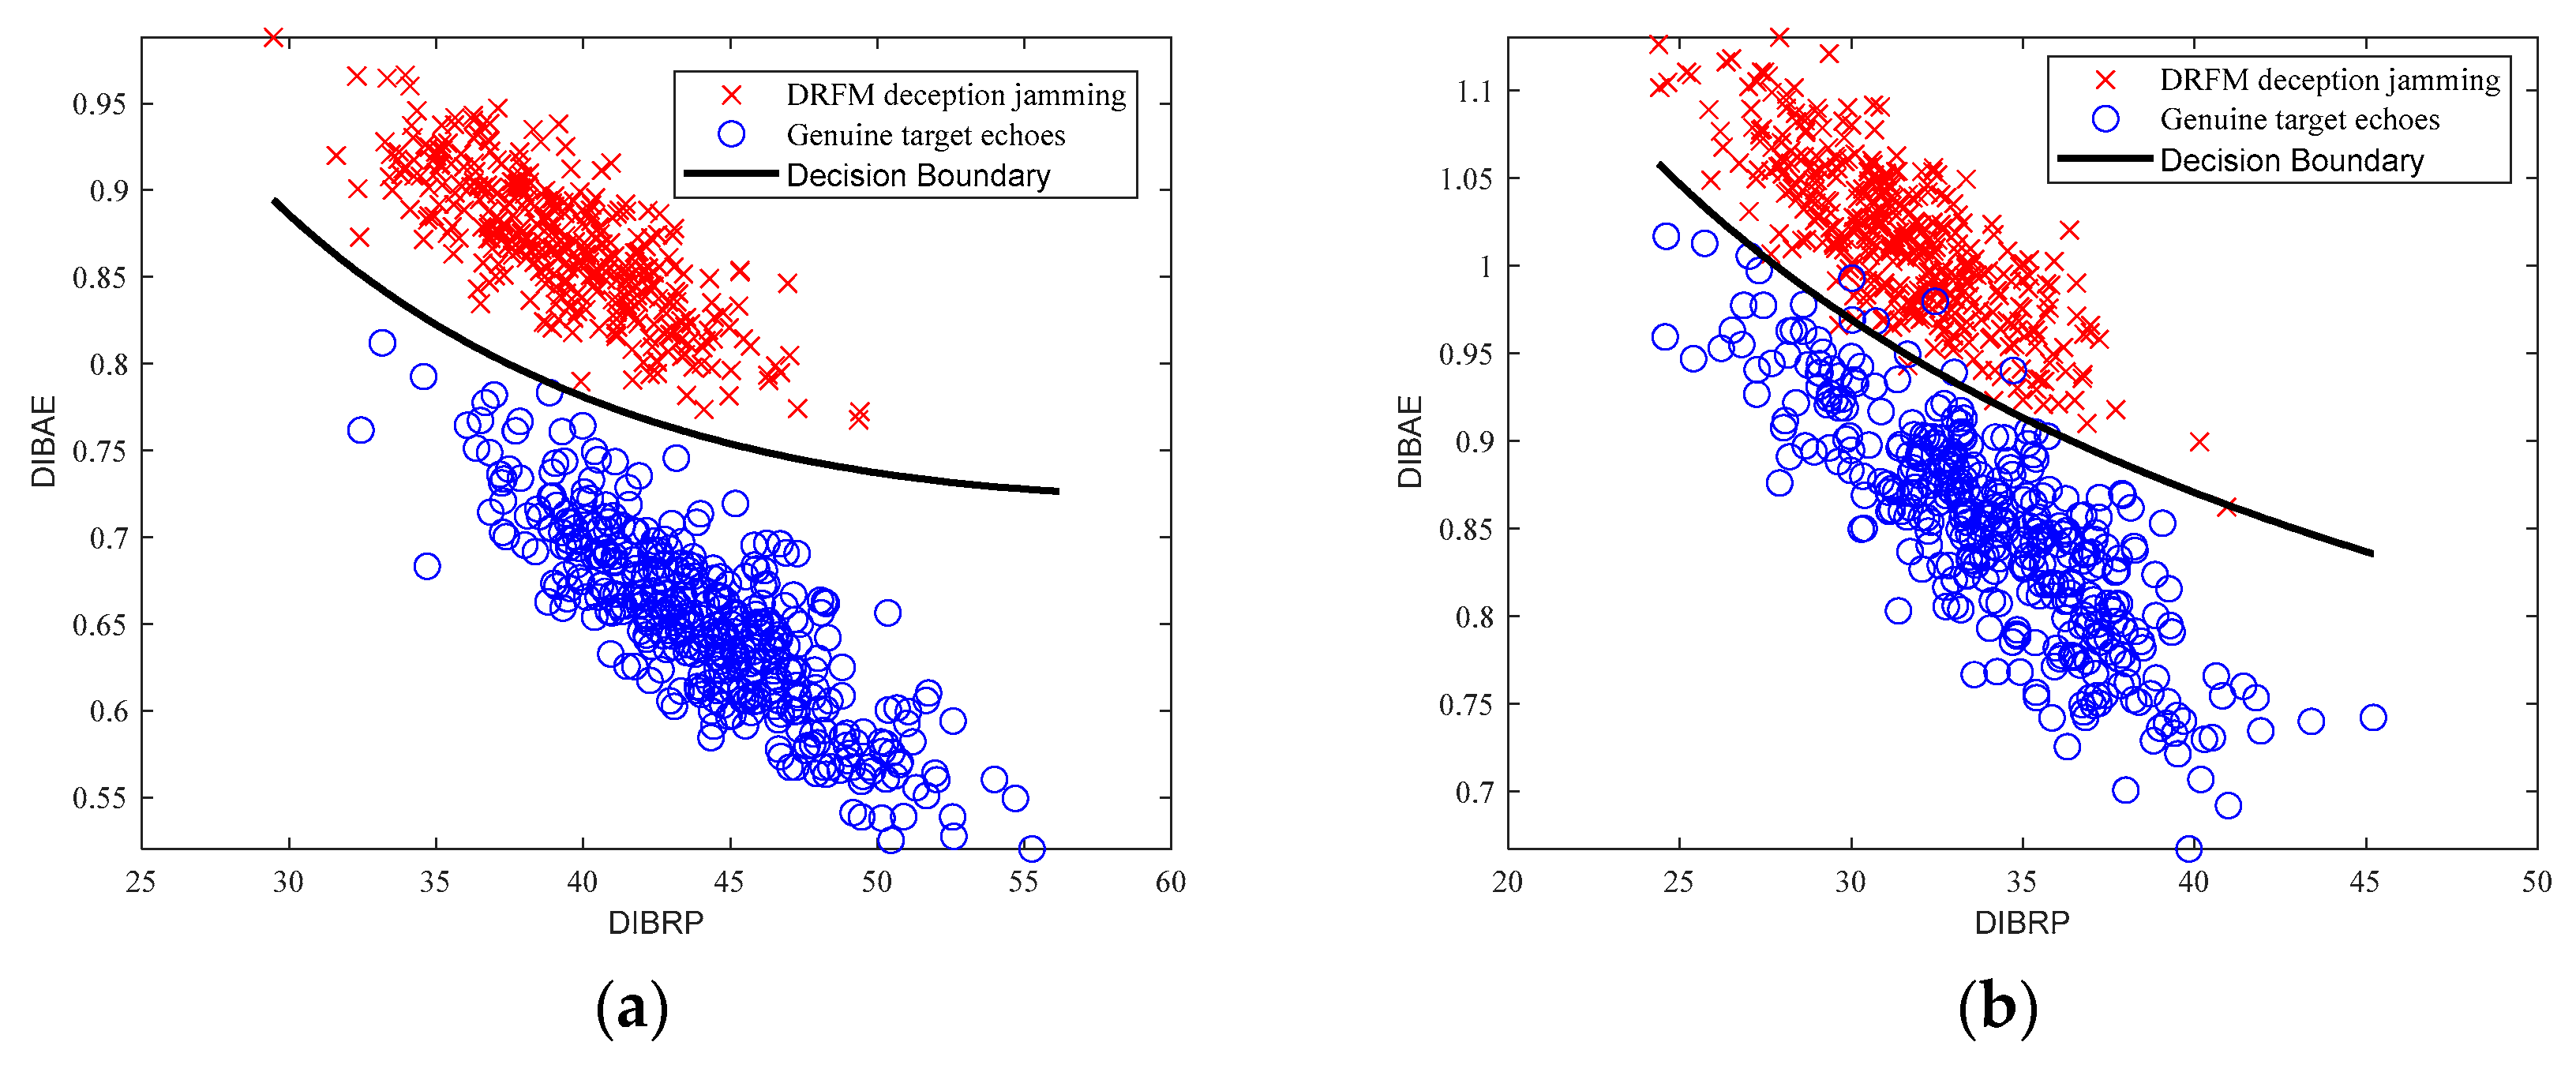
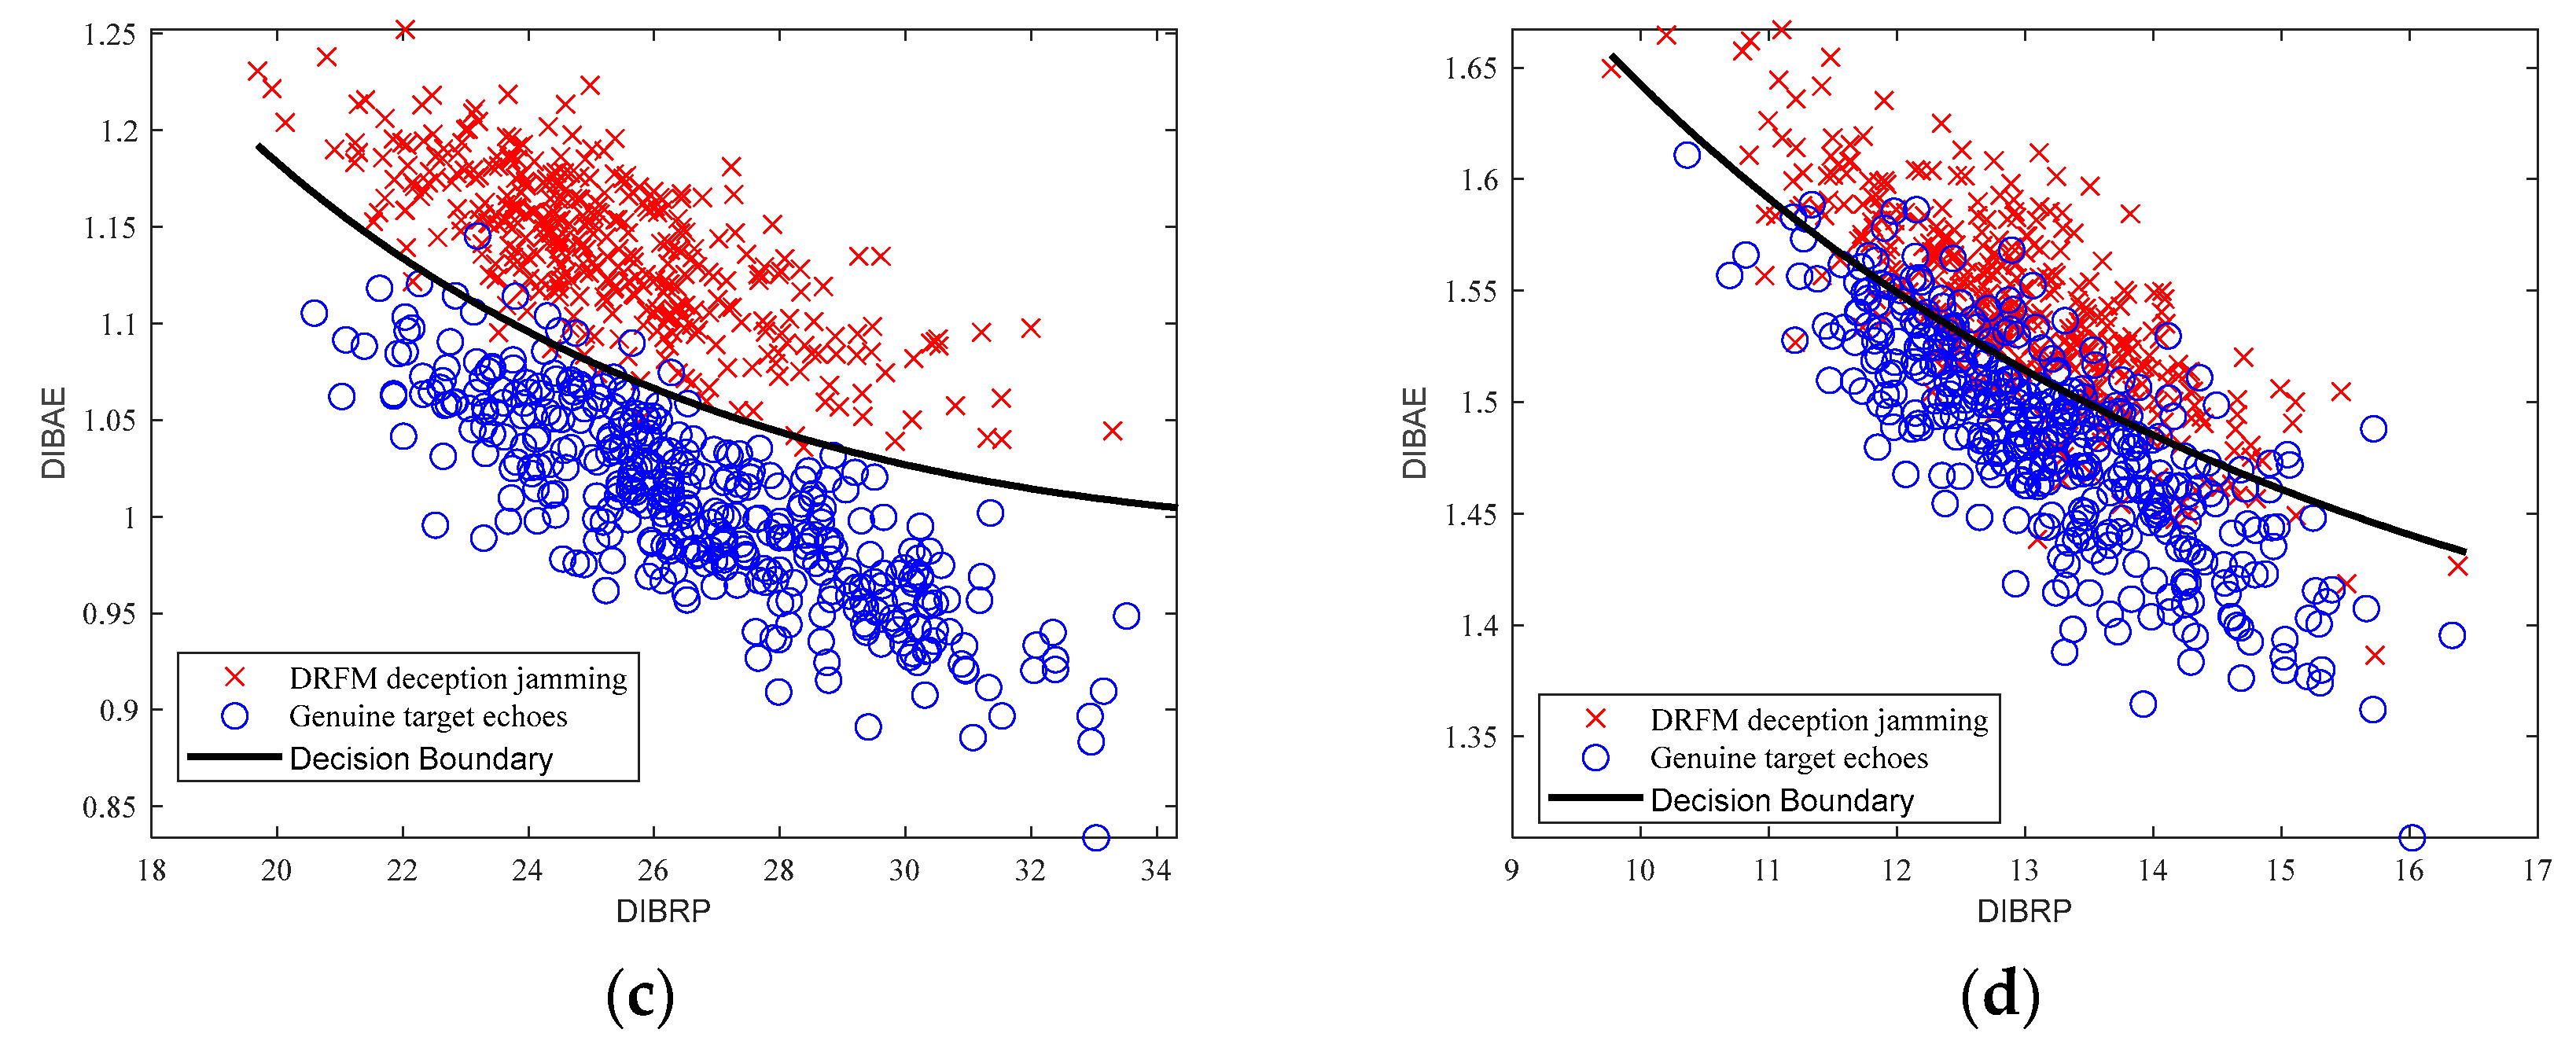
Using simulated data, radar target echo signals and DRFM deceptive jamming signals were generated under a JSR of 0 dB, with SNRs of 10 dB, 8 dB, 6 dB, and −2 dB, respectively. For each SNR level, 500 samples of genuine radar echoes and 500 samples of DRFM deception jamming signals were selected. Discriminative features were extracted from each dataset and subsequently fed into the polynomial kernel SVM classifier. The corresponding decision boundaries were numerically reconstructed based on spatial feature distributions, with visualization results presented in
Figure 9.
From
Figure 7, it can be observed that genuine radar echo signals exhibit smaller DIBAE values and larger DIBRP values, indicating superior energy concentration (i.e., better energy aggregation) and lower complexity. In contrast, DRFM deception jamming signals, due to the presence of coupling phenomena, display larger DIBAE values and smaller DIBRP values, reflecting poorer energy concentration (i.e., energy dispersion) and higher complexity.
4.4. Implementation Steps of the Algorithm
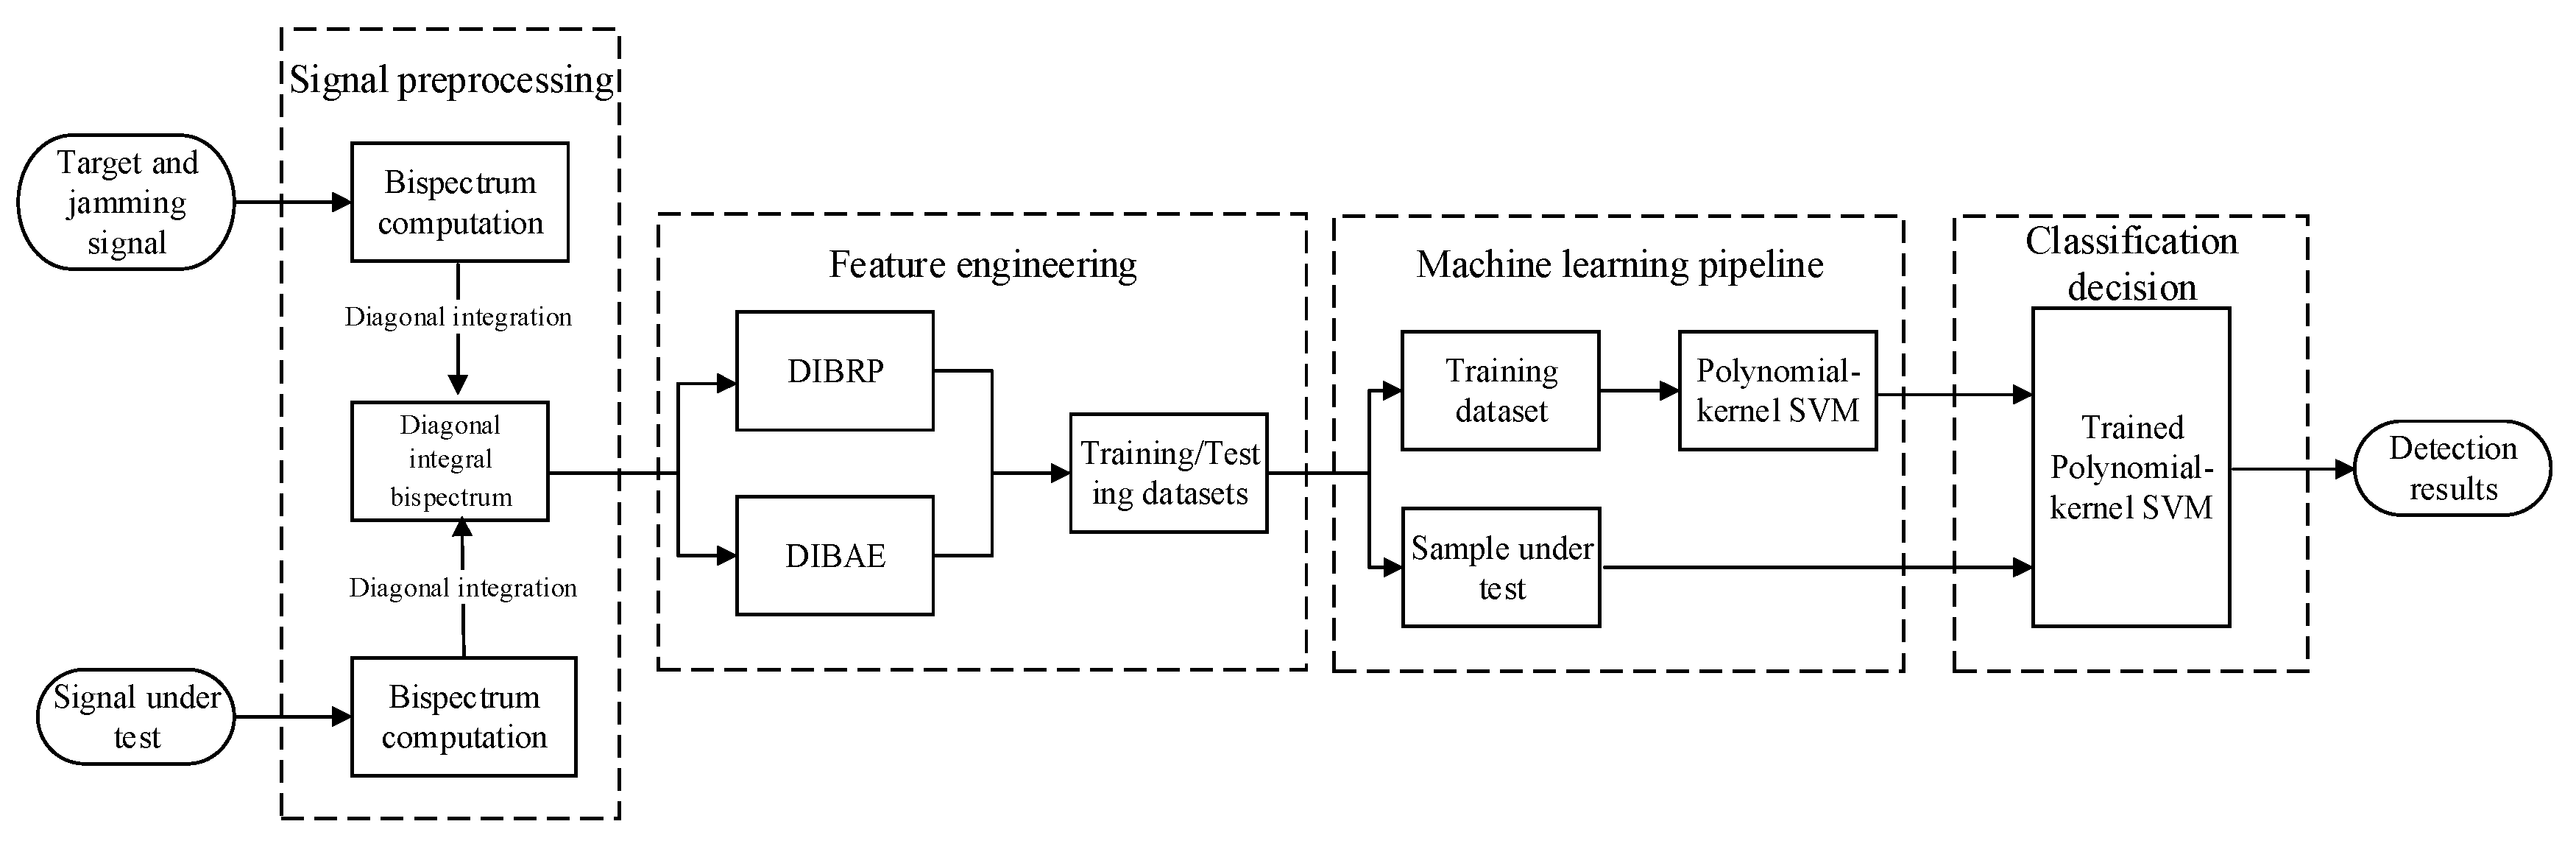
In summary, the flowchart of the DRFM deception jamming detection method based on the DIB is illustrated in
Figure 10, and the procedure can be summarized as follows:
Signal Preprocessing: The raw signal is subjected to third-order cumulant computation, generating a two-dimensional bispectrum matrix that preserves phase information while exhibiting enhanced noise robustness. Leveraging the higher-order statistical properties of the bispectrum enables the effective characterization of nonlinear coupling phenomena, demonstrating superior discriminative capability over conventional power spectrum-based approaches.
Dimensionality Reduction via Diagonal Integration: An integration operation is performed along the bispectrum’s sub-diagonal direction, compressing the 2D bispectral representation into a 1D DIB. This methodology circumvents interpolation artifacts inherent in axial or radial integration strategies while preserving the concentrated expression of bispectral differences between genuine and deceptive targets.
Multi-Dimensional Feature Extraction: From the dimensionality-reduced diagonal integrated bispectrum, two complementary discriminative features are derived: the DIBRP, which quantifies the energy concentration by measuring the relative amplitude of the dominant spectral peak, and the DIBAE, which evaluates nonlinear dynamical complexity through approximate entropy analysis. These features synergistically enhance separability by exploiting distinct signal characteristics: DIBRP captures amplitude-domain energy aggregation differences, while DIBAE isolates nonlinearity-driven irregularities induced by DRFM modulation artifacts.
Kernel SVM-Based Classification: A polynomial kernel support vector machine (SVM) is employed to address nonlinear separability challenges in the feature space. The kernel function parameters are optimized through cross-validation to balance model complexity and generalization performance, effectively mitigating overfitting risks associated with conventional linear classifiers.


