1. Introduction
Urbanization, driven by economic development and labor migration, has dramatically transformed cityscapes worldwide. Cities such as Wuhan in China have expanded both horizontally and vertically, resulting in diverse skylines and complex urban layouts [
1]. This vertical dimension, or Vertical Urban Growth (VUG), is increasingly vital as cities face pressures from population growth and land scarcity. However, it presents unique monitoring challenges compared to horizontal expansion. Urban growth patterns vary worldwide [
2]. For example, Indian cities tend to sprawl horizontally [
3], while coastal metropolises in China and South Korea expand vertically, showcasing a range of building heights [
4]. This diversity is not confined to international borders; it exists even within countries [
3].
Urban expansion has often been described as the outward expansion of urban areas into surrounding undeveloped areas. Remote sensing technologies, such as satellite and airborne systems, have been extensively used to monitor horizontal urban growth and sprawl [
5]. Techniques like object-based image analysis [
6], machine learning algorithms [
7], and change detection [
8] have significantly advanced our understanding of urban expansion [
9]. However, these predominantly 2D analyses fail to capture the vertical dimension of urban growth, which is critical in densely populated cities like Wuhan, thus leading to a partial understanding of urban dynamics [
10]. VUG monitoring is essential for managing infrastructure strain, subsurface geological risks like subsidence, and other environmental impacts associated with increased urban density.
1.1. Technological Advances in Vertical Urban Growth Monitoring
The impact of high-rise buildings on urban environments necessitates advanced tools for analyzing VUG that can provide accurate 3D measurements consistently over large areas and time periods. Methodologies to study height data, vertical development, and temporal changes have evolved, but significant challenges remain.
Photogrammetry and LiDAR: While Light Detection and Ranging (LiDAR) technology has significantly advanced the extraction of building height information and 3D city modeling, outperforming traditional photogrammetric approaches, its reliance on dedicated acquisition campaigns often limits temporal frequency and increases costs [
11,
12,
13,
14]. LiDAR’s limited availability can lead to gaps in spatial and temporal analysis needed for continuous VUG monitoring. Photogrammetry, whether aerial or satellite-based, faces limitations due to weather/illumination conditions [
15].
Optical Satellite Approaches: Alternatives like the Google Earth Engine and the European Copernicus program offer the potential for nationwide mapping of building heights using the Sentinel-1 Synthetic Aperture Radar (SAR) and Sentinel-2 optical satellite constellations [
16,
17]. In cities like Guangzhou, novel methodologies employing shadow analysis from medium-resolution imagery have improved the mapping of both horizontal and vertical urban density [
18]. Additionally, semantic segmentation with Landsat data and deep convolutional encoder–decoder networks using aerial imagery for height estimation has emerged, requiring careful handling of issues like lighting variations and spectral ambiguities [
19,
20,
21].
SAR-Based Techniques: SAR data are invaluable owing to their ability to overcome limitations related to weather and daylight and have been used for estimating building heights [
22]. SAR-based approaches such as TomoSAR [
23,
24] provide three-dimensional insights by utilizing multiple SAR images to identify persistent scatterer candidates (PSC) in urban landscapes, but they are computationally expensive. Interferometric SAR (InSAR) [
25] is pivotal in height estimation, but it faces significant challenges, particularly in the phase unwrapping process. In urban environments, the presence of tall buildings, discontinuous surfaces, and layover effects can lead to significant phase gradients and discontinuities, making phase unwrapping a complex task [
26].
Persistent Scatterer Interferometry (PSInSAR)
improves upon conventional InSAR by focusing on temporally stable point scatterers (PS), thus mitigating decorrelation issues. While highly effective for monitoring deformation in existing, stable structures, standard PSInSAR assumes scatterer stability throughout the observation period. This makes it unsuitable for monitoring VUG in its current form, as it cannot reliably track the emergence or height evolution of new structures.
To address this limitation, we develop a novel stack-processing PSInSAR approach using dense time series of high-resolution (3 m) COSMO-SkyMed X-band SAR data, specifically designed to quantify the appearance, disappearance, and height changes of structures over extended periods in complex urban environments. This choice capitalizes on SAR’s all-weather, day/night capabilities—crucial for consistent long-term monitoring—as well as its high spatial resolution for capturing urban details and frequent revisit potential over large areas. While standard PSInSAR assumes stability, this research adapts the technique to monitor dynamic VUG.
1.2. Novel Contribution to VUG Analysis
This study makes several significant contributions to the vertical urban growth monitoring studies:
Innovative Stack Processing Approach: We advance the PSInSAR methodology by implementing a comprehensive stack processing approach specifically designed for monitoring temporal changes in urban vertical growth. While previous studies have applied PSInSAR for various urban applications [
27,
28], our work is among the first to utilize a multi-temporal stack processing framework specifically optimized for tracking building height changes over time.
Temporal Resolution and Coverage: By processing 375 COSMO-SkyMed images spanning from 2012 to 2020, we provide an unprecedented temporal coverage and resolution for monitoring vertical urban development, enabling detailed analysis of growth patterns and trends that would be undetectable in studies with limited temporal coverage and resolution.
Multi-scale Analysis Framework: We developed and tested a methodological framework for analyzing vertical growth at multiple spatial scales, from 50 m grid level to district-level patterns, providing a comprehensive understanding of urban development dynamics.
Comparative Validation Approach: We implement a validation strategy that compares our PSInSAR-derived height estimates with both global datasets (e.g., Global Human Settlement Layer, GHSL) and high-precision drone measurements, quantifying the accuracy and limitations of different data sources for VUG monitoring.
While previous studies like VUG monitoring in Patna Urban Agglomeration [
29], for detecting new buildings in Athens [
30], and building height estimation in Chengdu [
31] have demonstrated the utility of PSInSAR, they have not capitalized on the stack processing method, which can significantly refine VUG measurements. Our research comprehensively evaluates the effectiveness of the PSInSAR technique for quantifying and mapping complex patterns of vertical expansion in rapidly developing cities, demonstrating how the availability of a consistent, long-term, high-resolution satellite X-band SAR time series can benefit this process.
By implementing a systematic validation process that includes comparing PSInSAR-derived height data with GHSL and independent validation data, we deliver a robust assessment of VUG in Wuhan. This approach ensures that our findings provide a detailed and precise understanding of the complex patterns of vertical expansion, addressing critical gaps in current urban remote sensing methodologies.
2. Study Area
Wuhan, the capital city of Hubei Province in central China, is a prime example of rapid urbanization and vertical growth. Strategically located at the confluence of the Yangtze and Han rivers, the city has evolved into a major economic, educational, and technological hub. As of 2020, it is home to approximately 12.44 million people, making it the ninth-largest city in China [
32,
33,
34].
The rapid urban growth in Wuhan has led to significant urban expansion and land use changes. Studies have shown that the city’s arable land area decreased by 78,322.4 km
2 while the built-up land area increased by 52,559.28 km
2 in the last three decades. This expansion has resulted in the loss of agricultural land and green spaces, leading to concerns about environmental sustainability [
35].
From 2012 to 2020 (i.e., the period monitored in this research using satellite X-band SAR data), Wuhan experienced significant transformations: its GDP grew from 775.22 billion yuan to 1561.61 billion yuan, and its population increased by 23%, from about 10.12 million to 12.44 million. These changes were driven by initiatives such as the “Rise of Central China”, which focused on enhancing infrastructure and fostering key industries [
33,
34].
This era of accelerated development was marked by extensive urban infrastructure enhancement and a boom in high-rise construction. The city’s skyline transformation, exemplified by projects like the Wuhan Greenland Center, reflects a shift towards denser VUG. These developments are crucial for accommodating an expanding population and diversifying economic activities while managing urban land resources efficiently.
Global datasets are essential for analyzing urban expansion. The GHSL’s Settlement Characteristics dataset, with its 10-m resolution, is particularly valuable. Derived from Sentinel-2 2018 composites and other GHS R2023A data, it provides a detailed view of urban landscapes. The 2018 reference data were chosen as an independent comparison dataset for this study [
36].
Managed by the European Commission’s Joint Research Centre (JRC), this dataset provides a comprehensive view of settlement patterns, building types, and height classes across various geographical locations.
Figure 1 presents a comprehensive visualization of Wuhan, a central metropolis within China’s Hubei Province, depicted through three distinct panels. The top left panel situates Hubei within the broader context of China, highlighting its national significance. The bottom left panel delineates the city of Wuhan, marked in a striking light blue color, related to its surrounding provincial areas in blue. The GHSL map, positioned on the right side of
Figure 1, categorizes Wuhan’s buildings into five height classes ranging from less than 3 to over 30 m.
With regard to the year 2018, the map highlights a notable concentration of tall buildings exceeding 30 m primarily in the Jianghan District, located northwest of the Yangtze River. This area, characterized by its high-rise structures, contrasts sharply with other districts like Wuchang and Hongshan, where the skyline is more diverse, featuring a mix of shorter buildings interspersed with taller structures. Additionally, the peripheral areas of Wuhan predominantly feature buildings shorter than 15 m, illustrating a gradient of urban density that diminishes with distance from the city center.
District-Level Socio-Economic Growth Analysis
The socio-economic development in different districts of Wuhan from 2012 to 2020 highlights the variability in growth patterns across the city. The districts analyzed include Caidian, Dongxihu, Hanyang, Hongshan, Jiang’an, Jianghan, Jiangxia, Qiaokou, Qingshan, and Wuchang. Key socio-economic variables such as GDP, government revenue, gross output construction, and population density were examined for percent growth during this period.
Dongxihu district experienced the highest GDP growth at 17.44%, followed by Wuchang at 16.30%. In contrast, the Caidian and Hanyang districts saw relatively lower GDP growth rates of 2.52% and 2.80%, respectively as shown in
Table 1. This significant variation in GDP growth reflects the differing economic activities and development policies implemented across the districts.
In terms of government revenue, Wuchang district again showed the highest growth at 17.63%, indicating strong fiscal performance and possibly effective tax collection and economic policies. On the other hand, Caidian was the only district with a negative growth rate of −0.53%, which could be due to various factors, including economic downturns or reduced investment in the area.
Hongshan district saw a substantial increase in gross output construction at 31.93%, reflecting significant infrastructure development. This suggests a focus on expanding urban infrastructure and building projects in Hongshan. In contrast, Qingshan had the lowest growth rate at 1.54%, which might indicate slower construction activity or a different developmental focus in that district.
Population density changes also varied significantly across the districts. Jianghan district experienced an exceptional increase in population density of 32.98%, indicative of intense urbanization and possibly a high influx of people moving into the area. Conversely, Jiang’an district saw a decline in population density by −16.84%, possibly due to migration out of the district or re-zoning efforts that changed the residential patterns.
These distinct urban growth trends in Wuhan present a compelling case for study to understand the driving forces, impacts, and challenges associated with such development. Knowledge gained from this analysis can be instrumental in supporting sustainable and equitable urban planning and development, making Wuhan an ideal research area for studying VUG using PSInSAR techniques.
3. Methodology
This study employs PSInSAR, a technique suitable to identify stable radar targets (namely, the PSC) over time, to monitor VUG and its temporal variation in Wuhan using a long time series of COSMO-SkyMed SAR data (2012–2020). To effectively manage this extensive dataset (375 images) and capture detailed temporal VUG dynamics, we developed and implemented a Stack Processing PSInSAR workflow, visualized in
Figure 2.
Our methodology is divided into three distinct phases, each crucial for ensuring the accuracy, consistency, and computational feasibility of analyzing the 8-year data stack.
Full Stack Processing: The primary goal of this initial phase is to establish a robust and consistent geodetic framework for the entire time series. This involves analyzing all 375 COSMO-SkyMed images together to select the optimal master image and, critically, to identify a highly stable reference point based on long-term signal stability, evaluated using the Amplitude Stability Index (AS-Index) across the full stack. This common reference point serves as the essential anchor for comparing height estimations across different time periods processed in the subsequent phase.
Sub-Stack Processing: Handling the entire 8-year dataset in a single PSInSAR process is computationally demanding and can obscure finer temporal details of VUG. Therefore, this second phase divides the dataset into 13 smaller, sequential, and manageable stacks (hereafter referred to as ‘stacks’), each containing 28 images. Each sub-stack is processed independently using consistent parameters and anchored to the common reference point identified in the Full Stack phase. This allows for efficient processing and the detailed extraction of height information over shorter time intervals, capturing the temporal evolution of VUG. This phase directly implements the core of our innovative stack processing approach for detailed temporal analysis.
Post-Processing: The outputs from the 13 individual sub-stacks require integration and refinement. This crucial final phase involves merging the PSC data, addressing noise and data gaps inherent in time series analysis, applying our multi-scale analysis framework by aggregating results onto a 50-m grid, extracting final VUG metrics (e.g., maximum height per grid, time series), and preparing the results for comparative validation against external datasets.
The figure details the three phases of the methodology: full-stack processing, sub-stack processing, and post-processing. Key components include the AS-Index for identifying stable scatterers, the reference point for height estimation consistency, and the Atmospheric Phase Screen (APS) for correcting atmospheric disturbances.
3.1. Data Sources
The COSMO-SkyMed dataset comprises 375 ascending mode StripMap HIMAGE scenes of Wuhan collected and provided by ASI over the period from 29 May 2011 to 21 November 2020. The whole dataset of 375 was exploited for the full stack processing. On the other hand, as there were only 11 images available in 2011, we did not use these earliest images in the sub-stack processing, which therefore focused on the images acquired between June 2012 and November 2020. These images feature horizontal transmit and receive (HH) polarization, with an incidence angle of 26.6° at the scene’s center. The data have a spatial resolution of 3 × 3 m (range × azimuth) and a swath width of approximately 40 km. The temporal resolution varies throughout the dataset; while the average revisit time was approximately 8 days, there were several gaps in acquisition timing (see
Figure 3a) as detailed below. COSMO-SkyMed images were collected through the COSMO-SkyMed background mission [
37]. The background is a low-priority acquisition plan by which the constellation collects images using the available capacity when no other orders are tasked. The images are taken over predefined targets, e.g., large cities, and the idea is to build time series as regularly as possible. However, given the low priority and the fact that the collection was made only if there was capacity onboard the satellites, there was no requirement to ensure that the revisit time was always kept. Therefore, the time series displayed in
Figure 3a is the best that the constellation could provide over Wuhan. These data were processed using SARPROZ software (version 2021.0) for PSInSAR analysis [
38,
39].
Of the 375 images used (2012–2020), 119 images were acquired between 2012 and 2015. After this period, as already observed in [
40], there was a notable data gap of 120 days. For effective PSInSAR analysis, it is essential to exploit a sufficient number of images in each processing unit to ensure consistent phase unwrapping and scatterer identification.
To maintain consistency in height extraction while managing computational requirements and accounting for the fact that the COSMO-SkyMed time series is long but made of subsets of more regular acquisitions, we established that each processing unit should contain at least 20 images. Upon reviewing the temporal distribution of our data, we determined through testing that using 28 images per stack provided an optimal balance. This number adequately balanced (a) processing efficiency, (b) the statistical reliability needed for robust PSInSAR analysis (comfortably exceeding the 20-image minimum), and critically, (c) the need to avoid the most significant data acquisition breaks. This division created 13 separate stacks of 28 images each (
Figure 3a). While the calendar duration covered by these stacks varied (
Figure 3b), the use of a consistent number of images allowed for standardized processing.
3.1.1. Digital Elevation Model (DEM)
We incorporated NASA’s 90-m resolution Shuttle Radar Topography Mission (SRTM) Digital Elevation Model (DEM) to subtract topographic phase components from the interferograms and facilitate geocoding procedures.
3.1.2. Validation Data
Temporal changes were validated using a series of optical images from Google Earth Pro (version 7.3.6, Google LLC, Mountain View, CA, USA). Additionally, height data were validated through a comprehensive field study using a DJI Mavic 3 Pro drone (SZ DJI Technology Co., Ltd., Shenzhen, China) in a spatially confined area of Hanyang district (
Figure 4). This area was selected for its dynamic urban expansion and the variability in building heights, with structures ranging from 3 to approximately 150 m. Notably, since 2012, the area has witnessed a substantial increase in buildings over 100 m, with hundreds constructed by 2020.
The drone surveys, conducted on 21 March 2024, with high-resolution imagery, covered approximately 504 buildings, collecting precise latitude, longitude, and building height data. While it may seem to be a limited validation dataset, it is worth noting that the surveyed buildings quantitatively provide a high spatial density of validation measurements in a rapidly expanding urban sector of Wuhan, where a multitude of PS candidates are present. The collection of such a dataset was already time-consuming. More extensive ground-truth surveys would have demanded an enormous effort, potentially reducing the overall cost-effectiveness of the research approach.. Thus, a trade-off was attempted, with consideration for the restrictions of drone flights over the urban areas in Wuhan. This robust dataset verified the heights recorded via PSInSAR and enhanced our understanding of the district’s vertical development.
Our empirical investigation revealed that most structures in the selected area of the Hanyang district typically range between 100 and 130 m, with some buildings reaching up to 150 m.
3.1.3. Global Human Settlement Layer (GHSL)
As introduced in
Section 2, the GHSL dataset was used as an independent, albeit lower-resolution, reference for comparison with our PSInSAR-derived height estimates, particularly for the year 2018.
3.1.4. Socio-Economic Data
District-level socio-economic data for Wuhan (2012–2020), including GDP, government revenue, gross output construction, and population density, were sourced from the Wuhan Municipal Statistics Bureau (
https://tjj.wuhan.gov.cn/tjfw/tjnj/ (accessed on 20 April 2025)). These data were used to explore potential correlations between economic indicators and observed VUG patterns in the Results.
3.2. PSInSAR Full Stack Processing
The key steps in PSInSAR full stack processing are as follows:
3.2.1. Reference Image Selection and Coregistration
The reference image, crucial for coregistration and interferogram formation, was selected to minimize spatial and temporal decorrelation. This selection was based on its optimal position in terms of both temporal and perpendicular baselines relative to the other images in the dataset. The perpendicular baseline refers to the spatial separation between satellite positions, while the temporal baseline measures the time difference between acquisitions. By optimizing these parameters, we minimize the cumulative decorrelation effects, which are essential for reliable interferometric analysis [
41].
The selected reference image from 18 May 2016 optimally represents the dataset’s central tendencies, with minimal average temporal and perpendicular baselines (731 days and 24 m, respectively) relative to all other images. This image serves as the reference point for all 13 stacks, each containing 28 images. The consistent application of this reference image across different temporal segments is crucial in maintaining coherence, especially given Wuhan’s significant urban changes during the study period.
3.2.2. PSC Extraction and Geocoding
After coregistration, stable radar reflectors or PSC were extracted. These typically include buildings and other rigid structures with strong radar reflectivity and minimal temporal decorrelation. The identified scatterers were then geocoded using SRTM DEM, which is essential for accurate topographic error mitigation in SAR data.
3.2.3. Reference Point Selection
The selection of a stable reference point is crucial in PSInSAR processing, particularly in our multi-stack approach. This selection process is fundamentally guided by the AS-Index, which quantifies the temporal consistency of radar reflectivity. Standard PSInSAR methodologies rely on a global temporal stability approach, expressed mathematically as:
where
and
are computed over all N acquisitions. However, this global approach has significant limitations when applied to dynamic urban environments, particularly in areas experiencing rapid vertical growth.
Our methodology addresses these limitations by introducing a stack-wise stability criterion:
where
and
are computed for the k-th sub-stack. This segmented approach enables the detection of PS points with
> 0.85 in any sub-stack, allowing us to capture transient scatterers that emerge during urban development phases.
The reliability of our methodology is maintained through three key innovations:
Reference Point Consistency: We maintain a carefully selected reference point across all stacks, ensuring the comparability of height measurements between temporal segments. This consistency is crucial for tracking vertical growth over time.
Adaptive PS Selection: Rather than applying amplitude stability criteria across the entire time series, we evaluate stability within each stack independently. The complete set of PS is defined through a union operation across all stacks:
Integration Framework: Our post-processing methodology robustly combines results from multiple stacks, creating a coherent timeline of urban vertical growth.
While conventional PSInSAR processing typically recommends an AS-Index threshold of 0.75 [
42], we have implemented a more stringent threshold of 0.85 for reference point selection. This decision was based on the observation that potential PSCs with AS-Index values below 0.85, while potentially stable within individual stacks, often exhibited appearance/disappearance across the 13 stacks due to inherent amplitude fluctuations (illustrated in
Figure 5). Selecting a reference point requires consistent stability throughout the entire observation period to serve as a reliable anchor for relative height estimations across all stacks. The 0.85 threshold provided this necessary margin, ensuring the chosen reference point maintained high stability and consistent presence across the dynamic temporal segments, thus guaranteeing the integrity of the multi-stack comparison.
Figure 5 illustrates the amplitude values of each image and AS-Index measurements over time for our chosen reference point at coordinates (30.554607°N, 114.29445°E) across thirteen stacks. Each stack represents a series of SAR images processed together, and the color-coded bars indicate the amplitude stability within each stack. The scatter plot shows fluctuations in amplitude and AS-Index values for each image within the stacks. While most stacks maintain AS-Index values above the 0.85 threshold, there are instances of significant amplitude variability, particularly in later stacks. This variability could be attributed to factors such as atmospheric disturbances, including water vapor, or changes in satellite orbit, which can affect the propagation of radar signals.
This approach, being the first attempt to process PSInSAR data in stacks for VUG, introduced unique challenges, particularly in maintaining a consistent reference point due to amplitude discontinuity. The selected reference point generally exhibited a high AS-Index, indicating substantial temporal stability. Nonetheless, the novel challenges of managing multiple stacks necessitated rigorous time-series analysis of amplitude values to confirm the reference point’s reliability throughout the study period.
3.2.4. Deformation and Elevation Model Construction
To ensure our reference point shows minimal displacement, we included an estimation of the APS to correct for any atmospheric delays that might affect the accuracy of our estimates. The deformation and elevation models are developed through an iterative process aimed at minimizing the discrepancies between observed and modeled phase values. This iterative refinement is aimed at minimizing the sum of the squared discrepancies between the observed phase values and those predicted by the model.
To ensure the accuracy of these models, we conducted extensive parameter testing. We found that the range of the linear velocity to ±50 mm and allowing for residual topographic error estimation of ±200 m provided the best balance. These parameters were particularly effective in our study area, accommodating the complex dynamics introduced by high-rise buildings and other structural variabilities. This setting maintains high temporal coherence in APS estimation, reinforcing the reliability of our subsequent analyses and findings.
As we already estimated the AS-Index and selected the PS point as a reference point with AS-Index higher than 0.85 in all the sub-stacks, now we also confirm that this reference point shows minimal displacement and velocity variations. This point also features minimal differences in height and residual height values relative to other PS points, ensuring it serves as a robust datum for height estimations across the dataset. After evaluation, we used this PS point as our reference point and estimated the height of other PS points relative to it.
3.3. Sub-Stack Data Processing
In the sub-stack data processing phase, we initiated our analysis by carefully examining the first set of 28 images. This meticulous review aimed to extract all PSCs with sufficient amplitude stability. These PS were then geocoded using their SAR coordinates, ensuring each was accurately mapped within our study framework.
For each sub-stack, we conducted an APS estimation to correct atmospheric phase delays that could affect the accuracy of our estimates. We consistently applied the same parameters as in the full stack processing—specifically, a linear velocity of ±50 mm and a height variation of ±200 m. This uniformity in parameter settings across all stacks ensured the coherence and comparability of our results.
After setting these parameters, we continued with the selected reference point from the full stack processing. We assessed the quality of the APS estimation by analyzing the temporal coherence of PS points selected within each sub-stack using an AS-Index threshold > 0.8. This ensured reliable points were used for estimating atmospheric delays specific to that sub-stack. Based on these findings and following the recommendations [
42], we adapted our selection criteria for the final set of PS points used for height estimation within each sub-stack to be less strict for multi-image sparse processing, specifically setting the AS-Index threshold above 0.75 to ensure adequate data quality and spatial coverage. This adjustment allowed for a denser collection of PS points, facilitating more comprehensive coverage across the study area.
Ultimately, all 13 image stacks were processed using these standardized parameters, referencing the established common point for consistency. The extracted PS points were geocoded and integrated into a Geographic Information System (GIS) for further analysis and visualization. For generating vertical height maps, we utilized only those PS points demonstrating a high AS-Index (higher than 0.75). This selective criterion ensured that the height data derived from these points were accurate and reflective of stable surface features, providing a robust basis for detailed analysis of vertical urban growth.
3.4. Post-Processing
The post-processing phase commenced after identifying PS points meeting the AS-Index > 0.75 criterion within each of the 13 sub-stacks. To construct the comprehensive dataset for VUG analysis, all PS points satisfying the >0.75 threshold in any individual sub-stack were initially merged based on their geocoded coordinates. This merged dataset, containing points identified across different temporal segments, forms the foundation for subsequent analysis. The following steps detail how this consolidated dataset was cleaned, aligned temporally, and processed to derive the final height change information.
3.4.1. Merging and Cleaning Data
To tackle these issues, we first consolidate all PS points, removing any with negative height values that were not reliable. We then align each point by its SAR coordinates, enabling us to track the height values consistently across each stack. This alignment is crucial for monitoring changes over time and correcting any discrepancies in the data.
3.4.2. Addressing Missing PS Points and Noise
PSCs are critical for accurate PSInSAR analyses; however, the inconsistency in stacks makes it challenging. Fluctuations in the AS-Index can cause some PS points to appear and disappear intermittently. This variability poses a significant challenge in maintaining a reliable dataset for VUG analysis.
This phenomenon is illustrated in
Figure 6, which shows the range of AS-Index values (from 0.80 to 0.94) across different stacks. These fluctuations highlight the reason behind the fact that only a fraction of the points—41,000 out of a potential five million—is consistently detectable across all the COSMO-SkyMed SAR stacks. This represents a significant reduction in data points that can be reliably used for height measurement and analysis.
To manage noise within the time series data derived from the merged PS points aligned by their consistent SAR coordinates, we address potential artifacts in the height estimation for individual points over time. Specifically, we identify and replace spurious height estimates where the difference between consecutive stack measurements for the same aligned PS point exceeds 3 m. This threshold was directly informed by our high-resolution drone survey data, which indicated that the typical floor height in modern Wuhan constructions is approximately 3 m. Using this physically meaningful value helps filter out large, unrealistic jumps in the estimated height of presumably stable scatterers. Such jumps are considered more likely attributable to processing noise (e.g., phase unwrapping errors, residual atmospheric effects specific to a stack) rather than actual changes in the physical scatterer’s height. While this stack-processing approach for VUG estimation is novel, this filtering step based on observed floor height provides a practical method for cleaning the individual PS time series before assessing overall growth trends.
Subsequently, to tackle incomplete data series (i.e., series where a PS point, which was initially detected, is missing in some later stacks), we fill the missing height values using the median height calculated from the available data for that specific PS point. This step is performed carefully to ensure that filling only occurs for stacks processed after the initial detection of each PS point. For instance, if a PS point first appears in the 2016 stack, any missing values in subsequent stacks are filled based on its available height data from 2016 onwards. These procedures—noise filtering based on the 3 m threshold and gap filling—aim to improve the continuity and reliability of the height information associated with each individual PS point, providing a cleaner dataset for subsequent analysis of temporal trends and spatial aggregation for VUG assessment.
3.4.3. Grid Size Selection
During the post-processing phase, handling spatial analysis across 13 stacks presented significant challenges. Each stack consists of datasets containing a variable number of PSCs with irregular spatial distribution, making it difficult to conduct an effective time-series analysis of vertical urban growth directly from these points.
To address this challenge, we implemented a gridded approach by overlaying grids of different sizes on the study area and aggregating PS points within each grid cell. We systematically tested six different grid sizes: 200, 150, 100, 75, 50, and 20 m, evaluating each based on three criteria:
Spatial resolution adequacy: The grid cell’s ability to capture distinct buildings and relevant urban features without excessive spatial averaging.
Ensuring a sufficient number of PSCs fall within most grid cells across the different stacks to allow for robust height aggregation and minimize spatial gaps in the analysis.
Validation accuracy: Comparing the aggregated height estimates derived from the PSInSAR data (for each tested grid size) against our independent, high-resolution drone-collected building height data within the Hanyang validation zone.
The evaluation revealed clear trade-offs. Coarser grids (200 m and 150 m) performed poorly on the first criterion, obscuring important details of the urban landscape by merging multiple distinct buildings into single cells. Conversely, the finest grid size (20 m) often failed the second criterion, resulting in many cells with insufficient PSC density for reliable height estimation, creating a sparse and discontinuous representation of the urban fabric.
Intermediate sizes (100 m, 75 m, 50 m) offered a better compromise between spatial detail and point density. The final selection of the 50 m grid was decisively supported by the validation accuracy assessment (criterion 3). Our comparative analysis showed that the aggregated height values calculated within the 50 m grids exhibited a stronger correlation and lower overall estimation error when contrasted with the high-resolution drone validation data, particularly demonstrating better performance than the 100 m and 75 m grid results.
Thus, the 50 m grid size was chosen to provide the optimal balance across all three criteria. It maintained sufficient spatial detail, generally ensured statistical reliability with adequate PSCs per cell, and yielded the most accurate height estimations when compared against ground truth data. This 50 m grid resolution enabled the subsequent extraction of maximum building heights per cell and facilitated a more robust and detailed analysis of vertical urban growth dynamics over time in specific areas of the city.
3.4.4. Spatial Joining and Outlier Removal
We utilized a 50-m spatial grid aligned with the 2020 PS points dataset and employed spatial joining in ArcMap (version 10.5, Esri, Redlands, CA, USA) to integrate data across the 2012–2020 span. This method ensured the comprehensive utilization of PS points within intersecting grid areas. Post-spatial joining, we addressed data quality by removing outliers using the interquartile range (IQR) method [
43].
We selected the IQR approach over simpler methods (such as percentile thresholding or standard deviation) because it is more robust to non-normal distributions, which are common in urban height data due to the mix of low-rise and high-rise buildings. The IQR represents the middle 50% of the data and is calculated as the difference between the upper (75th percentile) and lower (25th percentile) quartiles [
43].:
Any data points that fell above
or below
, where
Q1 and
Q3 are the 25th and 75th percentiles, respectively, were considered outliers and removed [
44]. While standard deviation-based approaches assume normal distribution, our comparative analysis showed that the IQR method better preserved true height variations while effectively removing erroneous measurements. We also tested the standard deviation approach, but found that it retained too many noise points in our dataset.
3.4.5. Maximum Height Value Extraction
Following outlier removal, we extracted the maximum height values within each 50-m grid by focusing on PS points exhibiting the highest elevations. This selective aggregation allowed us to accurately determine building heights and effectively manage the varied distribution of PS points, ensuring our height estimations reflect actual vertical growth within each grid.
3.5. Validation Framework
3.5.1. Reference Data Sources
The validation methodology employs two independent reference sources to assess the accuracy of height estimations. The primary reference consists of high-resolution drone measurements providing precise height information within the study area. This is complemented by Global Human Settlement Layer (GHSL) data, which offers an additional independent source for height validation. The validation focuses on a selected area within the Hanyang district of Wuhan, chosen for its representation of diverse urban structures and vertical development patterns.
3.5.2. Height Classification Framework
The validation methodology implements a systematic classification approach using five height categories
These categories are designed to capture the range of urban structures present in the study area while maintaining compatibility with GHSL height classifications.
where
represents the allowable error margin for each height category, which is determined based on the resolution and accuracy characteristics of the reference data.
It is important to note the temporal difference between the end of the PSInSAR observation period (November 2020) and the drone survey (March 2024). While VUG is a dynamic process, this validation primarily aims to assess the accuracy of the PSInSAR-derived height estimates for structures that were largely completed by late 2020 and were presumed stable in height during the intervening ~3.5 years. To confirm this stability, we visually inspected historical Google Earth imagery (available for the 2018–2023 period) for the specific validation area, verifying that the vast majority of buildings measured by the drone in 2024 were already present and appeared structurally complete by the end of our PSInSAR observation window. Therefore, the drone data provide a high-accuracy ground truth snapshot, against which the final state captured by the PSInSAR analysis (primarily the 2020 results, or specific years like 2018 for comparison with GHSL) can be evaluated. This allows for the assessment of systematic biases (e.g., under/overestimation) and overall accuracy for completed buildings. Potential minor height changes or significant construction/demolition occurring solely between late 2020 and early 2024 for a small subset of surveyed buildings would represent a limitation of this specific temporal comparison.
4. Results
This section presents the results of the VUG analysis in Wuhan from 2012 to 2020, derived from the processed PSInSAR data. Before presenting the main spatiotemporal patterns, we illustrate the effectiveness of the post-processing steps detailed in
Section 3.4.
4.1. PSInSAR Data Refinement and Quality
The raw output from PSInSAR processing required substantial refinement (
Section 3.4) to ensure accuracy for VUG analysis.
Figure 7 illustrates the effectiveness of our data cleaning and processing steps, comparing the mean heights across all stacks before and after addressing inconsistencies (like missing points and noise) and performing the grid-based maximum height extraction. The initial irregular mean heights were influenced by fluctuations in detectable PS points between stacks, the inclusion of noise (including erroneous negative values), and the inherent diversity of PS point elevations ranging from building bases to tops. The processed data (blue bars) show a significantly smoother and more plausible trend in mean height across the stacks, demonstrating the robustness of our post-processing methodology in generating more reliable height estimations suitable for analyzing high artificial structures.
Figure 7 illustrates the effectiveness of our data cleaning and processing steps, comparing the mean heights across all stacks before and after addressing inconsistencies and noise. The processed data show a significant improvement in height estimation, demonstrating the robustness of our methodology.
The figure highlights the initial irregular mean heights, influenced by the fluctuation in PS points, the inclusion of noisy points (including negative values), and the diversity of point elevations ranging from the building base to the top. Our post-processing steps, which involve extracting the maximum value within each grid and the median within the grids, provide a more accurate analysis of high artificial structures compared to the raw data.
Furthermore,
Figure 8 illustrates how post-processing transforms the sparse PS point data into a more usable, gridded format (50-m grids) for comparison with validation data (obtained by drone). Extracting accurate height information directly from the raw PS points (pre-processing) was challenging due to noise and scatter. Post-processing, including outlier removal and maximum value extraction within grids, makes it easier to discern representative heights for comparison and time-series analysis, although some residual noise can still affect measurements.
4.2. VUG from 2012 to 2020—Wuhan
Wuhan has undergone significant changes in its skyline over the past decade, reflecting its economic, social, and environmental evolution. These changes are visually documented in
Figure 9, which includes color-coded maps and Google Earth images illustrating the variations in building heights over time. The tallest structures are marked in red, while the shortest are shown in blue, with heights ranging from 0 to 200 m.
Transitioning from the macro view of the entire city to a focused examination, we delineate a specific region of interest within the Hanyang district, outlined by a rectangle. The zoomed-in area in a rectangle in the middle plays a critical role in detailing the height changes across the selected years. A clear trend emerges: the previously sparse landscape dotted with low-rise buildings is now bristling with a sharp increase in high-rise structures. This change is delineated in
Figure 8, where the right-hand Google Earth images provide a qualitative perspective, showcasing the area’s dense urbanization by 2020.
Initially depicted as a relatively low-rise city in 2012, Wuhan has seen a significant increase in taller buildings by 2016, with this trend continuing robustly into 2020. The maps show a broad distribution of these structures, indicating ongoing urban development and vertical growth across the city.
However, this expansion is not uniformly distributed across all districts. It is particularly pronounced on the northeastern riverside of the Wuchang district and the Hanyang district. Clusters of high-rise buildings are also significantly evident in the Hongshan and Jianghan districts. These areas have emerged as diverse centers of growth, highlighting the heterogeneous nature of urban expansion within the city’s landscape.
Contrasting with this are the more modest growth patterns in peripheral parts of Wuhan, consistent with the 2018 GHSL data, which shows moderate building heights as shown in
Table 2. Specifically,, Caidian, Dongxihu, Jiangxia, and Qingshan have fewer tall buildings than the central districts. This contrast highlights regions of intense urbanization driven by both local and national economic and transportation policies [
45,
46].
However, discrepancies in the GHSL data, particularly in the Hanyang district, where our results indicate the presence of buildings over 100 m tall, contrary to the GHSL dataset’s depiction of buildings under 30 m, prompted further investigation. We conducted fieldwork to verify whether the discrepancies arose from inaccuracies in the PSInSAR data or issues with the GHSL data. This field verification aimed to ensure the reliability of our findings and to address any anomalies between observed and expected building heights.
Over the past decade, Wuhan has experienced significant changes in its skyline, reflecting its economic, social, and environmental evolution. These transformations are visually documented in
Table 2, which shows the number of grids by building height in various districts from 2012, 2016, and 2020. The heights are categorized from less than 3 m to over 90 m, indicating a substantial increase in taller buildings over time.
In particular, the Hanyang, Wuchang, and Hongshan districts have seen pronounced increases in buildings over 90 m. For example, in Hanyang, the number of grids containing buildings taller than 90 m rose from 17 in 2012 to 1122 in 2020, representing a 66-fold increase. Despite Hanyang’s moderate GDP growth of 2.80%, this surge in high-rise buildings corresponds with a significant 14.17% increase in government revenue, suggesting a link between fiscal health and vertical development. Similarly, Wuchang has demonstrated significant vertical growth, with the number of such grids increasing from 86 in 2012 to 1132 in 2020, aligning with high economic development and a government revenue increase of 17.63%.
Hongshan shows the most dramatic rise, with grids containing buildings over 90 m growing from 68 in 2012 to 2311 by 2020, a substantial 34-fold increase. This aligns with substantial growth in gross output construction (31.93%) and GDP (9.17%), underscoring rapid urban development. In contrast, districts like Caidian and Qingshan, which displayed lower socio-economic growth, witnessed more modest increases. Caidian’s grids with buildings over 90 m grew from 6 in 2012 to 342 in 2020, and Qingshan’s from 9 to 389.
These results demonstrate how economic prosperity and infrastructure investments drive the construction of taller buildings, contributing to the changing skyline of Wuhan. While a detailed investigation into specific municipal zoning codes or urban master plan revisions between 2012 and 2020 is beyond the data scope of this remote sensing analysis, the observed spatial patterns—particularly the concentration of VUG in central districts like Hanyang, Wuchang, and Hongshan—are highly consistent with typical urban planning strategies favouring high-density development in core areas with established infrastructure. The previously mentioned strategic development plans [
33,
34] likely guided these differential growth trajectories across the city. Understanding the precise interplay between policy, economics, and VUG remains a key area for future interdisciplinary research.
4.3. 3D Time Series Analysis of Selected Case Study Area
A detailed 3D time series analysis was conducted to examine the temporal VUG dynamics within the Hanyang district. Utilizing the Stack-PSInSAR approach, this analysis provided a granular assessment of urban expansion, capturing shifts from the broader urban fabric of Wuhan down to the specific variances within distinct urban sectors.
Figure 10 represents this analysis visually, with each data point on the 3D scatterplot corresponding to a 50 m by 50 m area, mapping out the vertical development from 2012 to 2020. Through this detailed visualization, we discern the progression of structural height increments within the district, providing a dynamic overview of the urban expansion.
In 2012, the majority of the buildings in the district were below 25 m in height. As the years progressed, a notable upward shift in building heights was recorded, particularly after May 2015, reflecting a rapid construction of taller structures. By 2020, the architectural landscape had diversified significantly, featuring a mix of low-rise buildings to skyscrapers, some reaching as high as 200 m. The color coding of the scatterplot, with orange to dark orange points denoting buildings around 100 m and red to dark red indicating those over 140 m, highlights areas of intense vertical development.
The detailed 3D model underscores the strength of the PSInSAR technique, beyond its conventional use for deformation monitoring. It proves instrumental in detailing the VUG patterns, especially when complemented by stack processing and post-processing. Such in-depth analysis is critical to identifying specific areas with pronounced height changes, enabling urban planners to understand and manage the complex dynamics of city development.
Moreover, the time series approach provides valuable insights at the 50 m resolution. Analyzing each point over time within the 50-m grid reveals patterns of growth that are essential for understanding how different urban sectors evolve, especially in regions experiencing the most substantial vertical changes. The ability to track these increments over time not only illustrates the past and present landscape but also aids in forecasting future urban growth trajectories.
A limitation, though, of the present analysis is that it is not possible to infer the impact of the COVID-19 pandemic emergency (if there were any) on building constructions, given that the satellite data stack used refers to the time interval until November 2020.
4.4. VUG Analysis: Height Differences in Wuhan, 2012–2020
Our study produced a height difference map (2020–2012) for each 50 m grid to monitor the elevation changes in Wuhan city over eight years, emphasizing the vertical growth that occurred from 2012 to 2020.
Figure 11 provides a visual representation of the city’s elevation disparities, with variations up to 200 m.
Figure 11 comprises three scatterplots, each illustrating changes in building heights and the urban landscape of Wuhan City from 2012 to 2020. Scatterplot (a) is a map of Wuhan City where changes in building heights are represented by various colors, with blue indicating a small change in building height and red indicating large changes. Scatterplot (b) offers a closer view of the selected area and confirms the high concentration of buildings with increased heights, pointing to dense urban development. Finally, the scatterplot (c) shows the vertical growth of five specific sample points over time, from June 2012 to June 2020, with each point represented by a different colored line on a graph that tracks height changes over time.
The height differences highlight significant urbanization in the Hanyang district and along the Yangtze River, particularly within the northern riverside of the Wuchang district. The Wuchang riverside area shows substantial height increases, with a noticeable concentration of taller buildings near the river. This pattern aligns with the city’s strategy to develop waterfront areas, driven by high-value industries and enhanced transportation infrastructure.
While regions like Hanyang, Hongshan, and Wuchang have experienced robust vertical development, other districts, such as Caidian and Jiangxia, have seen more sporadic and modest growth. These disparities may result from varied development paces and zoning policies, reflecting Wuhan’s strategic modernization and urbanization efforts to accommodate its growth and economic expansion.
4.5. Temporal Patterns of Selected Sample Points
In our focused analysis within the Hanyang district, as presented in
Figure 11b, we identified clusters of buildings with significant vertical development from 2012 to 2020. The detailed scatterplot identifies random sample points, where each represents a 50 m grid, labeled SP1 to SP5, chosen to understand growth patterns over time.
Analysis of
Figure 11c reveals varied growth trajectories of selected sample points over several years, highlighting various vertical development patterns. SP2 exhibits the most dramatic vertical development, ascending to nearly 200 m, which identifies it as an outlier because, in the study area, there is no building with a height of more than 150 m. Therefore, the noise in the data appears to be the main problem in the time series analysis. This contrasts sharply with SP4, where only a minimal height increase was noted, suggesting limited development activity. Both SP3 and SP5 reached growth plateaus. SP3 capped at around 75 m, and SP5 at 150 m, indicating that their constructions were likely completed within the study period. Meanwhile, SP1 showed a rapid vertical rise from zero to 100 m starting in May 2019, stabilizing by February 2020, which points to a period of intense development followed by completion. Together, these patterns provide not just the disparate rates of growth across different parts of the selected area, but also the varying timelines and stages of the vertical development.
4.6. Height Validation: Empirical Assessment of PSInSAR Data Accuracy in the Hanyang District
Figure 12 presents a comparative analysis of 2018 height measurements and validation data collected in March 2024 against the GHSL data of 2018 and PSInSAR results. To facilitate direct comparison, we firstly resampled GHSL and validation data to 50 m resolution, then we categorized our height and validation data into the same five segments used by GHSL: the first category encompasses heights of 3 m or less; the second ranges from 3 to 6 m; the third span 6 to 15 m; the fourth extends from 15 to 30 m; and the fifth includes buildings with heights greater than 30 m.
Figure 12a displays the GHSL data, which illustrates a diverse distribution of building heights. There is a significant presence of taller structures in the “15–30 m” and “>30 m” categories, suggesting that GHSL captures a wide range of building heights. However, the considerable number of buildings in the “6–15 m” range points to a certain level of generalization in GHSL’s depiction of urban structures, which, while comprehensive, may not always capture the precise heights of buildings.
Figure 12b focuses on the PSInSAR data, which predominantly categorizes buildings exceeding 30 m in height. This indicates PSInSAR’s high sensitivity and precision in identifying tall urban structures, making it particularly suitable for precise elevation mapping. The PSInSAR data’s emphasis on taller buildings highlights its utility in urban areas characterized by high-rise architecture.
Figure 12c shows the validation data, which supports the accuracy of the PSInSAR results, with a substantial number of buildings also classified in the “>30 m” category. This alignment confirms PSInSAR’s effectiveness and suggests it provides a more accurate reflection of the current urban landscape compared to GHSL, especially in the detection of taller buildings.
Comparing these datasets,
Figure 12d,e highlight the differences in height estimation between GHSL and PSInSAR when validated against actual measurements from aerial surveys. GHSL, while valuable for broad urban studies, tends to underestimate the height of taller buildings. In contrast, PSInSAR shows a closer alignment with the validation data, particularly in the accurate detection of structures taller than 30 m. The validation data corroborate the accuracy of the PSInSAR results by also highlighting a substantial frequency of buildings in the “>30 m” category. This validation supports PSInSAR accuracy and suggests a closer alignment with the real-world scenario than GHSL. Although the validation data also show buildings in the “6–15 m” and “15–30 m” categories, the quantity is less pronounced than in GHSL, indicating a partial but not complete agreement.
In summary, when these results are compared, PSInSAR height estimates align more closely with the validation data, particularly in the detection of taller structures. GHSL data, while valuable, appears to offer a broader perspective that may include some underestimation of the tallest buildings.
4.7. Comparative Analysis of PSInSAR and Validation Heights
While the PSInSAR technique has proven invaluable in urban mapping and vertical growth analysis, its effectiveness is significantly influenced by the accuracy of the placement of PSC. In ideal scenarios, these PS points should be located at the highest architectural elements of buildings, such as rooftops. However, our analysis identifies a prevalent issue where many PS points are not positioned on rooftops but are instead found on lower structural elements like balconies and facades. This misplacement can lead to systematic underestimations of actual building heights, as PS points on lower building parts fail to capture the structure’s total vertical extent. Additionally, the noise within the PSInSAR data presents another substantial challenge and causes an overestimation of height.
Figure 13 provides a visual comparison between PSInSAR-derived height estimates and ground-truth validation heights for 20 randomly selected sample grids within the surveyed area, depicted through a connected scatter plot. This plot method effectively highlights the discrepancies between the two datasets, with each point connected by lines that visually encode the nature of each discrepancy: red lines indicate instances where PSInSAR measurements are higher than validation data, suggesting potential noise or data errors, whereas blue lines indicate underestimations by PSInSAR relative to validation data, often due to misplacement of PS points on non-rooftop structures. However, the number of such instances is a minority compared to the whole sample. Such discrepancies are particularly pronounced where PS points are not atop buildings, highlighting the need for precise placement of these scatter points to ensure accurate height estimation. On the other side, most data points exhibit a reasonable correlation with surveyed heights, demonstrating PSInSAR’s utility in capturing urban structural heights.
5. Discussion
This study successfully applied an innovative stack processing PSInSAR methodology to monitor and quantify VUG dynamics in Wuhan, China, using a dense, long-term (2012–2020) COSMO-SkyMed dataset. The observed vertical growth patterns, particularly the concentration of high-rise buildings in central districts like Jianghan, Wuchang, and Hanyang, align with previous studies documenting Wuhan’s dramatic urbanization and are consistent with the city’s strategic development plans focused on enhancing infrastructure and key industries in these core areas [
33,
34,
35]. However, the analysis also revealed significant heterogeneity in growth across the city, with peripheral regions exhibiting more modest VUG. This spatial variability echoes broader trends observed in urban expansion globally [
3] and underscores the differential development pressures and planning needs across Wuhan.
A key strength of this research lies in its methodological approach. By adapting PSInSAR through stack processing, we addressed critical challenges inherent in analyzing long-term SAR time series for dynamic VUG, such as data gaps and the appearance/disappearance of PS points due to construction. This overcomes the static stability assumption limiting standard PSInSAR for tracking growth over time [
29,
30,
31]. The ability to capture detailed temporal dynamics through time-series analysis and 3D visualization proved invaluable, offering insights beyond traditional 2D remote sensing techniques, which often neglect the crucial vertical dimension [
6,
7,
8]. Furthermore, the post-processing steps—including robust outlier removal using the IQR method, spatial aggregation onto a 50 m grid, and maximum height extraction—were essential for transforming potentially sparse and noisy PS point data into a coherent, interpretable VUG product suitable for urban analysis.
The comparison with the GHSL dataset highlighted the value of high-resolution techniques like PSInSAR for accurately characterizing individual structures and local growth patterns, suggesting that while global datasets provide useful context, they may require validation or calibration with localized measurements, especially for tall structures. Validation against high-resolution drone surveys further reinforced the reliability of the PSInSAR height estimations, particularly for buildings exceeding 30 m.
Despite the demonstrated effectiveness, limitations must be acknowledged. PSInSAR height accuracy is intrinsically linked to PSC presence and distribution, ideally on building tops. Misplacement on lower structures can lead to underestimations, while residual noise can cause overestimations, impacting the fine-scale interpretation of VUG. Future research could focus on developing advanced PS selection algorithms specifically designed to identify rooftop scatterers, potentially leveraging machine learning approaches informed by scattering characteristics or geometric analysis incorporating building footprint data. Furthermore, integrating PSInSAR height estimates with complementary datasets, such as high-resolution optical imagery for structural context or LiDAR data where available (even if temporally sparse), could help constrain estimates and mitigate underestimation issues caused by facade or balcony scatterers. Utilizing data from multiple SAR viewing geometries (e.g., combining ascending and descending passes) may also offer improved capabilities for detecting stable points specifically located on building tops. Enhancing noise reduction and gap-filling methods, perhaps using machine learning, could further increase the reliability of VUG time-series analysis. Explicitly integrating socio-economic drivers with the observed spatial VUG patterns also presents a promising avenue for deeper understanding.
6. Conclusions
This study presented and validated an effective PSInSAR stack processing methodology for quantifying VUG using a dense, 8-year-long COSMO-SkyMed SAR dataset over Wuhan, China. Our approach successfully adapted interferometric techniques, traditionally used for stable targets, to monitor the dynamic process of vertical construction, addressing challenges like data gaps and evolving scatterers. The analysis revealed significant VUG in Wuhan between 2012 and 2020, characterized by intense high-rise development in central districts like Hanyang, Wuchang, and Hongshan, while peripheral areas showed more moderate growth. This multi-temporal, high-resolution perspective offered detailed insights into the spatial heterogeneity and dynamics of Wuhan’s vertical expansion, surpassing the capabilities of traditional 2D remote sensing or static global datasets. Validation against high-resolution drone data confirmed the method’s ability to estimate building heights accurately, particularly for structures exceeding 30 m height, though GHSL data showed limitations in capturing the tallest buildings. While the methodology marks a significant step forward, inherent limitations in PSInSAR, such as the potential misplacement of scatterers on non-rooftop elements leading to height underestimation and the impact of residual noise, require acknowledgment. Future efforts aimed at refining scatterer selection, mitigating noise, and potentially integrating complementary datasets could further enhance the precision of VUG monitoring. Nonetheless, this research demonstrates the considerable value of advanced SAR interferometry techniques for providing critical analysis to understand and manage the complex three-dimensional growth of modern cities.
Author Contributions
Conceptualization, Z.A., T.B., F.C. and D.T.; formal analysis, Z.A.; funding acquisition, T.B.; investigation, Z.A.; resources, T.B., F.C. and D.T.; supervision, T.B.; visualization, Z.A.; writing—original draft, Z.A.; writing—review and editing, Z.A., T.B., F.C. and D.T. All authors have read and agreed to the published version of the manuscript.
Funding
This work was supported by the National Natural Science Foundation of China under Grant 42250610212.
Data Availability Statement
The data that support the findings of this study are available from the Italian Space Agency—ASI (information about the COSMO-SkyMed Mission and data exploitation and access are available at:
https://www.asi.it/en/earth-science/cosmo-skymed/, accessed on 25 May 2025). However, restrictions apply to the availability of the data, which were used under license for the current study, and, thus, are not publicly available.
Acknowledgments
This research was carried out using COSMO-SkyMed® Products © of the Italian Space Agency (ASI), delivered under a license for use by ASI (i.e., “WUHAN-CSK” led by D. Tapete).
Conflicts of Interest
The authors declare no conflicts of interest. The funders had no role in the design of the study; in the collection, analyses, or interpretation of data; in the writing of the manuscript; or in the decision to publish the results.
References
- Cheng, J.; Masser, I. Urban Growth Pattern Modeling: A Case Study of Wuhan City, PR China. Landsc. Urban Plan. 2003, 62, 199–217. [Google Scholar] [CrossRef]
- Zhu, Z.; Zhou, Y.; Seto, K.C.; Stokes, E.C.; Deng, C.; Pickett, S.T.A.; Taubenböck, H. Understanding an Urbanizing Planet: Strategic Directions for Remote Sensing. Remote Sens. Environ. 2019, 228, 164–182. [Google Scholar] [CrossRef]
- Mahtta, R.; Mahendra, A.; Seto, K.C. Building up or Spreading out? Typologies of Urban Growth across 478 Cities of 1 Million+. Environ. Res. Lett. 2019, 14, 124077. [Google Scholar] [CrossRef]
- Zhang, W.; Li, W.; Zhang, C.; Hanink, D.M.; Liu, Y.; Zhai, R. Analyzing Horizontal and Vertical Urban Expansions in Three East Asian Megacities with the SS-CoMCRF Model. Landsc. Urban Plan. 2018, 177, 114–127. [Google Scholar] [CrossRef]
- Weng, Q. Land Use Change Analysis in the Zhujiang Delta of China Using Satellite Remote Sensing, GIS and Stochastic Modelling. J. Environ. Manage. 2002, 64, 273–284. [Google Scholar] [CrossRef]
- Blaschke, T. Object Based Image Analysis for Remote Sensing. ISPRS J. Photogramm. Remote Sens. 2010, 65, 2–16. [Google Scholar] [CrossRef]
- Casali, Y.; Aydin, N.Y.; Comes, T. Machine Learning for Spatial Analyses in Urban Areas: A Scoping Review. Sustain. Cities Soc. 2022, 85, 104050. [Google Scholar] [CrossRef]
- Wang, X.; Liu, S.; Du, P.; Liang, H.; Xia, J.; Li, Y. Object-Based Change Detection in Urban Areas from High Spatial Resolution Images Based on Multiple Features and Ensemble Learning. Remote Sens. 2018, 10, 276. [Google Scholar] [CrossRef]
- Myint, S.W.; Gober, P.; Brazel, A.; Grossman-Clarke, S.; Weng, Q. Per-Pixel vs. Object-Based Classification of Urban Land Cover Extraction Using High Spatial Resolution Imagery. Remote Sens. Environ. 2011, 115, 1145–1161. [Google Scholar] [CrossRef]
- Bhatta, B.; Saraswati, S.; Bandyopadhyay, D. Urban Sprawl Measurement from Remote Sensing Data. Appl. Geogr. 2010, 30, 731–740. [Google Scholar] [CrossRef]
- Yu, B.; Liu, H.; Wu, J.; Hu, Y.; Zhang, L. Automated Derivation of Urban Building Density Information Using Airborne LiDAR Data and Object-Based Method. Landsc. Urban Plan. 2010, 98, 210–219. [Google Scholar] [CrossRef]
- Park, Y.; Guldmann, J.M. Creating 3D City Models with Building Footprints and LIDAR Point Cloud Classification: A Machine Learning Approach. Comput. Environ. Urban Syst. 2019, 75, 76–89. [Google Scholar] [CrossRef]
- Cao, S.; Du, M.; Zhao, W.; Hu, Y.; Mo, Y.; Chen, S.; Cai, Y.; Peng, Z.; Zhang, C. Multi-Level Monitoring of Three-Dimensional Building Changes for Megacities: Trajectory, Morphology, and Landscape. ISPRS J. Photogramm. Remote Sens. 2020, 167, 54–70. [Google Scholar] [CrossRef]
- Shirowzhan, S.; Lim, S.; Trinder, J.; Li, H.; Sepasgozar, S.M.E. Data Mining for Recognition of Spatial Distribution Patterns of Building Heights Using Airborne Lidar Data. Adv. Eng. Informatics 2020, 43, 101033. [Google Scholar] [CrossRef]
- Dubois, C.; Thiele, A.; Hinz, S. Building Detection and Building Parameter Retrieval in InSAR Phase Images. ISPRS J. Photogramm. Remote Sens. 2016, 114, 228–241. [Google Scholar] [CrossRef]
- Qi, F.; Zhai, J.Z.; Dang, G. Building Height Estimation Using Google Earth. Energy Build. 2016, 118, 123–132. [Google Scholar] [CrossRef]
- Frantz, D.; Schug, F.; Okujeni, A.; Navacchi, C.; Wagner, W.; van der Linden, S.; Hostert, P. National-Scale Mapping of Building Height Using Sentinel-1 and Sentinel-2 Time Series. Remote Sens. Environ. 2021, 252, 112128. [Google Scholar] [CrossRef]
- Zhang, W.; Li, W.; Zhang, C.; Ouimet, W.B. Detecting Horizontal and Vertical Urban Growth from Medium Resolution Imagery and Its Relationships with Major Socioeconomic Factors. Int. J. Remote Sens. 2017, 38, 3704–3734. [Google Scholar] [CrossRef]
- Chen, T.H.K.; Qiu, C.; Schmitt, M.; Zhu, X.X.; Sabel, C.E.; Prishchepov, A.V. Mapping Horizontal and Vertical Urban Densification in Denmark with Landsat Time-Series from 1985 to 2018: A Semantic Segmentation Solution. Remote Sens. Environ. 2020, 251, 112096. [Google Scholar] [CrossRef]
- Amirkolaee, H.A.; Arefi, H. Height Estimation from Single Aerial Images Using a Deep Convolutional Encoder-Decoder Network. ISPRS J. Photogramm. Remote Sens. 2019, 149, 50–66. [Google Scholar] [CrossRef]
- Baltsavias, E.P. A Comparison between Photogrammetry and Laser Scanning. ISPRS J. Photogramm. Remote Sens. 1999, 54, 83–94. [Google Scholar] [CrossRef]
- Li, X.; Zhou, Y.; Gong, P.; Seto, K.C.; Clinton, N. Developing a Method to Estimate Building Height from Sentinel-1 Data. Remote Sens. Environ. 2020, 240, 111705. [Google Scholar] [CrossRef]
- Wang, S.; Guo, J.; Zhang, Y.; Hu, Y.; Ding, C.; Wu, Y. Tomosar 3d Reconstruction for Buildings Using Very Few Tracks of Observation: A Conditional Generative Adversarial Network Approach. Remote Sens. 2021, 13, 5055. [Google Scholar] [CrossRef]
- Omati, M.M.; Bastani, M.H. Building Height Reconstruction Based on Propagator and Generalized Maximum Entropy-TomoSAR. IEEE Geosci. Remote Sens. Lett. 2023, 20, 1–4. [Google Scholar] [CrossRef]
- Sauer, S.; Ferro-Famil, L.; Reigber, A.; Pottier, E. Polarimetric Dual-Baseline INSAR Building Height Estimation at l-Band. IEEE Geosci. Remote Sens. Lett. 2009, 6, 408–412. [Google Scholar] [CrossRef]
- Costantini, M. A Novel Phase Unwrapping Method Based on Network Programming. IEEE Trans. Geosci. Remote. Sens. 1998, 36, 813–821. [Google Scholar] [CrossRef]
- Jiang, H.; Balz, T.; Cigna, F.; Tapete, D. Land Subsidence in Wuhan Revealed Using a Non-Linear PSInSAR Approach with Long Time Series of COSMO-SkyMed SAR Data. Remote Sens. 2021, 13, 1256. [Google Scholar] [CrossRef]
- Awasthi, S.; Jain, K.; Bhattacharjee, S.; Gupta, V.; Varade, D.; Singh, H.; Narayan, A.B.; Budillon, A. Analyzing Urbanization Induced Groundwater Stress and Land Deformation Using Time-Series Sentinel-1 Datasets Applying PSInSAR Approach. Sci. Total Environ. 2022, 844, 157103. [Google Scholar] [CrossRef]
- Prakash, A.; Diksha; Kumar, A. Measuring Vertical Urban Growth of Patna Urban Agglomeration Using Persistent Scatterer Interferometry SAR (PSInSAR) Remote Sensing. Remote Sens. 2023, 15, 3687. [Google Scholar] [CrossRef]
- Letsios, V.; Faraslis, I.; Stathakis, D. Monitoring Building Activity by Persistent Scatterer Interferometry. Remote Sens. 2023, 15, 950. [Google Scholar] [CrossRef]
- Zhu, B.; Wang, Y.; Yu, H. An Algorithm Measuring Urban Building Heights by Combining the PS-InSAR Technique and Two-Stage Programming Approach Framework. IEEE J. Sel. Top. Appl. Earth Obs. Remote Sens. 2023, 16, 7624–7635. [Google Scholar] [CrossRef]
- Department of Urban Surveys; National Bureau of Statistics of China. China City Statistical Yearbook—2020; China Statistics Press: Beijing, China, 2020. [Google Scholar]
- Wang, L.; Li, Z.; Zhang, Z. City Profile: Wuhan 2004–2020. Cities 2022, 123, 103585. [Google Scholar] [CrossRef]
- Wuhan Municipal Statistics Bureau; State Statistical Bureau Wuhan Investigation Team. Wuhan Statistical Yearbook 2020; China Statistics Press: Beijing, China, 2020. [Google Scholar]
- Zhang, X.; Ren, W.; Peng, H. Urban Land Use Change Simulation and Spatial Responses of Ecosystem Service Value under Multiple Scenarios: A Case Study of Wuhan, China. Ecol. Indic. 2022, 144, 109526. [Google Scholar] [CrossRef]
- Pesaresi, M.; Politis, P. GHS-BUILT-C R2023A—GHS Settlement Characteristics; Derived from Sentinel-2 Composite (2018) and Other GHS R2023A Data; European Commission, Joint Research Centre (JRC): Brussels, Belgium, 2023. [Google Scholar] [CrossRef]
- Battagliere, M.L.; Covello, F.; Coletta, A. Cosmo-Skymed Background Mission: Overview, Objectives and Results. In Proceedings of the International Astronautical Congress, IAC, Naples, Italy, 1–5 October 2012. [Google Scholar]
- Roccheggiani, M.; Piacentini, D.; Tirincanti, E.; Perissin, D.; Menichetti, M. Detection and Monitoring of Tunneling Induced Ground Movements Using Sentinel-1 SAR Interferometry. Remote Sens. 2019, 11, 1–14. [Google Scholar] [CrossRef]
- Perissin, D.; Wang, Z.; Lin, H. Shanghai Subway Tunnels and Highways Monitoring through Cosmo-SkyMed Persistent Scatterers. ISPRS J. Photogramm. Remote Sens. 2012, 73, 58–67. [Google Scholar] [CrossRef]
- Tanveer, H.; Balz, T.; Cigna, F.; Tapete, D. Monitoring 2011-2020 Traffic Patterns in Wuhan (China) with COSMO-SkyMed SAR, amidst the 7th CISM Military World Games and COVID-19 Outbreak. Remote Sens. 2020, 12, 1636. [Google Scholar] [CrossRef]
- Zebker, H.A.; Villasenor, J. Decorrelation in Interferometric Radar Echoes. IEEE Trans. Geosci. Remote Sens. 1992, 30, 950–959. [Google Scholar] [CrossRef]
- Ferretti, A.; Prati, C.; Rocca, F. Permanent Scatterers in SAR Interferometry. IEEE Trans. Geosci. Remote Sens. 2001, 39, 8–20. [Google Scholar] [CrossRef]
- Tukey, J.W. Exploratory Data Analysis; Addison-Wesley: Reading, MA, USA, 1977. [Google Scholar] [CrossRef]
- Hoaglin, D.C.; Iglewicz, B. Fine-Tuning Some Resistant Rules for Outlier Labeling. J. Am. Stat. Assoc. 1987, 82, 1147–1149. [Google Scholar] [CrossRef]
- Cheng, J.; Zhou, J. Urban Growth in a Rapidly Urbanized Mega City: Wuhan. In Urban Development Challenges, Risks and Resilience in Asian Mega Cities; Singh, R.B., Ed.; Springer: Tokyo, Japan, 2015; pp. 301–322. [Google Scholar]
- Cao, Q.; Huang, H.; Wang, W.; Wang, L. Characterizing Urban Densification in the City of Wuhan Using Time-Series Building Information. Landsc. Ecol. 2023, 38, 3307–3327. [Google Scholar] [CrossRef]
Figure 1.
Comprehensive urban analysis of Wuhan using GHSL Data. Top left: Administrative map of China with Hubei province highlighted. Below, a map contrasts Wuhan city (highlighted in light blue) against the broader Hubei province (in blue). On the right side, a building height map of Wuhan obtained from GHSL’s Global Settlement Characteristics (10 m) 2018 (P2023A) [
36] is categorized into five classes from less than 3 m to over 30 m. This map displays data for the nominal year 2018, representing the specific GHSL product version available and utilized as an independent reference for comparison against PSInSAR results in this study.
Figure 2.
Workflow diagram of the PSInSAR stack processing approach for monitoring Vertical Urban Growth (VUG). Notation: Amplitude Stability Index (AS-Index), Atmospheric Phase Screen (APS), Persistent Scatterers (PS), Reference Point (RP).
Figure 2.
Workflow diagram of the PSInSAR stack processing approach for monitoring Vertical Urban Growth (VUG). Notation: Amplitude Stability Index (AS-Index), Atmospheric Phase Screen (APS), Persistent Scatterers (PS), Reference Point (RP).
Figure 3.
Temporal characteristics of the COSMO-SkyMed dataset (2012–2020). (a) Temporal distance (days) between consecutive SAR image acquisitions vs. time. (b) Stack duration distribution (%) of the total study period covered by each of the 13 sequential 28-image sub-stacks used in the analysis, illustrating the impact of acquisition frequency (e.g., Stack 5 accounts for 15.8% of the total time span). Percentages are individually rounded to one decimal place and may not sum to exactly 100%.
Figure 4.
Drone Imagery for Height validation within the Hanyang District: (a–c) Drone-captured images of tall buildings in Hanyang District, validating PSInSAR height measurements; (d) Author conducting drone operations for data collection.
Figure 4.
Drone Imagery for Height validation within the Hanyang District: (a–c) Drone-captured images of tall buildings in Hanyang District, validating PSInSAR height measurements; (d) Author conducting drone operations for data collection.
Figure 5.
Amplitude and AS-Index analysis for the reference point.
Figure 5.
Amplitude and AS-Index analysis for the reference point.
Figure 6.
AS-Index fluctuations across multiple COSMO-SkyMed SAR stacks in Wuhan.
Figure 6.
AS-Index fluctuations across multiple COSMO-SkyMed SAR stacks in Wuhan.
Figure 7.
Comparison of the mean height estimation of each stack with and without dealing with missing points and noise.
Figure 7.
Comparison of the mean height estimation of each stack with and without dealing with missing points and noise.
Figure 8.
Comparison of PSInSAR height estimation results: (a) PSInSAR before post-processing, (b) validation data, and (c) after post-processing height results.
Figure 8.
Comparison of PSInSAR height estimation results: (a) PSInSAR before post-processing, (b) validation data, and (c) after post-processing height results.
Figure 9.
VUG Pattern of Wuhan City from 2012 to 2020 with historical Google Earth Images of the Selected Area outlined by the black rectangle within the Hanyang district: (a) 2012, (b) 2016, and (c) 2020. (Left) Distribution of building heights in Wuhan in 2012, 2016, and 2020. (right) Scatterplots and historical Google Earth images illustrate rapid vertical growth and urban development over the past decade within the selected area. The base map layer, sourced from OpenStreetMap, includes the incidental geographical label ‘柏泉办事处’ (Bǎiquán Bànshìchù, meaning ‘Baiquan Sub-district Office’). This label is part of the original OSM cartography.
Figure 10.
3D Scatterplot of VUG Development within the Hanyang district (as shown in a rectangle in
Figure 1 and
Figure 8) from 2012 to 2020.
Figure 10.
3D Scatterplot of VUG Development within the Hanyang district (as shown in a rectangle in
Figure 1 and
Figure 8) from 2012 to 2020.
Figure 11.
Vertical Height Difference in Wuhan City from 2012 to 2020, with Scatterplot and Time Series Analysis of the Hanyang District. (a) Difference height map of Wuhan City from 2012 to 2020. (b) Zoomed view over the Hanyang district. (c) Time series analysis of some selected points within the Hanyang district showing the vertical height difference from 2012 to 2020. The base map layer, sourced from OpenStreetMap, includes the incidental geographical label ‘柏泉办事处’ (Bǎiquán Bànshìchù, meaning ‘Baiquan Sub-district Office’). This label is part of the original OSM cartography.
Figure 12.
Height values and distribution for (a) GHSL, (b) Standard PSInSAR results, and (c) Validation data (obtained by aerial survey using DJI Mavic 3 Pro). Comparison between (d) GHSL vs. Validation data and (e) PSInSAR vs. Validation. The latter histograms are displayed with the same height classes along the x-axis for comparability, while a different scale is used along the y-axis to highlight the respective height correctness and over-/under-estimations per each height class.
Figure 13.
Comparative analysis of PSInSAR and validation heights of 20 sample grids.
Figure 13.
Comparative analysis of PSInSAR and validation heights of 20 sample grids.
Table 1.
Percentage growths in key socio-economic variables in different districts of Wuhan from 2012 to 2020 [
34] sourced from (
https://tjj.wuhan.gov.cn/tjfw/tjnj/) obtained at 20 April 2025.
Table 1.
Percentage growths in key socio-economic variables in different districts of Wuhan from 2012 to 2020 [
34] sourced from (
https://tjj.wuhan.gov.cn/tjfw/tjnj/) obtained at 20 April 2025.
| Districts | Caidian | Dongxihu | Hanyang | Hongshan | Jiang’an | Jianghan | Jiangxia | Qiaokou | Qingshan | Wuchang |
|---|
| GDP | 2.52 | 17.44 | 2.80 | 9.17 | 13.33 | 13.81 | 8.69 | 8.32 | 7.62 | 16.30 |
| Government Revenue | −0.53 | 7.49 | 14.17 | 14.58 | 11.57 | 15.89 | 4.09 | 6.25 | 8.86 | 17.63 |
| Gross output of construction | 2.15 | 8.07 | 6.97 | 31.93 | 10.13 | 5.04 | 6.18 | 5.94 | 1.54 | 22.06 |
| Population density | 0.92 | 0.71 | 2.86 | −0.34 | −16.84 | 32.98 | 0.57 | 25.11 | 13.34 | 40.70 |
Table 2.
Number of grids by building height in different districts of Wuhan (2012–2020).
Table 2.
Number of grids by building height in different districts of Wuhan (2012–2020).
| Year | 2012 | 2016 | 2020 | 2012 | 2016 | 2020 | 2012 | 2016 | 2020 | 2012 | 2016 | 2020 | 2012 | 2016 | 2020 |
| Height | <3 m | 3–9 m | 9–27 m | 27–90 m | >90 m |
| Districts | | | | | |
| Caidian | 5610 | 2244 | 289 | 626 | 1818 | 2097 | 646 | 2019 | 2745 | 192 | 896 | 1607 | 6 | 103 | 342 |
| Dongxihu | 6272 | 2142 | 490 | 712 | 2176 | 2223 | 593 | 2303 | 2724 | 208 | 1020 | 1814 | 16 | 160 | 550 |
| Hanyang | 7466 | 3260 | 482 | 1078 | 2170 | 2155 | 1330 | 2955 | 3422 | 425 | 1679 | 3135 | 17 | 252 | 1122 |
| Hongshan | 16246 | 6557 | 846 | 2545 | 4777 | 4817 | 3176 | 6836 | 8370 | 1742 | 4935 | 7433 | 68 | 672 | 2311 |
| Jiang’an | 4924 | 1480 | 198 | 1270 | 1824 | 1523 | 1675 | 3269 | 3601 | 757 | 1848 | 2601 | 41 | 246 | 744 |
| Jianghan | 3083 | 949 | 108 | 895 | 1103 | 866 | 1292 | 2402 | 2628 | 566 | 1219 | 1721 | 41 | 204 | 554 |
| Jiangxia | 5175 | 1955 | 209 | 921 | 1625 | 1608 | 1141 | 2798 | 3618 | 410 | 1156 | 1848 | 11 | 124 | 375 |
| Qiaoku | 3755 | 1358 | 269 | 971 | 1475 | 1296 | 1040 | 2129 | 2418 | 399 | 1100 | 1734 | 15 | 118 | 463 |
| Qingshan | 2368 | 837 | 54 | 558 | 796 | 658 | 697 | 1463 | 1686 | 230 | 670 | 1075 | 9 | 96 | 389 |
| Wuchang | 7808 | 2470 | 365 | 1645 | 2471 | 2204 | 2091 | 4562 | 5104 | 1110 | 2762 | 3935 | 86 | 475 | 1132 |
| Disclaimer/Publisher’s Note: The statements, opinions and data contained in all publications are solely those of the individual author(s) and contributor(s) and not of MDPI and/or the editor(s). MDPI and/or the editor(s) disclaim responsibility for any injury to people or property resulting from any ideas, methods, instructions or products referred to in the content. |
© 2025 by the authors. Licensee MDPI, Basel, Switzerland. This article is an open access article distributed under the terms and conditions of the Creative Commons Attribution (CC BY) license (https://creativecommons.org/licenses/by/4.0/).


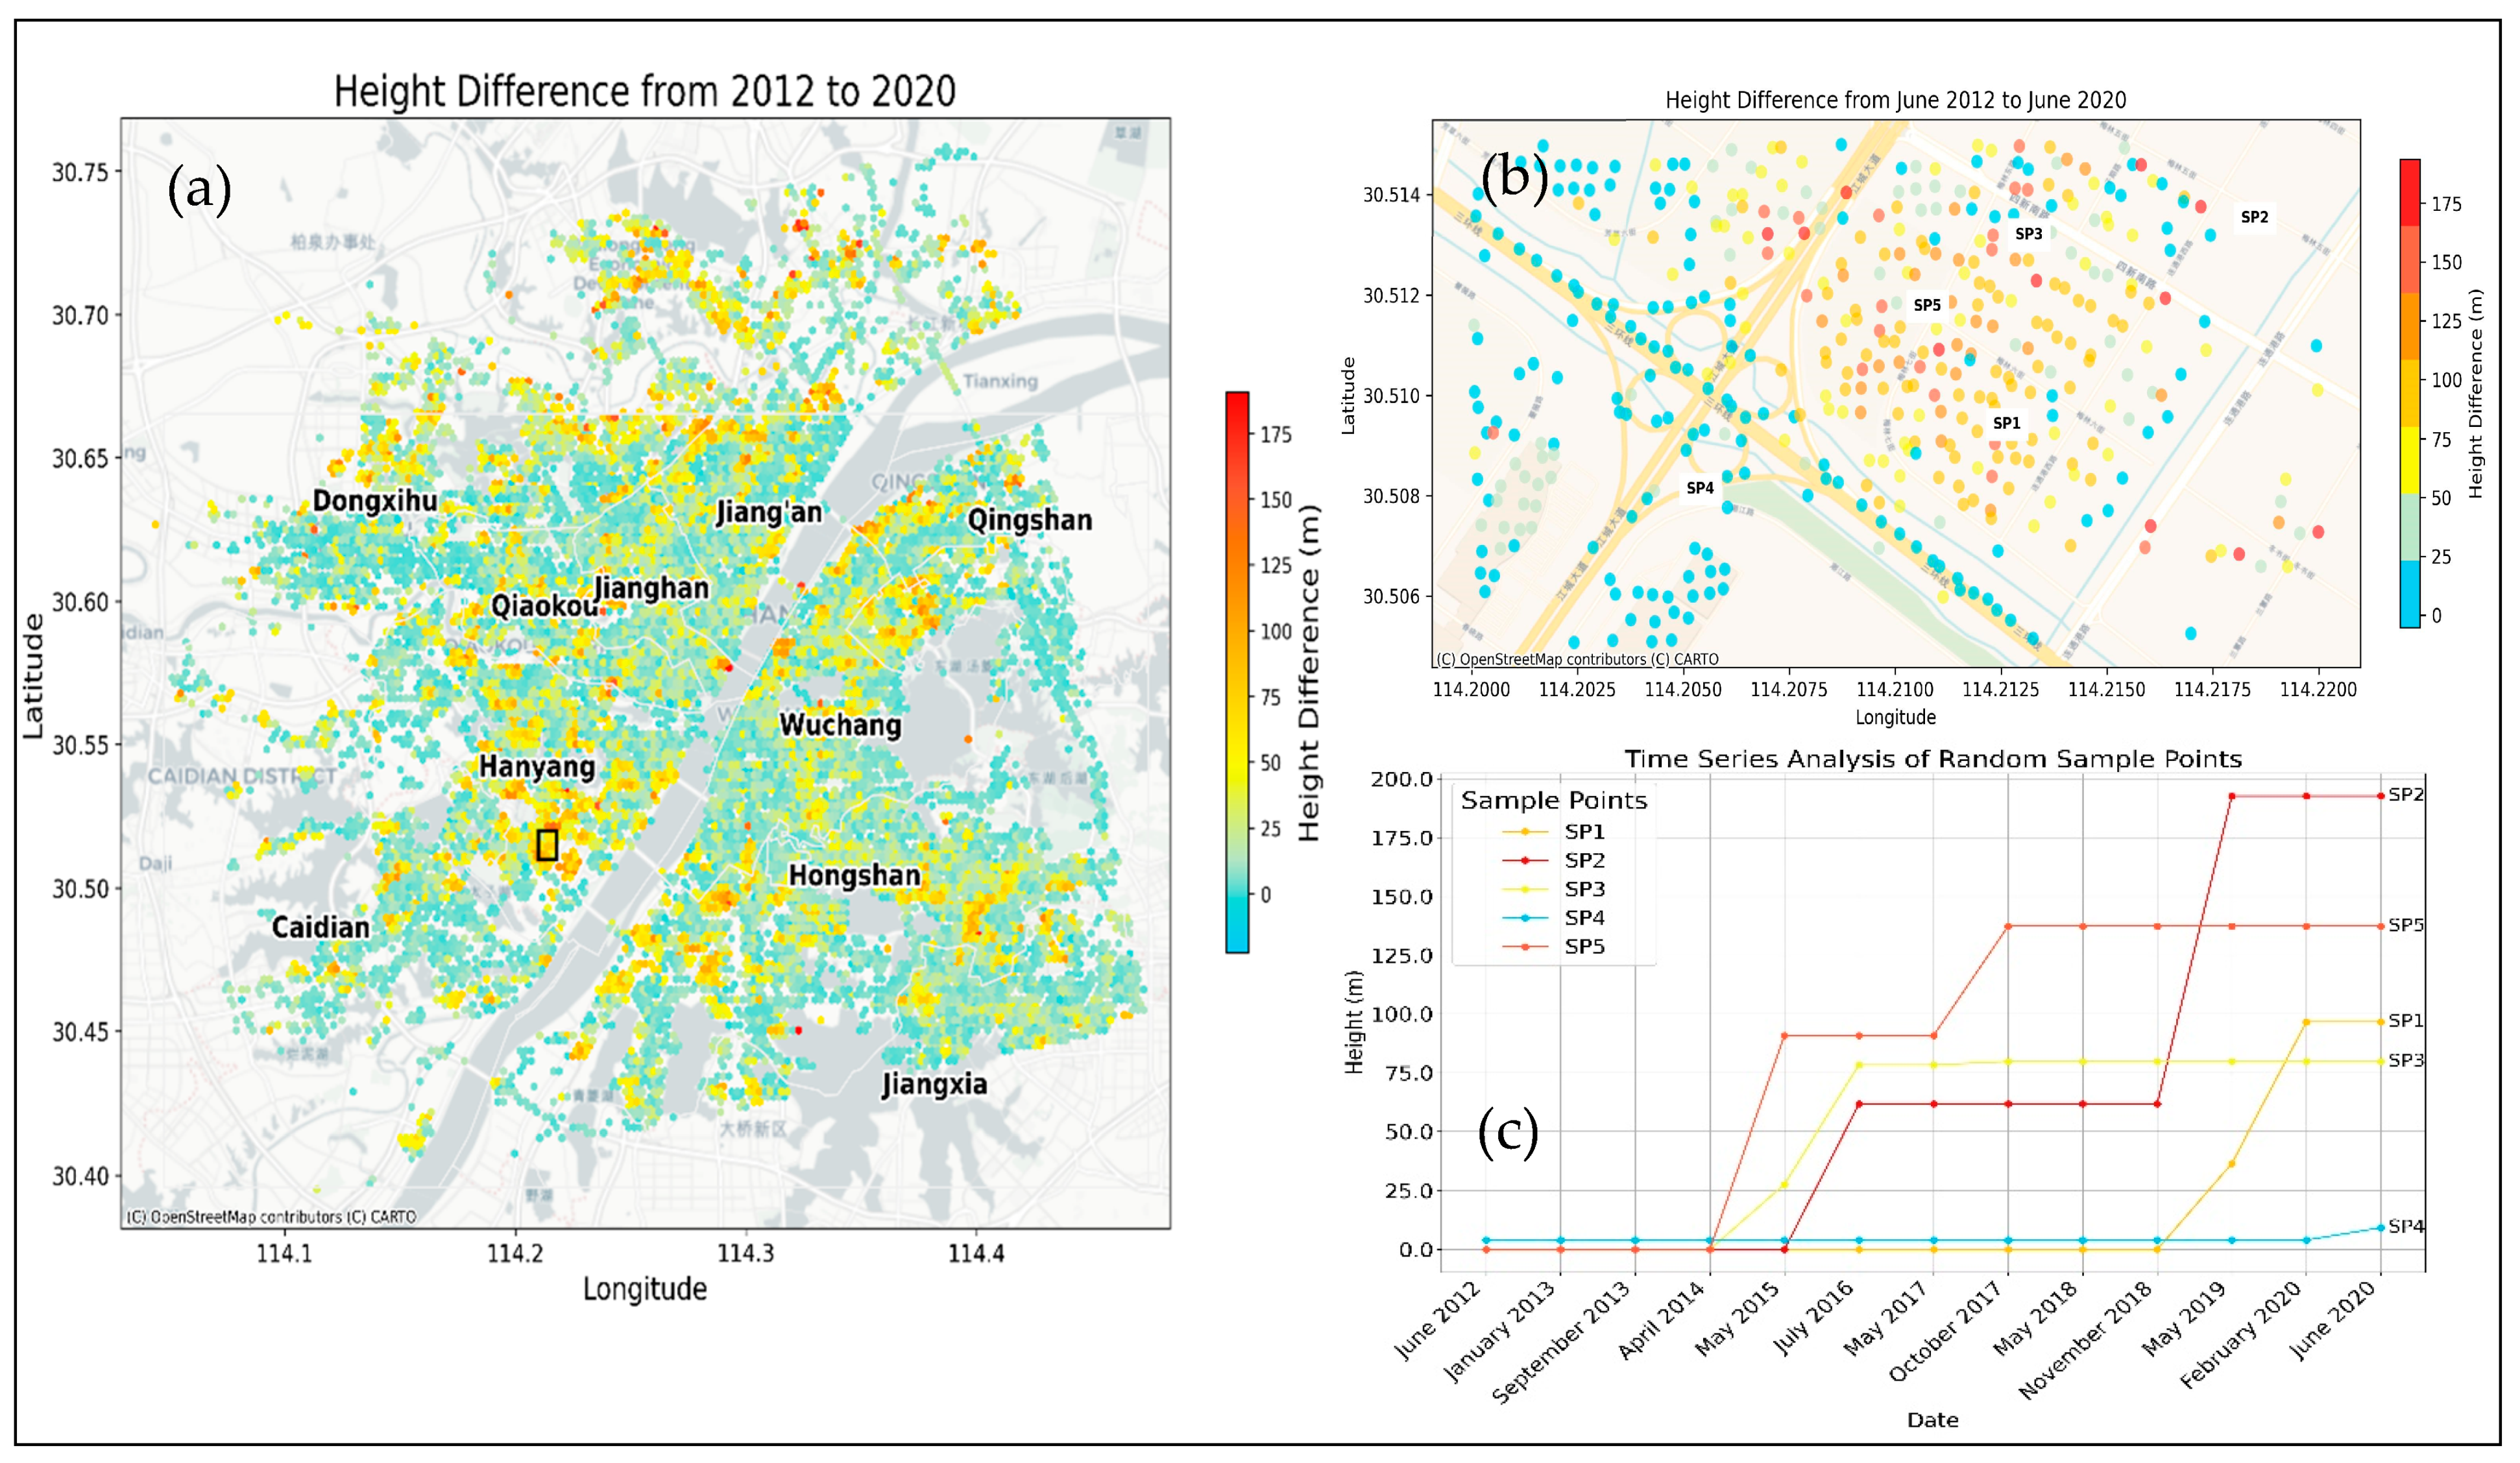


