1. Introduction
Hurricanes and tropical storms pose a significant threat to coastal communities, endangering lives and property through severe flooding. Flood frequency, intensity, and overall impact have increased in coastal regions over recent decades [
1,
2,
3]. Real-time flood monitoring and inundation mapping are critical for emergency response and risk mitigation. Geospatial technologies and remote sensing provide invaluable tools for rapid flood assessment, enabling responders to save lives and reduce damage [
4,
5,
6]. Optical satellite imagery (e.g., Landsat, MODIS, Sentinel-2) has been used successfully for flood detection [
7,
8,
9,
10,
11], but optical sensors are hindered by cloud cover and daylight requirements during extreme weather events. By contrast, active radar satellites such as Sentinel-1 operate day-and-night and penetrate clouds, making them ideal for flood monitoring during storms.
A variety of SAR-based flood mapping techniques have been developed. Traditional approaches include supervised classification, histogram thresholding, change detection, and interferometric analysis. For example, simple threshold-based methods on SAR backscatter can quickly delineate water if a suitable cutoff value is found. Ref. [
12] demonstrated that combining thresholding with morphological operators yields high-accuracy water masks. Change detection using pre- and post-event SAR images is another common approach; Ref. [
13] developed an automated flood detection chain for TerraSAR-X and Sentinel-1 data. More advanced techniques integrate segmentation, statistical modeling, or fuzzy logic to improve flood identification [
14,
15]. Ref. [
14] used a hierarchical split-based thresholding scheme to objectively detect flooded areas across varying image characteristics. Ref. [
16] evaluated multiple pixel-based methods (global thresholding, active contours, change detection) on SAR data and found these approaches effective for automated, near-real-time flood mapping.
Other recent studies have explored machine-learning and multi-sensor approaches. Ref. [
17] applied a fuzzy classification system to Sentinel-1 to map floods, while [
18] combined Sentinel-1 SAR (pre- and post-flood) with Sentinel-2 optical imagery in a supervised classification to delineate inundation. Ref. [
19] similarly identified flooded zones in China using Sentinel-1 and Sentinel-2 via supervised classification and change detection, showing improvements over simple Otsu thresholding and NDWI methods. Cloud computing platforms like Google Earth Engine have also been leveraged for flood mapping with SAR data [
6,
20]. These studies underscore that no single method is universally superior—each has advantages and limitations depending on landscape and data conditions. Simple thresholding can suffer increased misclassification in heterogeneous land cover or noisy conditions, whereas supervised classification offers an alternative by learning distinct class signatures, though it typically requires quality training data and expert knowledge.
Tropical Storm Imelda (2019) provides a compelling case to apply and evaluate SAR-based flood mapping techniques. Imelda made landfall in southeastern Texas (17–21 September 2019) and, despite never reaching hurricane strength, produced torrential rains that led to catastrophic flooding in southeast Texas and parts of Louisiana. Some communities received over 1000 mm of rain (comparable to Hurricane Harvey), making Imelda one of the wettest tropical cyclones on record in the contiguous U.S. [
21]. The storm’s heavy rainfall overwhelmed rivers, bayous, and drainage systems, resulting in both flash flooding and widespread inundation of low-lying areas. Over 6000 homes were flooded in Jefferson County alone, and coastal counties like Galveston also faced storm surge compounding the rainfall flooding. Given the scale of this disaster, rapid and accurate flood extent maps were urgently needed by emergency officials for rescue and relief operations.
In this context, our study presents a high-precision SAR-based inundation mapping approach for Tropical Storm Imelda. We leverage dual-polarization Sentinel-1 SAR imagery to capture flood extent under cloud-obscured conditions. Our approach centers on computing the VH/VV backscatter ratio and classifying floodwater versus land using a supervised machine learning classifier, combined with a change detection between pre- and post-event imagery to isolate new inundation. We adopt a Random Forest (RF) classifier for its non-parametric nature and robust performance. We also perform a statistical analysis of the relationship between observed rainfall and mapped flood extent to quantify how strongly precipitation drives flooding, including an assessment of the significance of this correlation. Furthermore, to ensure the robustness of our classification method, a sensitivity analysis on the selection of training samples is conducted. By comparing multiple classification trials with different training data, we assess how sensitive the flood mapping results are to the choice of training samples. The overall goals of the study are to (1) demonstrate a rapid-response SAR flood mapping workflow suitable for operational use, (2) validate the method’s accuracy and statistical soundness, and (3) compare our findings with other SAR-based flood mapping studies to contextualize the performance and reliability of the approach. This work contributes to the growing body of literature on radar-based flood monitoring and provides insights that can improve disaster preparedness and resilience in flood-prone regions.
Unlike traditional methods, this study leverages dual-polarization SAR processing (VH/VV ratio) to enhance water detection, minimizing misclassification errors due to surface roughness variations. A supervised Random Forest classification is employed to reduce dependency on manual thresholding, improving flood delineation accuracy. Additionally, topographic and rainfall data are integrated, enabling a quantitative correlation analysis (R2 = 0.87) between precipitation and mapped flood extent, offering deeper insights into flood dynamics. A sensitivity analysis of training samples ensures that classification results remain stable across different datasets, enhancing generalizability. By combining these advancements, this study delivers a highly accurate (>94%) and operationally scalable flood mapping workflow, making it more resilient to land cover variability and environmental noise than conventional SAR-based methods.
2. Methods
2.1. Study Area and Datasets
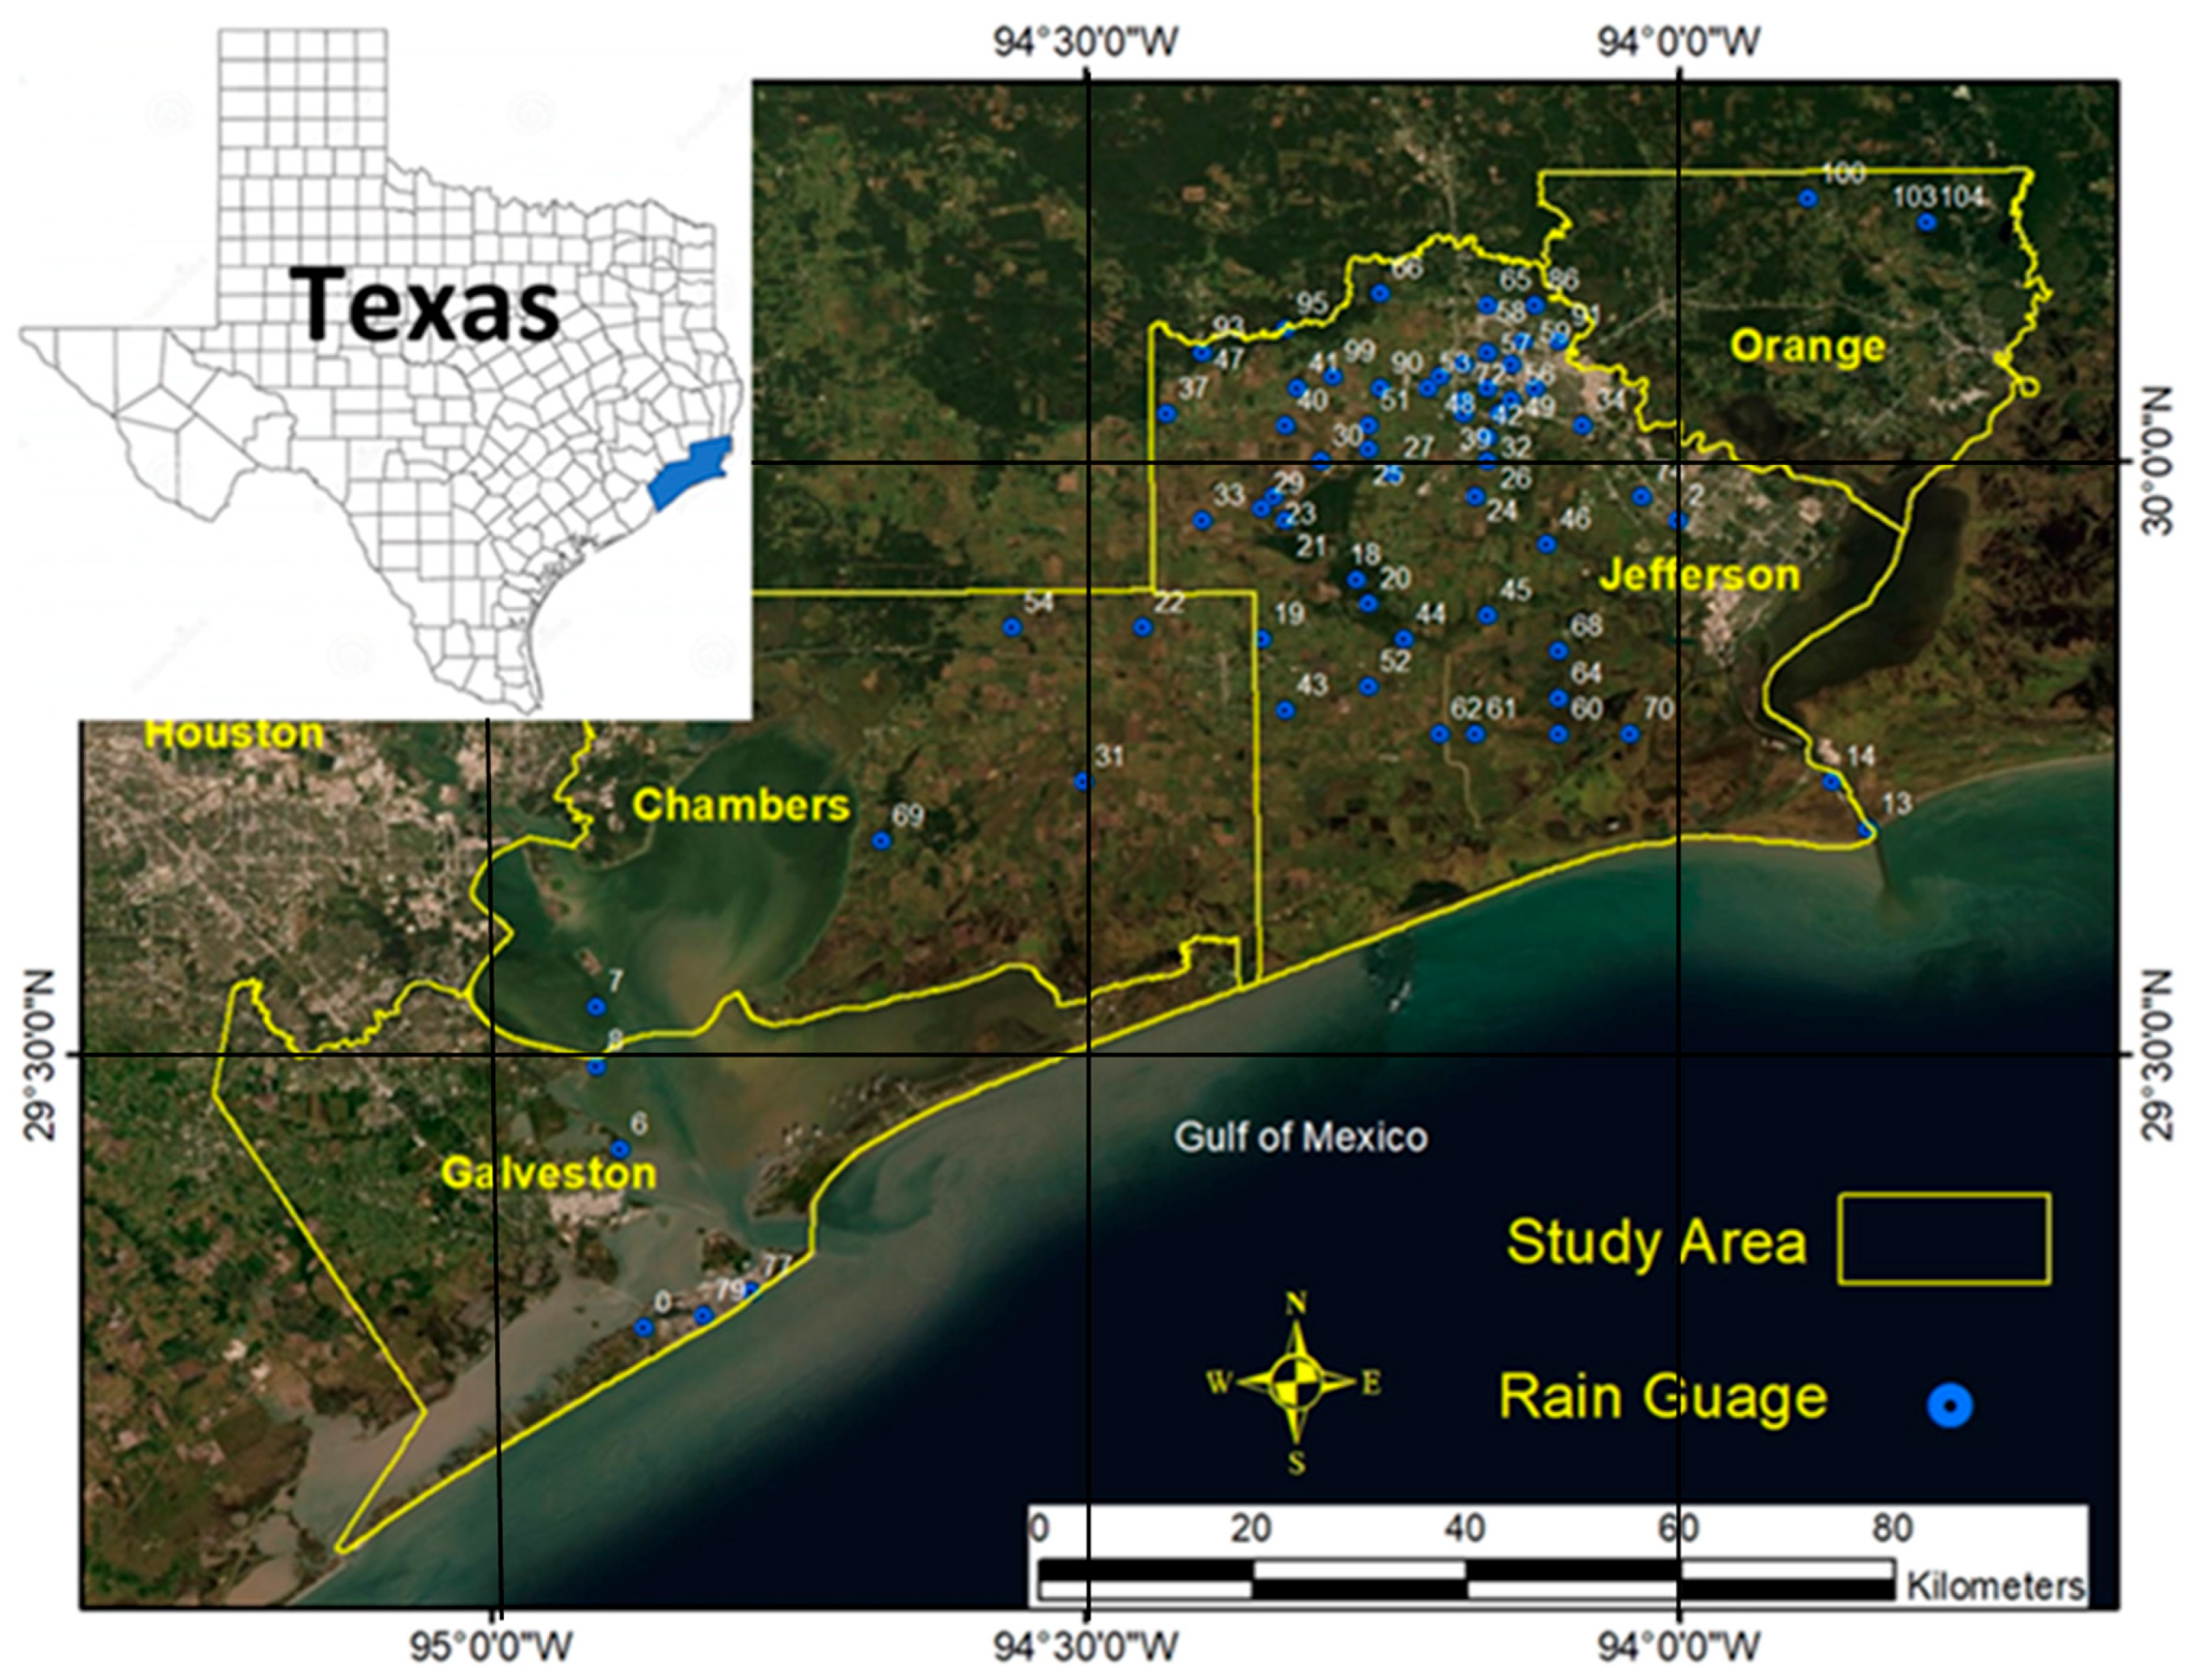
Our study area encompasses four counties in southeast Texas—Orange, Jefferson, Chambers, and Galveston—which were heavily impacted by Tropical Storm Imelda (
Figure 1). This region includes a mix of coastal and inland areas prone to flooding from both storm surge and heavy rainfall. Two Sentinel-1A Ground Range Detected (GRD) SAR images were acquired in Interferometric Wide Swath (IW) mode: a pre-flood image from 7 September 2019 (before Imelda’s main impact) and a during-flood image from 19 September 2019 (at the height of Imelda’s flooding). Each Sentinel-1 scene covers ~250 km × 250 km with a spatial resolution of 10 m (with pixel spacing of 10 m for SAR GRD products) and features dual polarization (VV and VH). The SAR data were downloaded from the Copernicus Open Access Hub.
Additionally, a Shuttle Radar Topography Mission (SRTM) Digital Elevation Model (DEM) at 30 m resolution and the National Land Cover Database 2016 (NLCD 2016) were obtained to analyze topographic and land cover influences on flooding. Rainfall data from the NOAA GOES Data Collection Platform rain gauge network (
Figure 1, blue circles) were collected for the period of 17–20 September 2019, representing the total storm precipitation across the study area. These diverse datasets provide the basis for mapping the flood extent and examining environmental factors contributing to flooding.
2.2. SAR Image Preprocessing
To exploit the complementary information in dual-polarization SAR, we calculated the VH/VV ratio for both the pre-flood and during-flood dates.
where:
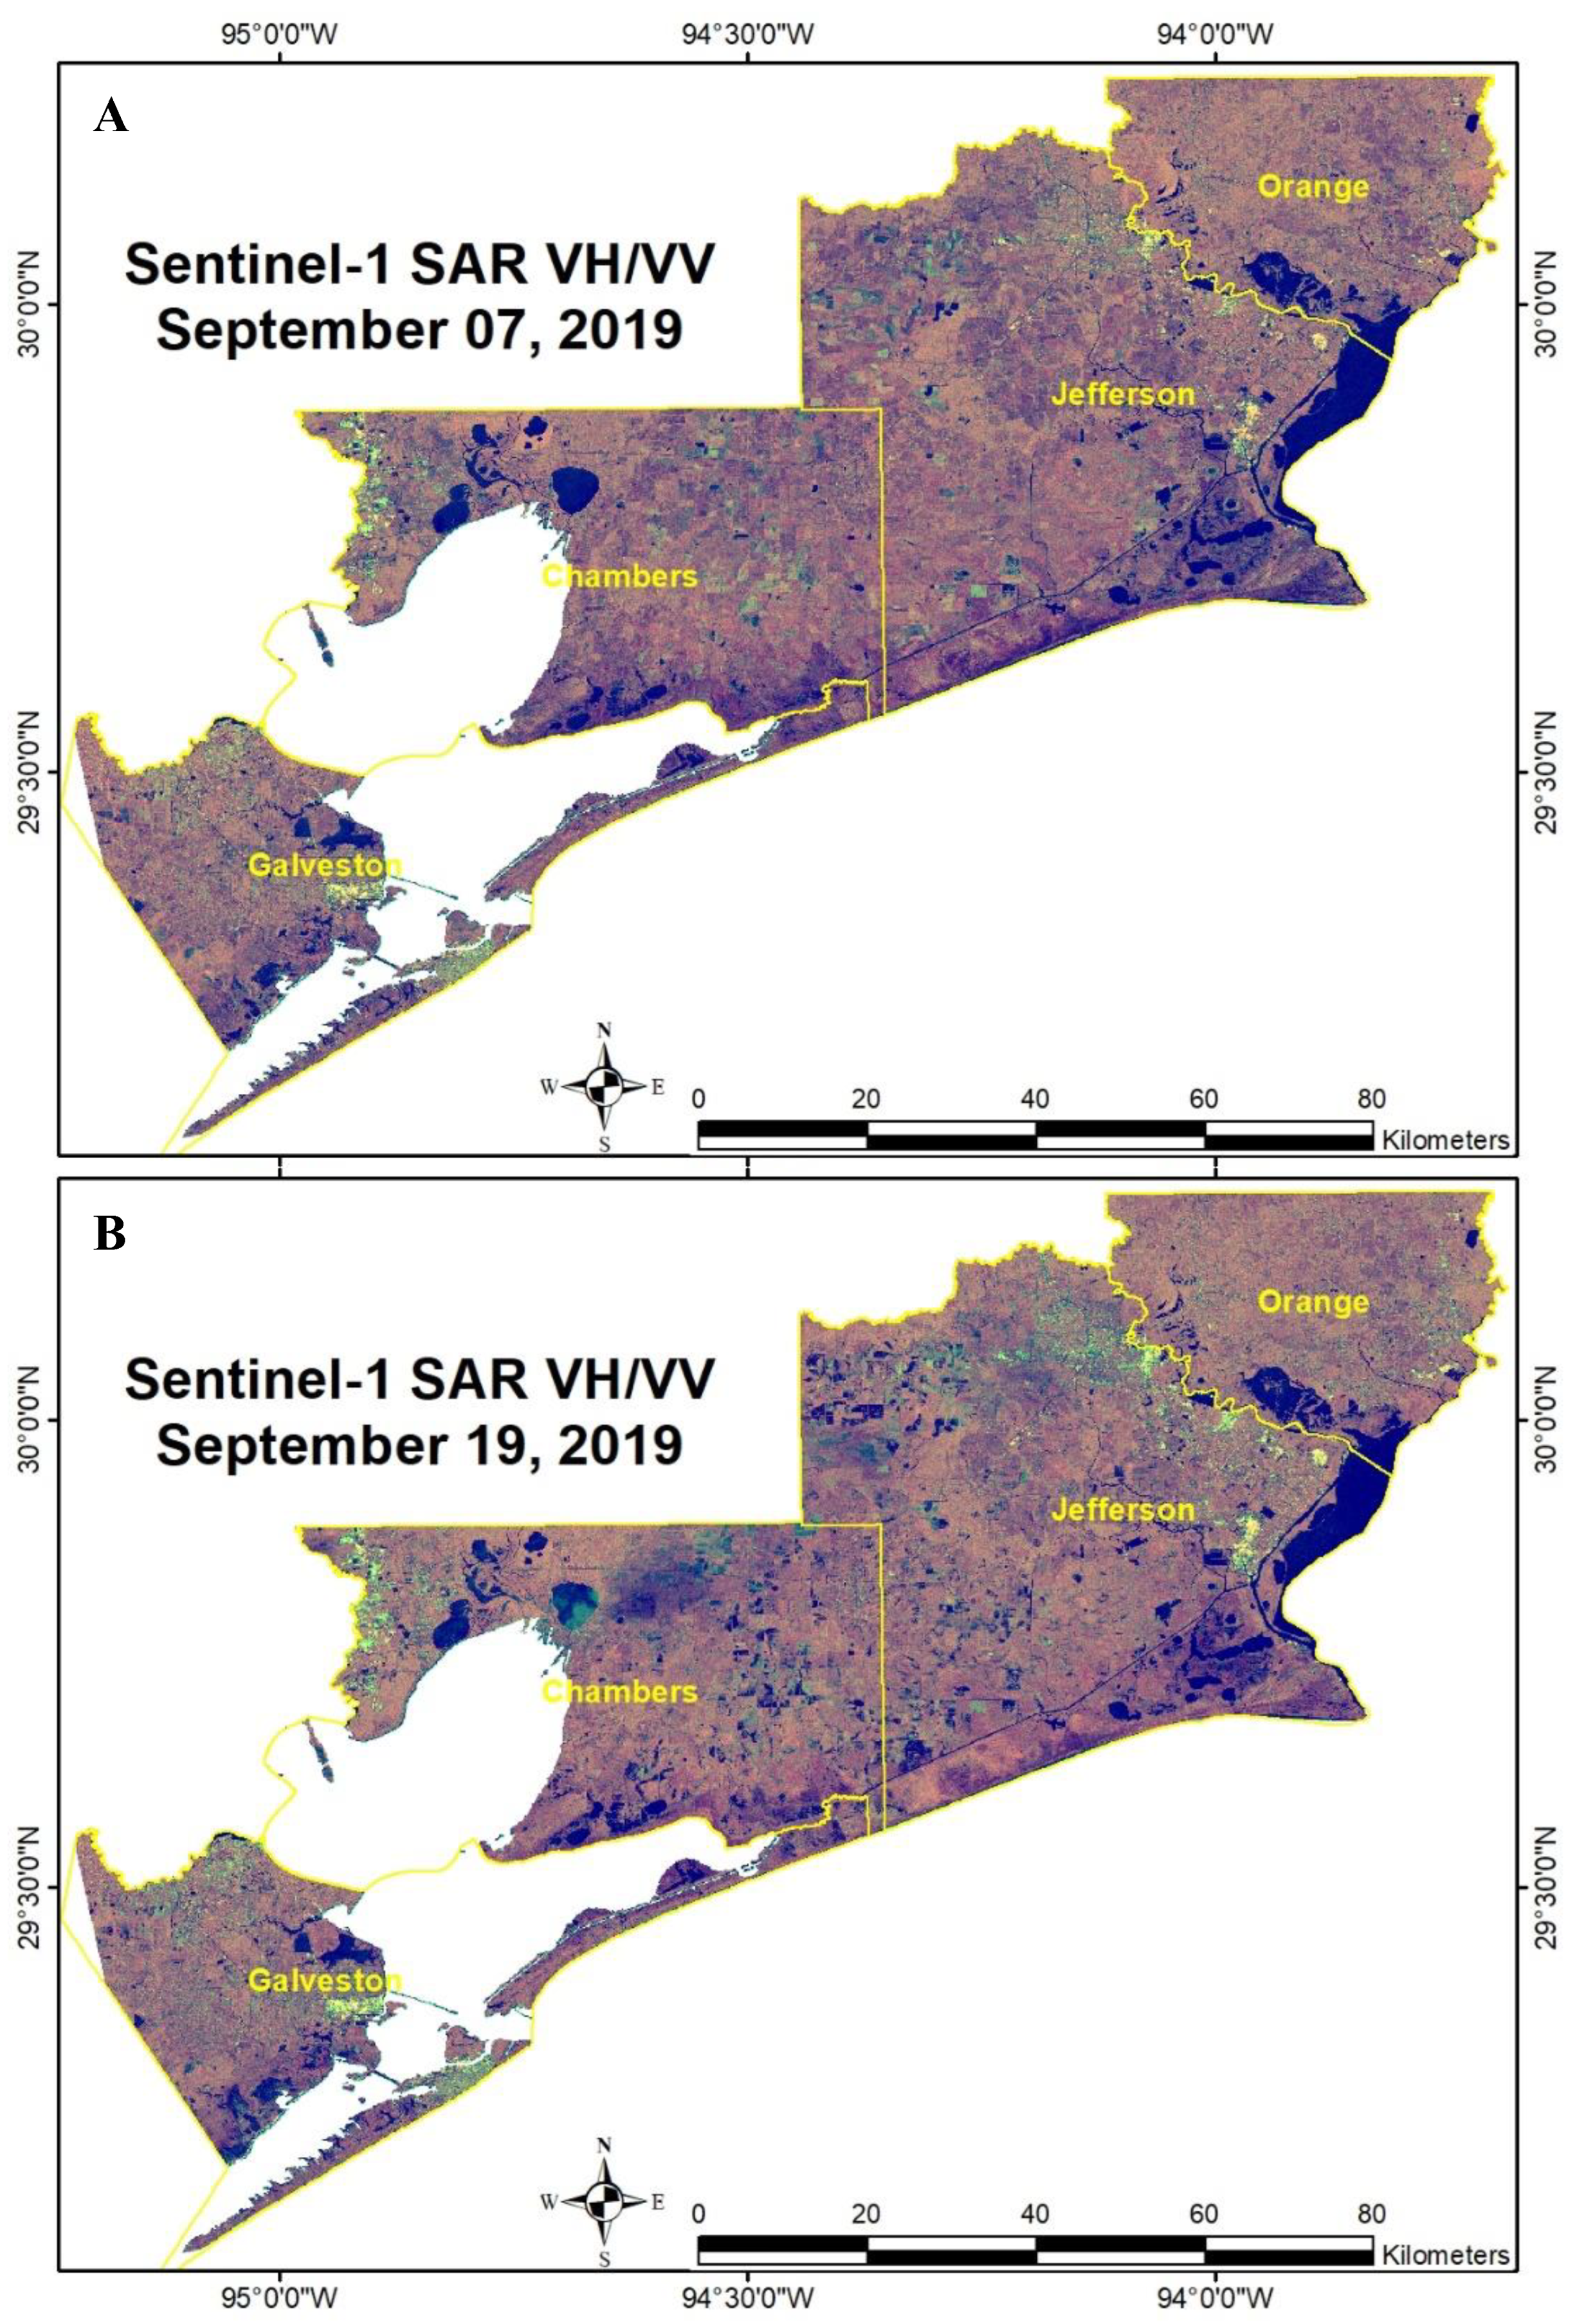
This ratio accentuates differences in surface water presence: water bodies generally produce low VV and VH returns (especially on calm surfaces), but VH tends to increase relative to VV in areas with volume scattering (e.g., flooded vegetation). By taking the pixel-wise ratio of VH to VV backscatter (σ°), water and flood-affected pixels are expected to exhibit distinguishable signatures from land. Indeed, initial tests of various polarization combinations (e.g., sum, difference, product) indicated that the VH/VV ratio image provided the best contrast between water and non-water areas. Figure 3A,B illustrates the pre-flood and during-flood VH/VV ratio images, with water appearing as lower-brightness (blue in the false-color composite) than land.
We employed a supervised classification approach on the VH/VV ratio images to separate floodwater from land. The classification was performed using the Random Forest (RF) algorithm, an ensemble-based decision tree method known for its ability to handle complex, non-linear class boundaries without requiring parametric assumptions about data distribution. RF often outperforms traditional classifiers in remote sensing applications due to its robustness and adaptability to diverse land cover conditions [
22,
23]. Using the ENVI Machine Learning Module, we trained an RF model to classify each pixel of the ratio images into either “Water” or “Land”. The training data for the classifier were derived from high-resolution reference imagery and expert interpretation. Specifically, we used 60-cm resolution National Agriculture Imagery Program (NAIP 2018) orthophotos and ancillary maps to identify representative training samples. Two sets of training polygons were prepared: one for Water (including permanent water bodies like lakes, ponds, rivers, and known flooded areas observed in the during-flood image) and one for Land (including urban areas, rural settlements, forests, agricultural fields, grasslands, and other non-flooded terrain). From these polygons, a large number of sample pixels (on the order of a few thousand per class) were extracted to capture the backscatter ratio characteristics of each class. The Random Forest model was then trained on these samples to learn the class decision boundaries. Once trained, the classifier was applied to the entire VH/VV ratio images for both dates, producing initial classified maps of water vs. land for pre-flood and flood conditions.
The RF classifier was implemented through NV5 ENVI (v6.1) Machine Learning Module. We configured the RF with 100 trees, using the Gini impurity criterion for node splitting. No maximum tree depth was imposed, allowing trees to grow until pure or until the minimum node size reached ENVI’s default, which helps capture complex decision boundaries. Out-of-bag (OOB) estimation was enabled to internally assess model generalization during training. These settings follow standard RF practices and align with the default parameters in ENVI’s implementation, ensuring reproducibility. Importantly, using ENVI v6.1’s RF (which leverages the scikit-learn library) provides a well-tested framework for classification, and we documented the software version and parameters for transparency.
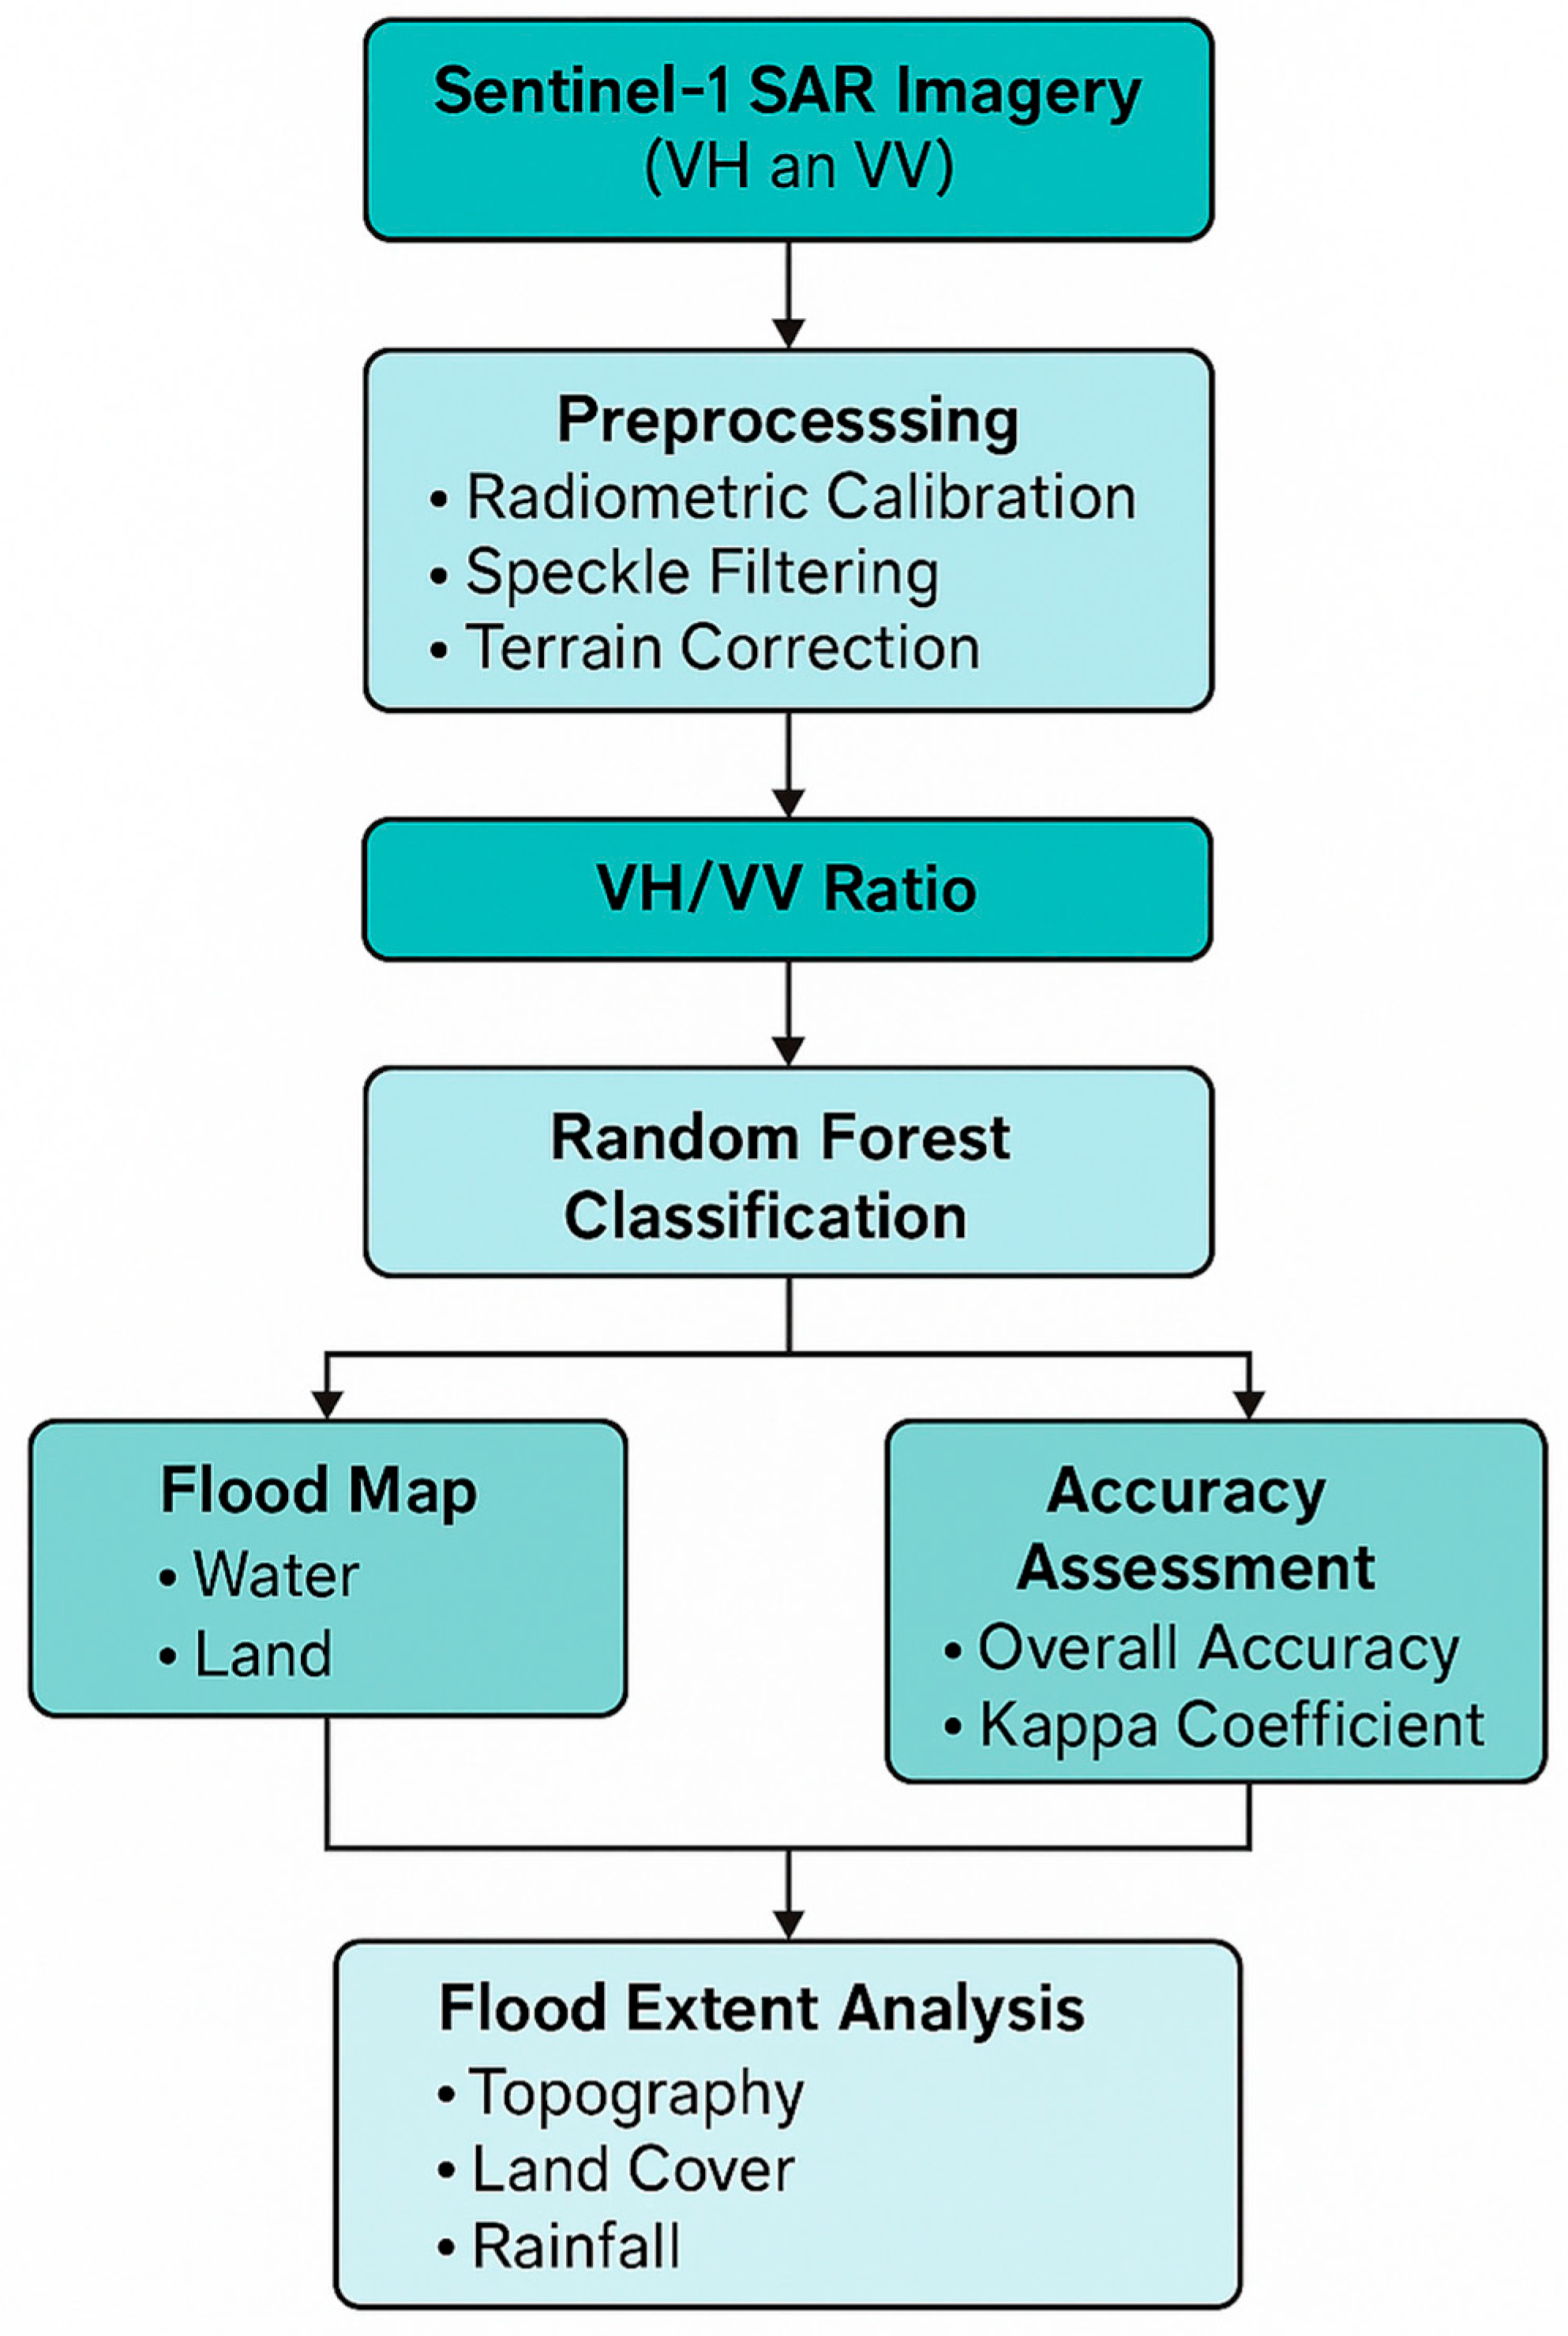
Following classification, we performed a change detection to isolate new flood inundation due to Imelda. The classified pre-flood map (September 7) was subtracted from the classified flood-event map (19 September) on a pixel basis. This highlights pixels that changed from Land (pre-flood) to Water (during flood) while ignoring areas that were water both before and during (e.g., existing lakes or bayous). The result is a binary change map representing the flood extent caused by the storm. This change detection approach, combined with the ratio-based classification, eliminates the need for manually choosing backscatter threshold values for water—a step where many simple methods struggle or introduce error. Instead, water delineation is learned from the data and the temporal difference inherently accounts for permanent water bodies. A complete overview of the methodological workflow is illustrated in
Figure 2.
2.3. Accuracy Assessment and Validation
To quantitatively assess the classification accuracy, we used an independent set of validation samples and error matrix analysis. We generated 500 random points within the study area for each date’s image and labeled each point’s true class by visual interpretation of high-resolution (60-cm) National Agriculture Imagery Program (NAIP) imagery (for the during-flood image, this effectively represents the ground truth of flooded vs. non-flooded areas). These points were not used in training. For each classified map (pre-flood and during-flood), we computed a confusion matrix comparing the classifier’s output against the reference labels. From the confusion matrices, we derived standard accuracy metrics: producer’s accuracy and user’s accuracy for each class, overall classification accuracy, and the kappa coefficient of agreement. We also cross-verified the flood extent map against ancillary observations: for example, reported flooded neighborhoods and roads (from FEMA and local news reports [
24]) fell within or adjacent to the mapped flood zones, lending confidence that the SAR-derived flood map is capturing real inundation patterns.
2.4. Sensitivity Analysis of Training Samples
To ensure the robustness of our supervised classification results, we conducted a sensitivity analysis on the selection of training samples. The aim was to evaluate how variations in training data might affect the flood mapping outcome. We created several alternative training sets by slightly perturbing the original training polygons or by randomly subsampling the original training pixels. For each variant, a new RF classifier was trained and applied to the VH/VV ratio imagery, and a flood map was produced. We then compared the resulting flood extents and accuracy metrics to those of the original classification.
2.5. Rainfall Correlation Analysis
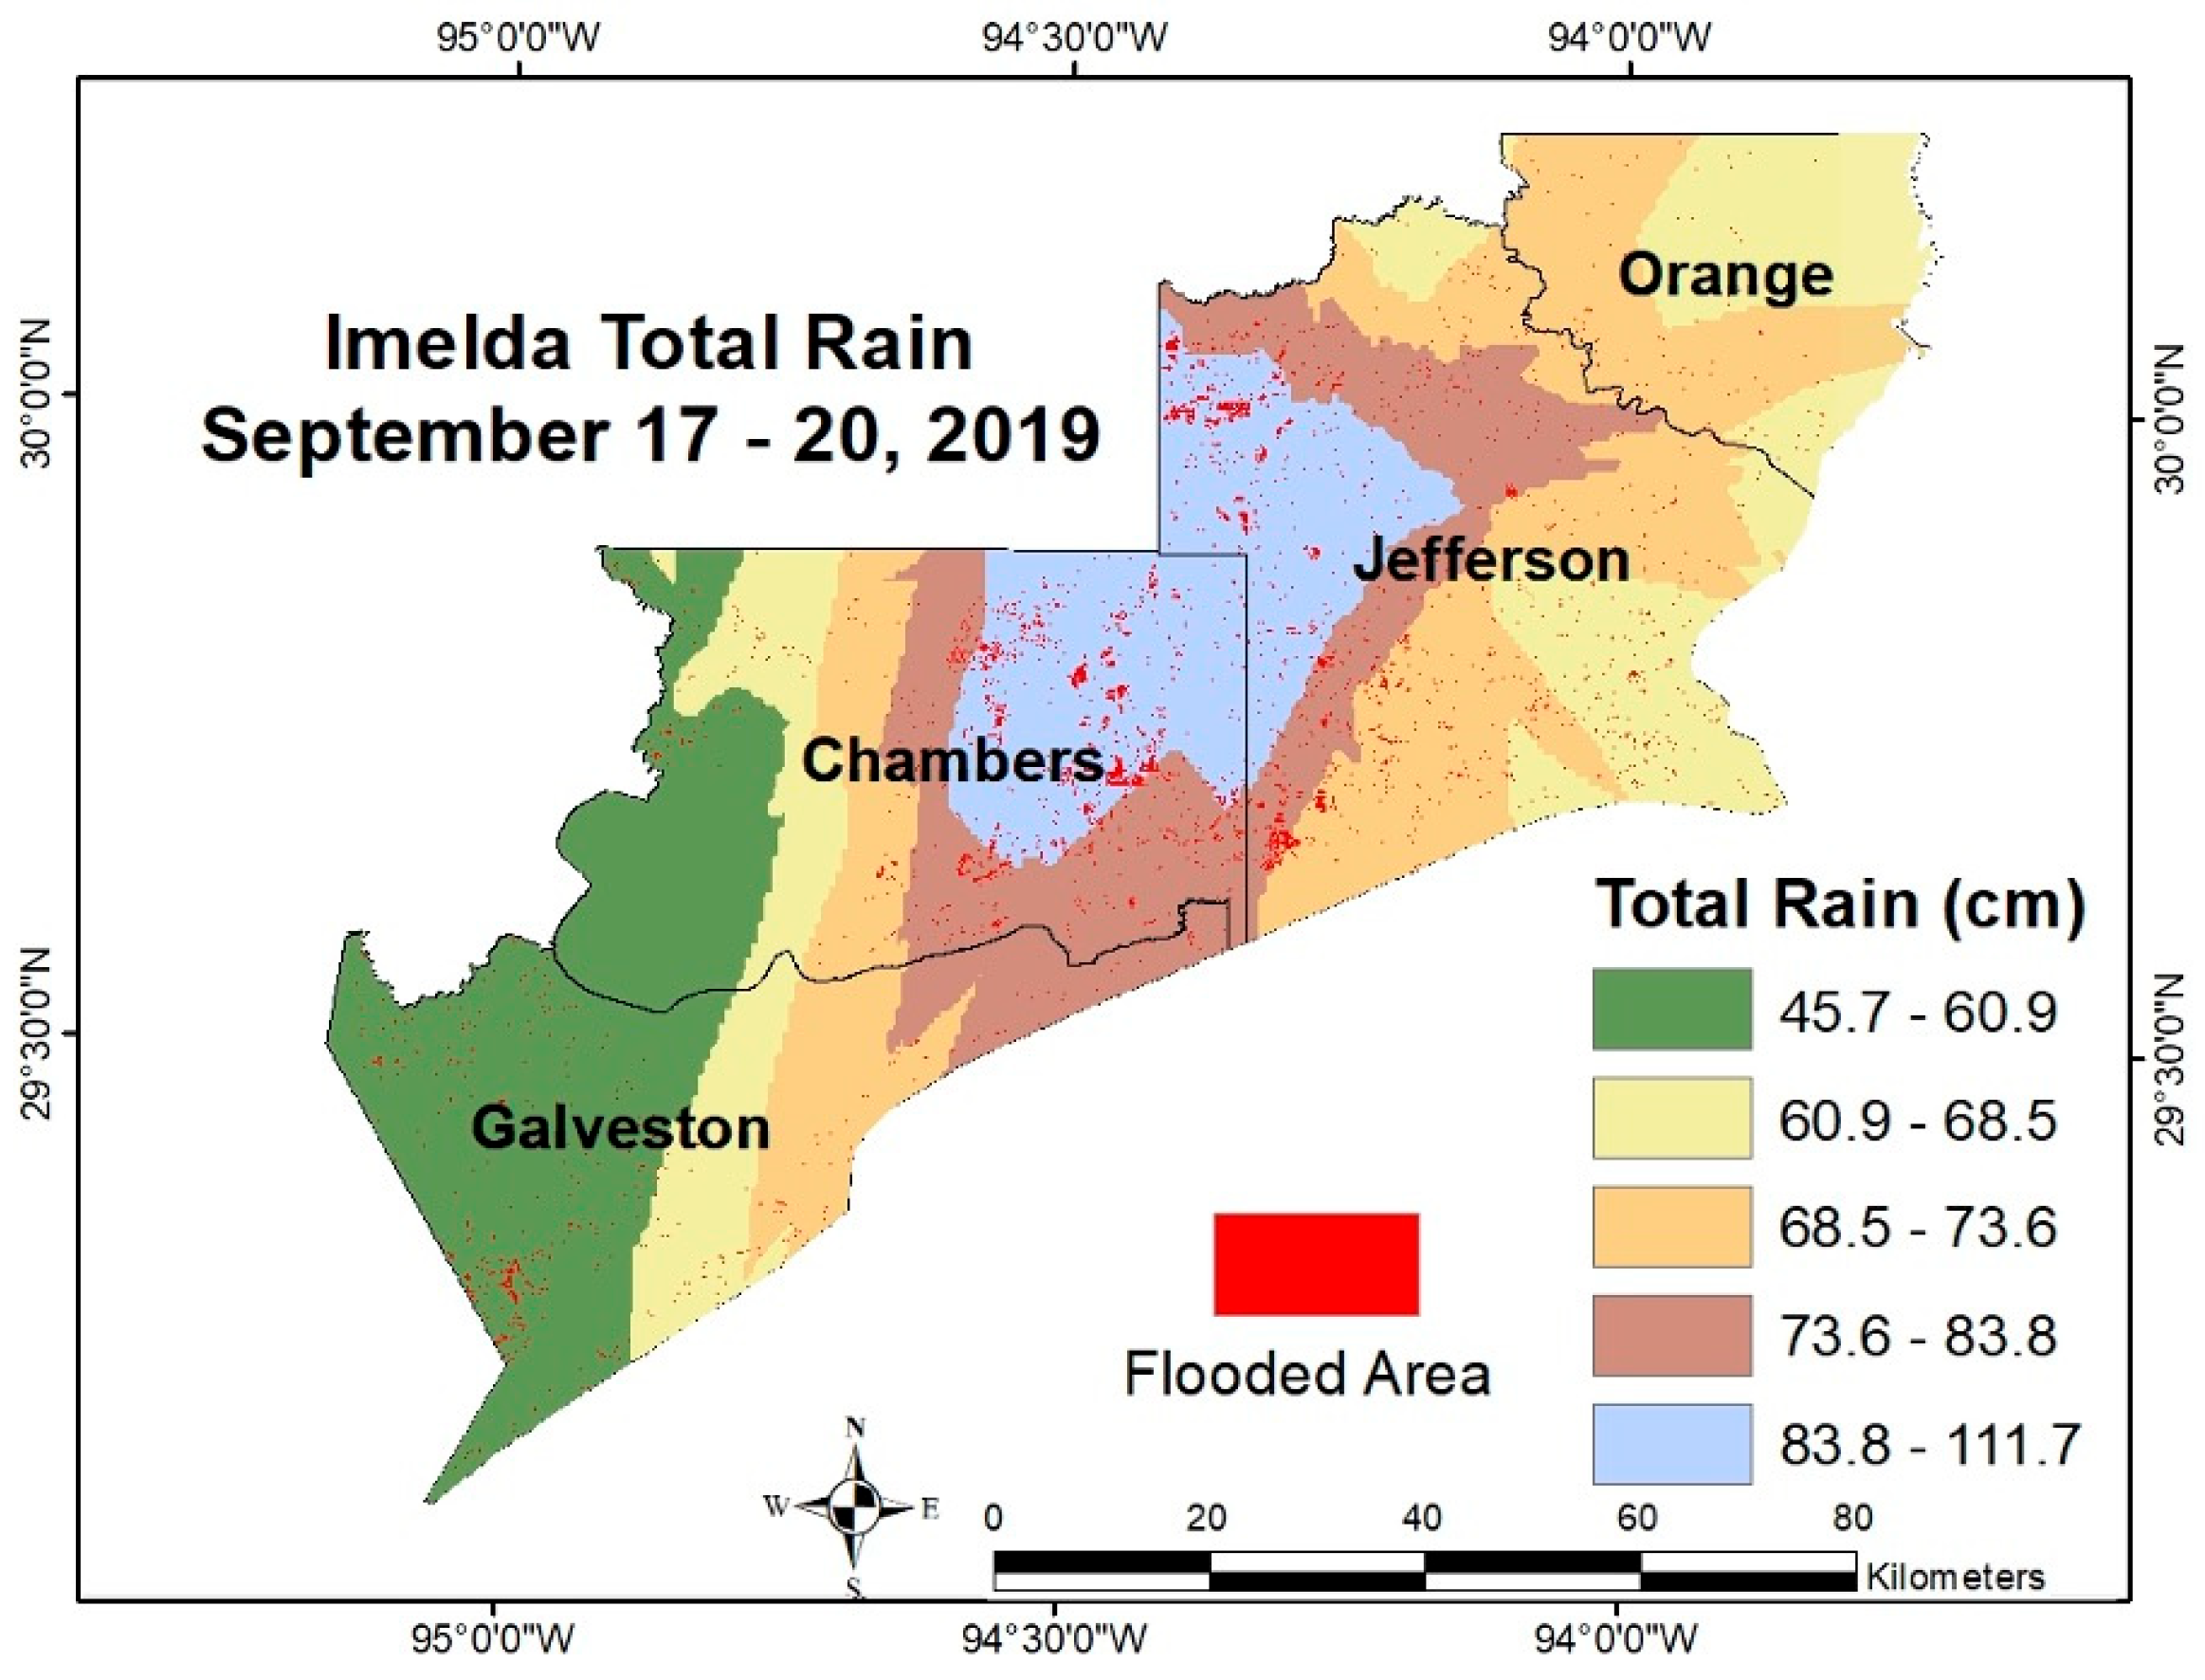
Given the anecdotal reports of heavier rainfall causing more severe flooding during Imelda, we quantitatively analyzed the relationship between rainfall and flood extent. First, a continuous rainfall surface was created by interpolating the point rain gauge measurements. Ordinary Kriging interpolation with a spherical variogram model was performed using ArcGIS Geostatistical Analyst to generate a continuous surface of total storm precipitation (17–20 September 2019) across the study area, which was subsequently resampled to 30 m to align with the spatial resolution of the SAR-derived flood map. The rainfall map was divided into five classes using natural breaks (Jenks) classification, yielding rainfall zones from roughly ~46 cm up to >84 cm of total rain (Class 1 being the lowest rainfall range, Class 5 the highest, as depicted in Figure 5). We then overlaid the binary flood extent map (from change detection) onto the rainfall classes map to compute how much flooded area fell within each rainfall class. This provided a dataset of paired values: for each rainfall class (independent variable), the corresponding flooded area in square kilometers (dependent variable).
We performed a linear regression analysis on these data to assess the strength of the rainfall–flood relationship. The coefficient of determination (R2) was calculated to summarize how much of the variance in flood extent is explained by rainfall differences. Additionally, we evaluated the statistical significance of the regression using a standard F-test (equivalent to a t-test on the slope, given a single predictor) to obtain a p-value for the correlation, and derived the 95% confidence interval for the regression slope.
Tropical Storm Imelda’s flooding was driven primarily by intense, localized rainfall, characteristic of a pluvial flood event. The affected counties—Orange, Jefferson, Chambers, and Galveston—are low-lying and drained by short bayous with limited capacity, resulting in rapid surface runoff and ponding during extreme rainfall [
25,
26]. Imelda delivered over 1100 mm of rain in some areas within three days [
21], overwhelming local drainage systems and leading to widespread flash flooding without significant upstream contributions. Given the flat topography and localized nature of the storm, analyzing rainfall solely within the impacted counties accurately reflects the flood-generating conditions. This approach is appropriate for pluvial events, where floodwaters originate from on-site rainfall rather than distant watershed inflows [
27,
28].
2.6. Topographic and Land Cover Analysis
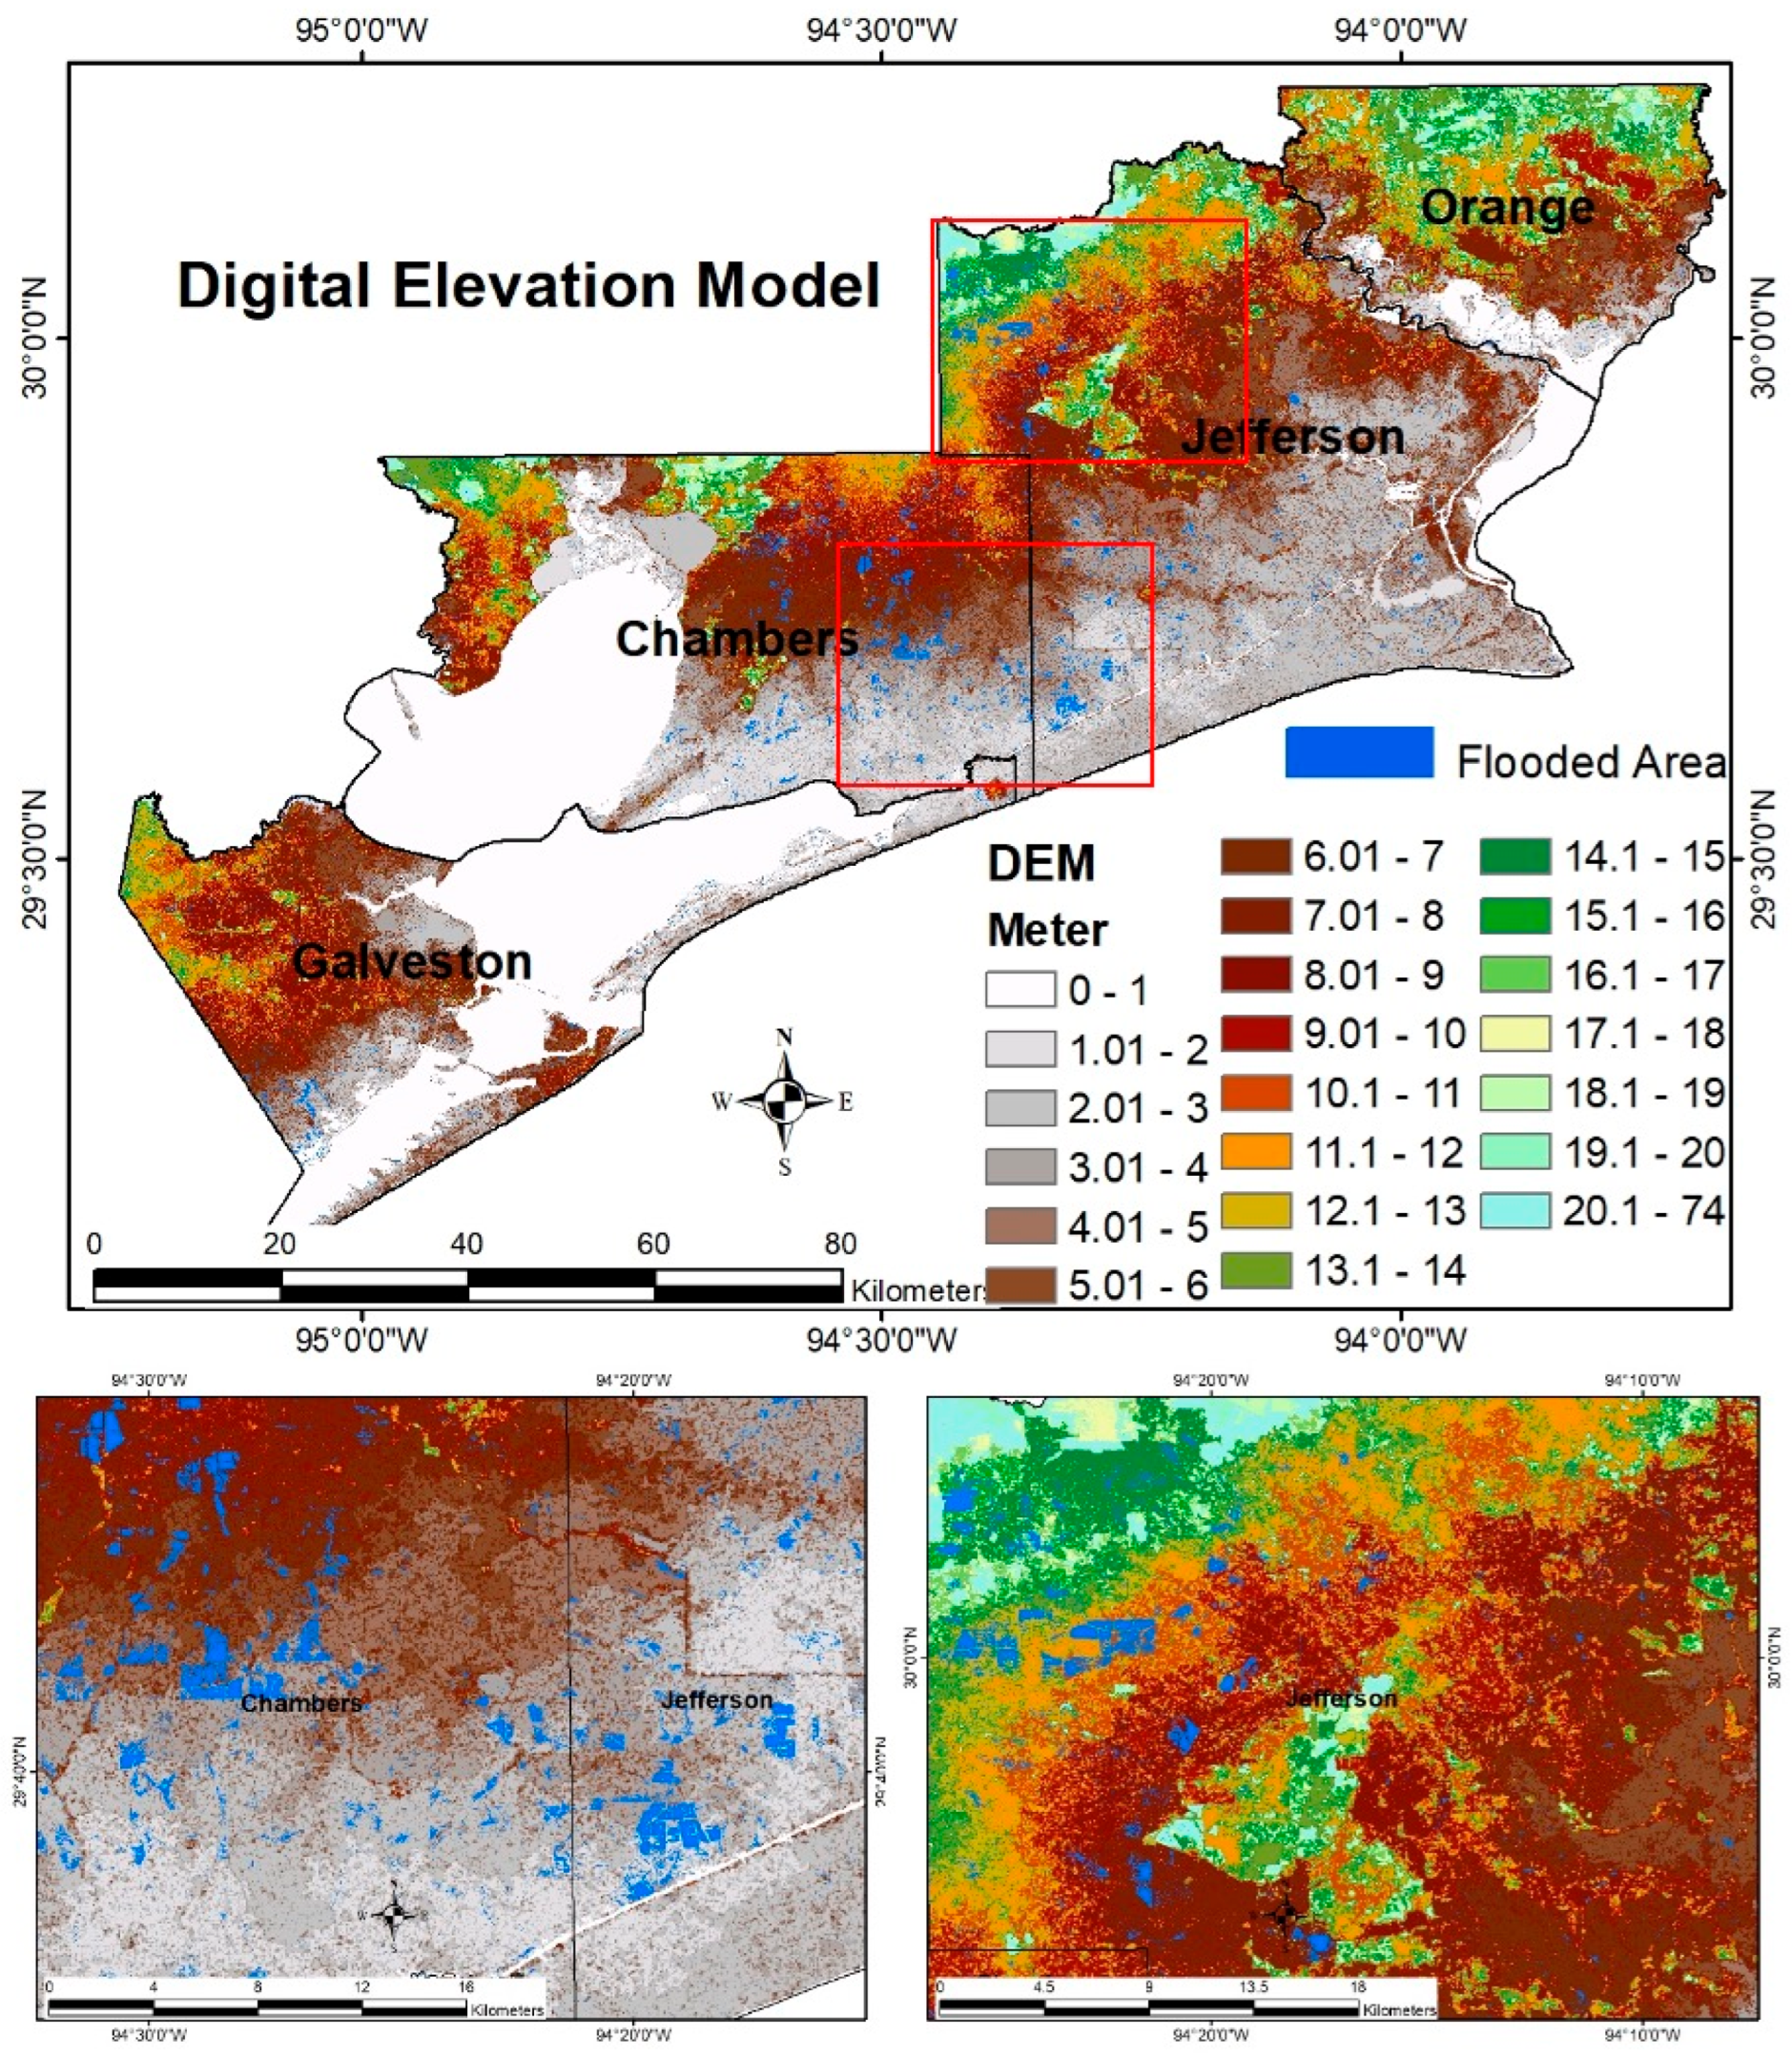
We also examined the influence of topography and land cover on the spatial distribution of flooding. To ensure hydrologically correct terrain representation, we first applied a “fill sinks” preprocessing step to the SRTM DEM using ArcGIS, removing depressions that could otherwise distort slope and elevation analyses. The corrected DEM was then used to generate elevation and slope maps for the study area. Elevation values, ranging from 0 m near the Gulf Coast to approximately 74 m in the northern portion of the region, were classified into 1-m intervals to delineate low-lying flood-prone zones. The classified elevation map was intersected with the SAR-derived flood extent to quantify the distribution of inundation across elevation bands. For land cover, the NLCD 2016 data (30 m) were used to map the distribution of different land use/land cover types (forests, urban areas, agriculture, wetlands, etc.). We converted the NLCD raster into polygons and intersected these with the flood extent to tally flooded area by land cover category.
3. Results
3.1. Flood Extent Mapping
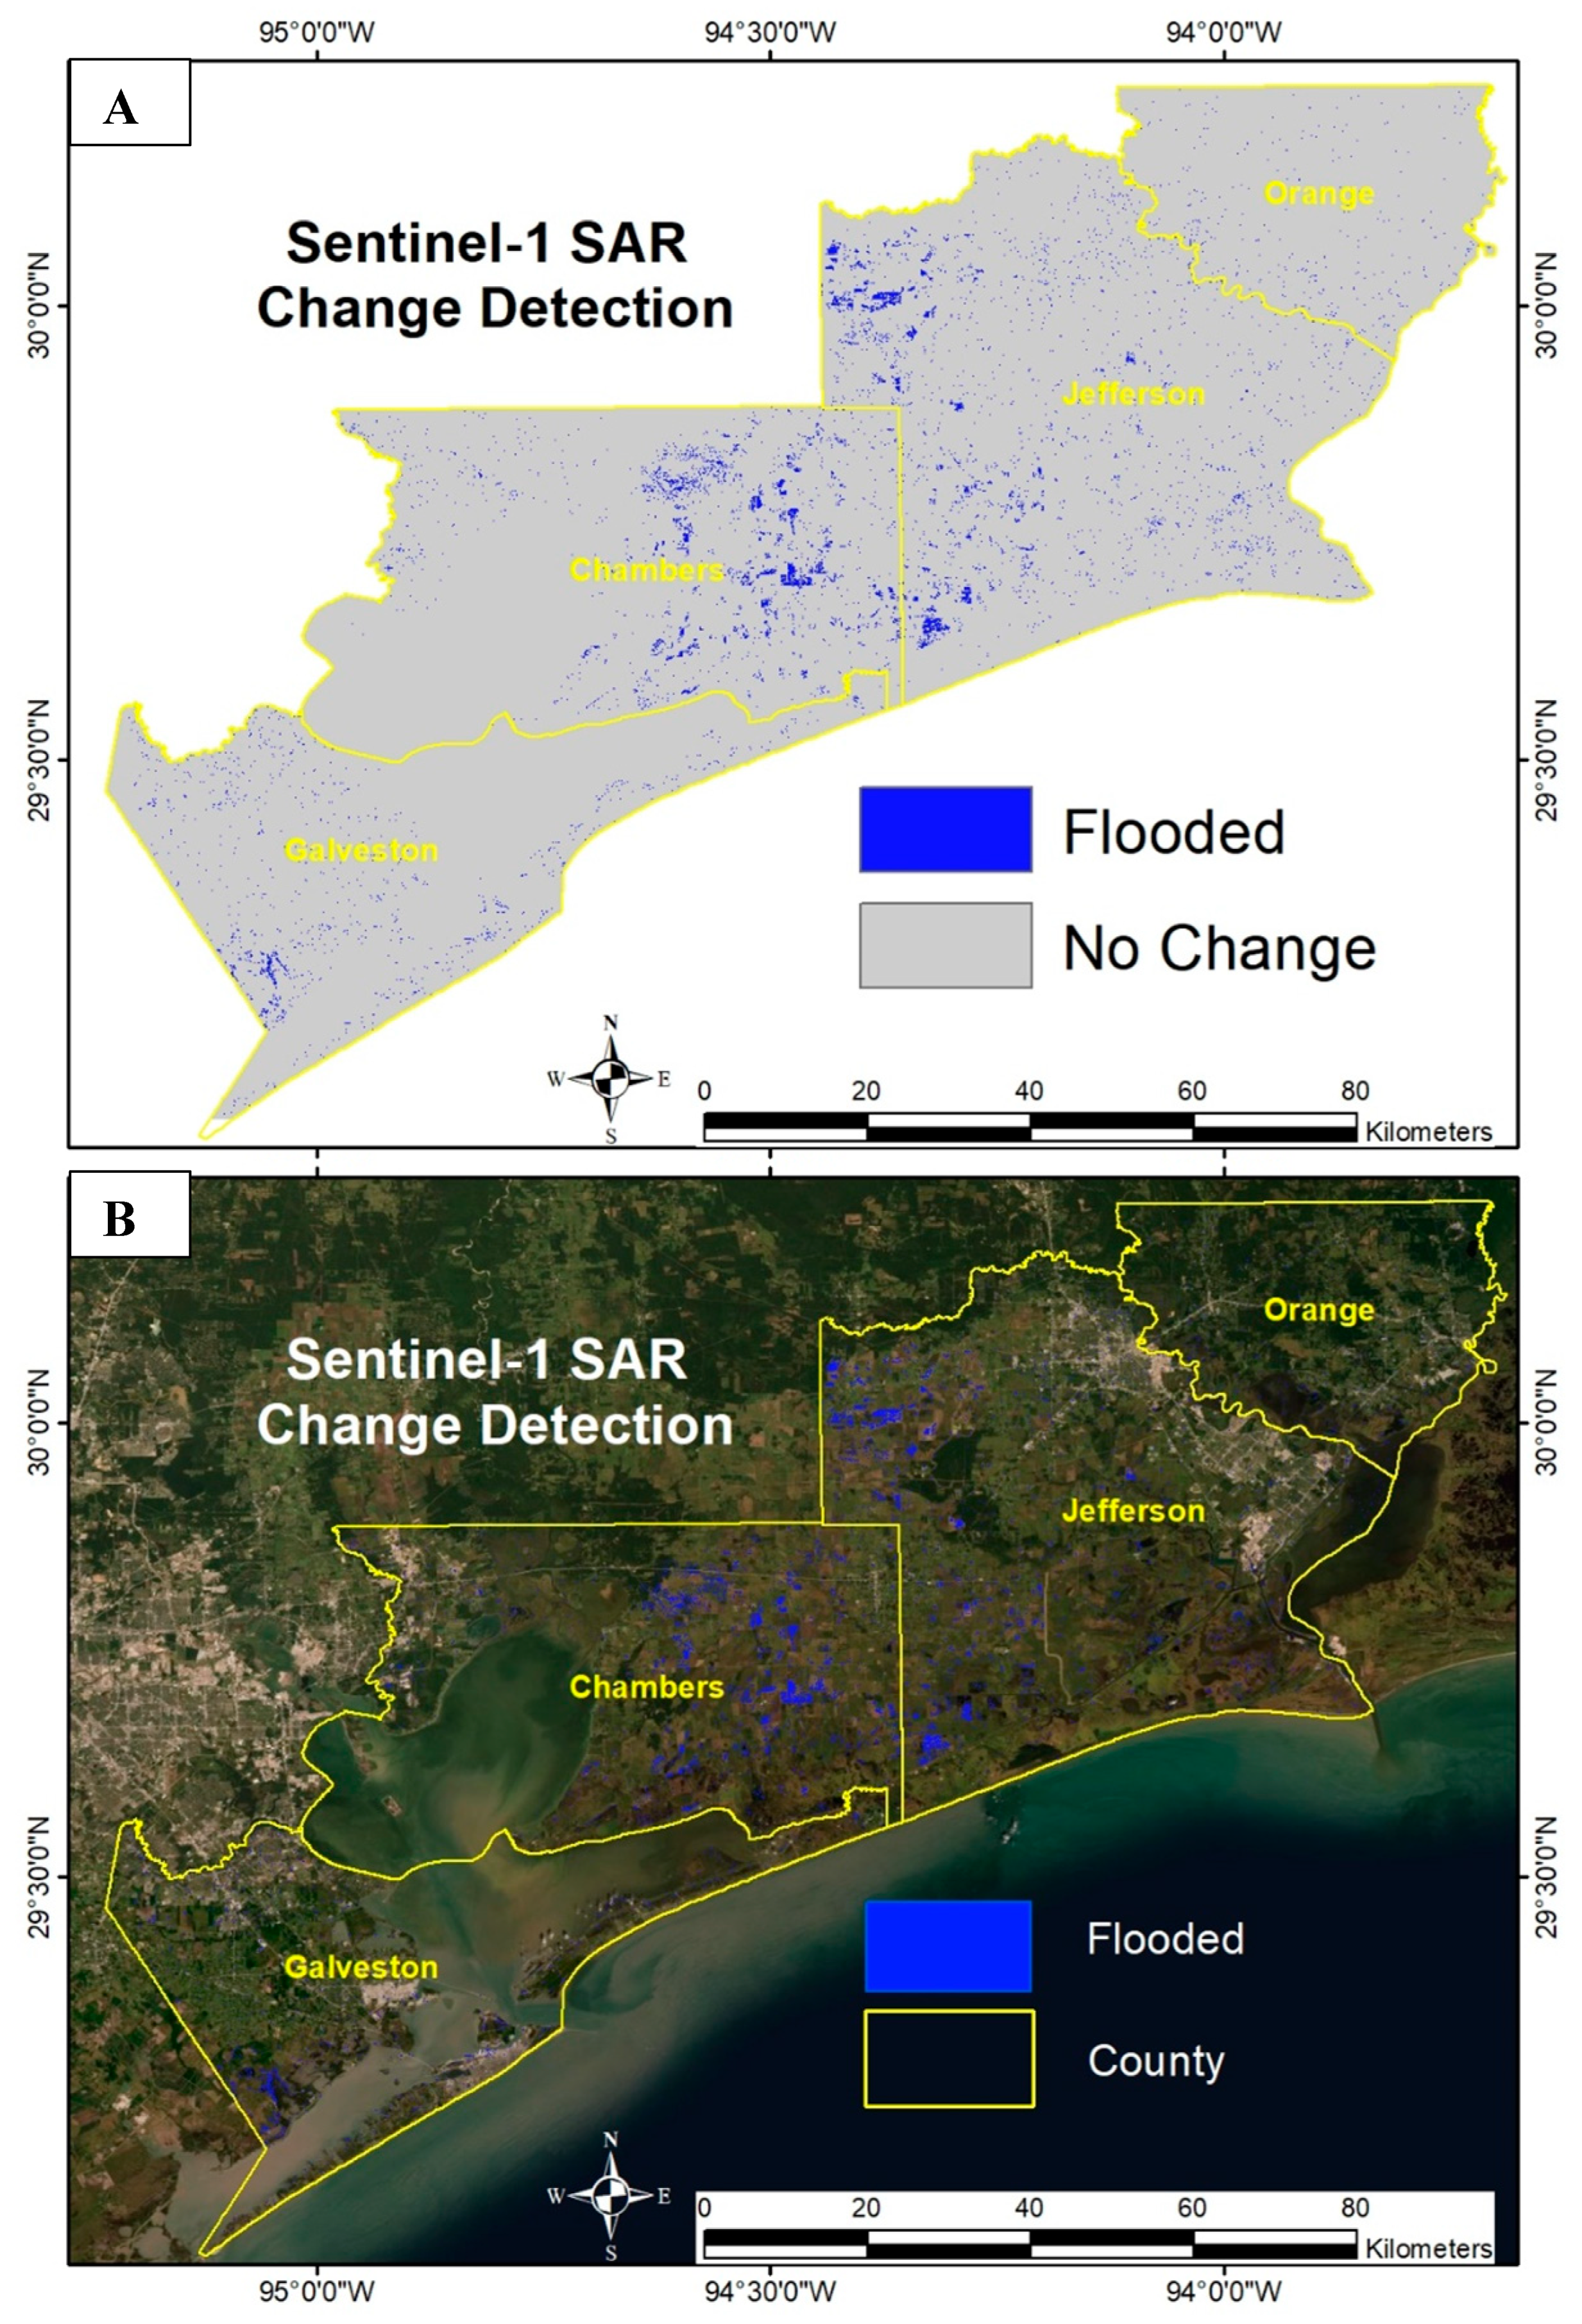
The Sentinel-1 SAR analysis successfully captured the extent of flooding caused by Tropical Storm Imelda. In the pre-flood ratio image (7 September 2019), permanent water bodies (rivers, lakes, ponds, bayous) appear prominently as water pixels, whereas the surrounding land is distinct. In the during-flood ratio image (19 September 2019), the extent of water increased substantially, with floodwaters appearing as new inundated areas spreading over land that was dry in the pre-event image (
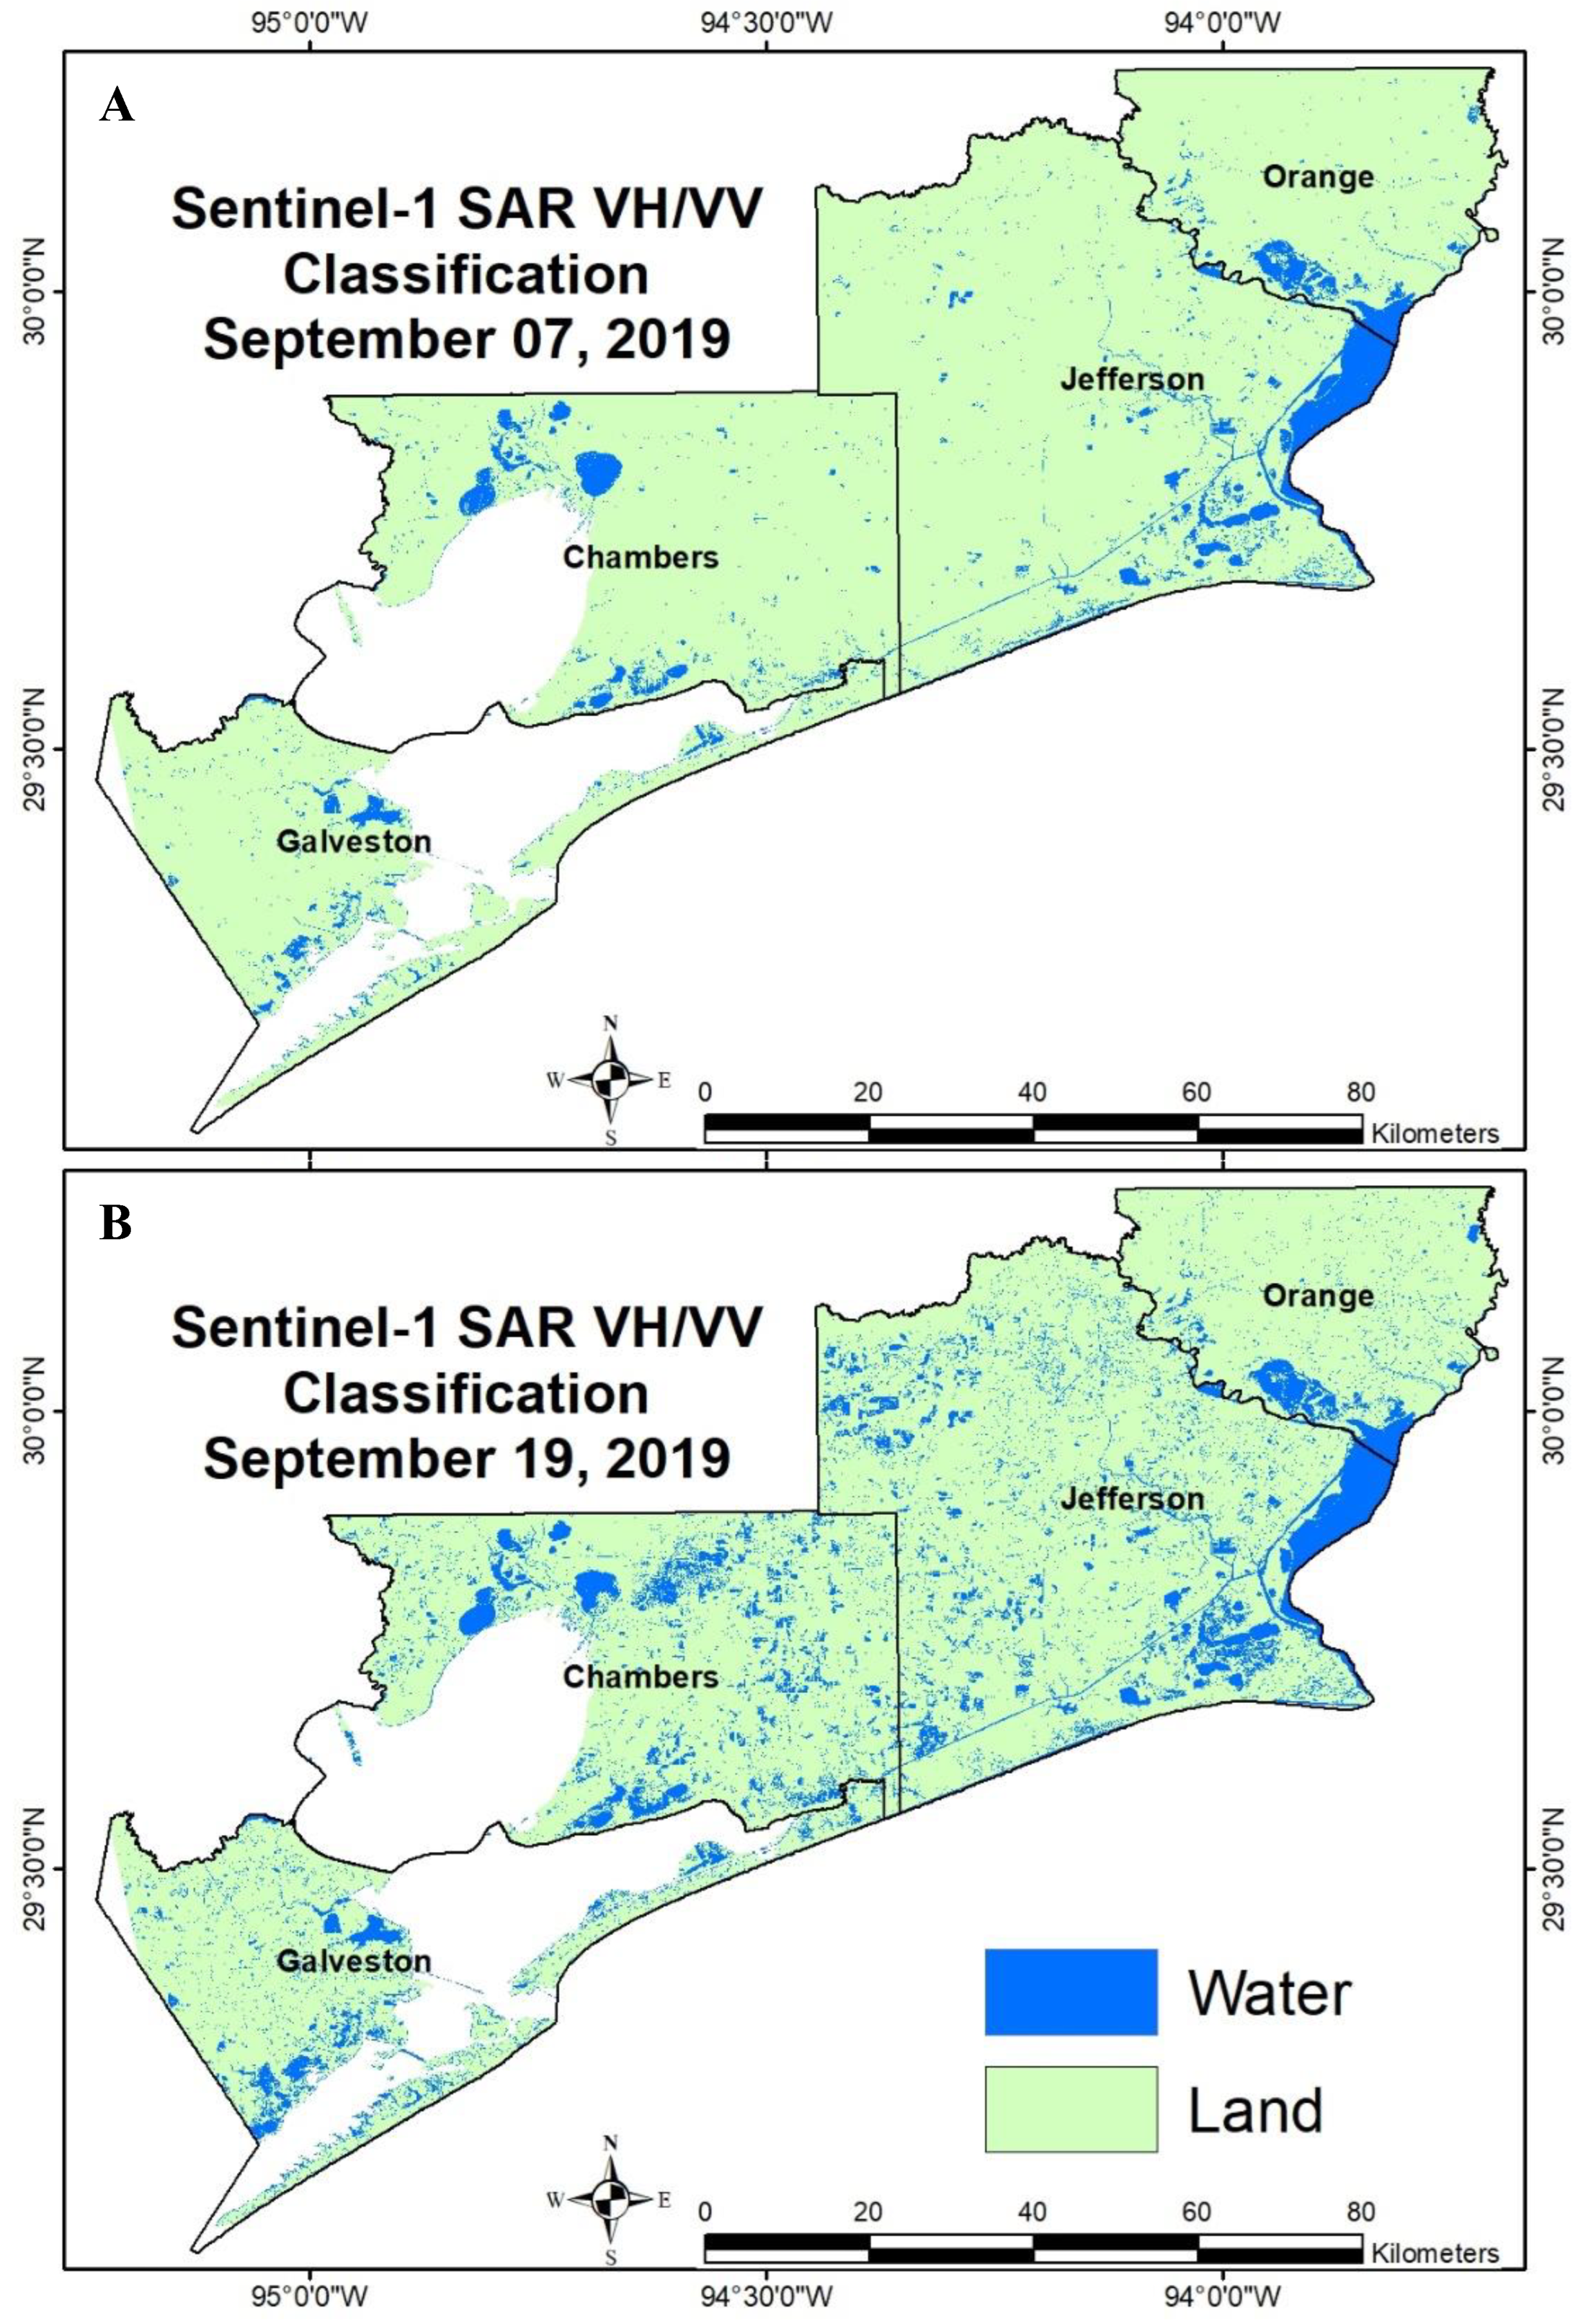
Figure 3). The supervised classification of these ratio images into Water vs. Land classes quantitatively delineated the flood extent (
Figure 4). Before the storm (pre-flood), the classified water pixels covered approximately 459 km
2, corresponding to the permanent open-water coverage in the region, while land covered about 5735 km
2 (
Figure 4A). During the flood event, the water class area increased to roughly 893 km
2, while land area reduced to about 5301 km
2 (
Figure 4B). This difference (~434 km
2) represents the new inundated area due to Imelda’s flooding (excluding the permanent water bodies). The spatial distribution of the flood was uneven across the counties: Jefferson and Chambers counties (central study area) experienced the most widespread flooding, whereas Orange and Galveston counties had comparatively less flooded area. The flood map clearly shows water overflowing along river channels and spreading into adjacent lowlands, as well as ponding in flat agricultural fields and wetlands. Notably, floodwater often surrounded or connected to permanent water bodies, as expected, since rising river levels expanded outward and small water bodies (ponds, marshes) merged with flood pools.
The accuracy assessment confirmed the reliability of the flood classification (
Table 1 and
Table 2). The error matrices for the pre-flood and during-flood classifications indicated overall accuracies of 96% and 94%, respectively, with strong agreement (kappa ≈ 0.74–0.77). Most misclassification errors were limited to a few isolated areas. For example, some patches of dense wetland vegetation were occasionally labeled as water (since the radar return from water under vegetation can be tricky to discern) and a few narrow riverbanks were missed. However, these errors were minimal and did not significantly affect the overall flood area estimation or pattern.
Analysis of the confusion matrices in
Table 1 and
Table 2 reveals notable differences in classification performance between pre-flood and flood conditions, particularly in the trade-off between omission and commission errors. In the pre-flood scenario, the Water class achieved perfect precision (U-Accuracy = 100%) but lower recall (P-Accuracy ≈ 63%), suggesting that the classifier was conservative—avoiding false positives but failing to detect some smaller or vegetated water bodies. The Land class, by contrast, demonstrated excellent accuracy (P-Accuracy = 100%, U-Accuracy ≈ 95%), with minimal misclassification. During the flood event, the Water class P-Accuracy increased to approximately 87%, indicating improved detection of actual inundation, though U-Accuracy declined to 75% due to a modest rise in false positives, possibly reflecting misclassifications in mixed land cover or areas with shallow water. The Land class remained stable with both P-Accuracy and U-Accuracy exceeding 95%, highlighting the model’s resilience. These results illustrate a reasonable and expected shift in classification behavior: under flood conditions, the model broadened its sensitivity to capture more of the true flood extent, while still maintaining high overall reliability. Such performance, consistent across varied hydrologic states, supports the robustness of the SAR-based approach for operational flood mapping.
3.2. Rainfall Extent Correlation
Consistent with expectations, there is a strong positive relationship between the amount of rainfall from Imelda (
Figure 5) and the extent of flooding observed (
Figure 6). By comparing total rainfall distribution to the SAR-derived flood map, we found that areas with heavier precipitation correspond to greater flooded areas. For example, the eastern and western parts of Chambers County and central Jefferson County received the highest rainfall totals (over ~85 cm), and these areas show extensive flooding in our maps (confirming reports of severe flooding in Winnie, Beaumont, etc.). Conversely, Galveston County, which had much lower rainfall (generally < 55–60 cm), experienced only minor flooding, mostly from storm surge rather than rainfall runoff (
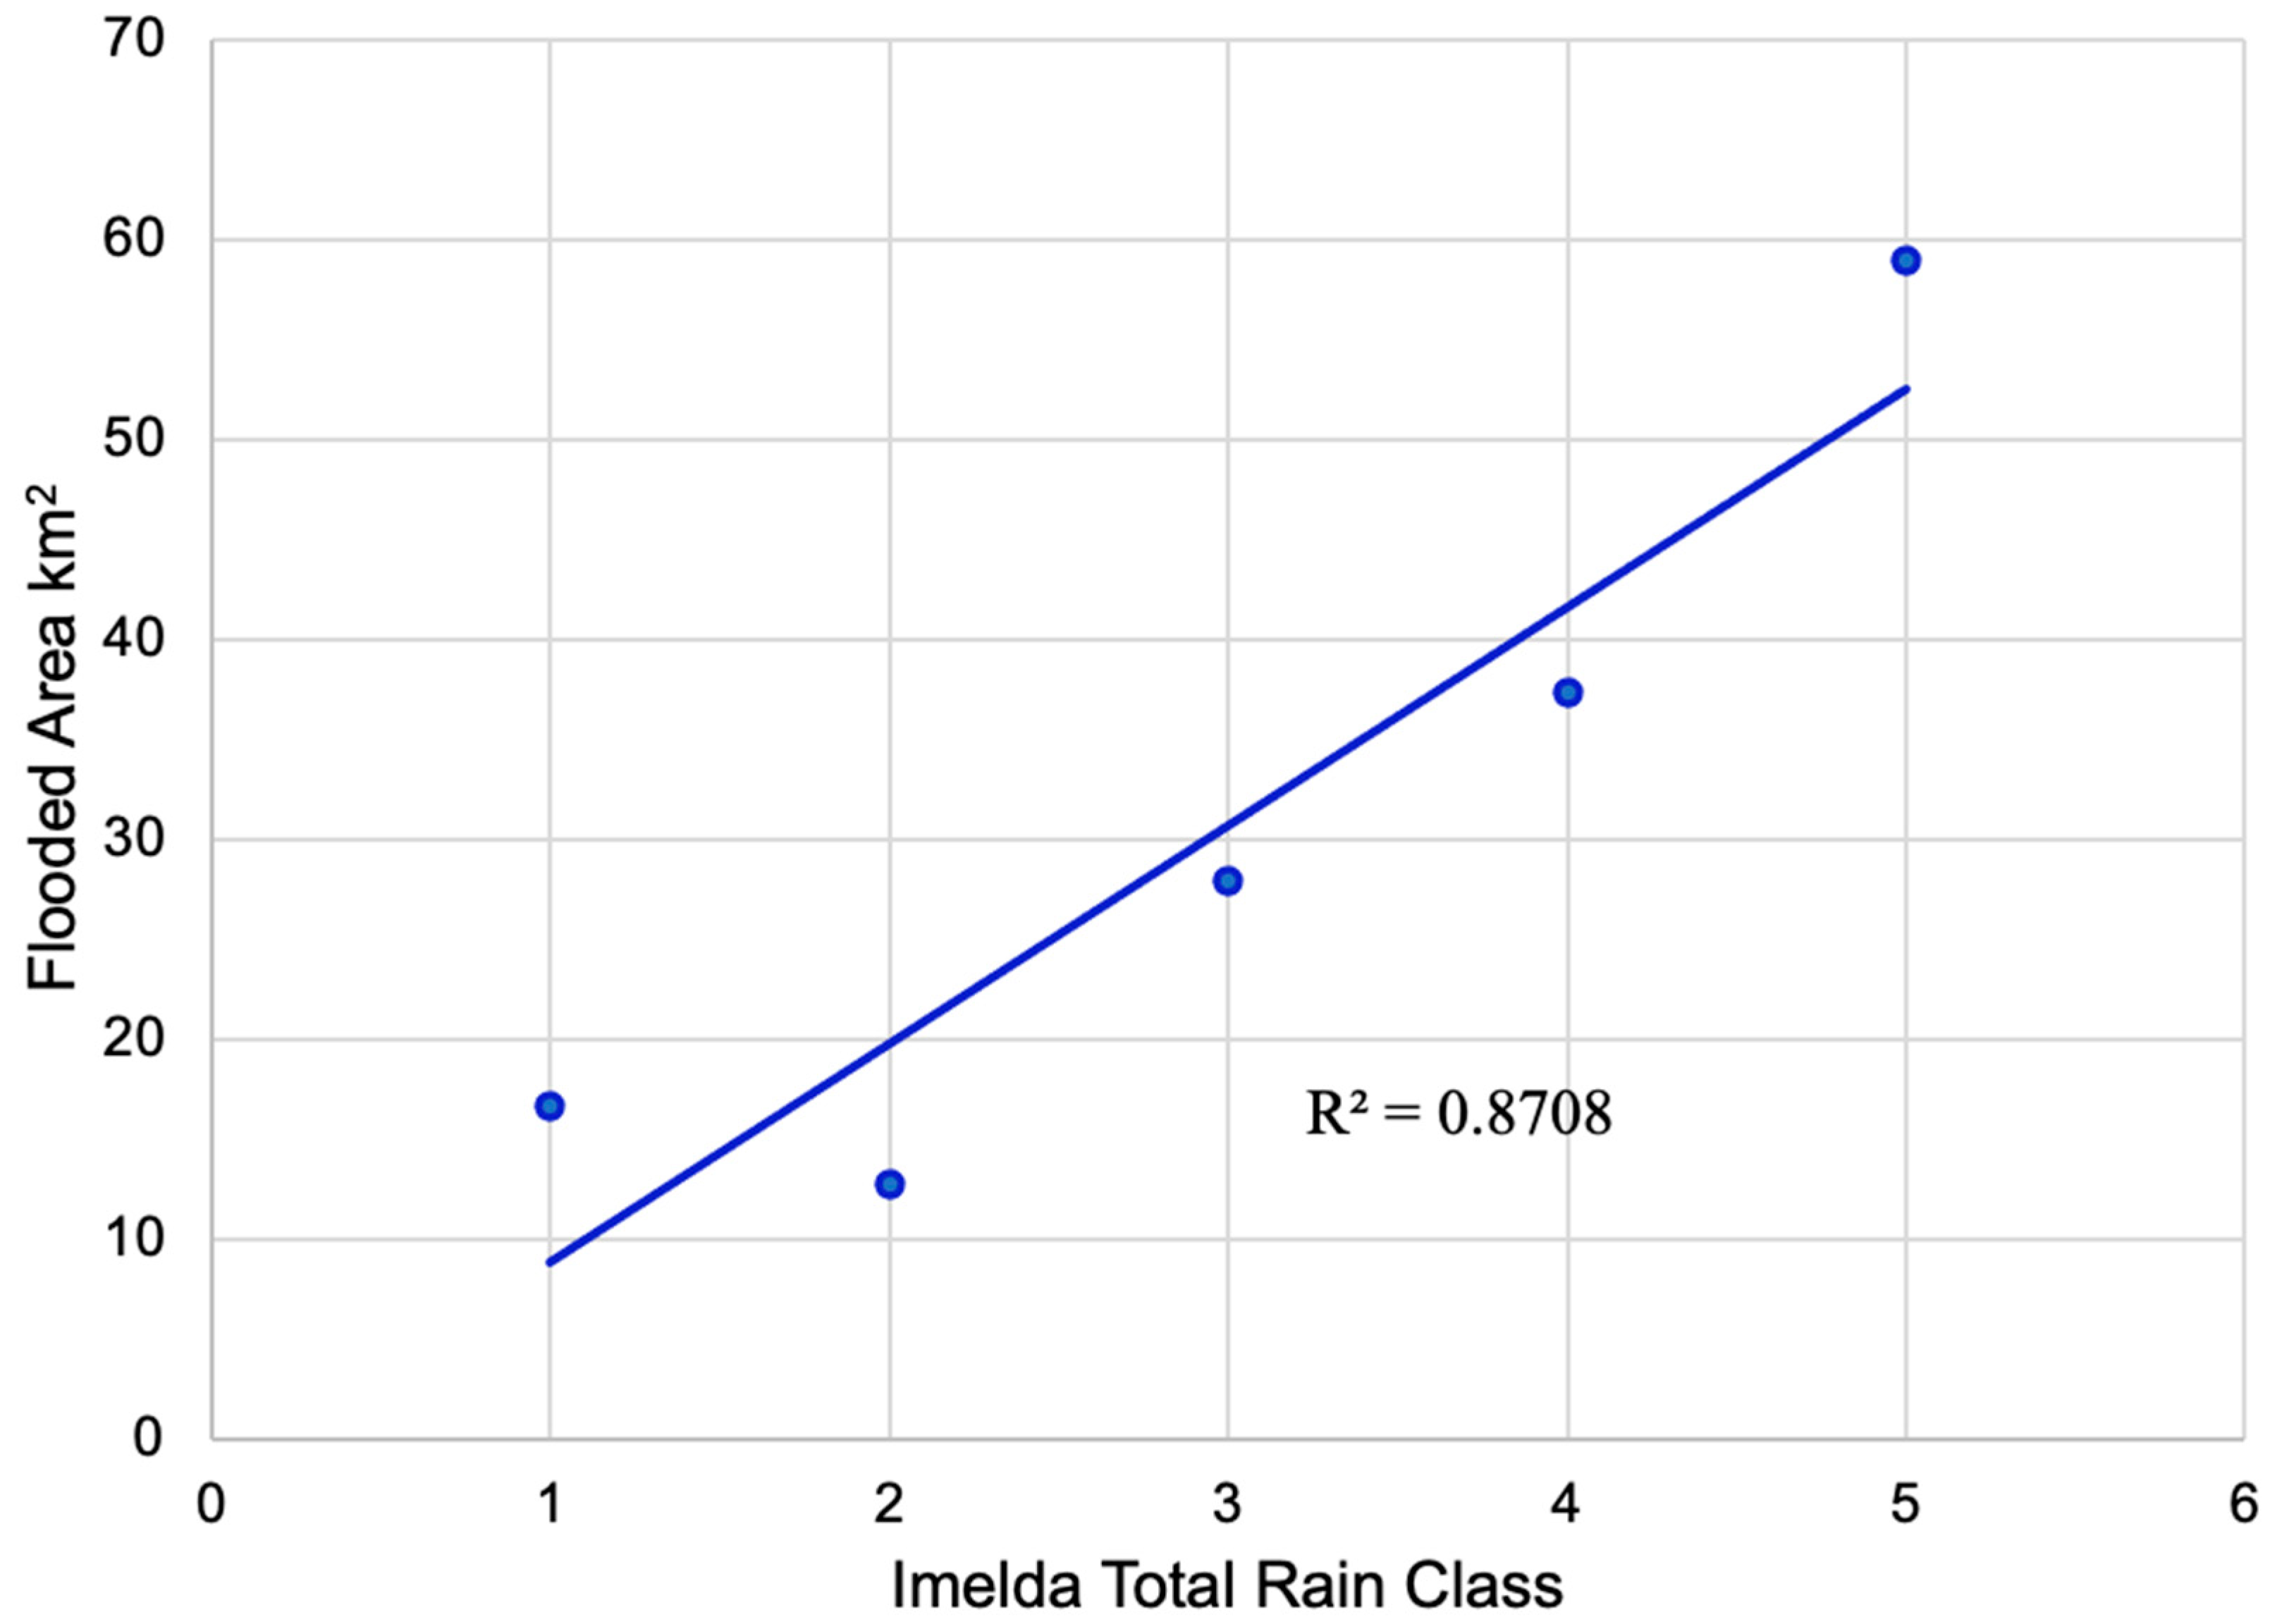
Table 3). A scatter plot of flooded area versus rainfall amount (
Figure 7) illustrates this trend quantitatively. The linear regression analysis yielded an R
2 of 0.87, indicating a very high correlation. Statistically, this correlation is significant (
p < 0.05), suggesting that the likelihood of observing such a strong flood–rainfall relationship by chance is low. In practical terms, our results mean that roughly 87% of the variance in flood extent across the region can be explained by how much rain fell. The remaining unexplained variance could be due to local factors like drainage efficiency, land cover, or timing of rainfall. The regression slope (flood area per unit rain) and its confidence interval further confirm that increased rainfall led to substantially more flooding—an important validation, as it quantifies the intuitive cause-effect between the storm’s rainfall and the SAR-mapped inundation. This finding aligns with hydrological reality and reinforces confidence in both the rainfall data and the flood mapping: had the flood map or rain data been significantly inaccurate, this strong correlation might not have emerged.
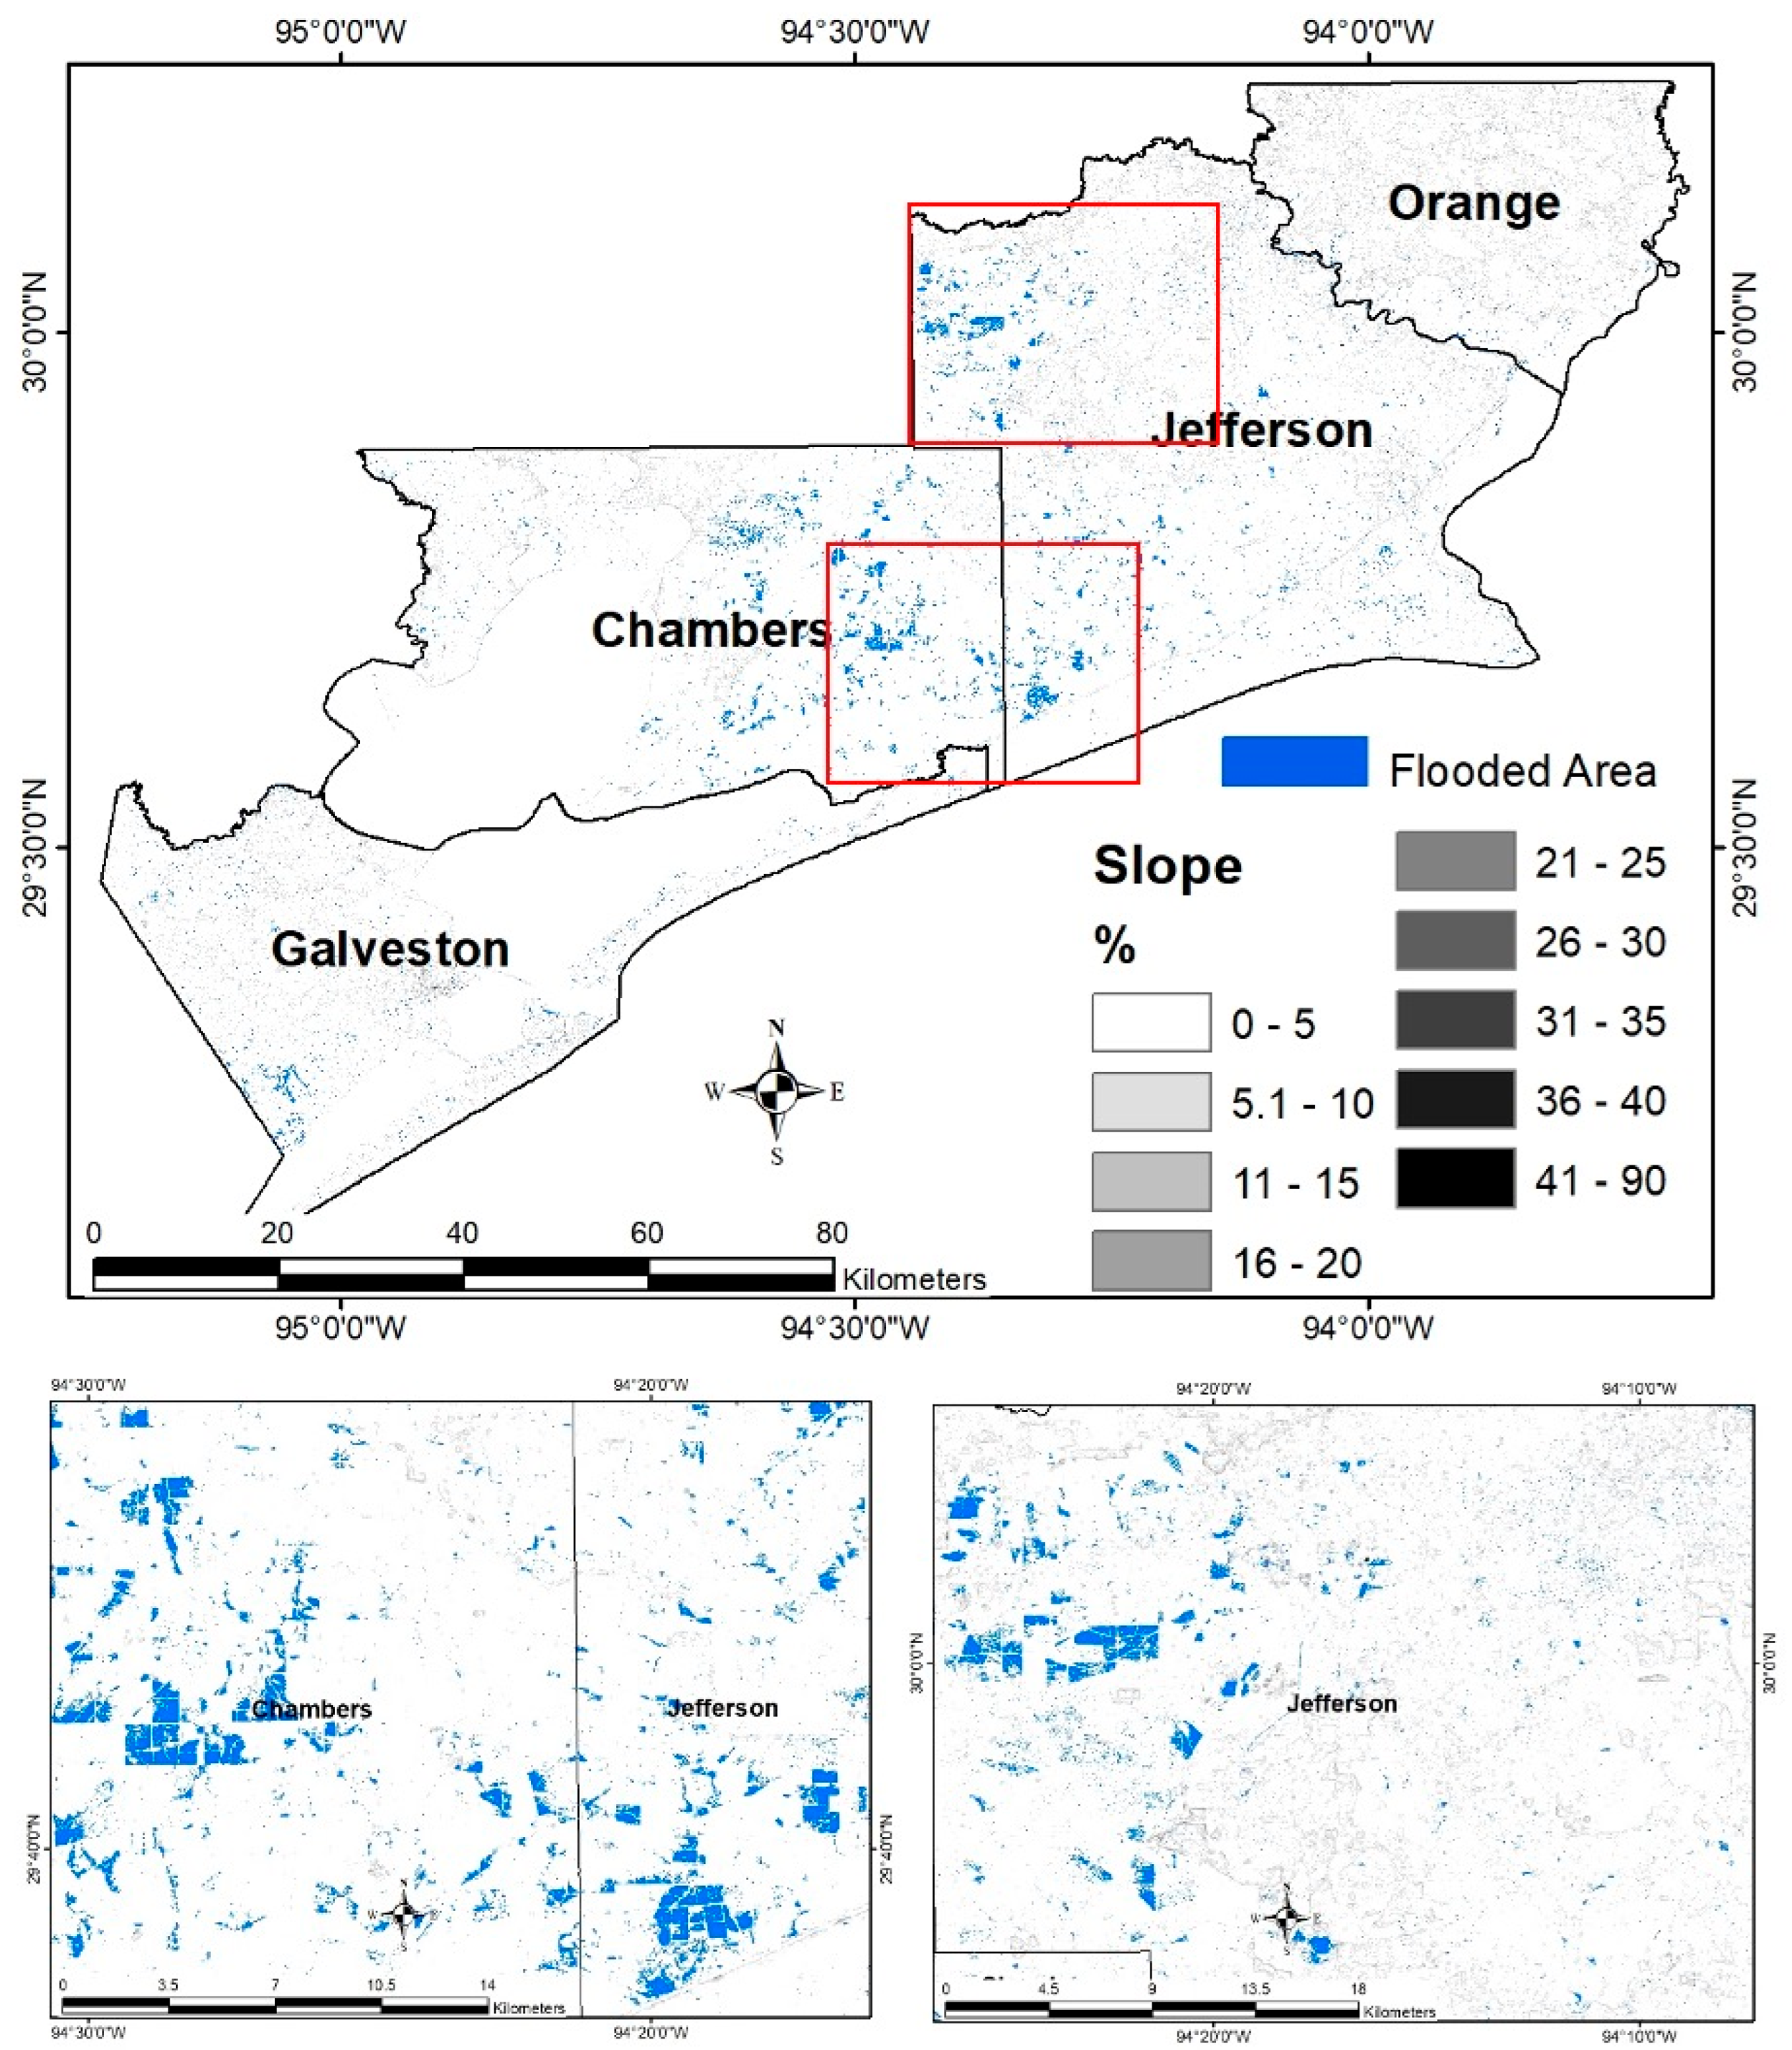
3.3. Influence of Topography
Terrain characteristics significantly influenced the spatial distribution of flooding during Tropical Storm Imelda. As expected in a coastal plain environment, low-lying areas experienced the greatest inundation. Overlaying the mapped flood extents on elevation data revealed that the majority of flooded areas were situated below 10 m, with the most extensive flooding occurring between 3 and 4 m above sea level (
Figure 8 and
Figure 9). These areas are predominantly flat and poorly drained, making them highly susceptible to surface water accumulation during extreme rainfall events.
In contrast, higher elevation zones (above 15–20 m) exhibited little to no flooding, likely due to a combination of reduced rainfall and more efficient runoff. Slope analysis reinforced this pattern: over 95% of flooded pixels occurred on gentle slopes (0–5%), while steeper areas (>10%) were rarely inundated. This suggests that Imelda’s intense rainfall pooled in the low-lying, flat “basins” of the landscape, a finding consistent with other studies that identify topography as a primary determinant of flood distribution.
However, flood extent was not solely a function of terrain. It also reflected a complex interplay of additional factors, including vegetation cover and human infrastructure. Vegetated areas can slow runoff or obscure shallow flooding, while urban zones with inadequate drainage systems may exacerbate flood impacts despite their elevation. Thus, the observed inundation patterns during Imelda were shaped by the combined influence of topography, land cover, and drainage infrastructure. These results underscore the importance of integrating elevation, slope, and anthropogenic features in flood risk assessments, particularly in rapidly urbanizing or low-lying regions.
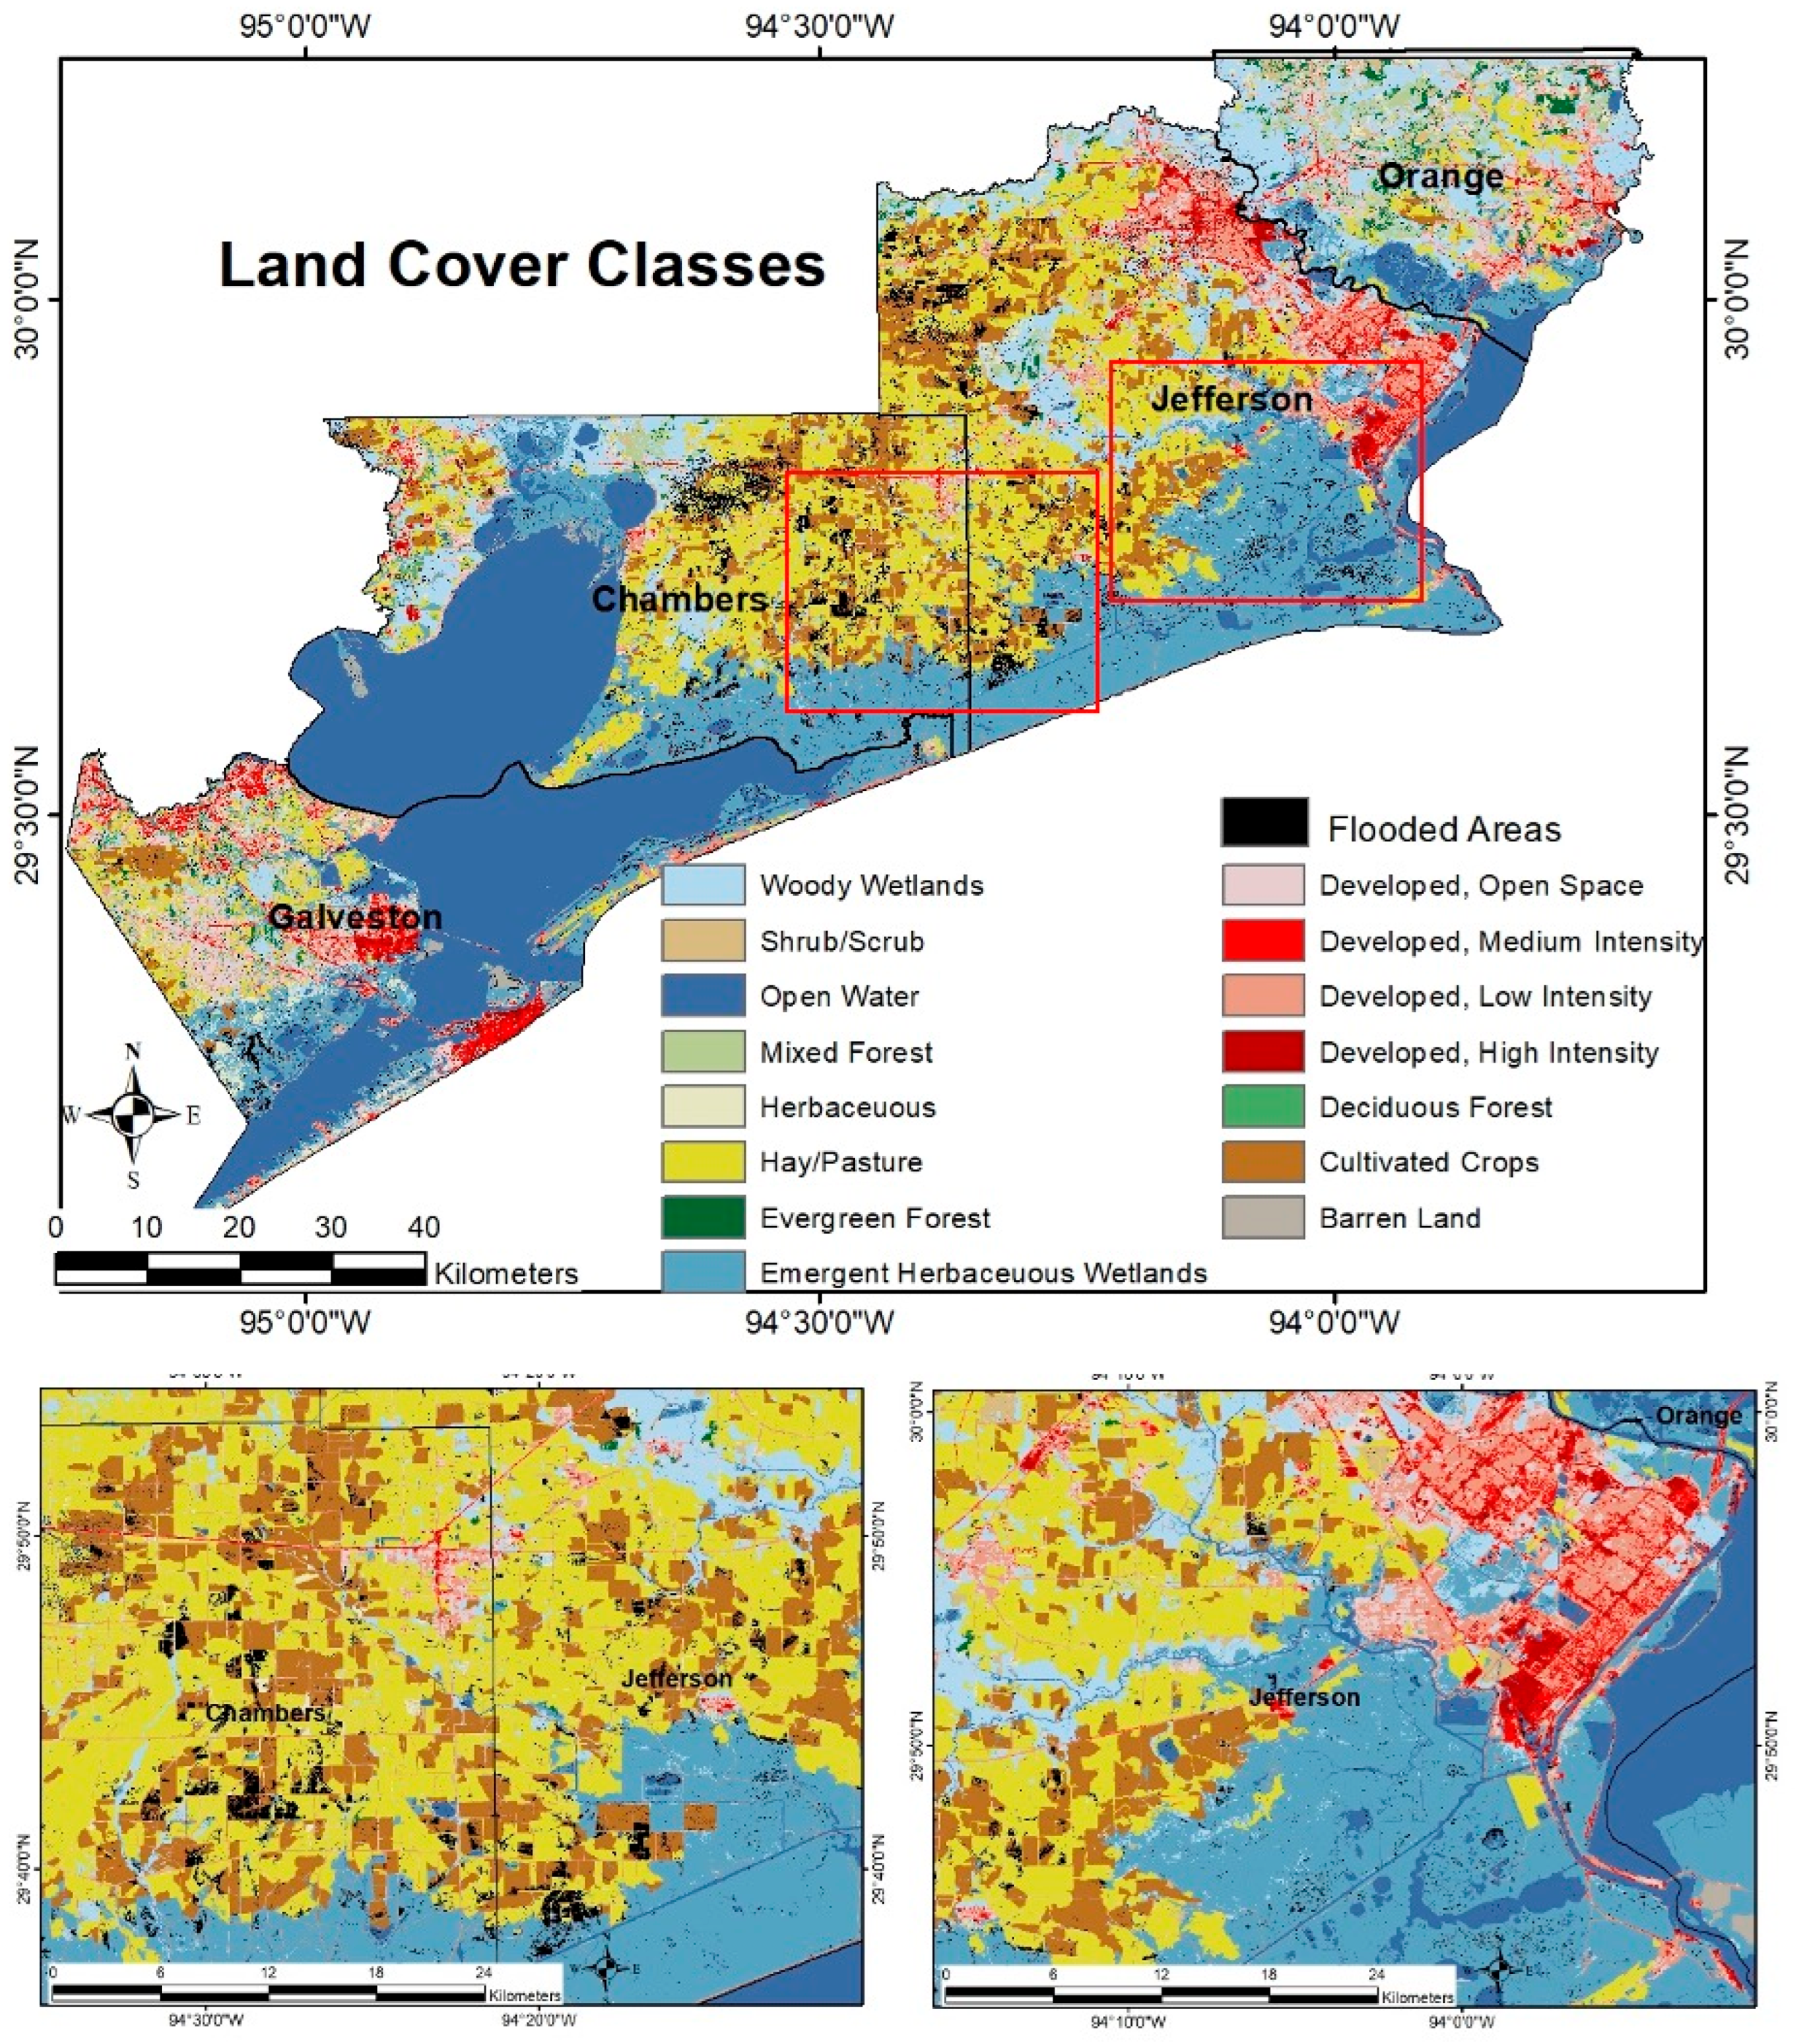
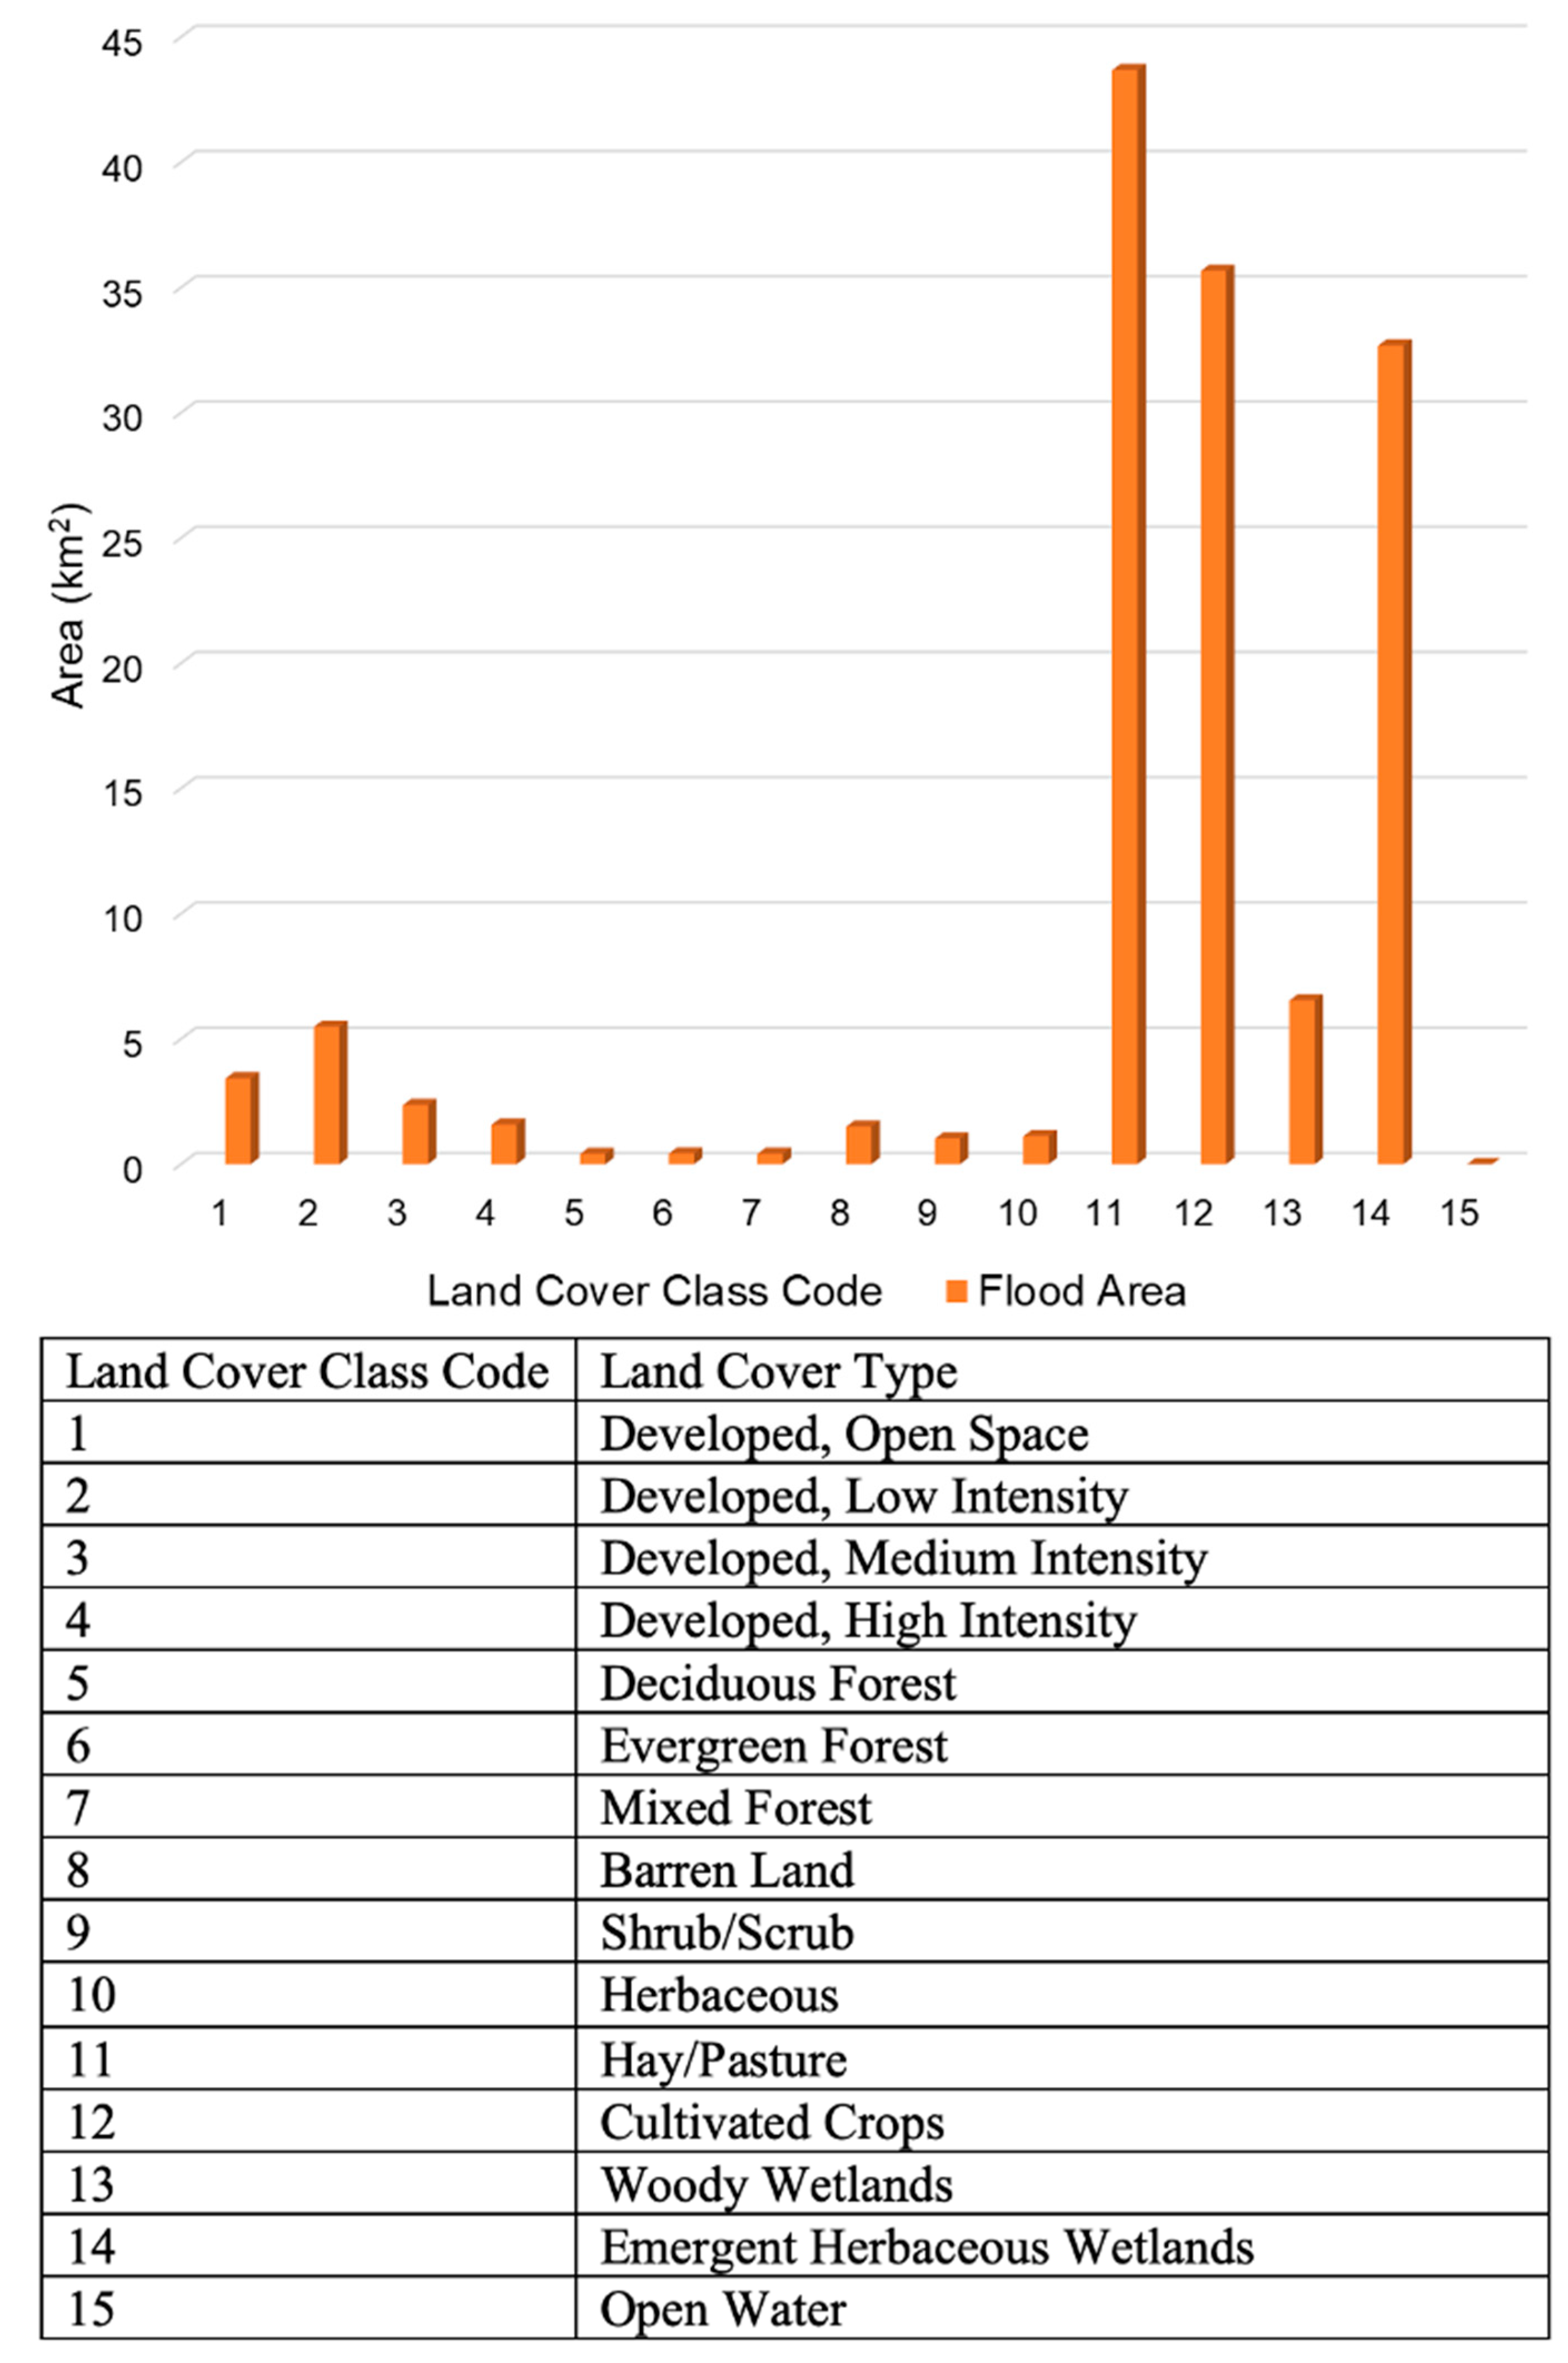
3.4. Influence of Land Cover
Land cover and land use patterns played a significant role in shaping the spatial distribution and severity of flooding during Tropical Storm Imelda. Our analysis revealed that agricultural and wetland areas experienced the most extensive inundation. In particular, hay and pasture lands, cultivated crops, and emergent herbaceous wetlands accounted for a substantial share of the total flooded area (
Figure 10 and
Figure 11). These land cover types are widespread in the flat, low-lying regions of Chambers and Jefferson counties—areas that suffered the greatest flooding. Their broad, open expanses and limited drainage capacity make them especially vulnerable to prolonged water accumulation. In these settings, soils quickly reach saturation, and even moderate additional rainfall leads to standing water or slow-moving runoff. This pattern aligns with findings by [
6], who observed similar flood retention in agricultural and vegetated lowlands in Bangladesh.
Urban areas were also affected, though flooding patterns varied with development intensity. Low-intensity developed zones—such as suburban neighborhoods with mixed impervious surfaces (e.g., roads, driveways) and pervious areas (e.g., lawns, parks)—experienced more persistent flooding than densely built urban cores. These suburban areas often lack robust stormwater infrastructure, making them more prone to water accumulation when drainage systems are overwhelmed. In contrast, high-intensity urban zones typically feature better-engineered drainage networks that facilitate rapid runoff, reducing the duration and extent of surface flooding. This was evident in Orange County, where runoff from impervious surfaces was efficiently channeled into streams, but the streams subsequently overflowed into adjacent low-lying residential areas. Additionally, some urban flood areas may have been underrepresented in the SAR flood map due to sensor limitations—shallow water layers on smooth pavement surfaces can appear similar to dry ground, especially in C-band radar imagery.
Forested areas showed the least flooding, which may reflect both actual hydrologic conditions—such as slightly higher terrain and better drainage—and the radar’s reduced sensitivity to floodwaters beneath dense canopy cover. Overall, the findings underscore the importance of land cover in flood dynamics. Rural and peri-urban land management practices—such as maintaining wetlands, improving field drainage, and investing in stormwater infrastructure—can substantially influence flood outcomes. These insights highlight the need to integrate land use planning into flood mitigation strategies, including the preservation of natural flood buffers and enhancements to drainage systems in vulnerable areas.
4. Discussion
Our study demonstrates an effective Sentinel-1 SAR-based workflow for rapid flood inundation mapping, and the results from Tropical Storm Imelda offer insights comparable to those reported in other SAR flood mapping studies. The achieved classification accuracies (≈95% overall) and kappa (~0.8) indicate a high reliability in distinguishing flooded areas, which is on par with or better than many existing methods documented in the literature. For example, [
16], in a broad assessment of SAR flood mapping techniques, showed that supervised and change detection approaches can reliably detect floods in various scenarios. Our approach, which combines a supervised classifier with change detection on a polarization ratio, aligns well with those proven strategies and avoids the pitfalls of simpler threshold-based methods. In thresholding approaches, choosing an appropriate backscatter cutoff for water is often challenging and site-dependent; errors can arise especially in vegetated or urban areas where water signals mingle with land covers. We specifically addressed this by using a ratio image that normalizes some environmental differences and by using machine learning classification to let the data itself determine the optimal decision boundary between water and land. This strategy is supported by prior works that favored classification or fuzzy logic to handle mixed pixels over straightforward thresholds. Ref. [
29] took a somewhat similar approach by integrating automatic thresholding with a fuzzy logic refinement to map floods in Pakistan. Our method achieves a comparable outcome (high-accuracy flood maps) but with a more streamlined process (direct RF classification on ratio images) and minimal manual intervention.
One noteworthy aspect of our results is the difference between mapping permanent water bodies and mapping ephemeral floodwaters, as reflected in the producer’s and user’s accuracies for each case. We found that before the flood, our classifier tended to miss some of the smaller or vegetation-obscured water features (lower producer’s accuracy for water) but made virtually no false identifications of water (perfect user’s accuracy for water). During the flood, however, the classifier successfully detected a much larger fraction of inundated areas (higher producer’s accuracy for water), while a few dry areas were mistakenly classified as water (moderately reduced user’s accuracy for water). This outcome highlights a common challenge in flood remote sensing: transient floodwaters, especially if shallow or intermingled with vegetation, are harder to detect with the same certainty as permanent open water. Nonetheless, even with this challenge, our method maintained strong performance, indicating that the combination of dual-pol SAR ratio and machine learning classification is robust against the increased complexity of flood scenes. By carefully analyzing both producer’s and user’s accuracy, we can confirm that the methodology is capturing most of the flood inundation without over-mapping water in non-flooded areas. Such analysis provides deeper insight into classifier behavior, affirming that our approach is effectively tuned to detect ephemeral flooding while keeping false alarms low.
One key finding of our study is the strong correlation between rainfall and flood extent (R
2 = 0.87). This quantitative link is a valuable piece of evidence reinforcing the validity of the SAR-derived flood map. If our inundation mapping were missing large flooded areas or falsely identifying floods, the correlation with actual rainfall would likely be weaker. The fact that we see a statistically significant correspondence suggests that our mapped flood extents are physically meaningful. Other studies have also attempted to relate remotely-sensed flood areas to causative factors like rainfall. For instance, ref. [
5] examined an extreme flood event in Bangladesh and highlighted the anomalies in rainfall and runoff that led to unusual flooding. While direct regression values were not reported in that case, our results provide a concrete example of how closely precipitation and flood area can align. It’s worth noting that in flood events where factors like dam breaks or tidal surges contribute, the rainfall–flood area correlation might not be as high—but for Imelda, rainfall was the dominant driver, and our analysis captures that well. This insight underscores the importance of integrating ground rainfall data with satellite flood mapping for comprehensive flood assessments; it helps differentiate whether extensive flooding was purely rain-driven or if other factors played a role.
Our comparative analysis of land cover impacts on flooding resonates with findings from other regions. The observation that agricultural fields and wetlands were heavily flooded is consistent with outcomes in many tropical and subtropical floods (e.g., [
6] in South Asia, where rice paddies and floodplains bore the brunt of flooding). The effect of urbanization we noted—greater flooding in less developed residential areas—also aligns with hydrologic studies that show increased impervious cover leads to faster runoff and can overwhelm local drainage [
30]. What our SAR-based approach adds is a spatially explicit mapping of these effects during an actual event, which could be used to validate or calibrate urban flood models. Moreover, the insight about SAR potentially under-detecting flooded forests (due to canopy backscatter) is in line with [
31], who discussed uncertainties in SAR flood mapping caused by vegetation and speckle. Future studies might address this by incorporating longer-wavelength SAR (e.g., L-band, which can penetrate vegetation better) or integrating optical imagery when available to ensure forested floods are not missed.
An important aspect of this work was the choice of classification method. The Random Forest (RF) classifier was selected due to its robust performance in handling complex datasets. RF makes no assumption of normality in the data, which is particularly useful given that the distribution of the VH/VV ratio for “water” and “land” pixels may not follow a strictly Gaussian pattern. Additionally, RF is less sensitive to outliers and can effectively model intricate relationships in the data through its ensemble-based approach. The classifier demonstrated high accuracy and consistency in flood extent mapping, reinforcing its reliability for this application. Another advantage of RF is its ability to provide internal measures of variable importance, which confirmed that the VH/VV ratio was the dominant predictor for distinguishing between water and land, as expected. The use of RF aligns with the broader trend in remote sensing of leveraging machine learning classifiers—such as RF, Support Vector Machines, and neural networks—for land cover mapping, where they often deliver high precision and adaptability across diverse environmental conditions.
Despite the high performance, there are limitations to acknowledge. The supervised classification requires representative training data, and in an operational rapid response scenario, obtaining such data can be challenging. We mitigated this by using antecedent high-resolution imagery and by demonstrating through sensitivity analysis that minor variations in training samples do not drastically alter results. Still, an inexperienced user or a completely new region might require some effort to gather suitable training labels. One possible improvement for the future could be to leverage crowdsourced flood reports or high-resolution global land cover data as proxy training data. Another limitation is the reliance on dual-polarization SAR; while Sentinel-1 provides VH and VV, in some cases only single polarization data might be available, which could reduce classification efficacy. Furthermore, our method was tested on a specific event in a specific region—generalizing to other flood events (different climates, topographies) would require additional validation. However, because we incorporated robust techniques (like RF classifier and avoidance of hard thresholds) and our results align with fundamental flood behavior and other studies, we are optimistic that the approach would transfer well with appropriate retraining.
Despite these caveats, our method finds a balance of simplicity and accuracy compared to other SAR-based methods. Fully automated thresholding pipelines (e.g., [
13]) are very fast but might need scene-specific tuning; highly sophisticated models (like [
32] two-step change detection with generalized Gaussian mixture modeling) are powerful but computationally intensive. Our method finds a middle ground: it is straightforward (essentially an image ratio, classification, and change detection) and could be executed in near-real time, yet it captures the flood extent with high precision. This makes it attractive for operational use by agencies that may not have the luxury of complex modeling in the midst of a disaster. The use of globally available Sentinel-1 data means the approach is scalable and repeatable anywhere in the world with similar sensors, and the processing steps we used (which can be automated in Google Earth Engine or other platforms) mean that flood maps can be produced within hours of data acquisition.
5. Conclusions
Tropical Storm Imelda caused extensive flooding, and our Sentinel-1 SAR machine learning approach was able to map the inundation with high accuracy (over 94% overall accuracy, κ ≈ 0.77). The methodology’s effectiveness was demonstrated by strong agreement with independent data, most notably the clear correlation between rainfall distribution and flood extent (R2 ≈ 0.87), confirming that areas with the heaviest rainfall experienced the most flooding. By integrating topographic and land cover information, the study identified how low-lying terrain and certain land uses (e.g., agricultural fields and wetlands) exacerbated the flooding, while urbanization patterns influenced flood spread. These findings highlight the value of SAR for rapid disaster response: even under cloud-covered conditions, we produced a reliable flood map within days of the event, providing critical information for emergency management. Our machine learning workflow (VH/VV ratio + Random Forest classification + change detection) required minimal manual tuning and proved robust, as evidenced by consistent results across sensitivity tests. These contributions advance operational flood mapping by offering a scalable, near-real-time solution that can be adapted to other events and regions. The study underscores that with appropriate techniques, freely available SAR data can yield actionable flood intelligence, improving preparedness and response in flood-prone areas.


