Article

Research on Key Sand Generating Parameters and Remote Sensing Traceability of Dust Storms in the Taklamakan Desert

1
Institute of Desert Meteorology, China Meteorological Administration, Urumqi 830002, China
2
College of Geography and Remote Sensing Sciences, Xinjiang University, Urumqi 830046, China
3
National Observation and Research Station of Desert Meteorology, Taklimakan Desert of Xinjiang, Urumqi 830002, China
4
Taklimakan Desert Meteorology Field Experiment Station, China Meteorological Administration, Urumqi 830002, China
5
Xinjiang Key Laboratory of Desert Meteorology and Sandstorm, Urumqi 830002, China
6
School of Geographical Sciences, Shanxi Normal University, Taiyuan 030032, China
*
Author to whom correspondence should be addressed.
Remote Sens. 2025, 17(11), 1870; https://doi.org/10.3390/rs17111870
Submission received: 7 April 2025 / Revised: 16 May 2025 / Accepted: 24 May 2025 / Published: 28 May 2025

Abstract

:
This study investigated the dust storm observation data from the Taklimakan Desert in 2018, focusing on analyzing horizontal dust flux (Q), vertical dust flux (F), their relationships with aerosol optical depth (AOD), and the relationship between HYSPLIT backward trajectories and dust storm dispersion direction. Key findings include: (1) at the Xiaotang (XT) station, Q values at low heights (1–10 m) exceeded those at higher altitudes, highlighting the role of flat terrain in dust accumulation, while Q values at the Tazhong (TZ) station remained relatively stable, suggesting dust redistribution influenced by undulating topography; (2) vertical dust flux (F) decreased with height, with significant seasonal variations in spring linked to frequent dust events; (3) at station XT, the contribution of F at 5 m height is relatively strong to AOD and its peak precedes AOD by 24–72 h, although the direct correlation is weak; and (4) dust dispersion directions aligned with HYSPLIT trajectories and high Q values corresponded with remotely derived dust dispersion patterns.

Graphical Abstract

1. Introduction

Sandstorm refers to the phenomenon where strong winds blow up dust and sand particles on the ground, causing horizontal visibility to be lower than 1 km [1]. The Sixth Assessment Report by the Intergovernmental Panel on Climate Change (IPCC), published in 2021, highlighted an increase in the frequency and intensity of sandstorms in several regions over recent decades, which have negatively impacted both the environment and public health [2,3]. This rise in sandstorm events is attributed to the growing occurrence of extreme weather, a consequence of global warming [4,5].
There are various methods and approaches for monitoring the parameters of sandstorms, including ground-based observation stations, meteorological stations, and satellite remote sensing [6,7,8]. However, the integration and analysis of multi-source data for monitoring remain a challenge due to the valuable and limited nature of data resources. To analyze the changes in dust flux, it is essential to understand the formation of sandstorms. Ref. [9] investigated the causes, source areas, and distribution characteristics of sandstorms in the Taklamakan Desert. They also examined the occurrence patterns and harmful mechanisms of sandstorms, and provided valuable suggestions for future research. In addition to the sandstorms in northern China, the Northwestern region, particularly Xinjiang, is also a high-frequency sandstorm area, largely due to its unique geographical and climatic conditions. The main types of sandstorms in this region are floating dust and sandstorms, with the occurrence of extremely intense sandstorms being rare. Furthermore, the frequency of sandstorms has decreased annually from 1954 to 2007, with the events primarily concentrated in the spring months (March to May), peaking in April [10]. Therefore, sand and dust sources are very important for the formation of sandstorms. In the Gobi region, due to flat terrain, high altitude, and the convergence of high-altitude jet streams, wind conditions are suitable for the vertical lifting and long-distance transportation of sand and dust, making it the main contribution area of East Asian sand and dust. The long-distance transportation of adjacent sand and dust in spring and summer accounts for 35% and 31% of the total amount of sand, respectively [11]. In contrast, although the Taklamakan Desert experiences a high dust mobilization flux during the spring (70.54 Tg·a−1, accounting for 42% of East Asia’s total), its location in a basin with low near-surface wind speeds makes it unfavorable for long-distance dust transport [11]. Thus, it is evident that the relationship between wind and dust is inseparable. According to [12], a coupling model between wind flow and sand particles was proposed to simulate the movement characteristics of wind-blown sand on slopes [6]. The study found that the influence of sand particles on wind flow is particularly significant, especially on the leeward slope. In addition, ref. [13] conducted wind tunnel experiments to study the efficiency of dust collectors at different heights and developed a collector design combining linear flow and wedge shape, achieving a collection efficiency of approximately 80%. Currently, most sandstorm parameterization schemes analyze the effects of various factors on dust transport, including wind speed, dust particle size, surface roughness, soil moisture, and vegetation cover [14,15,16,17,18]. Among these factors, wind speed is the primary driving force for the initiation of dust mobilization and its relationship with dust flux (including both horizontal and vertical flux) or concentration is typically expressed as a power-law function with exponents ranging from 2 to 5 [19,20,21,22,23,24,25]. Additionally, the particle size of the surface soil significantly influences the dust mobilization process. Bagnold (1941) classified the movement of sand particles into three types: creep, saltation, and suspension [19]. Variations in particle size directly affect the threshold for dust mobilization. When the particle size exceeds 60–70 microns, the dust mobilization threshold increases with the particle size, primarily due to the influence of the soil particles’ self-weight [14,15,19,26]. Conversely, when the particle size is smaller than 60–70 microns, the cohesive forces between soil particles cause the dust mobilization threshold to significantly increase as the particle size decreases [27]. In the typical transmission path of East Asian dust, Huang J et al. (2014) pointed out that East Asian dust aerosols have a stronger ability to absorb solar radiation and have a significant impact on clouds and precipitation [28]. The transmission of sandstorms does not remain in the horizontal direction, but also undergoes transmission changes in the vertical direction. Therefore, Huang Z et al. (2010) developed a lidar algorithm for extracting aerosol optical properties and obtained the aerosol vertical structure that affected sandstorms in northwest China in 2008 [29]. They found that Siberian cold air masses and Mongolian cyclones play an important role in the formation of sandstorms. It is noteworthy that Lakshmi et al. (2017) studied the vertical structure of aerosols over the Bay of Bengal and observed a significant increase in dust extinction during the pre-monsoon period [30]. They pointed out that the heating effect induced by dust could potentially influence the dynamics of the Indian monsoon. Additionally, Kang et al. (2020) investigated the vertical distribution of dust flux and found that the dust flux in the near-surface layer (2–80 m) follows a piecewise function with height [31]. They also noted that both dust flux and wind speed peak during the spring season. Meanwhile, Offer and Goossens (2004) conducted long-term observations from 1988 to 2000 and found that dust concentration, particle size, and vertical flux were all higher in the spring, with the lowest values observed in the autumn [32]. They also noted that the annual average vertical flux followed a parallel trend with wind speed and that precipitation was negatively correlated with dust flux.
By comprehensively considering these factors, the occurrence and intensity of sandstorms can be more accurately understood and predicted. By observing and calculating the horizontal dust flux (Q) and vertical dust flux (F), we can gain a deeper understanding of the spatiotemporal characteristics and movement paths of dust storms. These observations not only help identify the source of dust storms, but also provide data support for predicting their occurrence. By combining remote sensing technology and using indicators such as aerosol optical depth (AOD), the concentration and diffusion characteristics of dust in the atmosphere can be further analyzed, thereby enhancing the monitoring capability of dust storms.
Remote sensing data are widely used for monitoring sandstorms and aerosols. For example, remote sensing technology is not only used to identify the sources and affected areas of dust storms, but also helps analyze the dynamic changes of dust storms worldwide [33,34]. In addition, studies have explored the effectiveness of remote sensing algorithms in visible light band for dust monitoring, demonstrating the practicality of remote sensing technology in this field [35,36]. In the study by Si et al. (2022), images captured outdoors during sand and dust conditions often experience low contrast and color distortion, which significantly disrupt the performance of intelligent information processing systems [37]. To address these challenges, this paper proposes a new enhancement algorithm based on a fusion strategy. The algorithm consists of two sequential components: sand removal through an enhanced Gaussian model-based color correction method and dust elimination via a residual-based convolutional neural network (CNN). Meng et al. (2024) applied a geographic detector model to provide new insights into the relationship between sandstorms and land cover changes, aiding in the assessment of regional ecological impacts [38]. Gui et al. (2022) analyzed the “3.15” and “3.27” sandstorm events of 2021, highlighting that the observed downward trend in event frequency was disrupted [39]. They also found that the peak aerosol optical depth during the “3.27” event increased due to the short-term intrusion of coarse particles. Multiple studies have used remote sensing technology to monitor sandstorms. Xie et al. (2017) used color imaging technology to monitor sandstorms [40], while Kaskaoutis et al. (2012) combined satellite data (such as Aqua MODIS and CALIPSO) to determine the source areas and transport trajectories of sandstorms, demonstrating the importance and effectiveness of remote sensing technology in this field [41]. In addition, a study has evaluated the impact of sandstorms by comparing ground-level PM10 concentrations with normal levels [42], while a study used satellite data and back-trajectory analysis to identify the sources and transport pathways of coarse particulate aerosols, demonstrating the complementary nature of ground-based and remote sensing monitoring [43]. In the analysis of sandstorm events, researchers have combined meteorological models with remote sensing data to obtain more comprehensive information. Sowden et al. (2018) explored how near-real-time GEO satellite data can improve the estimation of ground-level PM concentrations [44]. Kaskaoutis et al. (2012) combined model outputs (e.g., DREAM) with satellite observations to delineate sandstorm source regions [41]. This data fusion approach helps enhance both the accuracy and timeliness of sandstorm monitoring. The use of the Normalized Difference Dust Index (NDDI) for sandstorm monitoring, which integrates multispectral remote sensing data, particularly MODIS data, has proven effective in identifying and monitoring sandstorm events [45]. The successful application of this technique highlights the high efficacy of remote sensing in environmental monitoring [46,47]. Through statistical analysis of historical dust storm events, researchers can identify the frequency and trend of dust storm occurrence, and use ground monitoring data from 1994 to 2013 for in-depth analysis to reveal the changing characteristics of dust storm activity under different climatic conditions [47,48]. This data-driven research provides a theoretical basis for future dust storm prediction [49,50]. Chen et al. (2023) analyzed the dust events in Beijing in 2017 using data from LIDAR and found significant differences in the vertical distribution of different types of dust events [51]. Wind direction and temperature play a key role in the distribution and concentration of dust events. These studies indicate that climate change has a significant impact on the frequency and driving factors of sandstorms. Remote sensing satellites not only improve the efficiency of dust storm monitoring, but also provide data support for analyzing the vertical changes and meteorological parameters of dust storms, making the understanding of dust storm dynamics under the influence of climate change and human activities deeper [52].
In summary, recent studies have made significant contributions to the field of sandstorm research [53]. However, there remains room for further exploration, particularly in the integration of observational data from sandstorm source regions with remote sensing analysis, as well as the quantification of parameters such as Q and F [54]. Therefore, based on previous work, this study uses observation data and satellite remote sensing data, taking Xiaotang Station on the northern edge of the Taklamakan Desert and Tazhong Station in the desert hinterland as examples, focusing on the vertical variation law and quantitative analysis of related parameters of sandstorms in 2018, aiming to deepen the understanding of the formation and development process of sandstorms, explore their impact on the atmospheric environment [55], and provide scientific basis for future monitoring and prediction [56]. The structure of this paper is as follows: Section 1 reviews the relevant literature, providing an overview of the main advancements and contributions in the field. Section 2 presents a detailed description of the research methodology, including the data collection and processing procedures, as well as the analytical tools employed. Section 3 showcases the experimental results, focusing on the analysis of dust flux variations at different altitudes and their relationship with remote sensing imagery. It also explores the dynamic characteristics and formation mechanisms of sandstorms through a comparative analysis of data from different time periods. Finally, Section 4 summarizes the key findings of the study, and Section 5 discusses their theoretical and practical implications and proposes potential directions for future research.

2. Materials and Methods
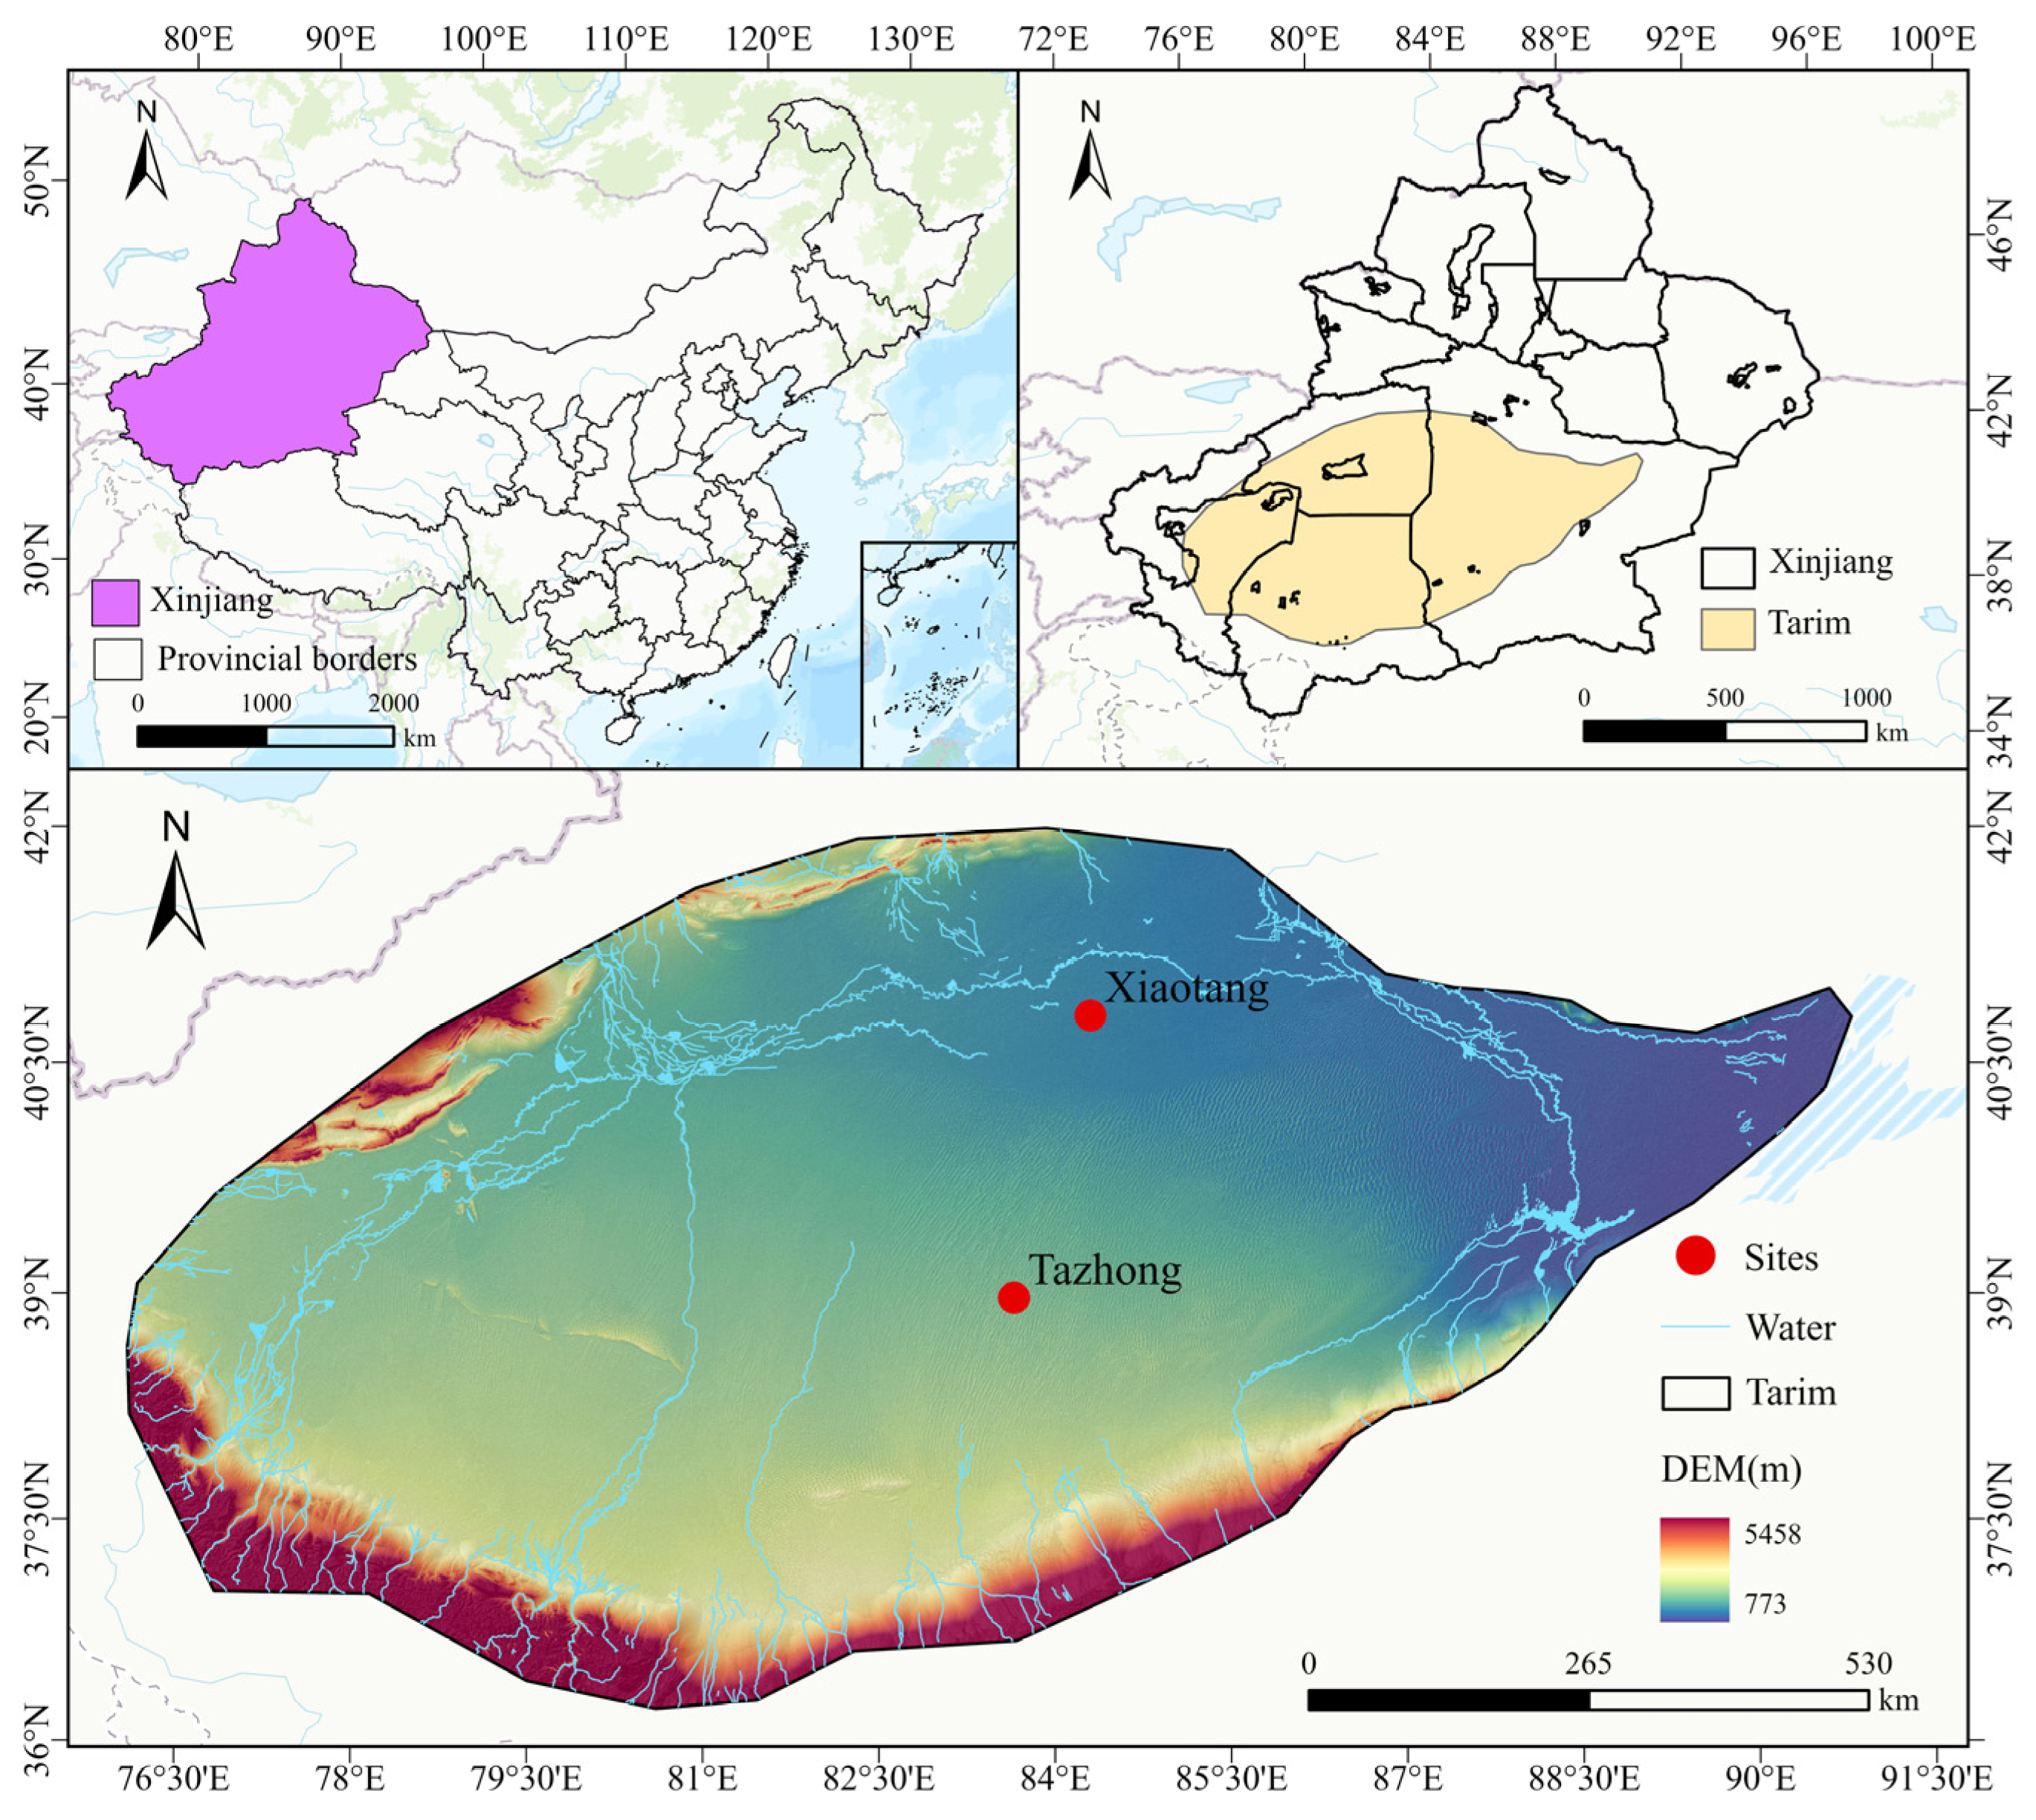
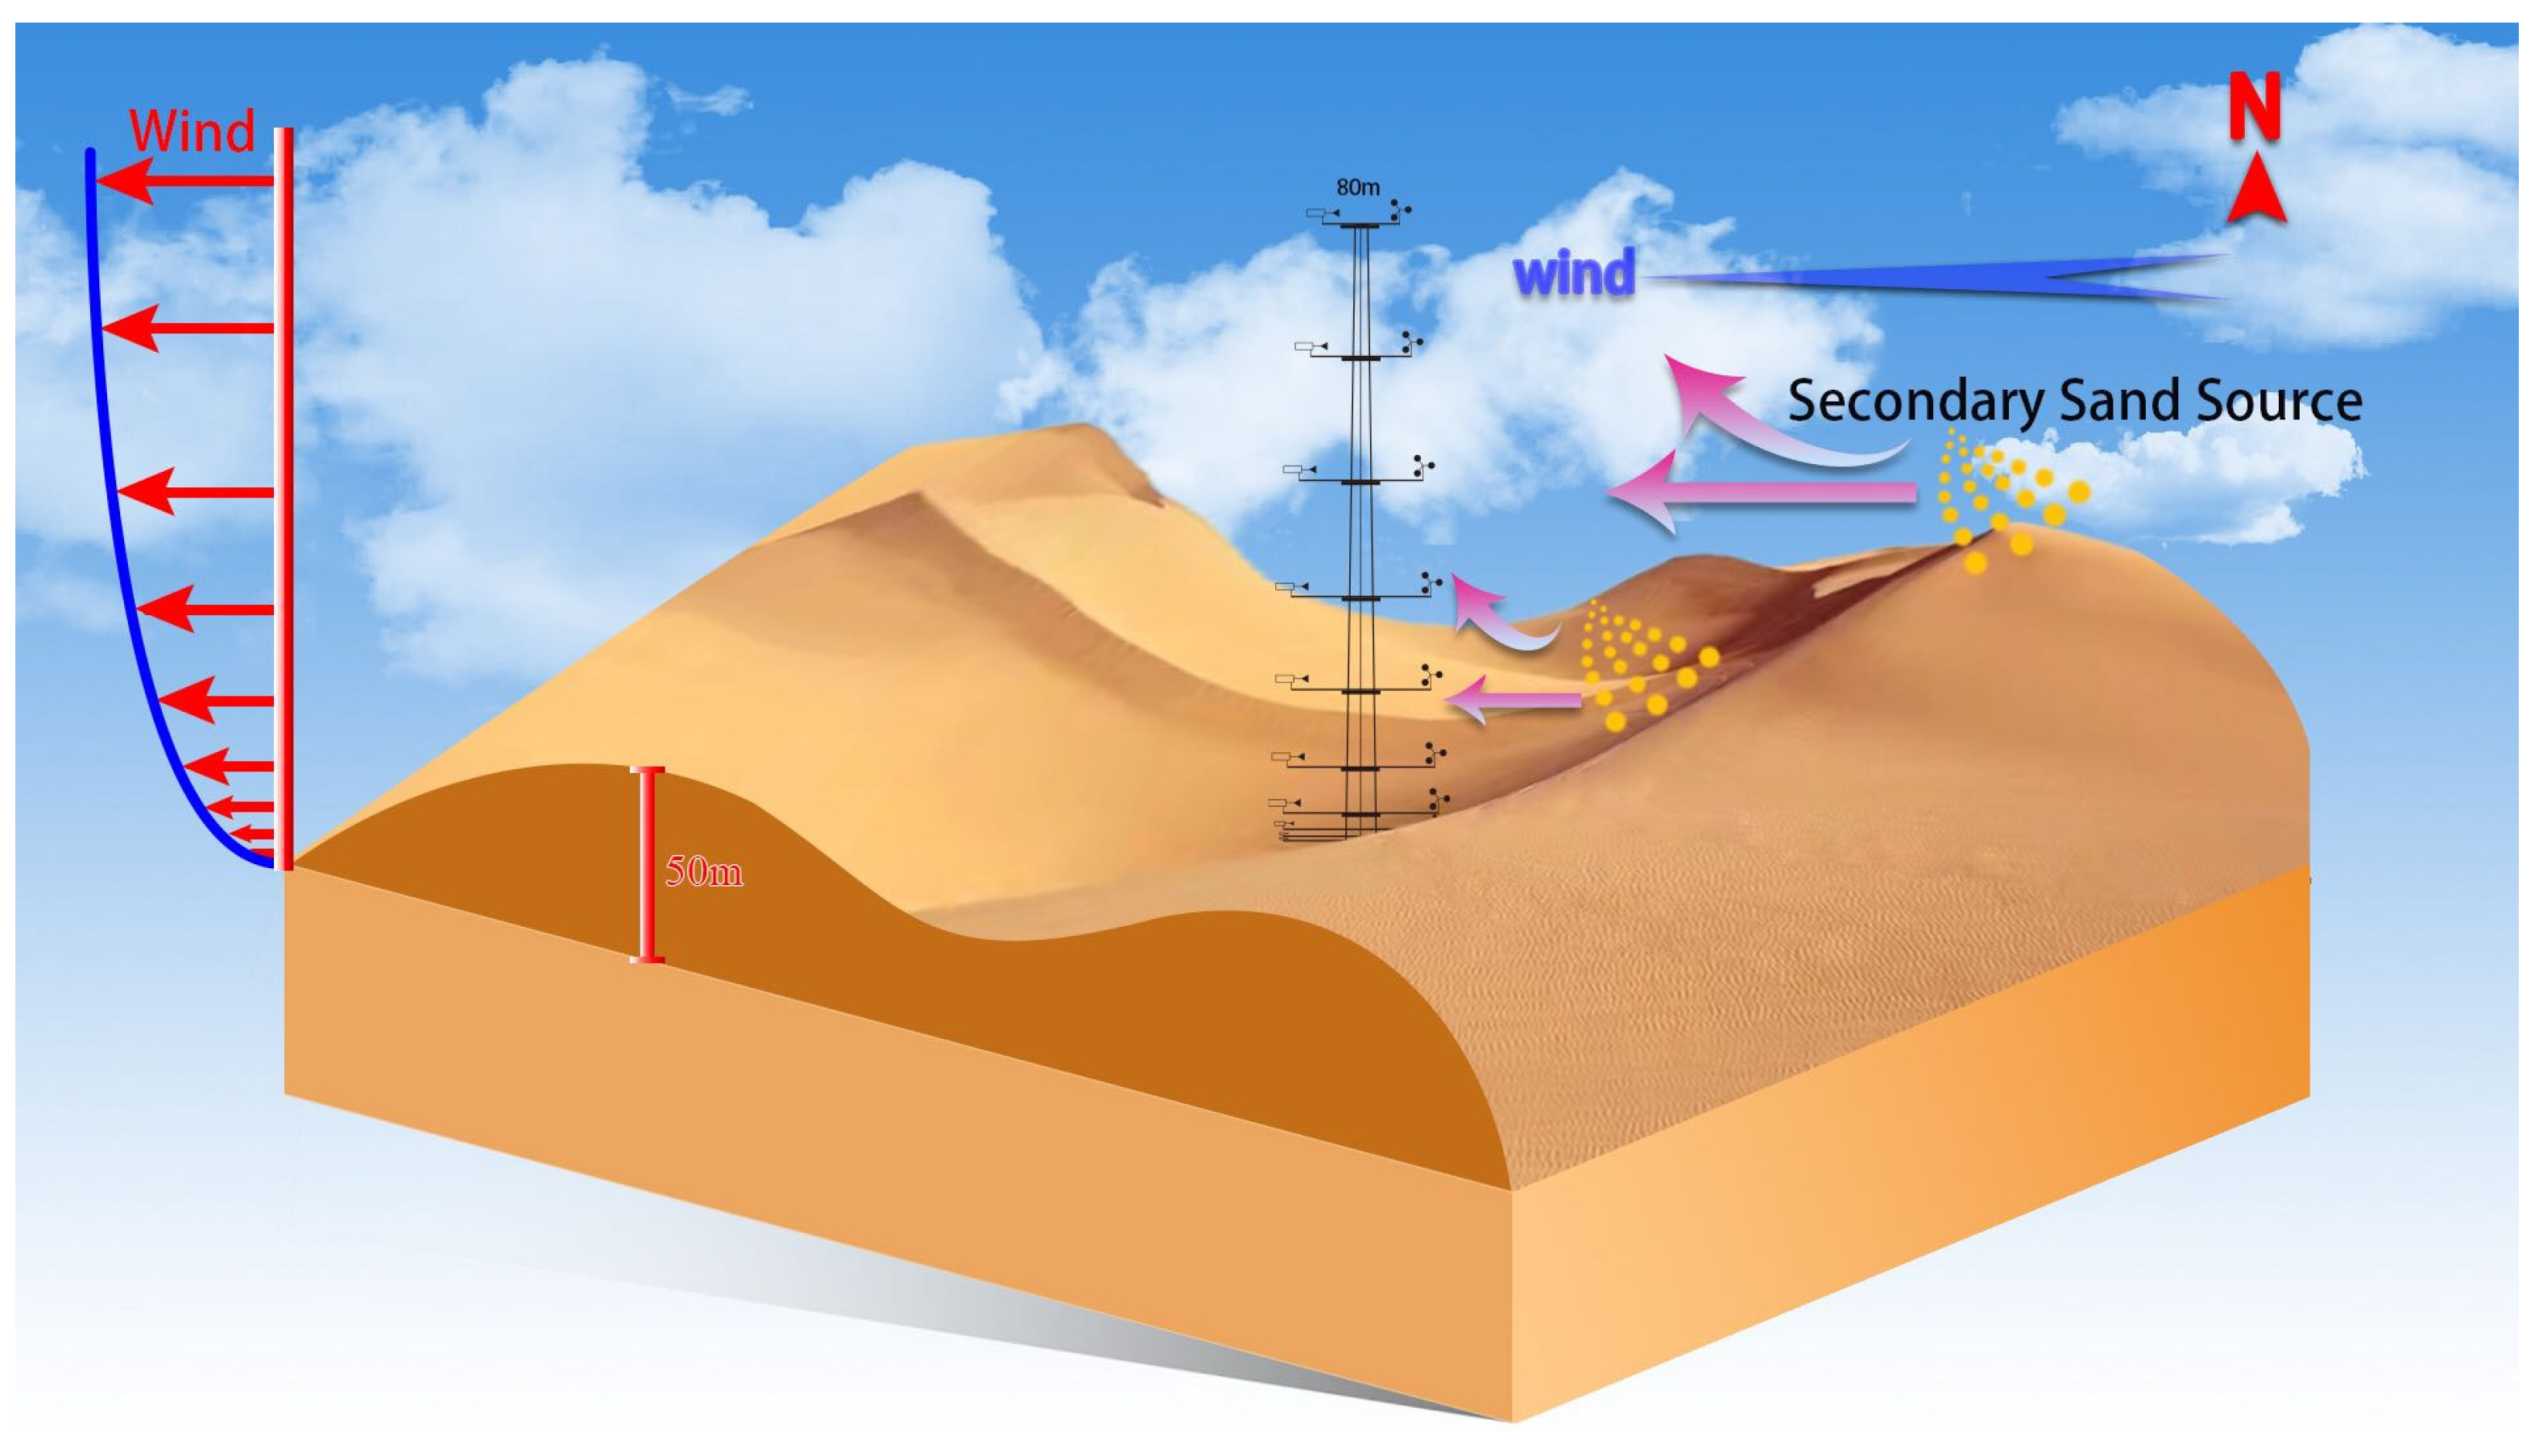
2.1. Study Area

The Taklamakan Desert is the largest desert in China, covering an area of 350,000 square kilometers [57]. To the west, it borders the Pamir Plateau; to the south, it is adjacent to the Kunlun Mountains; to the east, it connects with the Lop Nur basin; and to the north, it is surrounded by the Tianshan Mountains [58]. The Taklamakan Desert is one of the regions in China most prone to dust storms, which pose significant environmental hazards, severely impacting the surrounding areas [59]. Except for the northern area of Luntai and the northeastern region of Tiekenglik, the average annual number of sand and dust storms in the desert typically exceeds 10 days, with a maximum of up to 46.9 days. Excluding the northern Luntai area, the average annual number of dust-suspended weather events across the entire desert region also exceeds 30 days, with a peak of up to 86.4 days [60]. To better explore the dynamic characteristics and propagation patterns of sand and dust storms, this study selected two key monitoring stations in the Taklamakan Desert for analysis: the Tazhong Station (TZ) located at the center of the desert and the Xiaotang Station (XT) situated at its northern edge. Tazhong Station is located in the central part of the Taklamakan Desert (see Figure 1), at an elevation of 1099.3 m. It covers the Tazhong meteorological station and Tazhong Well No. 1 (83°39′E, 38°58′N) along with the surrounding area [17]. The station is surrounded on both the east and west sides by large and complex longitudinal sand ridges, with relative heights ranging from 40 to 50 m. The leading edge of the sand ridges is characterized by a chain of low, crescent-shaped dunes [61]. Xiaotang Station is located at coordinates 40°48′N, 84°18′E, with an elevation of 912 m. It is situated near Xiaotang Well No. 1, which is approximately 1000 m away, along a road that extends deep into the desert. The region is situated on the southern bank of an ancient riverbed, approximately 2 km north of the Populus euphratica forest, at the interface between the desert and semi-desert zones. It represents a typical transitional zone between the heart of the desert, the arid steppe, and the oasis. The area is located about 40 km from the Tarim River [62]. The surface is predominantly flat and consists of sandy terrain [63], as shown in Figure 1.

2.2. Observational Data

2.2.1. Methods for Acquiring and Analyzing Horizontal Dust Flux (Q)

The horizontal transport flux Q of sand and dust in the observation data used in this study was provided by the National Field Scientific Observation and Research Station of Taklamakan Desert Meteorology in Xinjiang. At the Taklamakan Desert Tower Station (TZ) and Xiaotang Station (XT), the internationally recognized standard BSNE sand collector was used to observe the horizontal transport flux of sand and dust (Table 1). It is important to note that the BSNE sand collectors primarily measure coarse particles. This study does not directly measure the concentration of fine particulate matter (PM2.5), which is typically not captured by the BSNE collector.
This study systematically analyzed the collected horizontal sand and dust flux data. The data are divided into 16 groups, each representing the measurement values of XT and TZ for different months and dates.
(1) Data Preparation:
Collected relevant data on dust flux (weight) and height from different measurement conditions. These data contain 10 measurement points at different heights (Table 1) and the purpose of analyzing these points is to reveal the variation pattern of horizontal sand and dust flux at different heights.
(2) Data Visualization:
In order to visually demonstrate the relationship between dust flux and height, a line chart was drawn using Origin 2025 software. Each line represents a measurement group and is distinguished by different markings and colors. In the figure, the horizontal axis represents the sand and dust flux (kg/m2), and the vertical axis represents the height (m). The presentation of data can clearly show the trend of dust flux variation with height. In the chart, the plotting of each group of data is consistent and corresponding legends are added to facilitate the identification of the performance of different groups. The limit of the coordinate axis is set in the figure to ensure that all data points can be presented clearly. The data processing process follows the best practices of data visualization to enhance the readability and scientificity of the results.

2.2.2. Methods for Acquiring and Analyzing Vertical Dust Flux (F)

In this study, the vertical sand dust transport flux (F) is calculated using meteorological data and sand dust transport observation data provided by the Meteorological Field Science Experiment Base of the China Meteorological Administration in the Taklamakan Desert. Based on the gradient method, it is assumed that the sand dust concentration follows a logarithmic distribution in the near-surface layer and the wind speed profile adheres to the classic logarithmic distribution law. Additionally, it is assumed that the atmosphere is in a neutral stability state, which is common under desert storm weather conditions [64]. The specific calculation formula [63,64] is as follows:
F = k u ( c 1 c 2 ) ln z 2 z 1
where:
F is the vertical dust flux (kg/m2/s), z 1 and z 2 are the measurement heights (m), u is the friction velocity (cm/s), c 1 and c 2 are the dust concentrations at two different heights (kg/m3), and k is a coefficient (0.4). The dust concentration c can be obtained through conversion of the dust transport data measured by a sand collector. The friction velocity and logarithmic wind profile are applicable under neutral stability conditions, which is a typical assumption in desert environments during dust storms (Yang, 2019) [64]. The dust concentration c at each height was derived by converting the dust transport data collected by BSNE samplers using the following equation:
c = M u t A
where:
c is the dust concentration at the measurement height (kg/m3/s), M is the mass of dust collected at the measurement height by the BSNE sampler (kg), u is the average wind speed during the sampling period (m/s), t is the sampling duration (s), and A is the inlet area of the BSNE sand collector (m2).

2.3. Remote Sensing Monitoring Data

Introduction to Remote Sensing Satellite Data Background

Dust particles are rich in minerals and influence the Earth’s radiation budget and energy balance by absorbing and scattering radiation [65]. The spectral characteristics of dust particles are affected by their size, providing a basis for dust storm monitoring. Studies indicate that dust particles range in size from 0.01 to 100 μm, with particles having radii greater than 5 μm comprising a significant proportion during dust storm events (Table 2) [66]. Larger particle radii tend to concentrate scattered energy in the forward direction and the ratio of absorption to extinction and scattering also changes accordingly [67].
Remote sensing satellite data are of great significance in the study of sandstorms [68], as they can provide extensive and timely monitoring capabilities, helping to quickly obtain spatial distribution and intensity information of sandstorms, and thus issuing timely warnings [69]. Remote sensing data can also deeply analyze the relationship between the causes of sandstorms and meteorological, land use, and other factors [70]. Therefore, they can help us understand their formation, development, and dissemination processes, and provide information on the spatial distribution and temporal evolution of sandstorms, providing comprehensive data support for related research.
This study utilizes the China 1 km resolution seamless daily aerosol optical depth (AOD) dataset for 2018, a pioneering long-term, high-resolution atmospheric parameter product developed through advanced multi-source data fusion techniques (Table 3). The dataset integrates three principal components: (1) Himawari-8 geostationary satellite retrievals (500 nm, 5 km raw resolution) processed with the Second Minimum Reflectance algorithm and quality-controlled via QA flags; (2) MERRA-2 reanalysis data (550 nm) spectrally converted using Angstrom exponent parameterization; and (3) ground-based measurements from AERONET/SONET aerosol networks and national air quality monitoring stations. Through the implementation of Singular Value Decomposition (SVD) for spatiotemporal reconstruction, Optimal Interpolation (OI) for multi-scale data assimilation, and Random Forest (RF) machine learning modeling, the final product achieves daily temporal continuity at 1 km spatial resolution (71–139°E, 15–56°N). Independent validation demonstrates exceptional agreement with ground observations (R = 0.90, RMSE = 0.21), effectively addressing common retrieval challenges over bright surfaces through multi-sensor synergy. It should be noted that, while multi-source data assimilation techniques have significantly improved AOD accuracy over typical bright surfaces (e.g., deserts), residual technical challenges persist in surface reflectance correction for optical sensors over high-reflectance terrains. These limitations, as systematically validated in [71], remain within the error tolerance thresholds of existing peer-reviewed AOD products. This dataset, accessible via the National Earth System Science Data Center (https://www.geodata.cn), provides critical support for investigating atmospheric haze dynamics, aerosol radiative effects, and exposure risk assessments across China’s heterogeneous landscapes.

2.4. Introduction to the Backward Trajectory Tracing Method

Backward trajectory analysis is a commonly used method for tracing the sources of atmospheric particles or gases and is widely applied in environmental science and meteorological research. By utilizing historical meteorological data and numerical simulation techniques, backward trajectories can reconstruct the transport pathways of atmospheric particles or gases to identify their potential source regions. This method typically relies on advanced atmospheric models and computational tools, such as the Hybrid Single-Particle Lagrangian Integrated Trajectory (HYSPLIT) model, which is developed and maintained by the National Oceanic and Atmospheric Administration (NOAA) (https://www.ready.noaa.gov/HYSPLIT.php, accessed on 10 September 2024). In this study, we employed the HYSPLIT model to generate backward trajectories to verify and analyze the general dispersion directions observed in the aerosol optical depth (AOD) images. The model parameters are critical for a clear understanding of the trajectory analysis. For the analysis over the Taklamakan Desert region, the following settings were used: trajectories were initialized at three different heights above ground level, namely 1 m, 10 m, and 100 m; backward trajectories corresponded to the observed dust storm events; the duration was set to 24 h, allowing us to trace the particle pathways 1 day prior to the events; the starting point was set at [39.430000°N, 83.670000°E], located in the Taklamakan Desert. The resulting backward trajectories are shown in the figure. This analysis illustrates the estimated pathways of particles during the 24 h preceding the dust events and helps to confirm the general dispersion directions observed in the AOD images.

3. Results

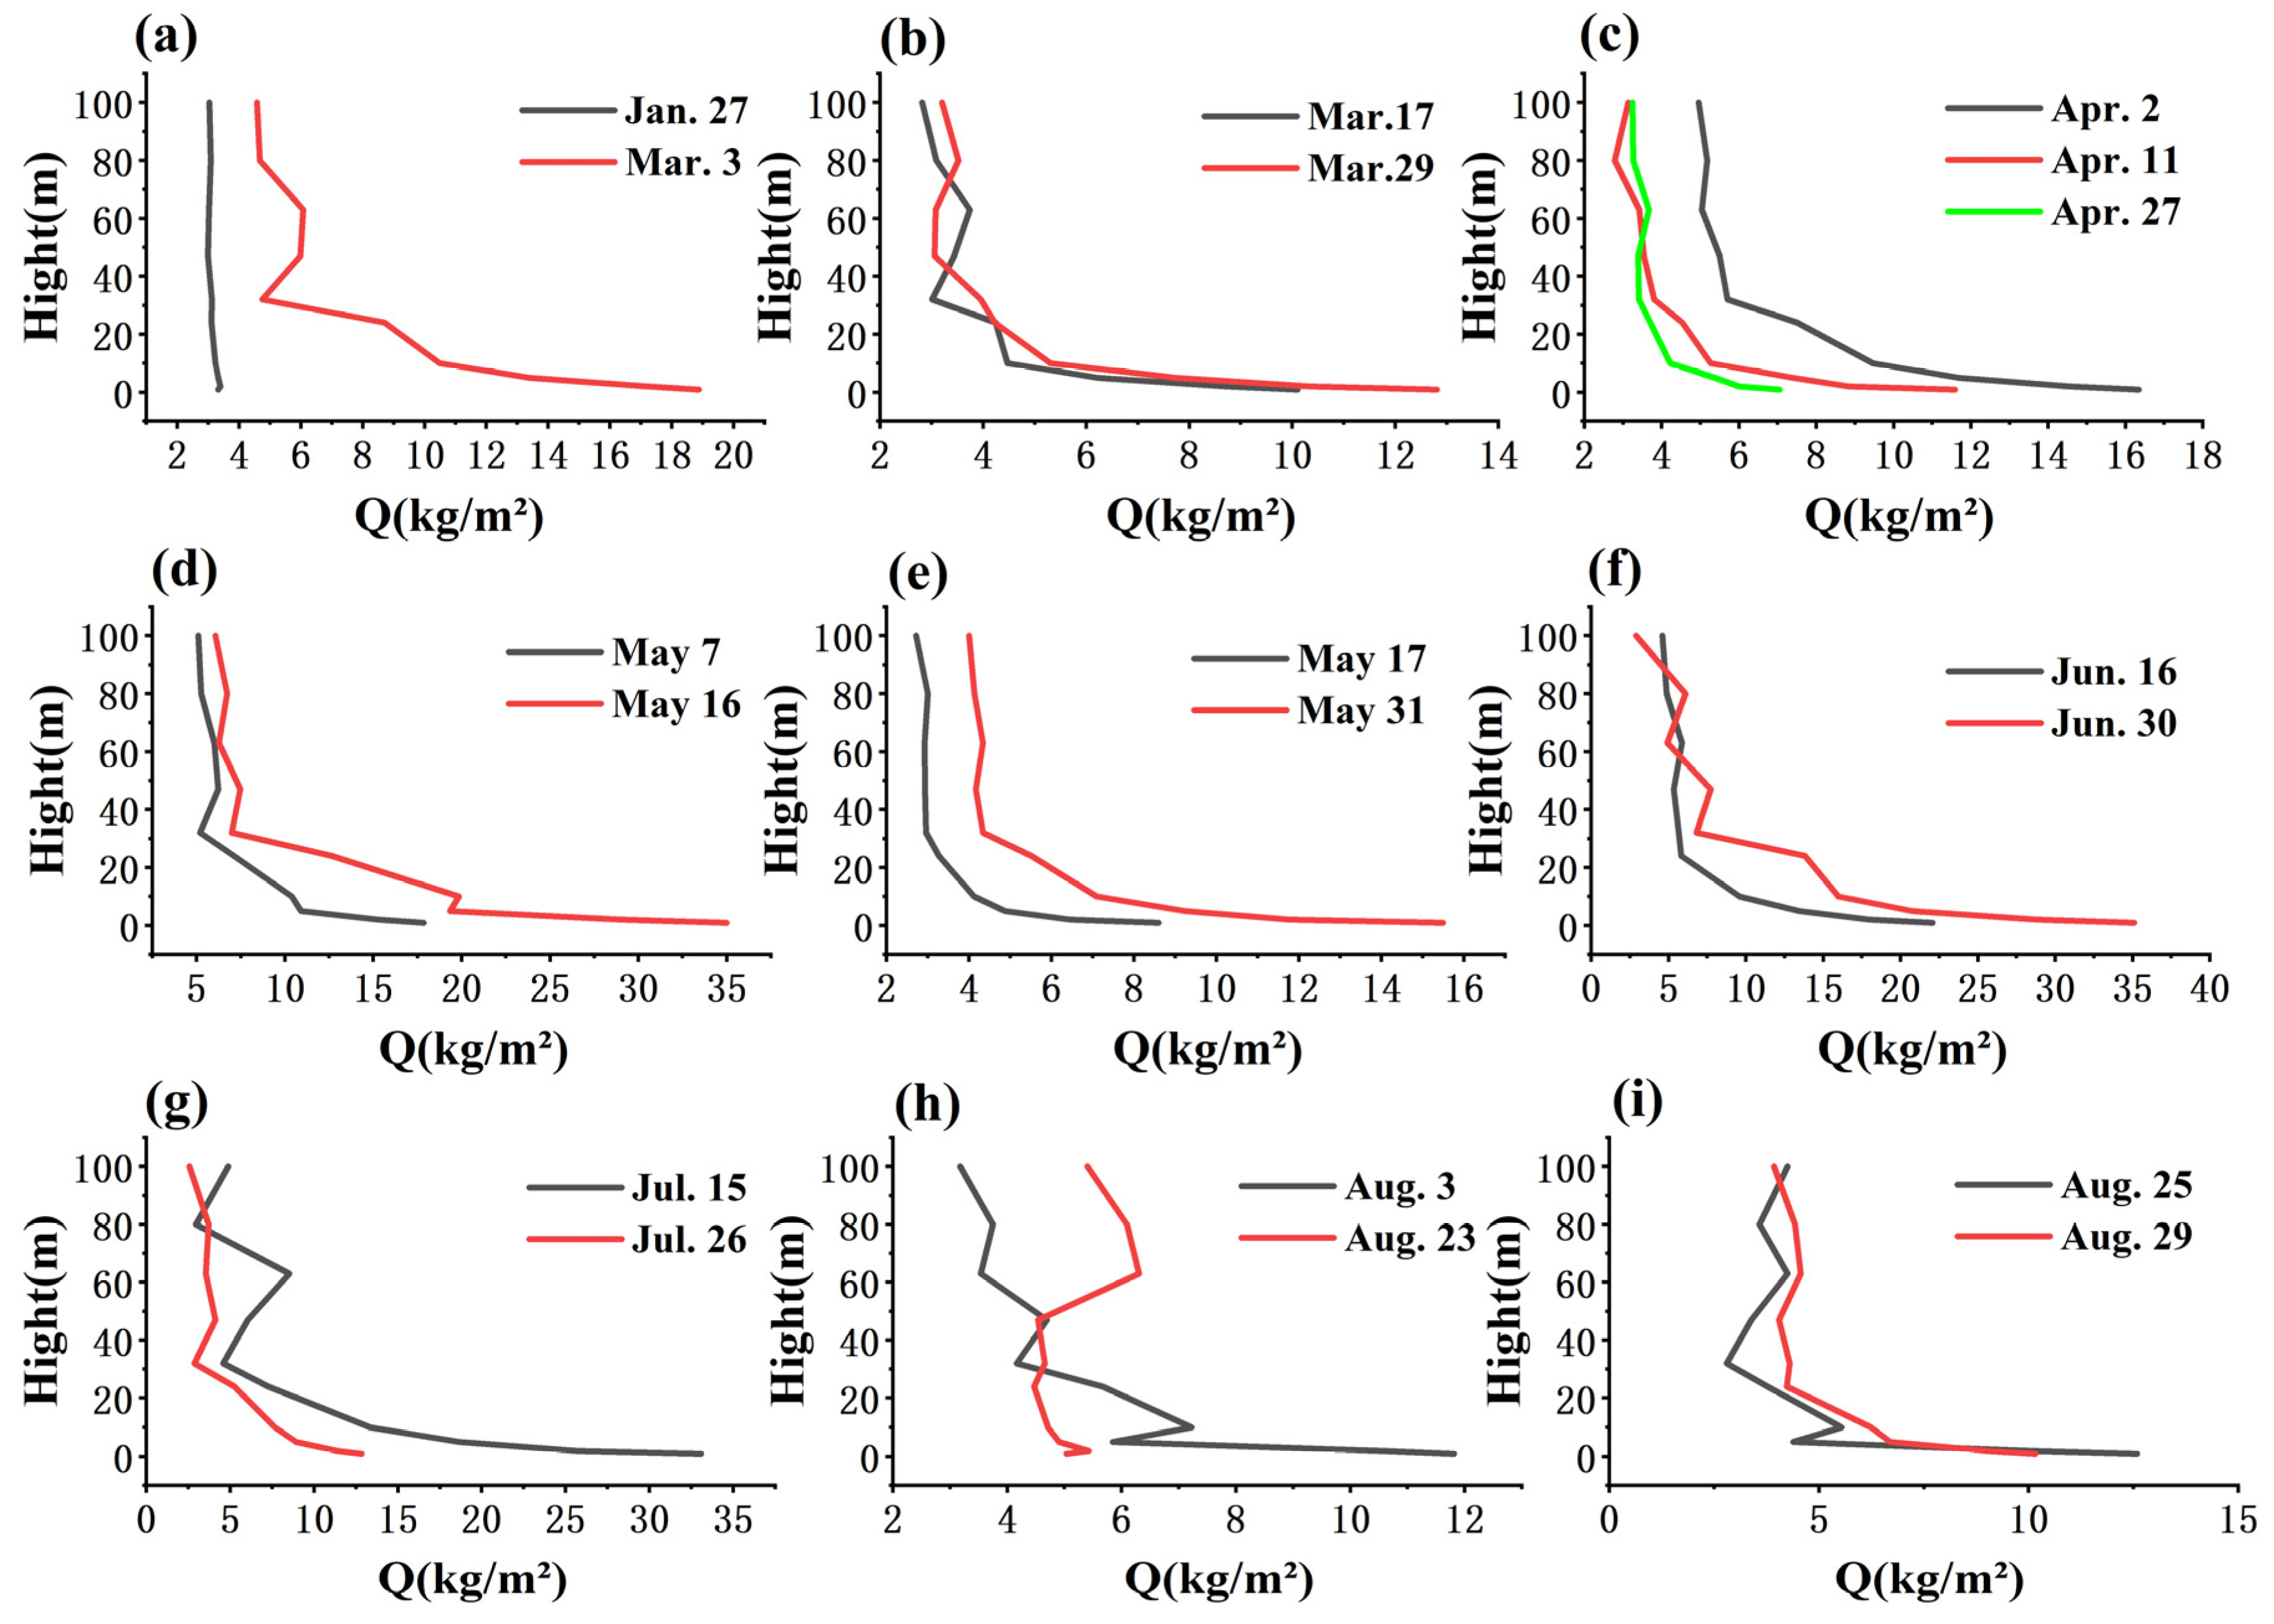
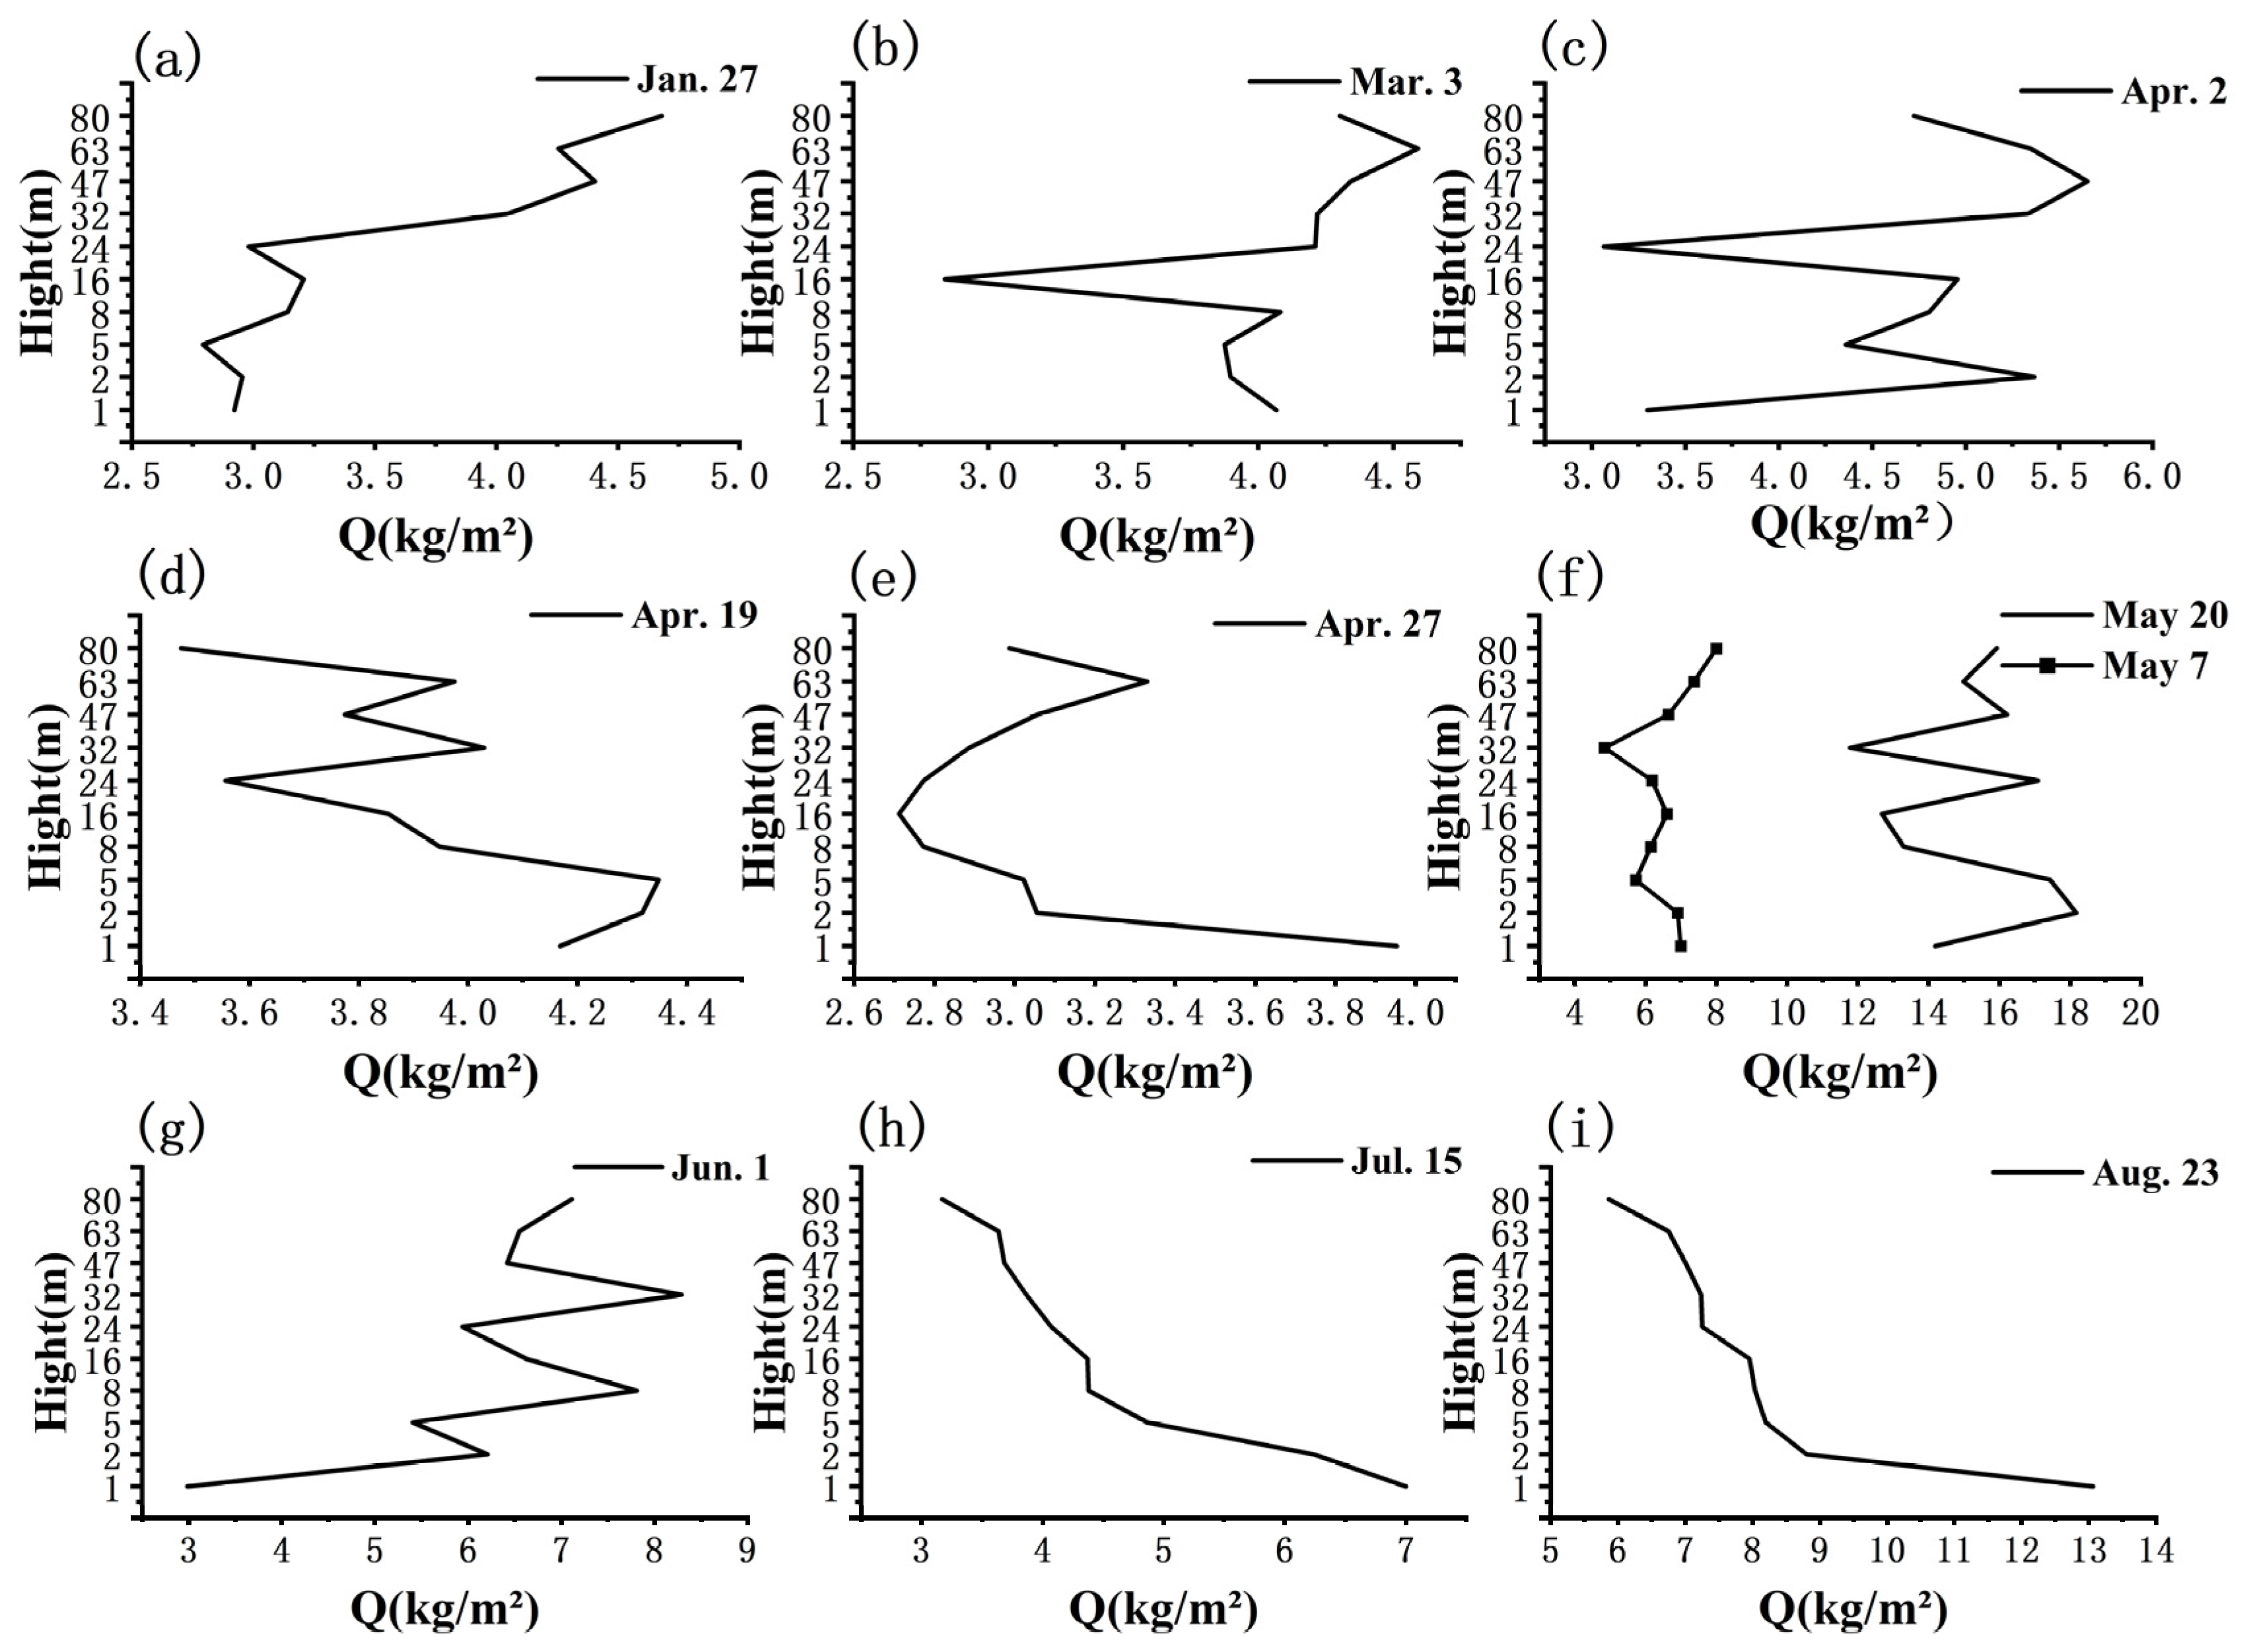
3.1. Variation Trend of Q at Different Heights

By analyzing the horizontal dust flux at XT and TZ stations during different dust storm events, it can be observed that the XT station generally exhibits a sharp decrease in dust flux with height, with the highest values concentrated within the near-surface layer (1 to 10 m). Specifically, during events in January, March, and April, the flux at 1 m was predominantly around 15–18 kg/m2. This still reflects the significant near-surface dust transport facilitated by the flat terrain at XT. In contrast, the TZ station shows a more uniform vertical distribution of dust flux, with values typically ranging from 3 to 8 kg/m2 throughout the profile. Occasional peaks appear near 32 or 47 m, but the overall magnitude remains lower than at XT, suggesting that the complex terrain at TZ disperses dust more evenly and reduces near-surface accumulation, especially in April and July where a decrease is evident (Figure 2 and Figure 3).

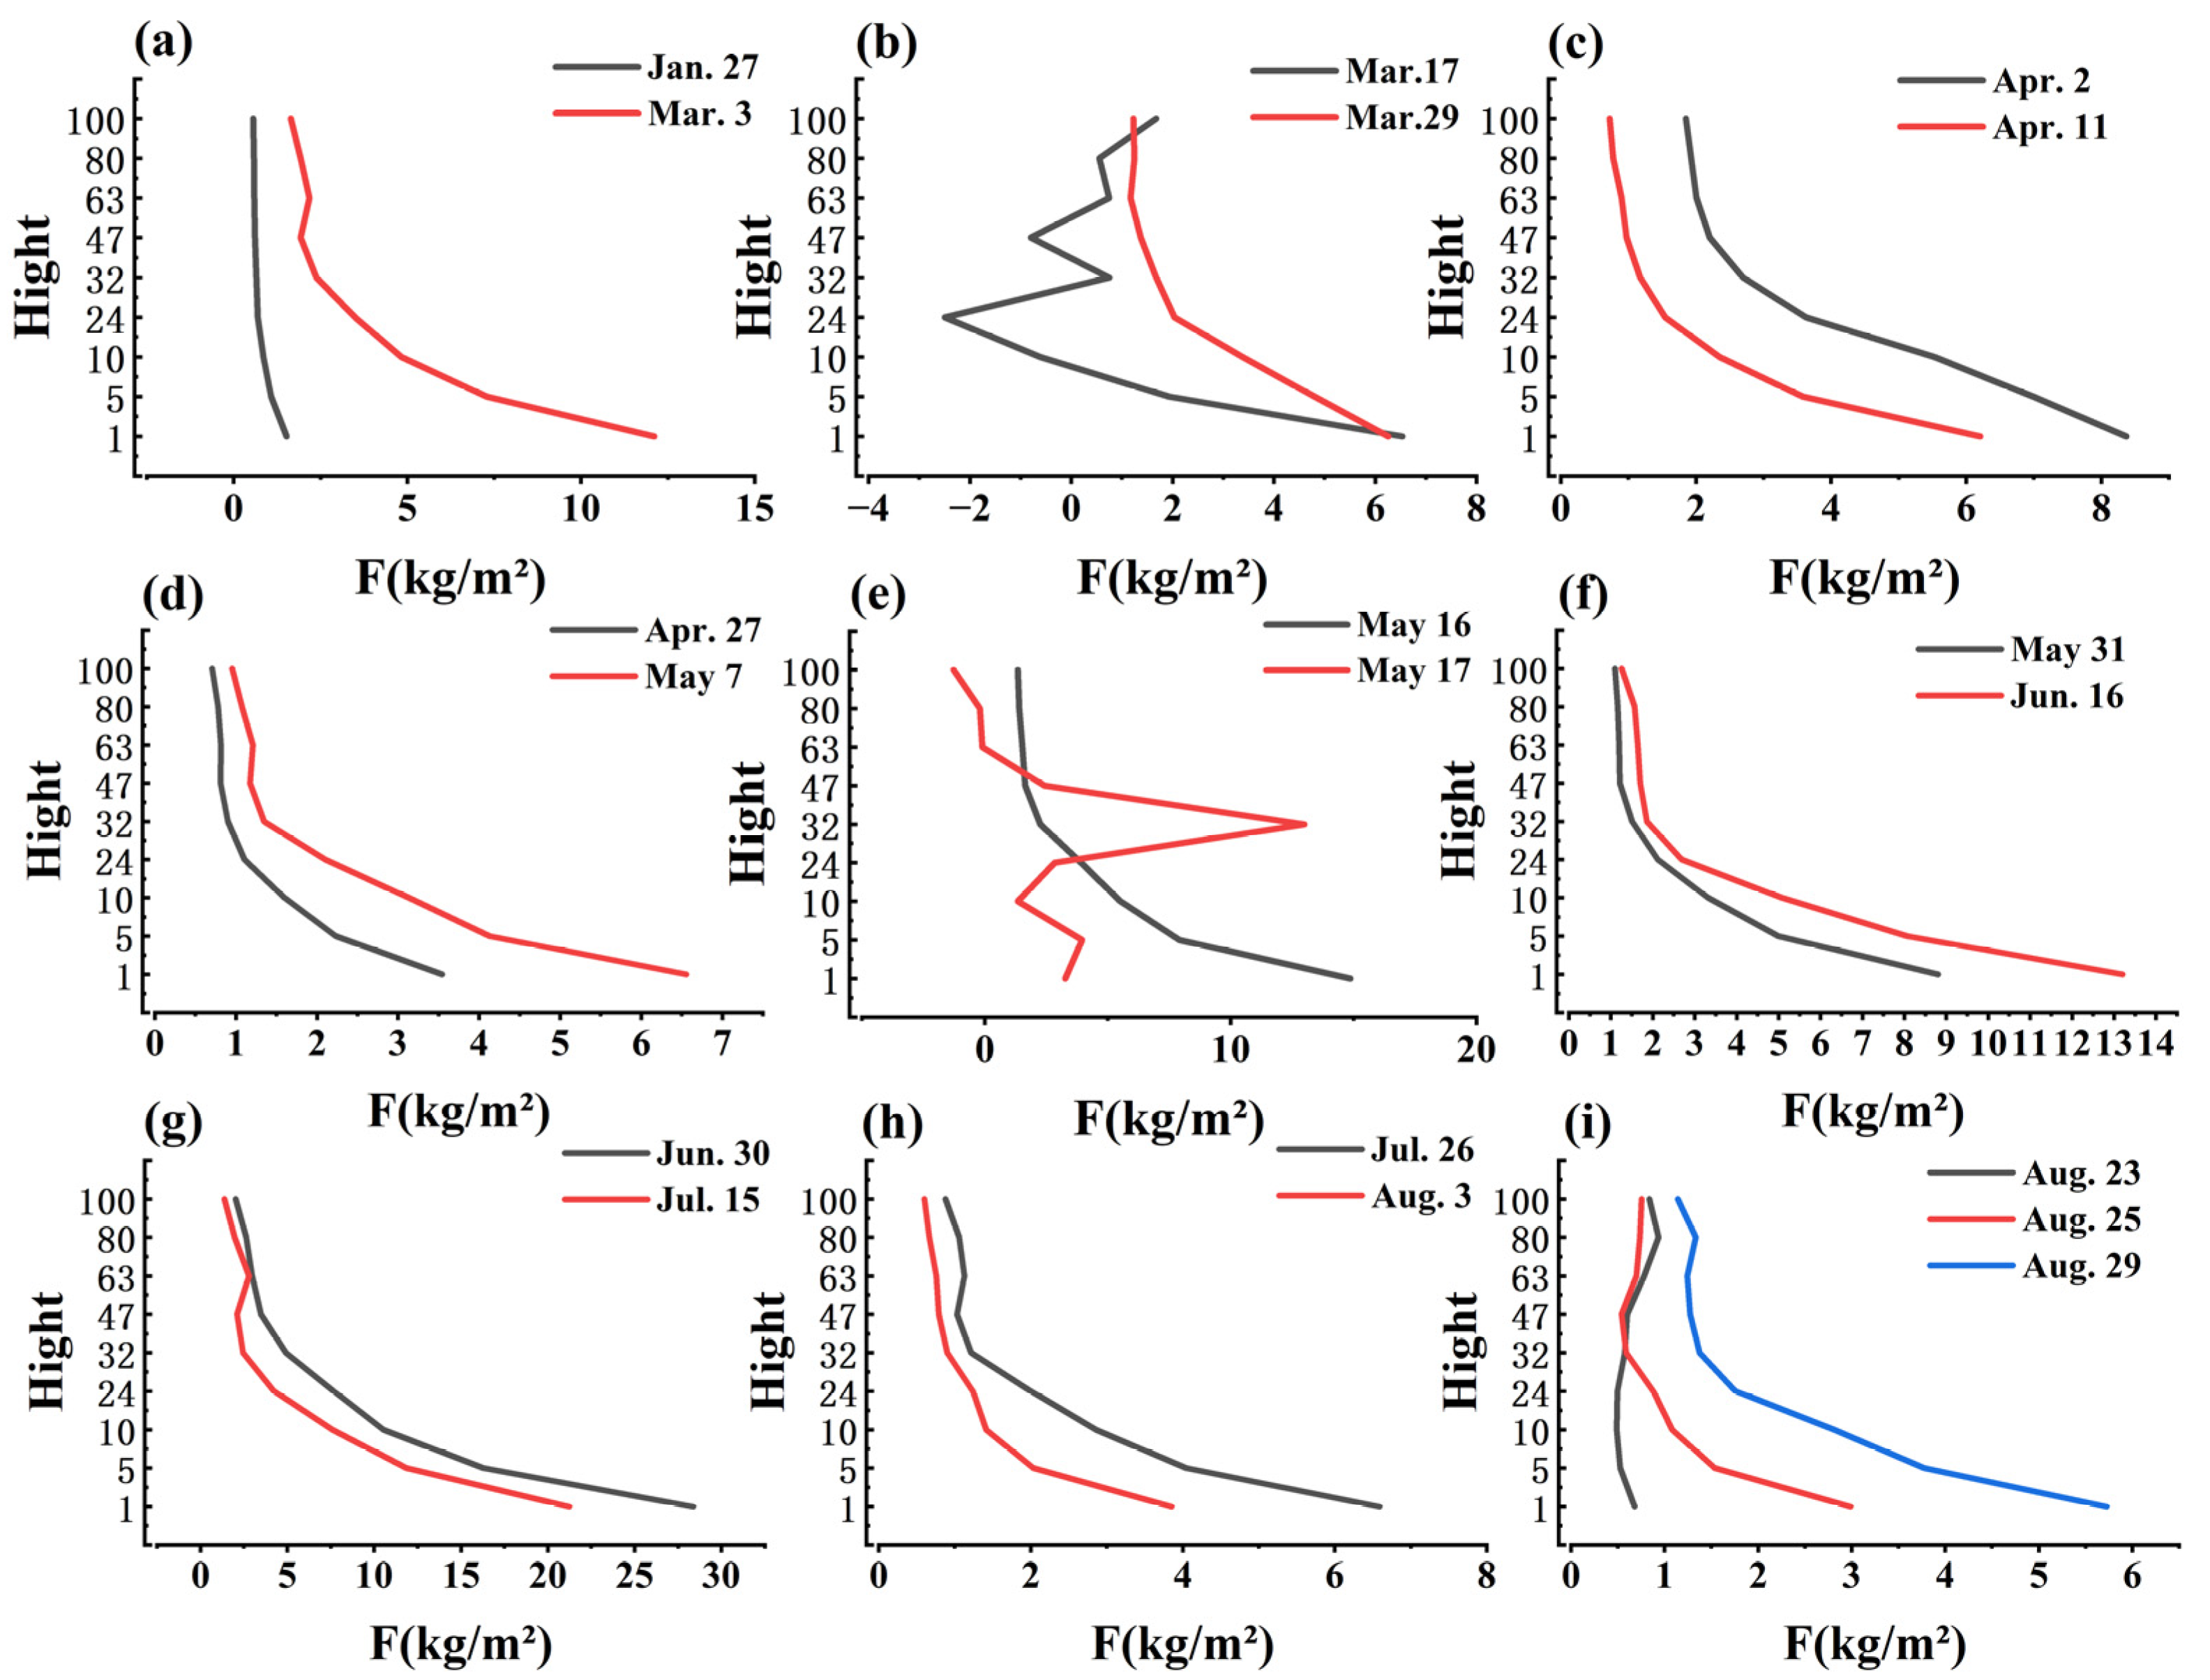
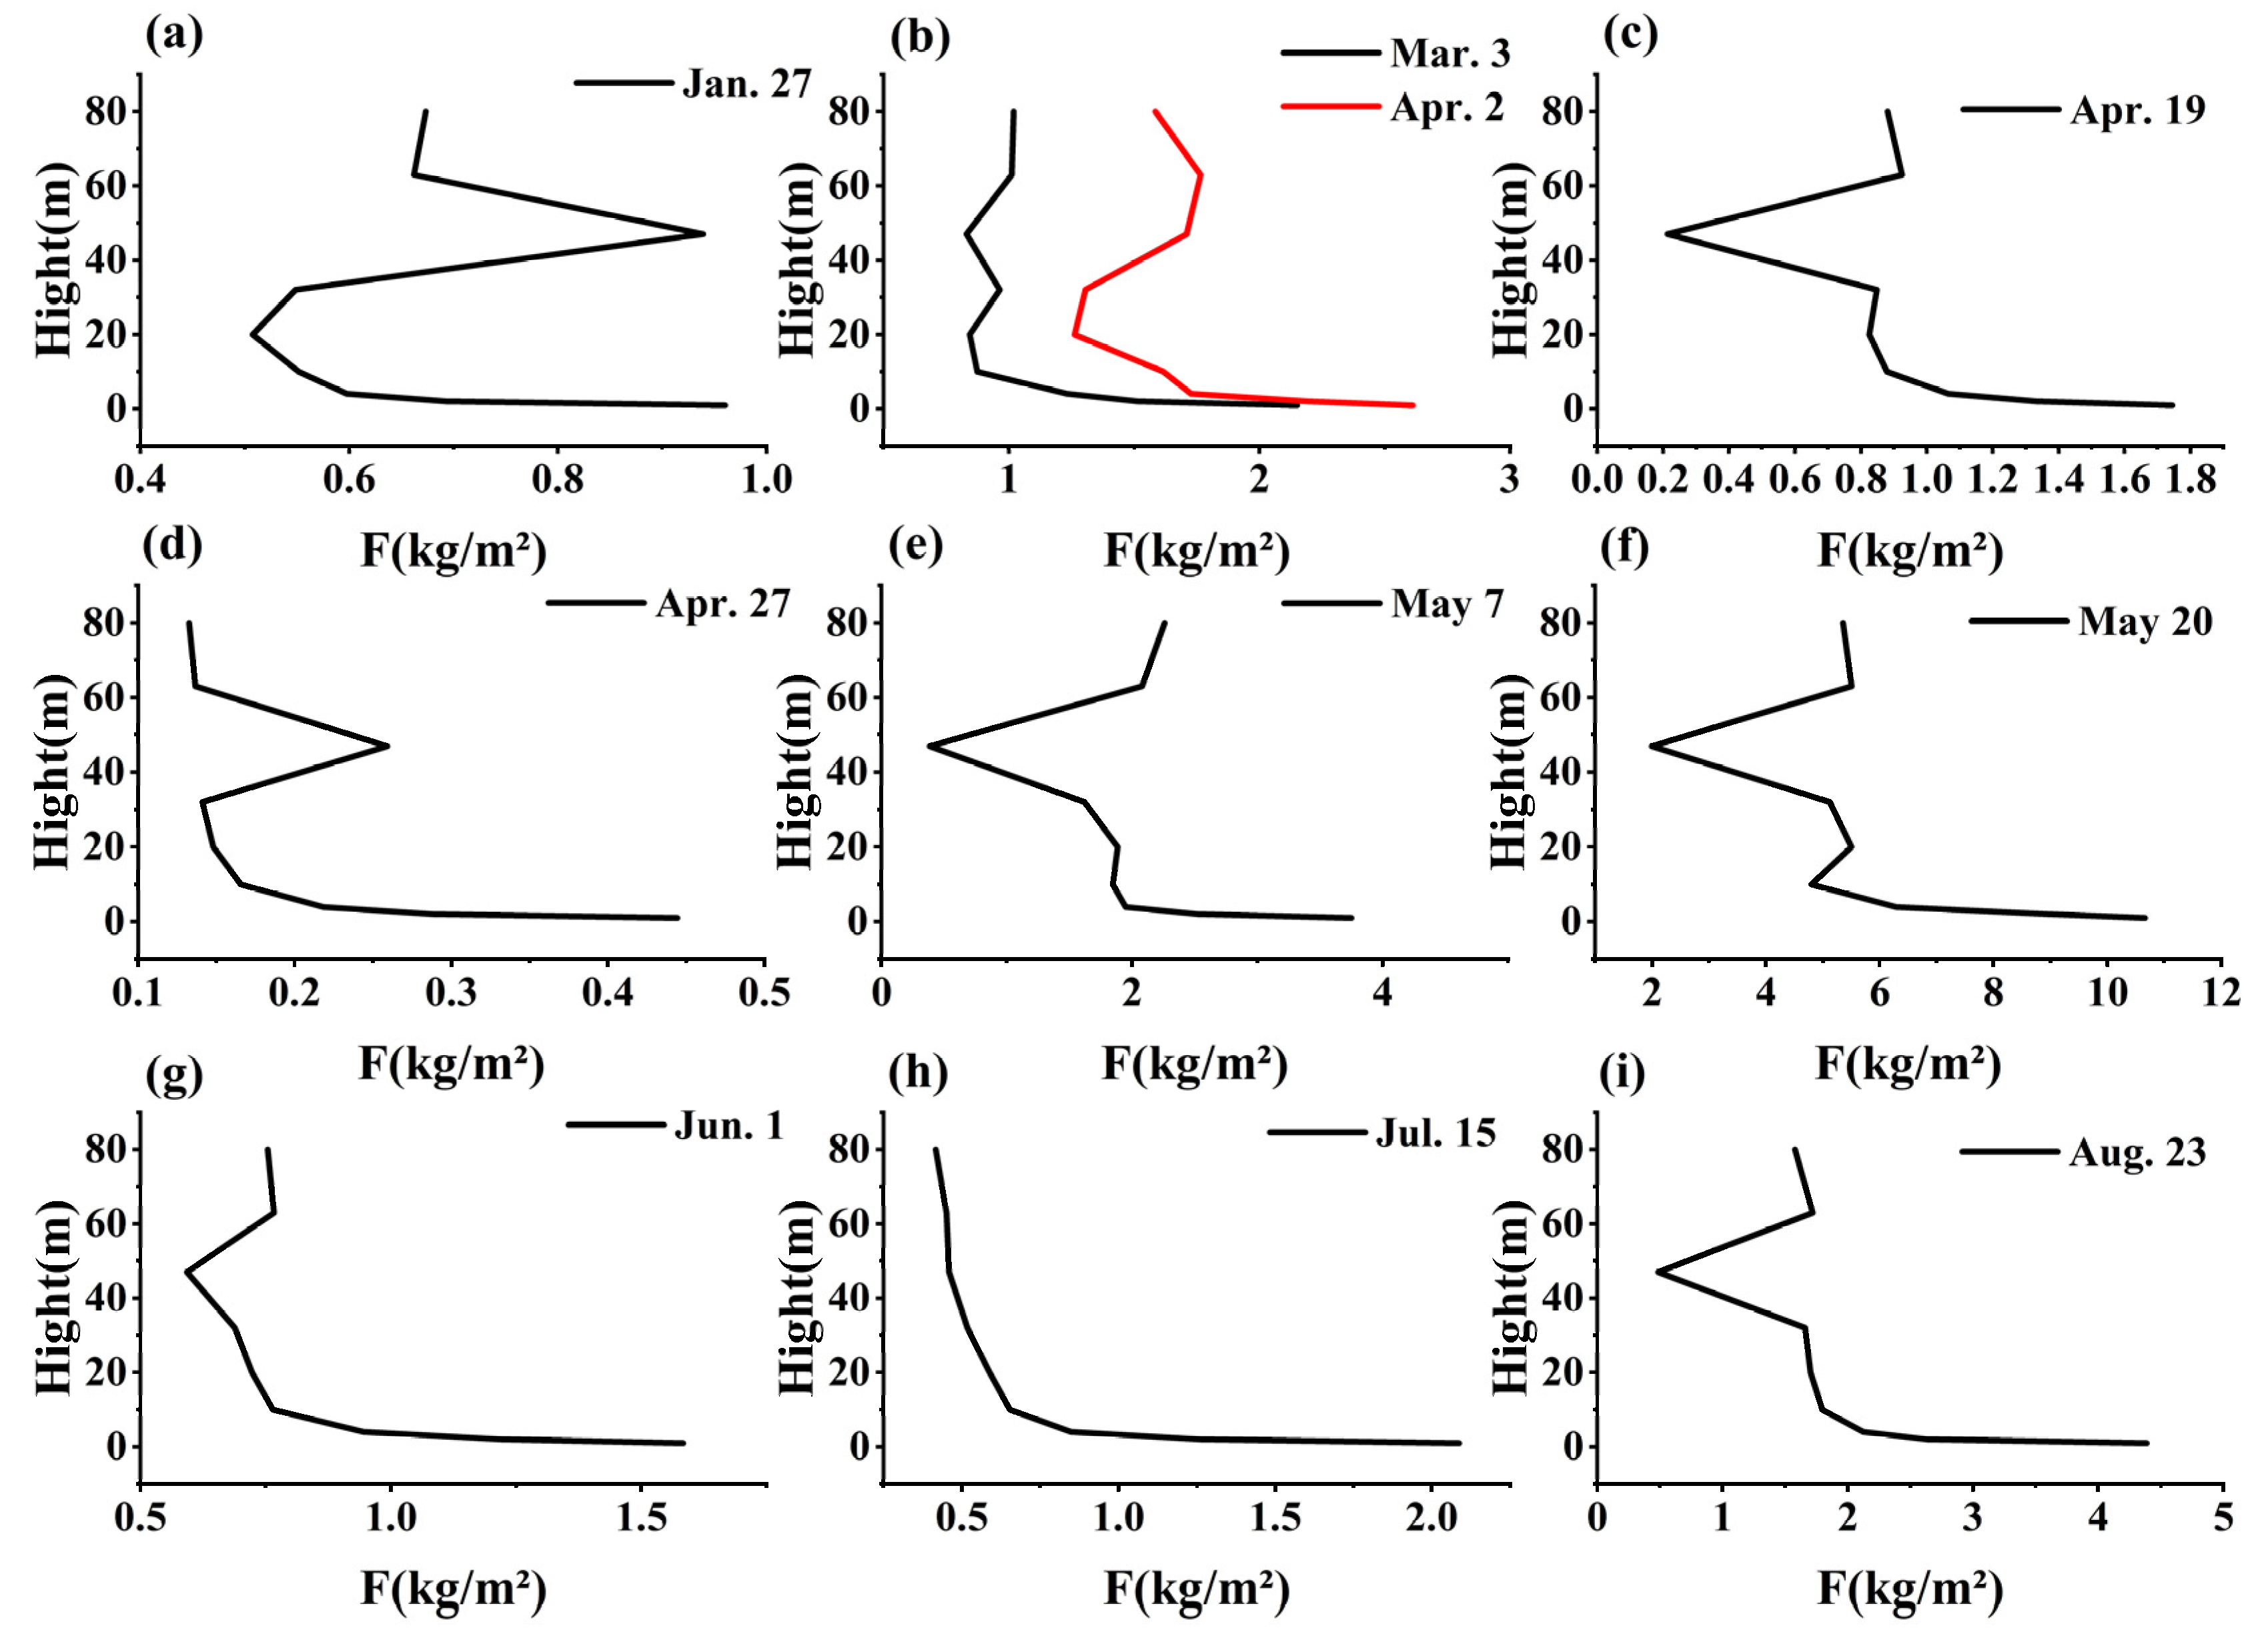
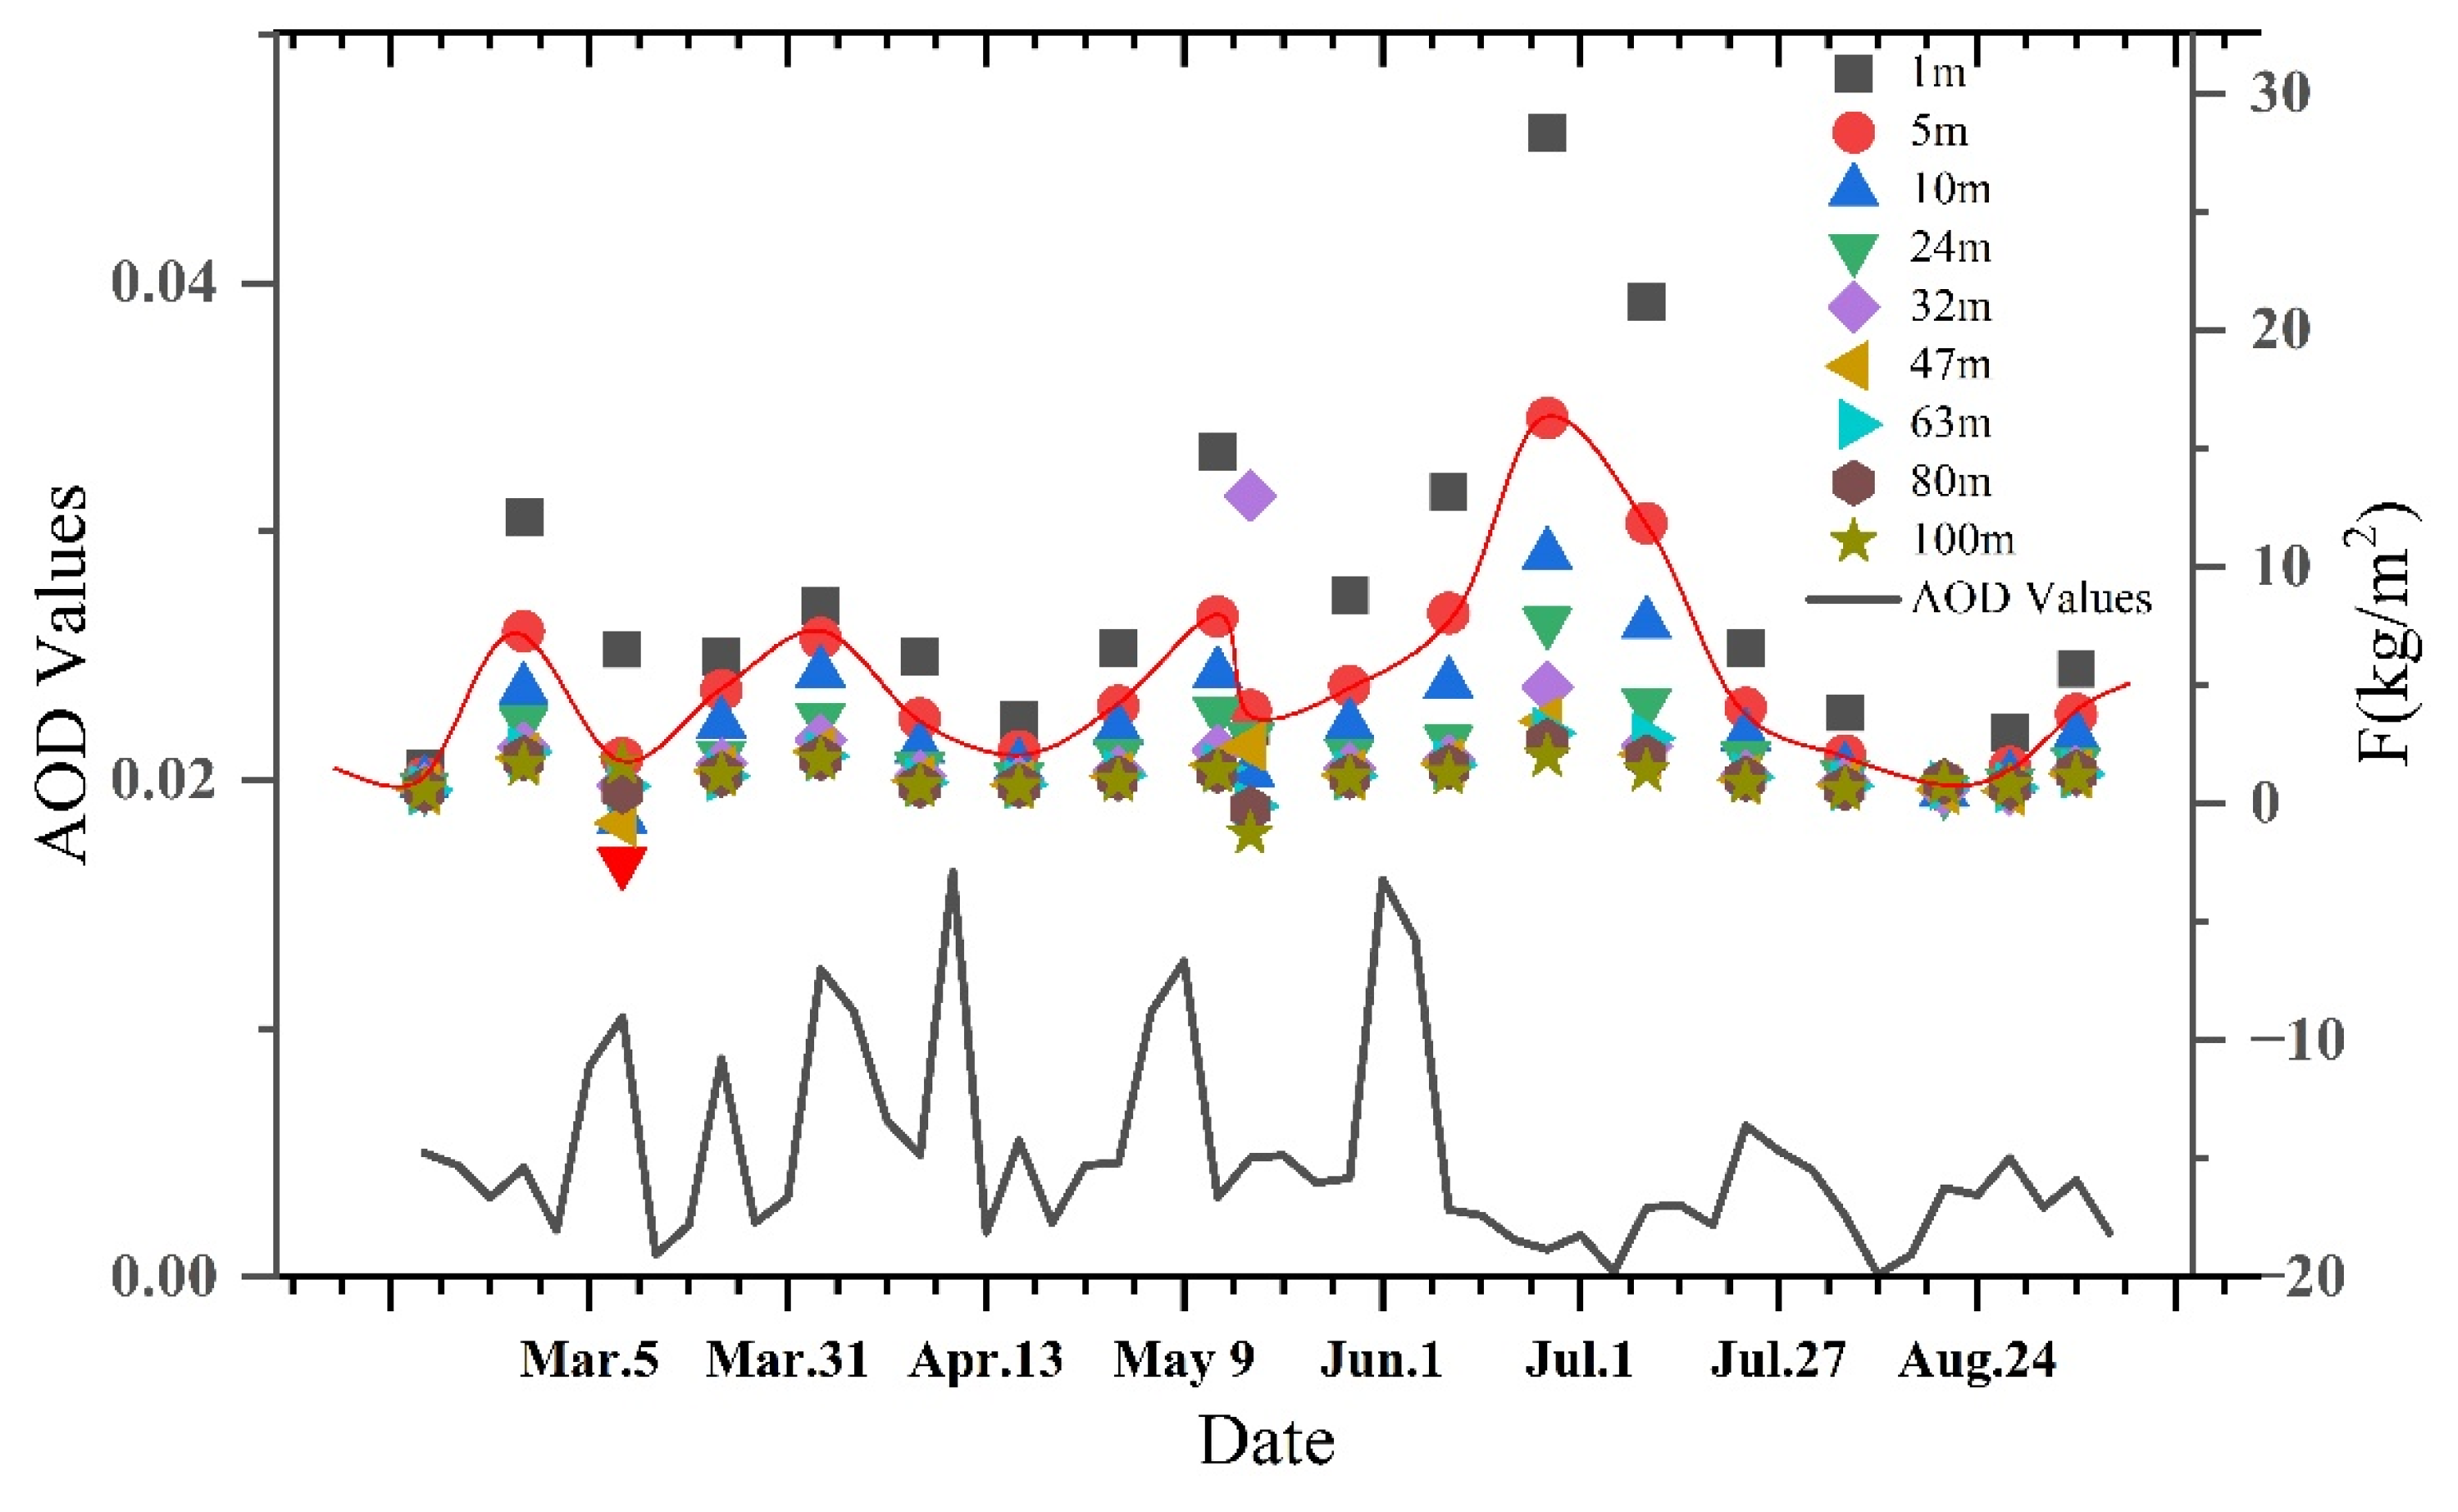
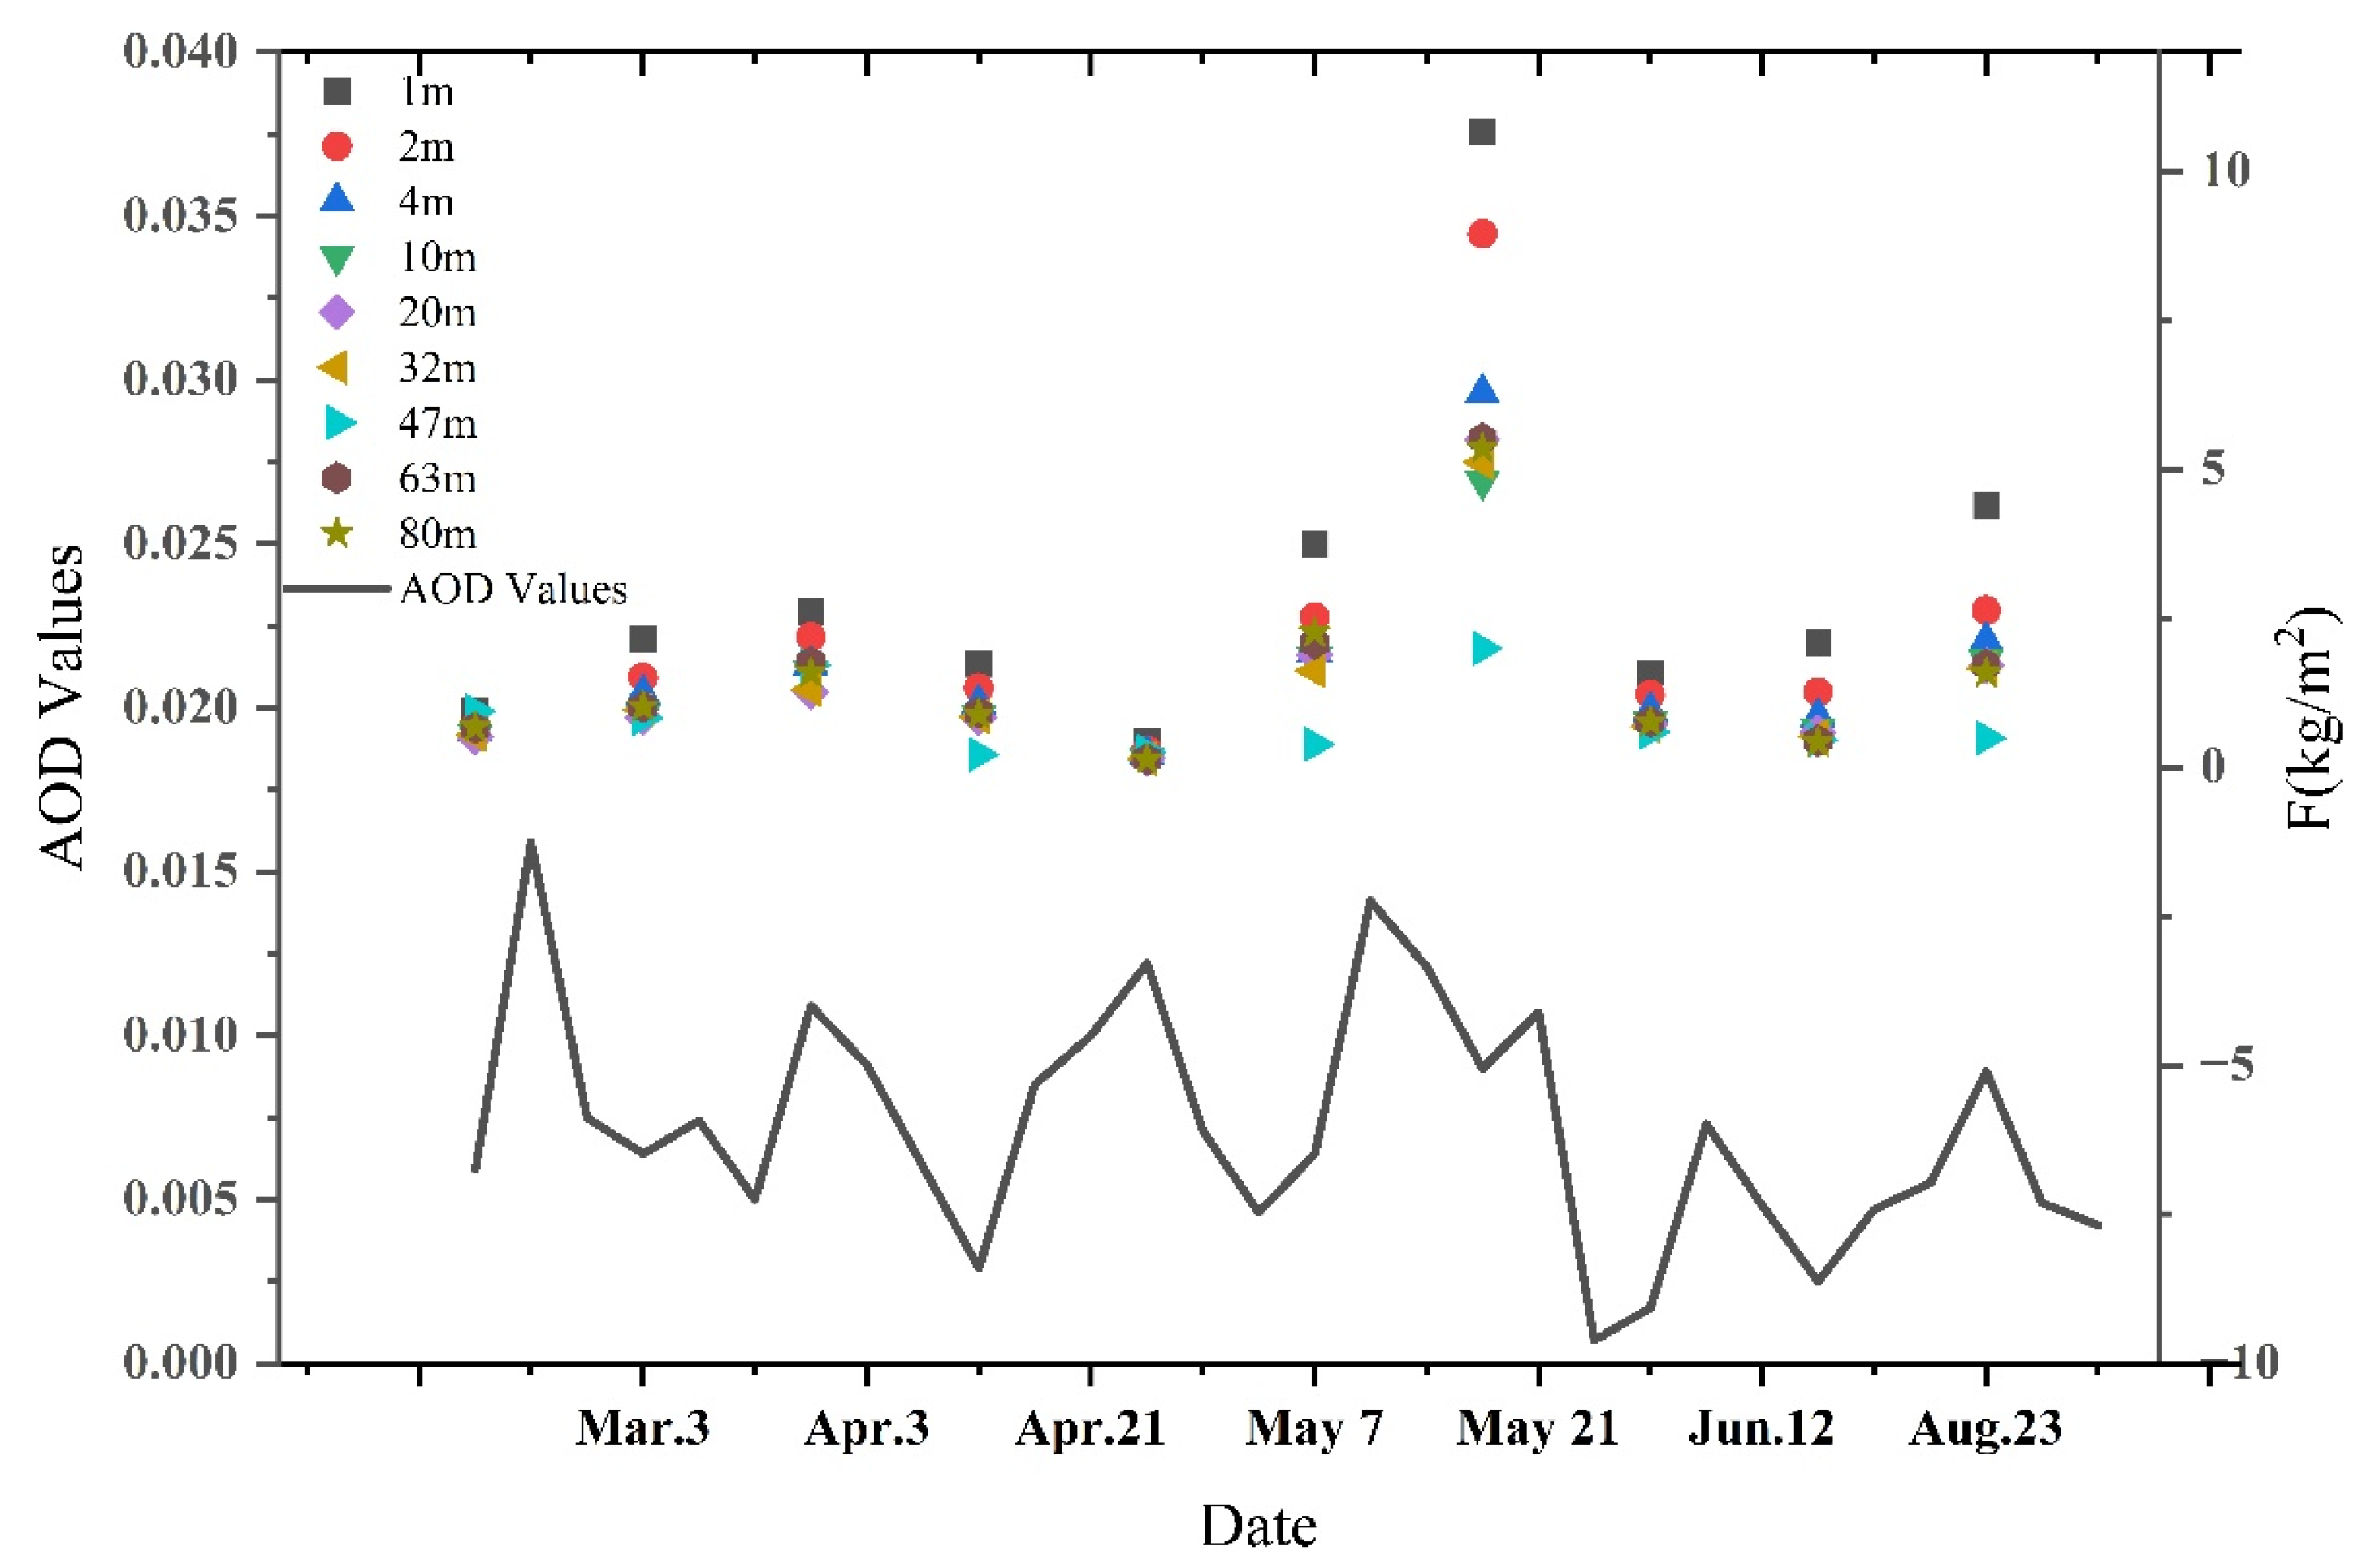
3.2. Variation Trend of F at Different Heights

Figure 4 shows the trend of vertical sand and dust flux variation with height at XT station from January to August. Overall, the sand and dust flux decreases with increasing altitude. In January, the sand and dust flux at a height of 1–2 m was 1.53 kg/m2, while it remained at 0.56 kg/m2 at 100 m, indicating a high concentration of sand and dust in the lower atmosphere. On 3 March, the flux at 1–2 m was 12.11 kg/m2, indicating the intensity of the sandstorm. After May, the sand and dust flux significantly increased, reaching 66.3 kg/m2 on 7 May, reflecting the intensity of sand and dust activity under specific weather conditions. Between June and July, the flux of 1–2 m reached 21.24 kg/m 2 on 15 July, but significantly decreased in August, especially dropping to 0.68 kg/m 2 on 23 August, indicating a decrease in low-level dust concentration.
Figure 5 shows the variation of dust flux at TZ station on different dates and at different heights. The sand and dust flux rapidly increases to its peak in the lower layer (1–40 m) and gradually decreases. On 27 January and 3 March, the flux reached its peak at 10 m and then decreased; on 2 April and 7 May, the peak appeared at heights of 40 m and 20 m. The sand and dust flux on 20 May and 23 August rapidly increased in the lower layer and then decreased rapidly with increasing altitude. On 1 June and 15 July, there was a relatively flat trend of change. Overall, the variation of dust flux with height shows significant seasonal differences.

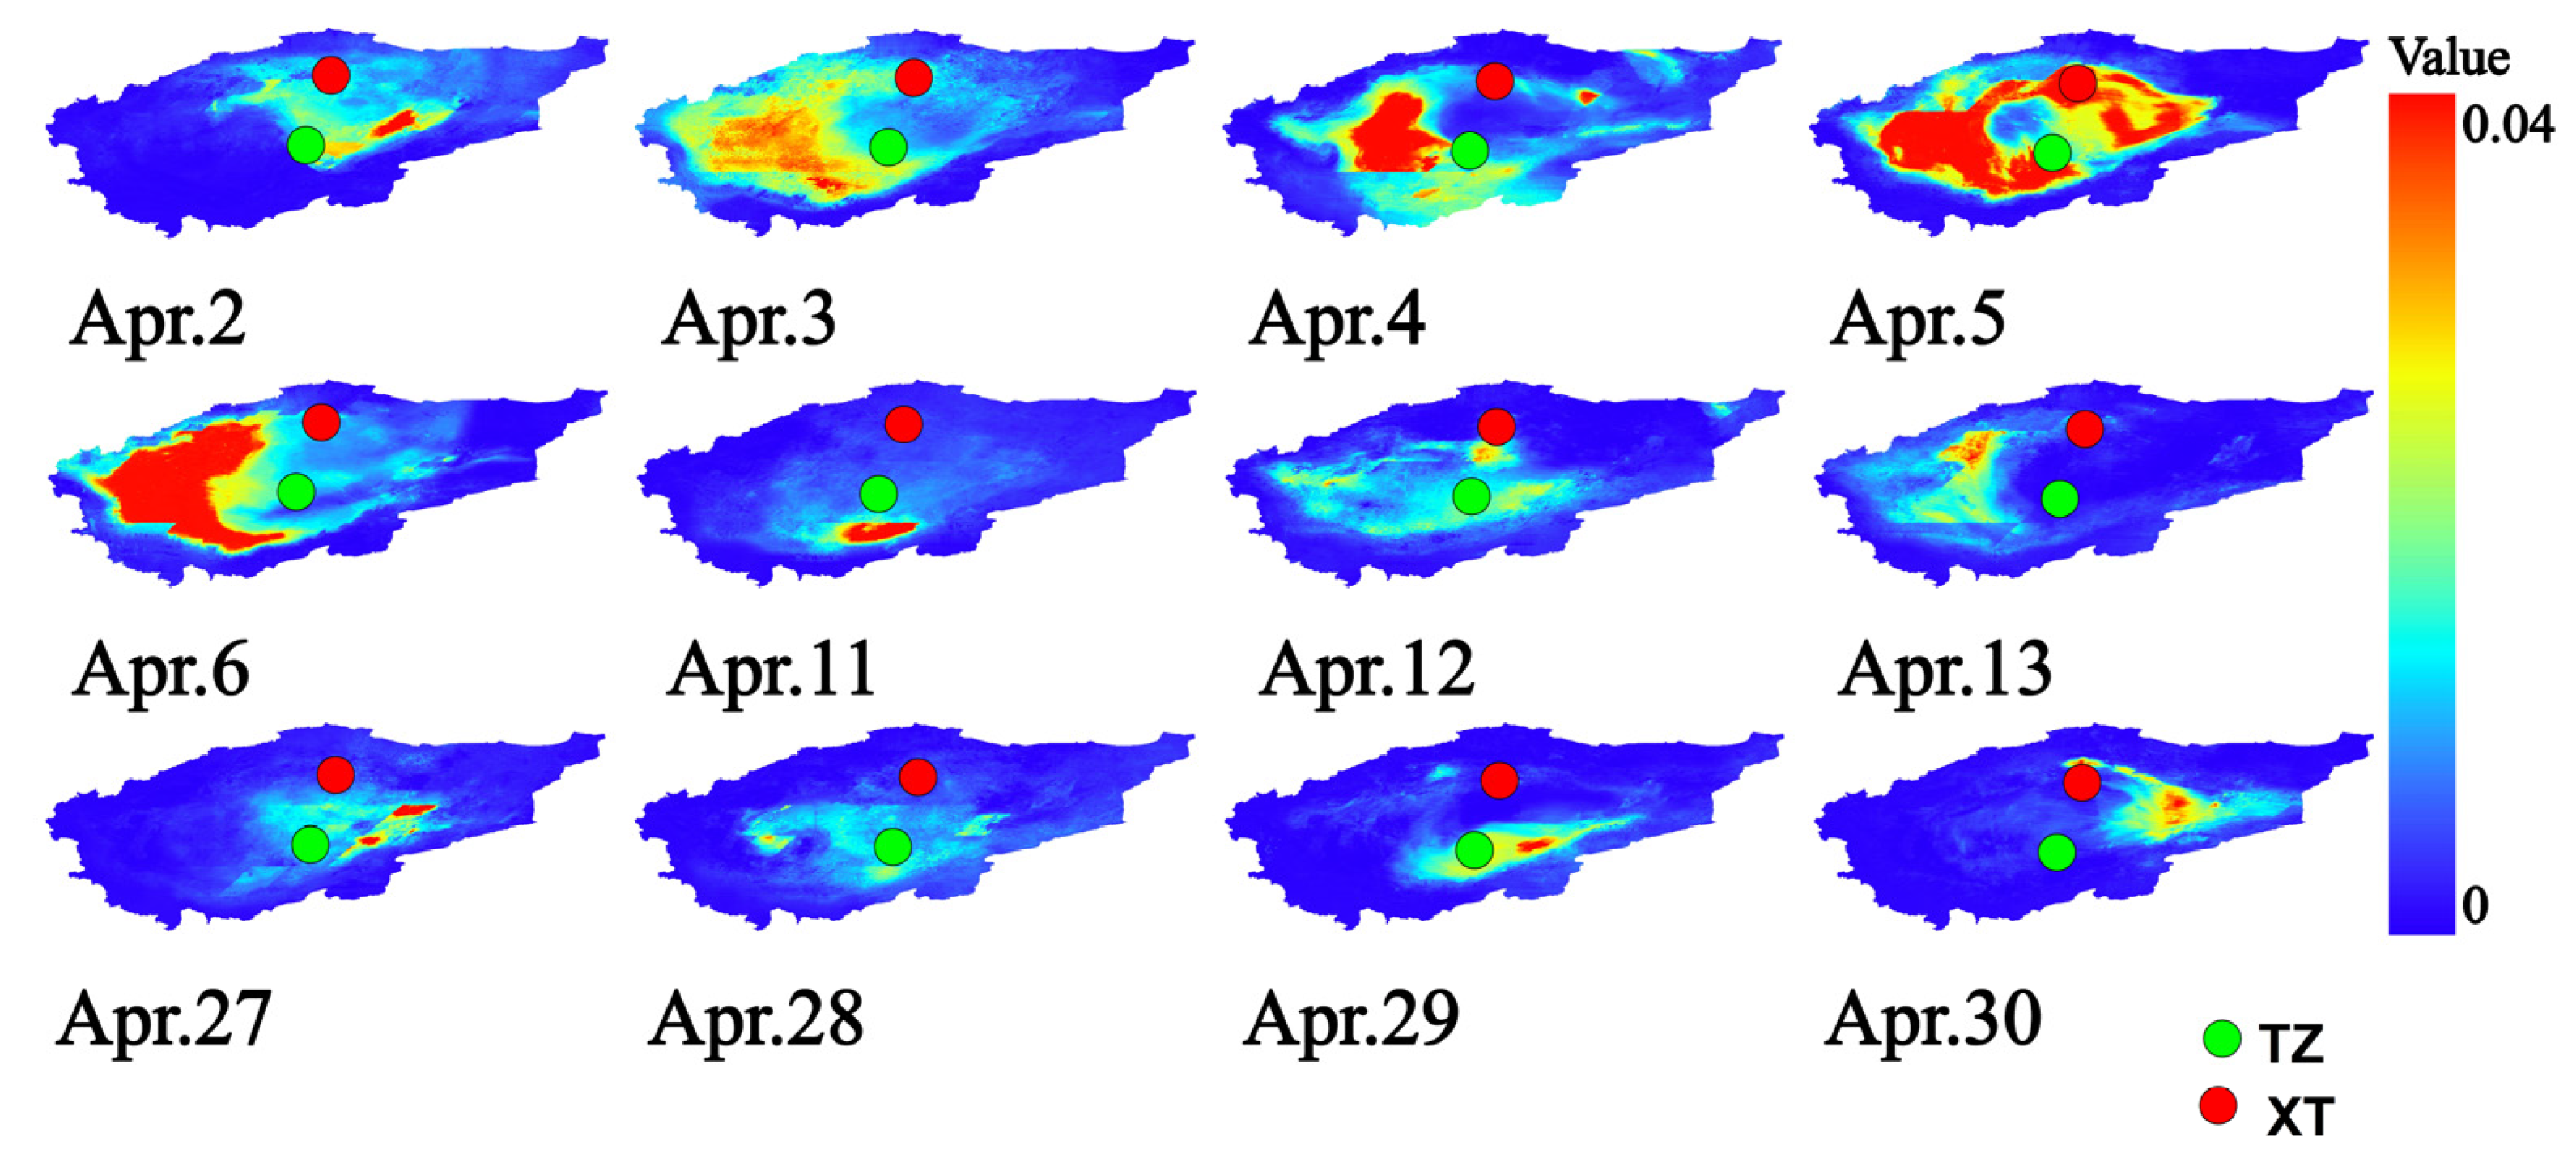
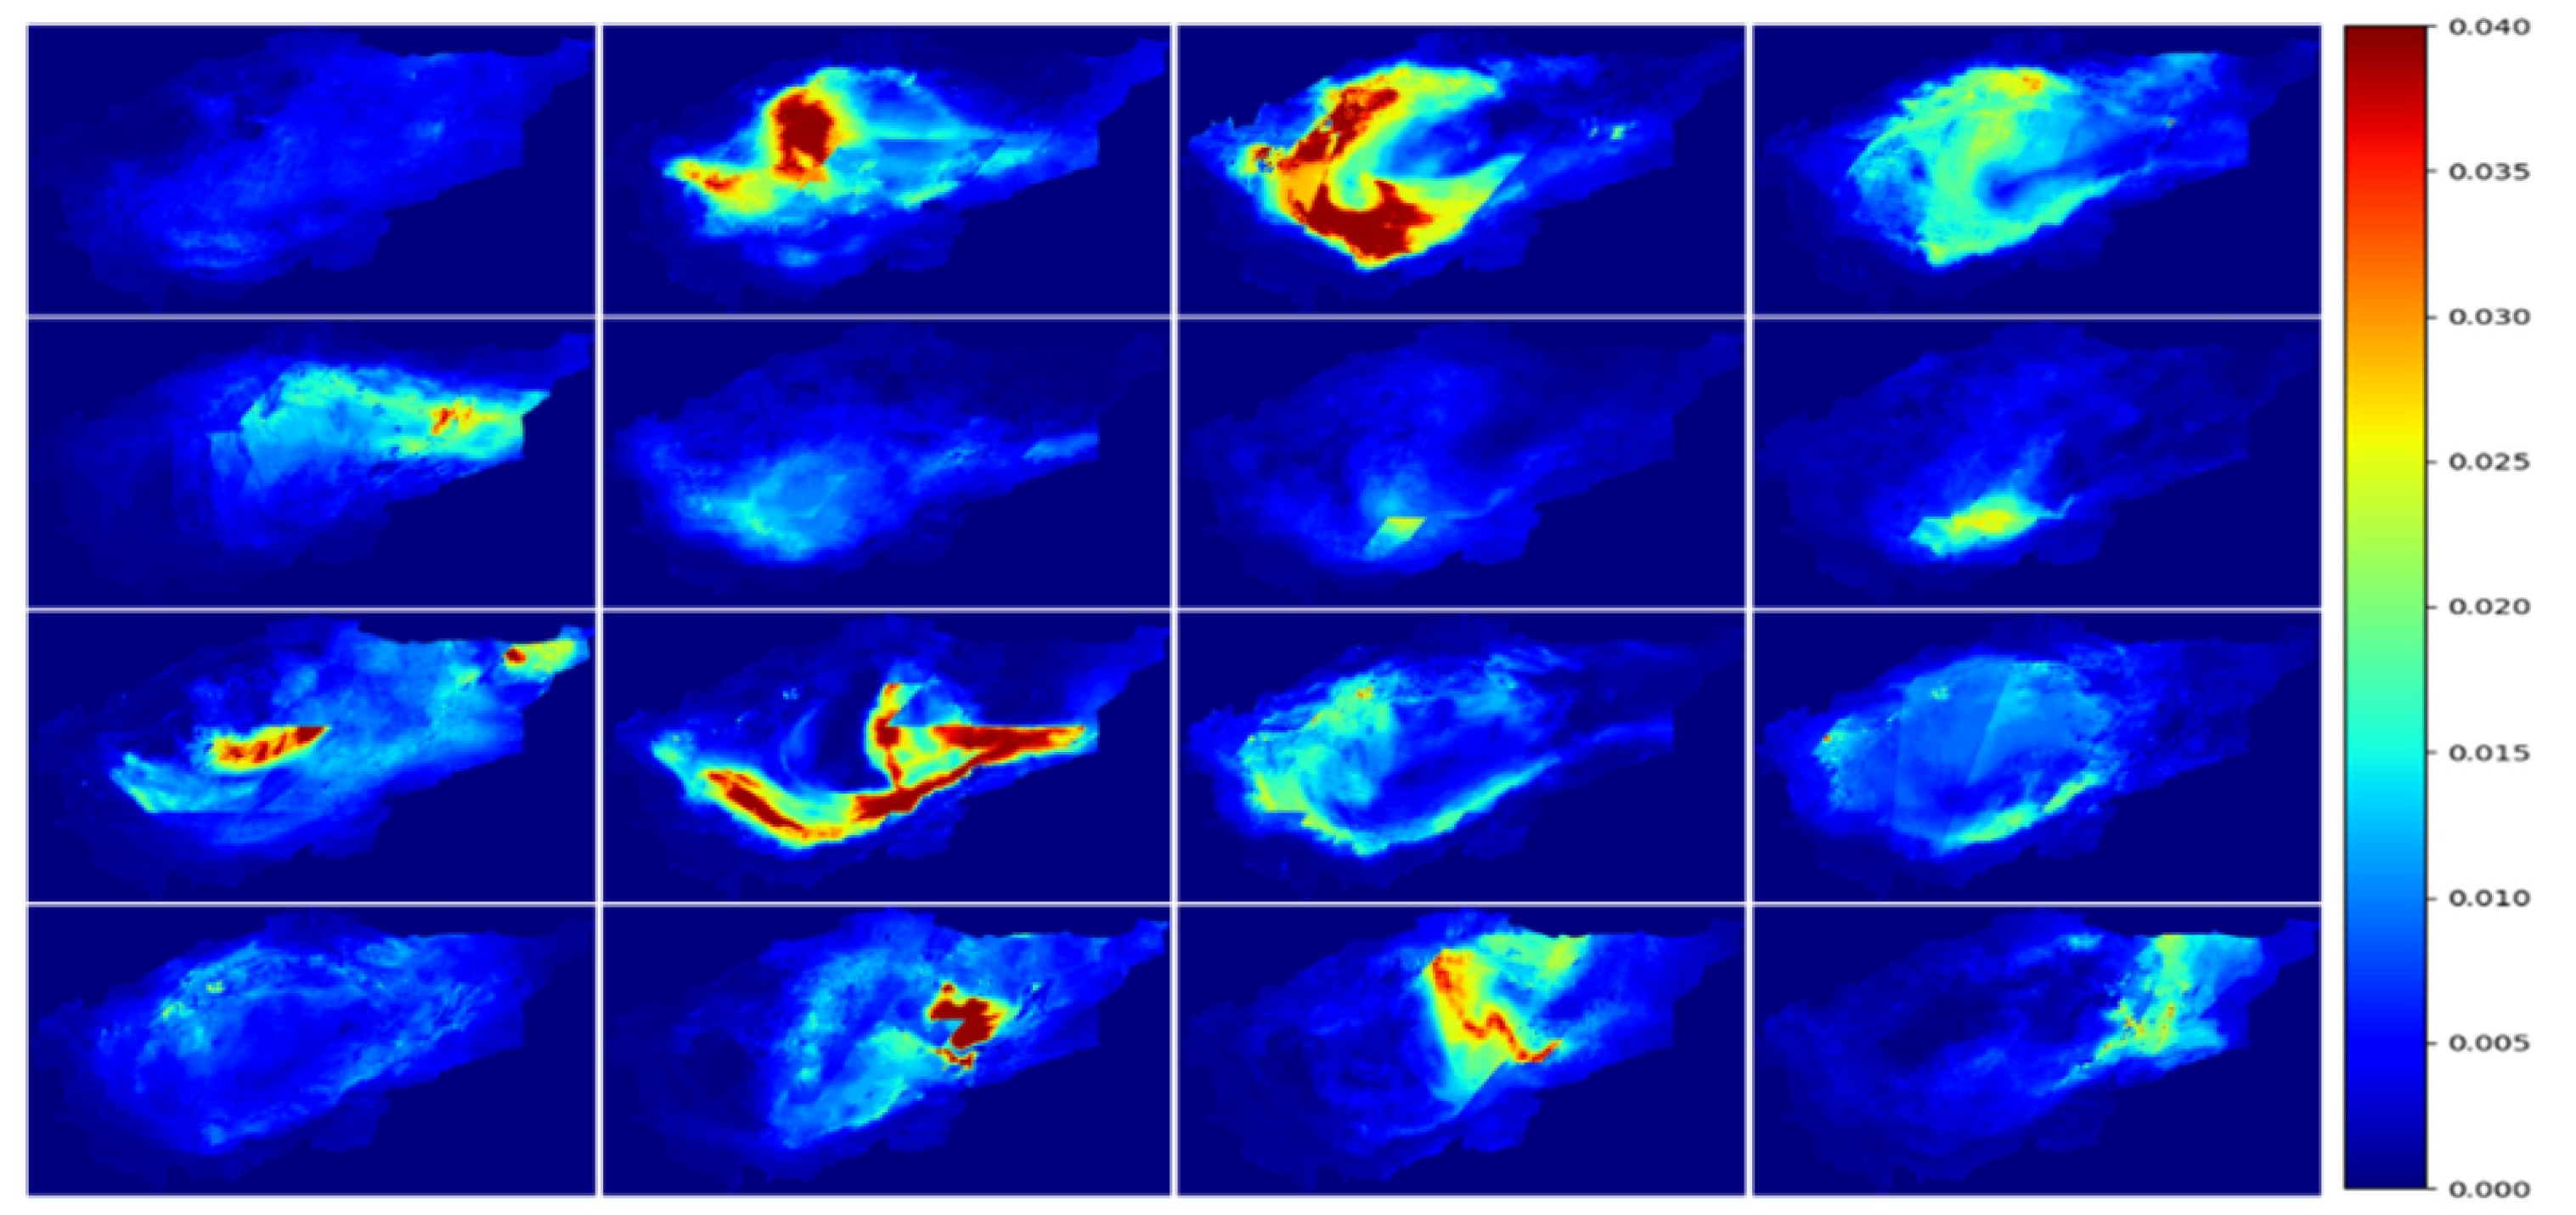
3.3. Satellite Image Analysis of Dust Storms

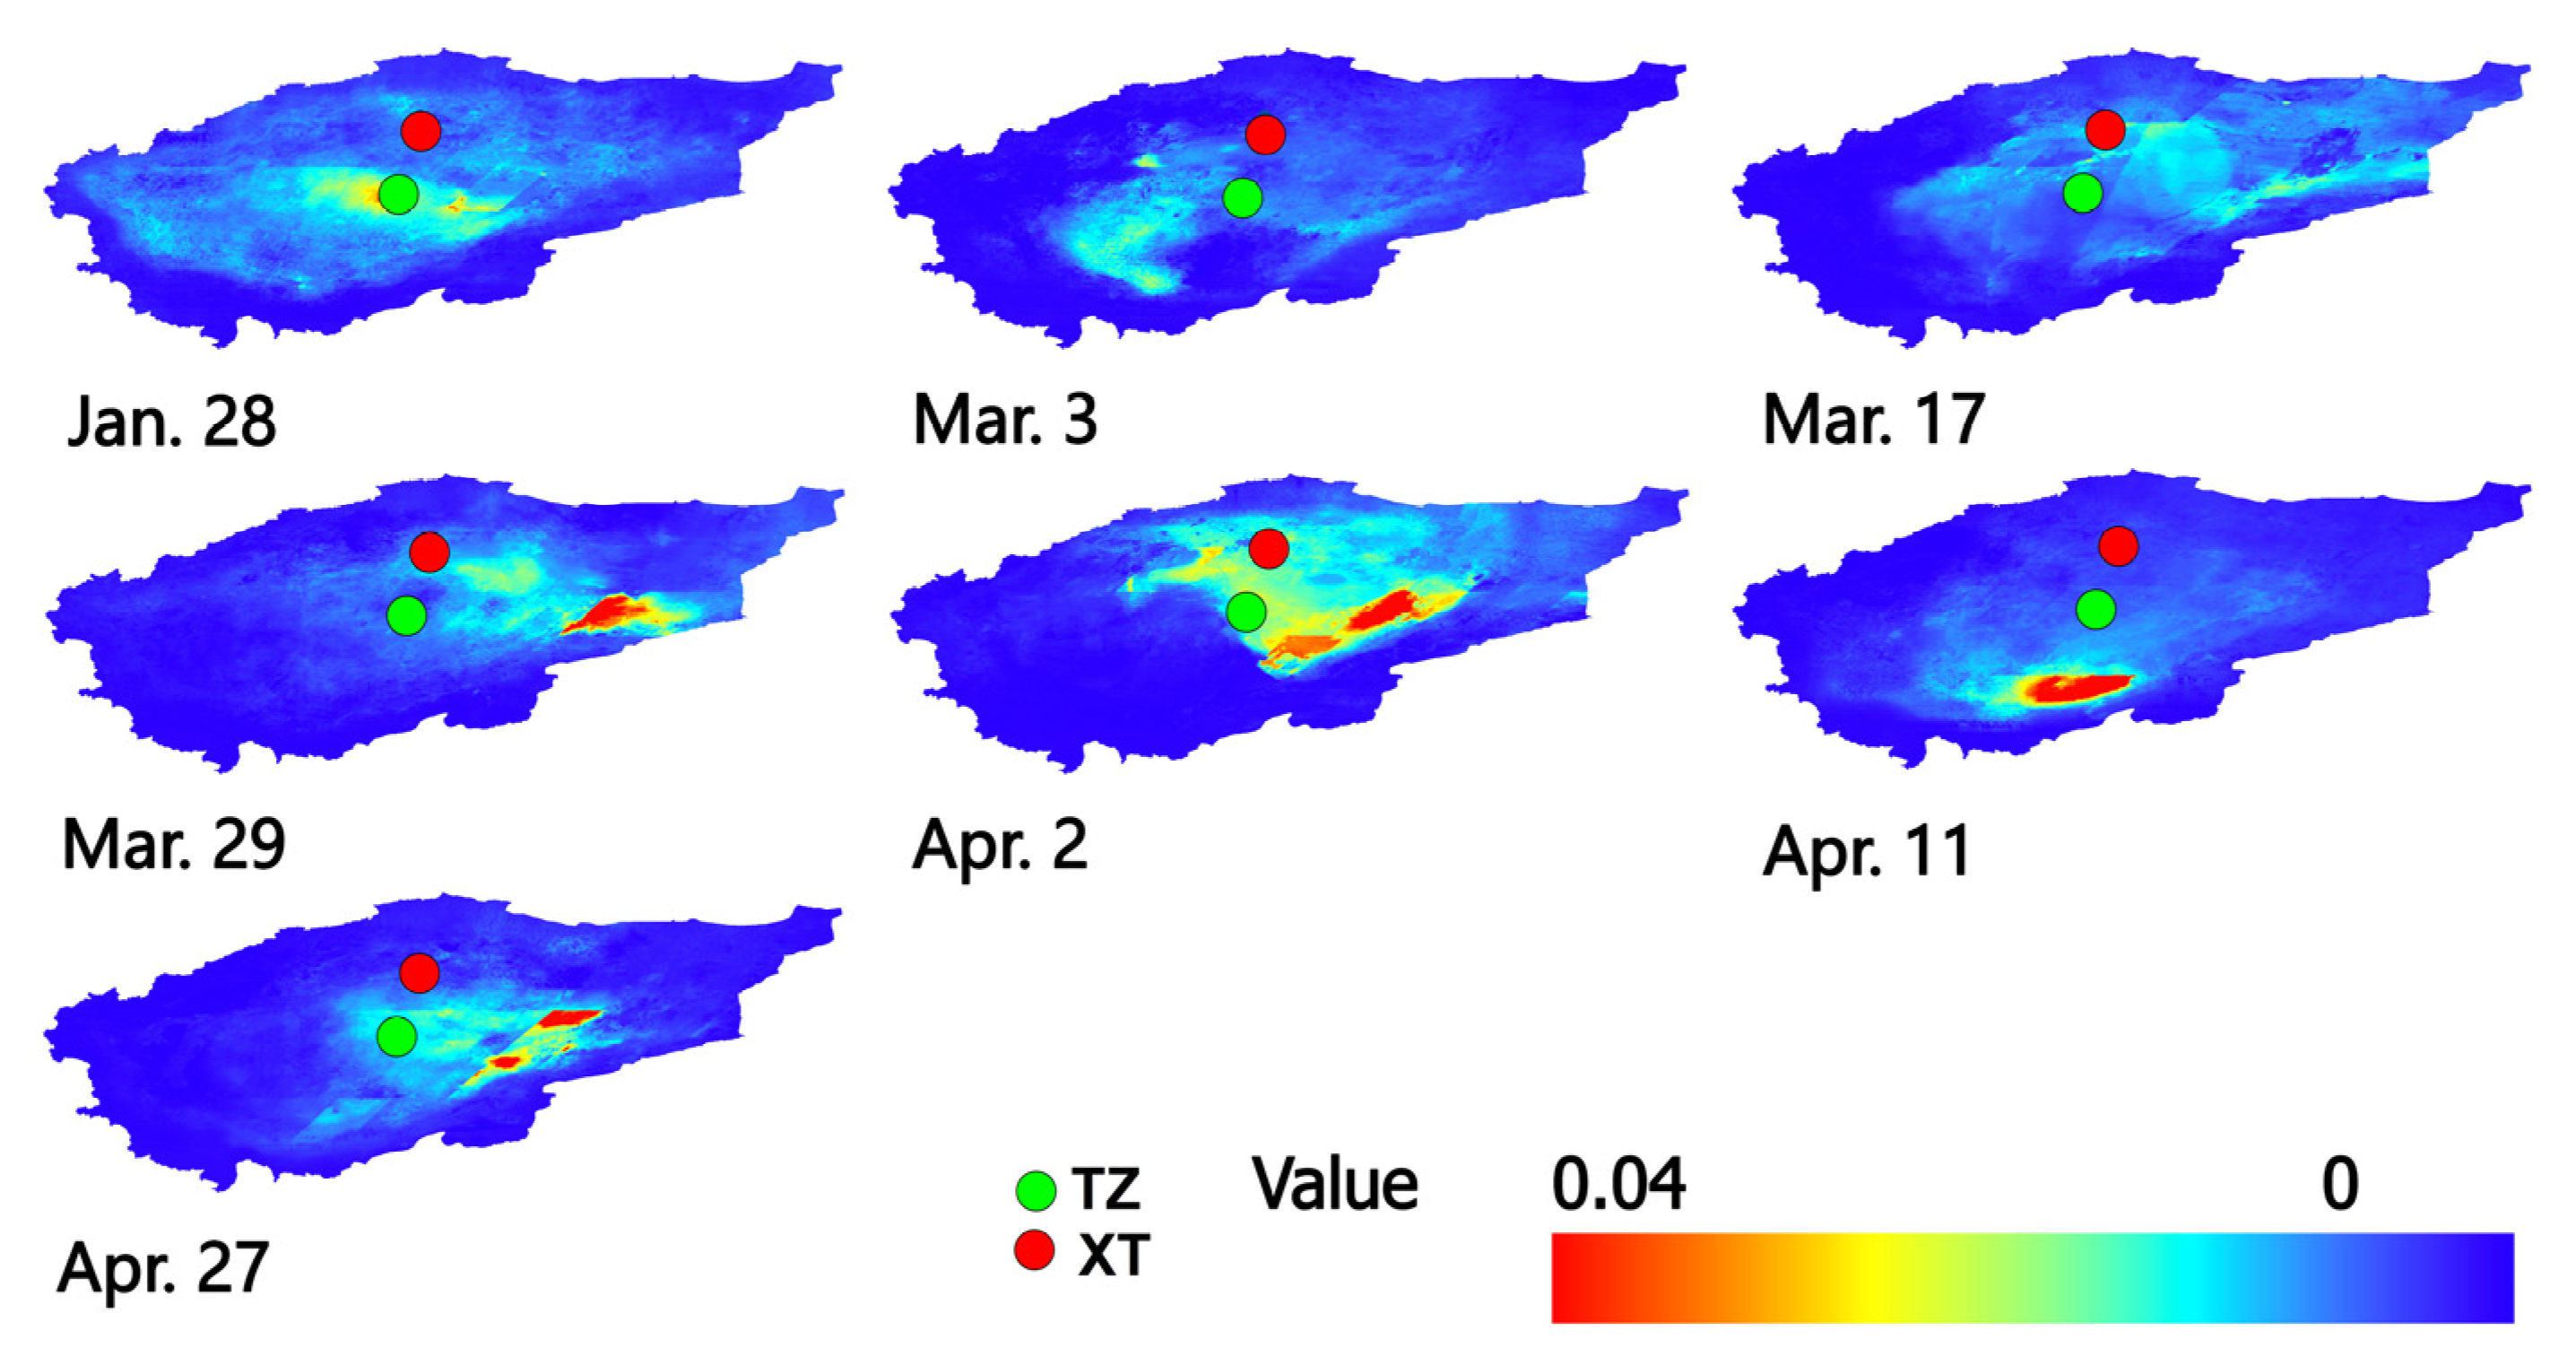
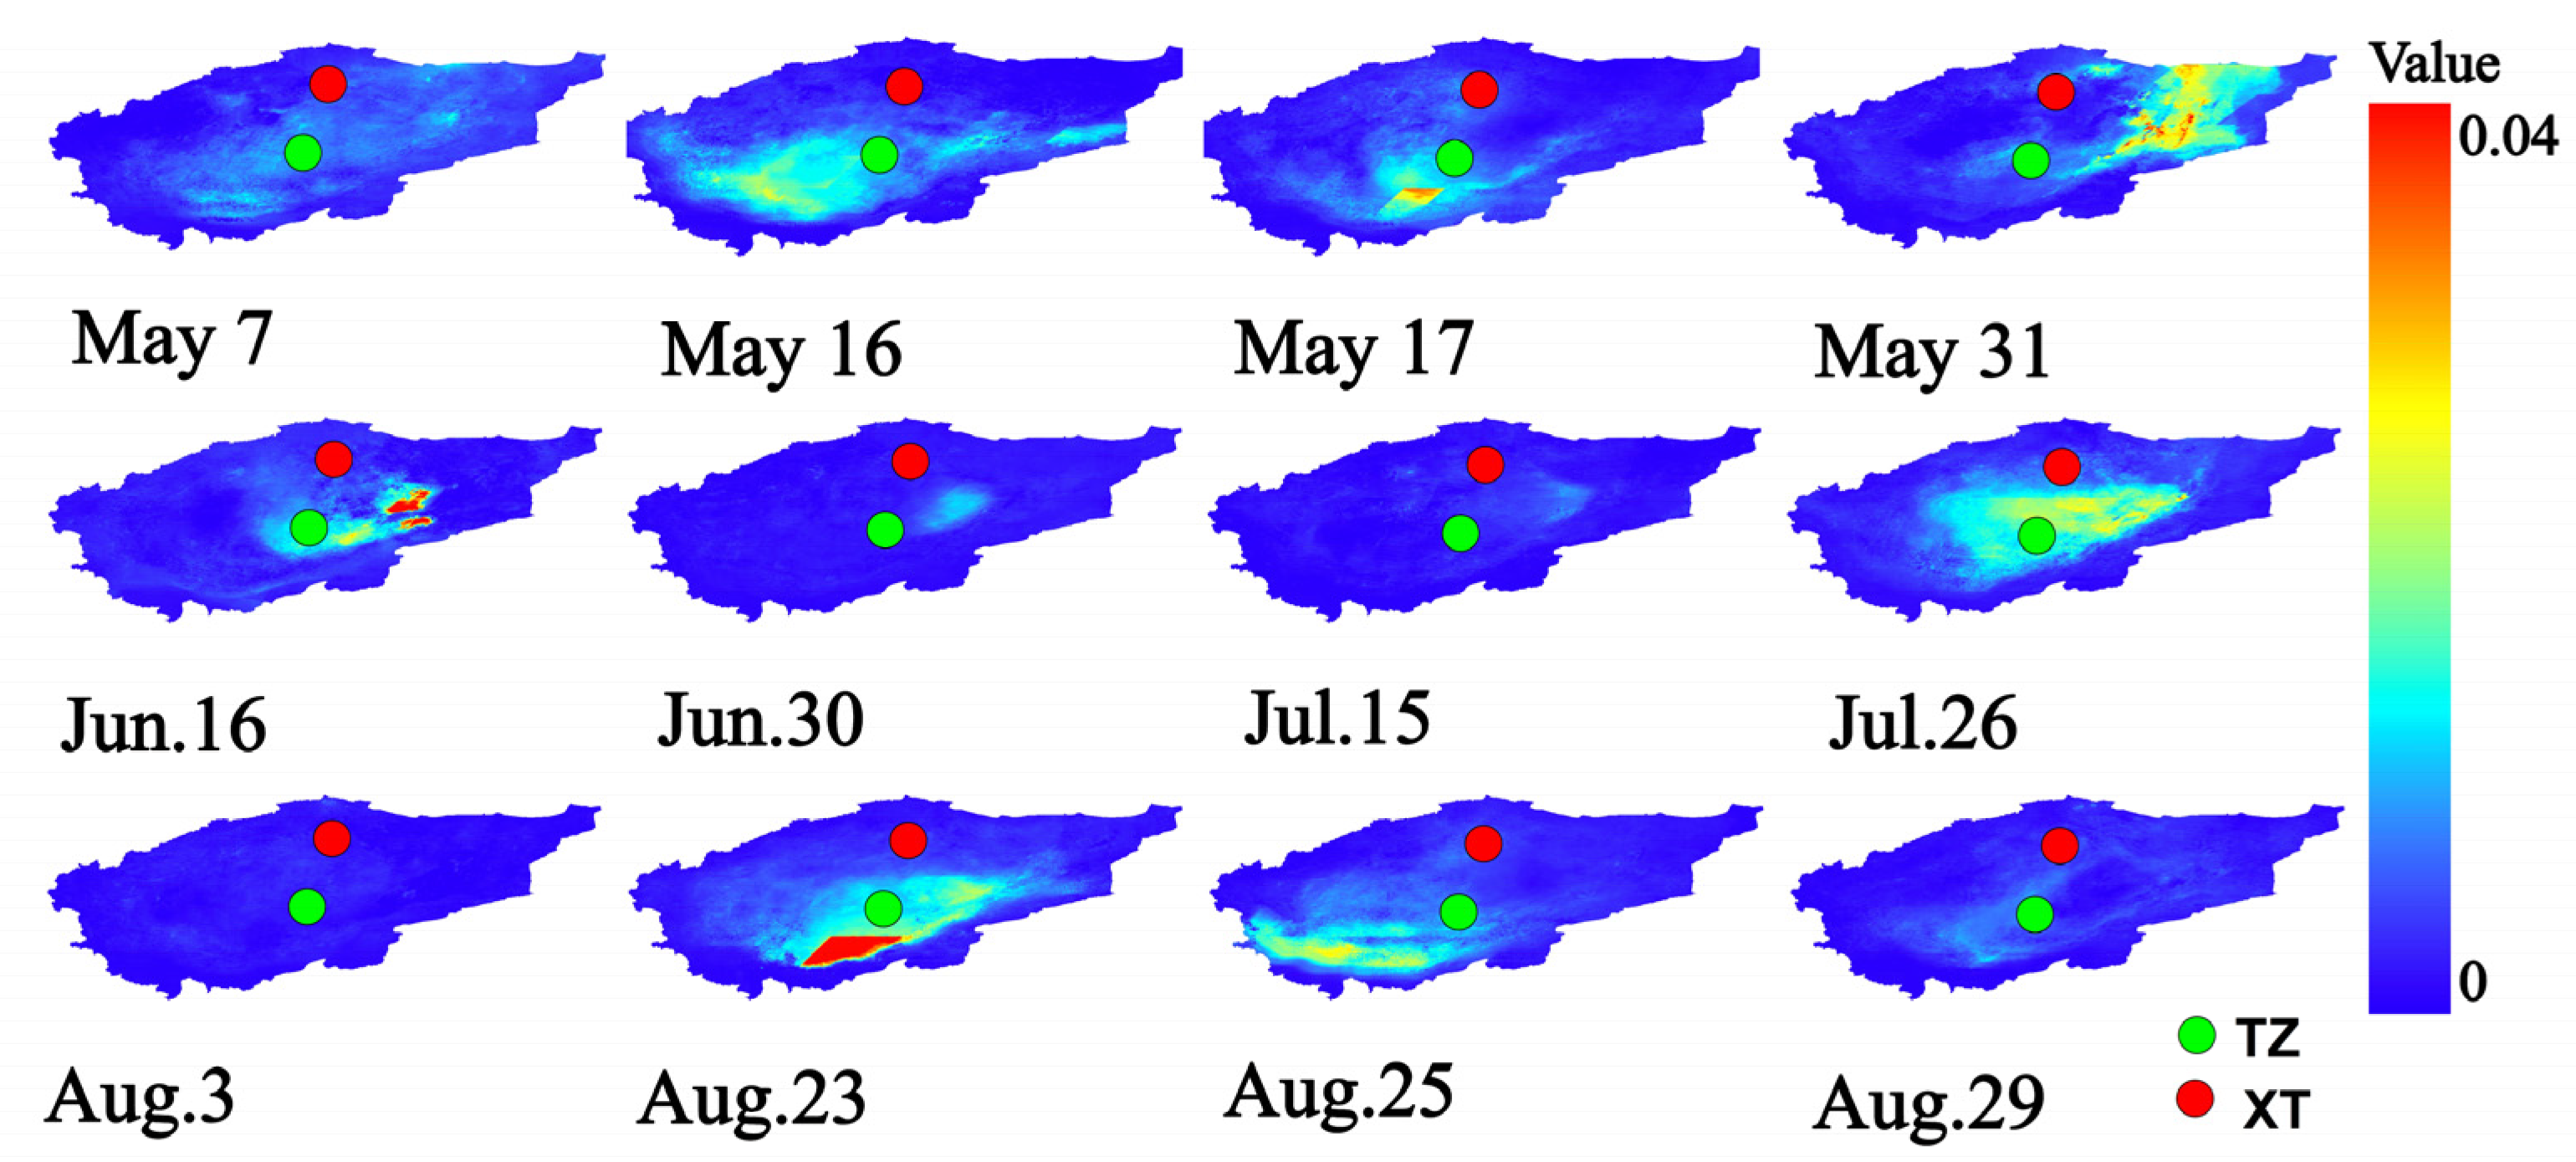
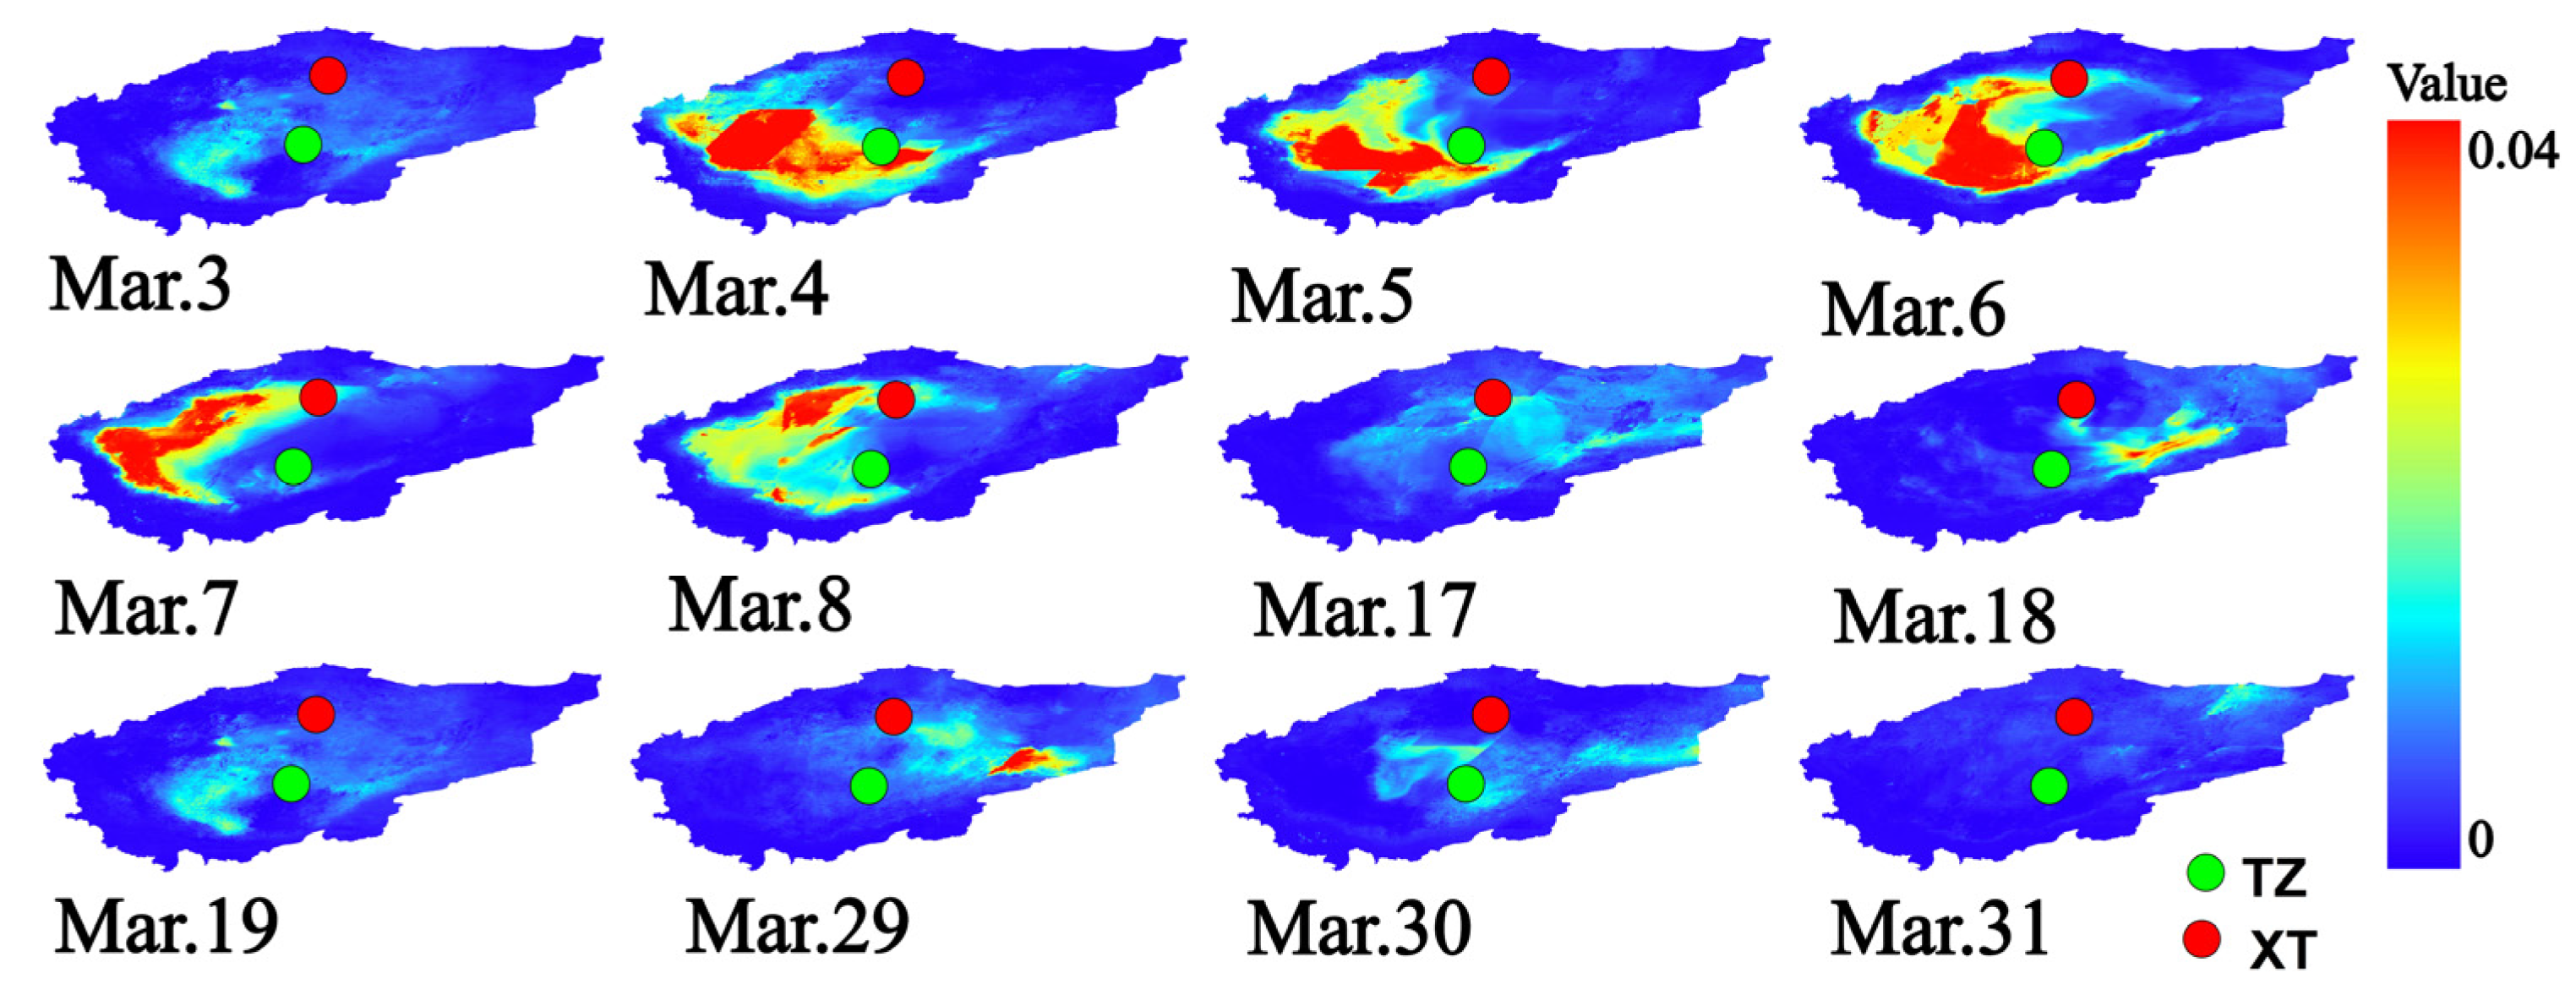
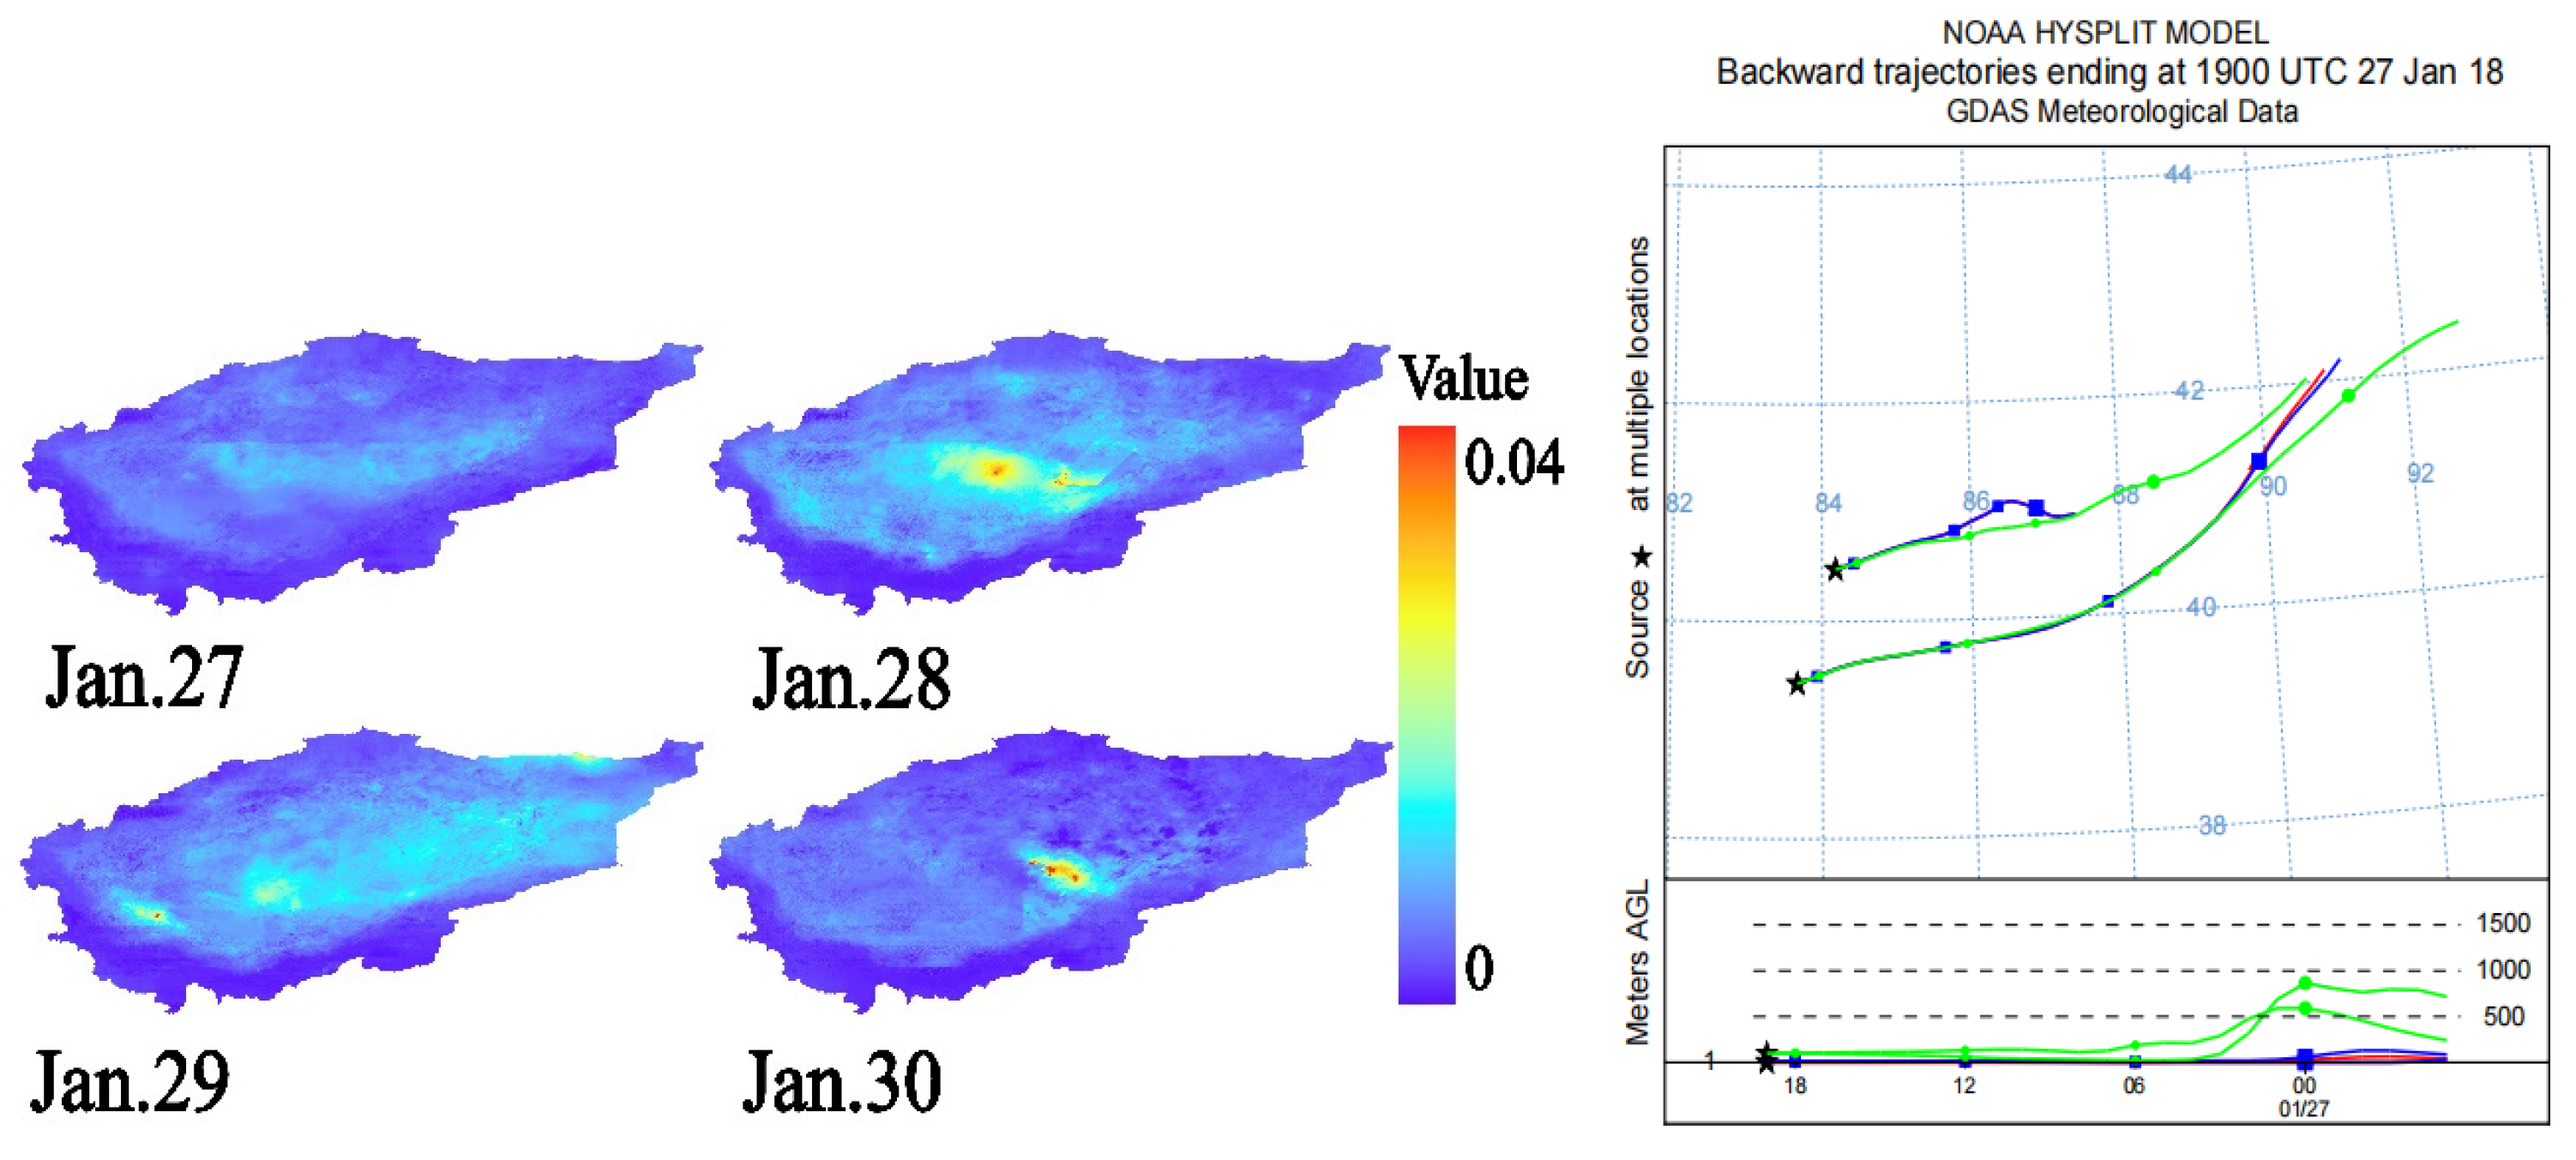
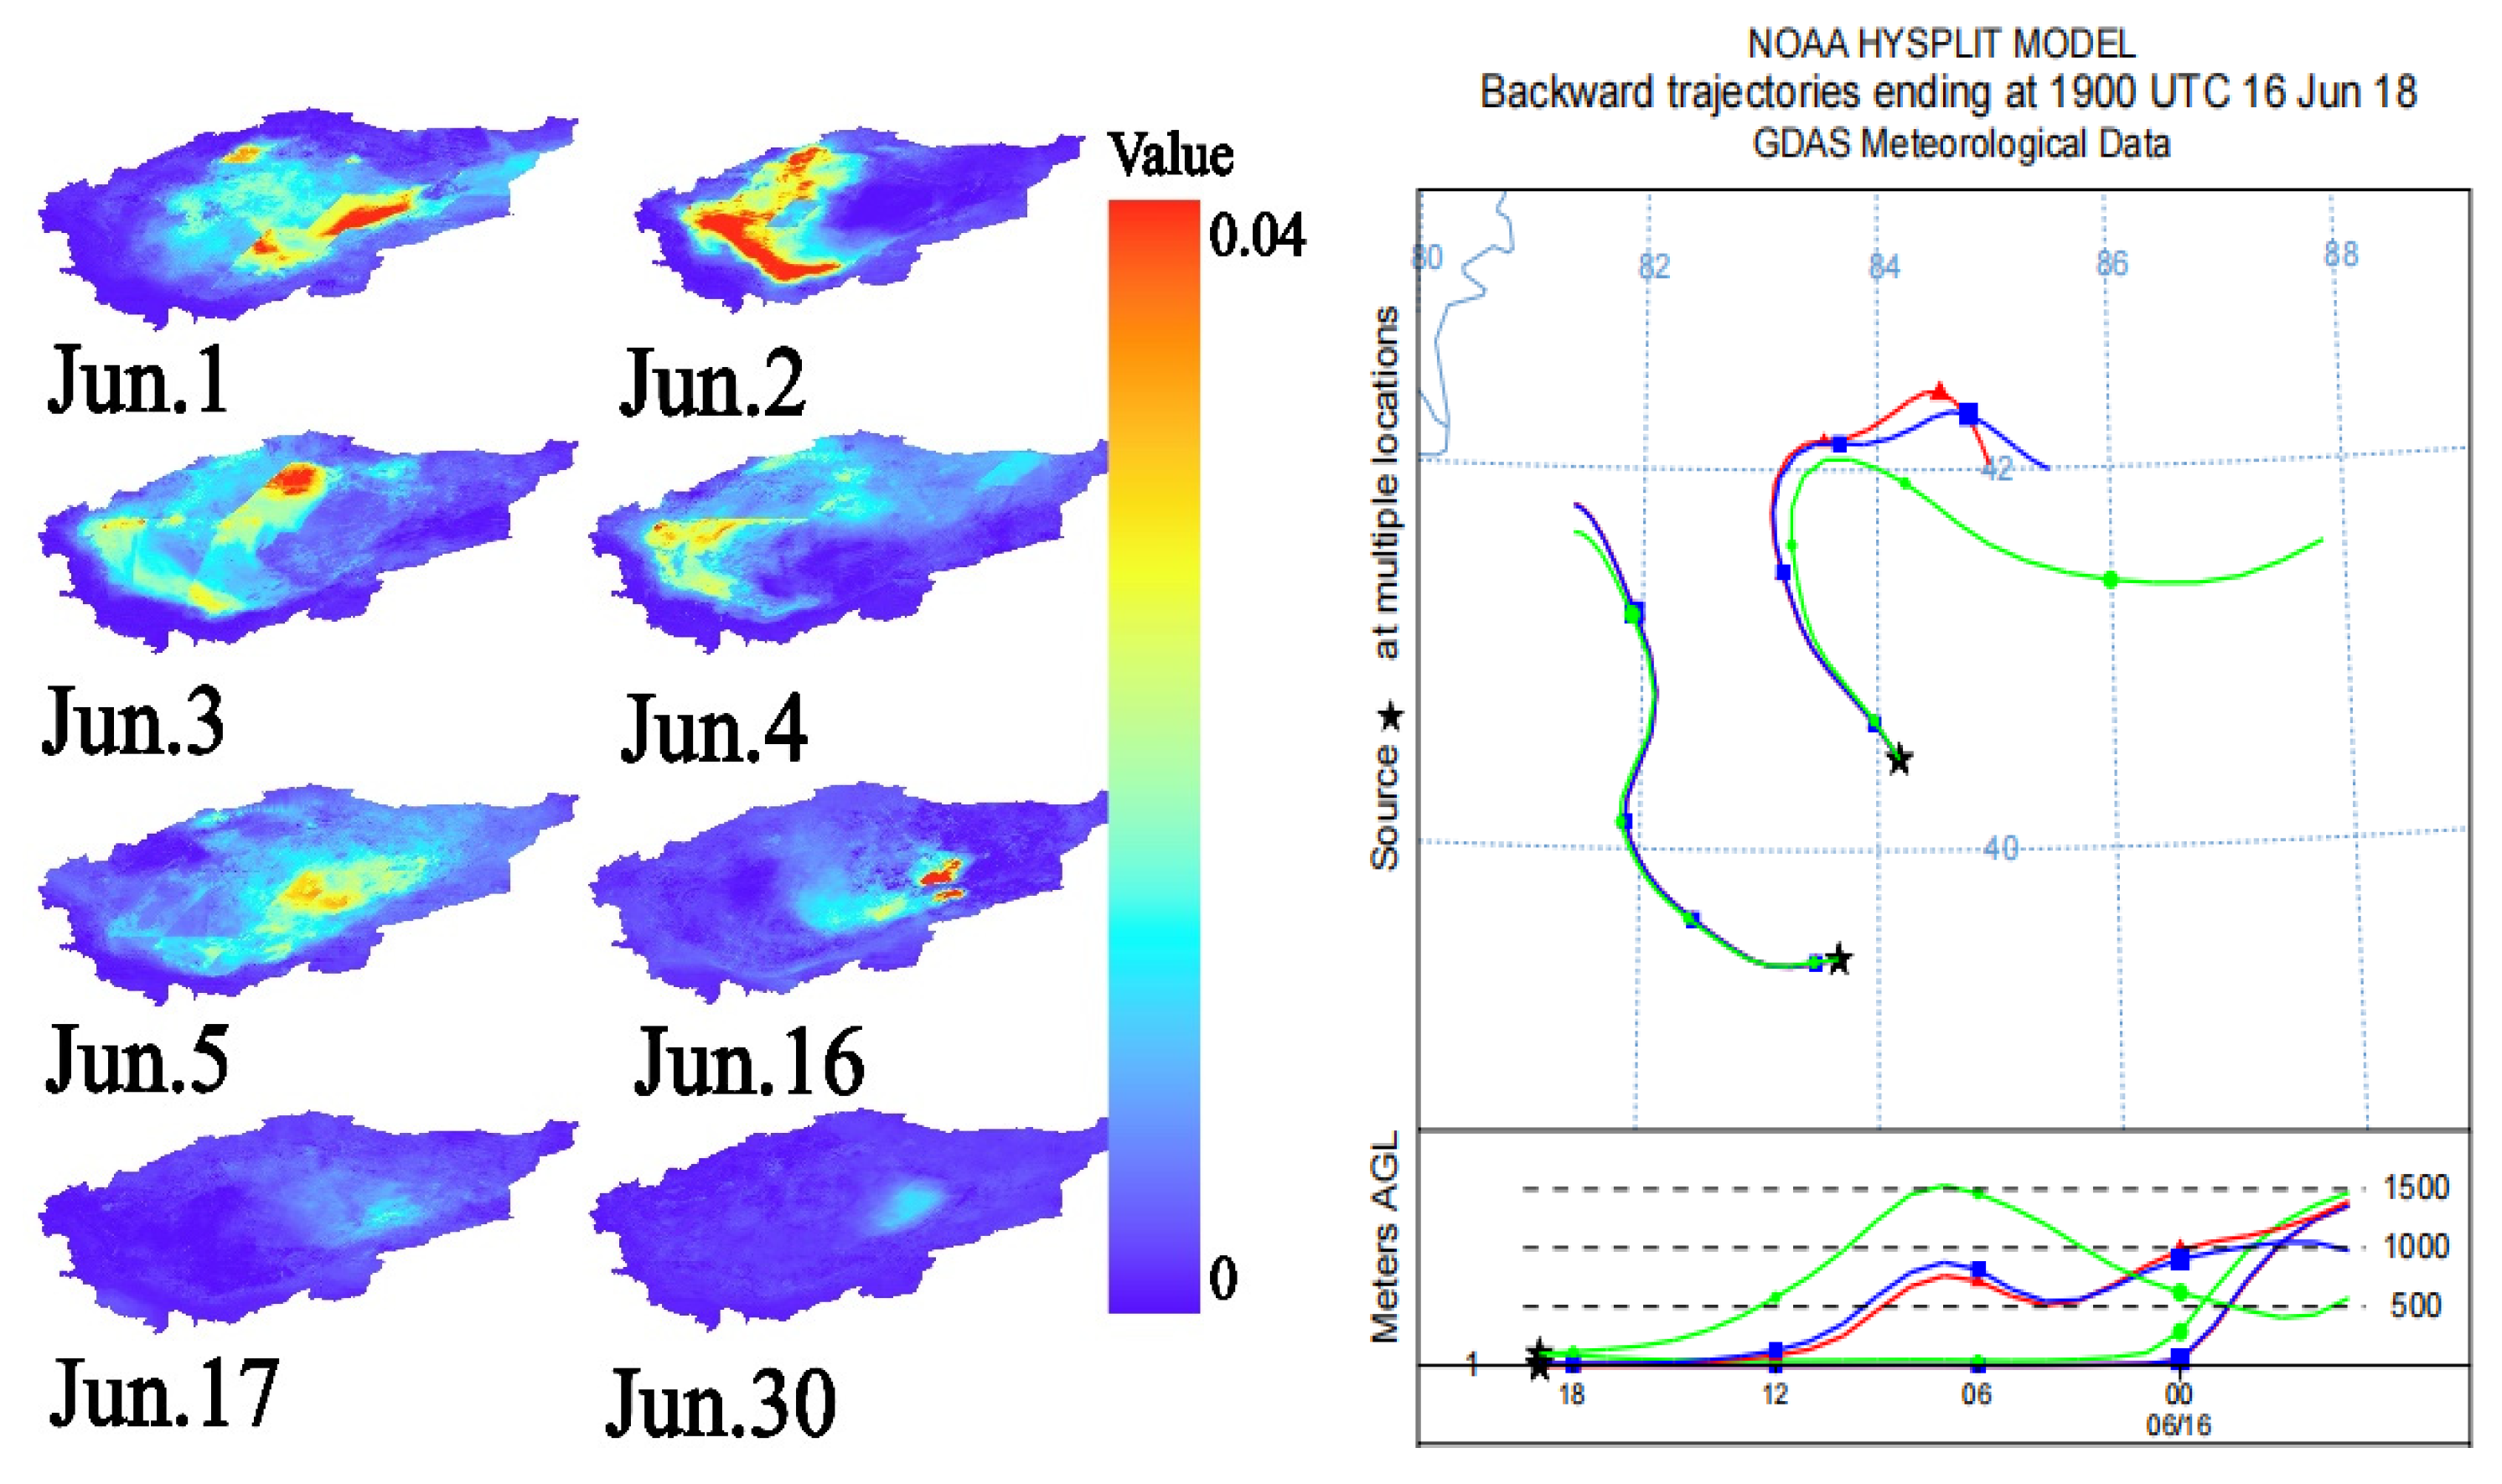
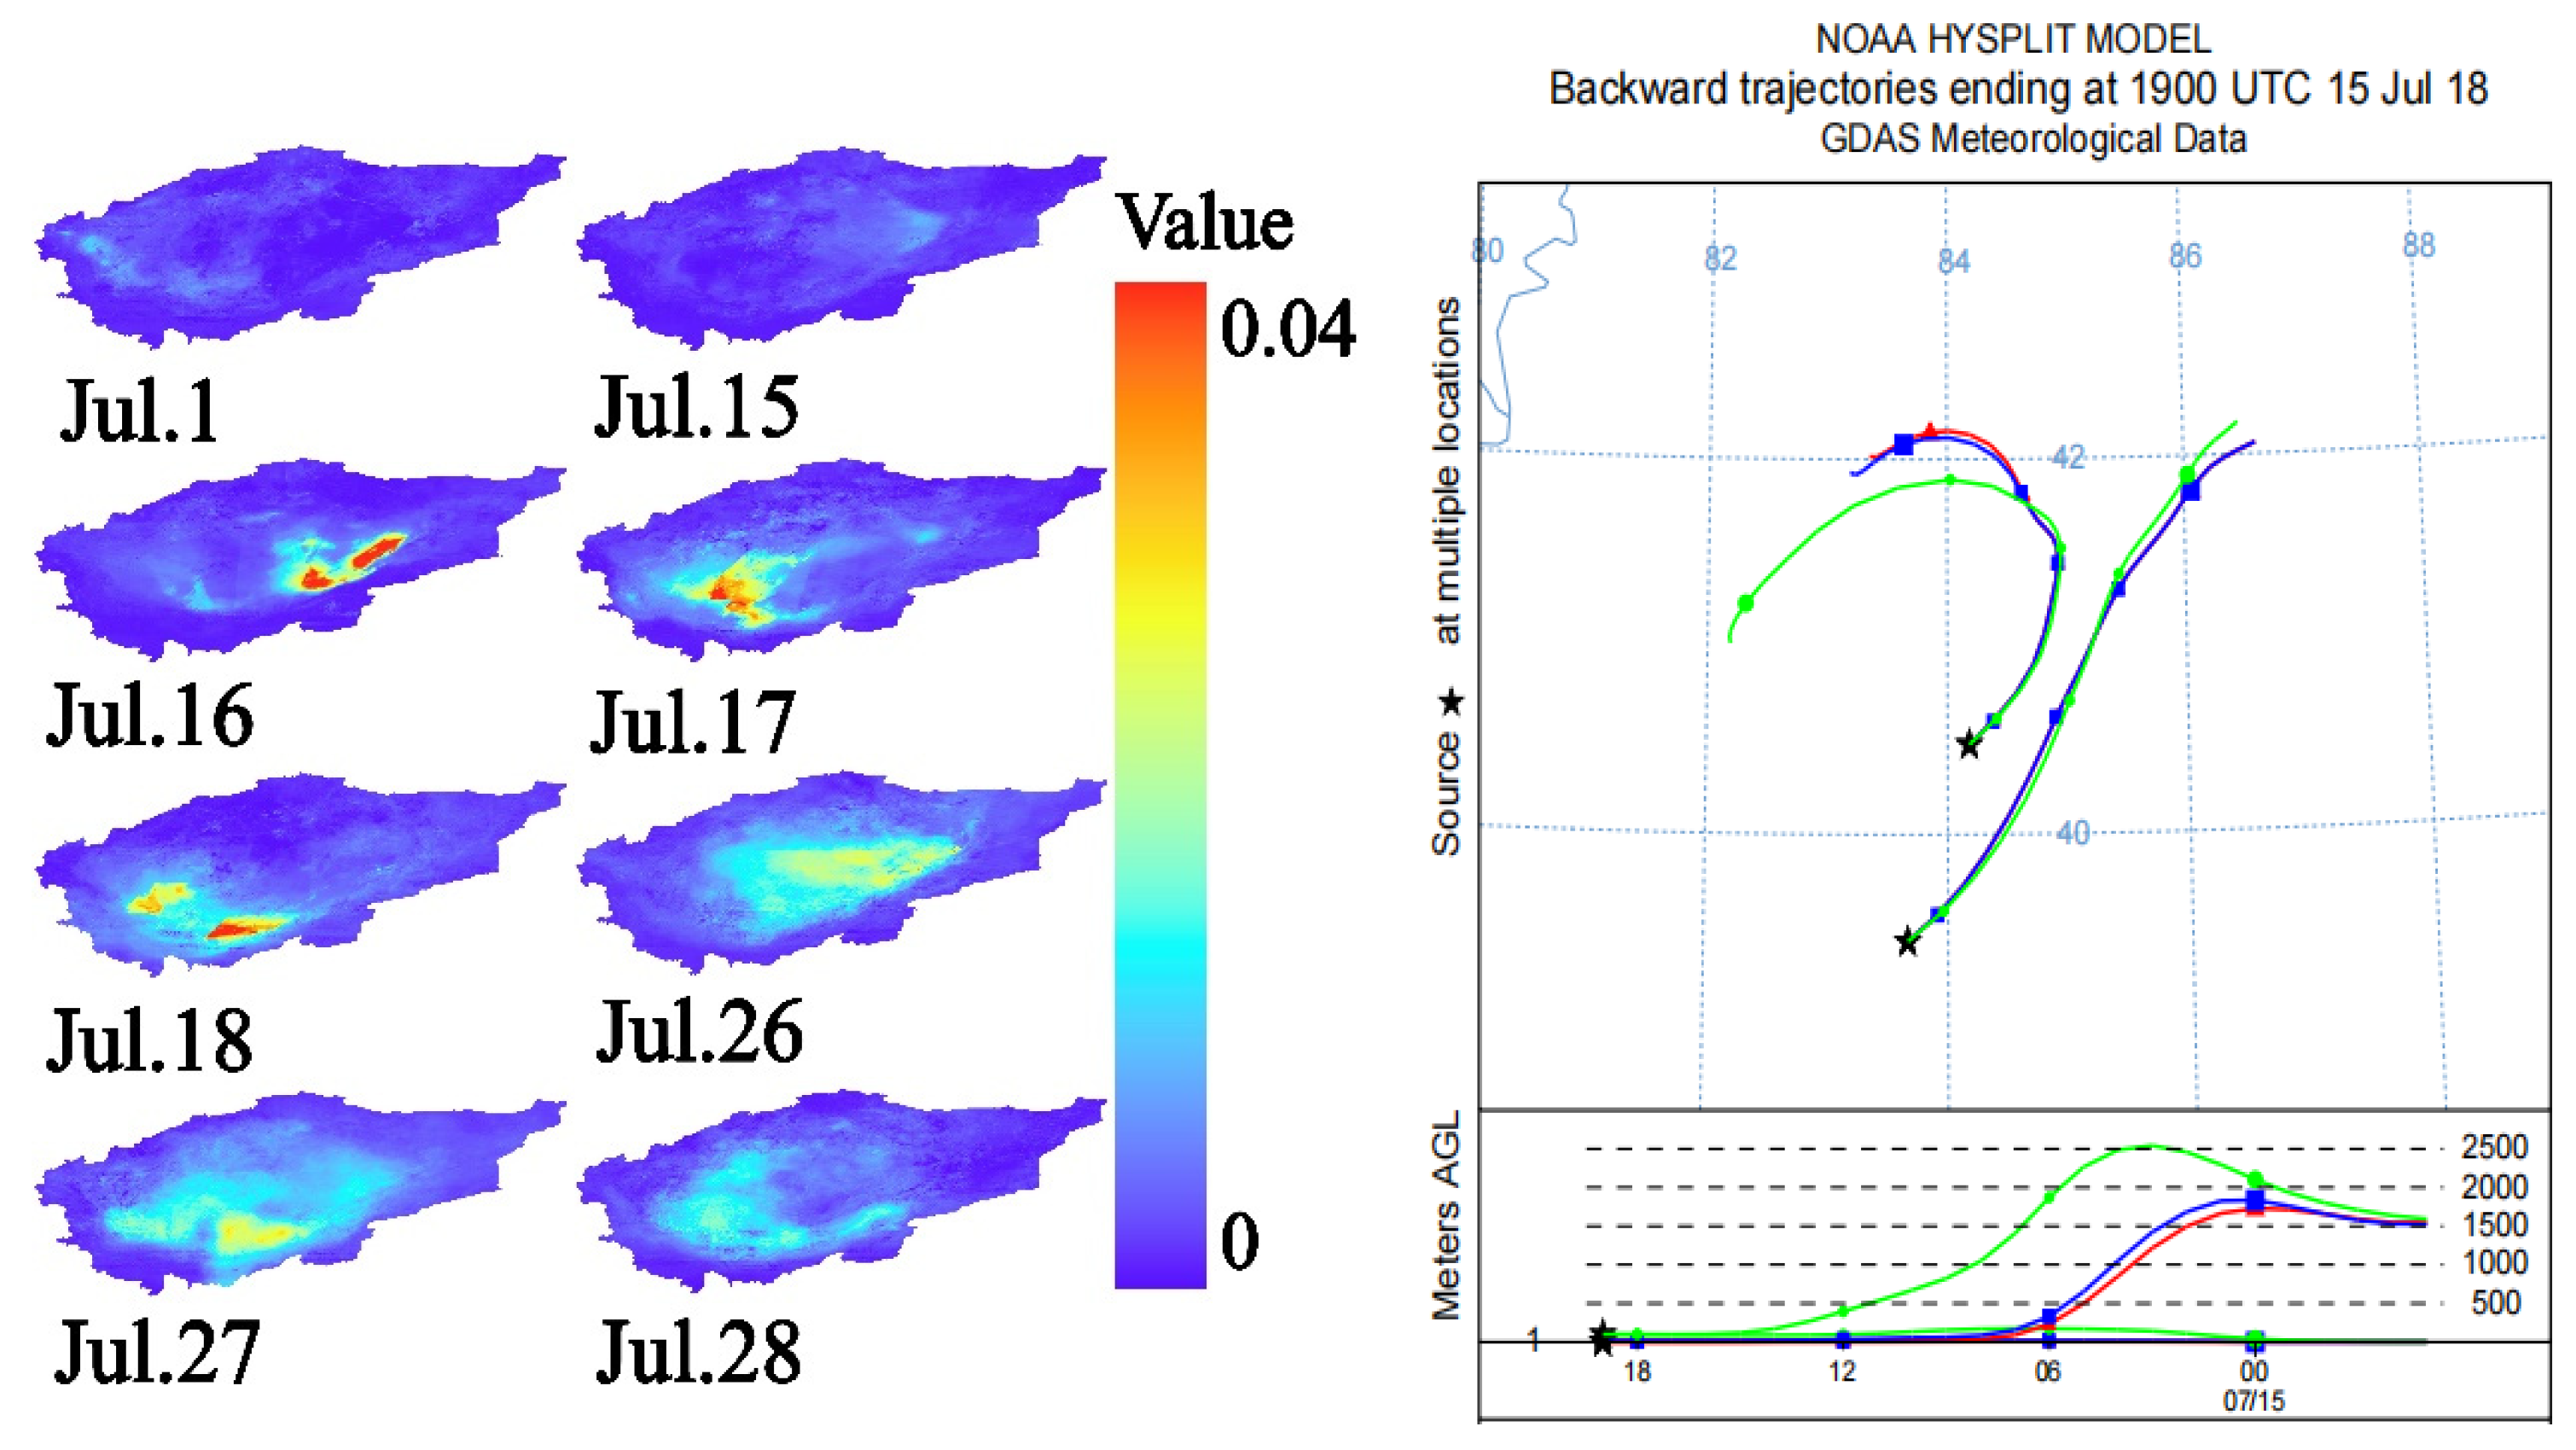
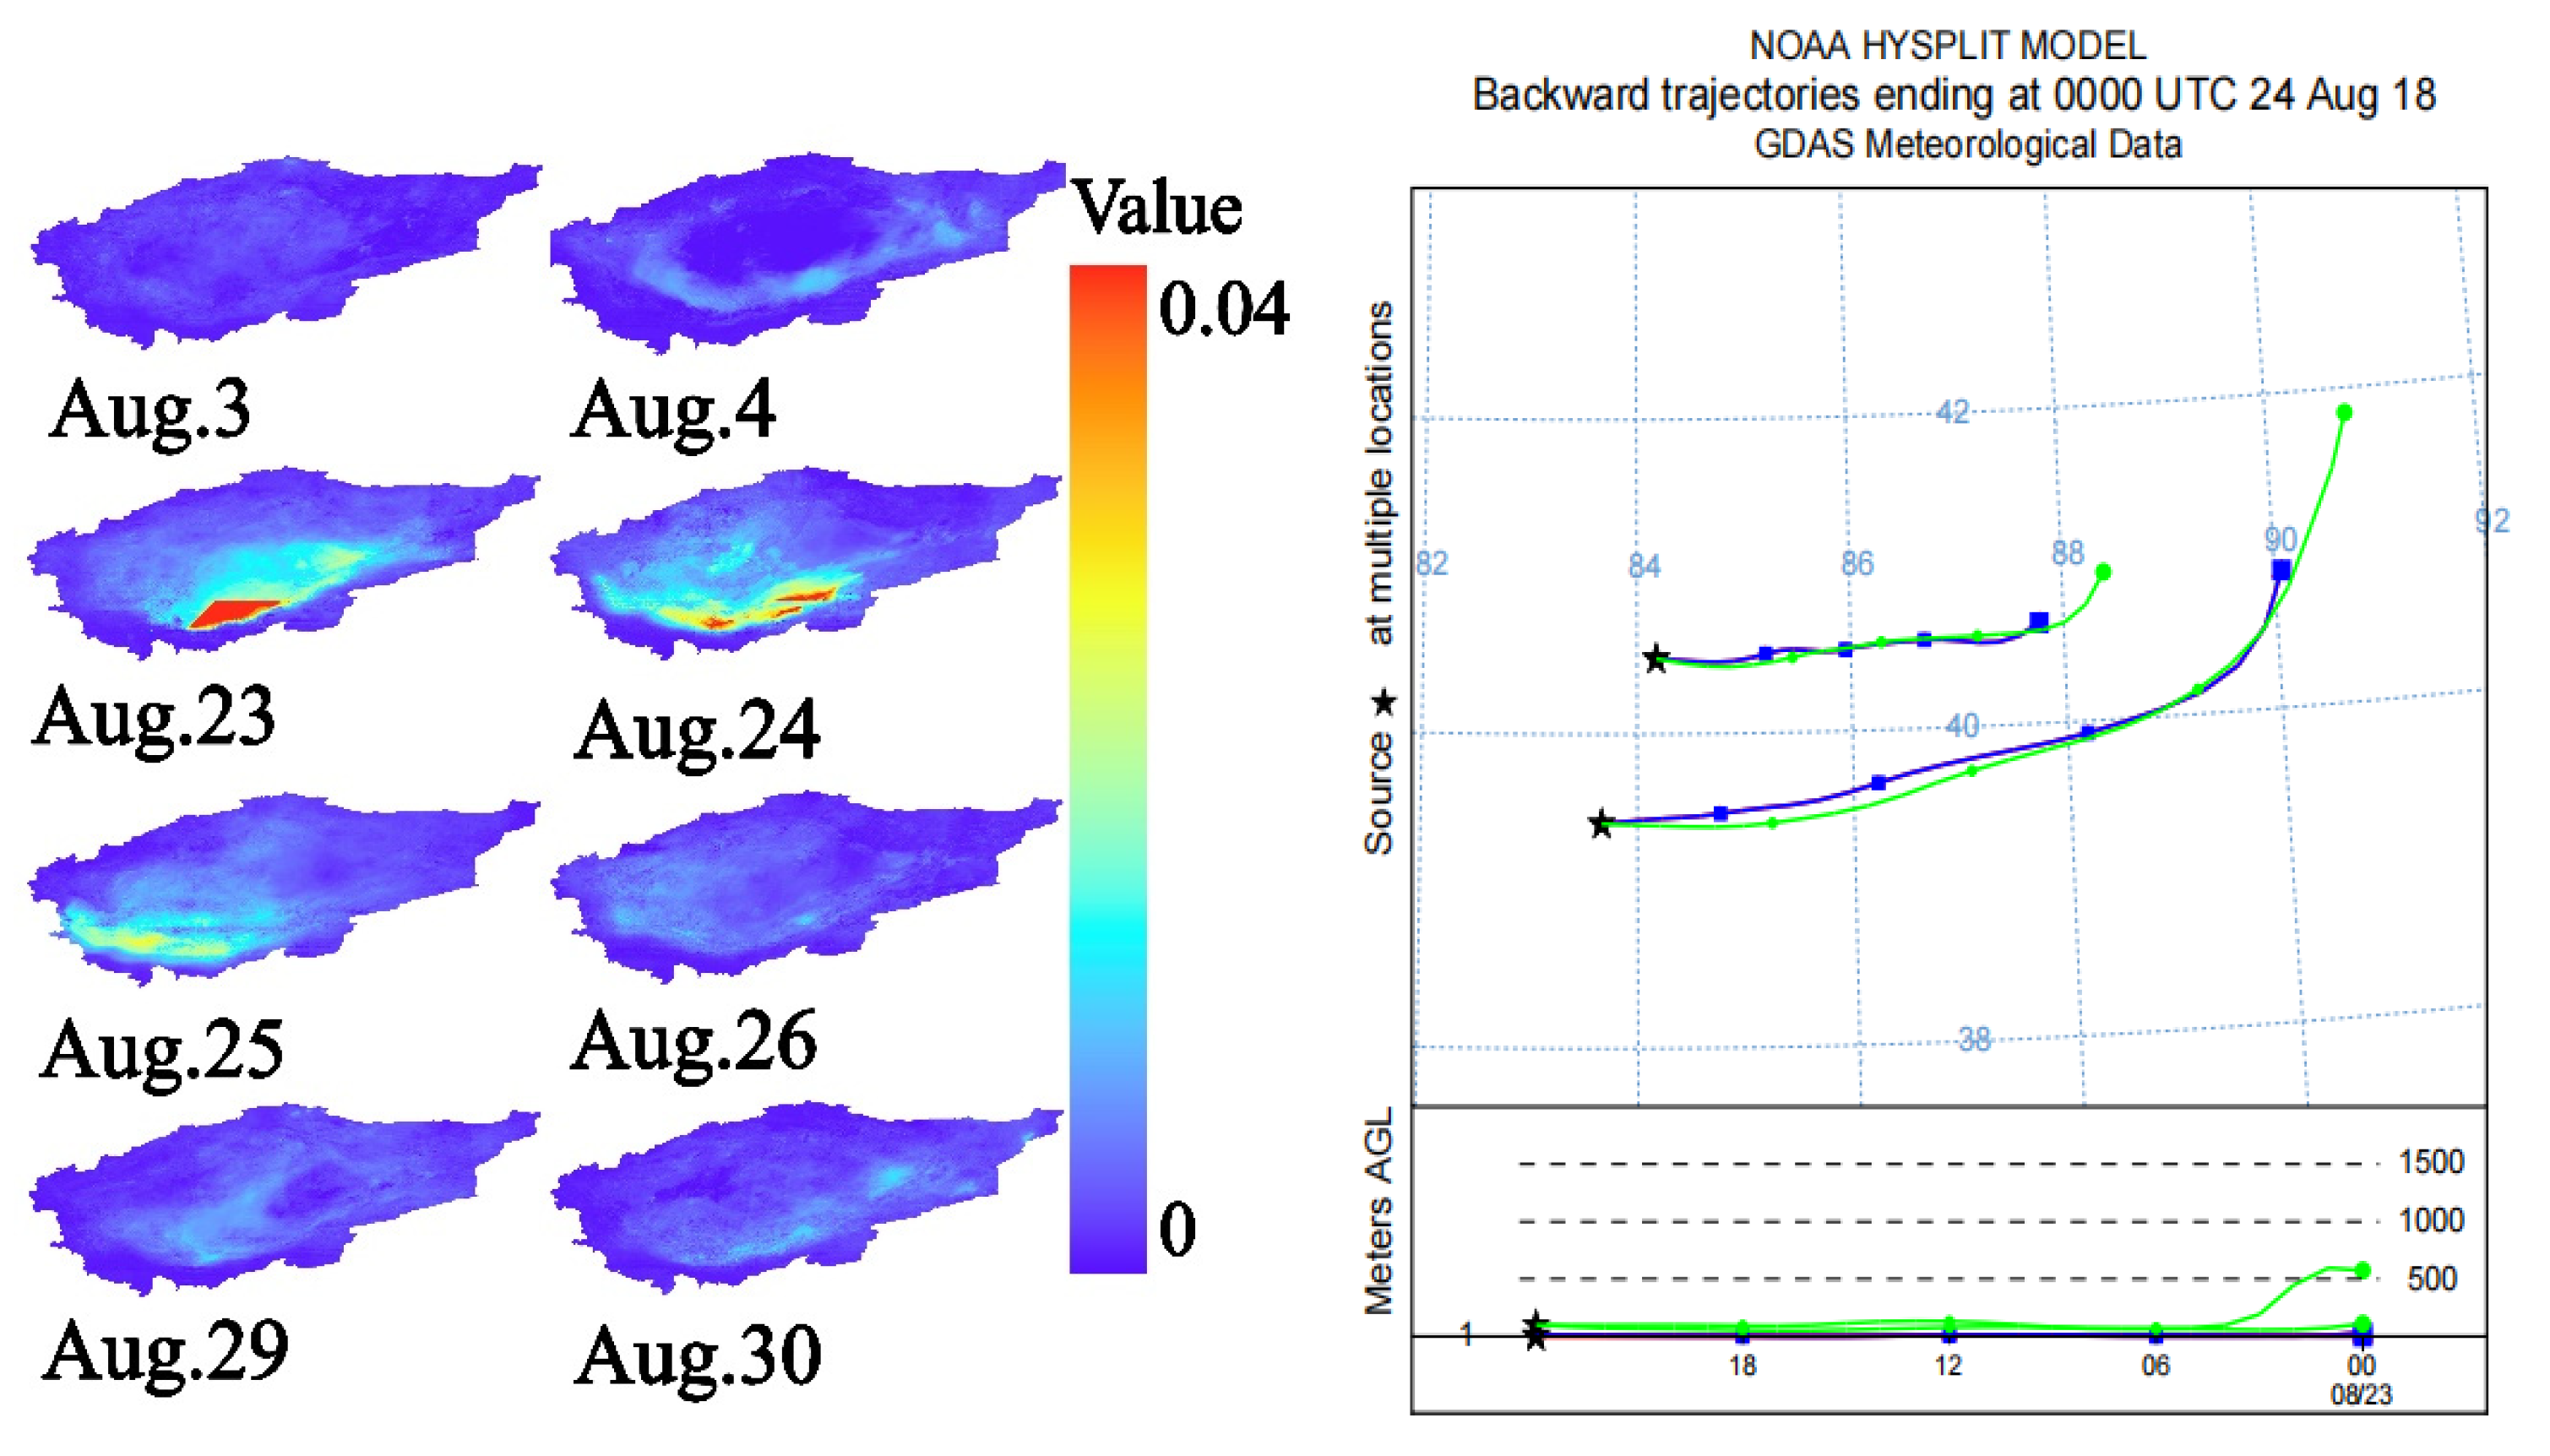
3.3.1. AOD Dust Storm Monitoring and Analysis of the Taklamakan Desert

In the previous section, we conducted an in-depth analysis of the variations in horizontal dust flux (Q) and vertical dust flux (F) at different altitudes. To further investigate the formation and evolution of dust storms and their relationship with remote sensing data, this section will examine the spatiotemporal variations of aerosol optical depth (AOD) over the Taklamakan Desert region from January to August 2018, as obtained from remote sensing satellites. These variations will be compared with ground-based dust storm data to assess the effectiveness of remote sensing technology in dust storm monitoring. To highlight seasonal differences, AOD remote sensing imagery for dust storm events during the spring (January–April) and summer (May–August) seasons will be presented (Figure 6 and Figure 7), enabling a better understanding of the impact of seasonal variations on dust storm monitoring.
The remote sensing image from 28 January (Figure 6) is consistent with the ground-based dust storm data, clearly indicating the occurrence of a dust storm event on that day and reflecting a significant increase in AOD, thereby validating the effectiveness of remote sensing monitoring. The monitoring for March is more complex, with ground data recording dust storm events on the 3rd, 17th, and 29th. Remote sensing observations slightly lagged for the first two events, while the monitoring results for the 29th fully aligned, demonstrating the high coverage capability of remote sensing. In June, ground-based observations recorded dust storms on the 16th and 30th. The remote sensing imagery on the 16th showed an increase in AOD, but the event on the 30th was not captured, possibly due to the dust storm not having fully dispersed at that time. The remote sensing images for April and May align well with the ground-based data, with the May images showing a slight time delay but still effectively reflecting dust storm activity. In July, the monitoring shows that dust storm events occurred on the 15th and 26th, with remote sensing imagery on the 16th indicating an increase in AOD and the monitoring on the 26th fully matching the ground observations. August monitoring is more complex, with dust storm events recorded on the 3rd, 23rd, 25th, and 29th. The AOD changes in the remote sensing images exhibited a time delay relative to the ground data, especially for the event on the 29th, which was not promptly captured and only showed a faint signal on the 31st. This suggests that while remote sensing technology can effectively monitor dust storms, there is a time lag during the early stages of a dust storm or when it has not yet fully dispersed.

3.3.2. Analysis of the Relationship Between Dust Flux and Dust Storm Dispersion Process

As observed in Section 3.3.1, remote sensing monitoring exhibits a delayed response. Therefore, in this section, typical aerosol optical depth (AOD) remote sensing images of dust storm dispersion processes from March to May 2018 are selected (see Figure 8, Figure 9 and Figure 10), providing important context and support for the analysis presented in Figure 11, Figure 12 and Figure 13.
As shown in Figure 11 and Figure 12, in the Xiaotang (XT) region, the vertical dust flux (F) at a height of 5 m exhibits the closest relationship with aerosol optical depth (AOD), with the peak values of F generally corresponding to the peaks of AOD. This suggests that the dust flux at this height contributes most significantly to AOD. Moreover, there is an observed time lag of approximately 24 to 72 h between F and AOD, where the peak of F typically precedes the peak of AOD. This reflects the process whereby dust particles from the surface require a certain period for uplift and atmospheric dispersion before impacting the AOD observed by remote sensing. However, combined with the results of Pearson correlation and cross-correlation analysis, the correlation coefficients between F and AOD at different heights (5 m, 10 m, 24 m) are generally low (maximum around −0.4) and the correlation did not reach statistical significance (all p-values greater than 0.05), with similarly weak correlations at lags of 1 to 2 days. This indicates that although there is a physically reasonable time-lag effect, the direct linear relationship between F and AOD is weak, which may be attributed to factors such as the short observation period, complex meteorological conditions, and the influence of multiple types of aerosols on AOD. During dust storm events, the vertical dust flux at different altitudes plays an important role in the distribution of particulate matter concentrations and indirectly affects the spatial distribution of AOD in remote sensing imagery through a time-lagged effect. In contrast, in the Tazhong (TZ) region, the relationship between F and AOD is more complex [63]. This complexity may be linked to secondary dust sources at the 40-m height (Figure 13). The secondary sand source is lifted again under specific meteorological conditions and mixed into the atmosphere, significantly increasing the concentration of sand and dust at a height of 40 m, thereby affecting the complex relationship between F and AOD. In the TZ area, the peak F-value at a height of 40 m coincides well with the peak AOD, indicating that the secondary sand source at this height has a significant and complex impact on AOD.

4. Discussion

To comprehensively demonstrate the diffusion characteristics of sandstorms in different seasons, this section selected remote sensing images from January, June, July, and August 2018 (Figure 14, Figure 15, Figure 16 and Figure 17). By comparing remote sensing images and backward trajectory maps at different time periods, combined with ground monitoring data, we can deeply analyze the diffusion direction, intensity, and correlation with meteorological conditions of sandstorms, providing scientific basis for further research on the propagation mechanism of sandstorms and the improvement of monitoring technology.
The horizontal sand and dust flux at the XT site remained stable in January and February, indicating that the experimental conditions and environmental impact were relatively small; the TZ station shows significantly high values in certain altitude ranges, which may be related to climate events such as strong winds. More than 90% of dust weather events occur during the spring season (March to May) [72,73]. At the XT station, significant fluctuations in dust flux are observed in the lower layers (1 m to 32 m) between March and June, while the higher layers (32 m to 100 m) exhibit more stable conditions, indicating that dust is primarily concentrated in the lower layers. A similar pattern of fluctuation is also observed at the TZ station during the same period. Data from July and August show that the dust flux at both XT and TZ stations decreases with height, indicating a weakening of dust dispersion capacity. At the XT station, due to the flat terrain, the dust flux in the lower layers is significantly higher than in the upper layers, particularly during certain months, which increases the likelihood of dust storms. In contrast, the complex terrain at the TZ station results in smaller fluctuations in dust flux, suggesting that the terrain interferes with local wind speeds and the formation of vortices. A significant positive correlation was found between Q and D at the XT station (desert edge), while there was no significant correlation at the TZ station (desert center) [74], indicating that terrain differences have a significant impact on changes in sand and dust flux. As shown in Figure 4 and Figure 5, the vertical dust flux at the XT station decreases with height. During the spring and early summer, the dust flux increases significantly, especially under specific climatic conditions. The enhancement of wind speed during these periods facilitates the lifting and transport of dust particles. In summer, although the low-level flux fluctuates, it shows an overall downward trend, indicating an improvement in atmospheric quality. The seasonal differences in vertical sand and dust flux reflect the combined effects of meteorological, surface humidity, and human activities. Through the analysis of data from different seasons and altitudes, it is found that dust activity is most frequent in the spring, with significant fluctuations in vertical dust flux, while a decreasing trend is observed in the summer. As altitude increases, dust flux gradually diminishes, indicating that dust concentration in the atmosphere decreases with height. Future research should integrate meteorological observations and modeling to further explore the mechanisms of dust storm formation and propagation. Although remote sensing monitoring can effectively capture changes in AOD during dust storm events, it is subject to delays and missed detections. It is recommended to combine ground-based observations with remote sensing data, enhancing the monitoring frequency and accuracy for more reliable results.
There are significant differences in vertical dust flux across different seasons, with higher values in spring and summer and lower values in winter. These variations are influenced by meteorological conditions, surface humidity, and human activities. In the spring, dust storms are frequent and the flux exhibits large fluctuations, primarily due to climate change and enhanced wind speeds. In contrast, dust flux decreases in the summer, driven by intense sunlight and increased evaporation. As altitude increases, the dust flux decreases progressively with each layer, reflecting the combined effects of airflow and gravity [75]. The flux variations at the XT station reveal the dynamic characteristics of dust movement. Future studies should integrate more meteorological data and modeling to further investigate the mechanisms of dust storm formation and propagation. In terms of remote sensing monitoring, the 2018 data effectively captured the AOD variations during dust storm events, but it also exhibited delays and missed detections. It is recommended to increase the monitoring frequency and improve the technology to enhance accuracy and reduce such issues.
During the dust storm event on 28 January, remote sensing imagery indicated an increase in aerosol optical depth (AOD) components beginning on 27 January, 1 day prior to the event, with a notable daily expansion. The extent of this dispersion was relatively significant. Concurrently, elevated values of near-surface dust flux were observed at the XT and TZ monitoring stations. Furthermore, between June and August, we consistently observed that when the low-level (1–10 m) Q increased, the dispersion activities captured in the remote sensing imagery also intensified, as evidenced during the period from 15 to 18 July.
A study in 2017 investigated the vertical distribution of aerosol optical properties in the Aibi Lake Basin, analyzing the data collected during the spring dust storm period. The results indicated that the backscattering coefficient within the 0–2 km height range was relatively high, demonstrating strong scattering abilities, with a contribution rate of 30.24%. In contrast, at heights of 8–10 km, the scattering coefficient was at its weakest, accounting for only 12.41% [76]. As the height increased, the aerosol scattering capability gradually diminished. The backscattering coefficient within the 0–2 km height range is concentrated between 0.0015 and 0.0035 km−1·sr−1, whereas the range from 2–10 km is between 0.0008 and 0.0025 km−1·sr−1. This indicates that aerosol pollution during dust storms is primarily concentrated near the surface. In the early stages of a dust storm, if the aerosols have not reached a certain altitude, remote sensing monitoring may not be able to capture the relevant signals in a timely manner. Therefore, future research should place greater emphasis on the temporal delay and relationship between changes in near-surface flux and remote sensing data. By improving remote sensing technologies and increasing the frequency of ground observations, it will be possible to more accurately capture the dynamic variations of dust storm events. In addition, this study found a significant correlation between the vertical dust flux at a height of 5 m and aerosol optical depth (AOD), with a time delay of 24 to 72 h between the two. This finding provides new insights into understanding the impact of dust storms on atmospheric optical properties and offers important evidence for dust storm monitoring and early warning based on remote sensing data. Some studies have indicated that the temporal delay observed in remote sensing monitoring affects the timely capture of the development and changes of dust storms, resulting in a temporal misalignment between the monitoring results and actual climatic conditions [77].
Therefore, combining remote sensing monitoring with ground flux data is essential for conducting more comprehensive monitoring and analysis of dust storms over a broader area. This integration can not only effectively enhance the timeliness and accuracy of data but also provide a scientific basis for the early warning and management of dust storms, assisting relevant authorities in formulating more precise mitigation measures.
As shown in Figure 6, Figure 7, Figure 8, Figure 9, Figure 10, Figure 11, Figure 12, Figure 13, Figure 14, Figure 15, Figure 16 and Figure 17, through in-depth analysis of the monitoring data, we draw the following conclusions: the diffusion and distribution of dust storms are significantly influenced by the lower-layer dust flux. A study in 2010 demonstrated that near-surface turbulent flux is a key parameter in characterizing the interaction between the surface and the atmosphere, playing a crucial role in the transport of dust particles [77]. The backscattering trajectory maps indicate that the diffusion direction of the dust storm in the remote sensing imagery is consistent with the height of the backward trajectories, particularly when the low-level Q values are high. For instance, the backward trajectory map from 3 March shows that the wind is blowing from the north toward the southwestern direction of the Taklamakan Desert, which aligns perfectly with the diffusion direction observed in the remote sensing imagery. This pattern has been validated in other dust storm events as well, indicating that changes in the lower-layer dust flux are a crucial driving factor for the diffusion of dust storms observed through remote sensing. This consistency not only validates the effectiveness of the backward scattering trajectory method but also provides essential data support for dust storm monitoring and prediction. Through this analysis, a more accurate understanding of the dust storm diffusion mechanisms can be achieved, providing a reliable basis for further research on its impacts. This approach enhances our ability to predict and mitigate the effects of dust storms on both the environment and human activities.

5. Conclusions

The horizontal sand and dust flux at the lower levels (1 to 10 m) of the XT station is significantly higher than that at the upper levels (24 to 100 m), especially during the dust storm events in January, March, and April, where the flux at 1 m primarily ranges between 15 and 18 kg/m2, indicating that the flat terrain promotes the accumulation of sand and dust at lower levels.
The horizontal sand and dust flux at TZ station is relatively stable at various heights, with low-level (1 to 8 m) flux maintained at 4–8 kg/m2 and significantly reduced in April and July, reflecting the influence of terrain undulation on the redistribution of dust sources.
At the XT station, the vertical dust flux decreases with height, with the flux in the lower layers significantly higher than in the upper layers. In January and March, the flux values were 1.53 kg/m2 and 12.11 kg/m2, respectively. On 7 May, the flux peaked at 66.3 kg/m2 and then gradually decreased, reflecting seasonal variations in dust activity. At the TZ station, the vertical dust flux rapidly increases in the lower layers (1–40 m) before reaching its peak, and then gradually decreases. On 27 January and 3 March, the peak values occurred at 10 m, while on 2 April and 7 May, the peaks were observed at 40 m and 20 m, respectively. Overall, the flux shows significant seasonal fluctuations.
Remote sensing technology effectively monitors dust storms, although there is a temporal lag, particularly during the early development stages or incomplete diffusion phases. Overall, AOD retrieved from remote sensing can capture dust changes, supporting its monitoring reliability. In the XT region, although the Pearson correlation between F and AOD at different heights is generally low and statistically insignificant, the dust flux at 5 m still shows the most notable contribution to AOD, with F peaks typically preceding AOD peaks by 24 to 72 h. This highlights the importance of near-surface dust flux in influencing AOD via atmospheric transport and diffusion. In the TZ region, the relationship between F and AOD is more complex, potentially due to a secondary dust source at 40 m. Under certain meteorological conditions, this source can be re-entrained into the atmosphere, enhancing dust concentrations at this height and contributing to a secondary AOD peak, reflecting a complex vertical coupling mechanism.
The diffusion direction of dust storms is generally consistent with the direction of the backward trajectories. When the horizontal dust flux (Q) in the lower layers reaches high values, the diffusion direction observed in the remote sensing imagery closely matches the direction of the backward trajectories. This result provides important theoretical support for understanding the propagation mechanisms of dust storms and their remote sensing monitoring.

Author Contributions

M.M.: Conceptualization, writing—original draft, formal analysis. W.H.: methodology, supervision, writing—review and editing. Y.L.: validation. Y.W.: investigation, data curation. F.Y.: experimental design, supervision. C.Z., X.Y. and A.M.: investigation, data curation. All authors have read and agreed to the published version of the manuscript.

Funding

This research was funded by the Tianshan Talent Project of Xinjiang (Grant No. 2023TSYCCX0075), China Meteorological Administration Youth Innovation Team Project (CMA2024QN13), National Natural Science Foundation of China (Grant No. 42207134), and the Xinjiang Science and Technology Innovation Team (Tianshan Innovation Team) Project (2022TSYCTD0007).

Data Availability Statement

The 1 km resolution daily seamless aerosol optical depth (AOD) dataset used in this study was obtained from the National Earth System Science Data Center (https://www.geodata.cn). The dust horizontal transport flux (Q) used in this study was provided by the Taklamakan Desert Meteorological National Field Science Observation and Research Station in Xinjiang. Since the ground observation data is site specific and not yet publicly available, it can be reasonably requested from the corresponding author.

Acknowledgments

We acknowledge the National Earth System Science Data Center (http://www.geodata.cn) and the Institute of Desert Meteorology (China Meteorological Administration, Urumqi) for providing critical datasets. We also thank the College of Geography and Remote Sensing Science, Xinjiang University (Urumqi) for technical assistance. Since the ground observation data is site specific and not yet publicly available, it can be reasonably requested from the corresponding author.

Conflicts of Interest

The authors declare no conflicts of interest.

References

  1. Goudie, A.S. Dust Storms: Recent Developments. J. Environ. Manag. 2009, 90, 89–94. [Google Scholar] [CrossRef] [PubMed]
  2. Gunaseelan, I.; Bhaskar, B.V.; Muthuchelian, K. The Effect of Aerosol Optical Depth on Rainfall with Reference to Meteorology over Metro Cities in India. Environ. Sci. Pollut. Res. 2014, 21, 8188–8197. [Google Scholar] [CrossRef] [PubMed]
  3. IPCC. Climate Change 2021: The Physical Science Basis. Contribution of Working Group I to the Sixth Assessment Report of the Intergovernmental Panel on Climate Change; Cambridge University Press: Cambridge, UK, 2021. [Google Scholar]
  4. Cui, C.; Li, X. Interannual Variations of Dust Events in the Xinjiang Region. In Proceedings of the SPIE Conference on Ecosystems Dynamics, Ecosystem-Society Interactions, and Remote Sensing Applica-tions for Semi-Arid and Arid Land, Hangzhou, China, 23–27 October 2002; SPIE: Bellingham, WA, USA, 2003; Volume 4890, pp. 320–327. [Google Scholar]
  5. Moore, T.R.; Matthews, H.D.; Simmons, C.; Leduc, M. Quantifying Changes in Extreme Weather Events in Response to Warmer Global Temperature. Atmos.-Ocean. 2015, 53, 412–425. [Google Scholar] [CrossRef]
  6. Gonzalez, L.; Briottet, X. North Africa and Saudi Arabia Day/Night Sandstorm Survey (NASCube). Remote Sens. 2017, 9, 896. [Google Scholar] [CrossRef]
  7. Li, X.; Zhang, H. Seasonal Variations in Dust Concentration and Dust Emission Observed over Horqin Sandy Land Area in China from December 2010 to November 2011. Atmos. Environ. 2012, 61, 56–65. [Google Scholar] [CrossRef]
  8. Su, Q.; Sun, L.; Yang, Y.; Zhou, X.; Li, R.; Jia, S. Dynamic Monitoring of the Strong Sandstorm Migration in Northern and Northwestern China via Satellite Data. Aerosol Air Qual. Res. 2017, 17, 3244–3252. [Google Scholar] [CrossRef]
  9. Jin, L.; He, Q.; Li, Z.; Deng, M.; Abbas, A. Variation Characteristics of Dust in the Taklimakan Desert. Nat. Hazards 2024, 120, 2129–2153. [Google Scholar] [CrossRef]
  10. Aili, A.; Oanh, N.T.K.; Abuduwaili, J. Variation Trends of Dust Storms in Relation to Meteorological Conditions and Anthropogenic Impacts in the Northeast Edge of the Taklimakan Desert, China. Open J. Air Pollut. 2016, 5, 127–137. [Google Scholar] [CrossRef]
  11. Chen, S.; Huang, J.; Kang, L.; Wang, H.; Ma, X.; He, Y.; Yuan, T.; Yang, B.; Huang, Z.; Zhang, G. Emission, Transport, and Radiative Effects of Mineral Dust from the Taklimakan and Gobi Deserts: Comparison of Measurements and Model Results. Atmos. Chem. Phys. 2017, 17, 2401–2421. [Google Scholar] [CrossRef]
  12. Jiang, H.; Huang, N.; Zhu, Y. Analysis of Wind-Blown Sand Movement over Transverse Dunes. Sci. Rep. 2014, 4, 7114. [Google Scholar] [CrossRef]
  13. Rasmussen, K.R.; Mikkelsen, H.E. On the Efficiency of Vertical Array Aeolian Field Traps. Sedimentology 1998, 45, 789–800. [Google Scholar] [CrossRef]
  14. Marticorena, B.; Bergametti, G. Modeling the Atmospheric Dust Cycle: 1. Design of a Soil-Derived Dust Emission Scheme. J. Geophys. Res. Atmos. 1995, 100, 16415–16430. [Google Scholar] [CrossRef]
  15. Shao, Y.; Raupach, M.; Leys, J. A Model for Predicting Aeolian Sand Drift and Dust Entrainment on Scales from Paddock to Region. Soil Res. 1996, 34, 309–342. [Google Scholar] [CrossRef]
  16. Lu, H.; Shao, Y. A New Model for Dust Emission by Saltation Bombardment. J. Geophys. Res. Atmos. 1999, 104, 16827–16842. [Google Scholar] [CrossRef]
  17. Ginoux, P.; Chin, M.; Tegen, I.; Prospero, J.M.; Holben, B.; Dubovik, O.; Lin, S.-J. Sources and Distributions of Dust Aerosols Simulated with the GOCART Model. J. Geophys. Res. Atmos. 2001, 106, 20255–20273. [Google Scholar] [CrossRef]
  18. Shao, Y. Physics and Modelling of Wind Erosion; Springer: Dordrecht, The Netherlands, 2009; Volume 37, ISBN 978-1-4020-8894-0. [Google Scholar]
  19. Bagnold, R.A. The Physics of Blown Sand and Desert Dunes; Methuen: London, UK, 1941. [Google Scholar]
  20. Kawamura, R. Study on Sand Movement by Wind; Reports of the Institute of Science and Technology; University of Tokyo: Tokyo, Japan, 1972; Volume 5, pp. 95–112. [Google Scholar]
  21. Owen, P.R. Saltation of Uniform Grains in Air. J. Fluid Mech. 1964, 20, 225–242. [Google Scholar] [CrossRef]
  22. White, B.R. Soil Transport by Winds on Mars. J. Geophys. Res. Solid Earth 1979, 84, 4643–4651. [Google Scholar] [CrossRef]
  23. Gillette, D.A.; Passi, R. Modeling Dust Emission Caused by Wind Erosion. J. Geophys. Res. Atmos. 1988, 93, 14233–14242. [Google Scholar] [CrossRef]
  24. Sørensen, M. An Analytic Model of Wind-Blown Sand Transport. In Aeolian Grain Transport; Springer: Vienna, Austria, 1991; pp. 67–81. [Google Scholar] [CrossRef]
  25. Park, S.-U.; Park, M.-S.; Chun, Y. A Parameterization of Dust Concentration (PM10) of Dust Events Observed at Erdene in Mongolia Using the Monitored Tower Data. Sci. Total Environ. 2011, 409, 2951–2958. [Google Scholar] [CrossRef]
  26. Iversen, J.D.; White, B.R. Saltation Threshold on Earth, Mars and Venus. Sedimentology 1982, 29, 111–119. [Google Scholar] [CrossRef]
  27. Swet, N.; Katra, I. Reduction in Soil Aggregation in Response to Dust Emission Processes. Geomorphology 2016, 268, 177–183. [Google Scholar] [CrossRef]
  28. Huang, J.; Wang, T.; Wang, W.; Li, Z.; Yan, H. Climate Effects of Dust Aerosols over East Asian Arid and Semi-Arid Regions. J. Geophys. Res. Atmos. 2014, 119, 11398–11416. [Google Scholar] [CrossRef]
  29. Huang, Z.; Huang, J.; Bi, J.; Wang, G.; Wang, W.; Fu, Q.; Li, Z.; Tsay, S.-C.; Shi, J. Dust Aerosol Vertical Structure Measurements Using Three MPL Lidars during 2008 China-U.S. Joint Dust Field Experiment. J. Geophys. Res. Atmos. 2010, 115, D00K12. [Google Scholar] [CrossRef]
  30. Lakshmi, N.B.; Nair, V.S.; Suresh Babu, S. Vertical Structure of Aerosols and Mineral Dust Over the Bay of Bengal from Multisatellite Observations. J. Geophys. Res. Atmos. 2017, 122, 12845–12861. [Google Scholar] [CrossRef]
  31. Kang, Y.; Yang, X.; Xiao, R.; He, Q.; Huo, W.; Yang, F.; Ai, L. Vertical Distribution Characteristics of Dust Flux Based on High-Resolution Observations. J. Earth Environ. 2020, 11, 255–264. [Google Scholar] [CrossRef]
  32. Offer, Z.Y.; Goossens, D. Thirteen Years of Aeolian Dust Dynamics in a Desert Region (Negev Desert, Israel): Analysis of Horizontal and Vertical Dust Flux, Vertical Dust Distribution and Dust Grain Size. J. Arid. Environ. 2004, 57, 117–140. [Google Scholar] [CrossRef]
  33. Attiya, A.A.; Jones, B.G. Investigation of Severe Dust Storms Over Baghdad City by Using Remote Sensing Measurements and Ground Data. IOP Conf. Ser. Earth Environ. Sci. 2023, 1215, 012004. [Google Scholar] [CrossRef]
  34. Heydari Alamdarloo, E.; Khosravi, H.; Abolhasani, A. Chapter 5—Dust-Source Monitoring Using Remote Sensing Techniques. In Remote Sensing of Soil and Land Surface Processes; Melesse, A.M., Rahmati, O., Khosravi, K., Petropoulos, G.P., Eds.; Elsevier: Amsterdam, The Netherlands, 2024; pp. 99–111. ISBN 978-0-443-15341-9. [Google Scholar]
  35. Castellanos, P.; Colarco, P.; Espinosa, W.R.; Guzewich, S.D.; Levy, R.C.; Miller, R.L.; Chin, M.; Kahn, R.A.; Kemppinen, O.; Moosmüller, H.; et al. Mineral Dust Optical Properties for Remote Sensing and Global Modeling: A Review. Remote Sens. Environ. 2024, 303, 113982. [Google Scholar] [CrossRef]
  36. Ostad-Ali-Askari, K.; Rahimi, N.; Ashrafi, P.; Gholami, H.; Ashrafi, A.-H.; Dehghan, S. Assessment of Dust Event by RS, GIS, MODIS and Statistical Methods Among Satellite Images. Am. J. Eng. Appl. Sci. 2021, 14, 198–213. [Google Scholar] [CrossRef]
  37. Si, Y.; Yang, F.; Liu, Z. Sand Dust Image Visibility Enhancement Algorithm via Fusion Strategy. Sci. Rep. 2022, 12, 13226. [Google Scholar] [CrossRef]
  38. Meng, R.; Meng, Z.; Li, H.; Cai, J.; Qin, L. Changes in Landscape Ecological Risk in the Beijing-Tianjin Sandstorm Source Control Project Area from a Spatiotemporal Perspective. Ecol. Indic. 2024, 167, 112569. [Google Scholar] [CrossRef]
  39. Gui, K.; Yao, W.; Che, H.; An, L.; Zheng, Y.; Li, L.; Zhao, H.; Zhang, L.; Zhong, J.; Wang, Y.; et al. Record-Breaking Dust Loading during Two Mega Dust Storm Events over Northern China in March 2021: Aerosol Optical and Radiative Properties and Meteorological Drivers. Atmos. Chem. Phys. 2022, 22, 7905–7932. [Google Scholar] [CrossRef]
  40. Xie, Y.; Zhang, W.; Qu, J. Detection of Asian Dust Storm Using MODIS Measurements. Remote Sens. 2017, 9, 869. [Google Scholar] [CrossRef]
  41. Kaskaoutis, D.G.; Prasad, A.K.; Kosmopoulos, P.G.; Sinha, P.R.; Kharol, S.K.; Gupta, P.; El-Askary, H.M.; Kafatos, M. Synergistic Use of Remote Sensing and Modeling for Tracing Dust Storms in the Mediterranean. Adv. Meteorol. 2012, 2012, 861026. [Google Scholar] [CrossRef]
  42. Attiya, A.A.; Jones, B.G. An Extensive Dust Storm Impact on Air Quality on 22 November 2018 in Sydney, Australia, Using Satellite Remote Sensing and Ground Data. Environ. Monit. Assess. 2022, 194, 432. [Google Scholar] [CrossRef]
  43. Szkop, A.; Pietruczuk, A. Analysis of Aerosol Transport over Southern Poland in August 2015 Based on a Synergy of Remote Sensing and Backward Trajectory Techniques. J. Appl. Remote Sens. 2017, 11, 016039. [Google Scholar] [CrossRef]
  44. Sowden, M.; Mueller, U.; Blake, D. Review of Surface Particulate Monitoring of Dust Events Using Geostationary Satellite Remote Sensing. Atmos. Environ. 2018, 183, 154–164. [Google Scholar] [CrossRef]
  45. El-Askary, H.; Gautam, R.; Kafatos, M. Remote Sensing of Dust Storms over the Indo-Gangetic Basin. J. Indian Soc. Remote Sens. 2004, 32, 121–124. [Google Scholar] [CrossRef]
  46. Albarakat, R.; Lakshmi, V. Monitoring Dust Storms in Iraq Using Satellite Data. Sensors 2019, 19, 3687. [Google Scholar] [CrossRef]
  47. Rahmati, O.; Mohammadi, F.; Ghiasi, S.S.; Tiefenbacher, J.; Moghaddam, D.D.; Coulon, F.; Nalivan, O.A.; Tien Bui, D. Identifying Sources of Dust Aerosol Using a New Framework Based on Remote Sensing and Modelling. Sci. Total Environ. 2020, 737, 139508. [Google Scholar] [CrossRef]
  48. Jafari, M.; Mesbahzadeh, T.; Masoudi, R.; Zehtabian, G.; Amouei Torkmahalleh, M. Dust Storm Surveying and Detection Using Remote Sensing Data, Wind Tracing, and Atmospheric Thermodynamic Conditions (Case Study: Isfahan Province, Iran). Air Qual. Atmos. Health 2021, 14, 1301–1311. [Google Scholar] [CrossRef]
  49. Broomandi, P.; Mohammadpour, K.; Kaskaoutis, D.G.; Fathian, A.; Abdullaev, S.F.; Maslov, V.A.; Nikfal, A.; Jahanbakhshi, A.; Aubakirova, B.; Kim, J.R.; et al. A Synoptic- and Remote Sensing-Based Analysis of a Severe Dust Storm Event over Central Asia. Aerosol Air Qual. Res. 2023, 23, 220309. [Google Scholar] [CrossRef]
  50. Wang, Y.; Tang, J.; Zhang, Z.; Wang, W.; Wang, J.; Wang, Z. Hybrid Methods’ Integration for Remote Sensing Monitoring and Process Analysis of Dust Storm Based on Multi-Source Data. Atmosphere 2022, 14, 3. [Google Scholar] [CrossRef]
  51. Chen, Z.; Ji, C.; Mao, J.; Wang, Z.; Jiao, Z.; Gao, L.; Xiang, Y.; Zhang, T. Downdraft Influences on the Differences of PM2.5 Concentration: Insights from a Mega Haze Evolution in the Winter of Northern China. Environ. Res. Lett. 2023, 19, 014042. [Google Scholar] [CrossRef]
  52. Gkikas, A.; Basart, S.; Hatzianastassiou, N.; Marinou, E.; Amiridis, V.; Kazadzis, S.; Pey, J.; Querol, X.; Jorba, O.; Gassó, S.; et al. Mediterranean Intense Desert Dust Outbreaks and Their Vertical Structure Based on Remote Sensing Data. Atmos. Chem. Phys. 2016, 16, 8609–8642. [Google Scholar] [CrossRef]
  53. Li, X.; Hu, L.; Hu, X.; Liu, W. Scaling of Vertical Coherence and Logarithmic Energy Profile for Wall-Attached Eddies during Sand and Dust Storms. J. Fluid Mech. 2024, 996, A7. [Google Scholar] [CrossRef]
  54. Guehaz, R.; Sivakumar, V.; Mbatha, N. A Case Study on the Dust Storm That Occurred on March 13–18, 2022, over the Algerian Sahara, Using Satellite Remote Sensing. J. Atmos. Sol.-Terr. Phys. 2024, 264, 106345. [Google Scholar] [CrossRef]
  55. Smith, M.D.; Martínez, G.M.; Sebastián, E.; Lemmon, M.T.; Atwood, S.A.; Toledo, D.; Viúdez-Moreiras, D.; Stcherbinine, A.; Rodriguez-Manfredi, J.A.; de la Torre Juárez, M. The Diurnal Variation of Dust and Water Ice Aerosol Optical Depth at Jezero Crater Observed by MEDA/TIRS over a Full Martian Year. Icarus 2025, 425, 116313. [Google Scholar] [CrossRef]
  56. Haitham, A.; Mohammed, F.S. Optical Simulation of the Soil Effect on Solar Photovoltaic Systems for Low Buildings. J. Opt. 2024. [Google Scholar] [CrossRef]
  57. Tashi, Y.; Chamard, P.C.; Courel, M.-F.; Tiyip, T.; Tuerxun, Y.; Drake, S. The Recent Evolution of the Oasis Environment in the Taklimakan Desert, China. In Water and Sustainability in Arid Regions: Bridging the Gap Between Physical and Social Sciences; Schneier-Madanes, G., Courel, M.-F., Eds.; Springer: Dordrecht, The Netherlands, 2010; pp. 51–74. ISBN 978-90-481-2776-4. [Google Scholar]
  58. Ge, J.M.; Huang, J.P.; Xu, C.P.; Qi, Y.L.; Liu, H.Y. Characteristics of Taklimakan Dust Emission and Distribution: A Satellite and Reanalysis Field Perspective. J. Geophys. Res. Atmos. 2014, 119, 11772–11783. [Google Scholar] [CrossRef]
  59. Aili, A.; Xu, H.; Zhao, X. Health Effects of Dust Storms on the South Edge of the Taklimakan Desert, China: A Survey-Based Approach. Int. J. Environ. Res. Public Health 2022, 19, 4022. [Google Scholar] [CrossRef] [PubMed]
  60. Yang, X.; Shen, S.; Yang, F.; He, Q.; Ali, M.; Huo, W.; Liu, X. Spatial and Temporal Variations of Blowing Dust Events in the Taklimakan Desert. Theor. Appl. Climatol. 2016, 125, 669–677. [Google Scholar] [CrossRef]
  61. Ma, F.; Lü, P.; Cao, M.; Yu, J.; Xia, Z. Morphological and Sedimentary Characteristics of Raked Linear Dunes in the Southeastern Taklimakan Desert, China. Aeolian Res. 2024, 67–69, 100923. [Google Scholar] [CrossRef]
  62. Jin, L.; He, Q.; Jiang, H.; Xiao, J.; Zhao, Q.; Zhou, S.; Li, Z.; Zhao, J. Unmanned Aerial Vehicle Observations of the Vertical Distribution of Particulate Matter in the Surface Layer of the Taklimakan Desert in China. Atmosphere 2020, 11, 980. [Google Scholar] [CrossRef]
  63. Huo, W.; Yang, F.; Wu, Y.; Zhi, X.; Song, M.; Zhou, C.; Yang, X.; MamtiMin, A.; He, Q.; Wen, C.; et al. Influence of Topographic Relief on Sand Transport in the Near-Surface Layer During Dust Storms in the Taklimakan Desert. Front. Environ. Sci. 2022, 10, 931529. [Google Scholar] [CrossRef]
  64. Yang, X.H. Observation of Surface Sand Entrainment and Improvement of Sand Entrainment Parameterization Scheme in the Taklimakan Desert. Ph.D. Thesis, Nanjing University of Information Science and Technology, Nanjing, China, 2019. [Google Scholar]
  65. Schepanski, K. Transport of Mineral Dust and Its Impact on Climate. Geosciences 2018, 8, 151. [Google Scholar] [CrossRef]
  66. Zhou, C.; Zhang, X.; Zhang, J.; Zhang, X. Representations of Dynamics Size Distributions of Mineral Dust over East Asia by a Regional Sand and Dust Storm Model. Atmos. Res. 2021, 250, 105403. [Google Scholar] [CrossRef]
  67. Jones, A.R. Light Scattering for Particle Characterization. Prog. Energy Combust. Sci. 1999, 25, 1–53. [Google Scholar] [CrossRef]
  68. Papi, R.; Kakroodi, A.A.; Soleimani, M.; Karami, L.; Amiri, F.; Alavipanah, S.K. Identifying Sand and Dust Storm Sources Using Spatial-Temporal Analysis of Remote Sensing Data in Central Iran. Ecol. Inform. 2022, 70, 101724. [Google Scholar] [CrossRef]
  69. An, L.; Che, H.; Xue, M.; Zhang, T.; Wang, H.; Wang, Y.; Zhou, C.; Zhao, H.; Gui, K.; Zheng, Y.; et al. Temporal and Spatial Variations in Sand and Dust Storm Events in East Asia from 2007 to 2016: Relationships with Surface Conditions and Climate Change. Sci. Total Environ. 2018, 633, 452–462. [Google Scholar] [CrossRef]
  70. Qian, W.; Quan, L.; Shi, S. Variations of the Dust Storm in China and Its Climatic Control. J. Clim. 2002, 15, 1216–1229. [Google Scholar] [CrossRef]
  71. Xu, R.; Zhang, B.H. Characteristics and Meteorological Causes of Dust Transport Pathways in China from 2000 to 2021. China Environ. Sci. 2023, 43, 4450–4458. [Google Scholar]
  72. Wang, S.; Wang, J.; Zhou, Z.; Shang, K. Regional Characteristics of Three Kinds of Dust Storm Events in China. Atmos. Environ. 2005, 39, 509–520. [Google Scholar] [CrossRef]
  73. Huo, W.; Song, M.; Wu, Y.; Zhi, X.; Yang, F.; Ma, M.; Zhou, C.; Yang, X.; Mamtimin, A.; He, Q. Relationships between Near-Surface Horizontal Dust Fluxes and Dust Depositions at the Centre and Edge of the Taklamakan Desert. Land 2022, 11, 959. [Google Scholar] [CrossRef]
  74. Aili, A.; Xu, H.; Xu, Q.; Liu, K. Aeolian Dust Movement and Deposition under Local Atmospheric Circulation in a Desert-Oasis Transition Zone of the Northeastern Taklimakan Desert. Ecol. Indic. 2023, 157, 111289. [Google Scholar] [CrossRef]
  75. Zhang, Z.; Ding, J.; Wang, J.; Chen, W. Observational Study on Salt Dust Aerosol Optical Properties Using Ground-Based and Satellite Remote Sensing. China Environ. Sci. 2021, 21, 665–678. [Google Scholar] [CrossRef]
  76. Ye, P. Remote Sensing Approaches for Meteorological Disaster Monitoring: Recent Achievements and New Challenges. Int. J. Environ. Res. Public Health 2022, 19, 3701. [Google Scholar] [CrossRef]
  77. Islam, M.M.; Meskhidze, N.; Rasheeda Satheesh, A.; Petters, M.D. Turbulent Flux Measurements of the Near-Surface and Residual-Layer Small Particle Events. J. Geophys. Res. Atmos. 2022, 127, e2021JD036289. [Google Scholar] [CrossRef]
Figure 1. Overview of the study area.
Remotesensing 17 01870 g001
Figure 2. Variation of XT horizontal dust flux with height. (a) Variation of XT horizontal dust flux with height on 27 January and 3 March; (b) Variation of XT horizontal dust flux with height on 17 March and 29 March; (c) Variation of XT horizontal dust flux with height on 2 April, 11 April and 27 April; (d) Variation of XT horizontal dust flux with height on 7 May and 16 May; (e) Variation of XT horizontal dust flux with height on 17 May and 31 May; (f) Variation of XT horizontal dust flux with height on 16 June and 30 June; (g) Variation of XT horizontal dust flux with height on 15 July and 26 July; (h) Variation of XT horizontal dust flux with height on 3 August and 23 August; (i) Variation of XT horizontal dust flux with height on 25 August and 29 August.
Remotesensing 17 01870 g002
Figure 3. Variation of TZ horizontal dust flux with height. (a) Variation of TZ horizontal dust flux with height on 27 January; (b) Variation of TZ horizontal dust flux with height on 3 March; (c) Variation of TZ horizontal dust flux with height on 2 April; (d) Variation of TZ horizontal dust flux with height on 19 April; (e) Variation of TZ horizontal dust flux with height on 27 April; (f) Variation of TZ horizontal dust flux with height on 7 May and 20 May; (g) Variation of TZ horizontal dust flux with height on 1 June; (h) Variation of TZ horizontal dust flux with height on 15 July; (i) Variation of TZ horizontal dust flux with height on 23 August.
Remotesensing 17 01870 g003
Figure 4. Variation of XT vertical dust flux with height. (a) Variation of XT vertical dust flux with height on 27 January and 3 March; (b) Variation of XT vertical dust flux with height on 17 March and 29 March; (c) Variation of XT vertical dust flux with height on 2 April and 11 April; (d) Variation of XT vertical dust flux with height on 27 April and 7 May; (e) Variation of XT vertical dust flux with height on 16 May and 17 May; (f) Variation of XT vertical dust flux with height on 31 May and 16 June; (g) Variation of XT vertical dust flux with height on 30 June and 15 July; (h) Variation of XT vertical dust flux with height on 26 July and 3 August; (i) Variation of XT vertical dust flux with height on 23 August, 25 August, and 29 August.
Remotesensing 17 01870 g004
Figure 5. Variation of TZ vertical dust flux with height. (a) Variation of TZ vertical dust flux with height on 27 January; (b) Variation of TZ vertical dust flux with height on 3 March and 2 April; (c) Variation of TZ vertical dust flux with height on 19 April; (d) Variation of TZ vertical dust flux with height on 27 April; (e) Variation of TZ vertical dust flux with height on 7 May; (f) Variation of TZ vertical dust flux with height on 20 May; (g) Variation of TZ vertical dust flux with height on 1 June; (h) Variation of TZ vertical dust flux with height on 15 July; (i) Variation of TZ vertical dust flux with height on 23 August.
Remotesensing 17 01870 g005
Figure 6. Remote sensing images of AOD for dust storm events in the Taklamakan Desert from January to April.
Remotesensing 17 01870 g006
Figure 7. Remote sensing images of AOD for dust storm events in the Taklamakan Desert from May to August.
Remotesensing 17 01870 g007
Figure 8. Progress of dust storm spread in the Taklamakan Desert in March.
Remotesensing 17 01870 g008
Figure 9. Progress of dust storm spread in the Taklamakan Desert in April.
Remotesensing 17 01870 g009
Figure 10. Progress of dust storm diffusion in the Taklamakan Desert in May (from left to right: 7, 8, 9, 10, 11, 16, 17, 18, 24, 25, 26, 27, 28, 29, 30, and 31 May).
Remotesensing 17 01870 g010
Figure 11. Temporal variation relationship of dust flux (F) and aerosol optical depth (AOD) at different heights in XT.
Remotesensing 17 01870 g011
Figure 12. Temporal variation relationship of dust flux (F) and aerosol optical depth (AOD) at different heights in TZ.
Remotesensing 17 01870 g012
Figure 13. Conceptual diagram of dust transport from multiple sand sources during a dust storm in TZ (source: Huo et al., 2022 [63]).
Remotesensing 17 01870 g013
Figure 14. Progress of dust storm spread in the Taklamakan Desert in January. The different colors in the figure represent different heights: red indicates 1 m, blue indicates 10 m, and green indicates 100 m.
Remotesensing 17 01870 g014
Figure 15. Progress of dust storm diffusion in the Taklamakan Desert in June. The different colors in the figure represent different heights: red indicates 1 m, blue indicates 10 m, and green indicates 100 m.
Remotesensing 17 01870 g015
Figure 16. Progress of dust storm diffusion in the Taklamakan Desert in July. The different colors in the figure represent different heights: red indicates 1 m, blue indicates 10 m, and green indicates 100 m.
Remotesensing 17 01870 g016
Figure 17. Progress of dust storm diffusion in the Taklamakan Desert in August. The different colors in the figure represent different heights: red indicates 1 m, blue indicates 10 m, and green indicates 100 m.
Remotesensing 17 01870 g017
Table 1. Taklamakan Desert observation station and specification summary.
FacilityObservation Levels (m)Other Specifications
XT Observation Station1, 2, 5, 10, 24, 32, 47, 63, 80, 100
TZ Observation Station1, 2, 5, 8, 16, 24, 32, 47, 63, 80
Dust InletWidth: 2 cm, Height: 5 cmCovered with a 60-mesh screen on top for air filtration and dust particle collection
Table 2. The spectral characteristics and impacts of dust particles of different sizes.
Particle Size Range (μm)Main CharacteristicsScattering Energy Concentration DirectionAbsorption and Extinction Effect
0.01–5Very small, similar to atmospheric backgroundRandomLow
5–20Medium particle size, significant impactForward scattering tends to increaseModerate
Table 3. Overview of China’s daily seamless aerosol optical depth (AOD) dataset.
ProjectDetailed Dataset Name
China 1 km Resolution Daily Seamless Aerosol Optical Depth (AOD) Dataset
Time Range2000–2020 (2018 data used in this study)
Time ResolutionDaily
Spatial Resolution1 km
Longitude Range71–139°E
Latitude Range15–56°N
Product Validation Accuracy≥0.90
Data SourceNational Earth System Science Data Center (https://www.geodata.cn)
China 1 km Resolution Daily Seamless Aerosol Optical Depth (AOD) Dataset
Time Range2000–2020 (2018 data used in this study)
Disclaimer/Publisher’s Note: The statements, opinions and data contained in all publications are solely those of the individual author(s) and contributor(s) and not of MDPI and/or the editor(s). MDPI and/or the editor(s) disclaim responsibility for any injury to people or property resulting from any ideas, methods, instructions or products referred to in the content.

