Abstract
Assessing nitrogen (N) status in potato (Solanum tuberosum L.) during the growing season is crucial for optimizing fertilizer application, aligning it with crop demand, and improving N use efficiency, particularly in Western Canada, where extensive potato cultivation supports the agricultural industry. This study evaluated the performance of three machine learning (ML) models—Random Forest (RF), Support Vector Machine (SVM), and Gradient Boosting Regression (GBR)—for predicting potato N status and examined the impact of feature selection techniques, including Partial Least Squares Regression (PLSR), Boruta, and Recursive Feature Elimination (RFE). A field experiment was conducted in 2023 and 2024 near Carberry, Manitoba, Canada, with plots receiving different N rates from various fertilizer sources. Multispectral drone imagery was collected throughout the growing seasons, and key vegetation indices (VIs) related to plant N concentration were extracted for model training. Among the VIs, Cl green exhibited the highest correlation with petiole NO3-N concentration (PNC). The results indicate that RF outperformed SVM and GBR, achieving the highest coefficient of determination (R2 = 0.571) and the lowest mean absolute error (MAE = 0.365%) using the RFE feature selection method. Feature selection enhanced model performance in specific cases, notably RF with RFE, and both SVM and GBR with Boruta. These findings highlight the potential of ML-based approaches for in-season potato N monitoring and emphasize the importance of feature selection in enhancing predictive accuracy.
1. Introduction
To meet future food demands driven by population growth without increasing cropland or environmental risks, potato, the fourth most important food crop, could play a crucial role [1]. A hectare of potatoes can generate two to four times the caloric output compared with the same area of grain crops [2]. However, maximizing potato productivity requires effective nitrogen (N) management, as N is the primary limiting nutrient in potato cropping systems [3]. Potato crops typically exhibit low N uptake efficiency, ranging from 40% to 60% [4] because they have a shallow rooting system that limits their ability to fully absorb N, making them susceptible to losses through immobilization, volatilization, leaching, and runoff, especially with poor agronomic practices [5]. Insufficient N causes early canopy senescence and reduced yield, whereas excessive N leads to excessive vine growth, reduced tuber yield, and delayed maturity [6]. Therefore, a well-planned N fertilizer application strategy supports the normal growth of potato plants and prevents increased production costs and environmental pollution from excessive N, which is crucial for the sustainable development of the potato industry [7].
Petiole nitrate-N (NO3-N) concentration (PNC) is currently used to guide N fertilizer applications in potato production, but this approach is limited by point sampling and does not capture fine-scale spatial variability within the field [8]. To address this limitation, precision farming has gained attention for its ability to manage crop and soil variability at a finer scale, helping farmers optimize yield, reduce costs, and increase profitability [9]. Remote sensing (RS) offers a cost-effective, non-destructive method to estimate plant N concentration by analyzing canopy reflectance, which is influenced by chlorophyll levels, thus improving nutrient management by addressing spatio-temporal variability [10]. Chlorophyll content, as a key indicator of photosynthetic activity, is closely related to N concentration in green vegetation and has therefore been widely used as an indirect proxy for assessing plant N status [11]. Unmanned aerial vehicles (UAVs), also known as drones, are valuable in RS for precision agriculture (PA), providing high-resolution data that are crucial for monitoring N levels [12,13]. Drones, as a type of UAV, offer distinct advantages in PA by providing high-resolution multispectral imagery with greater flexibility in timing compared with manned aircraft [14]. A study conducted in Denmark showed that UAV-based multispectral data outperformed satellite (Sentinel-2) and handheld (RapidScan) sensors in assessing potato N status, primarily due to the higher spatial resolution of the UAV images [10]. Potato leaf chlorophyll content could be reliably estimated using reflectance near the 700 nm red-edge position, achieving an R2 value of approximately 0.86 [15]. Spectral reflectance-based vegetation indices (VIs) from crop canopies are widely used in RS to monitor N content in crops [16]. VIs are created to emphasize specific characteristics of vegetation while minimizing the influence of other factors [17]. Numerous VIs (including ratio, normalization, and derivative indices) and crop growth indices (such as crop N/chlorophyll concentration, crop N/chlorophyll accumulation, leaf area index (LAI), and biomass) have been developed globally to diagnose crop N status by identifying sensitive bands in the canopy reflectance spectrum [18]. Among these VIs, the ratio vegetation index (RVI) and Normalized Difference Vegetation Index (NDVI) are the most common [19]. UAV monitoring has been used to assess the N status of Ranger Russet potatoes across N rates from 0 to 449 kg ha−¹, demonstrating that NDVI can predict leaf chlorophyll content with an R2 of up to 0.85. However, NDVI often saturates at high canopy densities due to red reflectance saturation [12]. Red edge-based VIs are resistant to saturation and provide reliable information on crop chlorophyll and N concentrations [20].
The primary goal of PA in cropping systems is to enhance decision-making by providing spatial and temporal information, enabling targeted management of plant health and nutrient levels [21]. Machine learning (ML) offers a valuable and supplementary method to crop simulation models by integrating a range of factors affecting crop growth, bypassing the need for intricate plant physiological details [22]. ML resolves complex nonlinear problems by integrating data from multiple sources, as evidenced by its successful application to agricultural RS inversion [23]. Effective N management necessitates a robust correlation between RS data and crop N status, and Random Forest (RF) provides a flexible, non-parametric approach that avoids overfitting and is simpler compared with other methods like artificial neural networks [10]. Several studies have compared various ML models for predicting N levels in crops, consistently finding that RF delivers superior performance [24,25,26]. The Support Vector Machine (SVM) is another widely used ML approach for N status prediction. SVM has been successfully applied in agricultural research, such as predicting soil moisture and nitrate-N content in time-series data [27], estimating canopy N weight in corn using UAV multispectral images [28], and evaluating soil nutrient levels alongside artificial neural networks [29]. Gradient Boosting is another ensemble learning technique that sequentially builds weak learners to minimize errors. While Gradient Boosting has been widely applied in agricultural modeling tasks such as yield prediction [30,31], studies focusing specifically on N status prediction remain limited.
A critical scientific question in PA is how to optimize ML models for accurate and efficient prediction of PNC using high-resolution remote sensing data. Feature selection in ML algorithms helps reduce data redundancy and prevent overfitting, thereby enhancing the accuracy of predictions for crop parameters such as yield and leaf chlorophyll concentration [32]. The process of feature selection involves choosing a subset of the original features by evaluating their importance, aiming to enhance both model performance and interpretability [33].
Despite growing interest in UAV-based remote sensing and ML approaches for crop N management, few studies have comprehensively evaluated the effectiveness of different ML models and feature selection techniques for in-season potato N prediction using high-resolution drone imagery. In particular, there is a lack of research focused on Canadian agroecosystems, where site-specific nutrient management strategies are essential due to spatial variability in the soil and climate conditions [34]. In addition, our study introduces a broader spectrum of N management strategies compared with previous research. By incorporating 15 distinct N fertilization treatments, including various rates, sources, and application timings, we aimed to capture a wider range of in-field N variability. This diversity improves model learning and allows for more nuanced exploration of the relationship between RS signals and PNC. This study addresses this gap by (1) investigating the relationships between drone-derived VIs (as proxies for chlorophyll content) and PNC in potato, (2) developing and comparing the performance of three supervised ML models (RF, SVM, and Gradient Boosting Regression (GBR)) for predicting in-season PNC using high-resolution multispectral imagery, and (3) systematically evaluating the effectiveness of three distinct feature selection techniques—Partial Least Squares Regression (PLSR), Boruta, and Recursive Feature Elimination (RFE)—in improving model accuracy and interpretability across various ML algorithms. By achieving these objectives, this research aimed to improve N management in potato cultivation through PA in Western Canada. Furthermore, the drone-based modeling framework developed in this study provides a scalable pathway for applying similar methodologies to large-scale nutrient monitoring using high-resolution satellite imagery across diverse agricultural systems.
2. Materials and Methods
To illustrate the comprehensive approach of this research, Figure 1 provides a schematic representation of the study’s workflow. This flowchart details the sequence of the methodologies employed, including data acquisition and the supervised ML approaches utilized for N status prediction.
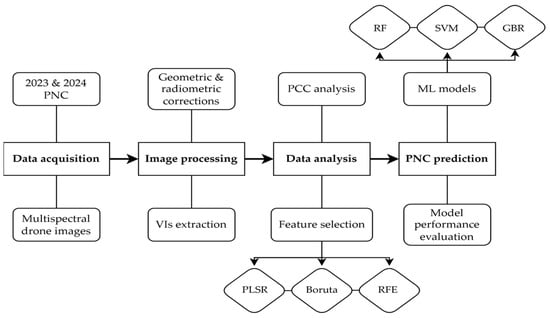
Figure 1.
Workflow for petiole NO3-N concentration (PNC) prediction using multispectral drone imagery and machine learning (ML). PCC, Pearson’s correlation coefficient; PLSR: Partial Least Squares Regression; RFE, Recursive Feature Elimination; RF, Random Forest; SVM, Support Vector Machine; GBR, Gradient Boosting Regressor; VIs, vegetation indices.
2.1. Study Area and Field Trials
The experiment was carried out during the 2023 (49°55′53.33″N, 99°23′21.20″W) and 2024 (49°55′53.85″N, 99°23′26.67″W) growing seasons in adjacent fields in Carberry, Manitoba (Figure 2). The primary crop rotation in this area includes wheat, canola, and potato. The study area is located in the prairie ecozone of Canada, part of North America’s Great Plains. The climate in the region is characterized as a subhumid to semiarid, featuring short, warm summers and long, cold winters, with low levels of precipitation and high evaporation.
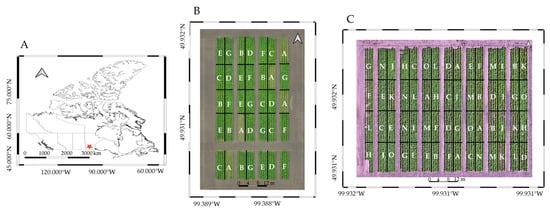
Figure 2.
Study site and field trial layouts. (A) Location of the experimental site in Carberry, Manitoba, Canada, marked with a red “*”. (B) Plot arrangement for the 2023 field trial. (C) Plot arrangement for the 2024 field trial, with labeled plots (A, B, C, etc.) representing different nitrogen (N) treatment levels.
The experiment was designed using a Randomized Complete Block Design (RCBD) to randomly assign treatments to the experimental units, thereby minimizing potential bias. Each treatment plot measured 12 m (m) in length and consisted of four rows, 4 m in width, with 1 m between rows. Russet Burbank, a leading potato cultivar in North America, widely cultivated and stored for both fresh market sales and frozen processing [35], was used in this study.
In 2023, the crop was grown under 6 N fertilization treatments and 1 unfertilized control, with 5 replicates per treatment, totaling 35 experimental plots. This initial trial served as a preliminary study to evaluate the feasibility of using UAV-based multispectral imaging for in-season PNC prediction. On the basis of the insights gained, the 2024 experiment was expanded to include 15 N fertilization treatments, each with 4 replicates, resulting in 60 experimental plots. This expansion allowed for a broader assessment of treatment effects and improved model robustness by capturing greater variability in plant responses. This study investigated N treatments using urea, environmentally smart N (ESN), ammonium sulfate (AS), and super urea (SuperU), applied at various rates and timings, including pre-planting and top-dressing, as detailed in Table 1.

Table 1.
Nitrogen application rates and sources for the 2023 and 2024 field trials.
Soil properties such as organic matter, pH, cation exchange capacity, and macronutrient levels of nitrogen (N), phosphorus (P), potassium (K), and sulfur (S) were analyzed to characterize the experimental sites and are summarized in Table 2. All plots were provided with adequate irrigation and essential nutrients, including P, K, S, and calcium (Ca), to prevent nutrient deficiencies. Soil and petiole samples were collected using standardized procedures to ensure consistency and representativeness across all plots. Soil samples were taken at standard depths commonly used for nutrient analysis. Petiole samples were collected at the row closure stage to assess plant nutrient status. The fourth petiole from the top of each plant was selected, leaflets were removed, and 30 petioles were collected per plot (not assigned individual geo-referencing) to ensure representative sampling of the plot, as recommended for potato nutrient monitoring [36]. All samples were properly labeled and packaged for analysis at Agvise Laboratories (USA), where the soil and petiole samples were analyzed for nutrient status using standardized laboratory protocols [37].
Table 2.
Soil analysis results for the experimental field before planting.
2.2. Image Acquisition and Management
The multispectral images were captured 37 days after emergence in the 2023 growing season and 42 days after emergence in 2024, both during the vegetation growth phase. These imaging dates were aligned with petiole sampling to ensure consistency in data collection. The images were acquired under cloudless weather conditions using a DJI Mavic 3M drone (DJI Group, Ltd., Shenzhen, China), equipped with four 5MP multispectral cameras (green (G): 560 ± 16 nm; red (R): 650 ± 16 nm; red edge (RE): 730 ± 16 nm; near-infrared (NIR): 860 ± 26 nm) and a sunlight sensor to enhance the accuracy and consistency of the data under dynamic field conditions. Each camera has a native sensor resolution of approximately 4.4 mm per pixel.
To maximize image quality and spatial detail, all flights were conducted at a consistent altitude of 15 m above ground level, with a flight speed of approximately 5 m/s to minimize motion blur. The along-track (front) and cross-track (side) overlaps were set to 80% and 70%, respectively, to ensure comprehensive image coverage and enable accurate mosaicking. The camera was oriented at a nadir (90° downward) angle for vertical image capture. Under these acquisition settings, the effective ground sampling distance (GSD) was approximately 1.27 cm/pixel for the multispectral imagery and 0.58 cm/pixel for RGB imagery. This distinction between the sensor’s native resolution and the GSD reflects the influence of flight parameters on the spatial resolution of the ortho-mosaicked images used for analysis. For centimeter-precise results, the real-time kinematics (RTK REACH RS2+) provided accurate geolocation data for the drone imagery, ensuring precise field mapping and in situ measurements. The drone raster images were ortho-mosaicked using DJI Terra (version 3.9.4, DJI, Shenzhen, China).
2.3. VI Extraction from Multispectral Images
Spectral VIs have been the primary and most commonly used method for estimating variable parameters [38]. In this study, 11 commonly used VIs were calculated using multispectral raster calculator tools in QGIS (version 3.28.3, QGIS Development Team, Open Source Geospatial Foundation, Washington, DC, USA) (Table 3). For each plot, the average pixel value of each VI was calculated using manually drawn plot boundaries, ensuring that each VI represented the mean canopy reflectance within the defined area. These indices—NDVI, GNDVI, RNIR, GNIR, RVI, GRVI, SAVI, Cl green, TCARI, MCARI, and SRRE—were selected according to their relevance in previous studies [39,40,41].
Table 3.
Extracted vegetation indices (VIs), used as proxies for chlorophyll content, to estimate petiole NO3−-N concentration (PNC) in potato crops.
2.4. Correlation Analysis of VIs and N Levels Using Pearson’s Correlation Coefficient (PCC)
To evaluate the relationships between various VIs and plant N levels, a PCC analysis was conducted. The PCC quantifies the linear correlation between two variables, calculated as
where is the PCC between variables and , and are individual data points, and and are the means of the variables. PCC values range from −1 to 1, indicating a perfect negative correlation and a perfect positive correlation, respectively, with 0 indicating no correlation.
The analysis was used to identify and quantify the strength of the linear relationships between VIs and N levels. A heatmap of the correlation matrix, with the upper triangle masked, was created to highlight unique pairwise correlations, providing a clear overview of the interrelationships among the variables and aiding decision-making in the modeling process. Separate heatmaps were generated for each growing season (2023 and 2024) rather than combining data into a single matrix. This was carried out to account for interannual variability in environmental and agronomic conditions, which can significantly influence the relationship between VIs and PNC.
2.5. Feature Selection for Enhanced Prediction Accuracy
To improve the accuracy of plant N status predictions, PLSR, Boruta, and RFE were individually employed (using Jupyter Notebook (version 6.0.3) with Python (version 3.8.5)) to identify and eliminate VIs that contributed minimally to the prediction models. PLSR was used to reduce dimensionality, Boruta was applied to determine the most relevant features, and RFE was utilized for feature selection, ensuring that only the most significant VIs were retained. Although certain ML models—such as RF—are inherently capable of handling redundant or less informative features due to their internal feature selection mechanisms, we applied all three feature selection techniques (PLSR, Boruta, and RFE) uniformly across the ML models to allow for a consistent and comprehensive evaluation of their influence on model performance.
PLSR, a multivariate statistical technique, was employed to reduce the dimensionality of the VI dataset by projecting the original predictor variables onto a set of orthogonal latent components that maximize the covariance with the response variable (PNC). This transformation enhances model robustness by minimizing collinearity and capturing the most relevant spectral features. The PLSR decomposition can be expressed as
where is the matrix of predictor variables, is the matrix of latent scores, is the matrix of loadings, and is the matrix of residuals. The optimal number of components was selected via 10-fold cross-validation based on the highest coefficient of determination (R2). VIs with minimal explanatory power were identified and excluded to enhance model performance and interpretability [52].
Boruta is a feature selection algorithm that works by comparing the importance of each feature with that of randomly generated shadow features. It iteratively removes less relevant features and retains only the most significant ones. The algorithm evaluates feature importance using a RF classifier and determines which features are statistically significant by comparing their importance with the shadow features. The decision process can be represented as
where is the importance of the feature , and represents the importance score from the RF model. Features with an importance score higher than the shadow features are retained, and irrelevant ones are discarded. Boruta’s ability to identify important features helps improve the predictive accuracy of ML models for plant N status prediction [53].
RFE is a feature selection technique that recursively eliminates less important features on the basis of their contribution to model performance. It works by training a model, ranking the features according to their importance, and removing the least important feature in each iteration until the optimal subset is achieved. In this study, RFE was applied using RF as the base estimator to ensure that the feature ranking was based on Gini importance, consistent with the decision-tree-based structure used in Boruta selection. The RFE elimination process at each iteration can be expressed as
where is the set of features at iteration , and is the importance of feature . By recursively applying this process, RFE identifies the most influential features, which helps improve model accuracy and reduce overfitting [54].
2.6. Supervised ML Approach for N Status Prediction
To enhance the prediction accuracy of plant N levels, three supervised ML models, RF, SVM, and GBR were employed. The dataset comprised 95 samples, including 35 observations from the 2023 growing season and 60 from 2024. To mitigate overfitting and ensure robust model evaluation, a 10-fold cross-validation approach was applied across the entire dataset. In this process, the model is trained on nine folds (serving as the training set) and tested on the remaining fold (acting as the validation set). This is repeated 10 times so that each data point is used for both training and validation. Such an approach yields unbiased out-of-fold predictions and provides a reliable estimate of the model’s generalization performance. No separate test set was reserved; instead, the model evaluation was based entirely on cross-validation results. The models were trained and tested using two distinct approaches: one involving all VIs and another after feature selection.
The RF model, an ensemble learning method, operates by constructing multiple decision trees during training and averaging their outputs for prediction. Mathematically, the RF prediction for N, , can be expressed as
where is the total number of trees, and represents the prediction from the -th tree for input feature [55].
The SVM model, though primarily designed for binary classification, can be seamlessly extended to regression problems, enhancing its applicability in various predictive modeling scenarios [56]. The SVM prediction for N, , can be represented as
where is the weight vector, represents the feature vector, and is the bias term [57].
The GBR model is a popular ML technique for regression tasks that combines multiple weak learners (typically decision trees) to form a strong predictive model [58]. The GBR prediction for N, , can be represented as
where is the initial model vector, is the -th weak learner (tree) applied to the input , is the step size or learning rate for the -th tree, and is the number of trees [59].
2.7. Model Performance Evaluation
The study compared model performance with and without reduction in the VIs to assess how dimensionality reduction affects the accuracy of N status prediction. This comparison provides valuable insights into which approach is better for selecting features to optimize N management in potato crops. During model evaluation, three metrics, namely the coefficient of determination (R2), root mean squared error (RMSE), and mean absolute error (MAE), were used to compare the N content of plants predicted by the model with the measurements obtained in the field. It should be noted that these criteria have been commonly applied in earlier studies [60,61]. R2, RMSE, and MAE were calculated with the following equations
where represents the actual potato N data (%) of the -th sample, is the mean of the actual potato N data, represents the potato N data (%) of the -th sample predicted by the N estimation model, is the sample size, and is the sample number.
3. Results
3.1. PNC Across Treatments and Growing Years
The PNC varied across treatments, reflecting the influence of different N applications (Figure 3). The control treatments (Treatment 1 in 2023 and Treatment 11 in 2024) had the lowest PNC values, showing minimal variation among replicates. This confirms that plants in these plots relied solely on the native soil N, which was insufficient to support higher N accumulation. The narrow distribution of PNC values in these treatments suggests a consistent N deficiency across the plants.
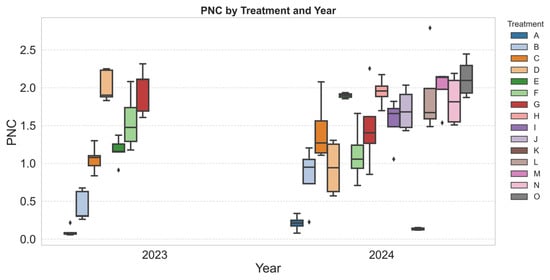
Figure 3.
Distribution of petiole NO3-N concentration (PNC) across treatments in 2023 and 2024. The boxplots display the variability in PNC, with the boxes representing the interquartile range (IQR) and the horizontal line inside each box indicating the median. Treatments correspond to the nitrogen fertilizer types and rates described in Table 1. Diamond-shaped points represent statistical outliers.
In contrast, N-fertilized treatments exhibited a wider range of PNC values, with some showing significantly higher concentrations. This variation is likely influenced by differences in N uptake efficiency, soil properties, plant health, and microclimatic conditions. Some treatments displayed stable PNC distributions, while others showed greater fluctuations, indicating potential effects of N formulation, application timing, or interactions with environmental factors. The presence of outliers in multiple treatments suggests localized variability in soil fertility or differences in individual plant responses.
From a modeling perspective, the diversity in N concentrations across treatments is beneficial for training ML models. A well-distributed dataset, containing both low and high PNC values, ensures that the models can capture the full spectrum of N variability in plants. This improves the ability of predictive models to generalize across different conditions, making them more robust for real-world applications. Treatments with distinct N responses provide valuable data points for developing accurate models that can predict N status on the basis of RS inputs.
3.2. Correlation Analysis of VIs with PNC
The correlation analysis revealed that certain VIs maintained a strong relationship with PNC across both years (Figure 4). In 2023, Cl green exhibited the highest correlation with PNC (r = 0.75), followed closely by GRVI (r = 0.72). Other indices, such as NDVI (r = 0.64) and GNDVI (r = 0.63), also showed moderate positive correlations, while GNIR and RNIR displayed negative associations, indicating an inverse relationship with PNC.
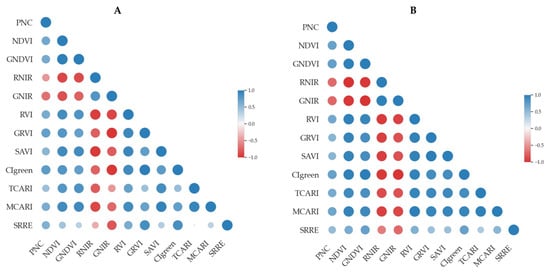
Figure 4.
Pearson’s correlation matrix between petiole NO3-N concentration (PNC) and vegetation indices (VIs). (A) Correlation matrix for the 2023 season; (B) correlation matrix for the 2024 season. The matrices illustrate the strength and direction of linear relationships between PNC and spectral indices. Blue circles represent positive correlations, while red circles indicate negative correlations. The size and color intensity of each circle reflects the magnitude of the Pearson correlation coefficient (r), with larger and more saturated circles denoting stronger correlations.
In 2024, the strongest correlations were observed with GNDVI (r = 0.73) and GNIR (r = −0.73), the latter showing a strong negative relationship with PNC. Cl green (r = 0.71) and RNIR (r = −0.71) also exhibited high correlations, with RNIR again displaying a negative association. Notably, MCARI and TCARI showed relatively strong correlations at 0.67 and 0.63, respectively, indicating their potential for PNC estimation. Although some indices varied in strength between years, the overall trends suggest that multiple VIs can serve as effective indicators of PNC.
3.3. Feature Selection for PNC Prediction
Feature selection using PLSR, Boruta, and RFE identified subsets of VIs for predicting PNC. PLSR selected seven VIs, including NDVI, RNIR, and SAVI, among others. Boruta retained six VIs, such as GNDVI, GNIR, and GRVI. RFE identified five VIs, including GNDVI, GRVI, and CI green. All methods consistently selected CI green, TCARI, and MCARI, indicating their strong relevance for PNC prediction. The selected VIs are summarized in Table 4, with their impact on model performance evaluated in Section 3.4.
Table 4.
Vegetation indices (VIs) selected for machine learning modeling by three feature selection methods: Partial Least Squares Regression (PLSR), Boruta, and Recursive Feature Elimination (RFE).
3.4. Comparative Assessment of N Status Prediction Models
The performance of three ML models—RF, SVM, and GBR—was evaluated for PNC prediction using different feature selection methods, as shown in Figure 5. Scatter plots compare the actual and predicted values for each model, considering the original dataset and three feature selection techniques: PLSR, Boruta, and RFE. The RF model achieved the highest accuracy with features selected by RFE, whereas SVM and GBR performed best with features identified by the Boruta method.
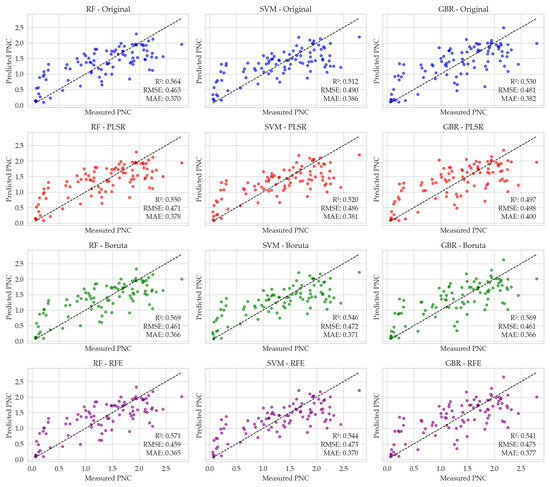
Figure 5.
Scatter plots illustrating the relationship between actual and predicted petiole NO3-N concentration (PNC) using three machine learning models: Random Forest (RF), Support Vector Machine (SVM), and Gradient Boosting Regressor (GBR). The black dashed line indicates the ideal 1:1 correspondence between the actual and predicted values. Model predictions are based on different feature selection methods: the original feature set (blue), Partial Least Squares Regression (PLSR) (red), Boruta (green), and Recursive Feature Elimination (RFE) (purple).
RF predictions show that the original dataset yielded an R2 of 0.564, an RMSE of 0.463%, and an MAE of 0.370%. PLSR decreased model performance (R2 = 0.550, RMSE = 0.471%, MAE = 0.378%), indicating that some important features were likely discarded. In contrast, Boruta marginally improved the results compared with the original dataset (R2 = 0.569, RMSE = 0.461%, MAE = 0.366%). The best performance was achieved with RFE, which provided the highest R2 (0.571) and the lowest MAE (0.365%), and a competitive RMSE, indicating that this method effectively retained the most relevant predictors for optimal predictive performance.
SVM results show that the original dataset resulted in an R2 of 0.512, an RMSE of 0.490%, and an MAE of 0.386%. PLSR improved the model’s performance, raising the R2 to 0.520 and reducing the RMSE and MAE to 0.486% and 0.381%, respectively. Boruta achieved the best performance (R2 = 0.546, RMSE = 0.472%, MAE = 0.371%), while RFE showed slightly lower performance (R2 = 0.544, RMSE = 0.473%, MAE = 0.370%). Overall, Boruta provided the highest predictive accuracy among the feature selection methods.
GBR predictions reveal that the original dataset produced an R2 of 0.530, an RMSE of 0.481%, and an MAE of 0.382%. PLSR led to a substantial drop in accuracy (R2 = 0.497, RMSE = 0.498%, MAE = 0.400%), highlighting the loss of critical features. In contrast, Boruta improved the performance, achieving the best overall results (R2 = 0.569, RMSE = 0.461%, MAE = 0.366%). RFE produced moderately weaker results (R2 = 0.541, RMSE = 0.475%, MAE = 0.377%). These findings indicate that GBR’s performance was highly sensitive to feature selection, with Boruta proving the most effective method.
4. Discussion
The integration of UAV-based multispectral imagery with ML models presents a practical and adaptable framework for in-season PNC monitoring in potato crops, as evidenced by this study conducted in Manitoba, Canada, during the 2023 and 2024 growing seasons. A key strength of this study lies in the inclusion of a broader and more diverse N treatment structure than that commonly reported in the literature. This expanded treatment range across multiple years improved the dynamic range of PNC in the dataset, thereby supporting more generalizable and accurate model development. By simulating practical nutrient management scenarios, the approach offers higher relevance for real-world PA applications. The results demonstrate that VIs, notably Cl green and GNDVI, are strongly correlated with PNC, achieving Pearson correlation coefficients (r) of up to 0.75 and 0.73, respectively. The comparative analysis of ML models—RF, SVM, and GBR—paired with feature selection techniques (PLSR, Boruta, and RFE) highlights the robustness of model-specific preprocessing in enhancing predictive accuracy.
The strong correlations between Cl green and PNC in both 2023 (r = 0.75) and 2024 (r = 0.71), alongside GNDVI in 2024 (r = 0.73), underscore their utility as proxies for N status. These findings align with studies demonstrating Cl green’s sensitivity to chlorophyll and N content in crops. For example, Cl green was found to accurately estimate corn canopy N content (R2 = 0.91, RMSE = 0.63 g m−2) due to its focus on green reflectance, which is strongly linked to the chlorophyll concentration [62]. Similarly, Cl green was identified as a key predictor of sugarcane leaf N, improving the accuracy of RF and SVM models [63]. The consistent selection of Cl green, TCARI, and MCARI across all feature selection methods further supports their relevance, as these VIs capture spectral signatures associated with N-related physiological traits. However, the interannual variability in VI–PNC correlations (e.g., GNDVI’s stronger correlation in 2024) suggests that environmental factors, such as soil properties or weather conditions, may influence Vis’ performance, necessitating multi-season validation.
The superior performance of RF with RFE (R2 = 0.571, MAE = 0.365%) compared with SVM and GBR reflects RF’s ability to handle nonlinear relationships and high-dimensional data, consistent with its widespread use in agricultural RS [64]. RFE’s effectiveness in optimizing RF stems from its iterative elimination of low-importance features, retaining only those with high predictive power, such as Cl green and GNDVI. This is consistent with findings that RFE enhanced RF-based alfalfa yield predictions by minimizing feature redundancy [65]. Conversely, SVM and GBR performed best with Boruta (R2 = 0.546 and 0.569, respectively), likely because Boruta’s feature importance ranking preserves the variables that complement their learning mechanisms. Our findings indicate that the integration of Boruta for feature selection enhances the performance of the SVM model, which aligns with previous research in the context of winter wheat yield prediction [66]. GBR’s sensitivity to Boruta-selected features reflects its iterative error correction, which benefits from a curated feature set, as supported by studies on boosting models in agronomic applications [58,67].
PLSR, however, reduced RF’s and GBR’s performance, likely due to its linear assumptions, which may discard nonlinear relationships that are critical for tree-based models. This contrasts with SVM, where PLSR improved performance (R2 = 0.520), suggesting that SVM benefits from dimensionality reduction in high-collinearity datasets. These model-specific responses emphasize the need for tailored feature selection, as a one-size-fits-all approach can compromise accuracy. The observed variability in PNC across treatments provided a diverse dataset, enabling robust model training, but outliers in the fertilized plots indicate potential influences from soil heterogeneity or application timing, which warrant further investigation.
This study advances PA applications for Canadian potato production by using UAV imagery for site-specific N monitoring. However, limitations include the reliance on a limited number of spectral bands, which may constrain physiological insights compared with hyperspectral approaches [68]. Despite the moderate R2 values, the modeling framework demonstrated consistent, interpretable patterns aligned with crop physiology, offering practical value for mid-season N management and a foundation for more scalable applications. The dataset, while diverse (95 samples across two seasons), is relatively small, and the models’ transferability to other agroecosystems remains untested. Interannual variability in soil properties and climate conditions may also affect VI–PNC relationships. Future research should explore the use of hyperspectral imaging to capture finer spectral details and integrate radiative transfer or crop growth models for enhanced physiological relevance [69,70]. Scaling the framework with larger, multi-regional datasets could support real-time decision-making tools, aligning with global efforts toward sustainable N management. Finally, incorporating temporal dynamics through time-series UAV data could improve model robustness by capturing N uptake patterns across growth stages.
5. Conclusions
This study examined the potential of integrating UAV-based multispectral imaging with ML models and feature selection techniques for in-season monitoring of PNC in potato crops. Over two growing seasons in Manitoba, VIs extracted from UAV imagery showed moderate to strong correlations with PNC, with Cl green being consistently influential. Among the ML models tested, RF combined with RFE produced slightly better prediction metrics compared with the other model–feature selection pairings. SVM and GBR showed improved performance with the Boruta technique. These results suggest that aligning feature selection methods with the structure of specific ML models can help improve predictive consistency.
While the findings are based on a limited dataset, they provide a practical framework that could be further explored in similar PA contexts. This approach may be applicable to other crops in the region but would benefit from additional validation across different conditions and scales. Rather than proposing a one-size-fits-all method, this study emphasizes the value of modest, model-specific adjustments in preprocessing and variable selection to support more informed nutrient management decisions using UAV imagery.
Author Contributions
Conceptualization, E.C.A. and N.B.; methodology, E.C.A., N.B., and M.E.-S.; validation, E.C.A., M.E.-S., X.C., A.Y., and N.B.; formal analysis, E.C.A., N.B., and M.E.-S.; investigation, E.C.A., M.E.-S., X.C., A.Y., and N.B; resources, E.C.A., N.B., and M.E.-S.; data curation, E.C.A. and N.B.; writing—original draft preparation, E.C.A. and N.B.; writing—review and editing, E.C.A., M.E.-S., X.C., A.Y., and N.B; visualization, E.C.A., M.E.-S., X.C., A.Y., and N.B.; supervision, N.B.; project administration, N.B.; funding acquisition, N.B. All authors have read and agreed to the published version of the manuscript.
Funding
This study was funded by Mathematics of Information Technology and Complex Systems (Mitacs) under Grant No. IT29631 and the KeyStone Potato Production Association (KPPA) in Manitoba.
Data Availability Statement
The original contributions presented in the study are included in the article; further inquiries can be directed to the corresponding author.
Acknowledgments
Mitacs and KPPA supported this work, and we gratefully acknowledge their financial support. A special thanks to Susan Ainsworth for facilitating the research collaboration, and Amy Unger for their collaboration in the fieldwork, which have enriched the development of this research project.
Conflicts of Interest
Author Mohamed El Shetehy was employed by the company Manitoba Horticulture Productivity Enhancement Centre Inc. (MHPEC). The remaining authors declare that the research was conducted in the absence of any commercial or financial relationships that could be construed as a potential conflict of interest.
References
- Raigond, P.; Singh, B.; Dutt, S.; Chakrabarti, S.K. Potato: Nutrition and Food Security; Springer Nature: Berlin, Germany, 2020. [Google Scholar]
- Aliche, E.B.; Oortwijn, M.; Theeuwen, T.P.J.M.; Bachem, C.W.B.; Visser, R.G.F.; van der Linden, C.G. Drought response in field grown potatoes and the interactions between canopy growth and yield. Agric. Water Manag. 2018, 206, 20–30. [Google Scholar] [CrossRef]
- Muleta, H.D.; Aga, M.C. Role of nitrogen on potato production: A review. J. Plant Sci. 2019, 7, 36–42. [Google Scholar]
- Rens, L.R.; Zotarelli, L.; Rowland, D.L.; Morgan, K.T. Optimizing nitrogen fertilizer rates and time of application for potatoes under seepage irrigation. Field Crops Res. 2018, 215, 49–58. [Google Scholar] [CrossRef]
- Gitari, H.I.; Karanja, N.N.; Gachene, C.K.K.; Kamau, S.; Sharma, K.; Schulte-Geldermann, E. Nitrogen and phosphorous uptake by potato (Solanum tuberosum L.) and their use efficiency under potato-legume intercropping systems. Field Crops Res. 2018, 222, 78–84. [Google Scholar] [CrossRef]
- Alkhaled, A.; Townsend, P.A.; Wang, Y. Remote sensing for monitoring potato nitrogen status. Am. J. Potato Res. 2023, 100, 1–14. [Google Scholar] [CrossRef]
- Fan, Y.; Feng, H.; Yue, J.; Jin, X.; Liu, Y.; Chen, R.; Bian, M.; Ma, Y.; Song, X.; Yang, G. Using an optimized texture index to monitor the nitrogen content of potato plants over multiple growth stages. Comput. Electron. Agric. 2023, 212, 108147. [Google Scholar] [CrossRef]
- Nigon, T.J.; Mulla, D.J.; Rosen, C.J.; Cohen, Y.; Alchanatis, V.; Knight, J.; Rud, R. Hyperspectral aerial imagery for detecting nitrogen stress in two potato cultivars. Comput. Electron. Agric. 2015, 112, 36–46. [Google Scholar] [CrossRef]
- Paustian, M.; Theuvsen, L. Adoption of precision agriculture technologies by German crop farmers. Precis. Agric. 2017, 18, 701–716. [Google Scholar] [CrossRef]
- Peng, J.; Manevski, K.; Kørup, K.; Larsen, R.; Andersen, M.N. Random forest regression results in accurate assessment of potato nitrogen status based on multispectral data from different platforms and the critical concentration approach. Field Crops Res. 2021, 268, 108158. [Google Scholar] [CrossRef]
- Haboudane, D.; Miller, J.R.; Tremblay, N.; Zarco-Tejada, P.J.; Dextraze, L. Integrated narrow-band vegetation indices for prediction of crop chlorophyll content for application to precision agriculture. Remote Sens. Environ. 2002, 81, 416–426. [Google Scholar] [CrossRef]
- Hunt, E.R.; Horneck, D.A.; Spinelli, C.B.; Turner, R.W.; Bruce, A.E.; Gadler, D.J.; Brungardt, J.J.; Hamm, P.B. Monitoring nitrogen status of potatoes using small unmanned aerial vehicles. Precis. Agric. 2018, 19, 314–333. [Google Scholar] [CrossRef]
- Khot, L.R.; Sankaran, S.; Carter, A.H.; Johnson, D.A.; Cummings, T.F. UAS imaging-based decision tools for arid winter wheat and irrigated potato production management. Int. J. Remote Sens. 2016, 37, 125–137. [Google Scholar] [CrossRef]
- Zhang, J.; Hu, Y.; Li, F.; Fue, K.G.; Yu, K. Meta-Analysis Assessing Potential of Drone Remote Sensing in Estimating Plant Traits Related to Nitrogen Use Efficiency. Remote Sens. 2024, 16, 838. [Google Scholar] [CrossRef]
- Zheng, T.; Liu, N.; Wu, L.; Li, M.; Sun, H.; Zhang, Q.; Wu, J. Estimation of chlorophyll content in potato leaves based on spectral red edge position. IFAC-PapersOnLine 2018, 51, 602–606. [Google Scholar] [CrossRef]
- Guo, F.; Feng, Q.; Yang, S.; Yang, W. Estimation of Potato Canopy Nitrogen Content Based on Hyperspectral Index Optimization. Agronomy 2023, 13, 1693. [Google Scholar] [CrossRef]
- Verrelst, J.; Camps-Valls, G.; Muñoz-Marí, J.; Rivera, J.P.; Veroustraete, F.; Clevers, J.G.P.W.; Moreno, J. Optical remote sensing and the retrieval of terrestrial vegetation bio-geophysical properties—A review. ISPRS J. Photogramm. Remote Sens. 2015, 108, 273–290. [Google Scholar] [CrossRef]
- Zhao, B.; Duan, A.; Ata-Ul-Karim, S.T.; Liu, Z.; Chen, Z.; Gong, Z.; Zhang, J.; Xiao, J.; Liu, Z.; Qin, A. Exploring new spectral bands and vegetation indices for estimating nitrogen nutrition index of summer maize. Eur. J. Agron. 2018, 93, 113–125. [Google Scholar] [CrossRef]
- Yao, X.; Zhu, Y.; Tian, Y.; Feng, W.; Cao, W. Exploring hyperspectral bands and estimation indices for leaf nitrogen accumulation in wheat. Int. J. Appl. Earth Obs. Geoinf. 2010, 12, 89–100. [Google Scholar] [CrossRef]
- Zhou, Z.; Jabloun, M.; Plauborg, F.; Andersen, M.N. Using ground-based spectral reflectance sensors and photography to estimate shoot N concentration and dry matter of potato. Comput. Electron. Agric. 2018, 144, 154–163. [Google Scholar] [CrossRef]
- Chlingaryan, A.; Sukkarieh, S.; Whelan, B. Machine learning approaches for crop yield prediction and nitrogen status estimation in precision agriculture: A review. Comput. Electron. Agric. 2018, 151, 61–69. [Google Scholar] [CrossRef]
- Jiang, J.; Atkinson, P.M.; Zhang, J.; Lu, R.; Zhou, Y.; Cao, Q.; Tian, Y.; Zhu, Y.; Cao, W.; Liu, X. Combining fixed-wing UAV multispectral imagery and machine learning to diagnose winter wheat nitrogen status at the farm scale. Eur. J. Agron. 2022, 138, 126537. [Google Scholar] [CrossRef]
- Zha, H.; Miao, Y.; Wang, T.; Li, Y.; Zhang, J.; Sun, W.; Feng, Z.; Kusnierek, K. Improving unmanned aerial vehicle remote sensing-based rice nitrogen nutrition index prediction with machine learning. Remote Sens. 2020, 12, 215. [Google Scholar] [CrossRef]
- Yang, H.; Yin, H.; Li, F.; Hu, Y.; Yu, K. Machine learning models fed with optimized spectral indices to advance crop nitrogen monitoring. Field Crops Res. 2023, 293, 108844. [Google Scholar] [CrossRef]
- Osco, L.P.; Junior, J.M.; Ramos, A.P.M.; Furuya, D.E.G.; Santana, D.C.; Teodoro, L.P.R.; Gonçalves, W.N.; Baio, F.H.R.; Pistori, H.; Junior, C.A.d.S. Leaf nitrogen concentration and plant height prediction for maize using UAV-based multispectral imagery and machine learning techniques. Remote Sens. 2020, 12, 3237. [Google Scholar] [CrossRef]
- Tang, Z.; Xiang, Y.; Zhang, W.; Wang, X.; Zhang, F.; Chen, J. Research on potato (Solanum tuberosum L.) nitrogen nutrition diagnosis based on hyperspectral data. Agron. J. 2024, 116, 531–541. [Google Scholar] [CrossRef]
- Yang, S.; Huang, Y. Application of support vector machine based on time series for soil moisture and nitratenitrogen content prediction. In Computer and Computing Technologies in Agriculture II, Volume 3: The Second IFIP International Conference on Computer and Computing Technologies in Agriculture (CCTA2008), Beijing, China, 18–20 October 2008; Springer: Berlin/Heidelberg, Germany, 2009; pp. 2037–2045. [Google Scholar]
- Lee, H.; Wang, J.; Leblon, B. Using linear regression, random forests, and support vector machine with unmanned aerial vehicle multispectral images to predict canopy nitrogen weight in corn. Remote Sens. 2020, 12, 2071. [Google Scholar] [CrossRef]
- Li, H.; Leng, W.; Zhou, Y.; Chen, F.; Xiu, Z.; Yang, D. Evaluation models for soil nutrient based on support vector machine and artificial neural networks. Sci. World J. 2014, 2014, 478569. [Google Scholar] [CrossRef]
- Pradeep, G.; Rayen, T.D.V.; Pushpalatha, A.; Rani, P.K. Effective crop yield prediction using gradient boosting to improve agricultural outcomes. In Proceedings of the 2023 International Conference on Networking and Communications (ICNWC), Chennai, India, 5–6 April 2023; IEEE: Piscataway, NJ, USA, 2023; pp. 1–6. [Google Scholar]
- Huber, F.; Yushchenko, A.; Stratmann, B.; Steinhage, V. Extreme Gradient Boosting for yield estimation compared with Deep Learning approaches. Comput. Electron. Agric. 2022, 202, 107346. [Google Scholar] [CrossRef]
- Fei, S.; Li, L.; Han, Z.; Chen, Z.; Xiao, Y. Combining novel feature selection strategy and hyperspectral vegetation indices to predict crop yield. Plant Methods 2022, 18, 119. [Google Scholar] [CrossRef]
- Uǧuz, H. A two-stage feature selection method for text categorization by using information gain, principal component analysis and genetic algorithm. Knowl. Based Syst. 2011, 24, 1024–1032. [Google Scholar] [CrossRef]
- Azizabadi, E.C.; Badreldin, N. A Review on Potato Crop Yield and Nitrogen Management Utilizing Remote/Proximal Sensing Technologies and Machine Learning Models in Canada. Potato Res. 2024, 2024, 1–21. [Google Scholar] [CrossRef]
- Wang, Y.; Brandt, T.L.; Olsen, N.L. A historical look at russet burbank potato (Solanum tuberosum L.) quality under different storage regimes. Am. J. Potato Res. 2016, 93, 474–484. [Google Scholar] [CrossRef]
- Westermann, D.T. Fertility management. In Potato Health Management; Rowe, R.C., Ed.; APS Press: St. Paul, MN, USA, 1993; pp. 77–86. [Google Scholar]
- Horneck, D.A.; Sullivan, D.M.; Owen, J.; Hart, J.M. Soil Test Interpretation Guide. Available online: https://catalog.extension.oregonstate.edu/ec1478 (accessed on 23 May 2025).
- Yang, H.; Li, F.; Hu, Y.; Yu, K. Hyperspectral indices optimization algorithms for estimating canopy nitrogen concentration in potato (Solanum tuberosum L.). Int. J. Appl. Earth Obs. Geoinf. 2021, 102, 102416. [Google Scholar] [CrossRef]
- Hunt, E.R., Jr.; Doraiswamy, P.C.; McMurtrey, J.E.; Daughtry, C.S.T.; Perry, E.M.; Akhmedov, B. A visible band index for remote sensing leaf chlorophyll content at the canopy scale. Int. J. Appl. Earth Obs. Geoinf. 2013, 21, 103–112. [Google Scholar] [CrossRef]
- Gao, S.; Yan, K.; Liu, J.; Pu, J.; Zou, D.; Qi, J.; Mu, X.; Yan, G. Assessment of remote-sensed vegetation indices for estimating forest chlorophyll concentration. Ecol. Indic. 2024, 162, 112001. [Google Scholar] [CrossRef]
- Rodrigues, M.; Cezar, E.; Argenta, J.C.; Barcelos, L.B.; Reis, A.S.; dos Santos, G.L.A.A.; de Oliveira, K.M.; de Oliveira, R.B.; Rafael Nanni, M. Relationship Between Vegetation Indices, Nutrients Content, and the Biomass Production of Brachiaria (Brachiaria ruziziensis). Commun. Soil. Sci. Plant Anal. 2022, 53, 2400–2419. [Google Scholar] [CrossRef]
- Rouse, J.W.; Haas, R.H.; Schell, J.A.; Deering, D.W. Monitoring vegetation systems in the Great Plains with ERTS. NASA Spec. Publ. 1974, 351, 309. [Google Scholar]
- Gitelson, A.A.; Kaufman, Y.J.; Merzlyak, M.N. Use of a green channel in remote sensing of global vegetation from EOS-MODIS. Remote Sens. Environ. 1996, 58, 289–298. [Google Scholar] [CrossRef]
- Richardson, A.J.; Wiegand, C.L. Distinguishing vegetation from soil background information. Photogramm. Eng. Remote Sens. 1977, 43, 1541–1552. [Google Scholar]
- Bausch, W.C.; Duke, H.R. Remote sensing of plant nitrogen status in corn. Trans. ASAE 1996, 39, 1869–1875. [Google Scholar] [CrossRef]
- Zhu, Y.; Yao, X.; Tian, Y.; Liu, X.; Cao, W. Analysis of common canopy vegetation indices for indicating leaf nitrogen accumulations in wheat and rice. Int. J. Appl. Earth Obs. Geoinf. 2008, 10, 1–10. [Google Scholar] [CrossRef]
- Johnson, D.E.; Harris, N.R.; Louhaichi, M.; Casady, G.M.; Borman, M.M. Mapping selected noxious weeds using remote sensing and geographic information systems. In Abstracts of Papers of the American Chemical Society; American Chemical Society: Washington, DC, USA, 2001; p. U48. [Google Scholar]
- Huete, A.R. A soil-adjusted vegetation index (SAVI). Remote Sens. Environ. 1988, 25, 295–309. [Google Scholar] [CrossRef]
- Gitelson, A.A.; Gritz, Y.; Merzlyak, M.N. Relationships between leaf chlorophyll content and spectral reflectance and algorithms for non-destructive chlorophyll assessment in higher plant leaves. J. Plant Physiol. 2003, 160, 271–282. [Google Scholar] [CrossRef] [PubMed]
- Daughtry, C.S.T.; Walthall, C.L.; Kim, M.S.; De Colstoun, E.B.; McMurtrey Iii, J.E. Estimating corn leaf chlorophyll concentration from leaf and canopy reflectance. Remote Sens. Environ. 2000, 74, 229–239. [Google Scholar] [CrossRef]
- Gitelson, A.; Merzlyak, M.N. Spectral reflectance changes associated with autumn senescence of Aesculus hippocastanum L. and Acer platanoides L. leaves. Spectral features and relation to chlorophyll estimation. J. Plant Physiol. 1994, 143, 286–292. [Google Scholar] [CrossRef]
- Wold, S.; Sjöström, M.; Eriksson, L. PLS-regression: A basic tool of chemometrics. Chemom. Intell. Lab. Syst. 2001, 58, 109–130. [Google Scholar] [CrossRef]
- Kursa, M.B.; Rudnicki, W.R. Feature selection with the Boruta package. J. Stat. Softw. 2010, 36, 1–13. [Google Scholar] [CrossRef]
- Guyon, I.; Elisseeff, A. An introduction to variable and feature selection. J. Mach. Learn. Res. 2003, 3, 1157–1182. [Google Scholar]
- Rodriguez-Galiano, V.; Sanchez-Castillo, M.; Chica-Olmo, M.; Chica-Rivas, M. Machine learning predictive models for mineral prospectivity: An evaluation of neural networks, random forest, regression trees and support vector machines. Ore Geol. Rev. 2015, 71, 804–818. [Google Scholar] [CrossRef]
- Shao, Y.; Zhao, C.; Bao, Y.; He, Y. Quantification of nitrogen status in rice by least squares support vector machines and reflectance spectroscopy. Food Bioprocess Technol. 2012, 5, 100–107. [Google Scholar] [CrossRef]
- Smola, A.J.; Schölkopf, B. A tutorial on support vector regression. Stat. Comput. 2004, 14, 199–222. [Google Scholar] [CrossRef]
- Friedman, J.H. Greedy function approximation: A gradient boosting machine. Ann. Stat. 2001, 29, 1189–1232. [Google Scholar] [CrossRef]
- Hastie, T.; Friedman, J.; Tibshirani, R. Boosting and Additive Trees. In The Elements of Statistical Learning; Springer: New York, NY, USA, 2001; pp. 299–345. [Google Scholar] [CrossRef]
- El-Kenawy, E.-S.M.; Alhussan, A.A.; Khodadadi, N.; Mirjalili, S.; Eid, M.M. Predicting Potato Crop Yield with Machine Learning and Deep Learning for Sustainable Agriculture. Potato Res. 2025, 68, 759–792. [Google Scholar] [CrossRef]
- Yin, H.; Huang, W.; Li, F.; Yang, H.; Li, Y.; Hu, Y.; Yu, K. Multi-temporal UAV imaging-based mapping of chlorophyll content in potato crop. PFG J. Photogramm. Remote Sens. Geoinf. Sci. 2023, 91, 91–106. [Google Scholar] [CrossRef]
- Salvador-Castillo, J.M.; Bolaños-González, M.A.; Palacios-Vélez, E.; Palacios-Sánchez, L.A.; López-Pérez, A.; Muñoz-Pérez, J.M. Estimation of fractional vegetation cover and canopy nitrogen content in corn by remote sensing. Rev. Terra Latinoam. 2021, 39. [Google Scholar]
- Soltanikazemi, M.; Minaei, S.; Shafizadeh-Moghadam, H.; Mahdavian, A. Field-scale estimation of sugarcane leaf nitrogen content using vegetation indices and spectral bands of Sentinel-2: Application of random forest and support vector regression. Comput. Electron. Agric. 2022, 200, 107130. [Google Scholar] [CrossRef]
- Belgiu, M.; Drăguţ, L. Random forest in remote sensing: A review of applications and future directions. ISPRS J. Photogramm. Remote Sens. 2016, 114, 24–31. [Google Scholar] [CrossRef]
- Feng, L.; Zhang, Z.; Ma, Y.; Du, Q.; Williams, P.; Drewry, J.; Luck, B. Alfalfa yield prediction using UAV-based hyperspectral imagery and ensemble learning. Remote Sens. 2020, 12, 2028. [Google Scholar] [CrossRef]
- Li, Z.; Chen, Z.; Cheng, Q.; Duan, F.; Sui, R.; Huang, X.; Xu, H. UAV-based hyperspectral and ensemble machine learning for predicting yield in winter wheat. Agronomy 2022, 12, 202. [Google Scholar] [CrossRef]
- Mahesh, P.; Soundrapandiyan, R. Yield prediction for crops by gradient-based algorithms. PLoS ONE 2024, 19, e0291928. [Google Scholar] [CrossRef]
- Khan, A.; Vibhute, A.D.; Mali, S.; Patil, C.H. A systematic review on hyperspectral imaging technology with a machine and deep learning methodology for agricultural applications. Ecol. Inform. 2022, 69, 101678. [Google Scholar] [CrossRef]
- Baret, F.; Houlès, V.; Guerif, M. Quantification of plant stress using remote sensing observations and crop models: The case of nitrogen management. J. Exp. Bot. 2007, 58, 869–880. [Google Scholar] [CrossRef] [PubMed]
- Houlès, V.; Mary, B.; Guérif, M.; Makowski, D.; Justes, E. Evaluation of the ability of the crop model STICS to recommend nitrogen fertilisation rates according to agro-environmental criteria. Agronomie 2004, 24, 339–349. [Google Scholar] [CrossRef]
Disclaimer/Publisher’s Note: The statements, opinions and data contained in all publications are solely those of the individual author(s) and contributor(s) and not of MDPI and/or the editor(s). MDPI and/or the editor(s) disclaim responsibility for any injury to people or property resulting from any ideas, methods, instructions or products referred to in the content. |
© 2025 by the authors. Licensee MDPI, Basel, Switzerland. This article is an open access article distributed under the terms and conditions of the Creative Commons Attribution (CC BY) license (https://creativecommons.org/licenses/by/4.0/).