


Assessment of Vegetation Dynamics After South Sugar Loaf and Snowstorm Wildfires Using Remote Sensing Spectral Indices


Abstract
1. Introduction
2. Literature Review
3. Study Area and Data
3.1. Study Area
3.2. Data
4. Methodology
4.1. Spectral Indices
4.2. Study Site Selection
4.3. Removing Seasonal Effects
4.4. Statistical Analysis
5. Results
5.1. Effects of Burn Severity
5.2. Trend Analysis of Spectral Indices
5.2.1. Snowstorm Fire
5.2.2. South Sugar Loaf
5.3. Effects of Burn Severity on Regrowth
5.3.1. Snowstorm
5.3.2. South Sugar Loaf
6. Discussion
6.1. Burn Severity Analysis
6.2. Spectral Indices Interpretation
6.3. Normalized Difference Vegetation Index (NDVI)
6.4. Moisture Stress Index (MSI)
6.5. Generalizability and Monitoring Implications
6.6. Future Directions
7. Conclusions
Author Contributions
Funding
Data Availability Statement
Conflicts of Interest
References
- Bowd, E.J.; Banks, S.C.; Strong, C.L.; Lindenmayer, D.B. Long-Term Impacts of Wildfire and Logging on Forest Soils. Nat. Geosci. 2019, 12, 113–118. [Google Scholar] [CrossRef]
- Ebel, B.A. Temporal Evolution of Measured and Simulated Infiltration Following Wildfire in the Colorado Front Range, USA: Shifting Thresholds of Runoff Generation and Hydrologic Hazards. J. Hydrol. 2020, 585, 124765. [Google Scholar] [CrossRef]
- Francos, M.; Úbeda, X.; Pereira, P.; Alcañiz, M. Long-Term Impact of Wildfire on Soils Exposed to Different Fire Severities. A Case Study in Cadiretes Massif (NE Iberian Peninsula). Sci. Total Environ. 2018, 615, 664–671. [Google Scholar] [CrossRef]
- Johnstone, J.F.; Allen, C.D.; Franklin, J.F.; Frelich, L.E.; Harvey, B.J.; Higuera, P.E.; Mack, M.C.; Meentemeyer, R.K.; Metz, M.R.; Perry, G.L.; et al. Changing Disturbance Regimes, Ecological Memory, and Forest Resilience. Front. Ecol. Environ. 2016, 14, 369–378. [Google Scholar] [CrossRef]
- Lee, J.H. Prediction of Large-Scale Wildfires With the Canopy Stress Index Derived from Soil Moisture Active Passive. IEEE J. Sel. Top. Appl. Earth Obs. Remote Sens. 2021, 14, 2096–2102. [Google Scholar] [CrossRef]
- van Leeuwen, W.J.D.; Casady, G.M.; Neary, D.G.; Bautista, S.; Alloza, J.A.; Carmel, Y.; Wittenberg, L.; Malkinson, D.; Orr, B.J. Monitoring Post-Wildfire Vegetation Response with Remotely Sensed Time-Series Data in Spain, USA and Israel. Int. J. Wildland Fire 2010, 19, 75–93. [Google Scholar] [CrossRef]
- Tian, Y.; Wu, Z.; Li, M.; Wang, B.; Zhang, X. Forest Fire Spread Monitoring and Vegetation Dynamics Detection Based on Multi-Source Remote Sensing Images. Remote Sens. 2022, 14, 4431. [Google Scholar] [CrossRef]
- Ahmad, I.; Stephen, H.; Ahmad, S. Machine Learning-Based Land Cover Classification and Impact Assessment in Pre-Wildfire and Post-Wildfire Areas. In Proceedings of the World Environmental and Water Resources Congress 2024, Milwaukee, WI, USA, 19–22 May 2024; pp. 1572–1582. [Google Scholar] [CrossRef]
- Avetisyan, D.; Velizarova, E.; Filchev, L. Post-Fire Forest Vegetation State Monitoring through Satellite Remote Sensing and In Situ Data. Remote Sens. 2022, 14, 6266. [Google Scholar] [CrossRef]
- Shvetsov, E.G.; Kukavskaya, E.A.; Buryak, L.V.; Barrett, K. Assessment of Post-Fire Vegetation Recovery in Southern Siberia Using Remote Sensing Observations. Environ. Res. Lett. 2019, 14, 055001. [Google Scholar] [CrossRef]
- Ahmad, I.; Aslam, S.; Hussain, U. Assessment of Plastic Pollution in Coastal Areas of Karachi: Case Study of West Warf, Kemari Jetty, and Manora. Mar. Pollut. Bull. 2023, 195, 115501. [Google Scholar] [CrossRef]
- Yi, K.; Tani, H.; Zhang, J.; Guo, M.; Wang, X.; Zhong, G. Long-Term Satellite Detection of Post-Fire Vegetation Trends in Boreal Forests of China. Remote Sens. 2013, 5, 6938–6957. [Google Scholar] [CrossRef]
- Miller, J.D.; Thode, A.E. Quantifying Burn Severity in a Heterogeneous Landscape with a Relative Version of the Delta Normalized Burn Ratio (dNBR). Remote Sens. Environ. 2007, 109, 66–80. [Google Scholar] [CrossRef]
- Velizarova, E.; Nedkov, R.; Avetisyan, D.; Radeva, K.; Stoyanov, A.; Georgiev, N.; Gigova, I. Application of Remote Sensing Techniques for Monitoring of the Climatic Parameters in Forest Fire Vulnerable Regions in Bulgaria. In Proceedings of the Seventh International Conference on Remote Sensing and Geoinformation of the Environment (RSCy2019), Paphos, Cyprus, 18–21 March 2019; SPIE: Bellingham, WA, USA, 2019; Volume 11174, pp. 451–462. [Google Scholar]
- Xofis, P.; Buckley, P.G.; Takos, I.; Mitchley, J. Long Term Post-Fire Vegetation Dynamics in North-East Mediterranean Ecosystems. The Case of Mount Athos Greece. Fire 2021, 4, 92. [Google Scholar] [CrossRef]
- Verbesselt, J.; Hyndman, R.; Zeileis, A.; Culvenor, D. Phenological Change Detection While Accounting for Abrupt and Gradual Trends in Satellite Image Time Series. Remote Sens. Environ. 2010, 114, 2970–2980. [Google Scholar] [CrossRef]
- Wang, Q.; Adiku, S.; Tenhunen, J.; Granier, A. On the Relationship of NDVI with Leaf Area Index in a Deciduous Forest Site. Remote Sens. Environ. 2005, 94, 244–255. [Google Scholar] [CrossRef]
- Coops, N.C.; Waring, R.H.; Landsberg, J.J. Assessing Forest Productivity in Australia and New Zealand Using a Physiologically-Based Model Driven with Averaged Monthly Weather Data and Satellite-Derived Estimates of Canopy Photosynthetic Capacity. For. Ecol. Manag. 1998, 104, 113–127. [Google Scholar] [CrossRef]
- Myneni, R.B.; Hoffman, S.; Knyazikhin, Y.; Privette, J.L.; Glassy, J.; Tian, Y.; Wang, Y.; Song, X.; Zhang, Y.; Smith, G.R.; et al. Global Products of Vegetation Leaf Area and Fraction Absorbed PAR from Year One of MODIS Data. Remote Sens. Environ. 2002, 83, 214–231. [Google Scholar] [CrossRef]
- Richard, Y.; Poccard, I. A Statistical Study of NDVI Sensitivity to Seasonal and Interannual Rainfall Variations in Southern Africa. Int. J. Remote Sens. 1998, 19, 2907–2920. [Google Scholar] [CrossRef]
- Schloss, A.L.; Kicklighter, D.W.; Kaduk, J.; Wittenberg, U.; The Participants of the Potsdam NpP Model Intercomparison. Comparing Global Models of Terrestrial Net Primary Productivity (NPP): Comparison of NPP to Climate and the Normalized Difference Vegetation Index (NDVI). Glob. Change Biol. 1999, 5, 25–34. [Google Scholar] [CrossRef]
- Haboudane, D.; Miller, J.R.; Pattey, E.; Zarco-Tejada, P.J.; Strachan, I.B. Hyperspectral Vegetation Indices and Novel Algorithms for Predicting Green LAI of Crop Canopies: Modeling and Validation in the Context of Precision Agriculture. Remote Sens. Environ. 2004, 90, 337–352. [Google Scholar] [CrossRef]
- Stankova, N.; Nedkov, R.; Ivanova, I.; Avetisyan, D. Modeling of Forest Ecosystems Recovery after Fire Based on Orthogonalization of Multispectral Satellite Data. In Proceedings of the Earth Resources and Environmental Remote Sensing/GIS Applications IX, Berlin, Germany, 11–13 September 2018; SPIE: Bellingham, WA, USA, 2018; Volume 10790, pp. 426–432. [Google Scholar]
- Daughtry, C.S.T.; Walthall, C.L.; Kim, M.S.; de Colstoun, E.B.; McMurtrey, J.E. Estimating Corn Leaf Chlorophyll Concentration from Leaf and Canopy Reflectance. Remote Sens. Environ. 2000, 74, 229–239. [Google Scholar] [CrossRef]
- Zhao, X.; Cao, C.; Ni, X.; Chen, W. Retrieval and Application of Leaf Area Index over China Using HJ-1 Data. Geomat. Nat. Hazards Risk 2017, 8, 478–495. [Google Scholar] [CrossRef]
- Cao, X.; Cui, X.; Yue, M.; Chen, J.; Tanikawa, H.; Ye, Y. Evaluation of Wildfire Propagation Susceptibility in Grasslands Using Burned Areas and Multivariate Logistic Regression. Int. J. Remote Sens. 2013, 34, 6679–6700. [Google Scholar] [CrossRef]
- Schut, A.G.T.; Stephens, D.J.; Stovold, R.G.H.; Adams, M.; Craig, R.L.; Schut, A.G.T.; Stephens, D.J.; Stovold, R.G.H.; Adams, M.; Craig, R.L. Improved Wheat Yield and Production Forecasting with a Moisture Stress Index, AVHRR and MODIS Data. Crop Pasture Sci. 2009, 60, 60–70. [Google Scholar] [CrossRef]
- Avdan, U.; Jovanovska, G. Algorithm for Automated Mapping of Land Surface Temperature Using LANDSAT 8 Satellite Data. J. Sens. 2016, 2016, 1480307. [Google Scholar] [CrossRef]
- Kuenzer, C.; Dech, S. Thermal Infrared Remote Sensing: Sensors, Methods, Applications; Springer Science & Business Media: Berlin/Heidelberg, Germany, 2013; ISBN 978-94-007-6639-6. [Google Scholar]
- Vlassova, L.; Pérez-Cabello, F.; Mimbrero, M.R.; Llovería, R.M.; García-Martín, A. Analysis of the Relationship between Land Surface Temperature and Wildfire Severity in a Series of Landsat Images. Remote Sens. 2014, 6, 6136–6162. [Google Scholar] [CrossRef]
- Key, C.H.; Benson, N.C. Landscape Assessment (LA); U.S. Department of Agriculture, Forest Service, Rocky Mountain Research Station: Fort Collins, CO, USA, 2006. [Google Scholar]
- United States Geological Survey. US Forest Service; Kurtis Nelson Burn Severity Portal, a Clearing House of Fire Severity and Extent Information (Ver. 9.0, October 2024); United States Geological Survey: Reston, VA, USA, 2024.
- Freden, S.C.; Mercanti, E.P.; Becker, M.A. Third Earth Resources Technology Satellite-1 Symposium: Section A-B. Technical Presentations; Scientific and Technical Information Office, National Aeronautics and Space Administration: Hampton, VA, USA, 1974. [Google Scholar]
- Rock, B.N.; Vogelmann, J.E.; Williams, D.L.; Vogelmann, A.F.; Hoshizaki, T. Remote Detection of Forest Damage: Plant Responses to Stress May Have Spectral “Signatures” That Could Be Used to Map, Monitor, and Measure Forest Damage. BioScience 1986, 36, 439–445. [Google Scholar] [CrossRef]
- Dudek, G. STD: A Seasonal-Trend-Dispersion Decomposition of Time Series. IEEE Trans. Knowl. Data Eng. 2023, 35, 10339–10350. [Google Scholar] [CrossRef]
- Li, C.; Jia, X.; Zhu, R.; Mei, X.; Wang, D.; Zhang, X. Seasonal Spatiotemporal Changes in the NDVI and Its Driving Forces in Wuliangsu Lake Basin, Northern China from 1990 to 2020. Remote Sens. 2023, 15, 2965. [Google Scholar] [CrossRef]
- Leys, C.; Ley, C.; Klein, O.; Bernard, P.; Licata, L. Detecting Outliers: Do Not Use Standard Deviation around the Mean, Use Absolute Deviation around the Median. J. Exp. Soc. Psychol. 2013, 49, 764–766. [Google Scholar] [CrossRef]
- Kendall, M.G. Rank Correlation Methods; Rank correlation methods; Griffin: Oxford, UK, 1948. [Google Scholar]
- Mann, H.B. Nonparametric Tests Against Trend. Econometrica 1945, 13, 245–259. [Google Scholar] [CrossRef]
- Sen, P.K. Estimates of the Regression Coefficient Based on Kendall’s Tau. J. Am. Stat. Assoc. 1968, 63, 1379–1389. [Google Scholar] [CrossRef]
- Wainwright, P.E.; Leatherdale, S.T.; Dubin, J.A. Advantages of Mixed Effects Models over Traditional ANOVA Models in Developmental Studies: A Worked Example in a Mouse Model of Fetal Alcohol Syndrome. Dev. Psychobiol. 2007, 49, 664–674. [Google Scholar] [CrossRef] [PubMed]
- Yu, Z.; Guindani, M.; Grieco, S.F.; Chen, L.; Holmes, T.C.; Xu, X. Beyond t Test and ANOVA: Applications of Mixed-Effects Models for More Rigorous Statistical Analysis in Neuroscience Research. Neuron 2022, 110, 21–35. [Google Scholar] [CrossRef]
- Luke, S.G. Evaluating Significance in Linear Mixed-Effects Models in R. Behav. Res. 2017, 49, 1494–1502. [Google Scholar] [CrossRef]
- Balch, J.K.; Bradley, B.A.; D’Antonio, C.M.; Gómez-Dans, J. Introduced Annual Grass Increases Regional Fire Activity across the Arid Western USA (1980–2009). Glob. Change Biol. 2013, 19, 173–183. [Google Scholar] [CrossRef]
- Chudnovsky, A.; Ben-Dor, E.; Saaroni, H. Diurnal Thermal Behavior of Selected Urban Objects Using Remote Sensing Measurements. Energy Build. 2004, 36, 1063–1074. [Google Scholar] [CrossRef]
- Johnstone, J.F.; Chapin, F.S.; Hollingsworth, T.N.; Mack, M.C.; Romanovsky, V.; Turetsky, M. Fire, Climate Change, and Forest Resilience in Interior Alaska. Can. J. For. Res. 2010, 40, 1302–1312. [Google Scholar] [CrossRef]
- Abatzoglou, J.T.; Kolden, C.A. Relationships between Climate and Macroscale Area Burned in the Western United States. Int. J. Wildland Fire 2013, 22, 1003–1020. [Google Scholar] [CrossRef]
- Klein, J.A.; Harte, J.; Zhao, X.-Q. Dynamic and Complex Microclimate Responses to Warming and Grazing Manipulations. Glob. Change Biol. 2005, 11, 1440–1451. [Google Scholar] [CrossRef]
- Asrar, G.; Fuchs, M.; Kanemasu, E.T.; Hatfield, J.L. Estimating Absorbed Photosynthetic Radiation and Leaf Area Index from Spectral Reflectance in Wheat. Agron. J. 1984, 76, 300–306. [Google Scholar] [CrossRef]
- Hunt, E.R.; Rock, B.N. Detection of Changes in Leaf Water Content Using Near- and Middle-Infrared Reflectances. Remote Sens. Environ. 1989, 30, 43–54. [Google Scholar] [CrossRef]
- Asner, G.P.; Knapp, D.E.; Kennedy-Bowdoin, T.; Jones, M.O.; Martin, R.E.; Boardman, J.; Hughes, R.F. Invasive Species Detection in Hawaiian Rainforests Using Airborne Imaging Spectroscopy and LiDAR. Remote Sens. Environ. 2008, 112, 1942–1955. [Google Scholar] [CrossRef]
- Dubayah, R.O.; Drake, J.B. Lidar Remote Sensing for Forestry. J. For. 2000, 98, 44–46. [Google Scholar] [CrossRef]


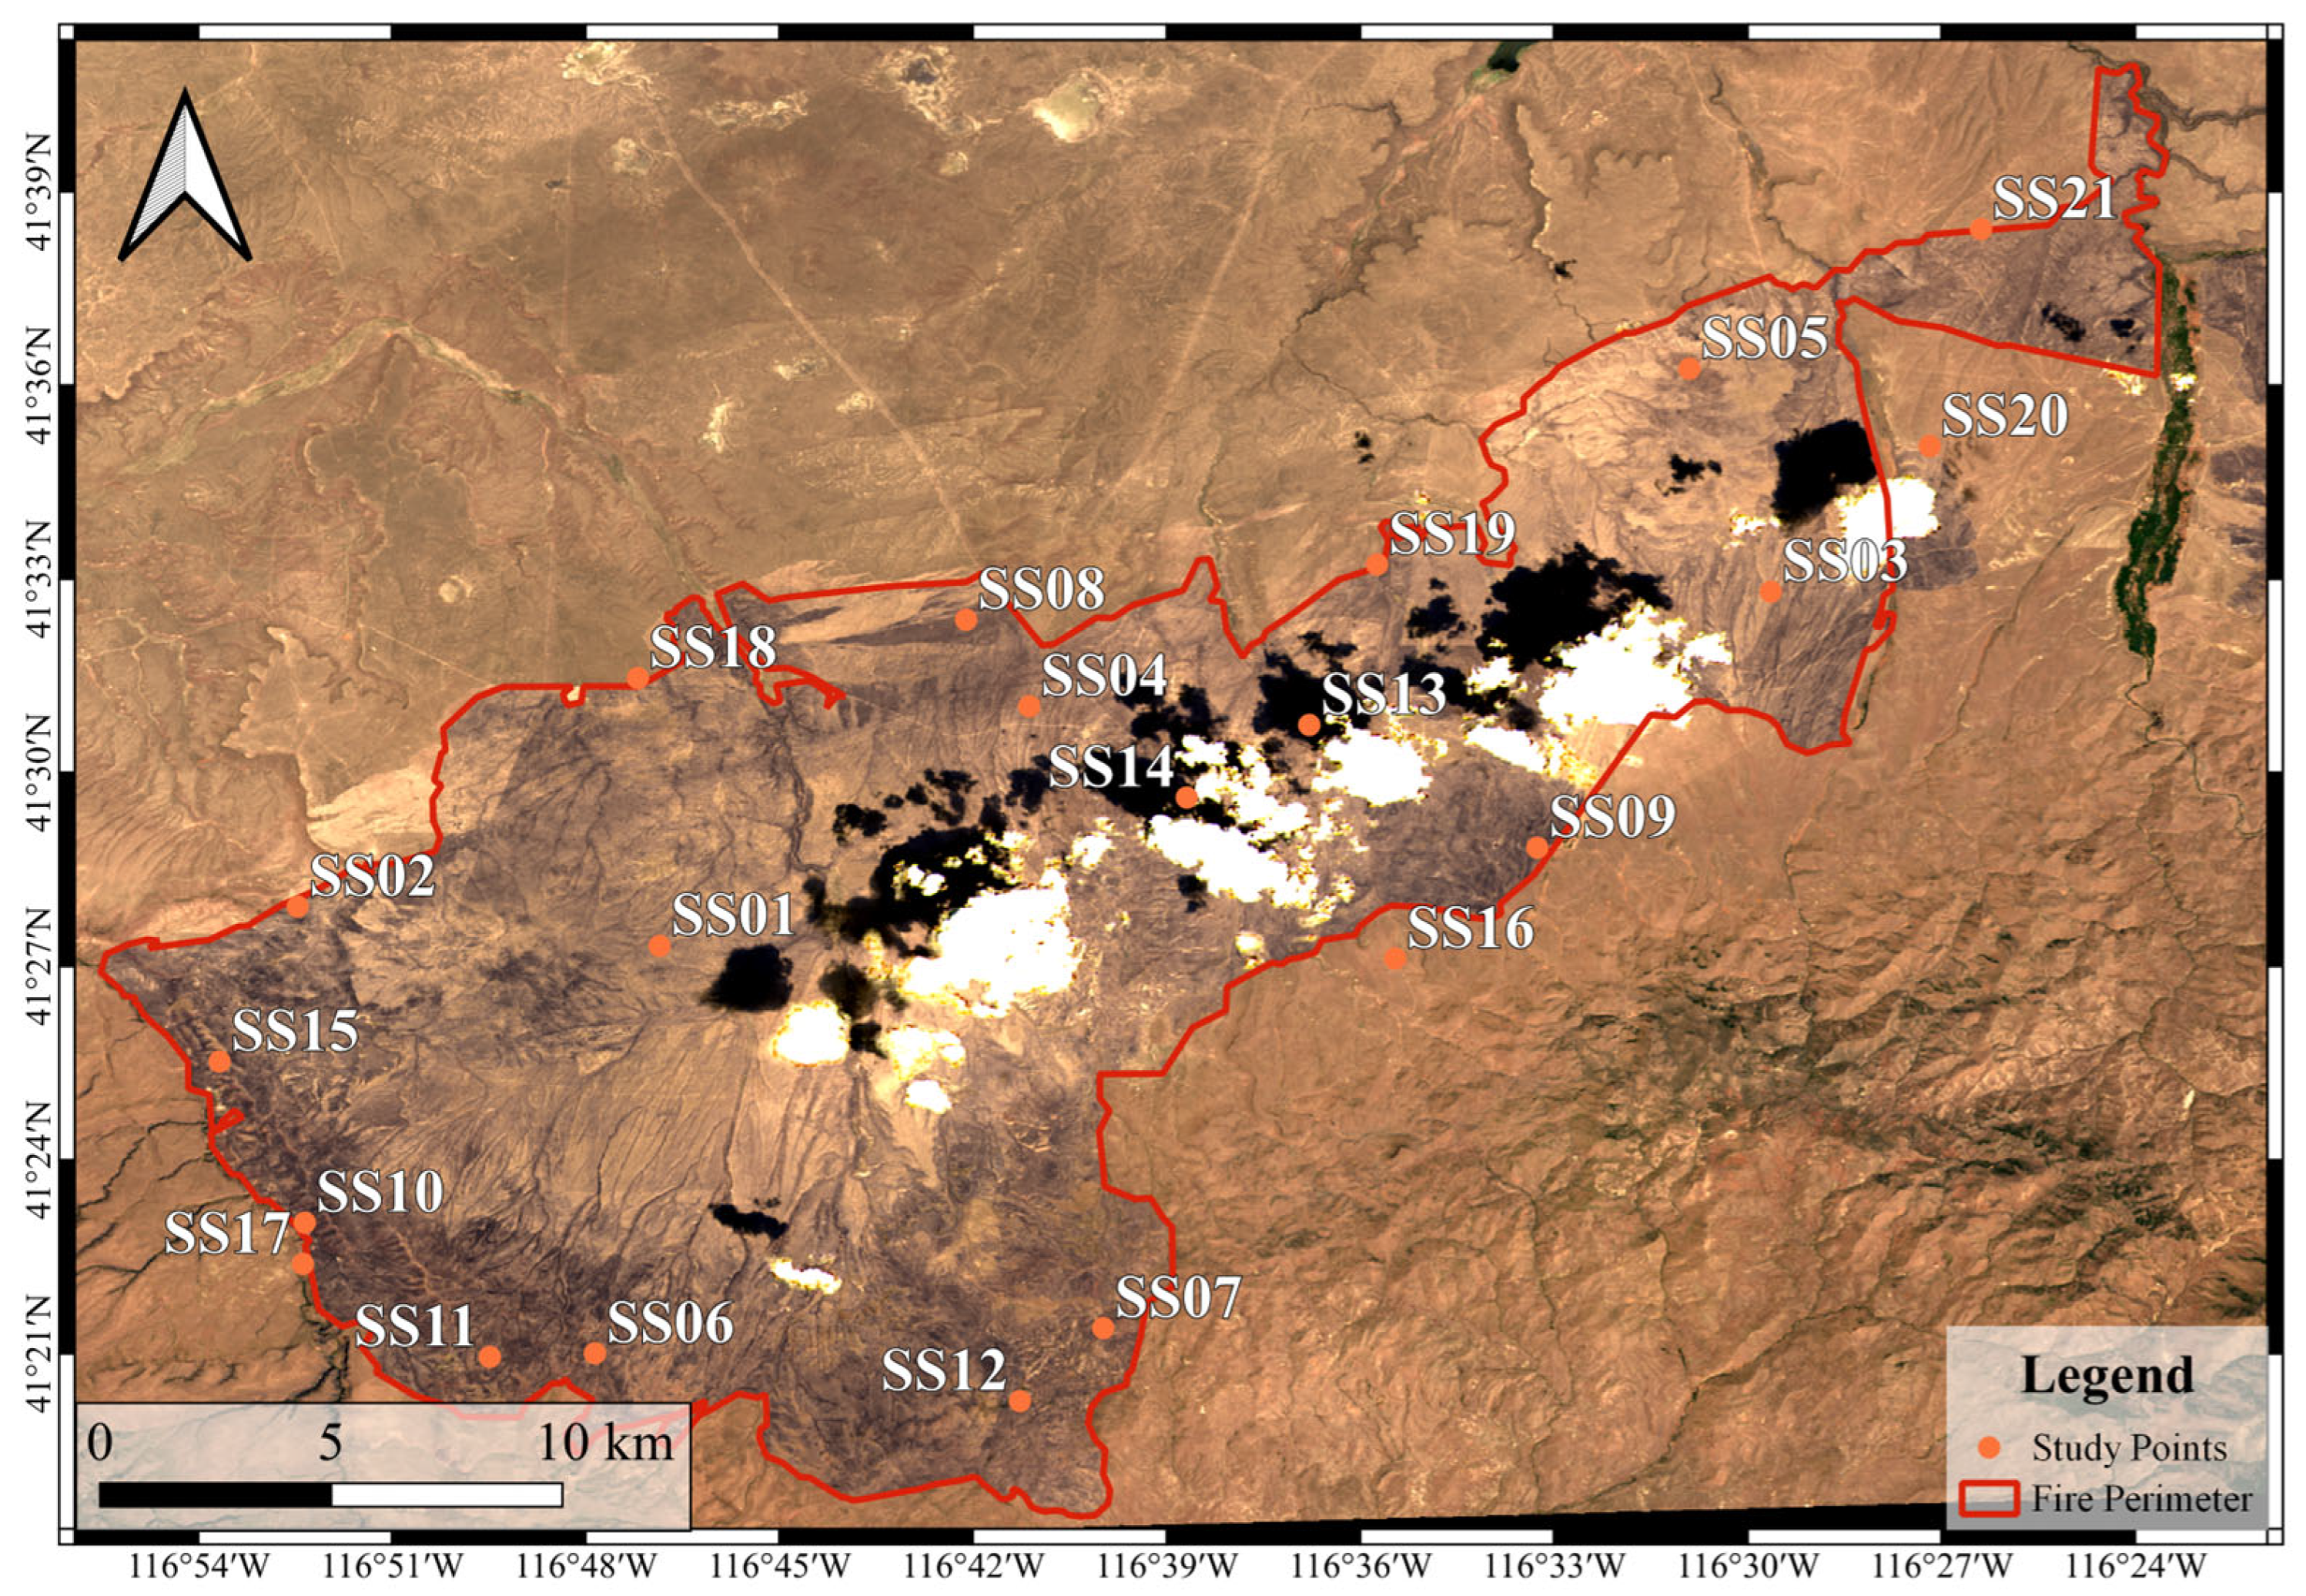
| Burn Severity Class | Study Points |
|---|---|
| Low severity (LS) | SS01, SS02, SS03, SS04, and SS05 |
| Moderate–low severity (MLS) | SS06, SS07, SS08, SS09 and SS10 |
| Moderate–high severity (MHS) | SS11, SS12, SS13, SS14, and SS15 |
| Outside fire perimeter | SS16, SS17, SS18, SS19, SS20 and SS21 |
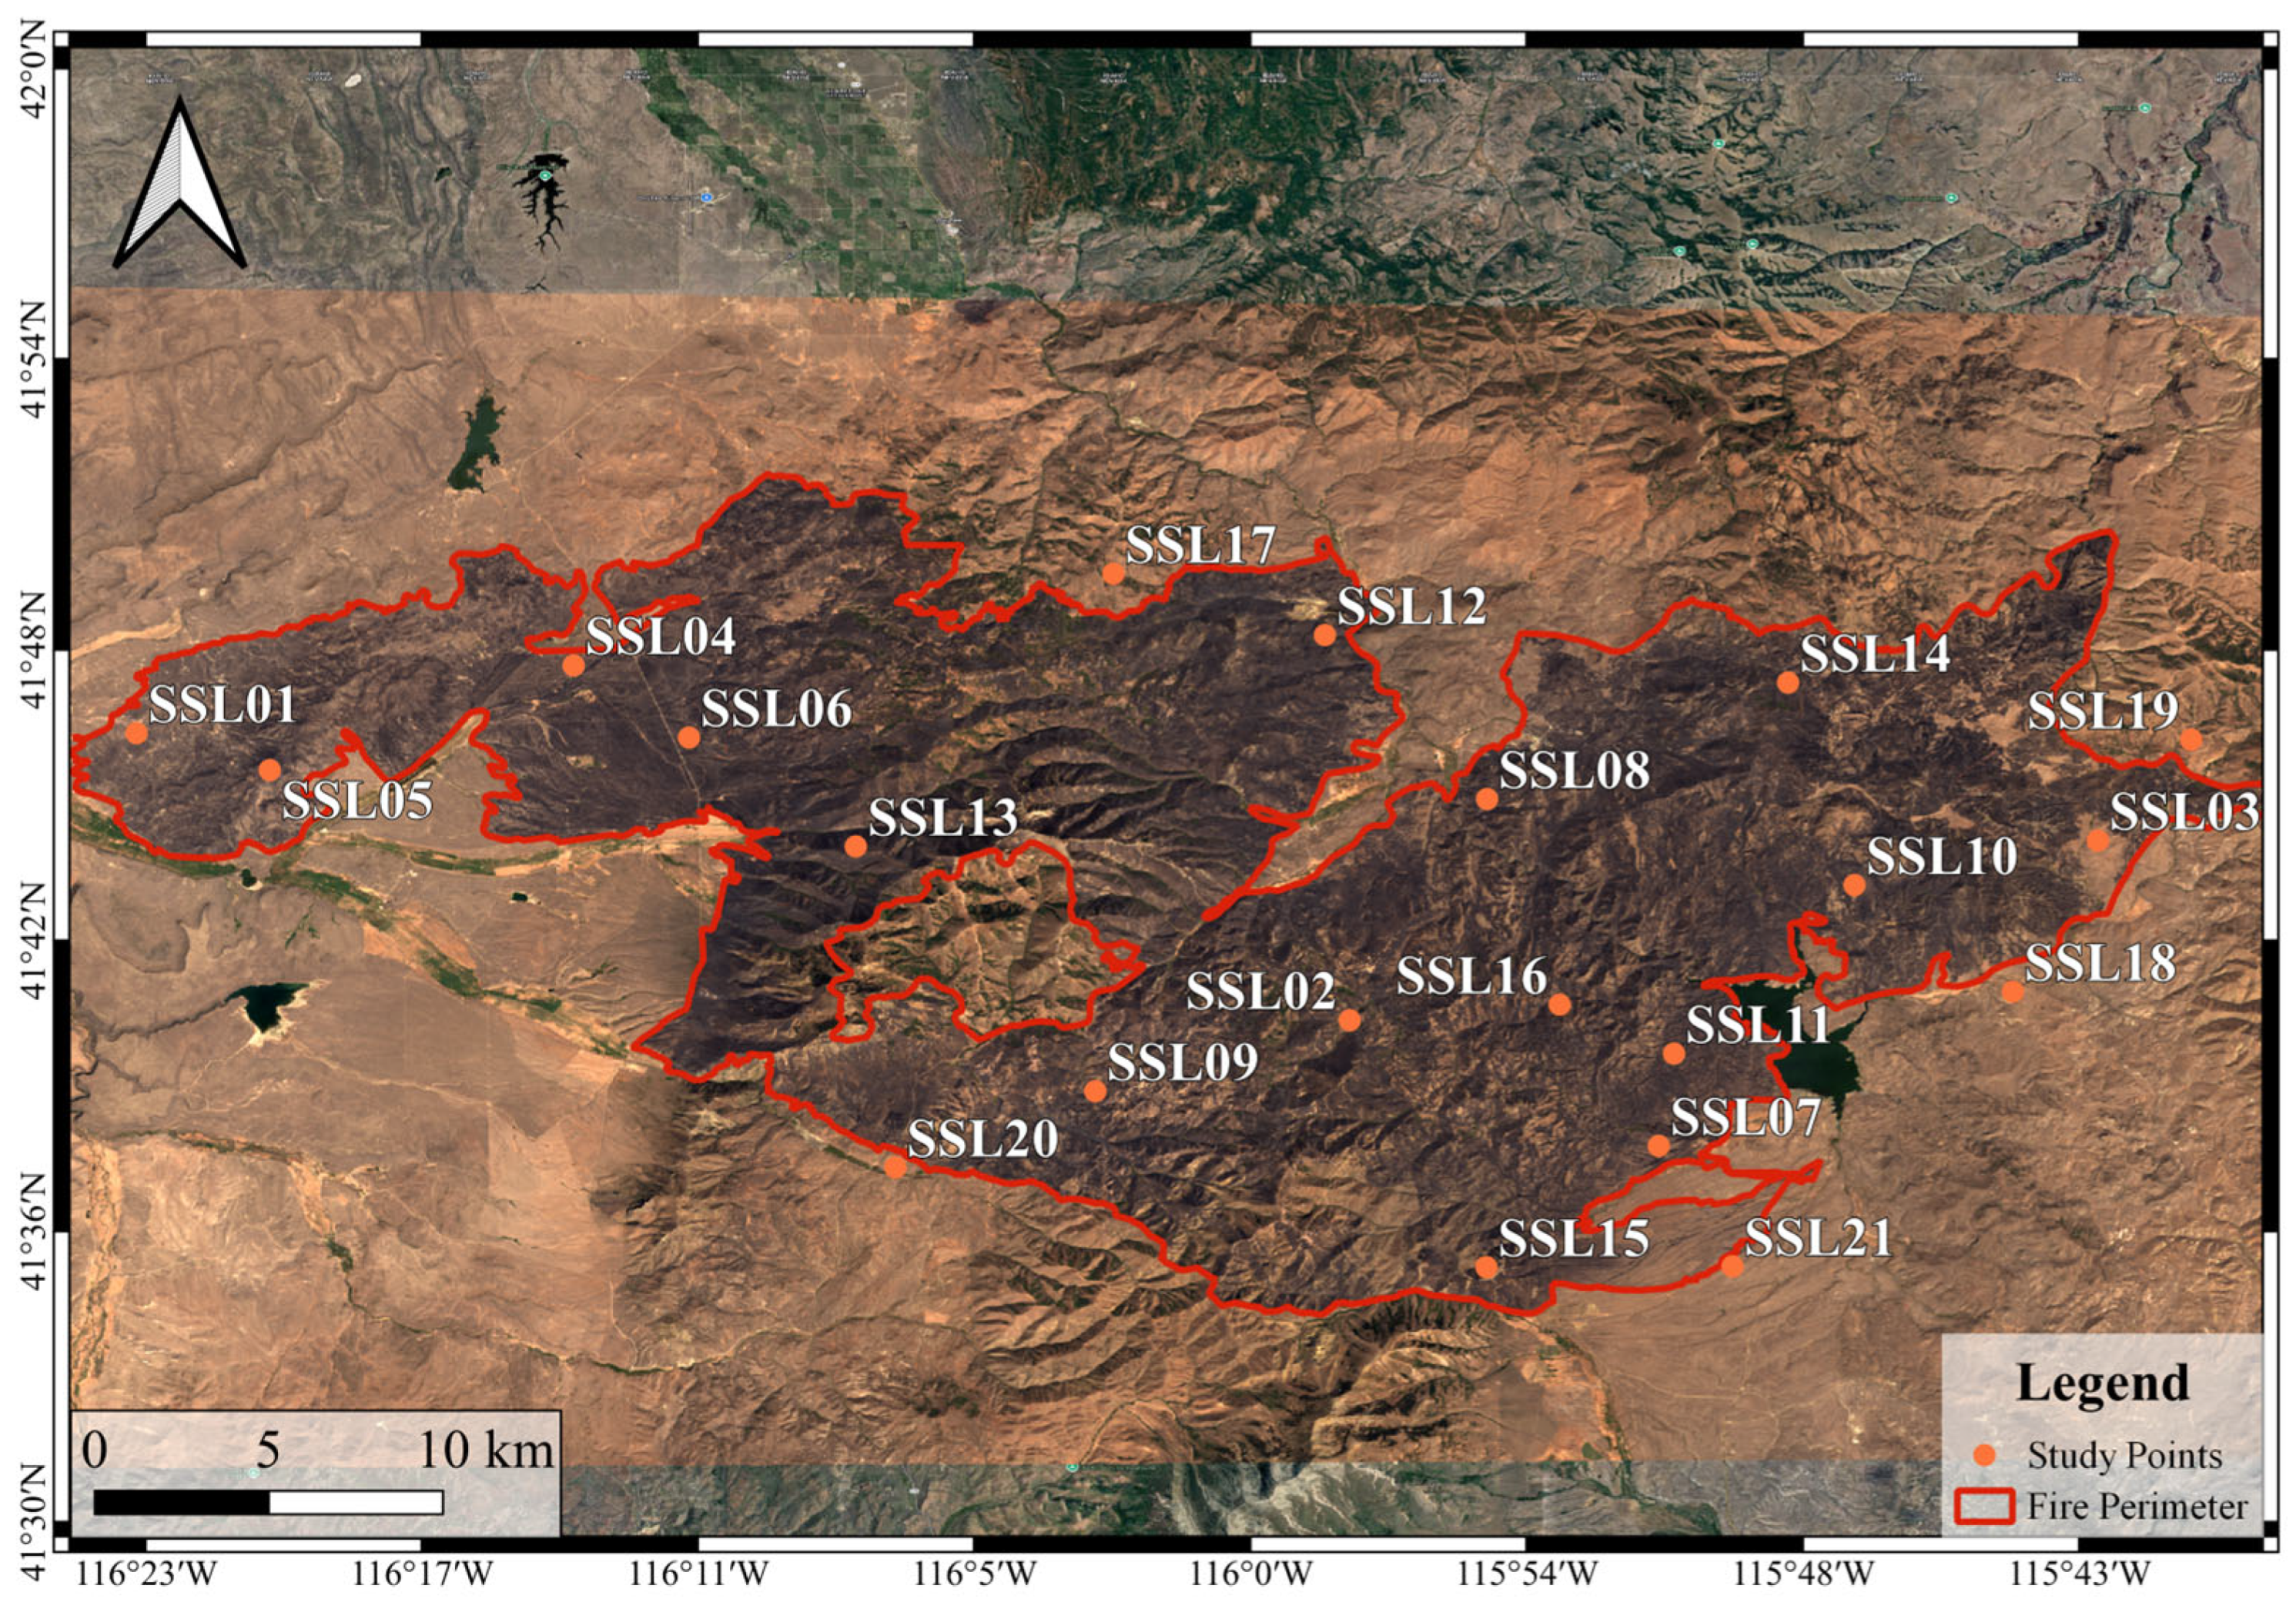
| Burn Severity Class | Study Points |
|---|---|
| Low severity (LS) | SSL01, SSL 02, SSL 03 and SSL 04 |
| Moderate–low severity (MLS) | SSL 05, SSL 06, SSL 07 and SSL 08 |
| Moderate–high severity (MHS) | SSL 09, SSL 10, SSL 11, and SSL 12 |
| High severity (HS) | SSL13, SSL14, SSL15, and SSL16 |
| Outside fire perimeter | SSL17, SSL18, SSL19, SSL20, and SSL21 |
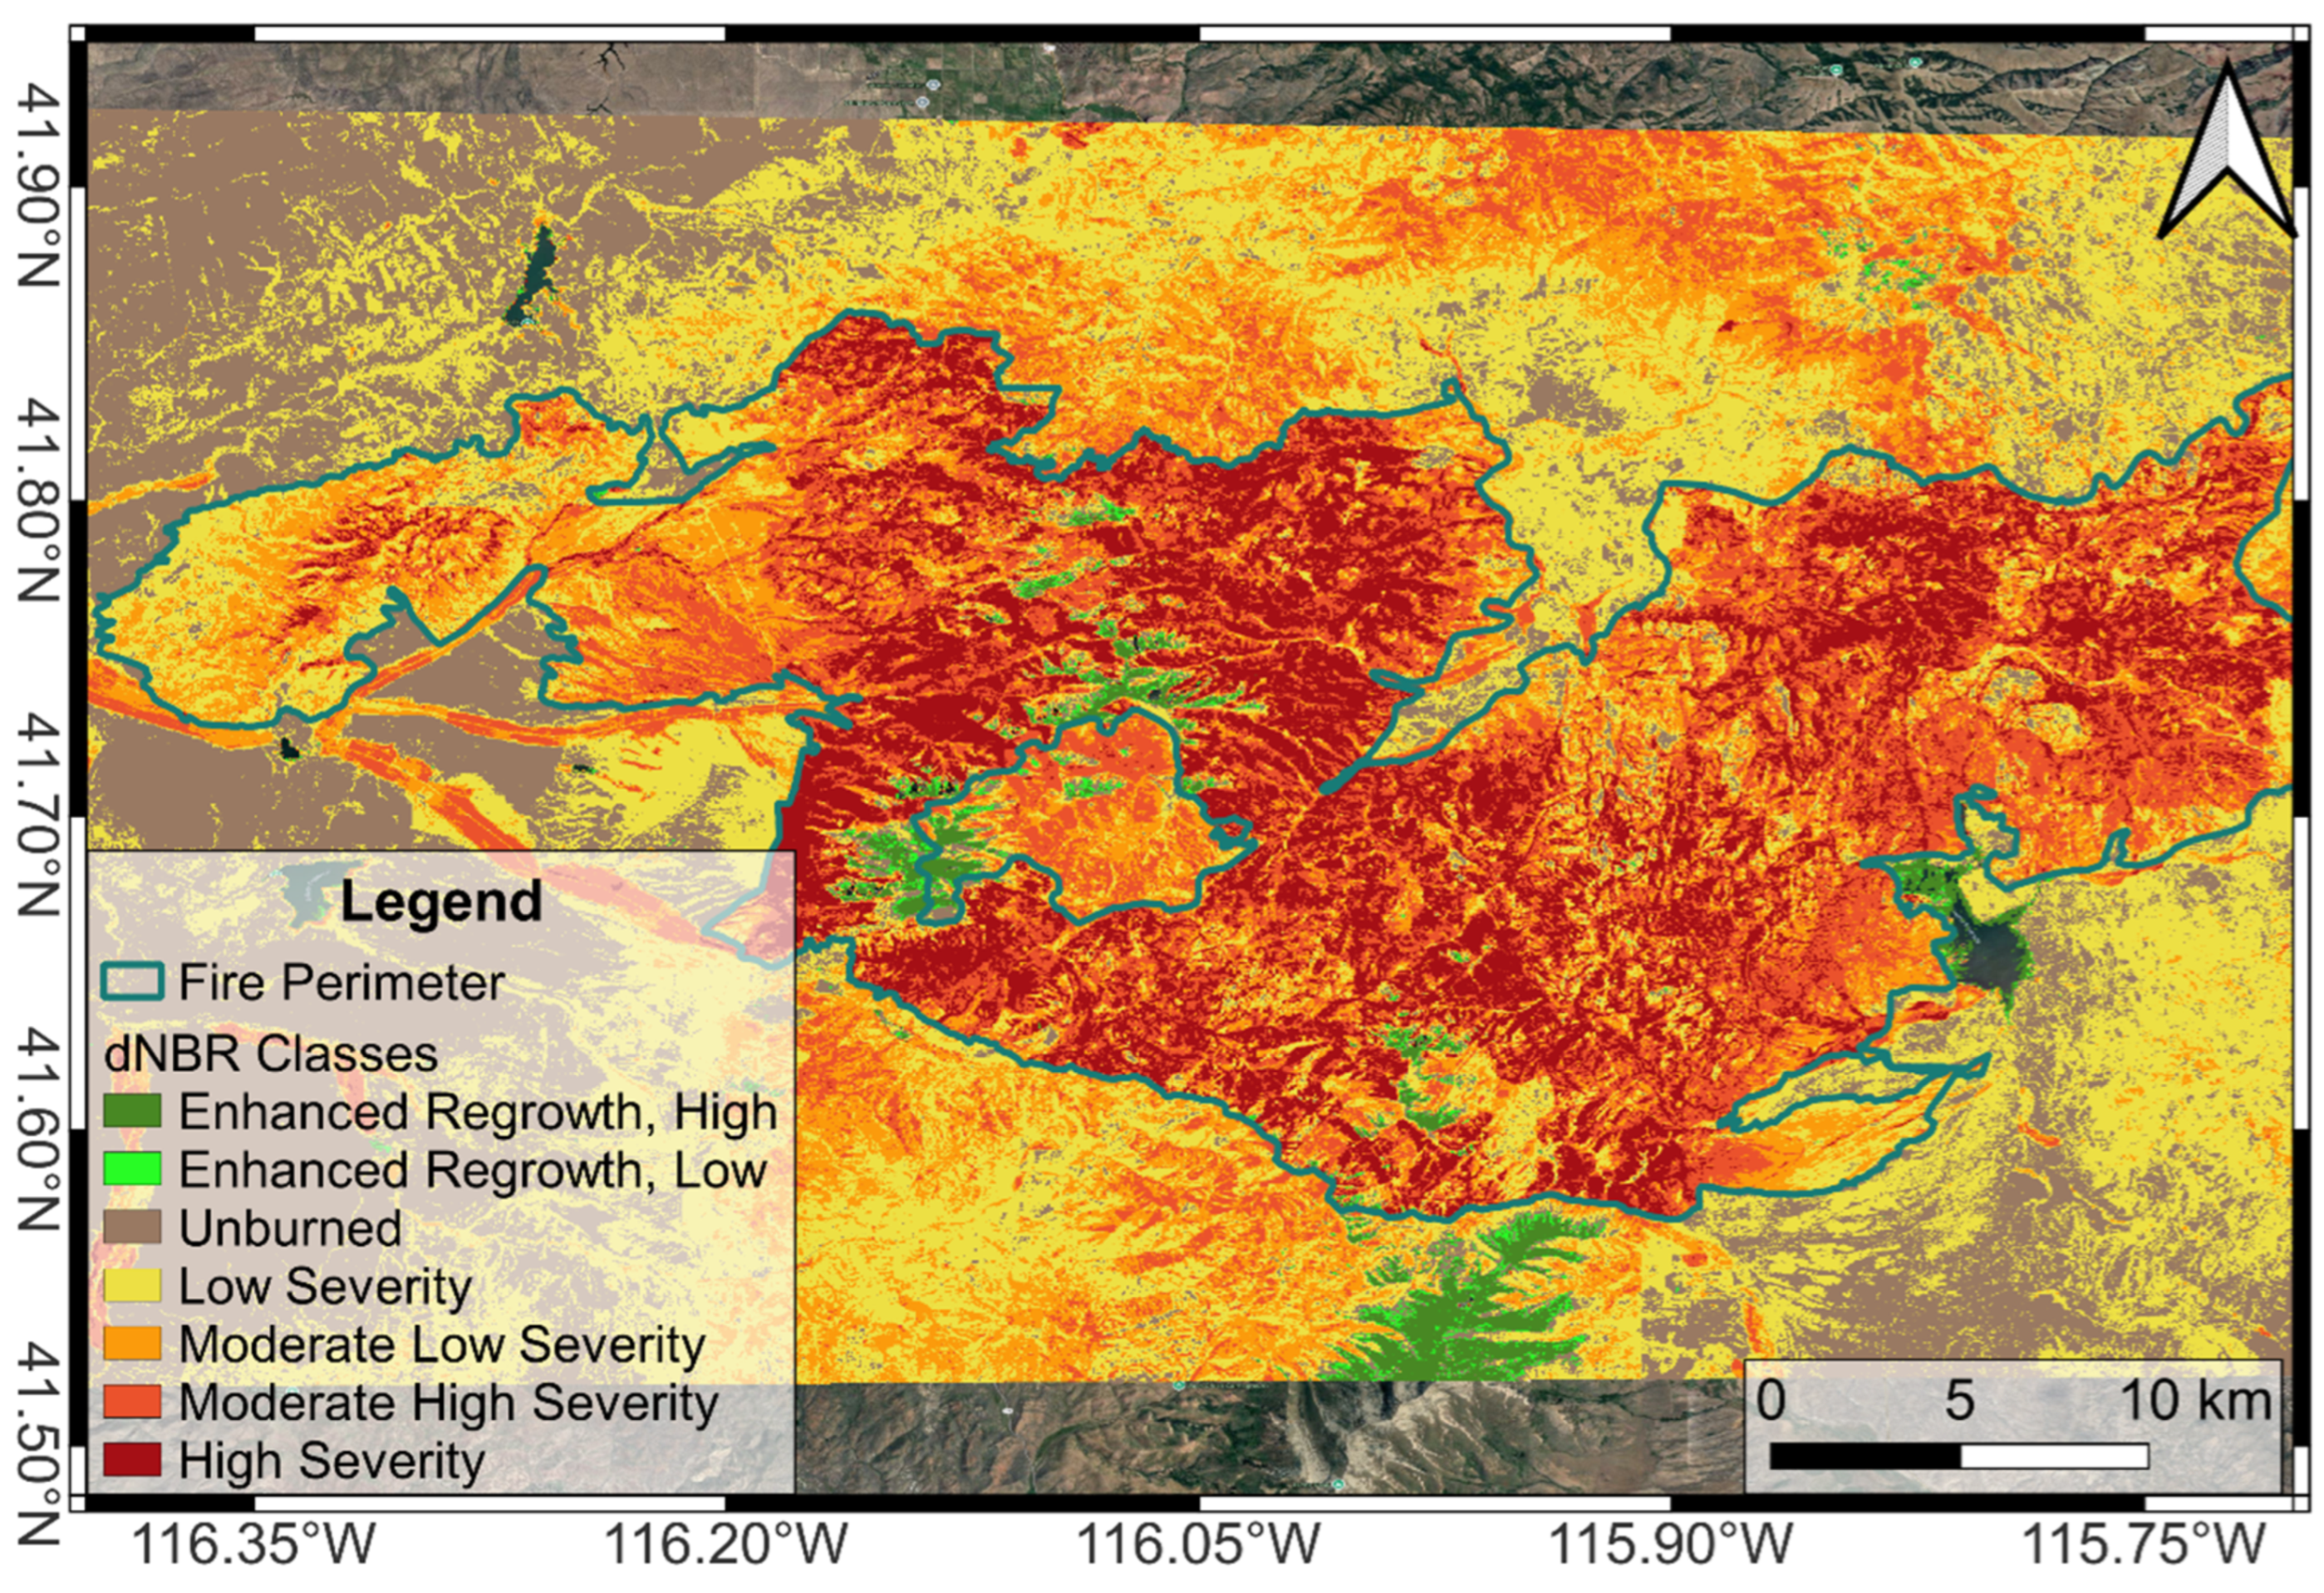
| Severity Level | dNBR Values |
|---|---|
| Enhanced regrowth, high | (−0.5)–(−0.251) |
| Enhanced regrowth, low | (−0.25)–(−0.101) |
| Unburned | (−0.1)–0.099 |
| Low severity | 0.1–0.269 |
| Moderate–Low severity | 0.27–0.439 |
| Moderate–High severity | 0.44–0.659 |
| High severity | 0.67–1.30 |
| Study Site | Period | NDVI | MSI | MCARI2 | LST | ||||
|---|---|---|---|---|---|---|---|---|---|
| p-Value | Sen Slope | p-Value | Sen Slope | p-Value | Sen Slope | p-Value | Sen Slope | ||
| 1 | Pre-fire | 0.0194 | 2.723 × 10⁻⁵ | 0.0002 | −0.00010 | 0.8088 | 1.3 × 10⁻⁶ | 0.7348 | −0.0009 |
| Post-fire | 0.7409 | 1.217 × 10⁻⁶ | 0.0123 | −0.00004 | 0.2586 | 2.8 × 10⁻⁶ | 0.3378 | −0.0010 | |
| 2 | Pre-fire | 0.2150 | 2.058 × 10⁻⁵ | 0.0028 | −0.00010 | 0.9309 | −1.0 × 10⁻⁶ | 0.6092 | 0.0012 |
| Post-fire | 0.0100 | 1.575 × 10⁻⁵ | 0.0005 | −0.00007 | 0.0141 | 1.2 × 10⁻⁵ | 0.2506 | −0.0012 | |
| 3 | Pre-fire | 0.0415 | 3.751 × 10⁻⁵ | 0.5369 | −0.00002 | 0.1269 | 1.6 × 10⁻⁵ | 0.4214 | −0.0015 |
| Post-fire | 0.7484 | 2.160 × 10⁻⁶ | 0.2600 | −0.00002 | 0.4739 | 2.3 × 10⁻⁶ | 0.8755 | −0.0001 | |
| 4 | Pre-fire | 0.0484 | 4.115 × 10⁻⁵ | 0.0229 | −0.00011 | 0.6317 | 7.2 × 10⁻⁶ | 0.1065 | −0.0036 |
| Post-fire | 0.8082 | 1.450 × 10⁻⁶ | 0.3187 | −0.00002 | 0.5038 | 2.6 × 10⁻⁶ | 0.5344 | −0.0007 | |
| 5 | Pre-fire | 0.2393 | 2.639 × 10⁻⁵ | 0.8796 | 0.00001 | 0.7355 | 3.3 × 10⁻⁶ | 0.2487 | −0.0026 |
| Post-fire | 0.9643 | 4.402 × 10⁻⁷ | 0.7597 | −0.00001 | 0.6545 | 2.0 × 10⁻⁶ | 0.1653 | 0.0012 | |
| 6 | Pre-fire | 0.0525 | 3.549 × 10⁻⁵ | 0.0009 | −0.00016 | 0.1586 | 1.8 × 10⁻⁵ | 0.0709 | −0.0036 |
| Post-fire | 0.0948 | 1.140 × 10⁻⁵ | 0.7224 | −0.00001 | 0.8390 | −7.8 × 10⁻⁷ | 0.4410 | 0.0008 | |
| 7 | Pre-fire | 0.0002 | 8.204 × 10⁻⁵ | 0.0000 | −0.00022 | 0.0095 | 3.7 × 10⁻⁵ | 0.0577 | −0.0038 |
| Post-fire | 0.4816 | 4.855 × 10⁻⁶ | 0.3413 | −0.00003 | 0.8546 | 7.4 × 10⁻⁷ | 0.5575 | 0.0005 | |
| 8 | Pre-fire | 0.3605 | 1.620 × 10⁻⁵ | 0.0000 | −0.00014 | 0.5164 | 5.5 × 10⁻⁶ | 0.4143 | −0.0016 |
| Post-fire | 0.0088 | 1.587 × 10⁻⁵ | 0.0000 | −0.00013 | 0.0192 | 8.6 × 10⁻⁶ | 0.0534 | −0.0020 | |
| 9 | Pre-fire | 0.6909 | 9.990 × 10⁻⁶ | 0.8506 | −0.00001 | 0.7855 | 3.0 × 10⁻⁶ | 0.1026 | −0.0029 |
| Post-fire | 0.3890 | 8.501 × 10⁻⁶ | 0.0082 | −0.00010 | 0.0566 | 9.5 × 10⁻⁶ | 0.8260 | −0.0002 | |
| 10 | Pre-fire | 0.1139 | 3.122 × 10⁻⁵ | 0.0038 | −0.00015 | 0.1586 | 2.0 × 10⁻⁵ | 0.4489 | −0.0019 |
| Post-fire | 0.8843 | 1.307 × 10⁻⁶ | 0.2155 | −0.00005 | 0.9723 | 1.4 × 10⁻⁷ | 0.1776 | −0.0014 | |
| 11 | Pre-fire | 0.0598 | 5.111 × 10⁻⁵ | 0.0000 | −0.00027 | 0.0461 | 3.6 × 10⁻⁵ | 0.0021 | −0.0061 |
| Post-fire | 0.7212 | 3.520 × 10⁻⁶ | 0.9354 | 0.00000 | 0.0781 | 1.0 × 10⁻⁵ | 0.3140 | −0.0010 | |
| 12 | Pre-fire | 0.0165 | 6.211 × 10⁻⁵ | 0.0000 | −0.00021 | 0.1196 | 3.2 × 10⁻⁵ | 0.1466 | −0.0037 |
| Post-fire | 0.9987 | 4.095 × 10⁻⁸ | 0.7232 | −0.00001 | 0.4912 | 4.1 × 10⁻⁶ | 0.9741 | 0.0000 | |
| 13 | Pre-fire | 0.0273 | 2.595 × 10⁻⁵ | 0.0627 | −0.00007 | 0.1185 | 9.5 × 10⁻⁶ | 0.1814 | −0.0029 |
| Post-fire | 0.2484 | 8.415 × 10⁻⁶ | 0.0034 | −0.00010 | 0.0221 | 9.0 × 10⁻⁶ | 0.9856 | 0.0000 | |
| 14 | Pre-fire | 0.2831 | 1.623 × 10⁻⁵ | 0.2246 | −0.00005 | 0.8980 | 1.0 × 10⁻⁶ | 0.3220 | −0.0018 |
| Post-fire | 1.0000 | 1.085× 10⁻⁸ | 0.5551 | −0.00001 | 0.5657 | 2.5 × 10⁻⁶ | 0.7883 | −0.0003 | |
| 15 | Pre-fire | 0.0972 | 3.481 × 10⁻⁵ | 0.0000 | −0.00028 | 0.7125 | 5.0 × 10⁻⁶ | 0.0112 | −0.0051 |
| Post-fire | 0.7922 | 2.303 × 10⁻⁶ | 0.2364 | −0.00005 | 0.6013 | −2.0 × 10⁻⁶ | 0.3432 | −0.0009 | |
| 16 | Pre-fire | 0.4025 | 2.171 × 10⁻⁵ | 0.1944 | −0.00007 | 0.2953 | 1.1 × 10⁻⁵ | 0.2858 | −0.0025 |
| Post-fire | 0.2437 | 1.016 × 10⁻⁵ | 0.1183 | −0.00004 | 0.0140 | 1.0 × 10⁻⁵ | 0.4907 | 0.0007 | |
| 17 | Pre-fire | 0.0015 | 3.855 × 10⁻⁵ | 0.0000 | −0.00011 | 0.0113 | 1.4 × 10⁻⁵ | 0.2858 | −0.0018 |
| Post-fire | 0.6071 | 3.339 × 10⁻⁶ | 0.0483 | 0.00002 | 0.3925 | −1.5 × 10⁻⁶ | 0.1296 | 0.0011 | |
| 18 | Pre-fire | 0.1323 | 2.593 × 10⁻⁵ | 0.0000 | −0.00019 | 0.4653 | 6.7 × 10⁻⁶ | 0.7961 | 0.0006 |
| Post-fire | 0.0042 | 1.730 × 10⁻⁵ | 0.0000 | −0.00020 | 0.0497 | 6.9 × 10⁻⁶ | 0.1135 | −0.0015 | |
| 19 | Pre-fire | 0.1425 | 2.216 × 10⁻⁵ | 0.4416 | −0.00005 | 0.1400 | 1.2 × 10⁻⁵ | 0.1914 | −0.0031 |
| Post-fire | 0.4642 | 5.246 × 10⁻⁶ | 0.0000 | −0.00008 | 0.0975 | 5.6 × 10⁻⁶ | 0.9474 | 0.0001 | |
| 20 | Pre-fire | 0.2555 | 2.921 × 10⁻⁵ | 0.1833 | −0.00008 | 0.3332 | 1.2 × 10⁻⁵ | 0.3838 | −0.0021 |
| Post-fire | 0.0085 | 2.043 × 10⁻⁵ | 0.0749 | −0.00003 | 0.0026 | 1.2 × 10⁻⁵ | 0.6237 | 0.0006 | |
| 21 | Pre-fire | 0.1827 | 2.505 × 10⁻⁵ | 0.4972 | −0.00004 | 0.3268 | 1.2 × 10⁻⁵ | 0.9199 | −0.0002 |
| Post-fire | 0.0588 | 1.723 × 10⁻⁵ | 0.0303 | −0.00005 | 0.0161 | 9.4 × 10⁻⁶ | 0.3649 | 0.0008 | |
| Study Site | Period | NDVI | MSI | MCARI2 | LST | ||||
|---|---|---|---|---|---|---|---|---|---|
| p-Value | Sen Slope | p-Value | Sen Slope | p-Value | Sen Slope | p-Value | Sen Slope | ||
| 1 | Pre-fire | 0.5264 | 6.3 × 10⁻⁶ | 0.1309 | 4.7 × 10⁻⁵ | 0.8966 | 6.7 × 10⁻⁷ | 0.6376 | −0.0007 |
| Post-fire | 0.2826 | 1.2 × 10⁻⁵ | 0.0001 | −1.3 × 10⁻⁴ | 0.3222 | 4.6 × 10⁻⁶ | 0.4947 | −0.0011 | |
| 2 | Pre-fire | 0.1400 | 2.6 × 10⁻⁵ | 0.0607 | −4.1 × 10⁻⁵ | 0.3573 | 3.9 × 10⁻⁶ | 0.5821 | 0.0008 |
| Post-fire | 0.3837 | 9.5 × 10⁻⁶ | 0.4047 | −1.9 × 10⁻⁵ | 0.0113 | 8.4 × 10⁻⁶ | 0.5877 | 0.0007 | |
| 3 | Pre-fire | 0.2131 | −1.6 × 10⁻⁵ | 0.5010 | −2.5 × 10⁻⁵ | 0.5188 | −4.0 × 10⁻⁶ | 0.4884 | −0.0008 |
| Post-fire | 0.7871 | 2.2 × 10⁻⁶ | 0.2732 | 2.4 × 10⁻⁵ | 0.8731 | −8.5 × 10⁻⁷ | 0.5007 | 0.0007 | |
| 4 | Pre-fire | 0.1056 | −1.5 × 10⁻⁵ | 0.3533 | 2.6 × 10⁻⁵ | 0.0323 | −1.0 × 10⁻⁵ | 0.3861 | −0.0012 |
| Post-fire | 0.7000 | −3.0 × 10⁻⁶ | 0.0865 | −4.4 × 10⁻⁵ | 0.4531 | 2.3 × 10⁻⁶ | 0.6925 | 0.0005 | |
| 5 | Pre-fire | 0.3935 | 9.5 × 10⁻⁶ | 0.9333 | 2.6 × 10⁻⁶ | 0.0484 | 7.2 × 10⁻⁶ | 0.0429 | −0.0028 |
| Post-fire | 0.9827 | −1.7 × 10⁻⁷ | 0.0000 | −1.1 × 10⁻⁴ | 0.6888 | 2.0 × 10⁻⁶ | 0.8455 | 0.0002 | |
| 6 | Pre-fire | 0.1147 | −1.7 × 10⁻⁵ | 0.0832 | 6.7 × 10⁻⁵ | 0.1314 | −7.7 × 10⁻⁶ | 0.9794 | 0.0001 |
| Post-fire | 0.6263 | 6.9 × 10⁻⁶ | 0.0023 | −1.5 × 10⁻⁴ | 0.2192 | 7.0 × 10⁻⁶ | 0.7067 | −0.0003 | |
| 7 | Pre-fire | 0.8258 | 4.5 × 10⁻⁶ | 0.1690 | −6.6 × 10⁻⁵ | 0.2555 | −6.4 × 10⁻⁶ | 0.1374 | −0.0029 |
| Post-fire | 0.4441 | 1.1 × 10⁻⁵ | 0.0150 | −1.2 × 10⁻⁴ | 0.1729 | 9.0 × 10⁻⁶ | 0.7246 | −0.0006 | |
| 8 | Pre-fire | 0.6415 | 7.5 × 10⁻⁶ | 0.0059 | −1.0 × 10⁻⁴ | 0.1772 | 7.9 × 10⁻⁶ | 0.4727 | −0.0012 |
| Post-fire | 0.8666 | 1.5 × 10⁻⁶ | 0.0005 | −1.2 × 10⁻⁴ | 0.3944 | 4.8 × 10⁻⁶ | 0.9584 | 0.0001 | |
| 9 | Pre-fire | 0.8190 | 4.1 × 10⁻⁶ | 0.8436 | −7.9 × 10⁻⁶ | 1.0000 | −1.9 × 10⁻⁷ | 0.1443 | −0.0027 |
| Post-fire | 0.0023 | 3.9 × 10⁻⁵ | 0.0213 | −1.1 × 10⁻⁴ | 0.0024 | 2.2 × 10⁻⁵ | 0.5066 | 0.0012 | |
| 10 | Pre-fire | 0.8939 | −1.7 × 10⁻⁶ | 0.0035 | −1.4 × 10⁻⁴ | 0.4186 | 5.0 × 10⁻⁶ | 0.1854 | −0.0026 |
| Post-fire | 0.1552 | 2.4 × 10⁻⁵ | 0.0000 | −2.5 × 10⁻⁴ | 0.0254 | 1.6 × 10⁻⁵ | 0.4513 | −0.0012 | |
| 11 | Pre-fire | 0.6632 | −8.2 × 10⁻⁶ | 0.4186 | −3.1 × 10⁻⁵ | 0.3507 | −6.9 × 10⁻⁶ | 0.1576 | −0.0030 |
| Post-fire | 0.2640 | 1.4 × 10⁻⁵ | 0.0138 | −1.0 × 10⁻⁴ | 0.0954 | 1.1 × 10⁻⁵ | 0.4428 | 0.0010 | |
| 12 | Pre-fire | 0.2357 | 1.4 × 10⁻⁵ | 0.0361 | −8.8 × 10⁻⁵ | 0.2693 | 6.1 × 10⁻⁶ | 0.3545 | −0.0017 |
| Post-fire | 0.1729 | 1.5 × 10⁻⁵ | 0.0160 | −1.3 × 10⁻⁴ | 0.0500 | 1.4 × 10⁻⁵ | 0.7890 | −0.0004 | |
| 13 | Pre-fire | 0.3266 | −3.1 × 10⁻⁵ | 0.6508 | −2.3 × 10⁻⁵ | 0.4972 | −7.5 × 10⁻⁶ | 0.8465 | 0.0003 |
| Post-fire | 0.0418 | 7.3 × 10⁻⁵ | 0.1425 | −1.3 × 10⁻⁴ | 0.0006 | 4.8 × 10⁻⁵ | 1.0000 | 0.0000 | |
| 14 | Pre-fire | 0.1347 | 2.9 × 10⁻⁵ | 0.0053 | −1.3 × 10⁻⁴ | 0.1525 | 1.3 × 10⁻⁵ | 0.1579 | −0.0022 |
| Post-fire | 0.1868 | 3.1 × 10⁻⁵ | 0.0459 | −1.5 × 10⁻⁴ | 0.1911 | 1.7 × 10⁻⁵ | 0.7450 | −0.0005 | |
| 15 | Pre-fire | 0.7949 | 4.3 × 10⁻⁶ | 0.3155 | −3.8 × 10⁻⁵ | 0.8710 | −1.7 × 10⁻⁶ | 0.9611 | −0.0002 |
| Post-fire | 0.8203 | 7.1 × 10⁻⁶ | 0.0001 | −2.4 × 10⁻⁴ | 0.2179 | 1.3 × 10⁻⁵ | 0.1623 | −0.0019 | |
| 16 | Pre-fire | 0.0791 | 3.7 × 10⁻⁵ | 0.3579 | −5.6 × 10⁻⁵ | 0.2125 | 1.0 × 10⁻⁵ | 0.5720 | −0.0008 |
| Post-fire | 0.0501 | 5.2 × 10⁻⁵ | 0.0000 | −3.2 × 10⁻⁴ | 0.0001 | 3.8 × 10⁻⁵ | 0.6102 | −0.0007 | |
| 17 | Pre-fire | 0.8380 | 4.5 × 10⁻⁶ | 0.5877 | −3.8 × 10⁻⁵ | 0.3507 | 1.7 × 10⁻⁵ | 0.5877 | −0.0010 |
| Post-fire | 0.2235 | 1.7 × 10⁻⁵ | 0.5907 | −1.6 × 10⁻⁵ | 0.6064 | 4.5 × 10⁻⁶ | 0.0357 | 0.0023 | |
| 18 | Pre-fire | 0.5522 | −9.0 × 10⁻⁶ | 0.0543 | −7.4 × 10⁻⁵ | 0.9145 | −8.9 × 10⁻⁷ | 0.0067 | −0.0031 |
| Post-fire | 0.6143 | −5.5 × 10⁻⁶ | 0.9601 | −1.7 × 10⁻⁶ | 0.5717 | −3.8 × 10⁻⁶ | 0.8807 | 0.0002 | |
| 19 | Pre-fire | 0.0257 | −3.6 × 10⁻⁵ | 0.2877 | 3.1 × 10⁻⁵ | 0.0288 | −1.9 × 10⁻⁵ | 0.3853 | 0.0010 |
| Post-fire | 0.0000 | 4.4 × 10⁻⁵ | 0.0002 | −6.3 × 10⁻⁵ | 0.0001 | 2.2 × 10⁻⁵ | 0.8053 | −0.0002 | |
| 20 | Pre-fire | 0.6870 | −8.3 × 10⁻⁶ | 0.0391 | −9.9 × 10⁻⁵ | 0.4647 | −7.7 × 10⁻⁶ | 0.1007 | −0.0030 |
| Post-fire | 0.2263 | 1.4 × 10⁻⁵ | 0.2450 | 4.0 × 10⁻⁵ | 0.4989 | 5.2 × 10⁻⁶ | 0.1016 | 0.0021 | |
| 21 | Pre-fire | 0.7185 | −9.0 × 10⁻⁶ | 0.1056 | −1.0 × 10⁻⁴ | 0.8932 | −2.4 × 10⁻⁶ | 0.1435 | −0.0027 |
| Post-fire | 0.4281 | −1.0 × 10⁻⁵ | 0.3928 | 2.3 × 10⁻⁵ | 0.5107 | −4.3 × 10⁻⁶ | 0.3175 | 0.0014 | |
Disclaimer/Publisher’s Note: The statements, opinions and data contained in all publications are solely those of the individual author(s) and contributor(s) and not of MDPI and/or the editor(s). MDPI and/or the editor(s) disclaim responsibility for any injury to people or property resulting from any ideas, methods, instructions or products referred to in the content. |
© 2025 by the authors. Licensee MDPI, Basel, Switzerland. This article is an open access article distributed under the terms and conditions of the Creative Commons Attribution (CC BY) license (https://creativecommons.org/licenses/by/4.0/).
Share and Cite
Ahmad, I.; Stephen, H. Assessment of Vegetation Dynamics After South Sugar Loaf and Snowstorm Wildfires Using Remote Sensing Spectral Indices. Remote Sens. 2025, 17, 1809. https://doi.org/10.3390/rs17111809
Ahmad I, Stephen H. Assessment of Vegetation Dynamics After South Sugar Loaf and Snowstorm Wildfires Using Remote Sensing Spectral Indices. Remote Sensing. 2025; 17(11):1809. https://doi.org/10.3390/rs17111809
Chicago/Turabian StyleAhmad, Ibtihaj, and Haroon Stephen. 2025. "Assessment of Vegetation Dynamics After South Sugar Loaf and Snowstorm Wildfires Using Remote Sensing Spectral Indices" Remote Sensing 17, no. 11: 1809. https://doi.org/10.3390/rs17111809
APA StyleAhmad, I., & Stephen, H. (2025). Assessment of Vegetation Dynamics After South Sugar Loaf and Snowstorm Wildfires Using Remote Sensing Spectral Indices. Remote Sensing, 17(11), 1809. https://doi.org/10.3390/rs17111809