Article

When Time Prevails: The Perils of Overlooking Temporal Landscape Evolution in Landslide Susceptibility Predictions

1
College of Surveying and Geo-Informatics, North China University of Water Resources and Electric Power, Zhengzhou 450046, China
2
Key Laboratory of Mine Spatio-Temporal Information and Ecological Restoration, Ministry of Natural Resources, Jiaozuo 454003, China
3
Hydraulics and Geotechnics Section, KU Leuven, Kasteelpark Arenberg 40, BE-3001 Leuven, Belgium
4
Ministry of Education Key Laboratory for Biodiversity Science and Ecological Engineering, School of Life Sciences, Fudan University, Shanghai 200438, China
5
State Key Laboratory of Ecological Safety and Sustainable Development in Arid Lands, Northwest Institute of Eco-Environment and Resources, Chinese Academy of Sciences, Lanzhou 730000, China
6
National Institute of Natural Hazards, Ministry of Emergency Management of China, Beijing 100085, China
*
Author to whom correspondence should be addressed.
Remote Sens. 2025, 17(10), 1752; https://doi.org/10.3390/rs17101752
Submission received: 17 February 2025 / Revised: 28 March 2025 / Accepted: 13 May 2025 / Published: 17 May 2025
(This article belongs to the Special Issue Advances in Remote Sensing for Land Subsidence Monitoring)

Abstract

:
This study highlights the importance of incorporating temporal landscape dynamics in landslide susceptibility assessments (LSAs). Two models are compared: one integrates multi-temporal data, while the other relies solely on present conditions. Artificial Digital Elevation Models (ADEMs) for 1960, 1980, 2000, and 2020 were generated using a landscape manipulation tool to simulate phases of land degradation and rehabilitation, thereby enabling the assessment of susceptibility over time. Landslide occurrences were simulated to increase over time—primarily as a result of anthropogenic changes, such as deforestation and land use alterations—with partial stabilization following conservation efforts. Both models achieved identical AUC values of 0.97, but the blind model misclassified stable areas and missed historically unstable regions. While conventional performance metrics such as ROC curves provide insights into model accuracy, they fail to detect misclassifications arising from temporal landscape changes, leading to overestimation in some areas and underestimation in others, especially in evolving environments. This study demonstrates that neglecting temporal landscape evolution leads to flawed susceptibility maps, potentially misguiding hazard mitigation efforts. To improve LSA accuracy, the study advocates for integrating multi-temporal thematic maps and adopting performance metrics that assess temporal robustness. It emphasizes the need for a shift from a static-to-hazard paradigm to a temporally evolved susceptibility-to-hazard framework for more accurate hazard and risk predictions.

Graphical Abstract

1. Introduction

LSA is an indispensable step in risk analysis and management (RAM) for natural hazards, as it provides a solid foundation for preventive measures, risk reduction planning, and resource allocation in regions affected by landslides [1,2,3,4]. Over the past several decades, LSA has undergone significant changes owing to advancements in computational tools, statistical methods, and machine learning algorithms [5]. Researchers can better predict landslide occurrences using various approaches, including traditional statistical methods [6,7], machine learning techniques such as support vector machines, decision trees, and random forests [8,9,10,11,12,13,14], as well as ensemble and hybrid models that enhance predictive accuracy [10,11,12,15]. Additionally, deep learning frameworks have gained traction in susceptibility modeling [16,17,18,19,20], alongside metaheuristic-based optimizations that integrate AI-driven approaches [17,18]. Several studies have also focused on landslide risk assessment, model sensitivity, and parameterization, providing further insights into susceptibility modeling [21,22,23,24,25]. Nevertheless, notwithstanding the paradigm shift in these sectors, there is an area of contention that rests upon the static nature of landscapes. Treating current conditions as representative of an entire landscape’s susceptibility history can lead to significant discrepancies, especially in contexts characterized by dynamic changes or human alteration [26]. Neglecting landscape dynamics, land use, and environmental pressures over time may distort model results and introduce systematic bias into the susceptibility modeling process, leading to unreliable landslide susceptibility predictions [23]. This study argues that temporal evolution should be incorporated directly into the landslide susceptibility assessment, not only in the subsequent hazard analysis. By integrating historical landscape changes, such as degradation, recovery, and human interventions, into susceptibility models, we can develop more accurate maps that better reflect the true, dynamic nature of landslide risk.
In LSAs, therefore, the temporality of the landscape cannot be overemphasized. Landslides are triggered by a complex interaction of geological, hydrological, and climatic factors, all of which improve with time. Anthropogenic activities such as deforestation, urbanization, and mining have historically altered soil stability, surface runoff patterns, and vegetation cover, thereby influencing landslide dynamics [27]. For instance, early phases of land development during a period of deforestation tend to increase soil erosion and slope instability, leading to higher landslide susceptibility. On the other hand, rehabilitation, including reforestation, biological measures, or soil conservation programs, has been known to gradually restore stability and, hence, reduce risks of landslides. This degradation followed by partial recovery is observed in other parts of the world, such as Golestan Province in Northeastern Iran, where major land use changes during decades in the past have impacted landslide occurrences. Nonetheless, several recent LSA models pay little attention to these temporally oriented variations, predicting only based on the contemporary state of landscape features. Failing to consider the historical perspective thus leads to susceptibility maps that may not correspond to temporally sensitive risk landscapes. Such static interpretation is not only simplistic, as it would suggest, but may also bear a misleading burden. Scenario developers often inadvertently assume that, today, topography, land use, and environmental factors present at landslide sites mimic the conditions in which past landslides occurred [27]. The static assumptions go on ignoring natural and anthropogenic changes that perennially reshape landscapes, like vegetation regrowth, soil erosion, and land use changes, as well as episodic events such as heavy precipitations and sudden earthquakes (e.g., Türkiye earthquakes that triggered 3000 landslides) at the time that contribute to slope instability over time [28,29,30]. Thus, it is known that a static model (hereafter referred to interchangeably as the blind or conventional model) may tend to give a false sense of high or low susceptibility predictions in fast-evolving or heavily modified areas [31]. These inaccuracies threaten model validity and misinstruct policymakers and planners who rely on these predictions for strategies mitigating risk. The predictive power is reduced without temporal considerations, thus making the susceptibility models susceptible to losing their place. In this regard, event-based landslide susceptibility models effectively capture the true predisposing and triggering factors of specific landslides; however, their applicability at broader watershed scales remains limited.
To address these limitations, this study calls to add a temporal construct into the LSA framework through the development of multi-temporal thematic maps and reconstructing the most relevant predisposing factors historically. An approach to susceptibility that incorporates time into LSA would not only improve model accuracy but also allow for a more realistic representation of susceptibility—a dynamic view that continues to take into consideration both historical degradation and current landscape rehabilitation. However, reconstructing historical settings to form the grounds of susceptibility modeling presents another challenge. The data availability is predominantly incapacitated, and reconstructing multi-temporal topography according to historical accuracy is still practically impossible across many regions. Advances in remote sensing, especially the growing availability of historical satellite imagery, provide valuable opportunities to determine land use and environmental conditions. With the Artificial Digital Elevation Models (ADEMs) generated by landscape creation tools such as TerreSculptor, researchers can establish multi-temporal landscapes, enabling experimental explorations of how variations in land use, topography, and environmental factors change the predilection for susceptibility assessments.
In this study, we present a case that demonstrates the impacts of neglecting temporal factors in landslide susceptibility modeling by employing two methodologies: (1) a strategically designed model that integrates historical conditions and multi-temporal thematic data and (2) a blind model that relies solely on contemporary landscape conditions, without reference to past or present changes in the environmental, geological, or physiographic aspects. Using ADEMs generated through multiple points in time, we systematically assess the impact of temporal neglect on susceptibility predictions. We hypothesize that the static model should yield far greater false positives or false negatives when compared to the strategized model, reinforcing the pernicious effects of neglecting temporal evolution in LSAs. The present study recalibrates the LSA paradigm by encouraging researchers to integrate historical landscape dynamics in their endeavors, thus raising predictive reliability in landslide susceptibility assessments, better aligned with the temporal complexity of real-world landscapes.

2. Materials and Methods

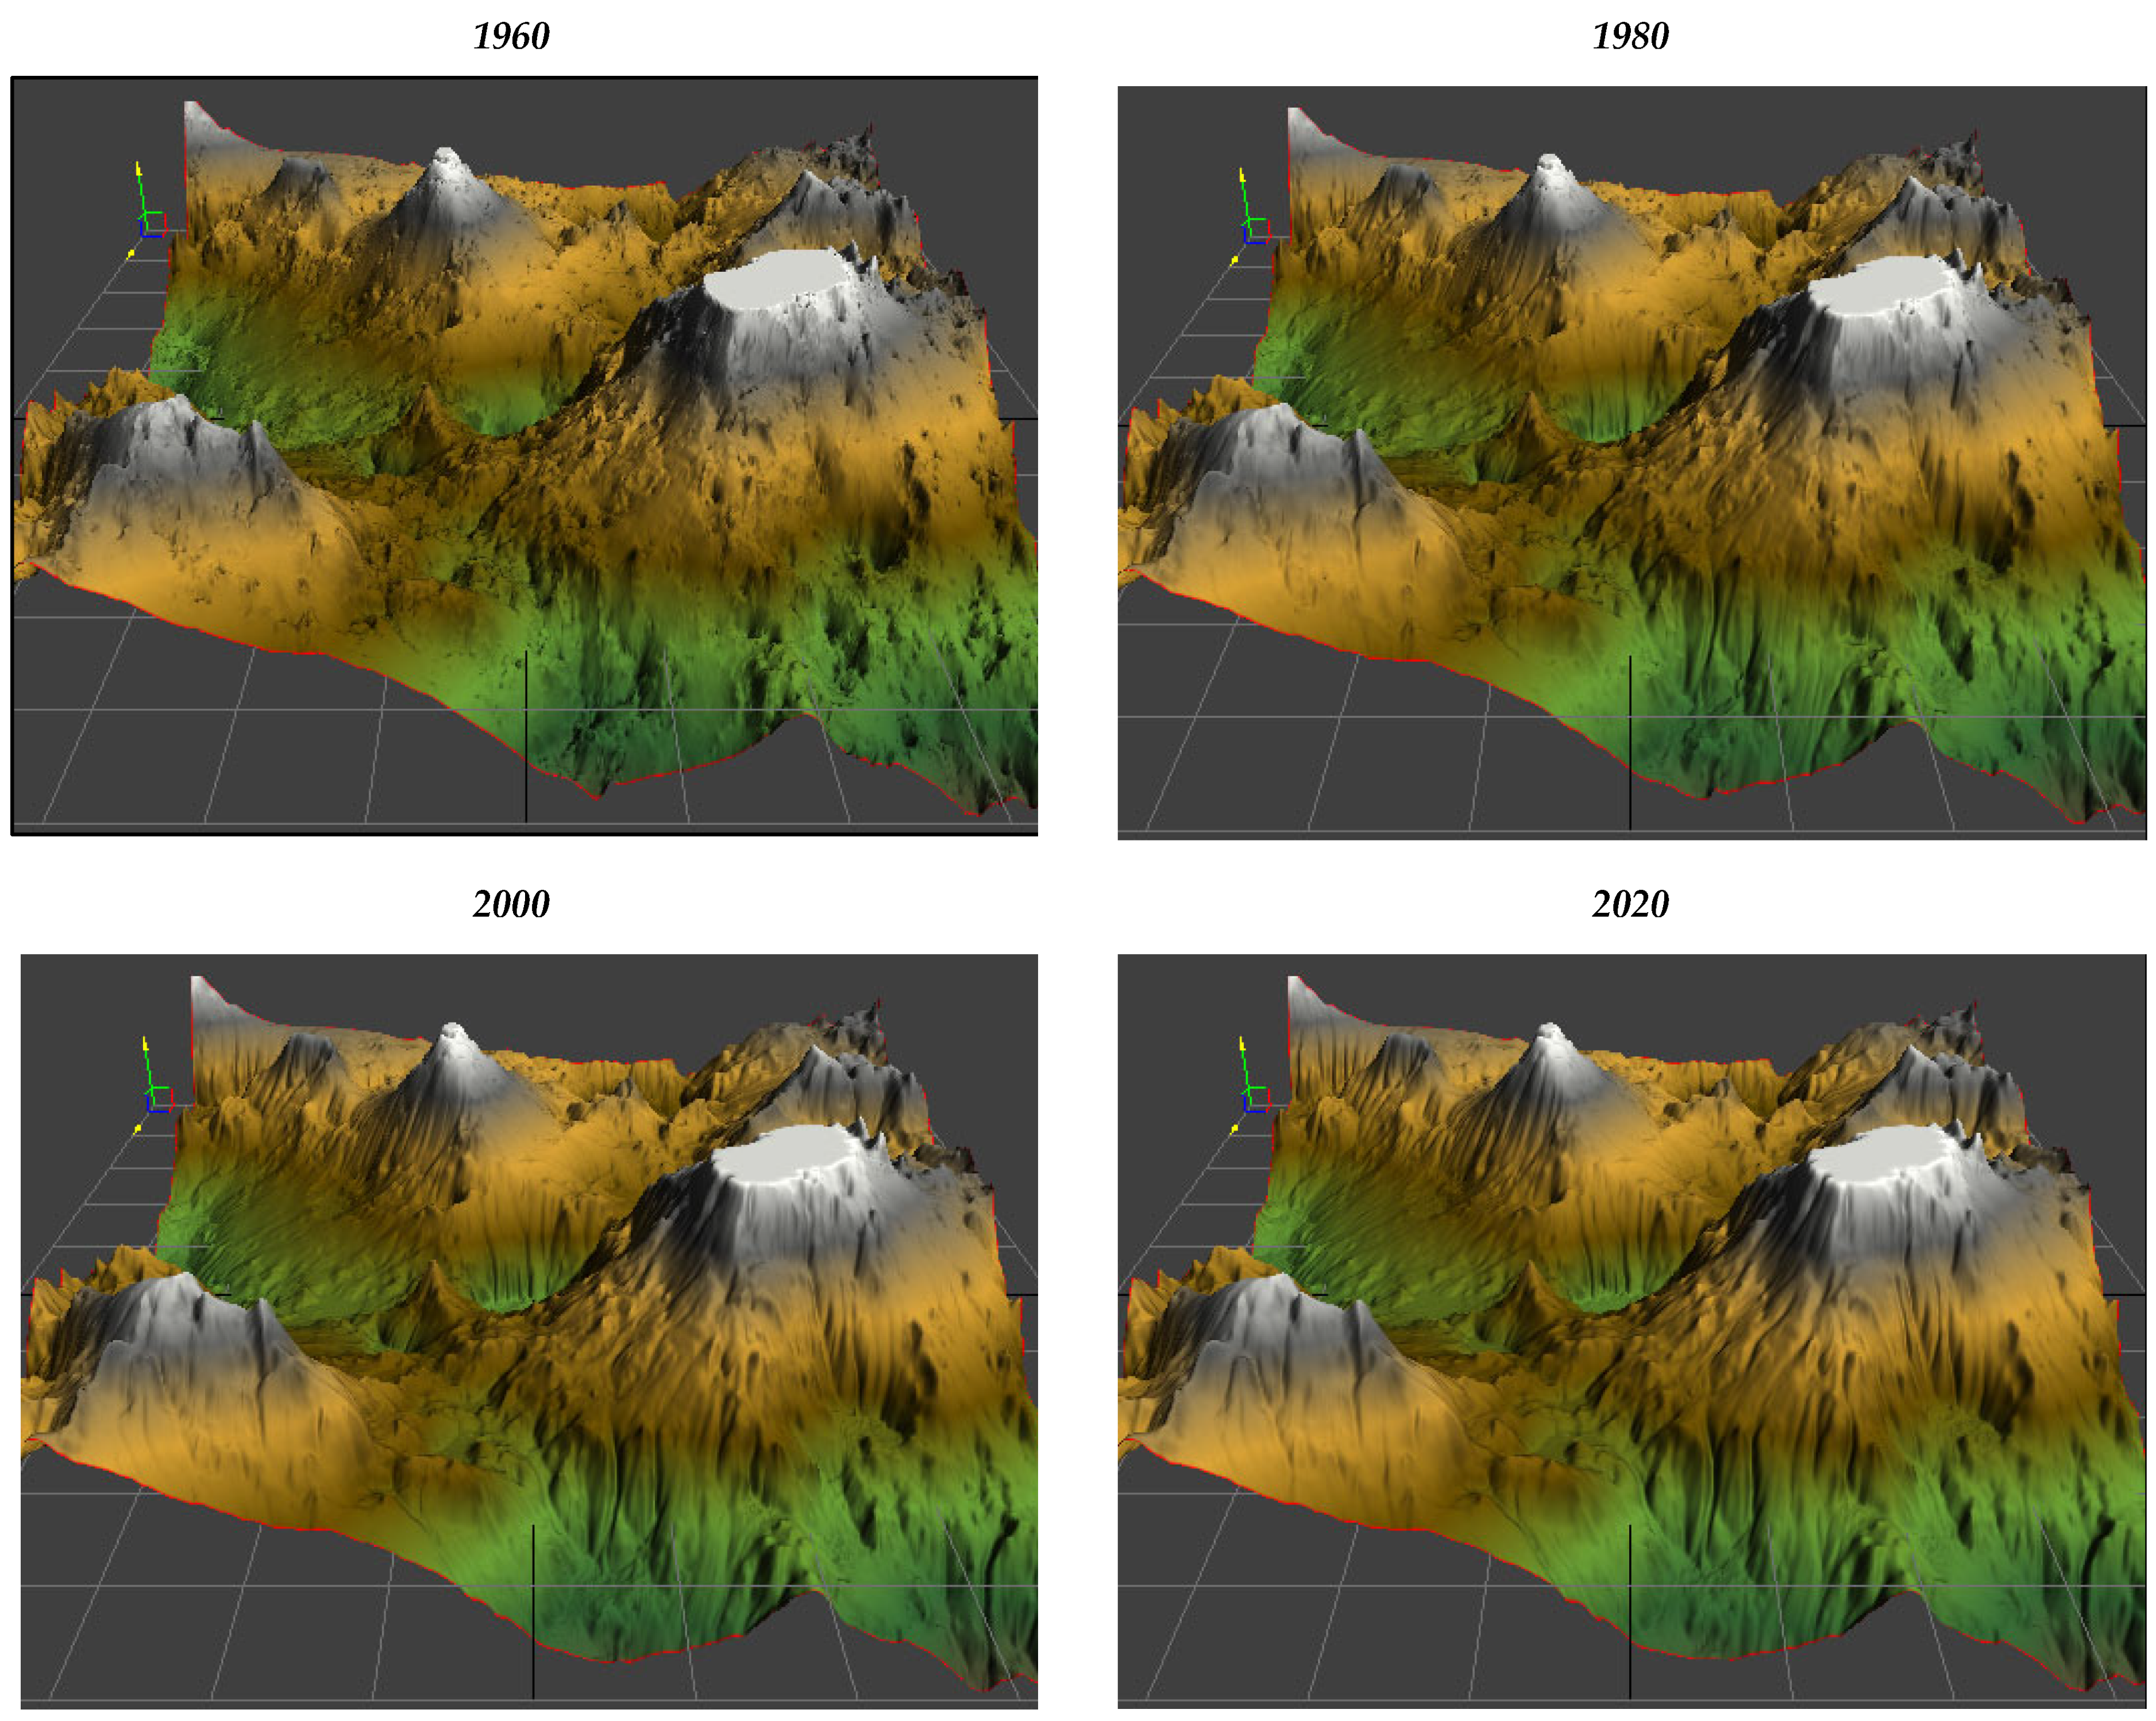
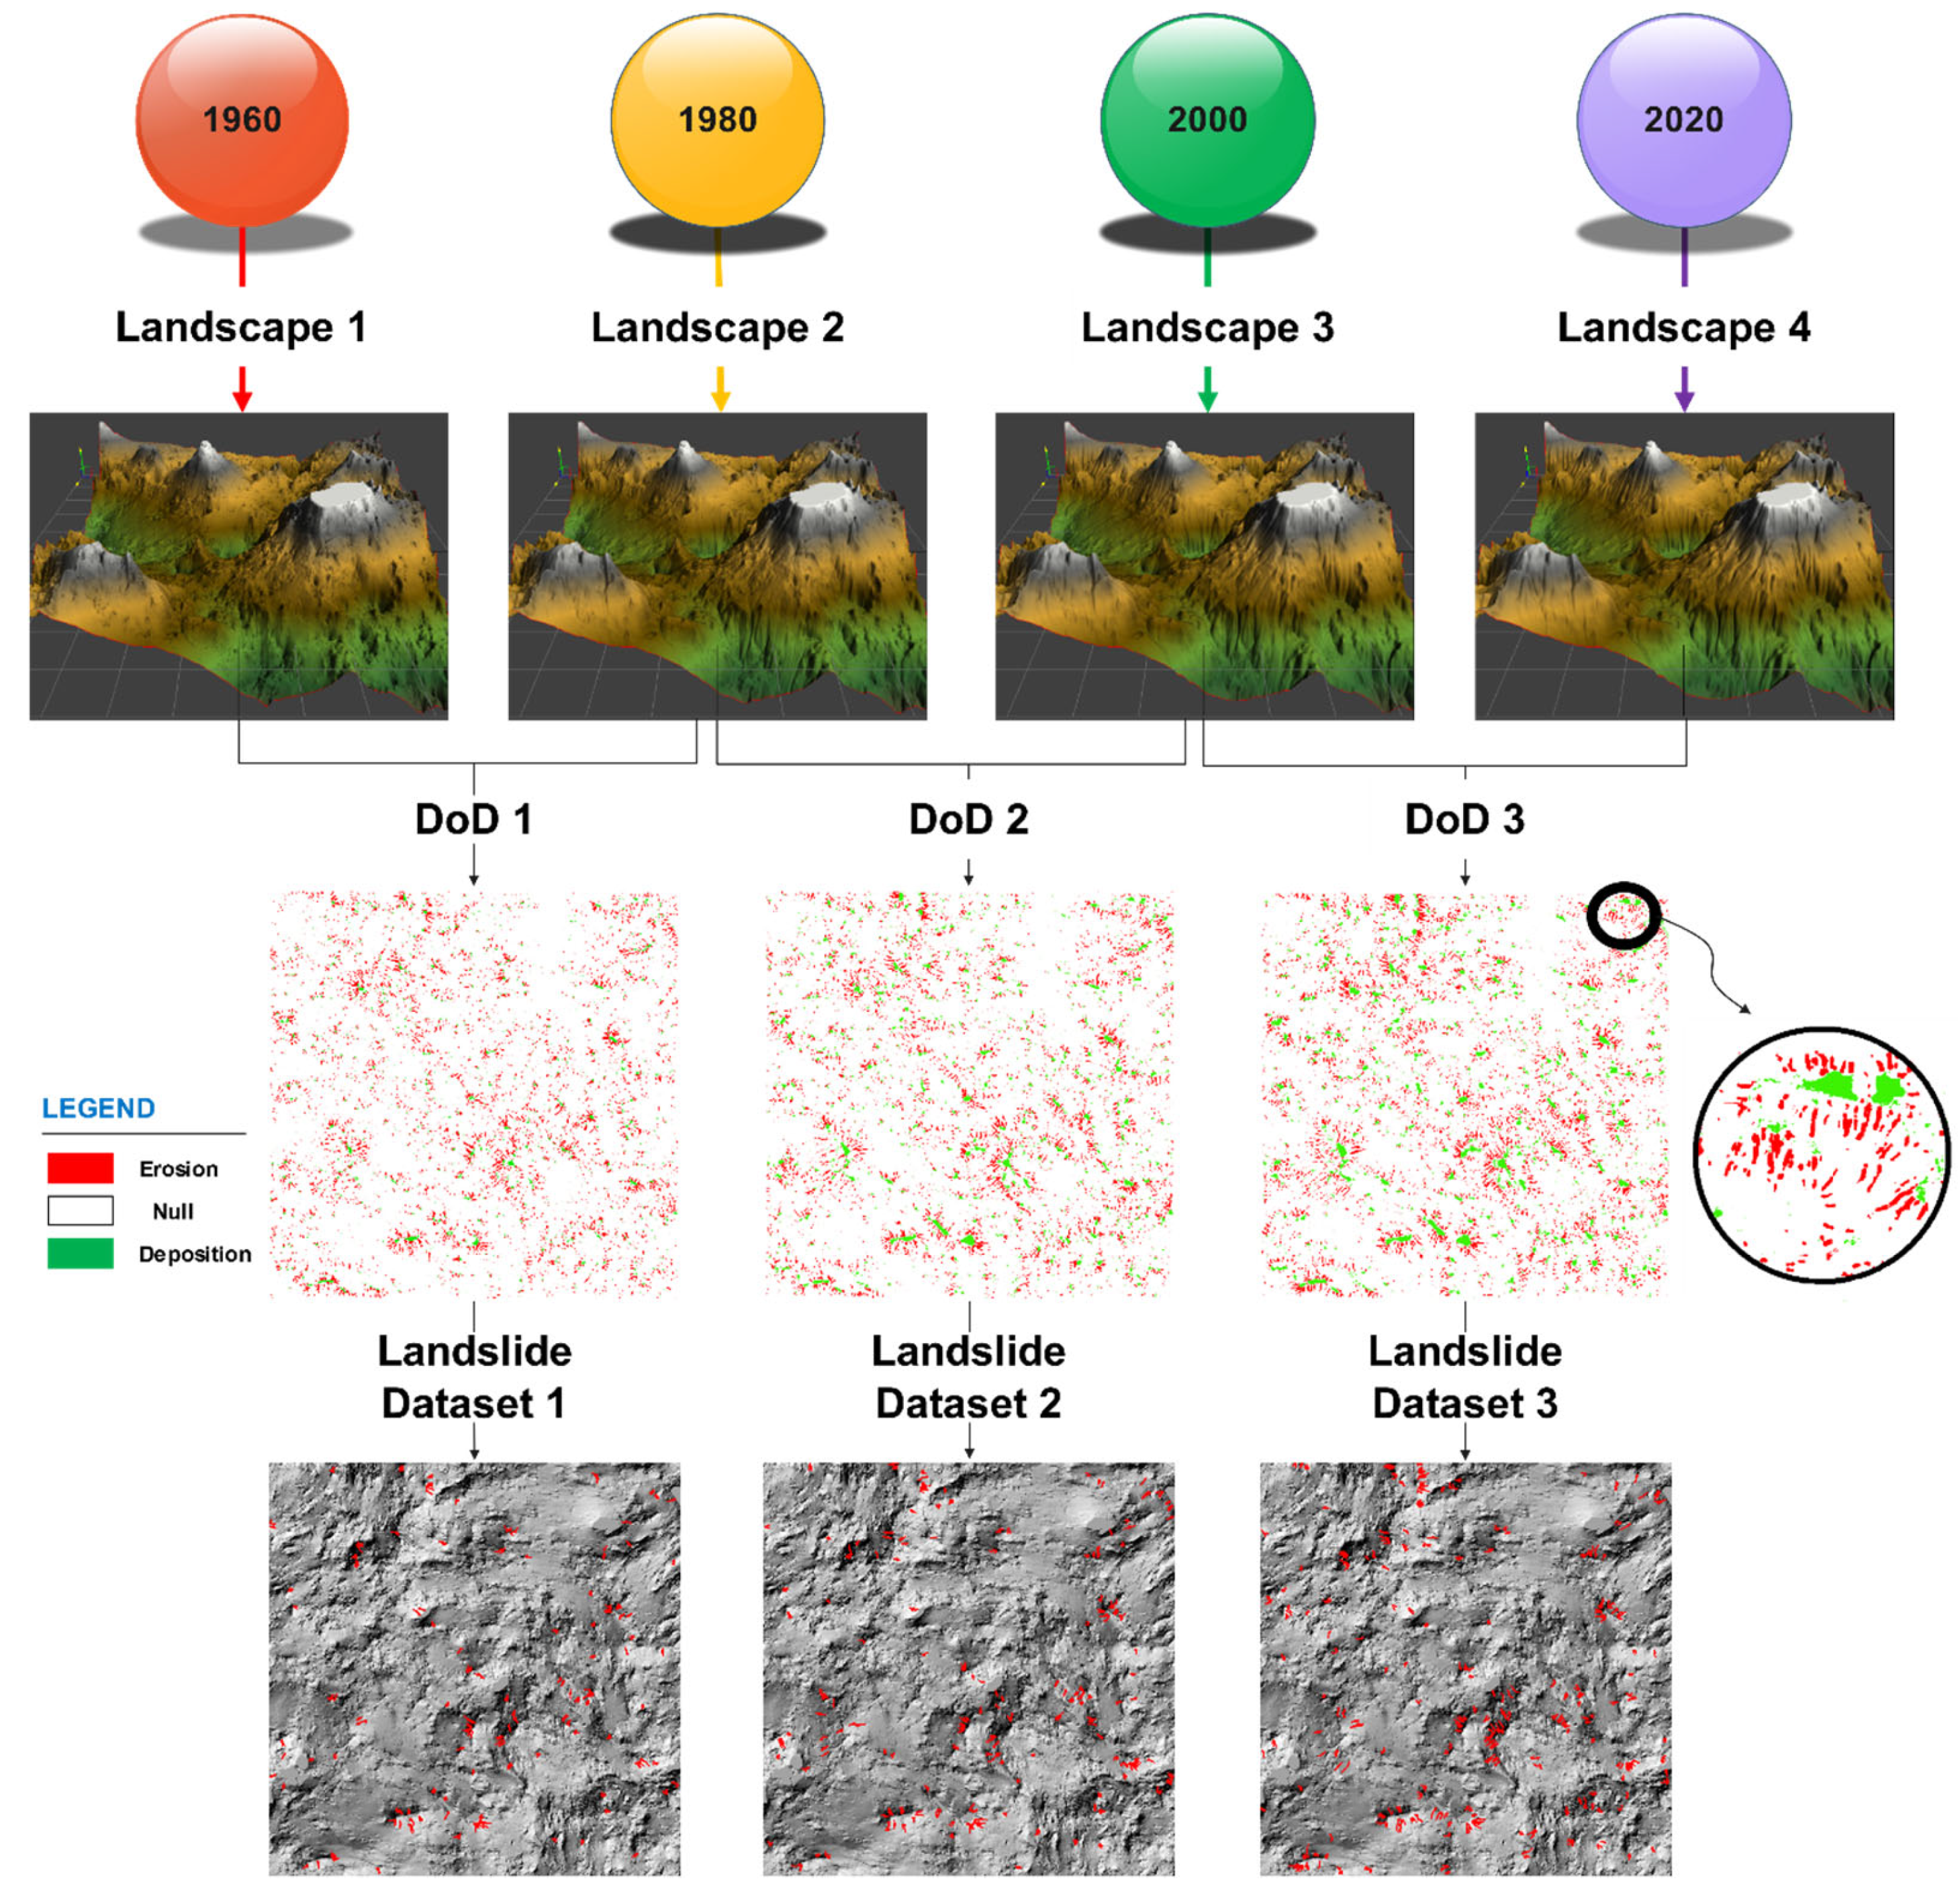
2.1. Study Area and Temporal Scenario Construction

In this study, the ADEMs will be created as hypothetical landscapes, with no specific geographical location. Unlike existing simulations that derive inspiration from a tangible landscape, these ADEMs are built purely to illustrate theoretical scenarios that encompass how land evolution over time drastically modifies the topography. By crafting a controlled, fictitious landscape, we wish to expose how ignoring temporal evolution in real settings distorts input data and may compromise the model’s credibility. These four modeled ADEMs represent a landscape at four time points—1960, 1980, 2000, and 2020—simulating stages of land degradation followed by rehabilitation. Practically, using the ADEMs allows isolating the effects of historical landscape change on landslide susceptibility models, thus avoiding the confounding variables occurring in real-world data. This remains extremely useful for illustrating how evolving and dynamically changing terrains can add rigor to input data integrity and therefore to the model efficacy.

2.2. Generation of Artificial Digital Elevation Models (ADEMs)

TerreSculptor software is an application developed mainly for game designers and artists for the creation of custom terrains in virtual environments. However, in this research, the software has been innovatively adapted for scientific modeling through an ingenious function of using its “Rainfall Erosion” module to create multi-temporal datasets used for landslide susceptibility analyses. The “Rainfall Erosion” tool in TerreSculptor v.3 is based on simplified physical principles of erosion, simulating the effects of rainfall on terrain over short periods (Figure 1).
Although using simple equations based on erosion principles, the tool more resembles an automated brush, and the users can use it to displace the terrain and shape features in ways that game designers employ while working on immersive landscapes. All four stages (1960, 1980, 2000, and 2020) were generated by simulating erosion via controlled rainfall, resulting in four distinct terrain states that typify three phases of degradation and deposition associated with landslides (Figure 2). Figure 2 illustrates how the simulated landscape changes over different time periods (1960, 1980, 2000, and 2020) affect the topography, demonstrating the progressive effects of degradation and subsequent rehabilitation on landslide susceptibility. The exaggerated elevation aids in visualizing erosion and deposition patterns, emphasizing the necessity of incorporating historical terrain changes into susceptibility modeling. Using these tools, we established unique terrain profiles at each time segment, from the nature initially affected by deforestation and soil erosion in 1960 to the initiated rehabilitation stages in later years. The changes that occurred within the time scope were quantified through DEMs of Difference (DoD) after manipulation of the terrain, allowing the creation of three landslide datasets associated with the progressive stages of terrain evolution (Figure 3). Figure 3 highlights how different land use phases—initial degradation followed by partial rehabilitation—contribute to evolving landslide susceptibility. It visually supports the study’s core argument that static models may fail to account for long-term environmental changes, reinforcing the importance of multi-temporal modeling for improving susceptibility assessments.
These phases served as a simulator to predict how the possible changes in terrain structure due to natural and anthropogenic processes would affect the landslide susceptibility over time. Hence, in a sense, the introduction of our approach lies in the application of a gaming tool to yield a time series data of cumulative landscape evolution. This way of simulating landscape evolution presents a developing picture of topographical change that is critical for testing how static susceptibility models can fail against real-world temporally dynamic landscapes. This approach provides a replicable way to investigate how some aspects of landscape development might, after all, influence susceptibility assessments, making it clear that temporal factors should be built into landslide susceptibility modeling.
While the Artificial Digital Elevation Models (ADEMs) in this study provide a controlled approach to simulate landscape evolution, it is essential to acknowledge the challenges of accurately reconstructing historical terrain conditions. Real-world landscape degradation is influenced by complex interactions between geomorphic processes, vegetation dynamics, and anthropogenic activities, which may not be fully captured by simplified erosion simulations. However, previous studies have demonstrated the feasibility of terrain reconstruction using various methodologies. For instance, ref. [32] explored modeling and information reconstruction from landslide monitoring data, providing insights into historical landscape changes. Similarly, ref. [33] validated displacement field reconstructions in landslide physical modeling using terrain laser scanning. Other approaches, such as soil depth reconstruction for landslide susceptibility assessment [34] and drone-based landslide mapping for 3D terrain reconstruction [35], highlight the potential for integrating historical topographic data into susceptibility modeling. Incorporating such methodologies into future studies could further refine ADEM accuracy and improve its applicability to real-world scenarios.

2.3. Morphometric Indices Extraction

Morphometric indices play a crucial role in landslide susceptibility assessment, as they quantify terrain characteristics that directly influence slope stability, such as gradient, curvature, and roughness. These indices help capture the hydro-geomorphological controls on landsliding, providing essential insights into how topographic features contribute to slope failures. Our selection of morphometric indices was based on an extensive literature review [3,36], ensuring that the most relevant and widely recognized parameters were incorporated into the study.
To scrutinize how temporal landscape features influence susceptibility, a total of 16 standard morphometric indices were extracted from each ADEM using SAGA-GIS v8.0.1. These indices are critical components of landscape modeling characteristics with respect to their effects on landslides, including aspects like slope stability and hydrological patterns [36,37,38,39,40,41,42,43]. These indices, together with their inherent causative role in landslide susceptibility modeling (LSM), are detailed in Table 1.
These indices were recalculated for each ADEM, creating temporally nuanced maps that enhance the susceptibility model’s ability to recognize the factors influencing landslide occurrence over time (Figure 4).

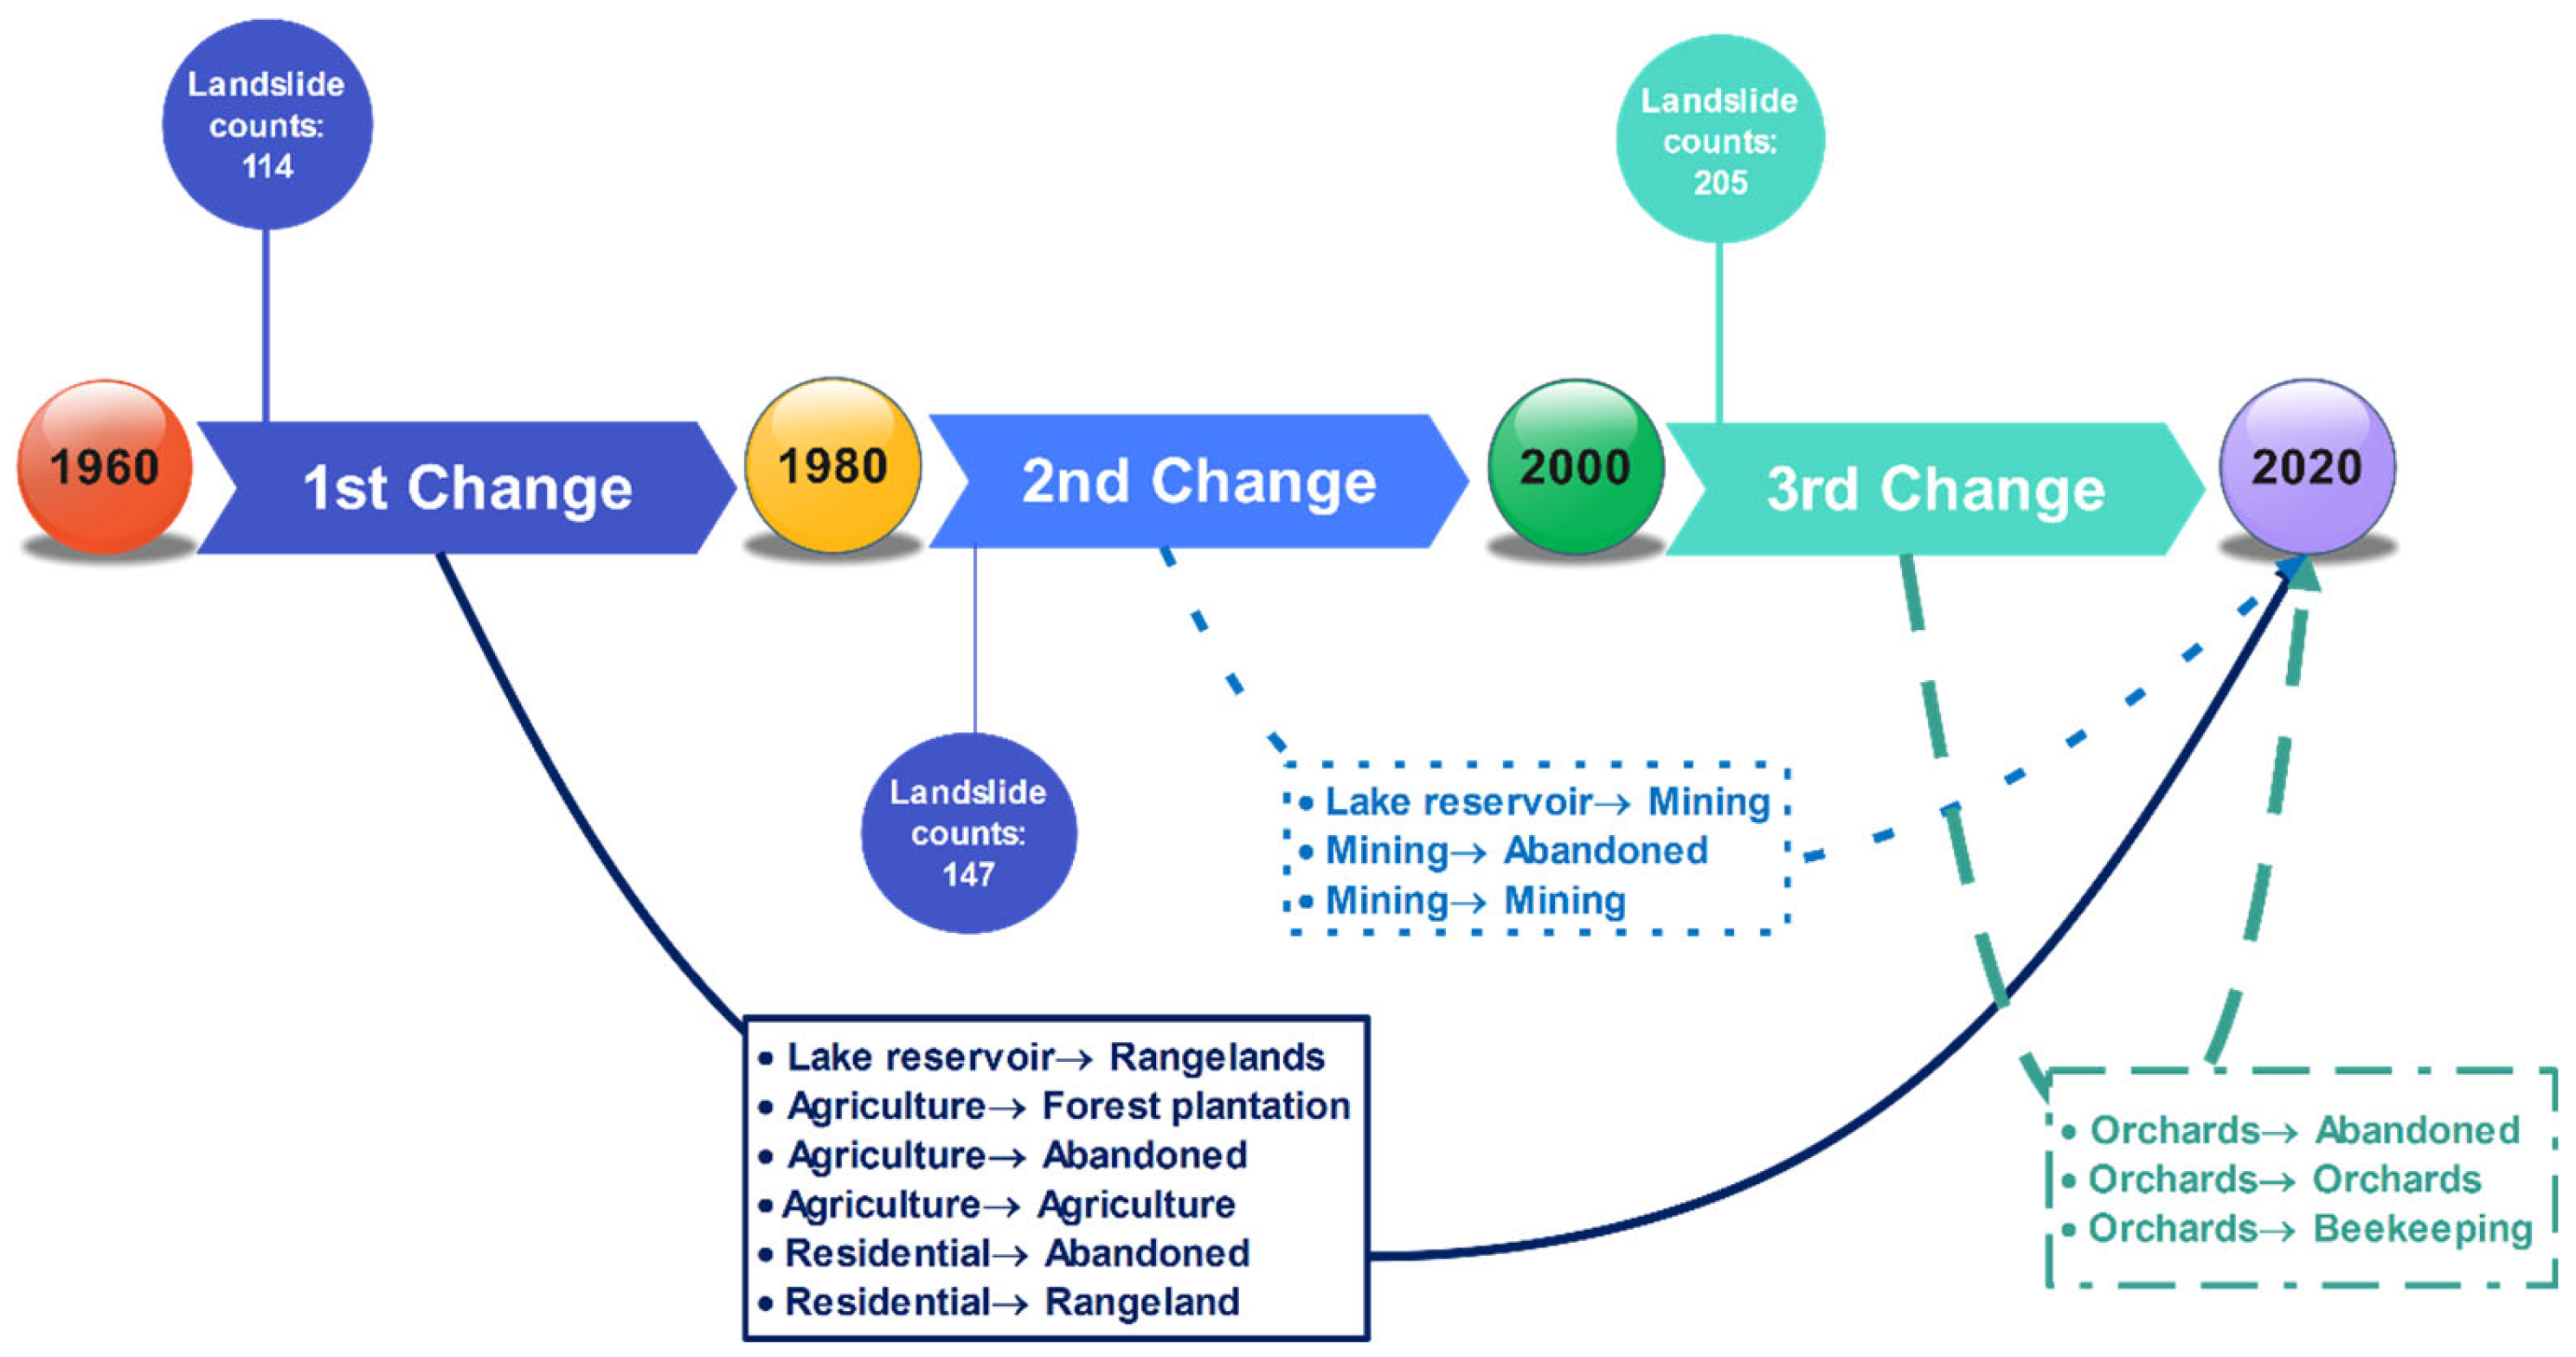
2.4. Land Use/Cover Change Analysis

The initial land use and land cover (LULC) map for 1960 and its subsequent transformations were conceptually modeled across two key phases: degradation (1960–1980) and rehabilitation (post-1980). The rapid changes in LULC over time, which were pertinent to landslide susceptibility, were historically captured and mapped for different time phases in Figure 5 and Figure 6.

2.4.1. Degradation Phase (1960–1980)

Derived from a conceptual simulation, this phase encompassed extreme deforestation, agricultural expansion, and urbanization that resulted in widespread land degradation. Clearing of the forests for timber and agriculture would have invariably led to soil erosion and a decline in slope stability. Mining activities worsened land degradation, leading to barren, unstable surfaces that increased susceptibility to landslides. During this episode, one finds a poorly vegetated scene with great runoff and huge soil loss.

2.4.2. Rehabilitation Phase (Post-1980)

Following the degradation depicted in the previous simulation phase, a new simulation phase of regional conservation emerged, aiming to stabilize the land through both biological and structural measures. Rehabilitation interventions in this phase included forestry projects and the introduction of sustainable agriculture systems, as well as various land reclamation projects. For instance, some areas previously used for farming and mining were converted into orchards or herbal croplands, while afforestation efforts were undertaken to enhance soil stability. These changes, although not entirely successful, reduced susceptibility in some areas by reducing runoff and increasing vegetative cover; however, some degraded patches remained vulnerable to landslides.
These phases are mapped in the form of a multi-temporal LULC map that incorporates information on both historical degradation and current conditions. The integrated LULC comprises predisposing LULC types at landslide locations and current LULC classes in the remaining areas. This allows the model to understand how historical LULC types have caused a rise in landslide susceptibility and to generalize this updated understanding to the current land use configuration (Figure 6).

2.5. Reconstruction of Historical Road Networks

To accurately represent the evolving influence of roads on landslide susceptibility, we reconstructed historical road network maps by hypothesizing the phased development of road infrastructure over time. Given that the current road network was assumed to be finalized after 2000, we drew the road configurations for earlier periods by considering the major construction phases and using logical inferences based on infrastructure expansion trends, ensuring that the road network gradually expanded over time. Based on these reconstructed road maps, we then generated distance-to-road maps for each period, measuring the proximity of landslide locations to the corresponding road network of that time. These evolving distance-to-road layers were integrated into the strategized model, allowing it to capture the temporal variations in road influence on landslide occurrence. In contrast, the blind model only used the present day road network (i.e., the fully extended version) for all landslide events, disregarding historical changes in infrastructure development and potentially introducing misleading susceptibility correlations.

2.6. Integration of Temporal Changes into Susceptibility Modeling

A key aspect of this study is the integration of temporal landscape changes into the susceptibility modeling framework to ensure that the pre-landslide conditions of various controlling factors are accurately represented. Rather than treating spatial and temporal analyses separately or inputting landslide-controlling factors multiple times at different time steps, we employed a multi-temporal thematic mapping approach. For each landslide-controlling factor (e.g., land use, slope gradient, and vegetation cover), a single composite thematic map was generated that dynamically reflects the state of that factor before landslide occurrences across different time periods, while areas outside the landslide domain retained the current state of the study area. This means that each thematic map represents the most relevant predisposing conditions at the time of failure rather than a static, present day dataset. This approach prevents redundancy and avoids the introduction of collinearity, as no factor is entered into the model multiple times for different time steps. One version of this process, incorporating historical pre-landslide conditions, formed the strategized model, while another version, using only present day data for each factor, constituted the blind model (further discussed in Section 2.7).
To achieve multi-temporal thematic maps, the thematic layers were constructed using historical datasets corresponding to known landslide occurrences. For example, land use maps from earlier years were utilized to capture the state of the land cover before landslides occurred in those respective periods. Similarly, morphometric and hydrological attributes were extracted based on terrain reconstructions that approximate pre-landslide topographic conditions. These thematic maps were then used as inputs in the strategized model, which contrasts with the blind model, where only present day conditions are considered, ignoring past landscape dynamics.
This methodological approach ensures that the susceptibility assessment reflects the true causative conditions that led to landslides rather than a static representation that may not account for past landscape modifications. By adopting this integrated approach, we ensure that the modeling process accounts for landscape evolution over time, enhancing the reliability of susceptibility predictions while avoiding methodological pitfalls such as collinearity or redundant data input. In other words, instead of treating temporal and spatial analyses separately, we integrate them into a unified dataset where each mapped factor represents its evolving state only at locations relevant to landslide occurrences over time.

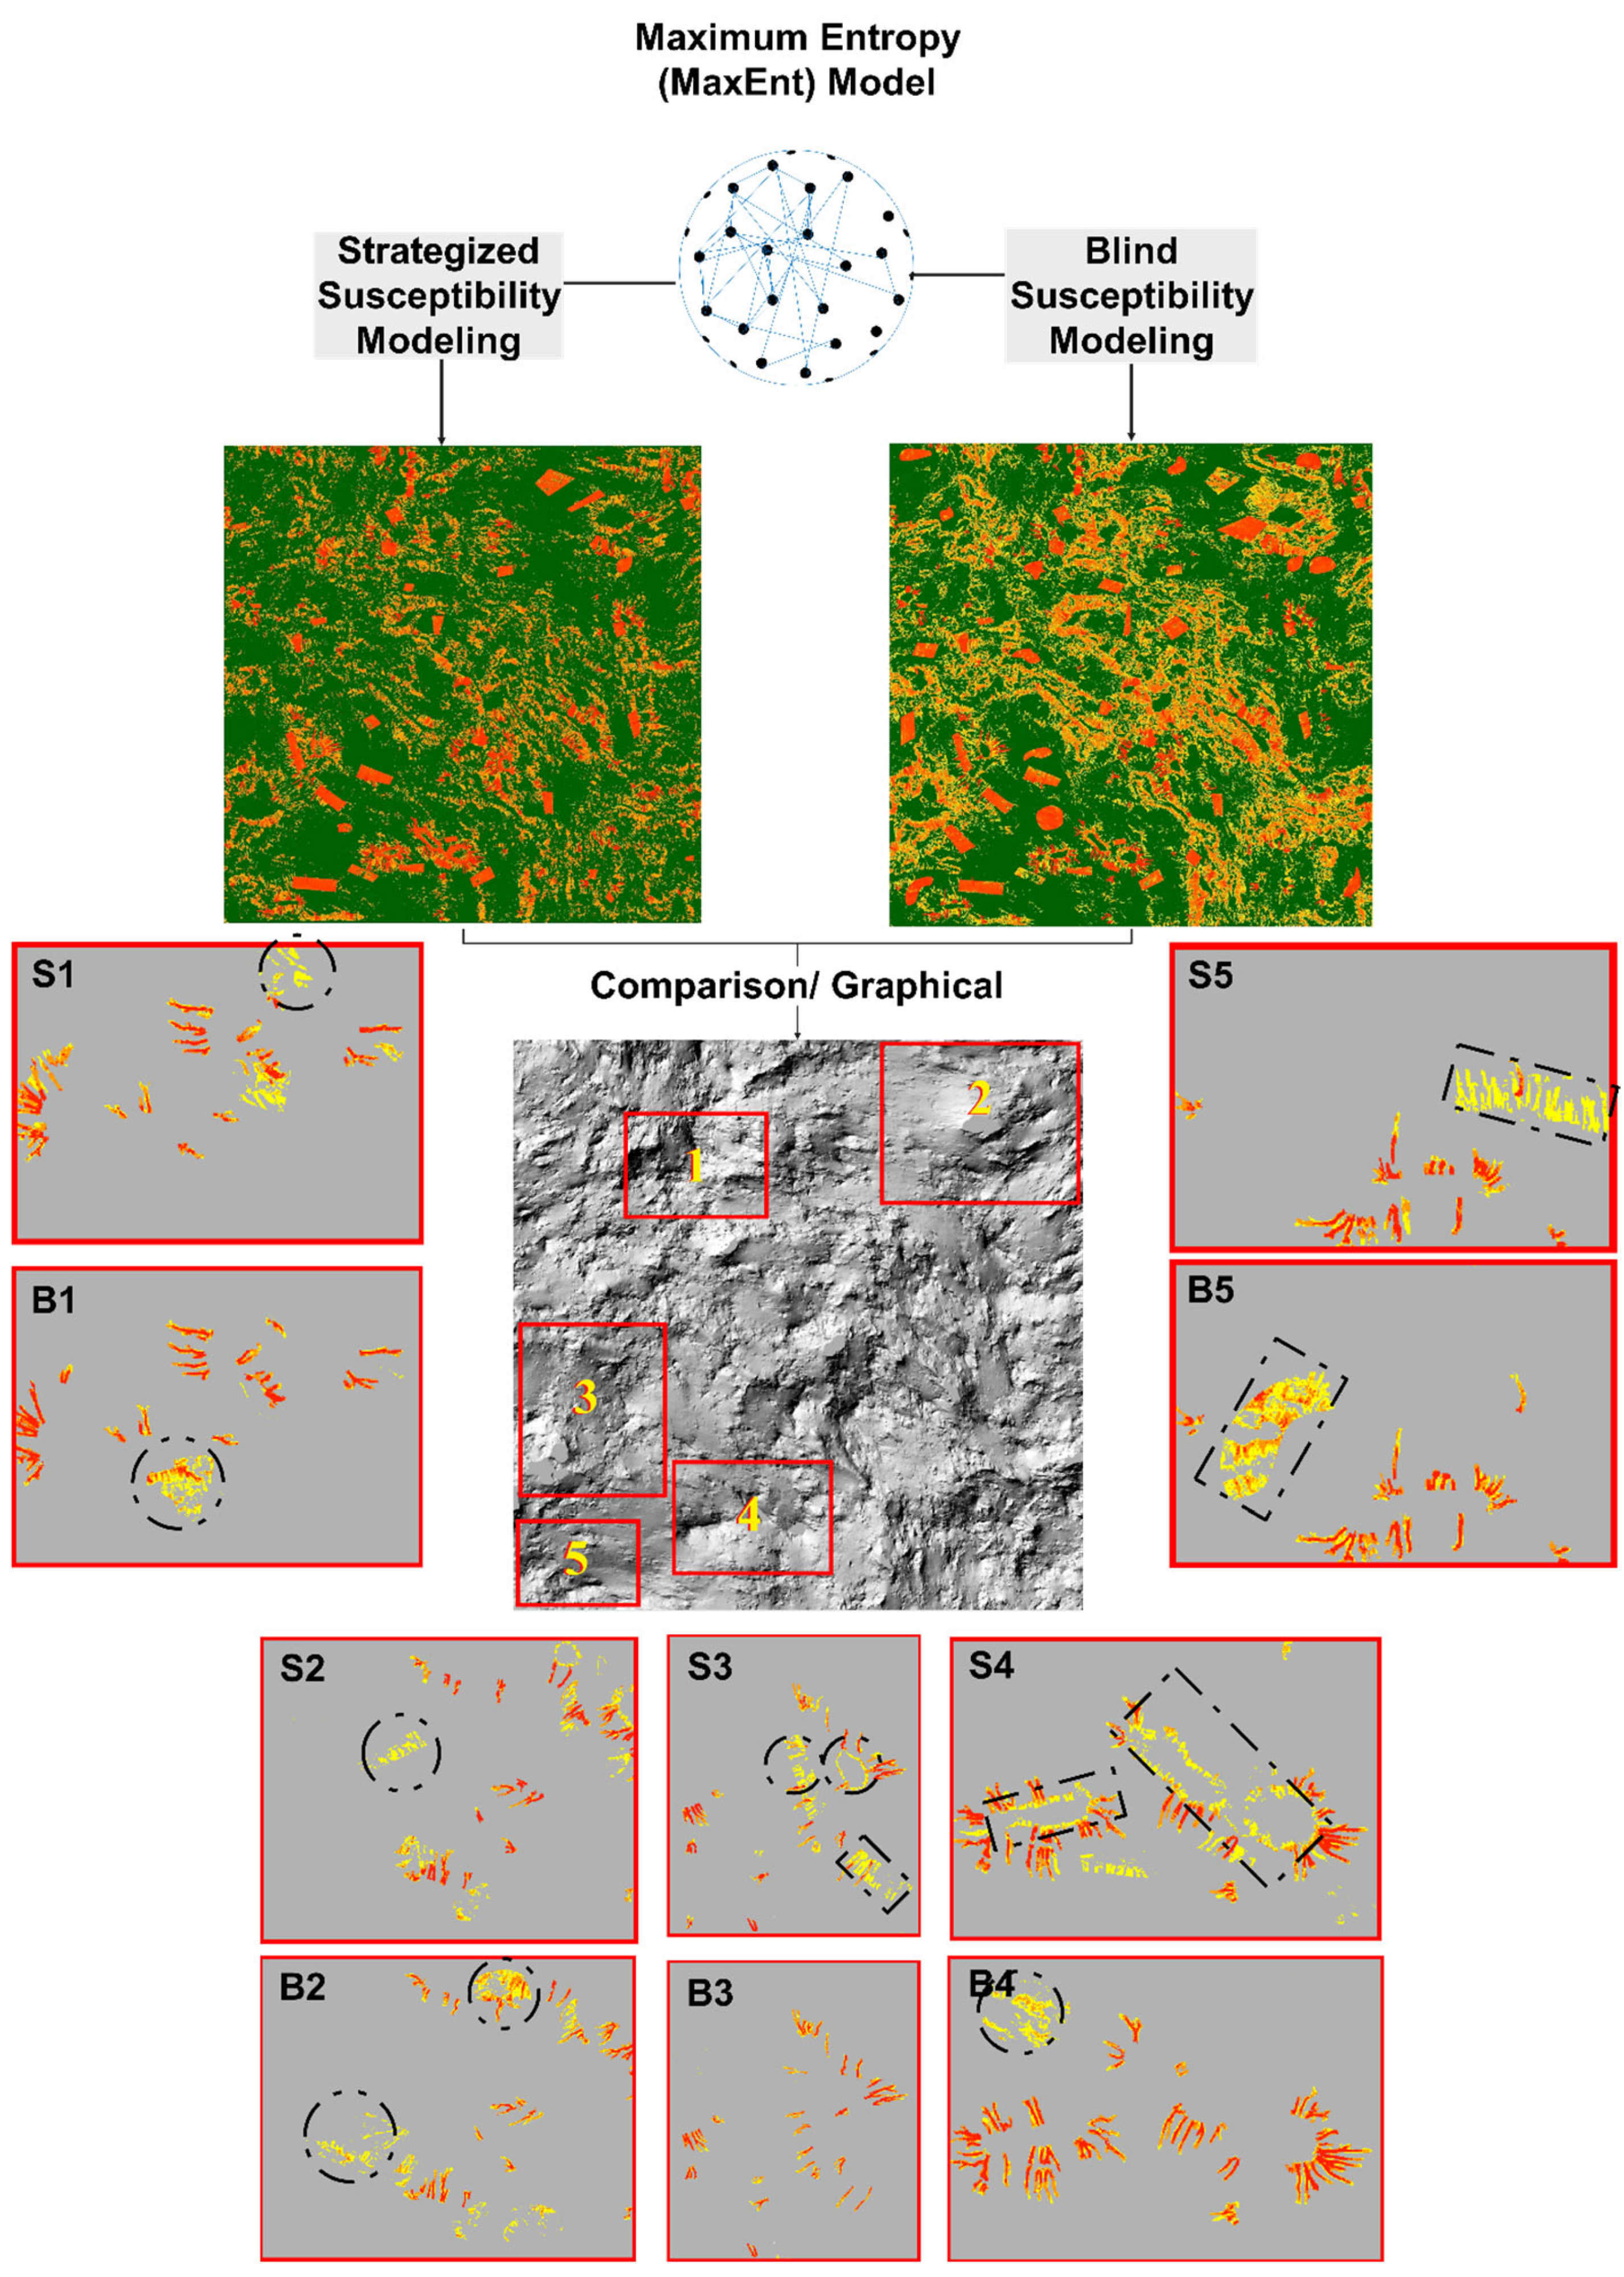
2.7. Landslide Susceptibility Modeling

2.7.1. Modeling Scenarios

We applied the Maximum Entropy (MaxEnt) model to explore two contrasting susceptibility modeling approaches:
  • Strategized Modeling: Incorporates historical LULC and morphometric data across all ADEMs, providing a temporally integrated model.
  • Blind Modeling: Relies solely on current data, representing a static approach commonly used in conventional LSA.
The MaxEnt is a popular presence-only, machine learning-based predictive modeling tool more suitable for cases where the available presence data are incomplete or sparse. The MaxEnt framework estimates a probability distribution function describing a phenomenon (here, landslide occurrence) that maximizes entropy, given a set of constraints based on the known data. In our study, we used the MaxEnt modeling tools developed by Phillips et al. (2004, 2006) for landslide susceptibility assessment [44,45]. An extensive explanation of the underlying mathematics and theoretical basis of MaxEnt was provided by Phillips et al. (2004, 2006), Phillips (2005), Phillips and Dudík (2008), Elith et al. (2011), and Kornejady et al. (2017) [44,45,46,47,48,49].
One limitation of MaxEnt is its reliance on presence-only data, which can lead to biased predictions if pseudo-absence data are not carefully generated. To address this, the model was calibrated by selecting background points that approximate true absences, ensuring a spatially representative sampling of non-landslide locations. We employed a bias-correction strategy by generating pseudo-absence points at locations with similar environmental conditions but no recorded landslides, following the recommendations of ref. [47]. To mitigate potential overfitting, we applied a regularization multiplier and tested multiple feature class combinations, selecting the optimal configuration based on the AUC and omission rates.

2.7.2. Model Calibration and Validation

The calibration of both models was based on a landslide inventory composed of 114 landslides after 1960, 147 landslides after 1980, and 205 events recorded after 2000. The performance of each model in terms of predictive accuracy was evaluated using the Area Under the Receiver Operating Characteristic Curve (AUC). A ROC curve is created by assessing a model’s performance at discrete threshold settings to distinguish positive instances (landslide-affected locations) from negatives (non-landslide locations). For each threshold, the True Positive Rate (sensitivity) and the False Positive Rate (1-specificity) are calculated. The True Positive Rate (TPR) is the number of correctly identified positive cases divided by the total of actual positives, while the False Positive Rate (FPR) is the number of falsely positive errors divided by actual negatives. Therefore, at a given threshold, the ROC curve is expressed as an x–y coordinate pair, with TPR as y and FPR as x. Ideally, the curve should approach a “1,1” point from the origin, reflecting a superior model highly capable of discriminating between the two classes (i.e., positives and negatives). Therefore, the area under the ROC curve (AUC) is an established single measure of accuracy, with a high AUC indicating better model performance in differentiating between positives and negatives and an AUC of 0.5 meaning that the model’s prediction is random [50,51,52,53,54,55,56].

2.8. Evaluation of Model Differences and Temporal Effects

Significant differences between the models will be further analyzed using susceptibility maps (providing a visual interpretation of two different spatial prediction patterns) and response curves (illustrating how landslide susceptibility varies with changes in the values of landslide-controlling factors). A graphical comparison would indicate the differences in susceptibility classifications between the strategized and blind models, where mismatches connoting false positives or negatives occur due to changes being overlooked over time. The response curves would also show how susceptibility predictions change with each factor (including DEM, LS factor, convergence index, profile curvature, TPI, rainfall, distance from roads, distance from streams, and LULC), highlighting that false assumptions may misinterpret susceptibility shifts due to their static nature.

3. Results

3.1. Temporal Evolution of Landscape and Landslide Susceptibility Patterns

Over time, the exact changes in land use were chronically elaborated in four intervals: 1960, 1980, 2000, and 2020 to exert the influence of natural and human modifications on the degree of landslide susceptibility. These hypothetical landscape changes represent a simulated time lag that mimics patterns of degradation and partial recovery comparable to occurrences in the field, such as in Golestan Province of Northeast Iran. The degradation phase, characterized by deforestation, urban expansion, and mining, significantly affected soil stability, runoff patterns, and vegetation cover. These are responsible for the rise in landslide incidences demonstrating a direct association between degradation instigated through human activities, with landslide incidences increasing from 114 in 1960 to 147 in 1980 and to 205 in 2000. The findings reveal that landscape degradation has negatively impacted landslide susceptibility as vegetation and soil destabilization increased vulnerability. From 1980 onwards, however, the landscape was in a rehabilitation phase during which conservation-based measures were developed to stabilize the land: reforestation, orchard establishment, and other forms of land reclamation. Although these activities certainly reduced landslide risk, some scars from the degrading phase remained, rendering some areas more vulnerable than others. These findings indicate that, while rehabilitation can bring about some stabilization of the landscape, this is evinced by the legacy of past land use; particularly in mining and deforested regions, care should be taken in accounting for such temporal effects in LSA modeling. This detailed evolution of LULC throughout these decades, illustrated in Figure 6, affords another support to this narrative. The timeline indicates shifts from destructive land uses such as agriculture and mining to more sustainable uses like orchards and beekeeping. This shift reflects a U-shaped pattern of land management, where degradation is followed by some effort towards restoration. However, the incomplete nature of these rehabilitation efforts is evident from the continued vulnerability in some circumstances, which firmly reinforces the idea that vulnerability was not simply a product of present conditions, but it was ingrained in the historical land use practices [57].

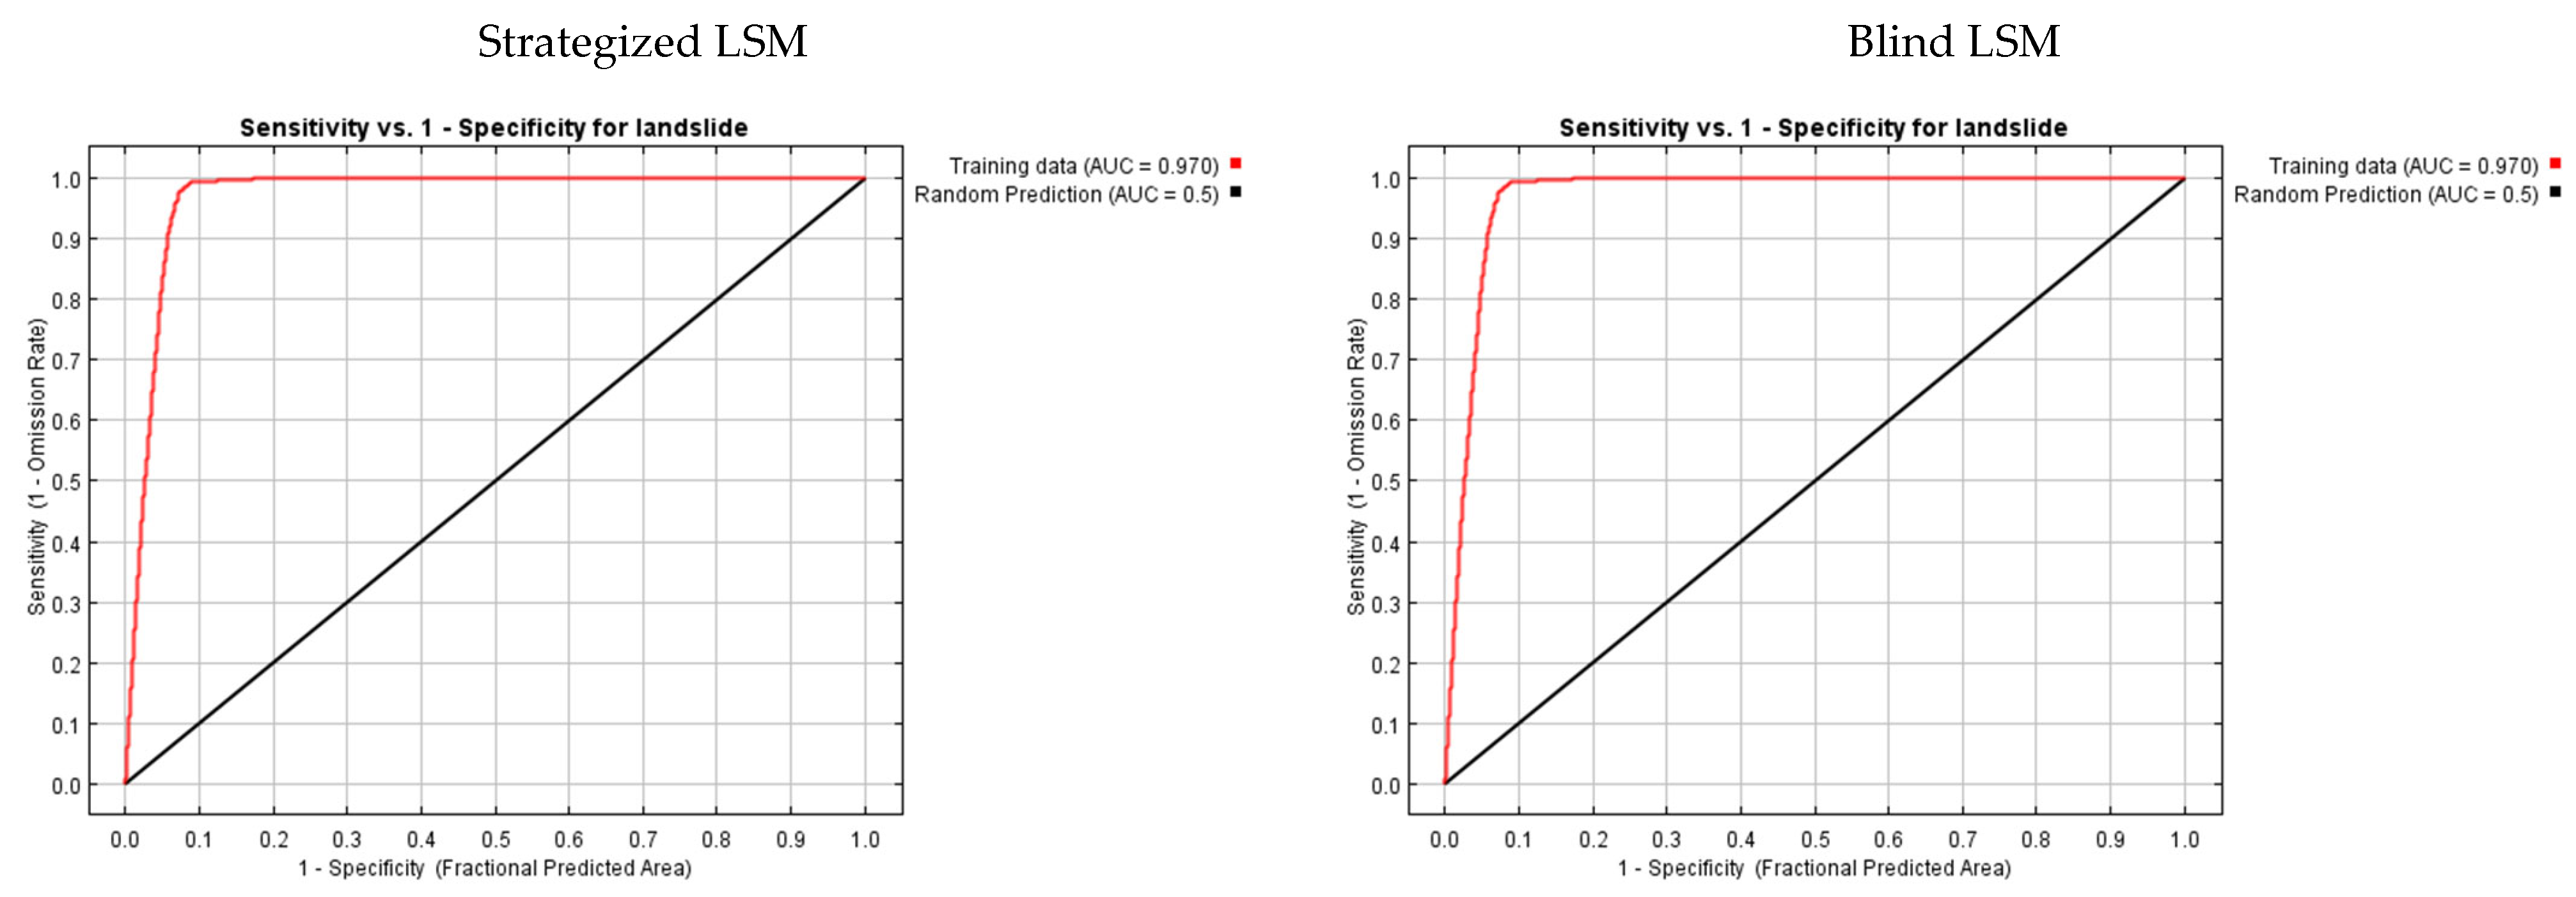
3.2. Comparison of Strategized and Blind Models in Susceptibility Mapping

This study’s main contribution lies in the comparison between the blind model and the strategized model that incorporates historical landscape evolution. Figure 7 depicts the landslide susceptibility with two contradictory patterns from the two models. In a nutshell, the strategized model encapsulates the accrued effects of past degradation and partial rehabilitation, which produces a more nuanced susceptibility map due to the incorporation of historical LULC and morphometric data. However, the blind model produces plenty of false positives and false negatives due to overlooking historical evolutions. The blind model, for example, misapplies current land uses—for instance, orchards—as key causal agents of landslides in zones where landslides occurred in the past owing to previous land uses such as agriculture or mining. Thus, the result is that even places previously occupied by orchards would occasionally fall under the threshold of highly susceptible zones to landsliding by the blind model. The strategized model, in contrast, correctly identifies the historic causes of slope instability, avoiding such misclassification, and offers a more reliable susceptibility estimation. This misclassification is due to the blind model’s widespread ignorance of the legacy effects of previous land uses.
Figure 7 shows the regions where the two models disagree and present contrasts in susceptibility, which are highly indicative descriptions of places where extreme LULC changes have occurred. These mismatches indicate how neglecting temporal factors can lead to erroneous risk assessments that could potentially misguide resource allocation for landslide mitigation.

3.3. Temporal Sensitivity of Morphometric and Environmental Factors

The response curves in Figure 8 illustrate how various morphometric and environmental factors correlate with landslide susceptibility in both the strategized and blind models. Each factor exhibits a unique susceptibility trend, reflecting the divergence between the two modeling approaches. The strategized model, taking into consideration pre-landslide conditions, yields a distinct response. However, the blind model often indicates a misleading relationship that is overly dependent on post-landslide conditions. A brief discussion of each factor is subsequently presented.

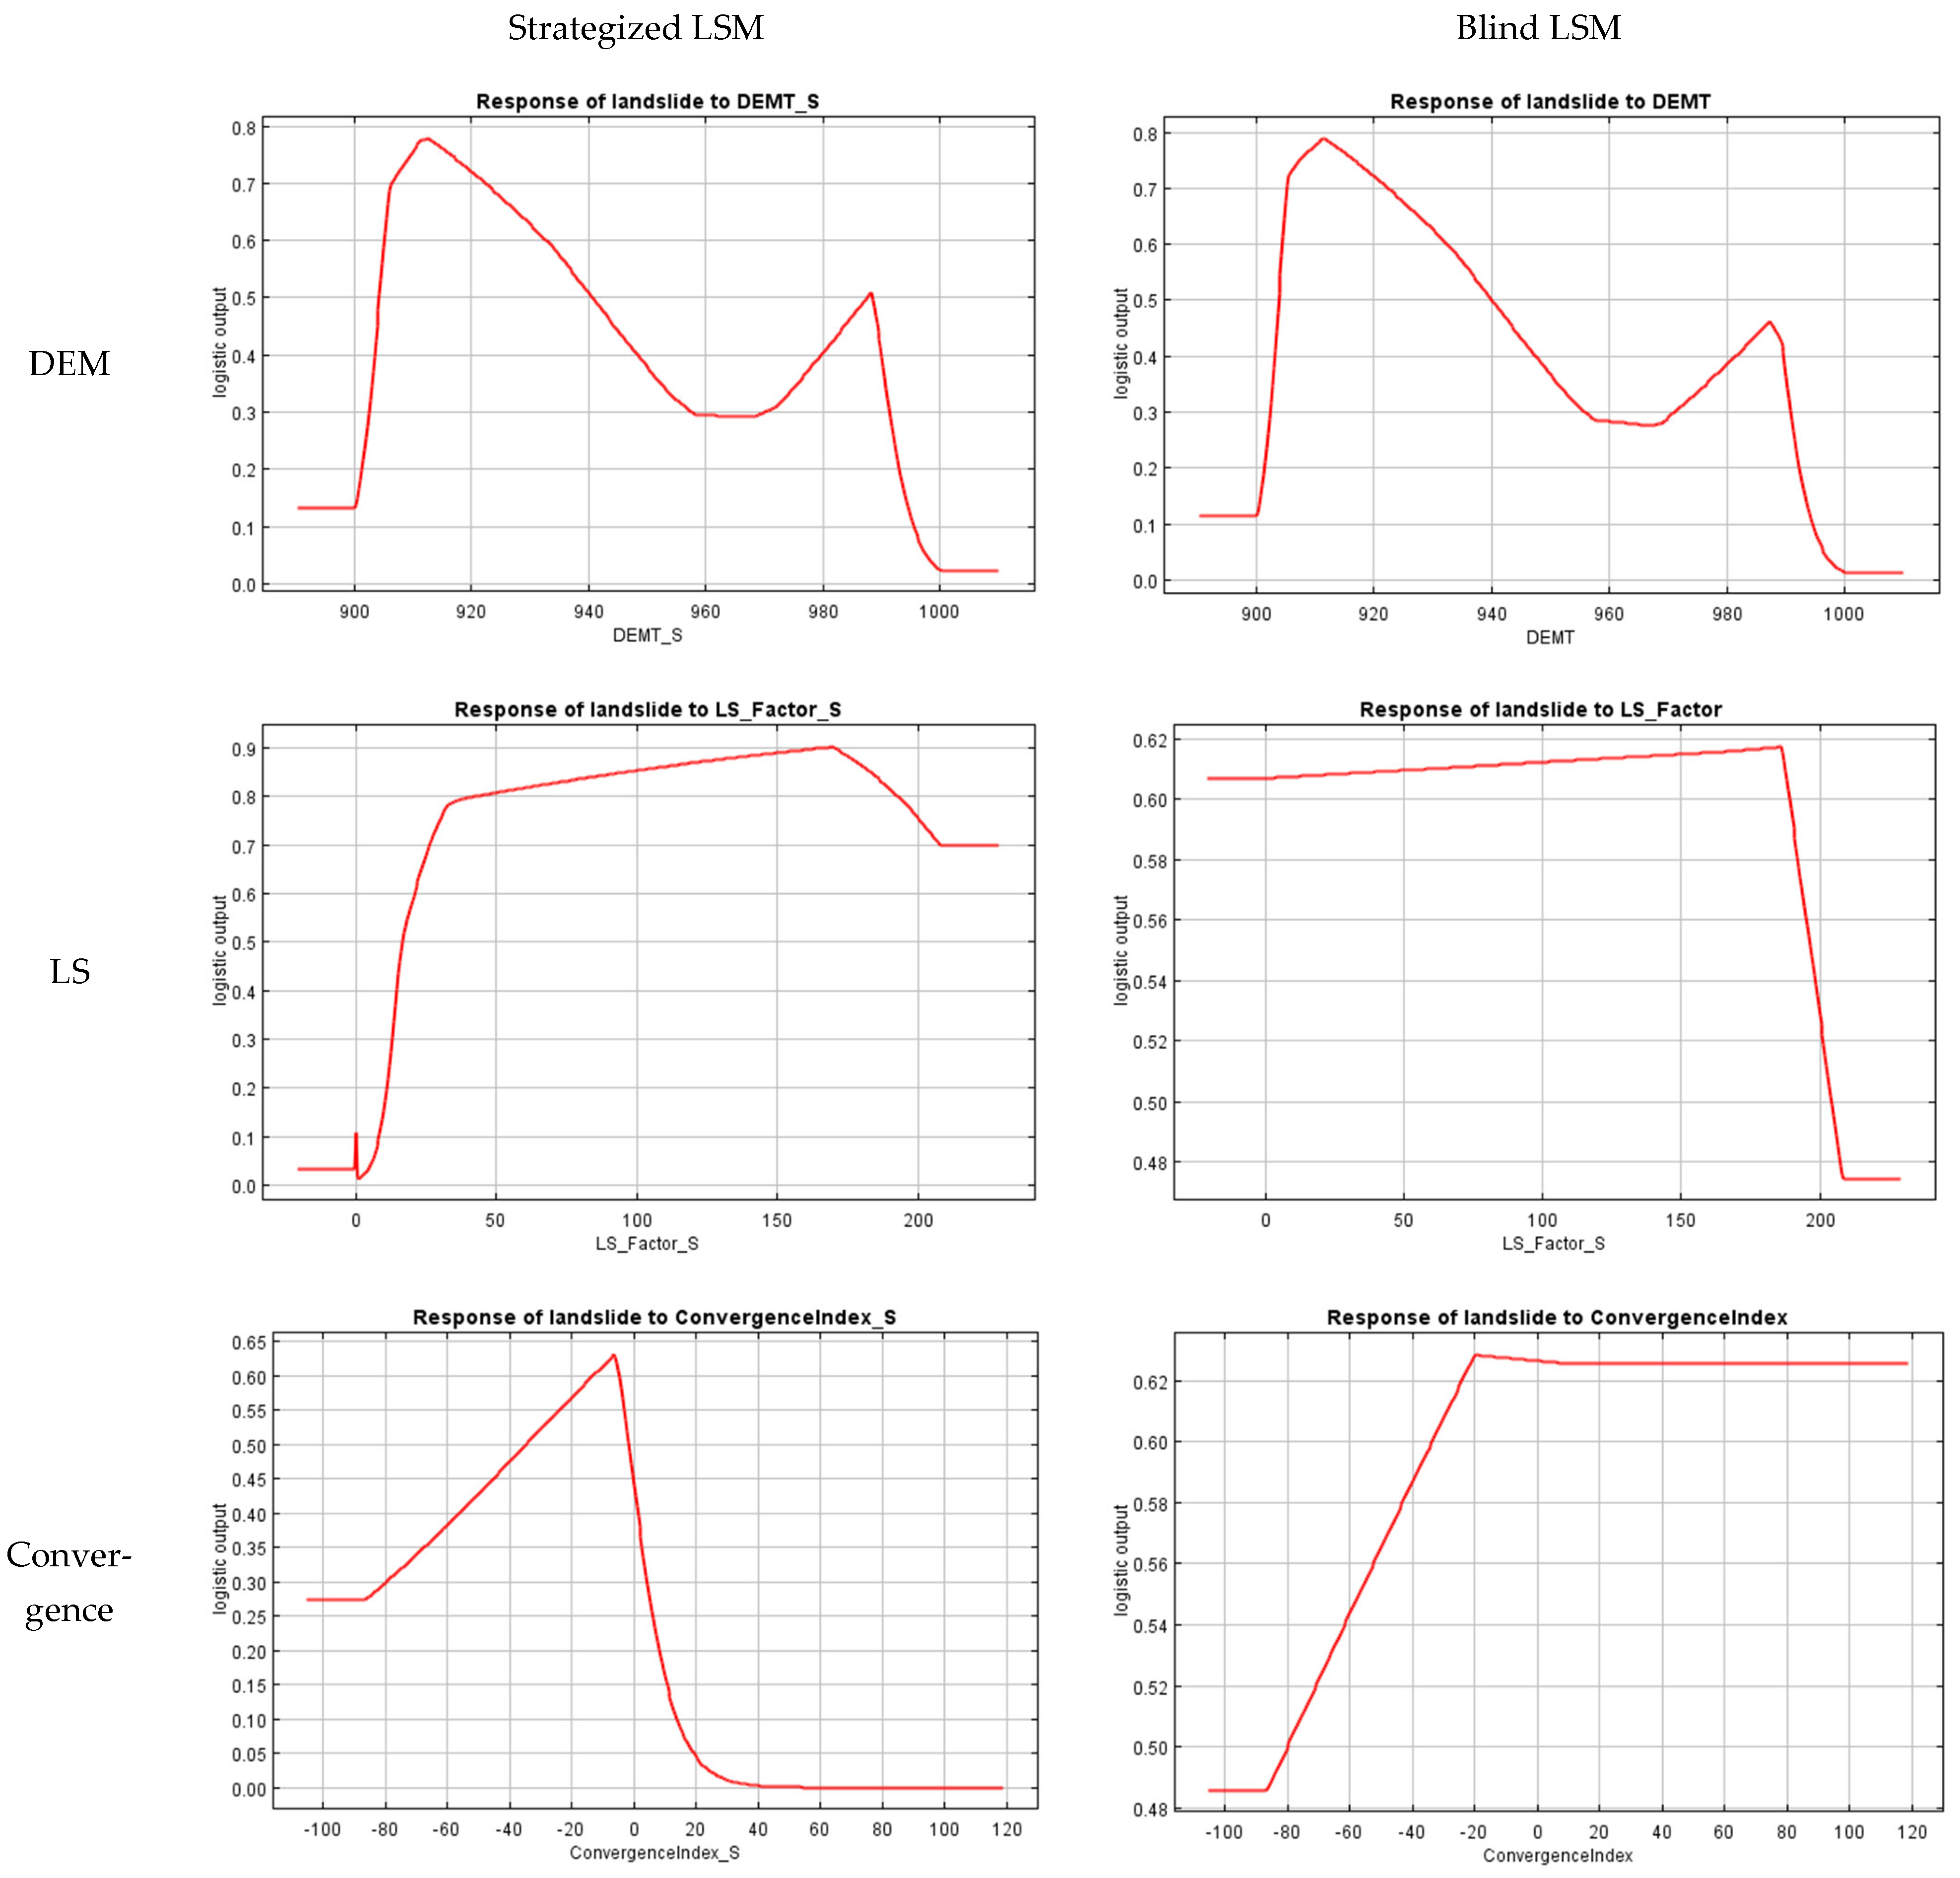
3.3.1. Digital Elevation Model (DEM)

The response curves in both the strategized and blind models for DEM data are similar, confirming that elevation plays an equivalent role in landslide susceptibility across both models. This similarity arises from the fact that, in the two models, the change in topography in the strategized scenario does not significantly alter the elevation of the sites where historical landslides occurred. Thus, landslide susceptibility patterns regarding elevation are similar for both models. Even though, unlike the blind model, the strategized model includes multi-temporal data, the nature of the elevation appears static, as it does not differ between past and present DEMs, and so, the landslide-prone zones remain at almost similar elevations over this time. This finding suggests that other morphometric factors could be influenced through landscape evolution, yet the distance between DEM-derived elevations has remained fairly static, reflecting similar patterns in the response curves for both modeling strategies.
Yet, assuming other topographical attributes remain unchanged through time is an oversimplification of the pattern that excludes critical temporal information affecting different susceptibility patterns. Clearly, in rotational slides, substantial differences exist between the pre- and post-slide topography, with the sliding mass forming a considerably altered spoon-shaped surface of rupture and backscarp. Thus, significant differences in some DEM-derived morphometric parameters, such as curvature and slope gradient, become evident (Figure 9). Although translational slide activity (where soil/rock moves along a relatively straight, planar surface) is fundamentally governed by slope topography (e.g., slope angle) [58], its predisposition may also be influenced by historical changes, such as land use shifts or climatic variations, which alter the subsurface hydrology or shear strength over time [59]. These dynamic changes accentuate the need for such models to incorporate temporal changes for efficient susceptibility mapping.

3.3.2. Slope Length (LS) Factor

The response of the LS factor in the strategized model was more pronounced, so much so that increasing the slope length and steepness sharply increases landslide susceptibility [59]. Such increased susceptibility is representative of pre-landslide conditions, allowing long, steep slopes that were unchanged to contribute to erosional processes and instability. The strategized model captures such sensitivity because it recognizes the susceptibility of unmodified slopes [60]. The blind model shows slower and less sensitive susceptibility, which falls short of entirely capturing the impact of slope length and steepness. This discrepancy arises because the blind model interprets a post-landslide topography already altered by the landslide event, thus reducing the apparent susceptibility of the slope.

3.3.3. Convergence Index

The convergence index suggests locations of accumulation (negative) or dispersion (positive) of water flow. In the strategized model, high susceptibility to landslides in the negative range is thought to increase toward the flat, unaltered slopes as convergence zones where water accumulation could predispose slopes to failure and collapse. As the mode shifts from convergence to divergence, the susceptibility decreases sharply, mirroring a decreased risk in those areas with dispersed flow [61]. The blind model, however, flattens out in the positive range, an erroneous interpretation possibly arising from the blind model’s reliance on current, post-landslide concave slope conditions, where altered flow paths and disrupted topography obscure the initial convergence patterns that influenced the occurrence of landslides.

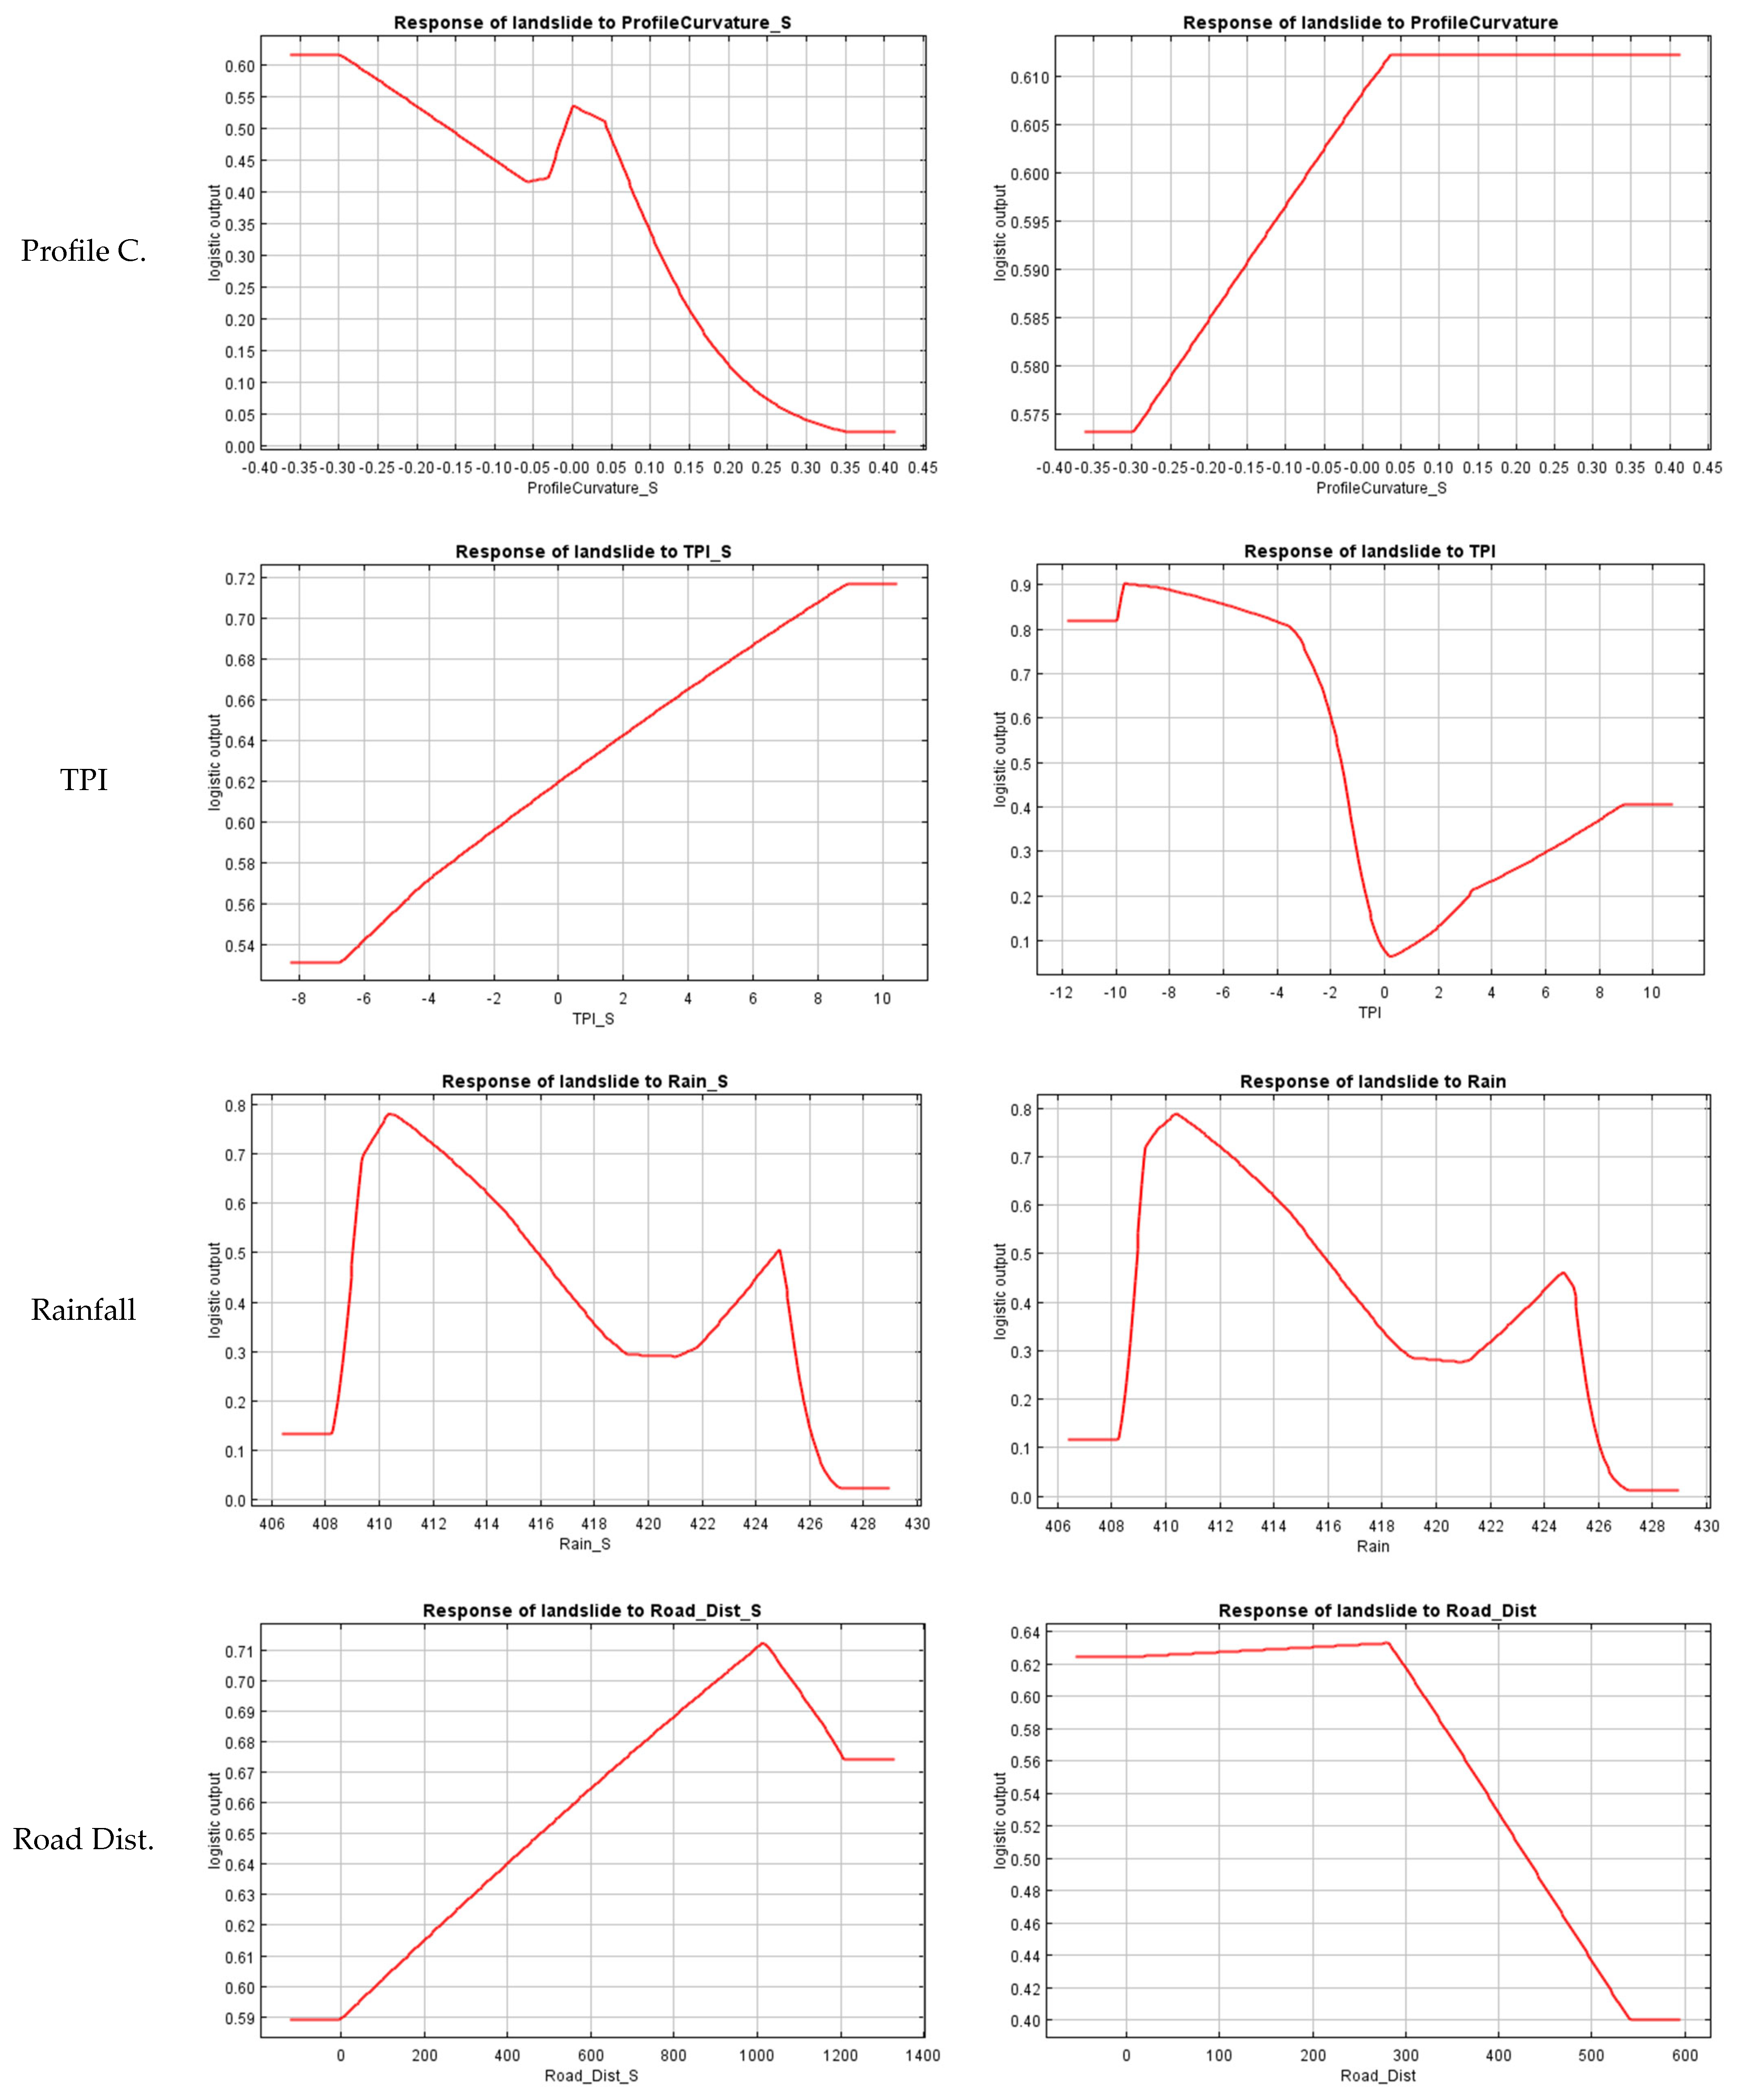
3.3.4. Profile Curvature

In the strategized model, landslide susceptibility decreases as the profile curvature moves from negative (convex) to positive (concave) values, with a small peak around zero (plain slope) [62]. Such a distribution is congruent with pre-landslide conditions, whereby convex slopes or slopes that resemble steep inclinations on average undergo initial failure more frequently [63]. The blind model, on the other hand, has shown that susceptibility rises with increased concavity, indicating a preference for the concave, post-landslide landscape. This misinterpretation on the part of the blind model is naïve, because it appears that it has automatically rendered concave, eroded slopes as inherently prone, leaving out the main and bigger assumption: that these concave shapes usually result from landslide occurrences rather than preceding them.

3.3.5. Topographic Position Index (TPI)

The TPI indicates susceptibility trends based on slope positioning, with high TPI values corresponding to ridge-like, convex positions and low TPI values to concave valleys [63]. As the TPI increases, the strategized model accurately shows an ascending trend of landslide susceptibility, signifying a greater risk on convex slopes where the flow velocity is typically higher. This sequence outlines the pre-landslide conditions to capture the true susceptibility of unaltered ridges [63,64,65]. In contrast, the blind model shows a descending trend, suggesting that very low TPI values correlate with greater susceptibility. This reversion occurs because the blind model interprets post-landslide concave forms as having greater susceptibility and fails to recognize ascending convex ridge positions, which mostly reflect pre-landslide conditions as moisture-laden, swelling slopes that would have led to the failure of the slope.

3.3.6. Rainfall

The rainfall response curves of both the strategized and blind models are structurally similar, as they are based on rainfall maps derived from DEM layers using the gradient equation. Since this gradient equation is a product of the DEM, it will give almost similar rainfall distributions for both current and historical DEMs, thus leaving a similar susceptibility response to rainfall in both models. This indicates that rainfall conditions landslide susceptibility in the same fashion for both models, not as an independent factor but as a topographical influence, with DEM being its proxy. The apparent similarity again reinforces that, by using gradient-based rainfall distribution in our models, there was no unique insight provided by our susceptibility mapping; instead, it mirrored the DEM effect, yielding similar response curves across the strategized and blind models.
Since rainfall is regarded as a triggering factor behind landslides, the rainfall extraction pursued here arises from the simplified gradient equation derived from the DEM layer; hence, in reality, it fails to capture the nuanced causative role of rainfall in landslide occurrences [66]. This approach is neither capable of capturing the evolution of rainfall patterns over time nor acknowledges precipitation instances directly tied to landslide-triggering events. A simplistic gradient-based rainfall layer fails to represent temporal variations in long-lasting or intense rainfall episodes responsible for slope failure. Meteorological data evaluations must be conducted in great detail, focusing on periods of accumulated rainfall or intense precipitation coinciding with previously documented landslides [66,67]. The presence of such temporal rainfall data that portray the conditions at the time of landslide occurrences would assist in developing a more legitimate susceptibility model that more genuinely represents causal mechanisms. This approach would build the model in such a way that it is no longer static but dynamic, linking susceptibility to real conditions. Hence, it will ensure a very high degree of reliability for the susceptibility model and enhance its applicability for further landslide risk assessments.

3.3.7. Distance from Roads

The response curves for distance from roads reflect a marked difference between the strategized and blind models and serve as a vivid reminder of an important issue: the historical evolution of landslide susceptibility assessment. The susceptibility response of the strategized model reflects the historical closeness of landslides to roads as they existed in the various phases of their construction, revealing how this model interprets roads’ causal roles [68]. Since the road network in this area assumed development for decades, wherein the current layout was finalized only after 2000, landslides blocking this time window would have had different distances to the road compared to those that happened subsequent to the road construction finish line. In the strategized model, the susceptibility response considers these temporal differences and thus has a nuanced susceptibility response. On the other hand, the blind model thinks the current configuration of the road is the causal agent for all the landslide events, establishing a static and hence distorted correlation between distance to the road and susceptibility. This highlights that the use of static road infrastructures in landslide susceptibility assessments would yield inaccurate results in dynamic landscapes that have ongoing infrastructure development [69].

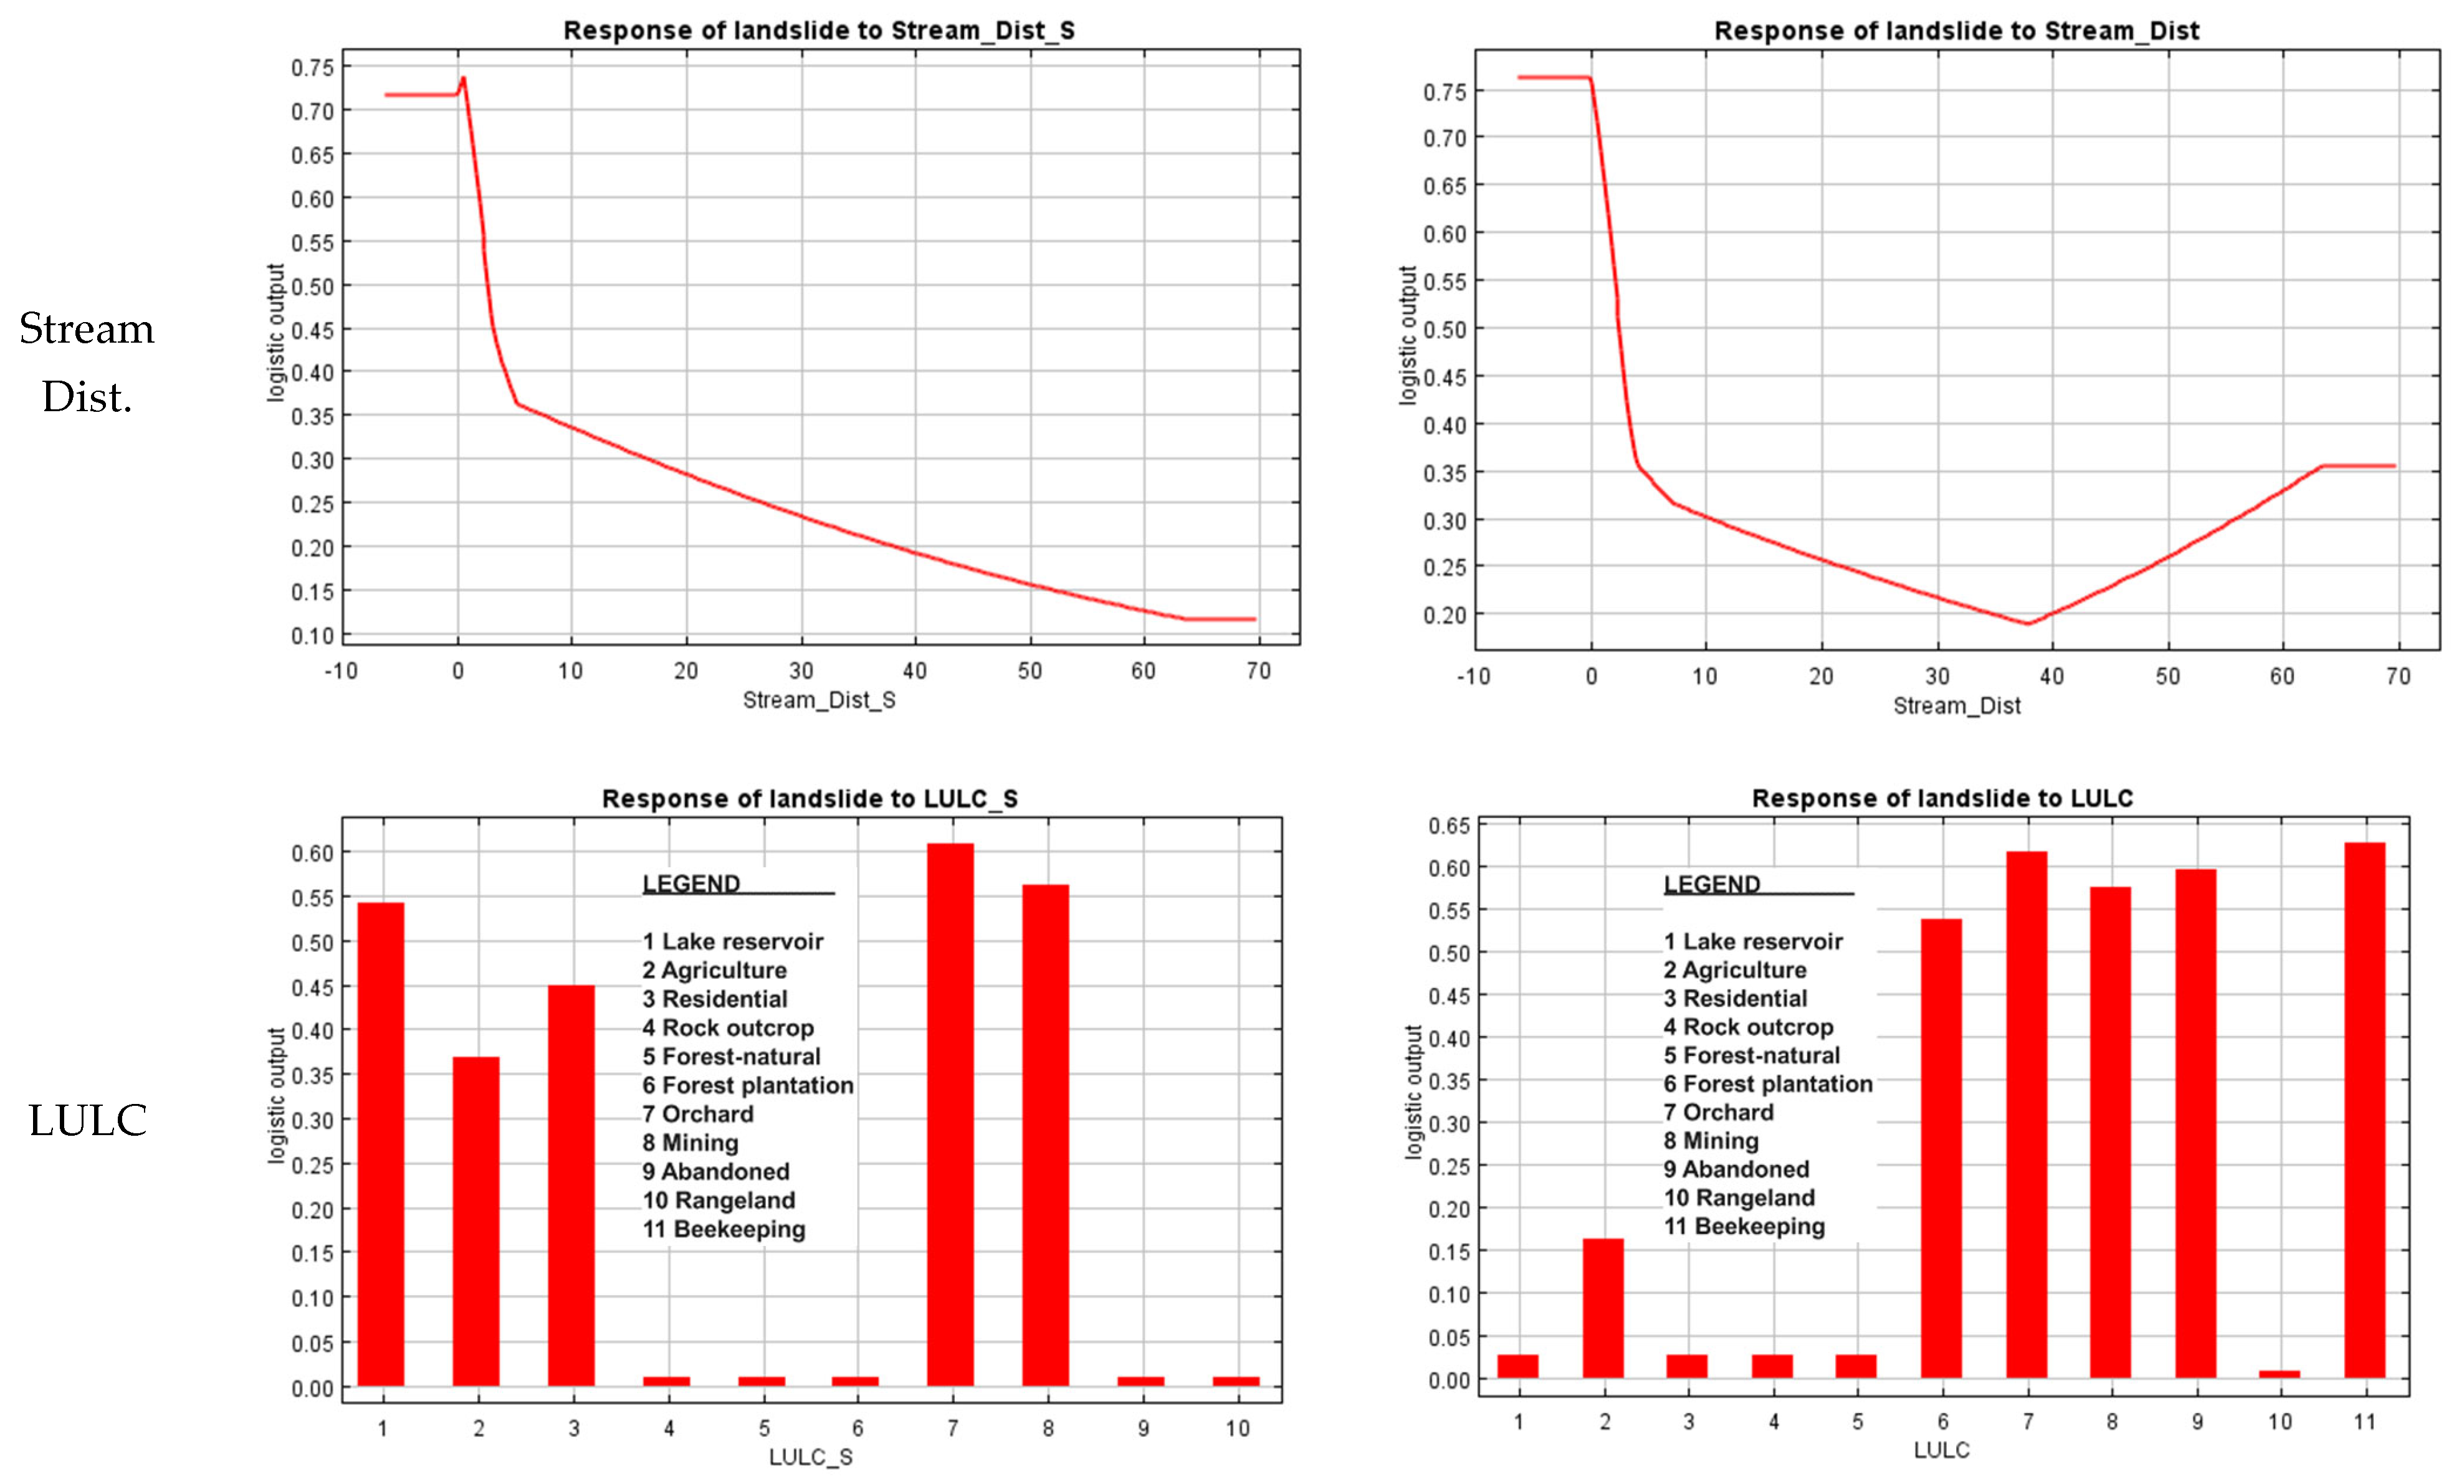
3.3.8. Distance from Streams

The response curves of the distance from streams show slight divergences for the strategized and blind models, which may have been triggered by episodic and current DEM elevation differences. Streams were automatically extracted from the topography, so slight changes in the DEM over time could translate into slight shifts in the extracted stream networks, typically first-order tributaries. Generally, the implementation of such varying characteristics over time into the strategized model led to rather small adjustments in stream locations that reflect a corresponding historical topography. Hence, these subtle stream location changes indicate that landslides did not operate at the same distance from streams in the past as they do under the current topography. The blind model does not allow this distance to be discerned, since a static stream network is assumed. Thus, there are slight changes that do not allow the systematic consideration of the temporal evolution of the landscape, which could influence the spatial relationships between landslides and distances to streams [70,71].

3.3.9. Land Use and Land Cover (LULC)

The LULC factor has reflected strong divergences between the strategized and blind models. The strategized model holds a rational perspective of high-risk LULC classes, recognizing agriculture, residential areas, mining, and orchards as historically contributing to landslide occurrences. It assimilates historic LULC data through which anthropogenic activities were responsible for unstable slopes, thus allowing it to locate genuinely susceptible areas for future landslides [23,57]. On the contrary, highly susceptible LULC classes in the blind model seem poorly conceived, as it attributes beekeeping, abandoned areas, and forest plantations to the main causes of landslide occurrence. This misattribution happens because the blind model is based on current LULC over sites with landslide evidence. Thus, it invariably issues numerous false positives and negatives in the LSM generated by the blind model. This misrepresentation could have dire consequences, diverting resources toward stable areas while leaving historically high-risk zones unprotected and potentially overpopulated.

3.4. Model Performance Evaluation Results

To assess the predictive capability of both the strategized and blind LSMs, the ROC curve was employed, and the AUC metric was calculated. As illustrated in Figure 10, both models achieved an AUC value of 0.970, which falls within the "excellent" classification threshold (AUC > 0.9). This high score suggests that the models possess a strong discriminatory power in distinguishing between areas with and without landslide occurrences within the training dataset. The identical AUC values for the two models indicate a comparable overall predictive performance in terms of classification accuracy. The ROC analysis provides a quantitative measure of classification reliability and suggests that both LSM approaches perform well in terms of general predictive ability. However, this metric alone does not fully reflect the practical effectiveness of each model. While the high AUC values imply strong overall accuracy, they do not account for how well each model captures the spatial distribution of landslides or recognizes the role of controlling factors. Therefore, the actual usefulness and robustness of each model—particularly the blind model—must be critically examined through further analysis and interpretation, as presented in the following discussion sections.

4. Discussion

4.1. Summary of Morphometric and Environmental Sensitivity Analysis

From a detailed analysis of all the factors, the understanding of the true mechanisms of landslide susceptibility is found to only be attainable through the strategized model. The pre-landslide situations studied through the strategized model depict complex and nuanced relationships between morphometric and environmental factors with susceptibility that can predict slope stability through both natural and anthropogenic risks. Each response curve—whether for LS, convergence index, or LULC—demonstrates a temporally sensitive relationship with landslide susceptibility that static models like the blind approach fail to capture. The blind model treats post-landslide data as influencing factors, thereby misattributing susceptibility to the current landscape and land use conditions. This leads to committing errors of interpretation, such as considering concave slopes or post-incident LULCs like beekeeping as the causes of future landslides. Such misunderstandings further highlight the misguidance of using static, present day data in susceptibility models, since they could lose valid rationale on the real drivers behind slope instability, eventually leading to an unreliable model with low accuracy.
This study has revealed the need for temporal sensitivity in landslide susceptibility models [72]. Such multi-temporal data incorporated into the purposive model render it capable of producing an incredibly realistic susceptibility map, grounded on the temporal development of the landscape. In contrast, static approaches such as that of the blind model could propagate false information, which could result in the misallocation of resources toward costly mitigation measures [73]. Such findings advocate the switch to temporally integrated susceptibility models, which provide measures to capture the depth of complex interactions driving landslide susceptibility in dynamic landscapes.

4.2. Implications for Landslide Susceptibility Assessment and Risk Management

The comparative analysis of strategized and blind models reveals profound implications for landslide susceptibility assessment and risk management, particularly in dynamic landscapes. The results indicate that static models, such as the blind approach, fail to capture the complex interactions of factors influencing landslide susceptibility in rapidly changing environments. By integrating multi-temporal land use/land cover (LULC) and morphometric features, the strategized model provides a more robust and realistic assessment, particularly in regions where anthropogenic activities have significantly modified landscape characteristics over time [3,6,74]. A key takeaway from this study is that landslide susceptibility models should not solely rely on the current landscape data. Instead, incorporating historical LULC changes, morphometric indices, and environmental variables enhances the predictive capability of models and reduces classification errors. Historical data provide crucial insights into past landscape modifications, including deforestation, mining, and urban expansion, which significantly alter the slope stability over time [2,75]. The inclusion of temporal data ensures that models account for cumulative land cover changes, which is essential in regions such as Golestan Province in Northeastern Iran, where land degradation and partial recovery coexist, leading to fluctuating susceptibility levels [4,76].
The integration of historical landscape dynamics into susceptibility models has practical implications for policymakers and urban planners. Landslide-prone regions often experience cycles of degradation and rehabilitation, where past land use decisions continue to influence present and future stability conditions [8,73]. Ignoring historical land use changes can lead to misinformed mitigation strategies, as static models may overestimate or underestimate susceptibility in areas where landscape conditions have evolved [26]. Incorporating multi-temporal analysis into susceptibility assessments allows for more effective disaster preparedness measures, ensuring that risk mitigation strategies align with long-term environmental changes. For example, predictive modeling that integrates historical topographic and land cover changes can help prioritize areas for reforestation, slope stabilization, and controlled urban expansion [9,76]. In this regard, policymakers should integrate susceptibility assessments with long-term land management policies to mitigate future landslide risks effectively.

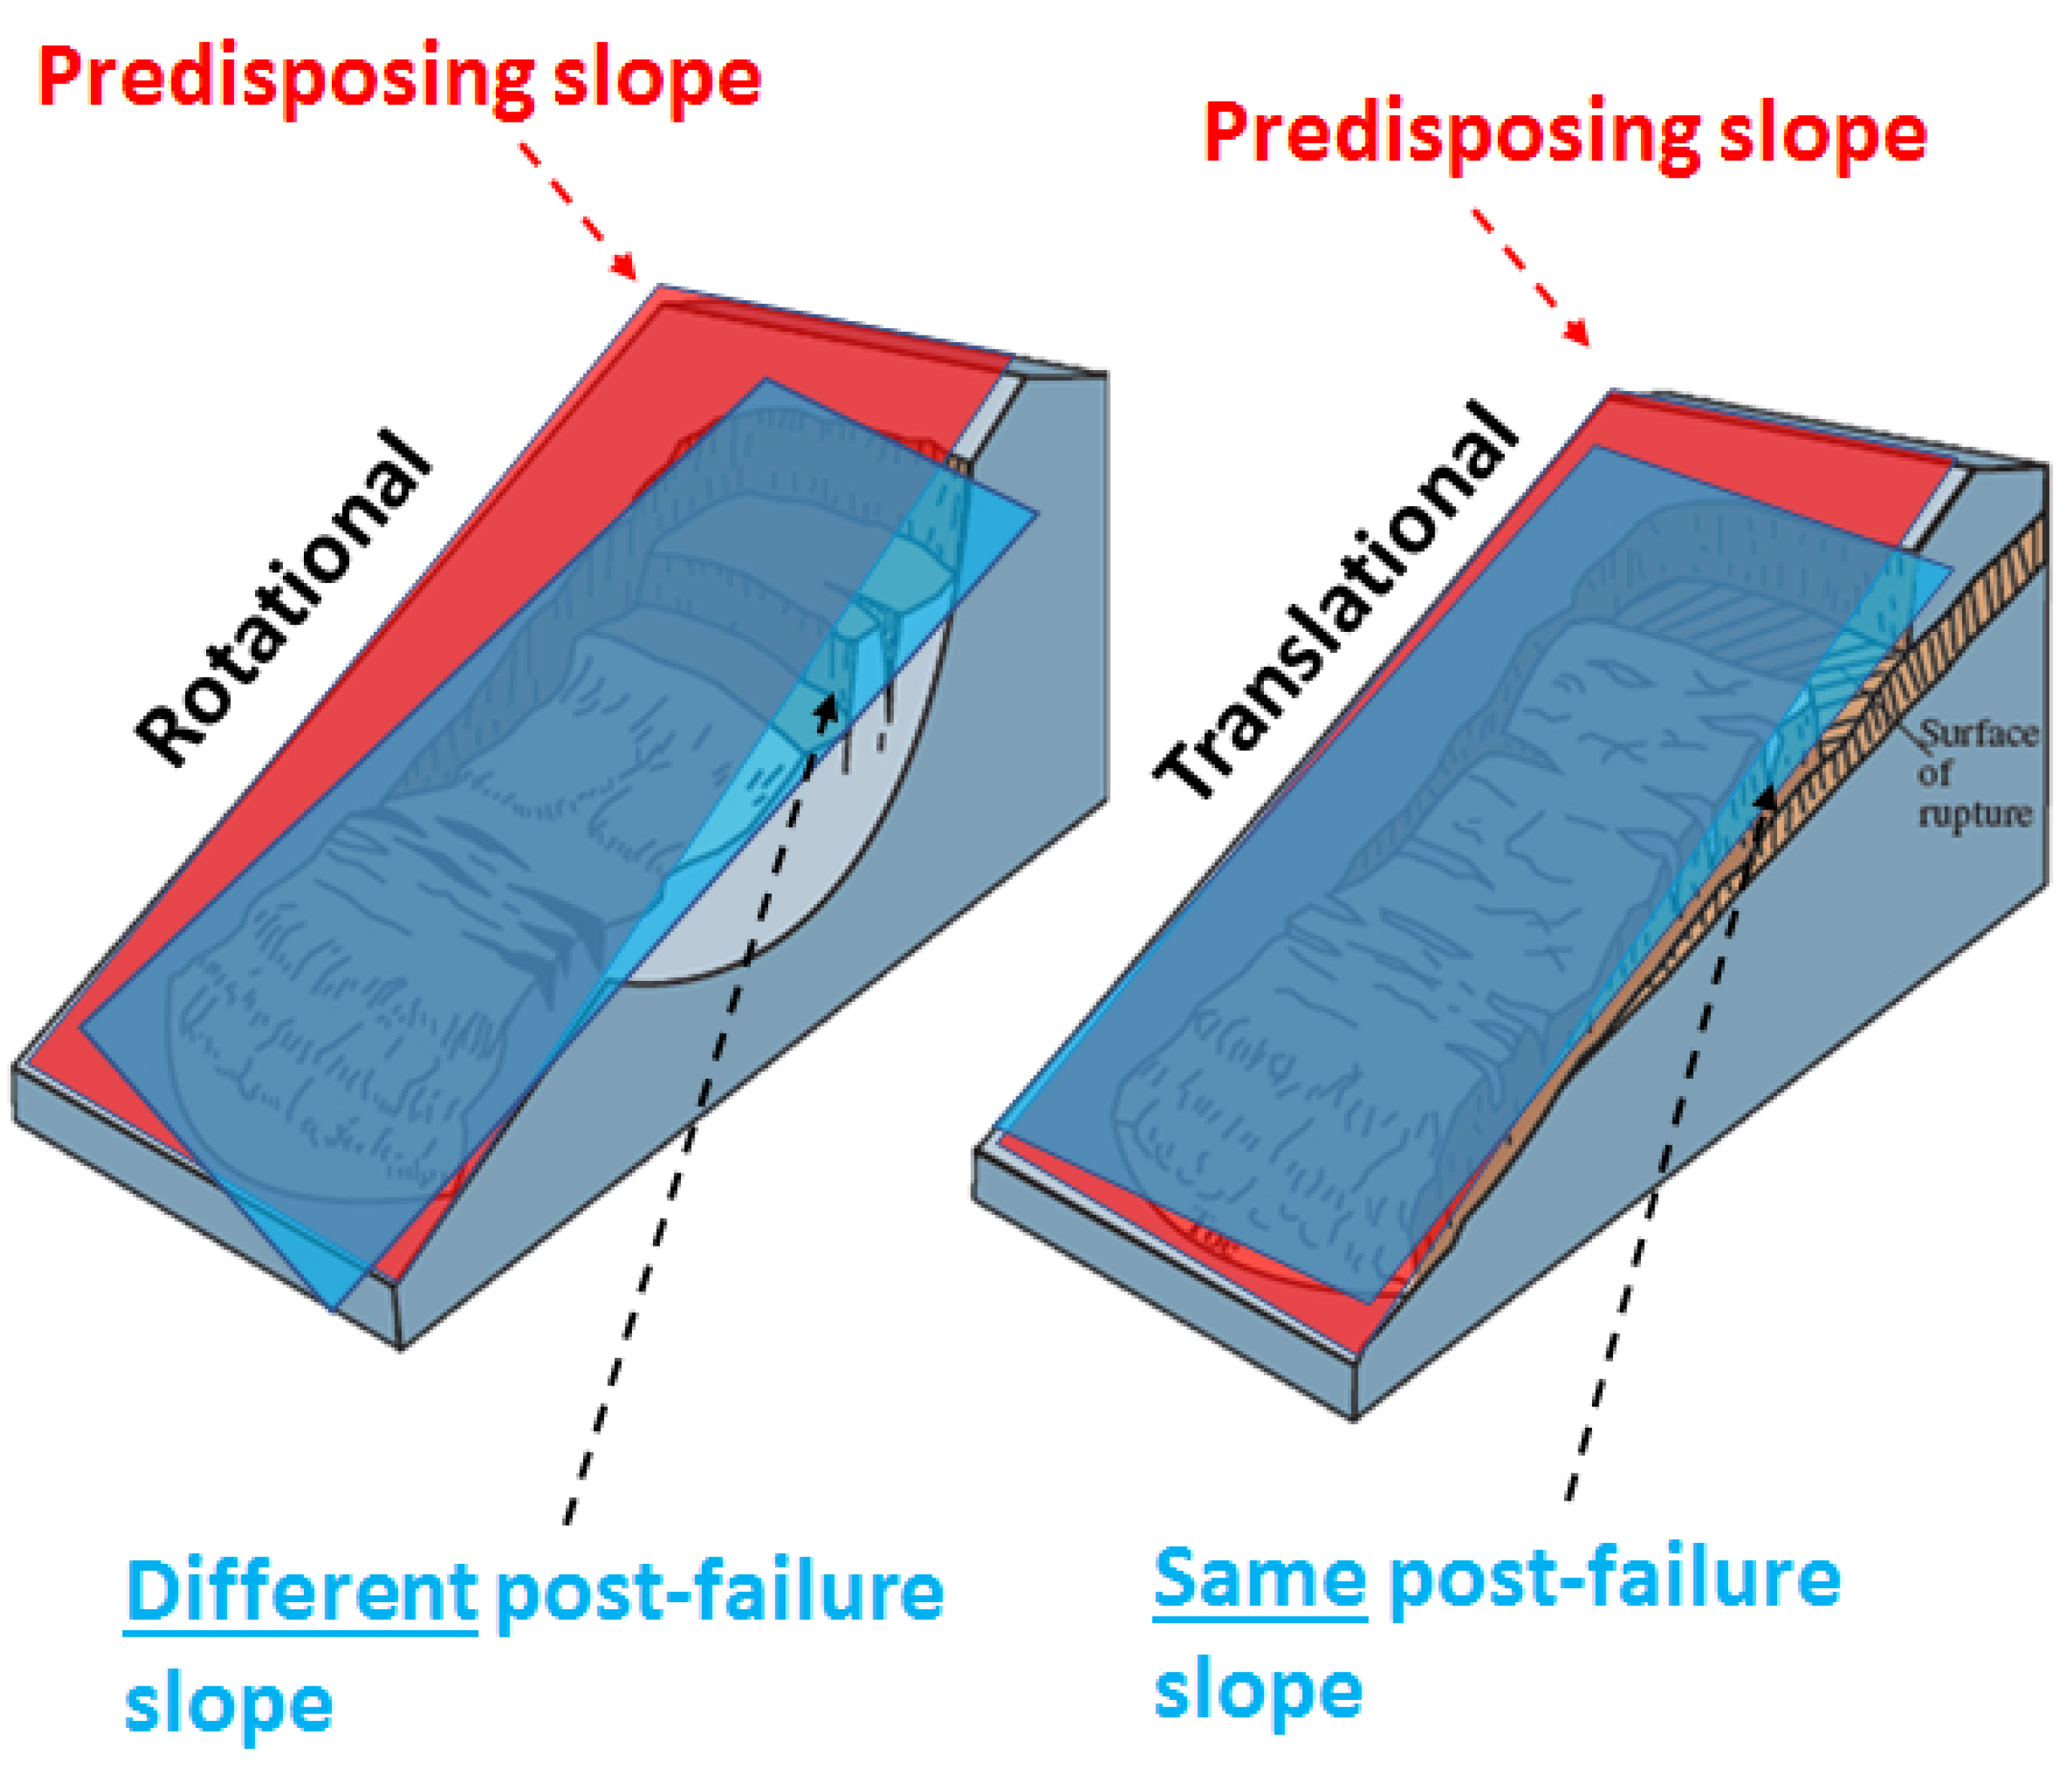
4.3. Limitations of Slope Units and Buffering in Capturing Temporal Dynamics

Both slope units and buffering techniques have been introduced as potential means to overcome the static nature of landslide susceptibility modeling by incorporating spatial structuring and localized feature extraction [77]. However, both approaches fall short in addressing the temporal evolution of landscapes. Slope units, which divide terrain into homogeneous drainage-based regions, are widely used for regional-scale susceptibility assessments. While they help smooth and standardize spatial data, their inherently static nature poses a critical limitation. Since slope units are derived from present day DEMs, they do not account for historical topographic changes caused by deforestation, mining, or rehabilitation efforts. Additionally, their coarse granularity prevents them from capturing small-scale predisposing factors essential for understanding landslide evolution over time. It is important to note that overcoming the static nature of susceptibility models is not the sole purpose of slope units; rather, they have been widely developed and utilized for improving spatial zoning, reducing noise, better integrating terrain and hydrological processes, and enhancing statistical reliability in landslide susceptibility assessments [77]. While these methodologies have proven effective for regional-scale modeling, their static nature limits their applicability in frameworks that require the explicit integration of temporal landscape evolution, as is the case in our study.
Similarly, buffering techniques, particularly those applied around landslide crown areas, aim to enhance the extraction of localized topographic and morphometric features. However, they primarily reflect post-landslide conditions, making it difficult to isolate the original factors that contributed to slope failure. The inherent smoothing effect of buffering further dilutes critical variations in terrain features, leading to the loss of key information. Moreover, buffering fails to incorporate historical land use and land cover (LULC) changes, meaning early disturbances such as deforestation or mining may no longer be detectable in the current datasets. Although both methods were introduced as possible solutions to mitigate the limitations of static landslide susceptibility modeling, they ultimately fail to capture the dynamic evolution of landscapes, making them insufficient as standalone approaches for integrating temporal changes in susceptibility assessments.

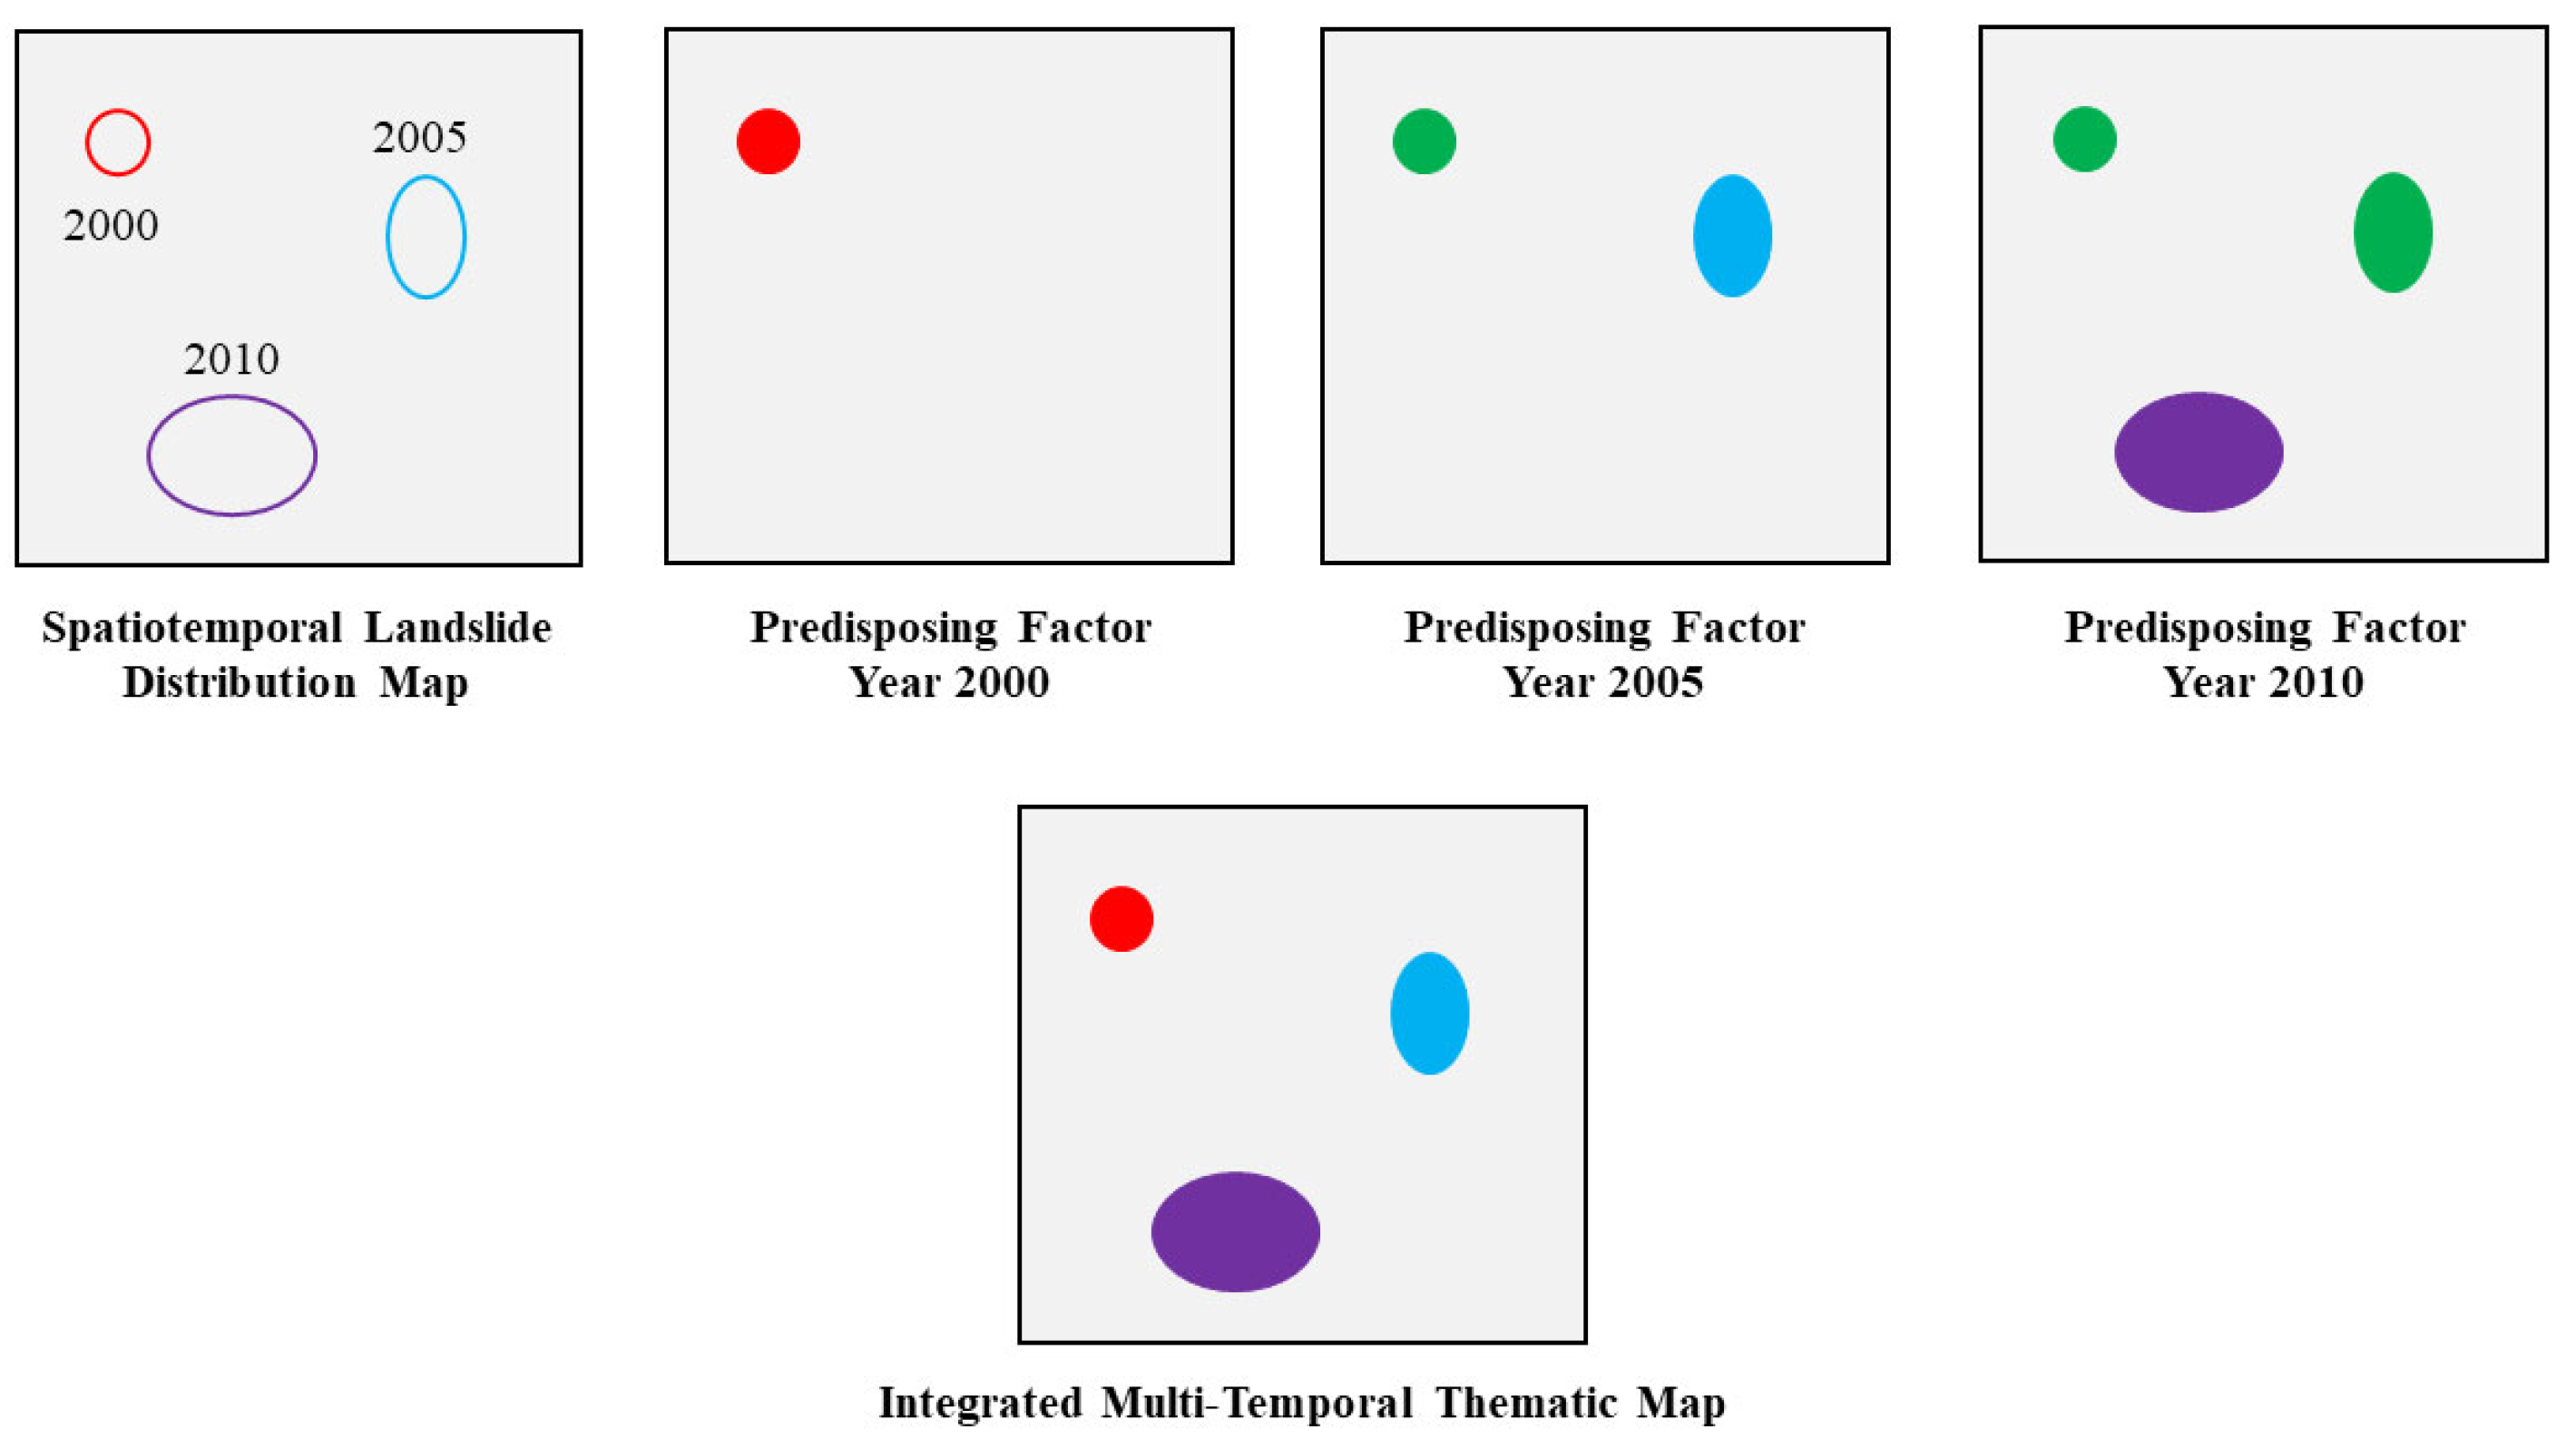
4.4. Creating Multi-Temporal Thematic Maps: A Comprehensive Solution to Model Temporal Dynamics

A significant limitation of static landslide susceptibility models driven mainly by static data is that they fail to consider the site’s temporal evolution, with such evolution being dictated by the variables that trigger landslides within periods that have long elapsed. A multi-temporal thematic map could solve this issue. By taking into account past predisposing factors just before the landslide occurrence, as illustrated in Figure 11, a spatially explicit representation of the current conditions and an evolving landscape at landslide locations become feasible. These multi-temporal maps integrated into a single composite thematic layer give the model the potential not only to identify where landslides occurred and what caused such occurrences but also to propagate such enhanced predisposing rules across the remaining areas, predicting the potential for slope failure under any spatial and temporal conditions in the future. This strategy integrates the changes due to the dynamic components of land use, development of infrastructure, and environmental features, creating a more dynamic understanding of landslide causation. This methodology ensures that susceptibility prediction captures past occurrences, without making the mistake of purely attributing landslide susceptibility to the current landscape properties. The integration of multi-temporal data will transform a static spatial assumption of susceptibility into a more dynamically configured model, helping provide more accurate, more reliable, and better-directed assessments of landslide susceptibility for long-term mitigation planning.

4.5. Reassessing Susceptibility Model Robustness in Light of Temporal Dynamics

The findings of this study further attest to the fragility of conventional landslide susceptibility models because of the impressive biases that static assumptions can produce in dynamic landscapes. It is significant especially where a U-shaped land use evolution pattern creates an interaction with past degradation and recent rehabilitation, resulting in a complex, multi-layered susceptibility pattern. The advantage of the strategized model to capture these intricate susceptibility patterns with higher fidelity underlines the indispensability of incorporating multi-temporal data during model design. For example, as illustrated in Figure 6 and Figure 7, susceptibility results from an aggregation of past actions, such as mining, deforestation, and, later, conservation, not just a snapshot of the current condition. Such a temporal interaction can cause an elevated modification that static models oversimplify, thereby emanating misleading conclusions about landslide susceptibility. With this understanding, it seems that it is imperative to gauge the model robustness metrics by embedding temporal dynamics.
As such, the rationale behind existing performance metrics will not determine the real robustness, learning capability, and predictive nature of susceptibility models. The widely employed performance measures for evaluating susceptibility models—in particular, accuracy and AUC—are based on a static superimposition of the observed landslide occurrence data on the predicted susceptibility map. While this mapping provides real information about the alignment of the model with existing landslide occurrences, it does not gauge the model’s predictive ability when subjected to future landslide occurrences in a changing landscape over time. Discarding this important rule makes the verification of the model fit to current events only while encapsulating temporal landscape changes is ignored. This limitation is especially troubling for static models that might do reasonably well on these metrics and yet fail to properly characterize susceptibility patterns responsive to time. While both the strategized and the blind models show precisely the same ROC curves and AUC values of 0.97 in Figure 10, the response curves previously presented in Figure 8 indicate very different modeling behaviors. To be robust, a susceptibility model must have predictive efficacy and remain robust across various historical landscape scenarios and not merely across the current or recent conditions. The strategized model’s use of multi-temporal thematic maps makes it possible to assess this robustness by providing different temporally distinct snapshots to test the model. Thus, we should shift focus from a purely static evaluation to a more dynamic one, where the model’s ability to capture cumulative effects of previous and ongoing landscape changes on susceptibility is reflected. Thus, further studies must push into adopting performance metrics for testing against multi-temporal data so that the models may be genuinely strong and rely upon dynamic environments. In summary, while the present performance metrics serve as a baseline for static assessments, they may inadvertently reward models that merely fit the static patterns rather than the truly predictive ones. By taking both model development and evaluation from an intrinsic temporal lens, landslide susceptibility models gain an increased ability to move far beyond the limitations of their static performance assessments and to provide more accurate and resilient susceptibility assessments in support of long-term risk mitigation strategies.
To better assess the temporal robustness of the model, alternative validation techniques beyond conventional AUC-based evaluations should be considered. One effective approach is temporal cross-validation, where the model is trained on past landslide data and tested on future occurrences to evaluate its predictive stability over time. This method ensures that the susceptibility model can generalize beyond the training period and accurately capture evolving landscape conditions. Additionally, time series evaluation metrics such as the Brier Score (which measures the accuracy of probabilistic predictions) and Logarithmic Loss (which penalizes incorrect confidence levels in predictions) can provide deeper insights into how well the model captures temporal trends in susceptibility. Another potential improvement is the use of spatial–temporal ROC curves, where the model performance is analyzed across different time slices rather than treating landslide data as a single static dataset. This approach would help distinguish whether a model’s predictive ability remains consistent across multiple temporal phases or if its accuracy degrades over time, thus offering a more rigorous evaluation of its long-term applicability.

4.6. The Danger of Oversimplification: Moving Beyond the Static-to-Hazard Paradigm in Susceptibility Mapping

A common misconception in landslide susceptibility studies is that temporal analysis is a separate procedure that should be done after the initial susceptibility mapping. Many researchers treat temporal changes as a factor only to be integrated into the hazard analysis, where landslide temporal probabilities for different return periods are calculated using models like Poisson or Binomial. However, such an approach overlooks the significance of temporal evolution within the susceptibility assessment itself. This paper argues that susceptibility models should account for temporal changes within the landscape—specifically, how past events (such as degradation, recovery, and human interventions) have shaped the current susceptibility to future landslides. Focusing on the current state of the landscape without considering its historical dynamics leads to maps that fail to reflect the full spectrum of risk, introducing inaccuracies like false positives and false negatives. By relying on static data, the traditional approach misses the cumulative effects of past events, which are critical to understanding the full context of susceptibility. While temporal hazard models do incorporate probability and magnitude over time, they should not be considered a substitute for dynamically updated susceptibility models. Susceptibility modeling must move beyond static representations of the landscape to create more holistic and accurate predictions. The integration of temporal dynamics directly into susceptibility maps will allow for a more realistic reflection of future risks based on both past and present landscape conditions, offering a more reliable tool for decision-makers in landslide risk management. Furthermore, emphasizing temporal evolution in susceptibility assessments ensures that risk models are not merely reflective of a snapshot in time but are more aligned with ongoing landscape dynamics, providing a clearer and more comprehensive understanding of landslide risk over time.

4.7. Limitations and Future Directions

Although this study offers an indispensable contribution to landslide susceptibility modeling, certain shortcomings should be addressed. First, the ADEM is a hypothetical case use that is not related to any specific real-world location. Though this may help isolate the influences of temporal development, it may serve to hinder the generalization of the findings. Future studies should apply this temporal framework to real landscapes with historical data, thus validating it in the current settings and demonstrating its usefulness beyond theoretical constructs. However, the applicability of the proposed methodology can be supported by previous studies that have validated multi-temporal landslide susceptibility modeling using observed historical landslide data. For instance, ref. [78] analyzed event-based multi-temporal landslide inventories to refine susceptibility assessments, while ref. [79] integrated run-out modeling to assess changes in landslide risk over time. Additionally, ref. [80] examined temporal variations in landslide distributions following extreme events, highlighting the importance of incorporating evolving landscape conditions into predictive models. Similar approaches have been applied in regions with extensive historical landslide records.
Second, the rainfall erosion modeling tool adopted in this study using TerreSculptor v.3 is used to illustrate landscape degradation. Though this specific tool aids in visualizing landscape changes over time, there are simplified erosion principles used in TerreSculptor v.3 that do not encompass the full representation of natural processes. Additional factors influencing the actual erosion processes, like vegetation cover, soil type, and climatic variability, quite significantly shape the highly complex mechanisms in natural erosion processes. Future studies could enhance model accuracy through professional erosion modeling approaches coupled with environmental variables. Additionally, future researchers should explore methods of retrieving historical data regarding key triggering elements, such as rainfall intensity and frequency. This retrieval would allow for a more precise and causative assessment of landslide susceptibility. This, in turn, will enhance the ability of the model to specify not only the spatial distribution of susceptibility but also certain environmental conditions that historically triggered landslides.
Moreover, while the study discusses human-induced landscape changes, it does not explicitly account for climate change-induced variations in landslide susceptibility. It is noteworthy that this study primarily focuses on reconstructing past landscape dynamics rather than predicting future susceptibility under climate change scenarios. While climate change undoubtedly influences landslide susceptibility through shifting precipitation patterns and increasing extreme weather events, these aspects fall beyond the study’s intended scope. However, future research could extend this framework by integrating climate projections, such as CMIP6 rainfall models, to assess how evolving hydrometeorological extremes may impact long-term susceptibility trends. Such an extension would enhance the adaptability of susceptibility models to future environmental changes while maintaining the study’s core emphasis on historical landscape reconstruction.
Lastly, it would be relevant for future studies to improve on the evaluation metrics of models. Traditional performance metrics reflect a static overlay of landslide occurrence data and might not be an adequate reflection of how well a model can predict or learn over time. Developing suitable performance metrics to evaluate models across multiple temporal scenarios would inform researchers to draw a line between fitting models for historical data and actual models that predict landslide susceptibility in dynamically changing landscapes. Future research could harness the findings of this study and build on the limitations mentioned above to offer a way forward toward improving the accuracy, robustness, and applicability of landslide susceptibility assessments.

4.8. Comparison with Other Works

The LSA has seen significant advancements in recent years, particularly with the integration of machine learning models, remote sensing technologies, and GIS-based spatial analyses [17,51]. While these approaches have improved predictive accuracy, they largely remain confined to static representations of landscape conditions, assuming that susceptibility is determined solely by present day environmental factors. This assumption persists despite evidence that topographic evolution and hydrological processes are time-dependent drivers of instability [70,71]. This study challenges that assumption by emphasizing the importance of incorporating historical landscape dynamics into LSA, a perspective that has been largely overlooked in the existing literature. Several studies have explored different aspects of susceptibility modeling. Traditional approaches, such as statistical regression-based models [33,34], rely on empirical correlations between landslide occurrences and causative factors. These methods often ignore the non-linear thresholds observed in landslide triggering [67,68], which our temporally explicit framework explicitly addresses. More recent studies have leveraged advanced machine learning techniques, including support vector machines, decision trees, and ensemble learning [3,8,11,18], with some works further investigating the impact of sample size and factor grading on model performance [7,14]. However, even deep learning approaches struggle with temporal generalization, as they typically train on single-time point inventories [20]. While these methodologies have enhanced model accuracy, they still treat susceptibility as a static phenomenon, failing to account for how past degradation, recovery, and anthropogenic interventions influence future landslide risk.
A few recent studies have attempted to integrate temporal aspects into susceptibility modeling. For instance, ref. [26] introduced a space–time landslide susceptibility model using data-driven approaches, but their analysis still treated landscape evolution as an external factor rather than an inherent component of susceptibility assessment. Similarly, studies focusing on landslide hazard assessment, such as ref. [24], emphasize the need to incorporate temporal probabilities, yet they typically follow a sequential approach—first conducting static susceptibility mapping and then separately estimating temporal probabilities, rather than integrating time-dependent susceptibility changes directly into the modeling framework. This decoupling echoes broader issues in landslide risk management, where climate change and societal priorities are often retrofitted into static models [25]. Recent efforts by ref. [5] highlighted the potential of spatiotemporal landslide risk forecasting, yet their framework still decouples susceptibility and hazard temporality, a limitation addressed in our study. Furthermore, approaches that rely on geomorphological slope units provide a useful delineation for susceptibility analysis [77] but are inherently static, as they are based on averaged contemporary topographic data. Digital terrain modeling and topographic position indices have improved spatial resolution but remain temporally constrained [58,61,63,64]. Such methods do not accommodate historical landscape transformations, such as deforestation, urbanization, or restoration efforts, which have been shown in this study to significantly alter susceptibility patterns over time. This aligns with the findings by refs. [57,69], who demonstrated the long-term impacts of land use change in landslide activity. Similarly, buffering techniques around landslide crown areas, while useful in identifying local instability [40], often rely on post-failure conditions rather than reconstructing pre-landslide settings, leading to inaccurate attributions of susceptibility drivers. Recent advancements in displacement field reconstruction and drone-based 3D landslide mapping offer improved spatial resolution [33,35] but still lack explicit temporal integration, a gap our study bridges through multi-temporal terrain analysis. This study diverges from prior work by explicitly integrating multi-temporal data into the susceptibility assessment process itself rather than treating temporal aspects as an external variable or a separate hazard analysis step. By reconstructing historical landscape states and evaluating their cumulative impact on susceptibility, this approach provides a more nuanced and realistic representation of landslide risk. Our methodology simulates evolving topography using a simplified physically-based model in a landscape creation tool previously used for game development—building upon approaches previously addressed by a sophisticated software (i.e., TerreSculptor v.3) [70]—but extends them to account for anthropogenic disturbances and dynamics [68,71]. Unlike conventional models that assume static causative factors, the proposed framework acknowledges that susceptibility is an evolving property influenced by past land use, degradation, and rehabilitation efforts. This is supported by temporal landslide inventory analyses [78,80], which reveal significant variations in landslide distributions following extreme events.
In contrast to existing methods that employ conventional performance metrics such as ROC [47,48,49], this study also highlights the limitations of such evaluations in diagnosing temporal errors. While many studies have reported high AUC values for static models [13,51,52], these metrics fail to capture the inaccuracies introduced by neglecting landscape evolution. As demonstrated by refs. [59,60], dynamic displacement and failure–time prediction models underscore the need for temporal validation. Our findings demonstrate that models with similar AUC scores can produce vastly different susceptibility maps when historical dynamics are considered, emphasizing the need for new evaluation frameworks that test models across multiple temporal instances. This aligns with critiques of statistically based susceptibility models [73] and calls for probabilistic basin-scale assessments [72]. Ultimately, this research contributes to the ongoing discourse on landslide susceptibility modeling by advocating for a paradigm shift from the traditional static-to-hazard approach to a temporally evolved susceptibility-to-hazard framework. By embedding temporal dynamics directly within susceptibility assessments, this study addresses a critical gap in the existing methodologies and provides a more robust foundation for future landslide risk management strategies. The call for adaptive risk management under climate change [25] and the lessons from multi-scale hazard evaluations [62] further underscore the urgency of such temporally explicit frameworks.

5. Concluding Remarks

This study emphasizes the critical role of temporal dynamics in landslide susceptibility assessments and highlights the inherent limitations of static models that rely solely on the current conditions. The analysis of a strategized model that incorporates historic landscape dynamics compared to a blind model, which disregards these temporal aspects, highlights the significance of incorporating landscape changes over time. This approach proves superior in providing more accurate and reliable susceptibility maps, addressing past degradation, and ongoing rehabilitation actions. The study challenges the existing assumptions in landslide susceptibility modeling, particularly the notion that the current conditions alone suffice to represent a landscape’s susceptibility history. By integrating temporal data, this research underscores the importance of multi-temporal analysis for capturing the cumulative impacts of both natural and human-induced changes. In doing so, it lays the groundwork for future models that are more reflective of real-world complexities and can offer better tools for risk management in landslide-prone areas. The key achievements and takeaways are:
  • The development of a temporally integrated susceptibility model that incorporates historical landscape dynamics leads to more accurate landslide susceptibility maps compared to static models, which fail to account for temporal changes. This results in a better reflection of the real conditions influencing landslide susceptibility.
  • Traditional static modeling approaches were shown to be inadequate, as they do not consider how the landscape evolves over time. This omission can cause significant errors, such as false positives and false negatives, which undermine the effectiveness of susceptibility mapping.
  • The study proposes the need for a new evaluation framework that incorporates multiple temporal instances. This approach would offer a more comprehensive understanding of how susceptibility evolves over time and how models can be better assessed across different timeframes.
  • We highlighted the roles of remote sensing, GIS, and data reconstruction technologies in creating multi-temporal thematic maps. These technologies provide researchers with the tools necessary to better capture landscape dynamics and enhance the accuracy of susceptibility assessments.
  • The assumption that the current conditions alone are sufficient to represent landslide susceptibility is challenged. The research emphasizes the importance of incorporating past degradation, recovery, and human interventions into susceptibility modeling, as they contribute to the overall landscape dynamics that influence landslide susceptibility.
  • The study advocates a dynamic approach to modeling landslide susceptibility by considering variables such as rainfall intensity, vegetation cover, and soil moisture. This inclusion makes the model more reliable and resilient to varying environmental conditions, improving its predictive power.
  • Temporally integrated susceptibility models can improve landslide risk management strategies. This approach allows for more accurate and confident decision-making, ultimately leading to better risk reduction and more effective protection for communities in landslide-prone areas.
  • Highlighting the risks of the traditional static-to-hazard approach, this study argues for embedding temporal dynamics directly into susceptibility modeling, emphasizing that integrating temporal factors within the susceptibility stage itself ensures more accurate and realistic landslide susceptibility assessments.
This study paves the way for future research that incorporates temporal dynamics into landslide susceptibility assessments, thereby improving both the predictive capability and practical utility of such models in addressing the complex realities of landslide-prone areas.

Author Contributions

Conceptualization, J.L. and A.K.; methodology, J.L.; software, Y.R. and A.K.; validation, J.L.; formal analysis, J.L.; investigation, J.L.; resources, J.L. and A.K.; data curation, J.L.; writing—original draft preparation, J.L., Y.R. and A.K.; writing—review and editing, J.L., P.H., J.X., Q.H., Y.R., A.K. and H.G.; visualization, J.L. and A.K.; supervision, J.X. and Y.R.; project administration, Q.H.; funding acquisition, J.L., J.X. and Q.H. All authors have read and agreed to the published version of the manuscript.

Funding

This research was jointly funded by the Gansu Provincial Science and Technology Planning Project (No. 23ZDFA018), Key Laboratory of Mine Spatio-Temporal Information and Ecological Restoration, MNR (No. KLM202301), Henan Provincial Science and Technology Research (No. 242102320017), Henan Province Joint Fund Project of Science and Technology (No. 222103810097), National Key Research and Development Program of China (No. 2024YFC3212200), Henan Science Foundation for Distinguished Young Scholars of China (No. 242300421041), and Henan Key Research and Development Program of China (No. 241111321100).

Data Availability Statement

The raw data supporting the conclusions of this article will be made available by the authors on request.

Conflicts of Interest

The authors declare no conflicts of interest.

References

  1. Chalkias, C.; Ferentinou, M.; Polykretis, C. Landslide Risk Assessment, Awareness, and Risk Mitigation: Case Studies. In Landslide Science for a Safer Geoenvironment; Springer: Berlin/Heidelberg, Germany, 2014; pp. 15–30. [Google Scholar] [CrossRef]
  2. Shano, L.; Raghuvanshi, T.K.; Meten, M. Landslide susceptibility evaluation and hazard zonation techniques—A review. Geoenviron. Disasters 2020, 7, 18. [Google Scholar] [CrossRef]
  3. Pourghasemi, H.R.; Sadhasivam, N.; Amiri, M.; Eskandari, S.; Santosh, M. Landslide susceptibility assessment and mapping using state-of-the-art machine learning techniques. Nat. Hazards 2021, 108, 1291–1316. [Google Scholar] [CrossRef]
  4. Luo, Y.; Wang, J.; Zhang, L. Evaluating landslide susceptibility: An AHP method-based approach. Nat. Hazards 2023, 110, 45–60. [Google Scholar] [CrossRef]
  5. Wang, T.; Dahal, A.; Fang, Z.; van Westen, C.; Yin, K.; Lombardo, L. From spatio-temporal landslide susceptibility to landslide risk forecast. Geosci. Front. 2024, 15, 101765. [Google Scholar] [CrossRef]
  6. Lee, S.; Pradhan, B. Landslide hazard mapping at Selangor, Malaysia using frequency ratio and logistic regression models. Landslides 2007, 4, 33–41. [Google Scholar] [CrossRef]
  7. Yang, S.; Tan, J.; Luo, D.; Wang, Y.; Guo, X.; Zhu, Q.; Ma, C.; Xiong, H. Sample size effects on landslide susceptibility models: A comparative study of heuristic, statistical, machine learning, deep learning and ensemble learning models with SHAP analysis. Comput. Geosci. 2024, 193, 105723. [Google Scholar] [CrossRef]
  8. Bui, D.T.; Tuan, T.A.; Klempe, H.; Pradhan, B.; Revhaug, I. Spatial prediction models for shallow landslide hazards: A comparative assessment of the efficacy of support vector machines, artificial neural networks, kernel logistic regression, and logistic model tree. Landslides 2016, 13, 361–378. [Google Scholar] [CrossRef]
  9. Youssef, A.M.; Pourghasemi, H.R.; Pourtaghi, Z.S. Landslide susceptibility mapping using random forest, boosted regression tree, classification and regression tree, and general linear models and comparison of their performance at Wadi Tayyah Basin, Asir Region, Saudi Arabia. Landslides 2016, 13, 839–856. [Google Scholar] [CrossRef]
  10. Dou, J.; Yunus, A.P.; Bui, D.T.; Merghadi, A.; Sahana, M.; Zhu, Z.; Pham, B.T. Improved landslide assessment using support vector machine with bagging, boosting, and stacking ensemble machine learning framework in a mountainous watershed, Japan. Landslides 2020, 17, 641–658. [Google Scholar] [CrossRef]
  11. Pham, B.T.; Prakash, I.; Bui, D.T. Spatial prediction of landslides using a hybrid machine learning approach based on random subspace and classification and regression trees. Geomorphology 2018, 303, 256–270. [Google Scholar] [CrossRef]
  12. Hong, H.; Liu, J.; Bui, D.T.; Pradhan, B.; Acharya, T.D.; Pham, B.T.; Ahmad, B.B. Landslide susceptibility mapping using J48 Decision Tree with AdaBoost, Bagging and Rotation Forest ensembles in the Guangchang area (China). Catena 2018, 163, 399–413. [Google Scholar] [CrossRef]
  13. Chen, W.; Xie, X.; Wang, J.; Pradhan, B.; Hong, H.; Bui, D.T.; Ma, J. A comparative study of logistic model tree, random forest, and classification and regression tree models for spatial prediction of landslide susceptibility. Catena 2017, 151, 147–160. [Google Scholar] [CrossRef]
  14. Zeng, T.; Jin, B.; Glade, T.; Xie, Y.; Li, Y.; Zhu, Y.; Yin, K. Assessing the imperative of conditioning factor grading in machine learning-based landslide susceptibility modeling: A critical inquiry. Catena 2024, 236, 107732. [Google Scholar] [CrossRef]
  15. Guo, W.; Ye, J.; Liu, C.; Lv, Y.; Zeng, Q.; Huang, X. An approach for predicting landslide susceptibility and evaluating predisposing factors. Int. J. Appl. Earth Obs. Geoinf. 2024, 135, 104217. [Google Scholar] [CrossRef]
  16. Xiao, L.; Zhang, Y.; Peng, G. Landslide susceptibility assessment using integrated deep learning algorithm along the China-Nepal highway. Sensors 2018, 18, 4436. [Google Scholar] [CrossRef]
  17. Chen, W.; Hong, H.; Panahi, M.; Shahabi, H.; Wang, Y.; Shirzadi, A.; Bin Ahmad, B. Spatial prediction of landslide susceptibility using GIS-based data mining techniques of ANFIS with whale optimization algorithm (WOA) and grey wolf optimizer (GWO). Appl. Sci. 2019, 9, 3755. [Google Scholar] [CrossRef]
  18. Huqqani, I.A.; Tay, L.T.; Mohamad-Saleh, J. Spatial landslide susceptibility modelling using metaheuristic-based machine learning algorithms. Eng. Comput. 2023, 39, 867–891. [Google Scholar] [CrossRef]
  19. Thirugnanam, H. Deep learning in landslide studies: A review. In Progress in Landslide Research and Technology; Springer: Berlin/Heidelberg, Germany, 2023; pp. 247–255. [Google Scholar] [CrossRef]
  20. Liu, Q.; Norbu, N. Modeling of landslides susceptibility prediction using deep belief networks with optimized learning rate control. Geocarto Int. 2024, 39, 2322060. [Google Scholar] [CrossRef]
  21. Segoni, S.; Pappafico, G.; Luti, T.; Catani, F. Landslide susceptibility assessment in complex geological settings: Sensitivity to geological information and insights on its parameterization. Landslides 2020, 17, 2443–2453. [Google Scholar] [CrossRef]
  22. O’Sullivan, A.M.; Devito, K.J.; Curry, R.A. The influence of landscape characteristics on the spatial variability of river temperatures. Catena 2019, 177, 70–83. [Google Scholar] [CrossRef]
  23. Quevedo, R.P.; Velastegui-Montoya, A.; Montalván-Burbano, N.; Morante-Carballo, F.; Korup, O.; Daleles Rennó, C. Land use and land cover as a conditioning factor in landslide susceptibility: A literature review. Landslides 2023, 20, 967–982. [Google Scholar] [CrossRef]
  24. Alcántara-Ayala, I.; Sassa, K. Landslide risk management: From hazard to disaster risk reduction. Landslides 2023, 20, 2031–2037. [Google Scholar] [CrossRef]
  25. Capobianco, V.; Choi, C.E.; Crosta, G.; Hutchinson, D.J.; Jaboyedoff, M.; Lacasse, S.; Nadim, F.; Reeves, H. Effective landslide risk management in era of climate change, demographic change, and evolving societal priorities. Landslides 2025, 1–19. [Google Scholar] [CrossRef]
  26. Fang, Z.; Wang, Y.; van Westen, C.; Lombardo, L. Space–time landslide susceptibility modeling based on data-driven methods. Math. Geosci. 2024, 56, 1335–1354. [Google Scholar] [CrossRef]
  27. Tyagi, A.; Gupta, N.; Tiwari, R.K.; James, N.; Chavan, S.R. Determining the impact of anthropogenic activities and climate change on landslide susceptibility for the Himalayan region. Nat. Hazards 2024, 108, 1291–1316. [Google Scholar] [CrossRef]
  28. Görüm, T.; Tanyas, H.; Karabacak, F.; Yılmaz, A.; Girgin, S.; Allstadt, K.E.; Burgi, P. Preliminary documentation of coseismic ground failure triggered by the February 6, 2023 Türkiye earthquake sequence. Eng. Geol. 2023, 327, 107315. [Google Scholar] [CrossRef]
  29. Karakas, G.; Unal, E.O.; Cetinkaya, S.; Özcan, N.T.; Karakas, V.E.; Can, R.; Kocaman, S. Analysis of landslide susceptibility prediction accuracy with an event-based inventory: The 6 February 2023 Türkiye earthquakes. Soil Dyn. Earthq. Eng. 2024, 178, 108491. [Google Scholar] [CrossRef]
  30. Kocaman, S.; Çetinkaya, S.; Özcan, N.T.; Karakaş, G.; Karakaş, V.E.; Gökçeoğlu, C. Landslides triggered by the 6 February 2023 Kahramanmaraş earthquakes (Türkiye). Turk. J. Earth Sci. 2025, 34, 47–67. [Google Scholar] [CrossRef]
  31. Han, Y.; Semnani, S.J. Important considerations in machine learning-based landslide susceptibility assessment under future climate conditions. Acta Geotech. 2024, 20, 475–500. [Google Scholar] [CrossRef]
  32. Mishra, M. Modeling and Information Reconstruction from Landslide Monitoring Data. Ph.D. Thesis, Université Grenoble Alpes, Grenoble, France, 2022. [Google Scholar]
  33. Liu, D.; Gong, X.; Hu, X.; Wang, H.; Zheng, W.; Niu, L. Displacement field reconstruction in landslide physical modeling by using a terrain laser scanner–Part 1: Methodology, error analysis and validation. J. Rock Mech. Geotech. Eng. 2024, 16, 4066–4076. [Google Scholar] [CrossRef]
  34. Cascini, L.; Ciurleo, M.; Di Nocera, S. Soil depth reconstruction for the assessment of the susceptibility to shallow landslides in fine-grained slopes. Landslides 2017, 14, 459–471. [Google Scholar] [CrossRef]
  35. Gupta, S.K.; Shukla, D.P. Application of drone for landslide mapping, dimension estimation and its 3D reconstruction. J. Indian Soc. Remote Sens. 2018, 46, 903–914. [Google Scholar] [CrossRef]
  36. Ayalew, L.; Yamagishi, H. The application of GIS-based logistic regression for landslide susceptibility mapping in the Kakuda-Yahiko Mountains, Central Japan. Geomorphology 2005, 65, 15–31. [Google Scholar] [CrossRef]
  37. Conoscenti, C.; Di Maggio, C.; Rotigliano, E. GIS analysis to assess landslide susceptibility in a fluvial basin, southern Sicily. Geomorphology 2008, 94, 325–339. [Google Scholar] [CrossRef]
  38. Nefeslioglu, H.A.; Gokceoglu, C.; Sonmez, H. An assessment on the use of logistic regression and artificial neural networks with different sampling strategies for the preparation of landslide susceptibility maps. Eng. Geol. 2008, 97, 171–191. [Google Scholar] [CrossRef]
  39. Pradhan, B.; Lee, S. Regional landslide susceptibility analysis using back-propagation neural network model at Cameron Highland, Malaysia. Landslides 2010, 7, 13–30. [Google Scholar] [CrossRef]
  40. Mandal, S.; Mondal, S. Geomorphic Diversity and Landslide Susceptibility: A Multi-criteria Evaluation Approach. In Geoinformatics and Modelling of Landslide Susceptibility and Risk: An RS & GIS-Based Model Building Approach in the Eastern Himalaya; Springer: Cham, Switzerland, 2019; pp. 73–120. [Google Scholar] [CrossRef]
  41. Barbosa, N.; Andreani, L.; Gloaguen, R.; Ratschbacher, L. Window-based morphometric indices as predictive variables for landslide susceptibility models. Remote Sens. 2021, 13, 451. [Google Scholar] [CrossRef]
  42. Chicas, S.D.; Li, H.; Mizoue, N.; Ota, T.; Du, Y.; Somogyvári, M. Landslide susceptibility mapping core-base factors and models’ performance variability: A systematic review. Nat. Hazards 2024, 120, 12573–12593. [Google Scholar] [CrossRef]
  43. Sonker, I.; Tripathi, J.N.; Swarnim. Landslide susceptibility mapping using morphological and hydrological parameters in Sikkim Himalaya: Frequency ratio model and geospatial technologies. Nat. Hazards 2024, 120, 6797–6832. [Google Scholar] [CrossRef]
  44. Phillips, S.J.; Dudík, M.; Schapire, R.E. A maximum entropy approach to species distribution modeling. In Proceedings of the Twenty-First International Conference on Machine Learning, Banff, AB, Canada, 4–8 July 2004; p. 83. [Google Scholar] [CrossRef]
  45. Phillips, S.J.; Anderson, R.P.; Schapire, R.E. Maximum entropy modeling of species geographic distributions. Ecol. Model. 2006, 190, 231–259. [Google Scholar] [CrossRef]
  46. Phillips, S.J. A brief tutorial on Maxent. T. Res. 2005, 190, 231–259. Available online: http://biodiversityinformatics.amnh.org/open_source/maxent/ (accessed on 3 September 2024). [CrossRef]
  47. Phillips, S.J.; Dudík, M. Modeling of species distributions with Maxent: New extensions and a comprehensive evaluation. Ecography 2008, 31, 161–175. [Google Scholar] [CrossRef]
  48. Elith, J.; Phillips, S.J.; Hastie, T.; Dudík, M.; Chee, Y.E.; Yates, C.J. A statistical explanation of MaxEnt for ecologists. Divers. Distrib. 2011, 17, 43–57. [Google Scholar] [CrossRef]
  49. Kornejady, A.; Ownegh, M.; Bahremand, A. Landslide susceptibility assessment using maximum entropy model with two different data sampling methods. Catena 2017, 152, 144–162. [Google Scholar] [CrossRef]
  50. Metz, C.E. Basic principles of ROC analysis. Semin. Nucl. Med. 1978, 8, 283–298. [Google Scholar] [CrossRef]
  51. Obuchowski, N.A. ROC analysis. Am. J. Roentgenol. 2005, 184, 364–372. [Google Scholar] [CrossRef]
  52. Gorsevski, P.V.; Gessler, P.E.; Foltz, R.B.; Elliot, W.J. Spatial prediction of landslide hazard using logistic regression and ROC analysis. Trans. GIS 2006, 10, 395–415. [Google Scholar] [CrossRef]
  53. Cantarino, I.; Carrion, M.A.; Goerlich, F.; Martinez Ibañez, V. A ROC analysis-based classification method for landslide susceptibility maps. Landslides 2019, 16, 265–282. [Google Scholar] [CrossRef]
  54. Sahin, E.K.; Colkesen, I.; Kavzoglu, T. A comparative assessment of canonical correlation forest, random forest, rotation forest and logistic regression methods for landslide susceptibility mapping. Geocarto Int. 2020, 35, 341–363. [Google Scholar] [CrossRef]
  55. Yang, C.; Liu, L.L.; Huang, F.; Huang, L.; Wang, X.M. Machine learning-based landslide susceptibility assessment with optimized ratio of landslide to non-landslide samples. Gondwana Res. 2023, 123, 198–216. [Google Scholar] [CrossRef]
  56. Highland, L.M.; Bobrowsky, P. The Landslide Handbook—A Guide to Understanding Landslides; US Geological Survey: Reston, VA, USA, 2008; Volume 1325. [Google Scholar]
  57. Glade, T. Landslide occurrence as a response to land use change: A review of evidence from New Zealand. Catena 2003, 51, 297–314. [Google Scholar] [CrossRef]
  58. Moore, I.D.; Grayson, R.B.; Ladson, A.R. Digital terrain modelling: A review of hydrological, geomorphological, and biological applications. Hydrol. Process. 1991, 5, 3–30. [Google Scholar] [CrossRef]
  59. Liu, Z.; Qiu, H.; Ma, S.; Yang, D.; Pei, Y.; Du, C.; Sun, H.; Hu, S.; Zhu, Y. Surface displacement and topographic change analysis of the Changhe landslide on September 14, 2019, China. Landslides 2021, 18, 1471–1483. [Google Scholar] [CrossRef]
  60. Zhou, X.P.; Yuan, X.K.; Yang, D. Prediction of landslide failure time based on moving average convergence and divergence coupling with Bayesian updating method. Eng. Geol. 2024, 343, 107781. [Google Scholar] [CrossRef]
  61. Zevenbergen, L.W.; Thorne, C.R. Quantitative analysis of land surface topography. Earth Surf. Process. Landf. 1987, 12, 47–56. [Google Scholar] [CrossRef]
  62. Guzzetti, F.; Carrara, A.; Cardinali, M.; Reichenbach, P. Landslide hazard evaluation: A review of current techniques and their application in a multi-scale study, Central Italy. Geomorphology 1999, 31, 181–216. [Google Scholar] [CrossRef]
  63. De Reu, J.; Bourgeois, J.; Bats, M.; Zwertvaegher, A.; Gelorini, V.; De Smedt, P.; Chu, W.; Antrop, M.; De Maeyer, P.; Finke, P.; et al. Application of the topographic position index to heterogeneous landscapes. Geomorphology 2013, 186, 39–49. [Google Scholar] [CrossRef]
  64. Lee, H.N.; Kim, G. Landslide Susceptibility Assessment Using TPI-Slope Combination. J. Korean Soc. Surv. Geod. Photogramm. Cartogr. 2018, 36, 507–514. [Google Scholar]
  65. Muddarisna, N.; Yuniwati, E.D.; Masruroh, H.; Oktaviansyah, A.R. An automated approach using topographic position index (TPI) for landform mapping (case study: Gede Watershed, Malang Regency, East Java, Indonesia). In Proceedings of the IOP Conference Series: Earth and Environmental Science, Changsha, China, 18–20 September 2020; Volume 412, p. 012027. [Google Scholar]
  66. Crozier, M.J. Prediction of rainfall-triggered landslides: A test of the antecedent water status model. Earth Surf. Process. Landf. 1999, 24, 825–833. [Google Scholar] [CrossRef]
  67. Giannecchini, R.; Galanti, Y.; D’Amato Avanzi, G. Critical rainfall thresholds for triggering shallow landslides in the Serchio River Valley (Tuscany, Italy). Nat. Hazards Earth Syst. Sci. 2012, 12, 829–842. [Google Scholar] [CrossRef]
  68. Larsen, M.C.; Parks, J.E. How wide is a road? The association of roads and mass-wasting in a forested montane environment. Earth Surf. Process. Landf. 1997, 22, 835–848. [Google Scholar] [CrossRef]
  69. Sidle, R.; Ochiai, H. Processes, Prediction, and Land Use; American Geophysical Union: Washington, DC, USA, 2006; Volume 525. [Google Scholar]
  70. Montgomery, D.R.; Dietrich, W.E. A physically based model for the topographic control on shallow landsliding. Water Resour. Res. 1994, 30, 1153–1171. [Google Scholar] [CrossRef]
  71. Bogaard, T.A.; Greco, R. Landslide hydrology: From hydrology to pore pressure. Wiley Interdiscip. Rev. Water 2016, 3, 439–459. [Google Scholar] [CrossRef]
  72. Guzzetti, F.; Reichenbach, P.; Cardinali, M.; Galli, M.; Ardizzone, F. Probabilistic landslide hazard assessment at the basin scale. Geomorphology 2005, 72, 272–299. [Google Scholar] [CrossRef]
  73. Reichenbach, P.; Rossi, M.; Malamud, B.D.; Mihir, M.; Guzzetti, F. A review of statistically-based landslide susceptibility models. Earth-Sci. Rev. 2018, 180, 60–91. [Google Scholar] [CrossRef]
  74. Van Westen, C.J.; Castellanos, E.; Kuriakose, S.L. Spatial data for landslide susceptibility, hazard, and vulnerability assessment: An overview. Eng. Geol. 2008, 102, 112–131. [Google Scholar] [CrossRef]
  75. Fell, R.; Corominas, J.; Bonnard, C.; Cascini, L.; Leroi, E.; Savage, W.Z.; JTC-1 Joint Technical Committee on Landslides and Engineered Slopes. Guidelines for landslide susceptibility, hazard and risk zoning for land use planning. Eng. Geol. 2008, 102, 85–98. [Google Scholar] [CrossRef]
  76. Malamud, B.D.; Turcotte, D.L.; Guzzetti, F.; Reichenbach, P. Landslide inventories and their statistical properties. Earth Surf. Process. Landf. 2004, 29, 687–711. [Google Scholar] [CrossRef]
  77. Alvioli, M.; Marchesini, I.; Reichenbach, P.; Rossi, M.; Ardizzone, F.; Fiorucci, F.; Guzzetti, F. Automatic delineation of geomorphological slope units with r.slopeunits v1.0 and their optimization for landslide susceptibility modeling. Geosci. Model Dev. 2016, 9, 3975–3991. [Google Scholar] [CrossRef]
  78. Tseng, C.M.; Lin, C.W.; Hsieh, W.D. Landslide susceptibility analysis by means of event-based multi-temporal landslide inventories. Nat. Hazards Earth Syst. Sci. Discuss. 2015, 3, 1137–1173. [Google Scholar]
  79. Hussin, H.Y.; Chen, L.; Ciurean, R.; Van Westen, C.J.; Reichenbach, P.; Sterlacchini, S. Analysing changes in landslide risk using multi temporal landslide susceptibility and run-out modeling on a regional scale. In Proceedings of the International Conference on Analysis and Management of Changing Risks for Natural Hazards, Padua, Italy, 18–19 November 2014. [Google Scholar]
  80. Jones, J.N.; Boulton, S.J.; Bennett, G.L.; Stokes, M.; Whitworth, M.R. Temporal variations in landslide distributions following extreme events: Implications for landslide susceptibility modeling. J. Geophys. Res. Earth Surf. 2021, 126, e2021JF006067. [Google Scholar] [CrossRef]
Figure 1. Erosion simulation tool (red circle) in TerreSculptor v.3 utilized to model progressive landscape evolution and associated multi-temporal landslide occurrences.
Remotesensing 17 01752 g001
Figure 2. Progressive topographical transformation resulting from landscape evolution simulated using the Erosion tools in TerreSculptor software (Elevation has been intentionally exaggerated to enhance visual clarity).
Remotesensing 17 01752 g002
Figure 3. Multi-temporal landslide data generated using the Erosion tool in TerreSculptor software, attributed to hypothetical LULC changes over time.
Remotesensing 17 01752 g003
Figure 4. Thematic maps of morphometric indices derived from ADEMs using SAGA-GIS v8.0.1 (abbreviations are defined in Table 1).
Remotesensing 17 01752 g004
Figure 5. U-shaped land evolution model comprising degradation and subsequent rehabilitation phases, often overlooked in landslide susceptibility modeling.
Remotesensing 17 01752 g005
Figure 6. Specific hypothetical land evolution model represented as land use changes over time, leading to multi-temporal landslide occurrences.
Remotesensing 17 01752 g006
Figure 7. Landslide susceptibility maps produced by the MaxEnt model under strategized and blind modeling approaches (dashed rectangles and circles highlight error sources attributed to the blind model: false positives and negatives).
Remotesensing 17 01752 g007
Figure 8. Response curves generated from the MaxEnt model using the blind and strategized LSM approaches.
Remotesensing 17 01752 g008aRemotesensing 17 01752 g008bRemotesensing 17 01752 g008c
Figure 9. Illustration of rotational and translational slides highlighting differences in post-failure slopes.
Remotesensing 17 01752 g009
Figure 10. ROC curves for strategized and blind LSM approaches generated using the MaxEnt model.
Remotesensing 17 01752 g010
Figure 11. A schematic procedure of making an integrated multi-temporal thematic map.
Remotesensing 17 01752 g011
Table 1. Morphometric indices and their contributions to landslide susceptibility modeling.
IndexContribution to LSM
Topographic Position Index (TPI)Indicates each pixel’s position relative to ridges and valleys, aiding in identifying slope stability zones.
Curvature Index (CI)Describes surface curvature, influencing erosion patterns and sediment deposition on slopes.
Topographic Wetness Index (TWI)Combines slope and upstream catchment area to assess potential soil moisture distribution and runoff accumulation.
Terrain Ruggedness Index (TRI)Quantifies surface complexity, affecting water flow retention and erosion susceptibility.
Plan Curvature (Pl. Curv.)Determines flow convergence/divergence across the slope, impacting soil moisture concentration and erosion.
Stream Distance (St. Dist.)Measures distance to nearest stream, affecting water accumulation and drainage pathways on slopes.
Slope Length (LS)Accounts for slope steepness and length, critical for assessing erosion risk and slope stability.
Valley Depth (VD)Measures the depth of valleys, influencing local drainage and sediment deposition areas.
Mass Balance Index (MBI)Assesses the balance of sediment deposition and erosion, relevant for identifying landslide-prone areas.
Relative Slope Position (RSP)Describes the pixel’s relative position on the slope, crucial for slope stability analysis in relation to surrounding topography.
Flow Accumulation (Flow Acc.)Calculates the total drainage area, helping to identify water flow paths and potential landslide zones.
Stream Power Index (SPI)Measures the potential stream energy available for sediment transport, essential in erosion-prone areas.
Slope (Slope)Indicates terrain steepness, a primary factor affecting gravitational movement and landslide risk.
Melton Ruggedness Index (MRI)Provides a measure of ruggedness based on elevation, impacting surface water flow and erosion susceptibility.
Profile Curvature (Prof. Curv.)Describes the slope profile’s shape, which influences water flow speed and sediment transport dynamics.
Disclaimer/Publisher’s Note: The statements, opinions and data contained in all publications are solely those of the individual author(s) and contributor(s) and not of MDPI and/or the editor(s). MDPI and/or the editor(s) disclaim responsibility for any injury to people or property resulting from any ideas, methods, instructions or products referred to in the content.

