Article

A Comprehensive Evaluation of Land Reclamation Effectiveness in Mining Areas: An Integrated Assessment of Soil, Vegetation, and Ecological Conditions

1
College of Geoscience and Surveying Engineering, China University of Mining and Technology (Beijing), Beijing 100083, China
2
Academy of Eco-Civilization Development for Jing-Jin-Ji Megalopolis, Tianjin Normal University, Tianjin 300387, China
*
Author to whom correspondence should be addressed.
Remote Sens. 2025, 17(10), 1744; https://doi.org/10.3390/rs17101744
Submission received: 17 March 2025 / Revised: 6 May 2025 / Accepted: 14 May 2025 / Published: 16 May 2025
(This article belongs to the Special Issue Application of Advanced Remote Sensing Techniques in Mining Areas)

Abstract

:
Land reclamation is crucial for restoring ecosystems in mining areas, improving land use efficiency, and promoting sustainable regional development. Traditional single-indicator assessments fail to capture the full complexity of reclamation, highlighting the need for a more comprehensive evaluation approach. This study combines field-measured and remote sensing data to develop multiple evaluation indices, creating a comprehensive framework to assess reclamation effectiveness. A soil quality index based on the Minimum Data Set (SQIMDS) was developed to analyze spatial variations in soil quality, efficiently capturing key soil attributes. Remote sensing data were used to calculate the Dump Reclamation Disturbance Index (DRDI) and the Enhanced Coal Dust Index (ECDI) to evaluate vegetation recovery and ecological improvements. The Comprehensive Evaluation Quality Index (CEQI) was introduced, synthesizing soil, vegetation, and ecological conditions for a holistic assessment. Key findings include significant soil quality improvement over time, with MDS effectively capturing variations; vegetation recovery increased with reclamation duration, though regional disparities were observed; ecological conditions steadily improved, as evidenced by a decline in ECDI values and reduced contamination; and the CEQI reflected overall improvements in reclamation effectiveness. This study offers a practical framework for coal mining land reclamation, providing scientific support for decision-making and guiding effective reclamation strategies for ecological restoration and sustainable land management.

1. Introduction

Coal resources occupy an important position in the global non-renewable energy structure and play an irreplaceable role in the process of industrialization [1,2]. China is not only the world’s major coal consumer but also an important coal producer [3,4], and its energy security and economic development are highly dependent on coal resources [5]. Open-pit mining has become one of the most important modes of coal production and contributes 12% to the national production thanks to its significant cost advantages, safety, and resource utilization [6,7]. Over the past decade, open-pit coal production has grown at an average annual rate of 4.5 percent, and its share in major producing regions such as Inner Mongolia and Shanxi has exceeded 20 percent, highlighting a shift in mining models.
However, while open-pit mining has significantly enhanced production capacity, it has also led to severe ecological and environmental challenges, among which the ecological restoration of waste disposal sites has become a critical issue hindering sustainable development [8]. Research indicates that for every 10,000 tons of coal extracted through open-pit mining, approximately 0.10 hm2 of external soil disposal sites is generated. The construction of these sites results in significant ecological degradation, including impaired soil structure functionality (e.g., increased soil bulk density, reduced porosity, and a sharp decline in water infiltration rates), vegetation loss, and decreased biodiversity [9,10,11,12]. More critically, the heavy metal enrichment coefficient in these disposal sites can reach 2–5 times than that of natural levels, posing ecological risks through bioaccumulation in the food chain [13]. Although current reclamation techniques, such as topsoil replacement and revegetation, can partially restore ecological functions, their effectiveness is constrained by multiple factors, including reclamation methods (e.g., terracing vs. flattening), the restoration duration (5–30 years), and soil handling processes (e.g., layered crushing vs. natural piling) [14,15,16]. Additionally, there are significant regional variations in restoration efficiency, with reported effectiveness ranging from 35% to 80%. Consequently, accurately assessing the spatial and temporal variability of reclamation effects has emerged as a key scientific challenge in optimizing ecological restoration strategies.
Since the 1980s, numerous studies have been systematically conducted on ecological restoration in mining areas, achieving significant progress in three key areas: (1) Soil quality assessment: A comprehensive soil fertility index system based on the total data set (TDS) has been established, with critical parameters such as organic matter (showing an average annual increase of 0.1–0.3%) and aggregate stability identified and quantified [17,18]. For instance, He et al. [19] employed the Minimum Data Set (MDS) method and principal component analysis to construct a soil quality index (SQI) suitable for evaluating the soil quality of reclaimed land at the Suancigou coal mine in Inner Mongolia. Their study revealed the evolutionary characteristics of soil physicochemical properties under different reclamation ages, providing theoretical support and practical guidance for land quality assessments and the optimization of ecological restoration strategies. (2) Vegetation restoration: The role of pioneer species (e.g., sea buckthorn and purple acacia) in enhancing soil quality has been demonstrated, leading to a significant increase in vegetation cover from less than 10% to 50–70% [20,21]. For example, Xiang et al. [22] conducted extensive soil improvement trials and analyzed years of ecological reconstruction practices at the Heidai Gou open-pit mine. They determined the optimal vegetation combinations for mining environment conditions and established an ecological restoration and vegetation reconstruction technology system centered on plant selection. Zhu et al. [23] employed field experimental methods, assessing 14 common grass species used in land reclamation using indicators such as life cycle, canopy cover, importance value, and ecological niche width. They found that alfalfa, Xing’an milkvetch, and Yinchen Artemisia exhibited strong adaptability on acidic coal gangue hills and hold potential as pioneer plants for vegetation restoration. Zhou et al. [24] applied a “space-for-time” substitution method to analyze the succession characteristics of vegetation composition, diversity, cover, and biomass on a spoil heap at a coal mine in a cold and dry region over 1–4 years of reclamation. They found significant inter-annual changes in community structure, with the highest vegetation cover (90.06%) in the third year of reclamation and the greatest biomass (20.76 tons/hm2) in the second year, revealing the dynamic patterns of vegetation restoration in the early stages of reclamation. (3) Monitoring technology: Remote sensing indices (e.g., NDVI and SAVI) have enabled the large-scale dynamic tracking of vegetation recovery [25,26,27]. For example, Yu et al. [28] analyzed remote sensing imagery and vegetation cover (FVC) calculation methods, combined with statistical data, to examine the greening progress of abandoned mining areas in Dartford during the advancement of the Ebbsfleet Garden City project in the UK. They found that the area achieved a high level of vegetation restoration while undergoing urban development, reflecting a synergistic approach to ecological management and sustainable development. Sam et al. [29] analyzed six typical Canadian mines using multi-temporal Landsat remote sensing imagery and methods such as NDVI, regrowth index (RI) analysis, and post-classification change detection. They found that actively reclaimed mines showed rapid and high-level vegetation restoration, with some areas even surpassing pre-mining levels, demonstrating the key role of active reclamation in sustainable mine management.
Despite these notable advances, the existing research framework remains bifurcated, hindering the systematic diagnosis of reclamation effects: (1) Single-dimension dominance: Approximately 83% of the literature focuses on isolated subsystems (either soil or vegetation), neglecting the synergistic evolution mechanisms between soil, vegetation, and the environment. For instance, the indirect impact of coal dust deposition (0.5–1.2 kg/m2 per year) on plant photosynthetic efficiency (reduced by 15–25%) through alterations in soil pH (0.3–0.8 units) is rarely analyzed in an integrated manner. (2) Fragmentation of the assessment system: Existing indicators (e.g., the soil quality index and vegetation cover) are often treated in isolation, lacking the capacity to holistically quantify ecosystem recovery. This fragmented approach limits the ability to evaluate the overall effectiveness of ecological restoration efforts and their long-term sustainability.
The lack of a holistic, integrated assessment system not only restricts our understanding of reclamation success but also prevents the optimization of reclamation strategies and impedes the implementation of sustainable management practices. Effective reclamation monitoring must address the dynamic restoration process through problem identification and adaptive management to provide a basis for strategy optimization [30]. The construction of an integrated assessment index system is of great significance for comprehensively evaluating the effects of land reclamation and ensuring its scientific and sustainable implementation.
Based on this, this study combines field-measured data and remote sensing imagery to establish a comprehensive assessment framework that integrates soil–vegetation–environment interactions with multi-source geospatial data. This framework aims to comprehensively assess the land reclamation effects in mining areas using a space-for-time substitution approach. The main objectives of the study include the following: (1) quantifying the impacts of reclamation duration on soil quality, vegetation conditions, and ecological indicators and (2) constructing an integrated assessment system to evaluate reclamation effects holistically by substituting space for time, combining field data with remote sensing analysis, and comparing different reclaimed areas horizontally. The findings will offer valuable insights into the spatial and temporal variability of ecosystem restoration, optimize reclamation strategies, and improve overall reclamation efficiency, contributing to more sustainable land management in mining areas.

2. Materials

2.1. Study Area

The Balongtu Coal Mine (110.116°E, 39.842°N) is situated in Dongsheng District, Ordos City, within the Inner Mongolia Autonomous Region of China. The region experiences an arid to semi-arid temperate plateau continental climate. The mine area has an irregular polygonal shape. The topography is generally higher in the south and lower in the north, with an average elevation of 1437.65 m. It has a maximum elevation difference of 170.9 m and a total area of 26.974 km2. The average annual temperature ranges from 5.5 to 7.3 °C, with hot summers and cold winters. Annual precipitation is relatively low, predominantly concentrated in July, August, and September, averaging between 281.2 and 401.6 mm, while annual evapotranspiration ranges from 2082.2 to 2535.0 mm. The frost-free period is relatively short, lasting approximately 165 days, whereas the freezing period is prolonged, typically extending from October of one year to April of the next year. Vegetation in the study area is sparse, primarily consisting of perennial herbs and shrubs. Influenced by factors such as topography, geomorphology, the soil parent material, vegetation, and human activities, the predominant zonal soil type in the region is calcium-rich chestnut soil.
The study area is abundant in mineral resources, with coal reserves totaling 263.9 million tons. The coal seams are shallowly buried and possess high heat content. Land reclamation efforts in the mine’s discharge field began in 2012, implementing measures such as soil mulching, a 2 m × 2 m Salix grid on side slopes, platform planning roads, safety retaining walls at the edges of the discharge field, and drip irrigation systems. Vegetation restoration included planting mountain apricot, sea buckthorn, alfalfa, and sainfoin in the intervening areas. By the end of 2023, land reclamation had been completed in four discharge fields, covering a total area of approximately 3.96 km2. The reclamation timelines and areas within the study site are detailed in Figure 1 and Table 1. The notation “Re” represents the reclamation age of the discharge sites up to the sampling year (2023). For comparative analysis, a control (CK) area was selected from an undisturbed original geomorphological region adjacent to the study area, where no mining activities had occurred. This control area was used as a baseline for subsequent comparative evaluations.

2.2. Data

2.2.1. Measured Data

Based on GPS positioning and considering the overpass time of the Landsat 8 satellite, soil sampling was conducted within a 5-day window before and after 18 April 2023. Four reclamation areas were selected as study sites, with approximately 16 sampling points evenly distributed within each area. The sampling points were determined using a stratified random sampling method to ensure a uniform and representative distribution. During field sampling, adjustments to the sampling locations were made based on actual conditions, with precise positioning aided by GPS. A five-point sampling method was employed at each sampling point, following these steps: first, a central point was established; then, four sub-sampling points were arranged within a 1 m × 1 m area around the center. A 100 cm3 soil ring knife was used to collect soil samples from a depth of 0–10 cm at each sub-point. A total of five subsamples were collected per point, each carefully labeled with detailed records of location, depth, and sampling time to enhance data accuracy and traceability. The soil samples were bagged and transported to the laboratory for physicochemical property analysis. To compare with the reclaimed soil, five additional sampling points were selected in an unreclaimed area as a control group using the same sampling method. In total, 345 soil samples were collected (16 × 4 × 5 + 5 × 1 × 5), and the physicochemical properties of each sample were analyzed. The average value for each sampling point was calculated to reduce errors and ensure the representativeness and scientific validity of the results.
The physicochemical properties of the field-collected soil samples were determined using the following methods: Soil bulk density (BD): measured using the ring knife method. Soil particle composition: determined using the pipette method (international system), including sand (2–0.02 mm), silt (0.02–0.002 mm), and clay (<0.002 mm). Soil pH: measured potentiometrically using a 1:2.5 soil–water mixed leaching solution. Total nitrogen (N): determined via the potassium dichromate volumetric method (external heating method). Total phosphorus (P): measured using the molybdenum antimony colorimetric method. Total potassium (K): determined via flame photometry. Soil moisture (SM): measured using the drying method. Heavy metal content (Hg, Pb, Zn, and Ni): analyzed using atomic fluorescence spectrometry. These analyses provide a comprehensive understanding of the soil properties in both reclaimed and control areas, enabling a detailed comparison and evaluation of reclamation effects. Soil sample test results are mainly used to construct the soil quality index to assess the soil quality of the study area.

2.2.2. Landsat 8

The Landsat series of satellites launched by NASA includes Landsat 8, which was launched on 11 February 2013. Landsat 8 carries two primary sensors: the Operational Land Imager (OLI) and the thermal infrared sensor (TIRS). It has 11 spectral bands, 9 of which are from the OLI, all with a spatial resolution of 30 m, except for the panchromatic band (15 m). The TIRS provides two thermal infrared bands with a spatial resolution of 100 m.
This study utilizes the Landsat 8 Collection 2 Level-2 Science Product (L2SP) (LC08_L2SP_*_T1), the data are generated from Level-1 products through a series of processing steps. The “T1” designation indicates that the data have undergone rigorous geometric correction and radiometric calibration, ensuring high geometric accuracy with a root mean square error (RMSE) of less than 12 m, making them suitable for multi-temporal analysis. L2SP data include the surface reflectance (SR) and surface temperature (LST) products. The surface reflectance product is generated by atmospherically correcting Level-1 data using the Landsat Surface Reflectance Code (LaSRC). The surface temperature product combines thermal infrared (TIR) sensor data with top-of-atmosphere (TOA) reflectance and TOA brightness temperature data, which are processed using a single-channel algorithm (SCA). The spatial resolution of the L2SP surface reflectance product is 30 m, while the surface temperature product has a resolution of 100 m for Landsat 8. The revisit period for both satellites is 16 days, providing ascending and descending orbit data corresponding to equatorial crossing times of approximately 10:00 and 22:00, respectively.
Landsat 8 data are primarily used for calculating remote sensing indices. To further ensure data quality, we implemented additional quality control measures. Before using the data, we assessed the distribution of surface reflectance (SR) values and found that 95% of the SR values fall within the range of 0 to 0.4. Therefore, we applied a threshold to exclude SR values exceeding 0.4, thereby minimizing the impact of clouds and enhancing the reliability of the data. In addition, to ensure consistency in spatial resolution between the surface reflectance (SR) and land surface temperature (LST) data, this study employed the TsHARP downscaling method [31,32] to downscale the LST images to 30 m. This allowed for the calculation of corresponding indices at a uniform resolution. The Landsat 8 Collection 2 Level-2 products are accessible through the U.S. Geological Survey (USGS) Earth Resources Observation and Science Center (EROS) (https://www.usgs.gov/landsat-missions/landsat-collection-2 (accessed on 11 May 2023)). These data sets provide critical information for monitoring and analyzing land surface changes, supporting applications in ecological restoration, land reclamation, and environmental management.

3. Environmental Quality Assessment Model

In this study, the soil quality index (SQI), Dump Reclamation Disturbance Index (DRDI), and Enhanced Coal Dust Index (ECDI) indices were used to characterize the soil quality, vegetation restoration, and ecological environment quality of each reclamation area. These three indices were integrated into a Comprehensive Evaluation Quality Index (CEQI) using the CRITIC weighting method to assess reclamation effectiveness. The SQI was derived from field sampling data through a standardized procedure involving Minimum Data Set (MDS) selection, membership function construction, and PCA-based weight allocation. DRDI and ECDI were derived from remote sensing data (Landsat 8) based on ecologically meaningful spectral and thermal indicators. The calculation and theoretical basis of each index are detailed below.

3.1. Construction of the SQI

3.1.1. Membership Calculation

Based on a review of the previous literature and field investigations of soil characteristics in the study area, 13 physical and chemical indicators that effectively reflect soil quality were selected to establish the Minimum Data Set (MDS) [33,34]. To eliminate unit differences and normalize the data set, we applied affiliation functions that account for the directionality of indicator influence on soil quality. Ascending and descending affiliation functions were used to standardize the data depending on whether the indicators had positive or negative correlations with soil quality [35]. Specifically, positive indicators refer to those with higher values indicating better soil quality, while negative indicators are those with higher values corresponding to poorer soil quality. The classification of indicators and the respective affiliation functions used are summarized in Table 2 and Equations (1) and (2).
Q x i = ( x i j x i m i n ) ( x i m a x x i m i n )
Q x i = ( x i m a x x i j ) ( x i m a x x i m i n )
where Q x i represents the affiliation value of each soil indicator; x i j denotes the measured value of the j-th sample for the i-th soil indicator; and x i m a x and x i m i n are the maximum and minimum values of the i-th soil indicator, respectively. Equation (1) was applied when the soil indicator exhibited a positive effect on soil quality, whereas Equation (2) was used for indicators with a negative effect.

3.1.2. Minimum Selection of the Data Set

The MDS [36] framework mitigates issues such as data redundancy and simplifies processing while retaining critical soil quality information. To select representative soil indicators, principal component analysis (PCA) was employed as a dimensionality reduction tool. Principal component loadings, variance contribution rates, and cumulative variance contribution rates were calculated for each soil indicator. Principal components with eigenvalues ≥1 were retained. Within each retained component, soil indicators with absolute loading values within 10% of the highest loading were classified as high-loading indicators. If an indicator exhibited high loadings on multiple principal components simultaneously, it was assigned to the component with the lower absolute loading value.
To address potential information loss from single-component loading assignments, the Norm value of each indicator was calculated. Norm represents the vector length of an indicator’s loadings across all retained principal components in multidimensional space. Higher Norm values indicate stronger combined loadings and greater explanatory power for integrated soil quality information. For indicator groups containing multiple candidates, Pearson correlation analysis was applied to refine their selection: if the correlation coefficient (r) between two indicators exceeded 0.5, the one with the lower Norm value was discarded; if correlations were weak (r < 0.5), all indicators in the group were retained. The Norm calculation formula is provided in Equation (3).
N i j = 1 j ( u i j 2 λ j )
where N i j represents the composite loading of the i-th variable across the first j principal components (with eigenvalues ≥ 1); u i j denotes the loading of the i-th soil indicator on the j-th principal component; and λ j is the eigenvalue of the j-th principal component.

3.1.3. Weight Allocation and Soil Quality Indexes

The SQI [37] was employed to characterize soil quality in the reclamation area. As a composite metric integrating key indicators of soil quality, the SQI is widely adopted due to its computational efficiency and adaptability to quantitative assessments. The index was calculated by weighting individual soil indicators based on their common factor variances derived from PCA, followed by a weighted summation process. Specifically, the common factor variance of each indicator (ranging from 0 to 1) reflects its relative contribution to the total variance, with higher values indicating greater importance in soil quality evaluations. The computational methodology is detailed in Equations (4) and (5).
W i = C i i = 1 n C i
S Q I = i = 1 n W i Q ( x i )
where W i is the weight of the i-th soil indicator; C i represents the common factor variance of the i-th evaluation indicator; n denotes the number of indicators included in the MDS; SQI is the soil quality index; and Q ( x i ) is the affiliation value of the i-th soil indicator.

3.2. Construction of the DRDI

The DRDI [38] was applied to quantify vegetation restoration status in the reclamation area. The DRDI evaluates disturbance intensity by comparing the structural and functional states of vegetation to their optimal reference conditions, as defined in Equation (6). Specifically, the structural state is represented by the Enhanced Vegetation Index (EVI), which reflects vegetation canopy density and biomass. The functional state is characterized by the land surface temperature (LST), indicating vegetation physiological activity and stress levels. Vegetation conditions are considered optimal when EVI is maximized (structural integrity) and LST is minimized (reduced thermal stress). Consequently, lower deviation from these optimal thresholds (i.e., higher EVI and lower LST) corresponds to a smaller disturbance index value [39,40]. This assumption has been widely adopted in remote sensing studies of vegetation degradation and drought monitoring due to its ecological plausibility; healthy vegetation often exhibits higher canopy greenness and lower surface temperature as a result of transpiration and shading effects. In this study, we explicitly acknowledge both the ecological rationale behind this assumption and its potential limitations. For example, in areas with unique microclimates, heterogeneous land cover, or intense anthropogenic influence, the coupling between EVI and LST may weaken, possibly affecting the accuracy of DRDI estimation. Nevertheless, at the regional scale of our analysis, this assumption provides a reasonable comparative baseline for assessing vegetation recovery.
D R D I i j = L S T i j / E V I i j L S T j , m i n / E V I j , m a x
where L S T i j represents the land surface temperature at pixel j in monitoring year i; E V I i j denotes the Enhanced Vegetation Index at pixel j in monitoring year i; L S T j , m i n is the minimum LST value at pixel j recorded between the initiation of reclamation measures and the target year; and E V I j , m a x is the maximum EVI value at pixel j observed over the same period.

3.3. Construction of the ECDI

The ECDI [41] was selected to assess ecological environment quality in the study area. This validated index, developed based on near-infrared (NIR), Short-Wave Infrared 1 (SWIR1), and Short-Wave Infrared 2 (SWIR2) spectral bands, leverages the distinct spectral contrast between coal dust and surrounding natural features in mining areas. The ECDI enables the effective identification of coal dust distribution patterns, which is critical for monitoring post-reclamation environmental recovery. The computational framework is mathematically expressed in Equation (7).
E C D I = S W I R 1 N I R + S W I R 2 S W I R 1 + N I R S W I R 2

3.4. Construction of CEQI

To obtain a comprehensive assessment of reclamation effectiveness, CEQI was constructed by integrating SQI, DRDI, and ECDI. The Criteria Importance Through Intercriteria Correlation (CRITIC) method [42] was used to assign weights objectively. The CRITIC method evaluates the importance of each index based on its variability (standard deviation) and degree of independence (correlation with other indices). This method mainly consists of the following steps: (1) data standardization, (2) calculating the standard deviation to measure the variability of each indicator, (3) calculating the correlation coefficients to determine the conflict/independence between indicators, (4) calculating the importance of each indicator, and (5) determining the weights. Specifically, the CRITIC method assigns higher weights to indices with greater variability (standard deviation), as they provide more discriminative information, and to indices with lower correlations, as they contribute more independent information. The computational frameworks for CRITIC weights and CEQI are detailed in Equations (8)–(13).
Z i j = x i j μ j σ j
r i j = k = 1 n ( z i k z i ¯ ) ( z j k z j ¯ ) k = 1 n ( z i k z i ¯ ) 2 ( z j k z j ¯ ) 2
a j = 1 n 1 i = 1 n x i j x j ¯ 2
C j = a j   i = 1 n 1     r i j ,     j = 1 ,   2 ,   ,   n
W j = C j i = 1 n C i
C E Q I = k = 1 n w j Z i j
where Z i j is the standardized value of the i-th indicator value for the j-th indicator, x i j is the i-th indicator value for the j-th indicator, μ j is the mean of the j-th indicator, and σ j is the standard deviation of the j-th indicator; r i j is the correlation coefficient between the i-th and j-th indicators and z i ¯ and z j ¯ are the means of the i-th and j-th indicators, respectively; a j is the standard deviation of the j-th indicator; C j is the importance of each indicator; w j is the weight of the j-th indicator; and CEQI is the comprehensive evaluation index.

3.5. Statistical Analysis

To validate the spatial interpolation results and evaluate index performance, we applied several statistical techniques. The arithmetic mean, median, maximum, minimum, and standard deviation of the different indicators in each study area were calculated separately using Python 3.10. Inverse distance weighting (IDW) was used for the spatial interpolation of index values. The performance of interpolated results was verified using correlation coefficient (R), bias, root mean square error (RMSE), and unbiased RMSE (ubRMSE), which were calculated using Equations (14)–(17). Additionally, factor analysis and MDS construction were performed using SPSS 27.
R = i = 1 N ( x i x ¯ ) ( y i y ¯ ) i = 1 N x i x ¯ 2 ( y i y ¯ ) 2
R M S E = i = 1 N ( x i y i ) 2 N
B i a s = 1 N i = 1 N ( x i y i )
u b R M S E = i = 1 N [ x i x ¯ y i y ¯ ] 2 N
where x i and y i represent the values of the sampled data and interpolated data at corresponding positions, respectively, and N denotes the number of available samples.

4. Results

4.1. SQI Characteristics of Reclaimed Areas

4.1.1. Patterns of Spatial Variation in Soil Properties

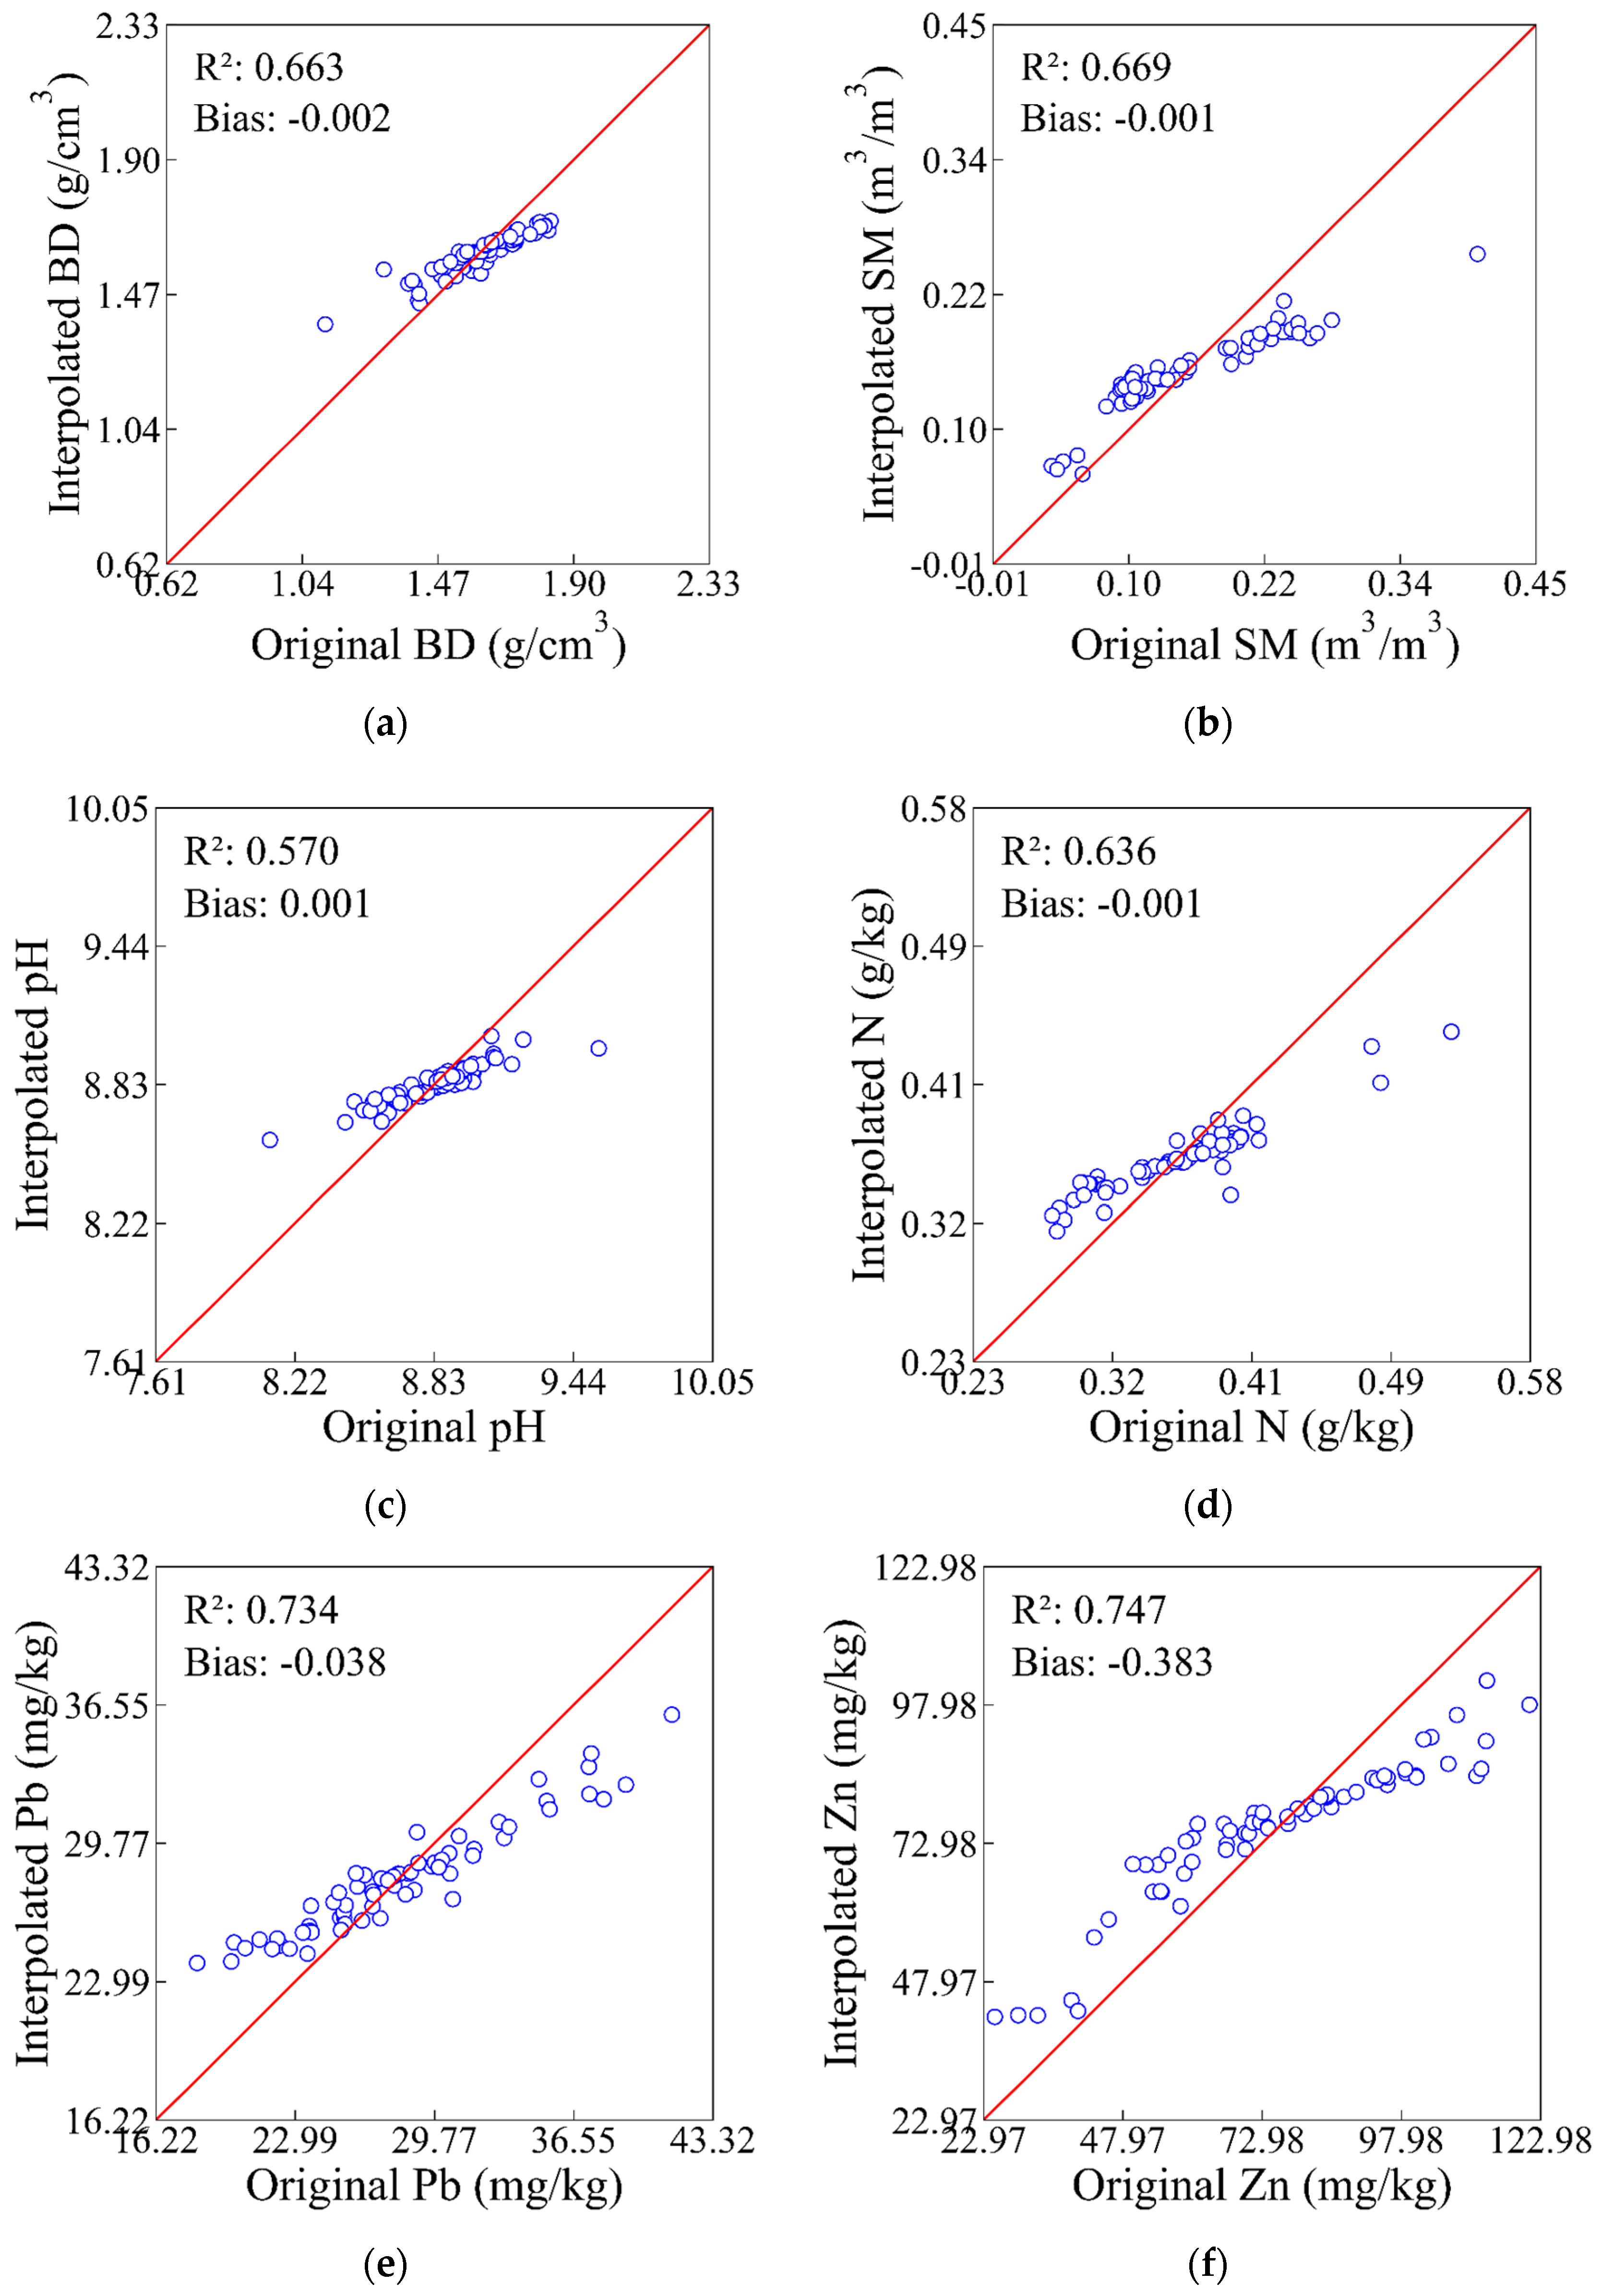
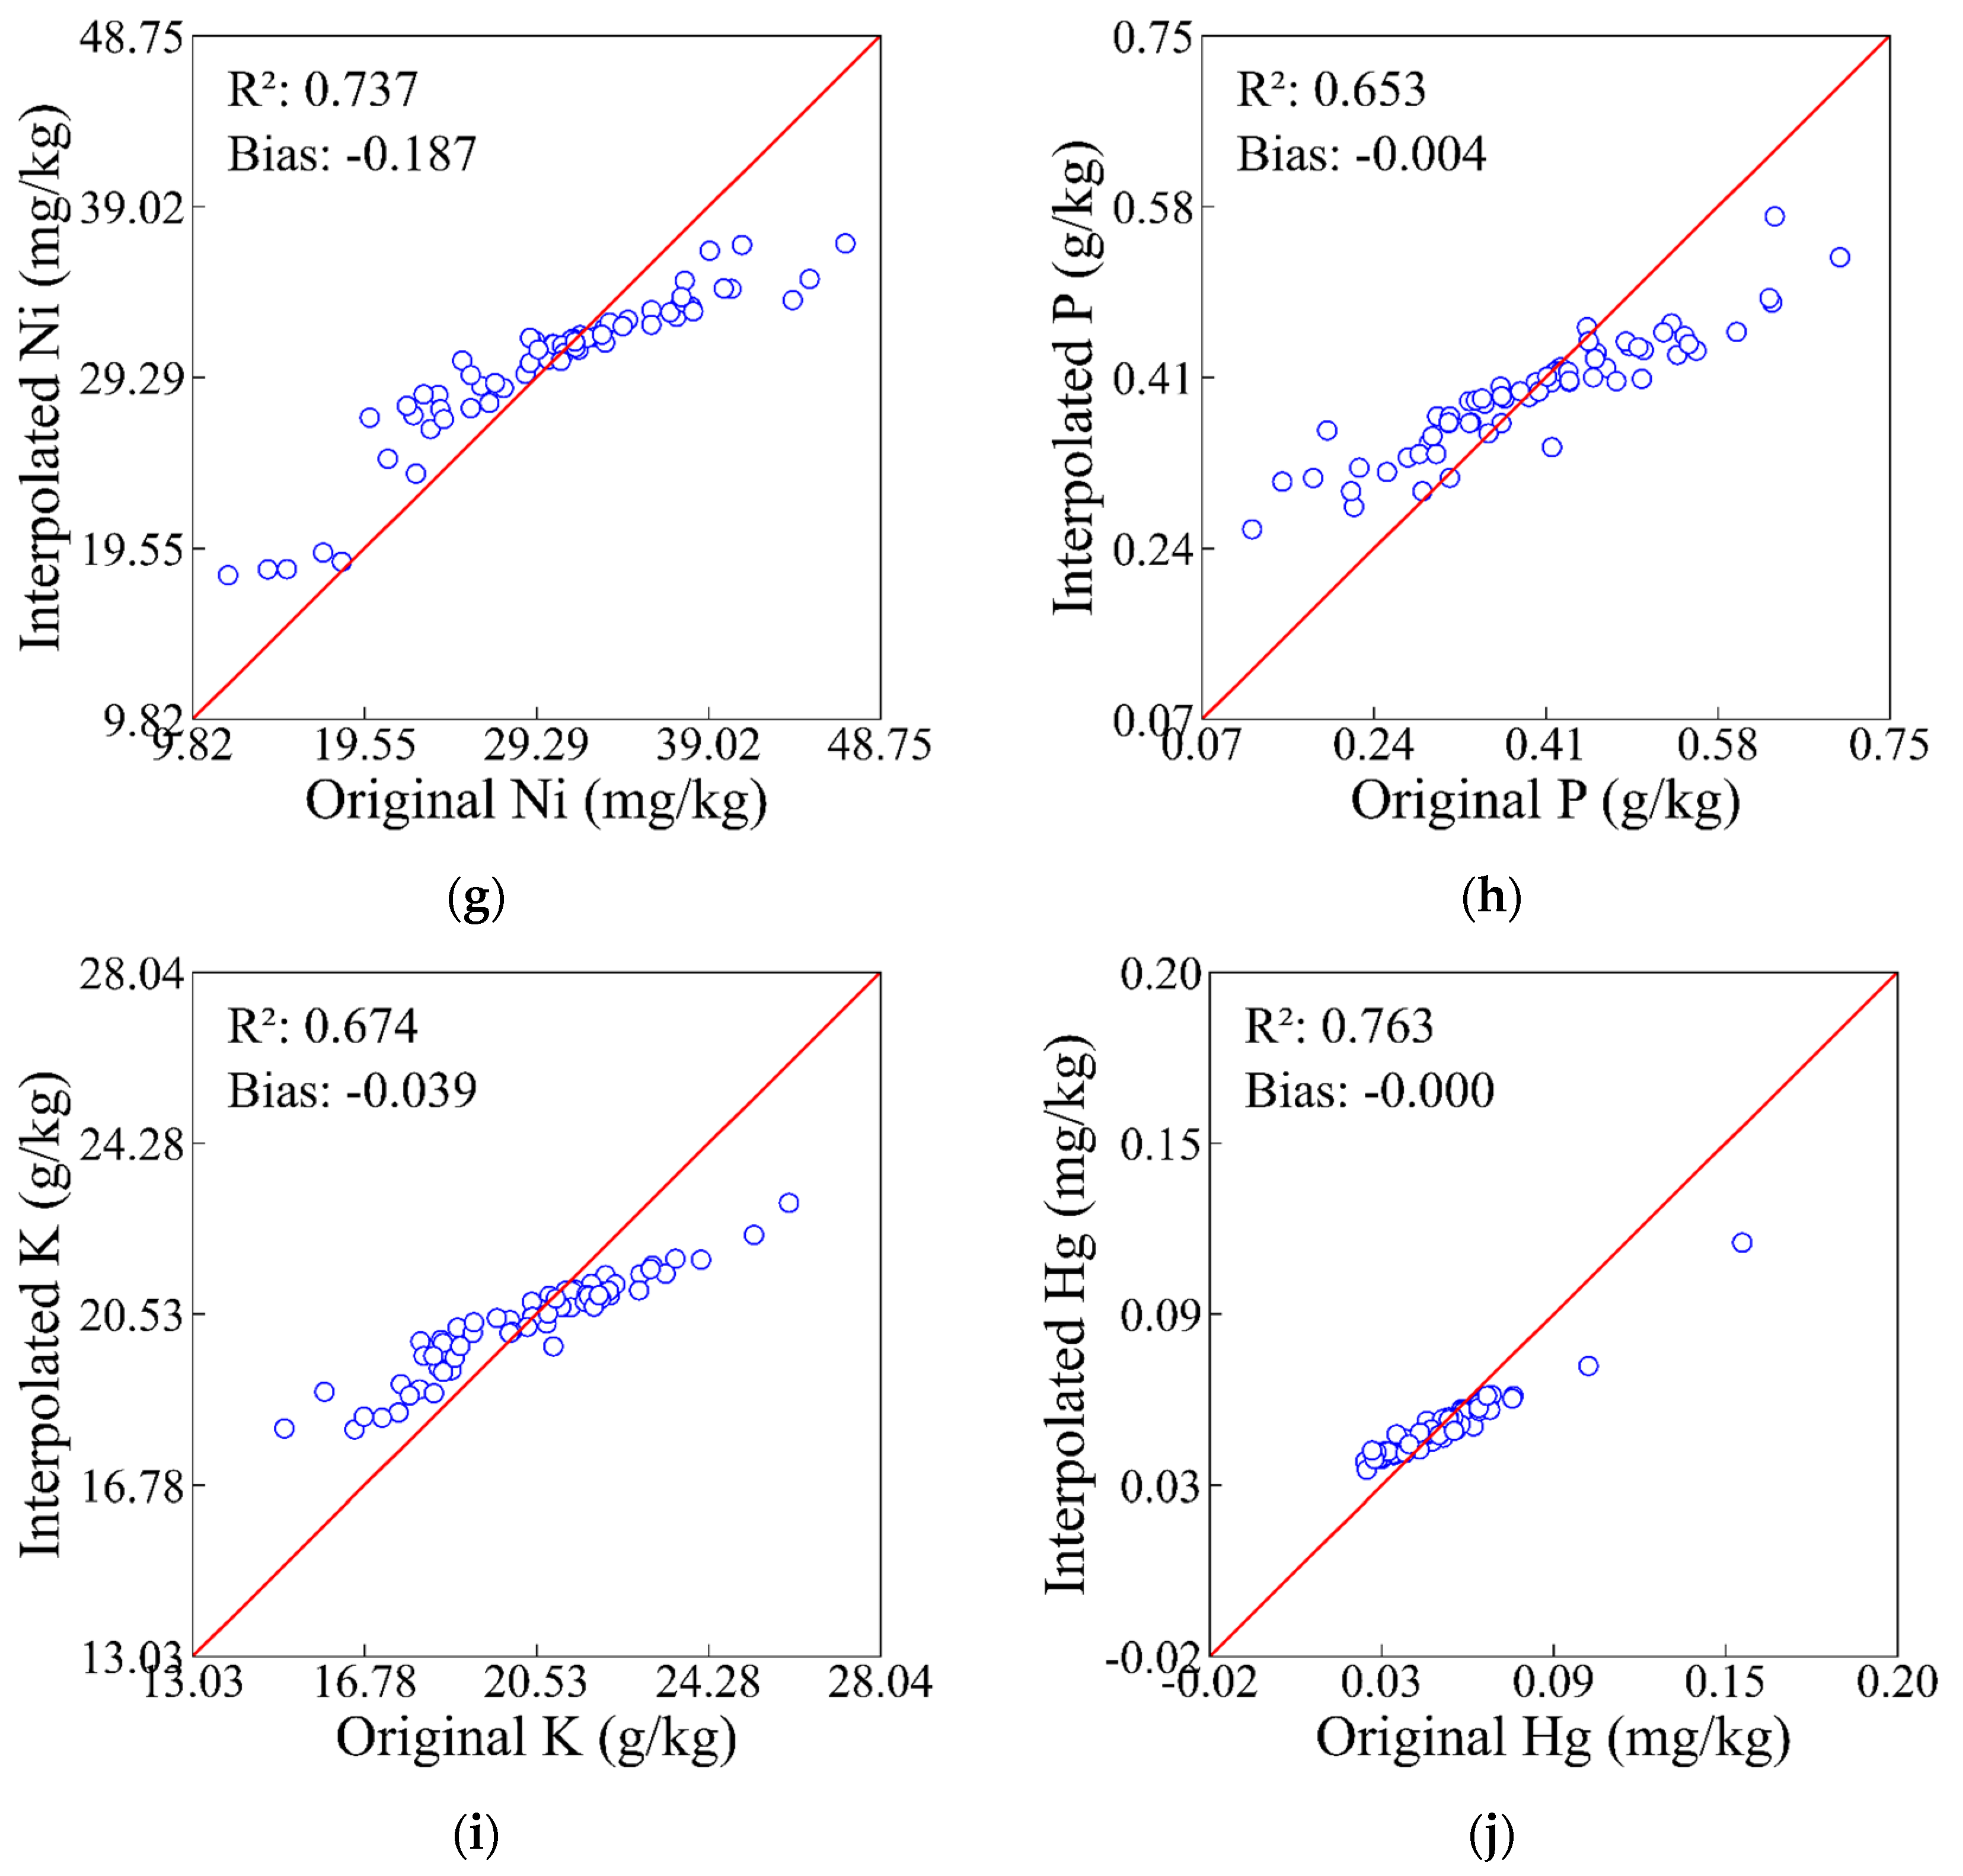
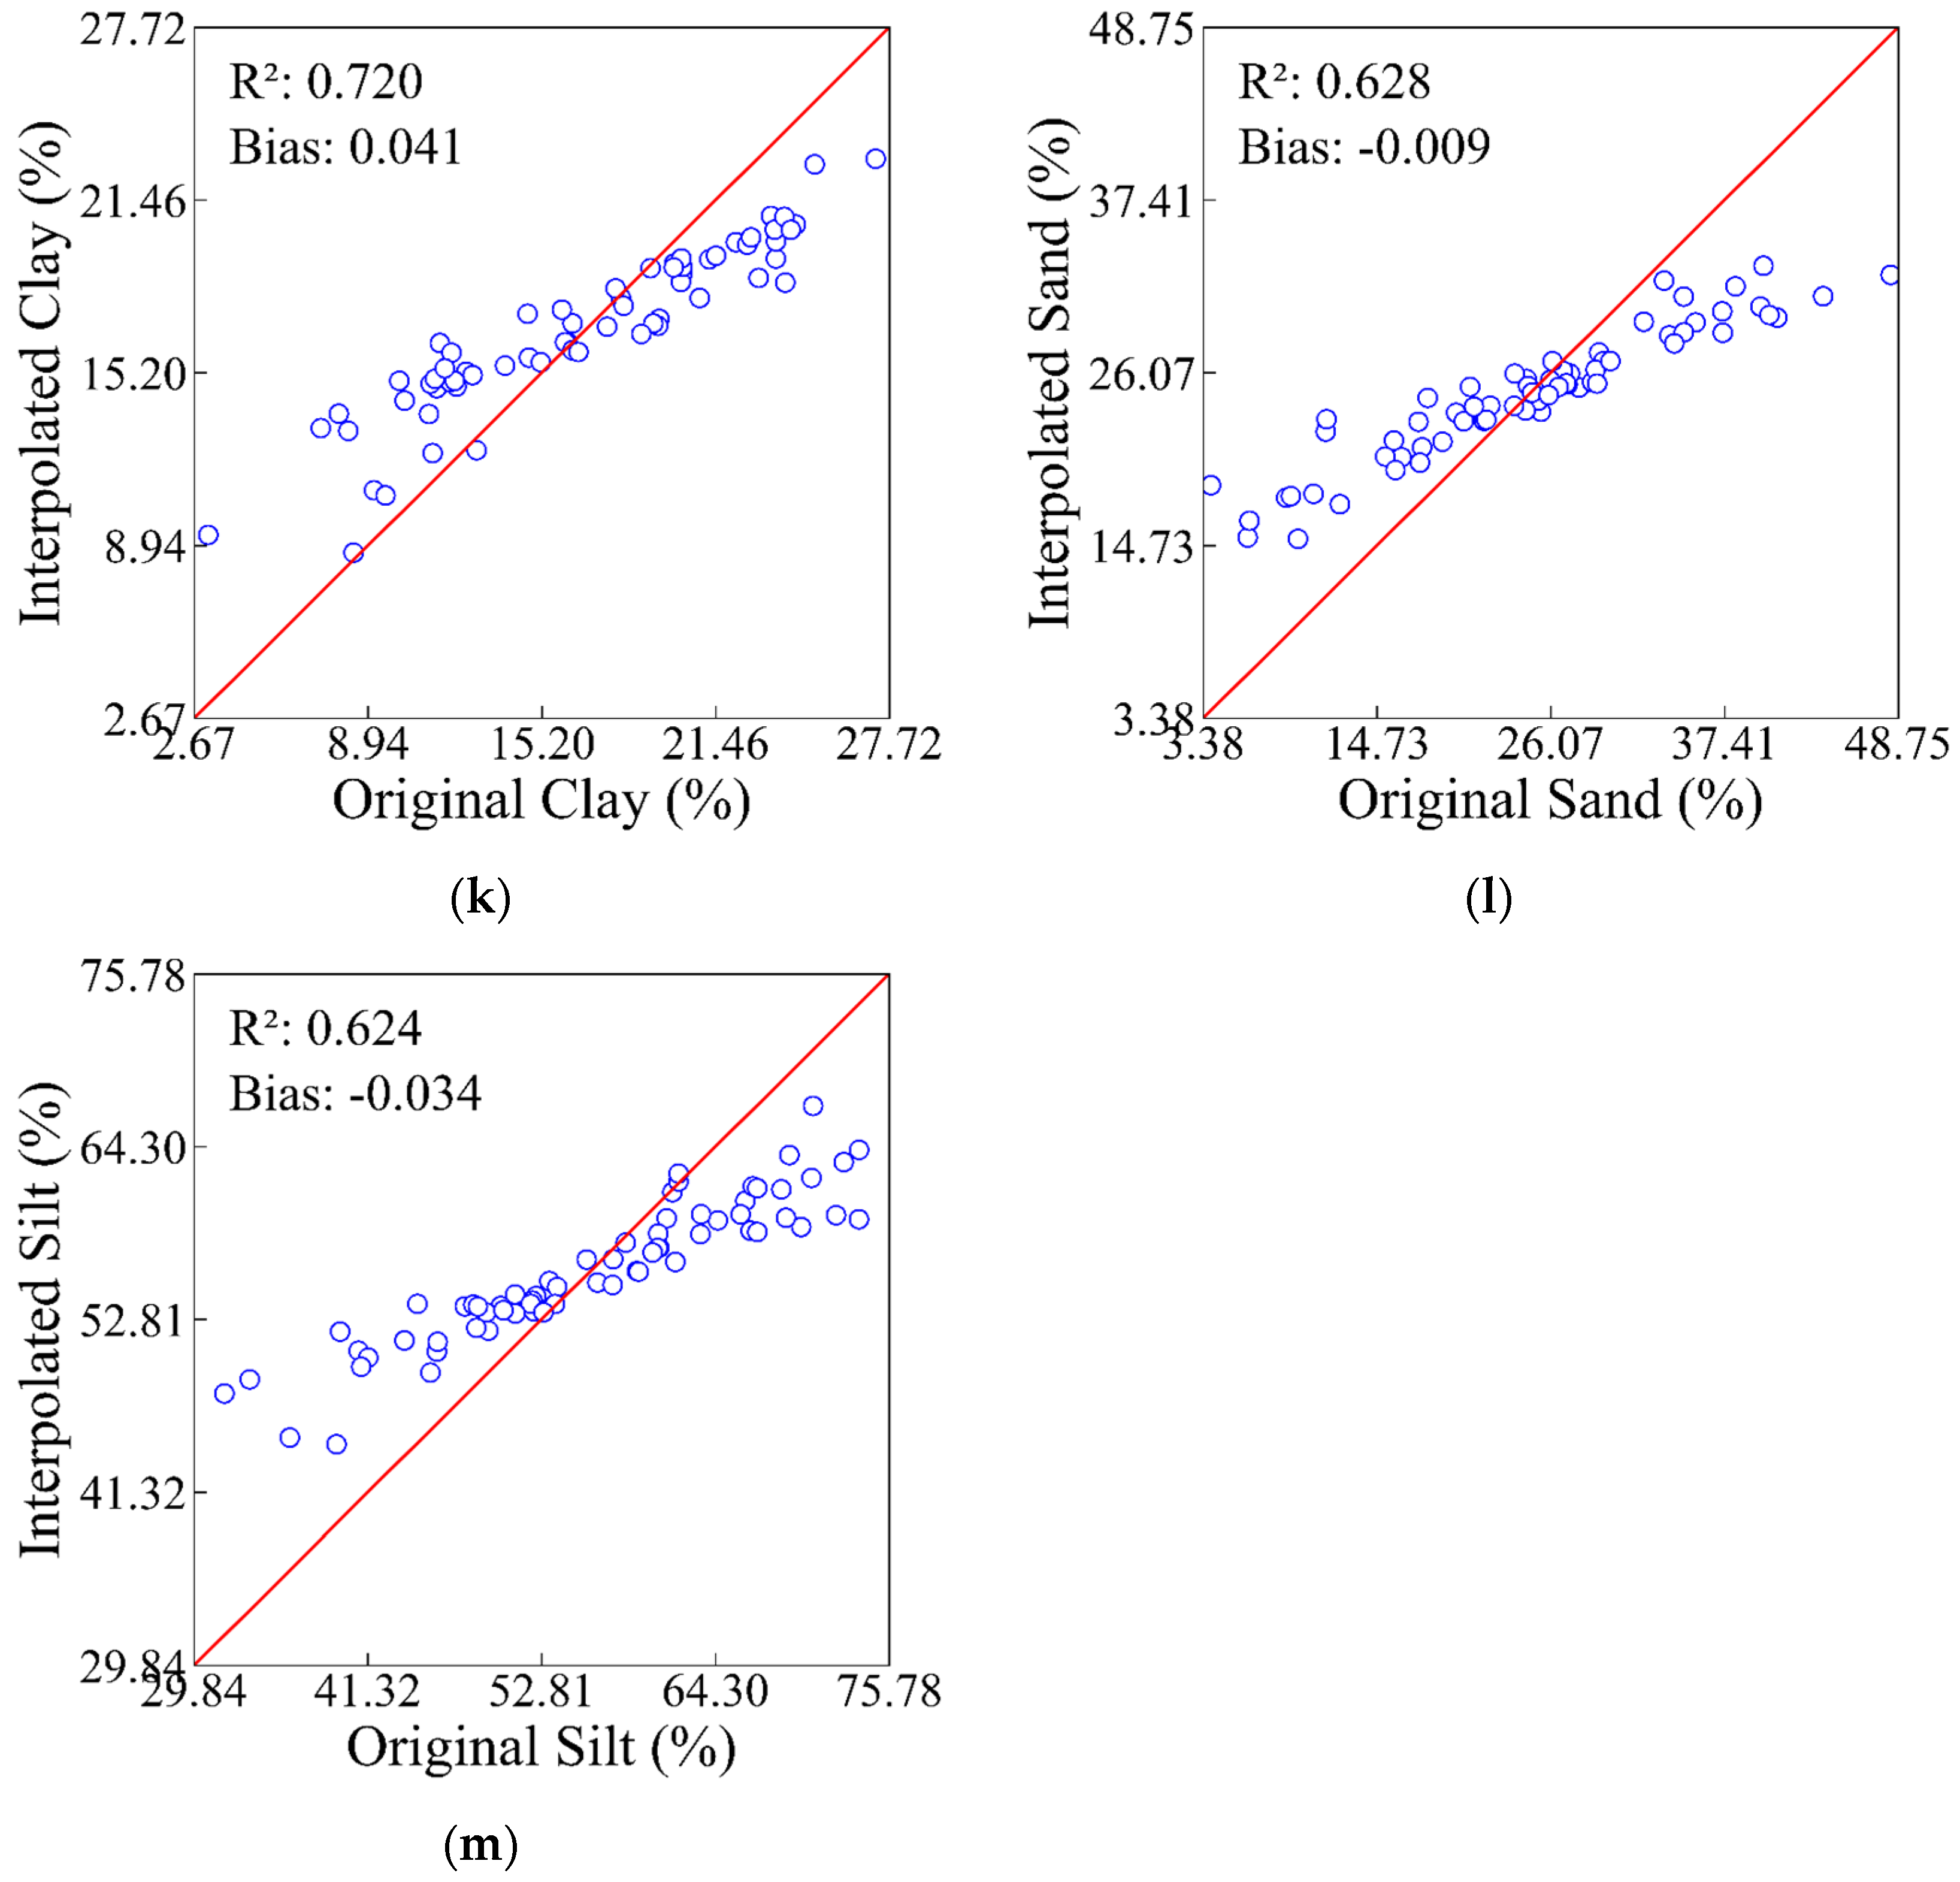
The IDW method was employed to interpolate soil indicators and evaluate the accuracy of the interpolation results (Figure 2). The fitting outcomes demonstrated that IDW effectively captured the spatial variation patterns of soil indicators, exhibiting high prediction accuracy and minor deviations. For soil properties (BD, SM, and pH), the R2 values ranged from 0.570 to 0.663, with absolute bias values consistently below 0.005, indicating high reliability in interpolating these parameters. Among them, pH had the lowest R2 value (0.570), suggesting that although the absolute bias was minimal, the model had limited capacity to fully capture the spatial variability of pH, possibly due to the complex chemical interactions in soil affecting acidity levels.
Soil nutrients (N, P, and K) showed R2 values between 0.636 and 0.674, with minimal fluctuation across this range. Although the K element exhibited a slightly higher bias compared to N and P, its absolute bias remained below 0.05, reflecting an overall underestimation trend. This underestimation could be attributed to potassium’s relatively high variability in soils due to plant uptake and leaching processes.
Metallic elements (Pb, Zn, Ni, and Hg) yielded the highest R2 values (0.734–0.763) among all indicators, with limited variability, suggesting strong spatial regularity. However, Zn and Ni showed relatively higher absolute biases (Zn: 0.383; Ni: 0.187), indicating that while spatial trends were well captured, some local deviations existed, possibly due to an uneven distribution or anthropogenic impacts (e.g., industrial activities). Pb and Hg, by contrast, exhibited both high R2 values and minimal biases, demonstrating stable spatial behavior and higher interpolation precision.
For soil texture (clay, sand, and silt), R2 spanned 0.624–0.720, and absolute biases were uniformly below 0.05. This indicates that IDW was generally effective in representing soil textural variations, although fine-scale heterogeneities may still lead to localized deviations.
In summary, the IDW method performed robustly in characterizing the spatial distribution of soil indicators, particularly for metallic elements and soil properties. Most interpolated results demonstrated strong correlations (high R2) and minimal bias, confirming the method’s credibility for spatial analysis of heterogeneous soil datasets. The variable-specific analysis further illustrates that while the method captures general spatial patterns well, certain parameters with high natural variability or anthropogenic influence (e.g., Zn, Ni, and pH) may still exhibit noticeable residuals, warranting further model enhancement or alternative approaches in future studies.
The statistical analysis of soil indicators (0–10 cm depth) across reclamation zones in the study area (Table 3) revealed distinct trends in soil restoration over time. Soil properties (BD, SM, and pH) demonstrated progressive recovery, reaching levels comparable to or exceeding those of the CK area after approximately 11 years of reclamation. Specifically, pH values across all reclaimed zones remained stable within the alkaline range (8.79–8.91), with low variability, indicating the consistent regulation of soil acidity during reclamation. SM and BD exhibited contrasting trends: BD showed a decreasing trend, while SM increased gradually, reflecting improved soil porosity and moisture retention, which collectively enhanced vegetation suitability. Notably, SM values in reclaimed zones consistently surpassed those of the CK area, likely attributed to vegetation restoration and targeted soil management practices.
Soil nutrients (N, P, and K) displayed an initial increase followed by a gradual decline with reclamation duration, though all remained higher than CK levels. N and K concentrations showed minimal variability, with differences from CK consistently below 5 g/kg. In contrast, P peaked at 0.411 g/kg in the eighth year of post-reclamation before declining, possibly linked to leaching or shifts in plant uptake efficiency. These findings were further emphasized in the comparative analysis presented in Table 3, which demonstrates that the concentrations of N, P, and K in all reclamation stages remained higher than those in the CK zone, reflecting the lasting impact of early-stage soil amendments.
Metallic elements (Pb, Zn, Ni, and Hg) exhibited divergent behaviors. Hg concentrations remained comparable to CK levels, with low standard deviations across zones, suggesting limited temporal influence and minimal phytoremediation. Conversely, Pb, Zn, and Ni accumulated progressively in reclaimed soils, exceeding CK values, likely due to anthropogenic inputs or legacy contamination during reclamation. This trend was further emphasized through a detailed comparison of means and medians across zones, which consistently showed that Pb, Zn, and Ni concentrations in reclaimed soils were significantly elevated compared to the CK area, highlighting the persistent influence of historical land use and the necessity of targeted remediation efforts.
Soil texture (clay, sand, and silt) showed limited variability. Clay content decreased progressively with reclamation duration, while silt and sand fractions stabilized near CK levels. However, clay content in reclaimed soils remained higher than in CK, promoting denser soil structure and enhanced water retention capacity.
Prolonged reclamation significantly improved soil properties (SM, pH, and BD) and nutrient availability (N, P, and K), achieving restoration targets within 11 years. However, the persistent elevation of heavy metal concentrations (Pb, Zn, and Ni) highlights the need for long-term monitoring and mitigation strategies to align reclaimed soils with CK benchmarks.
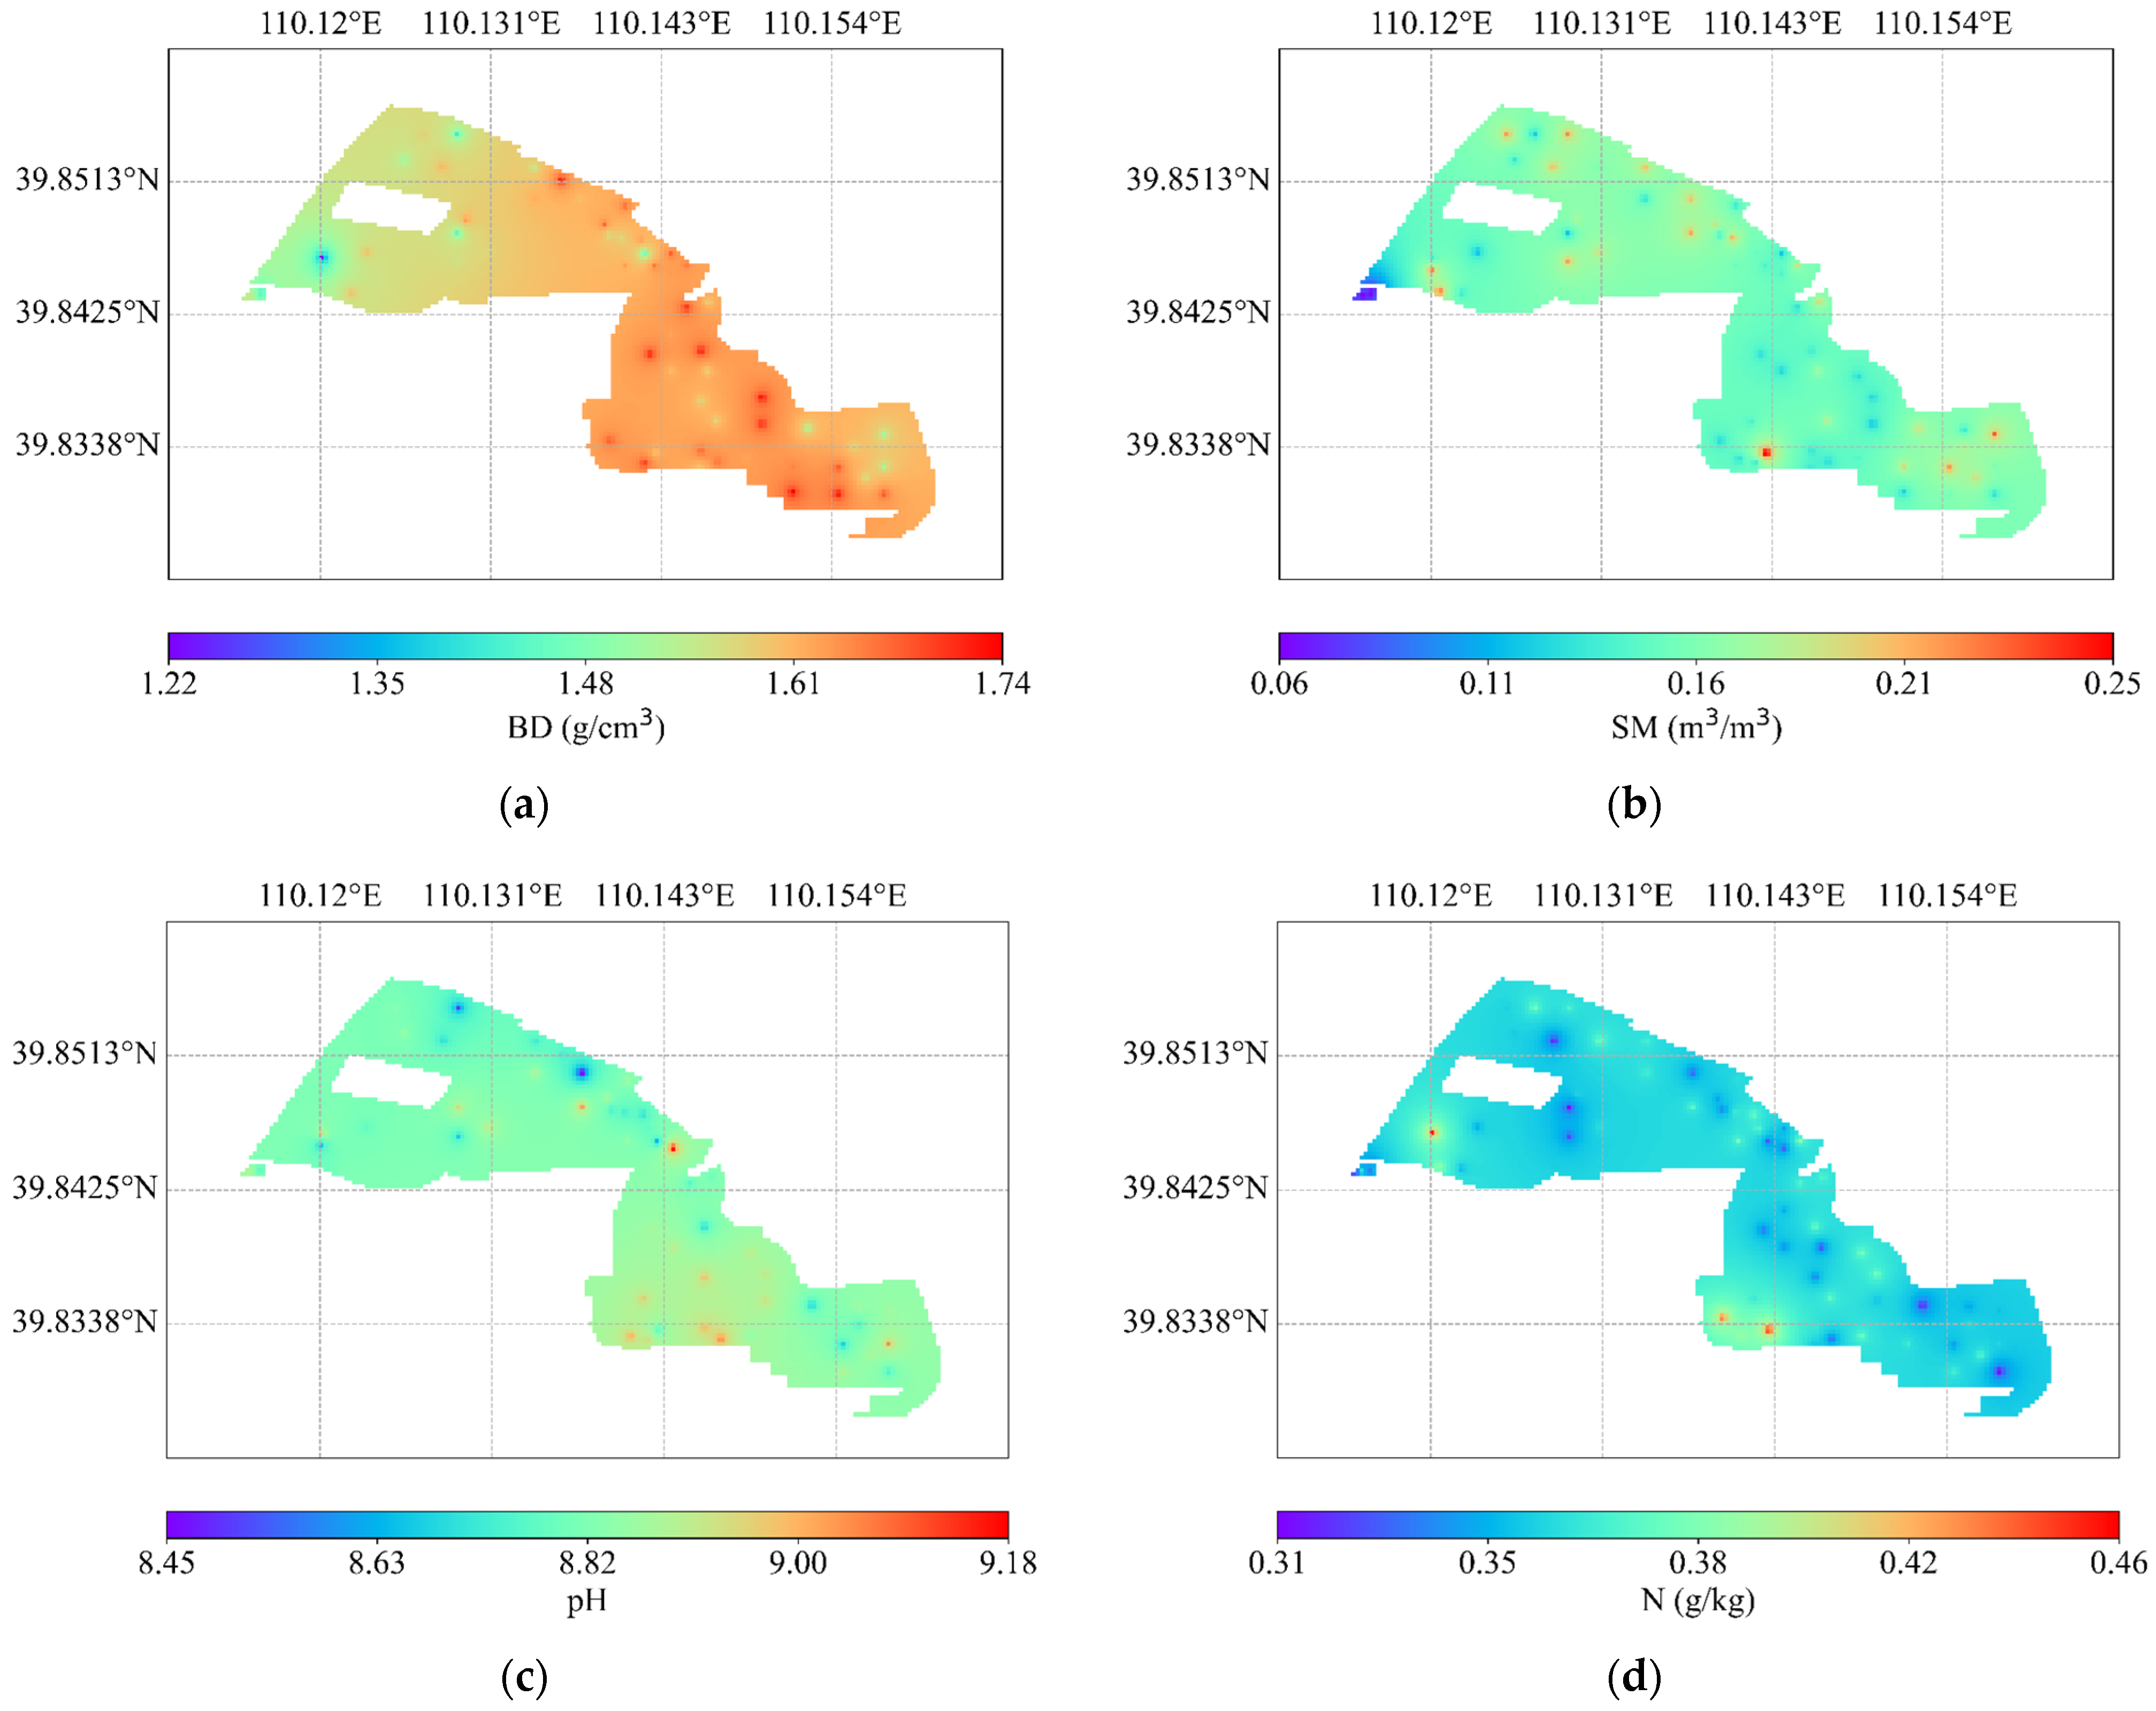
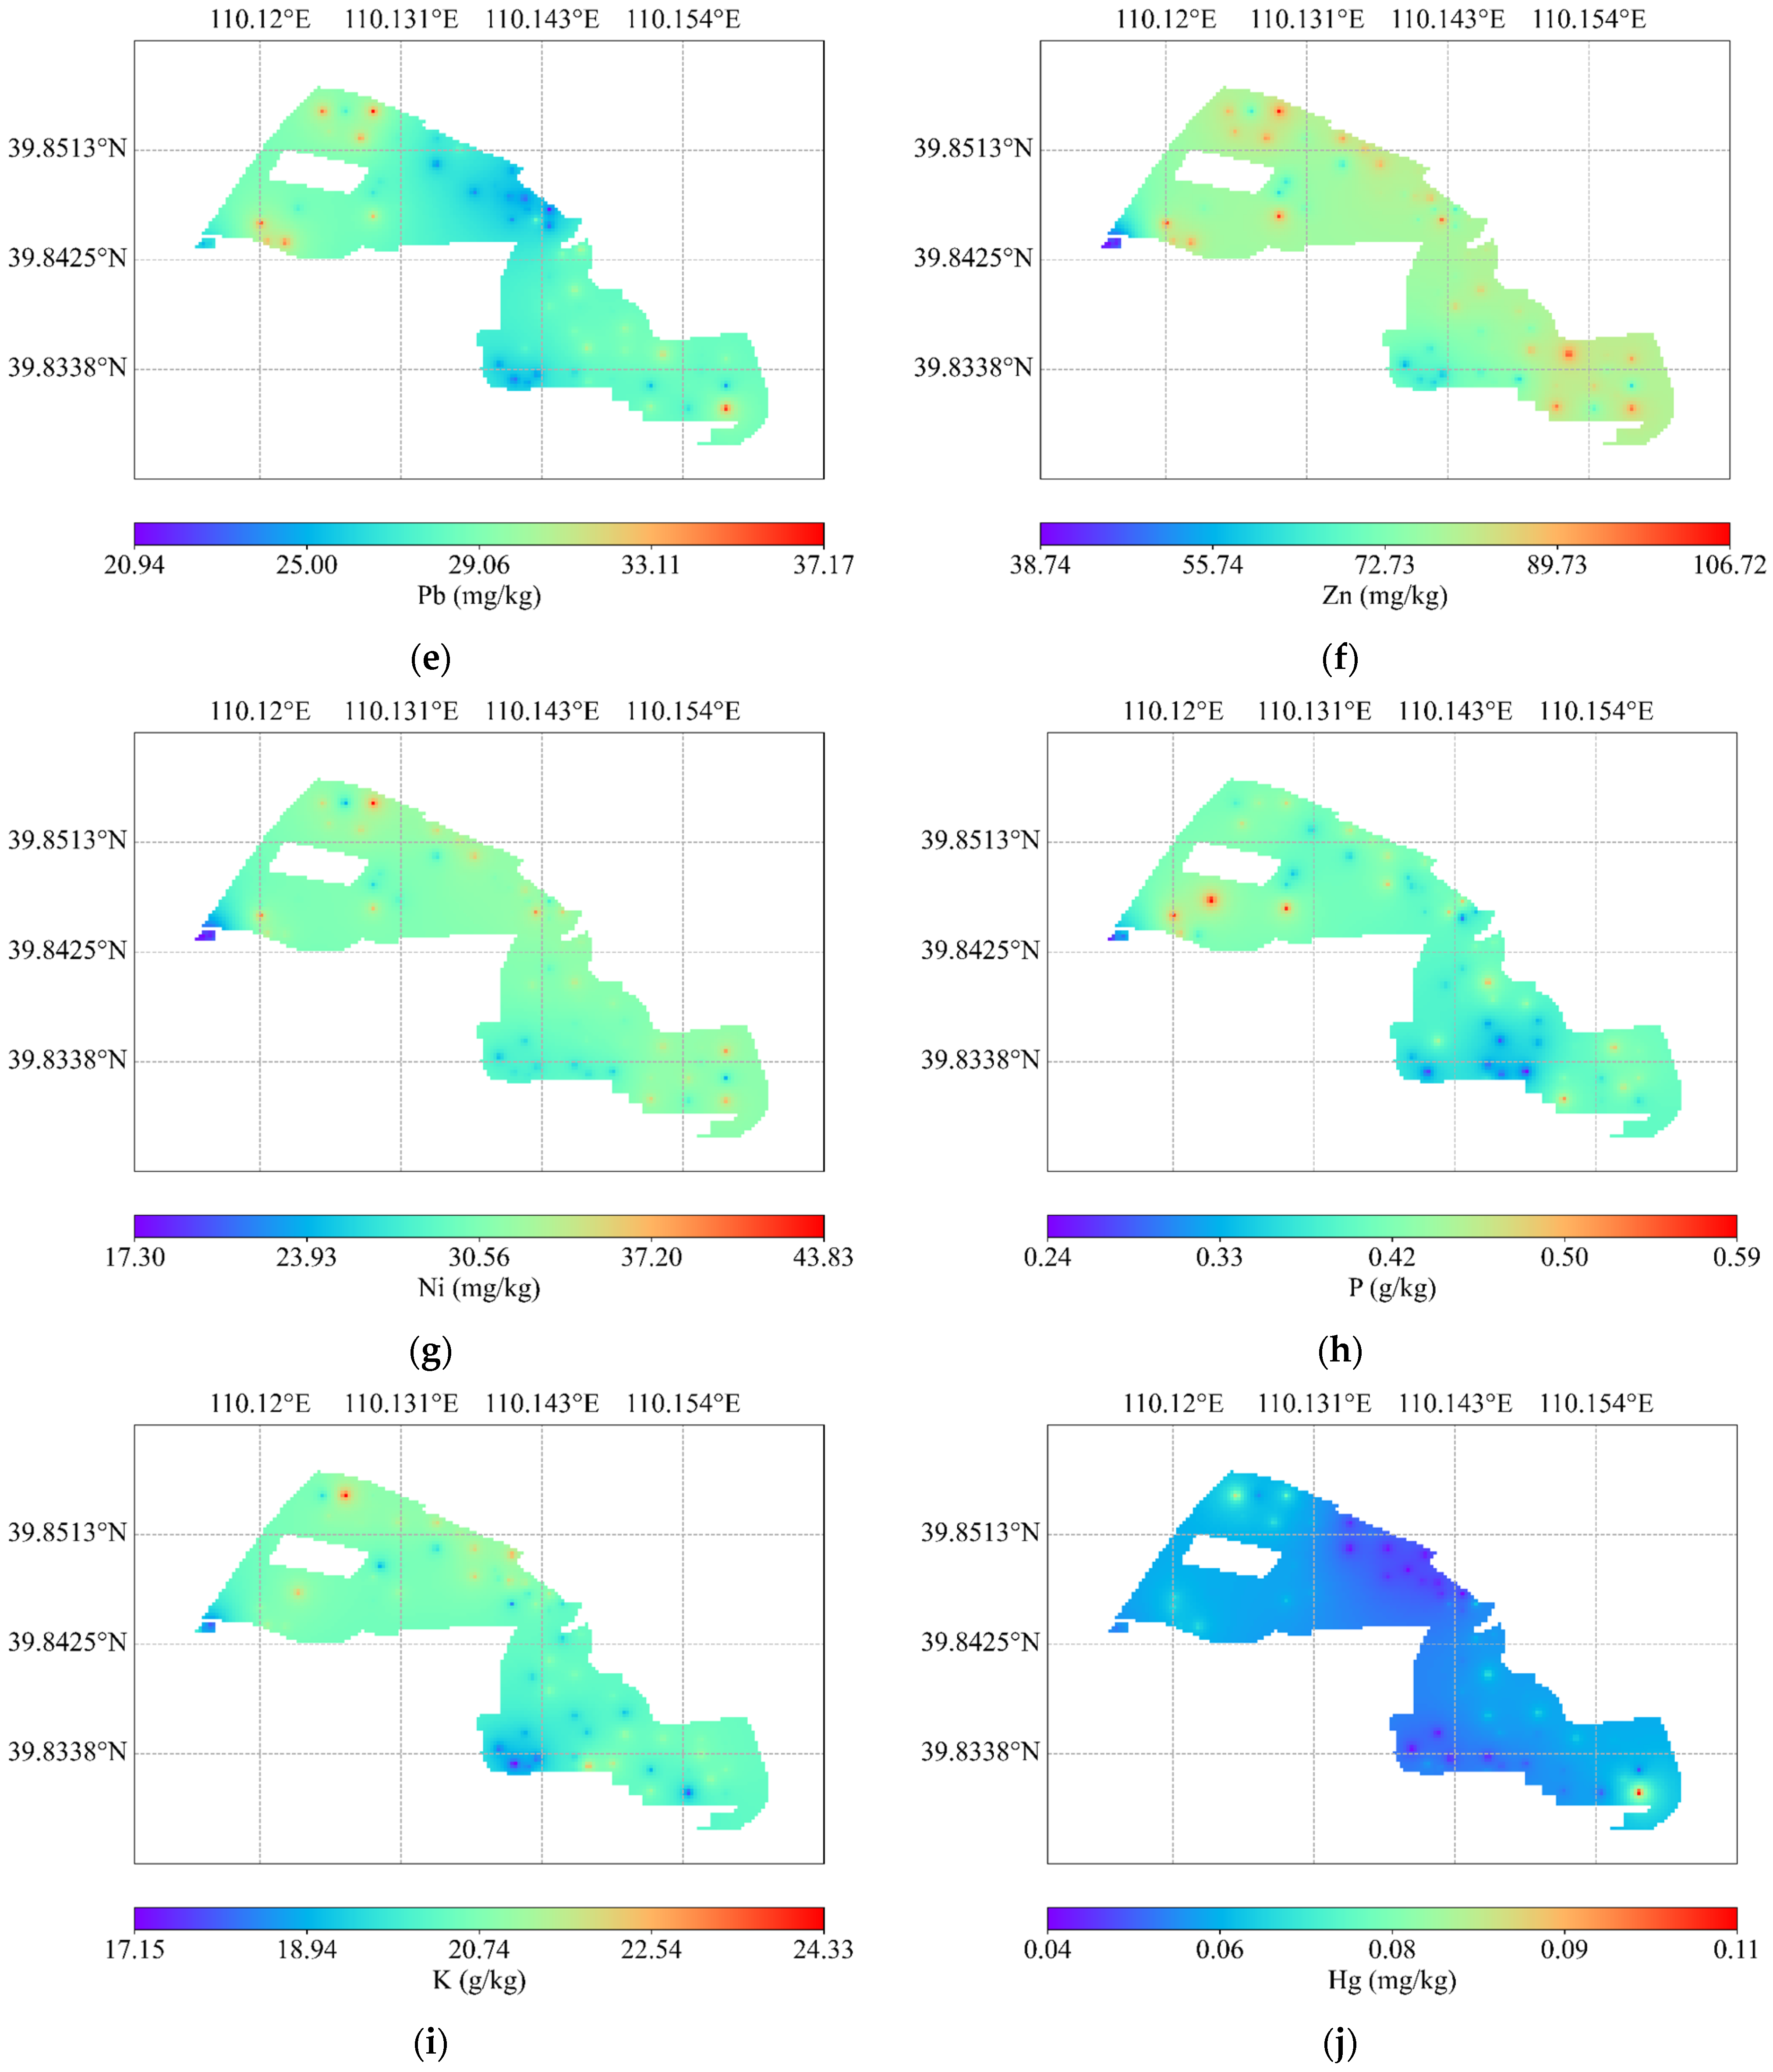
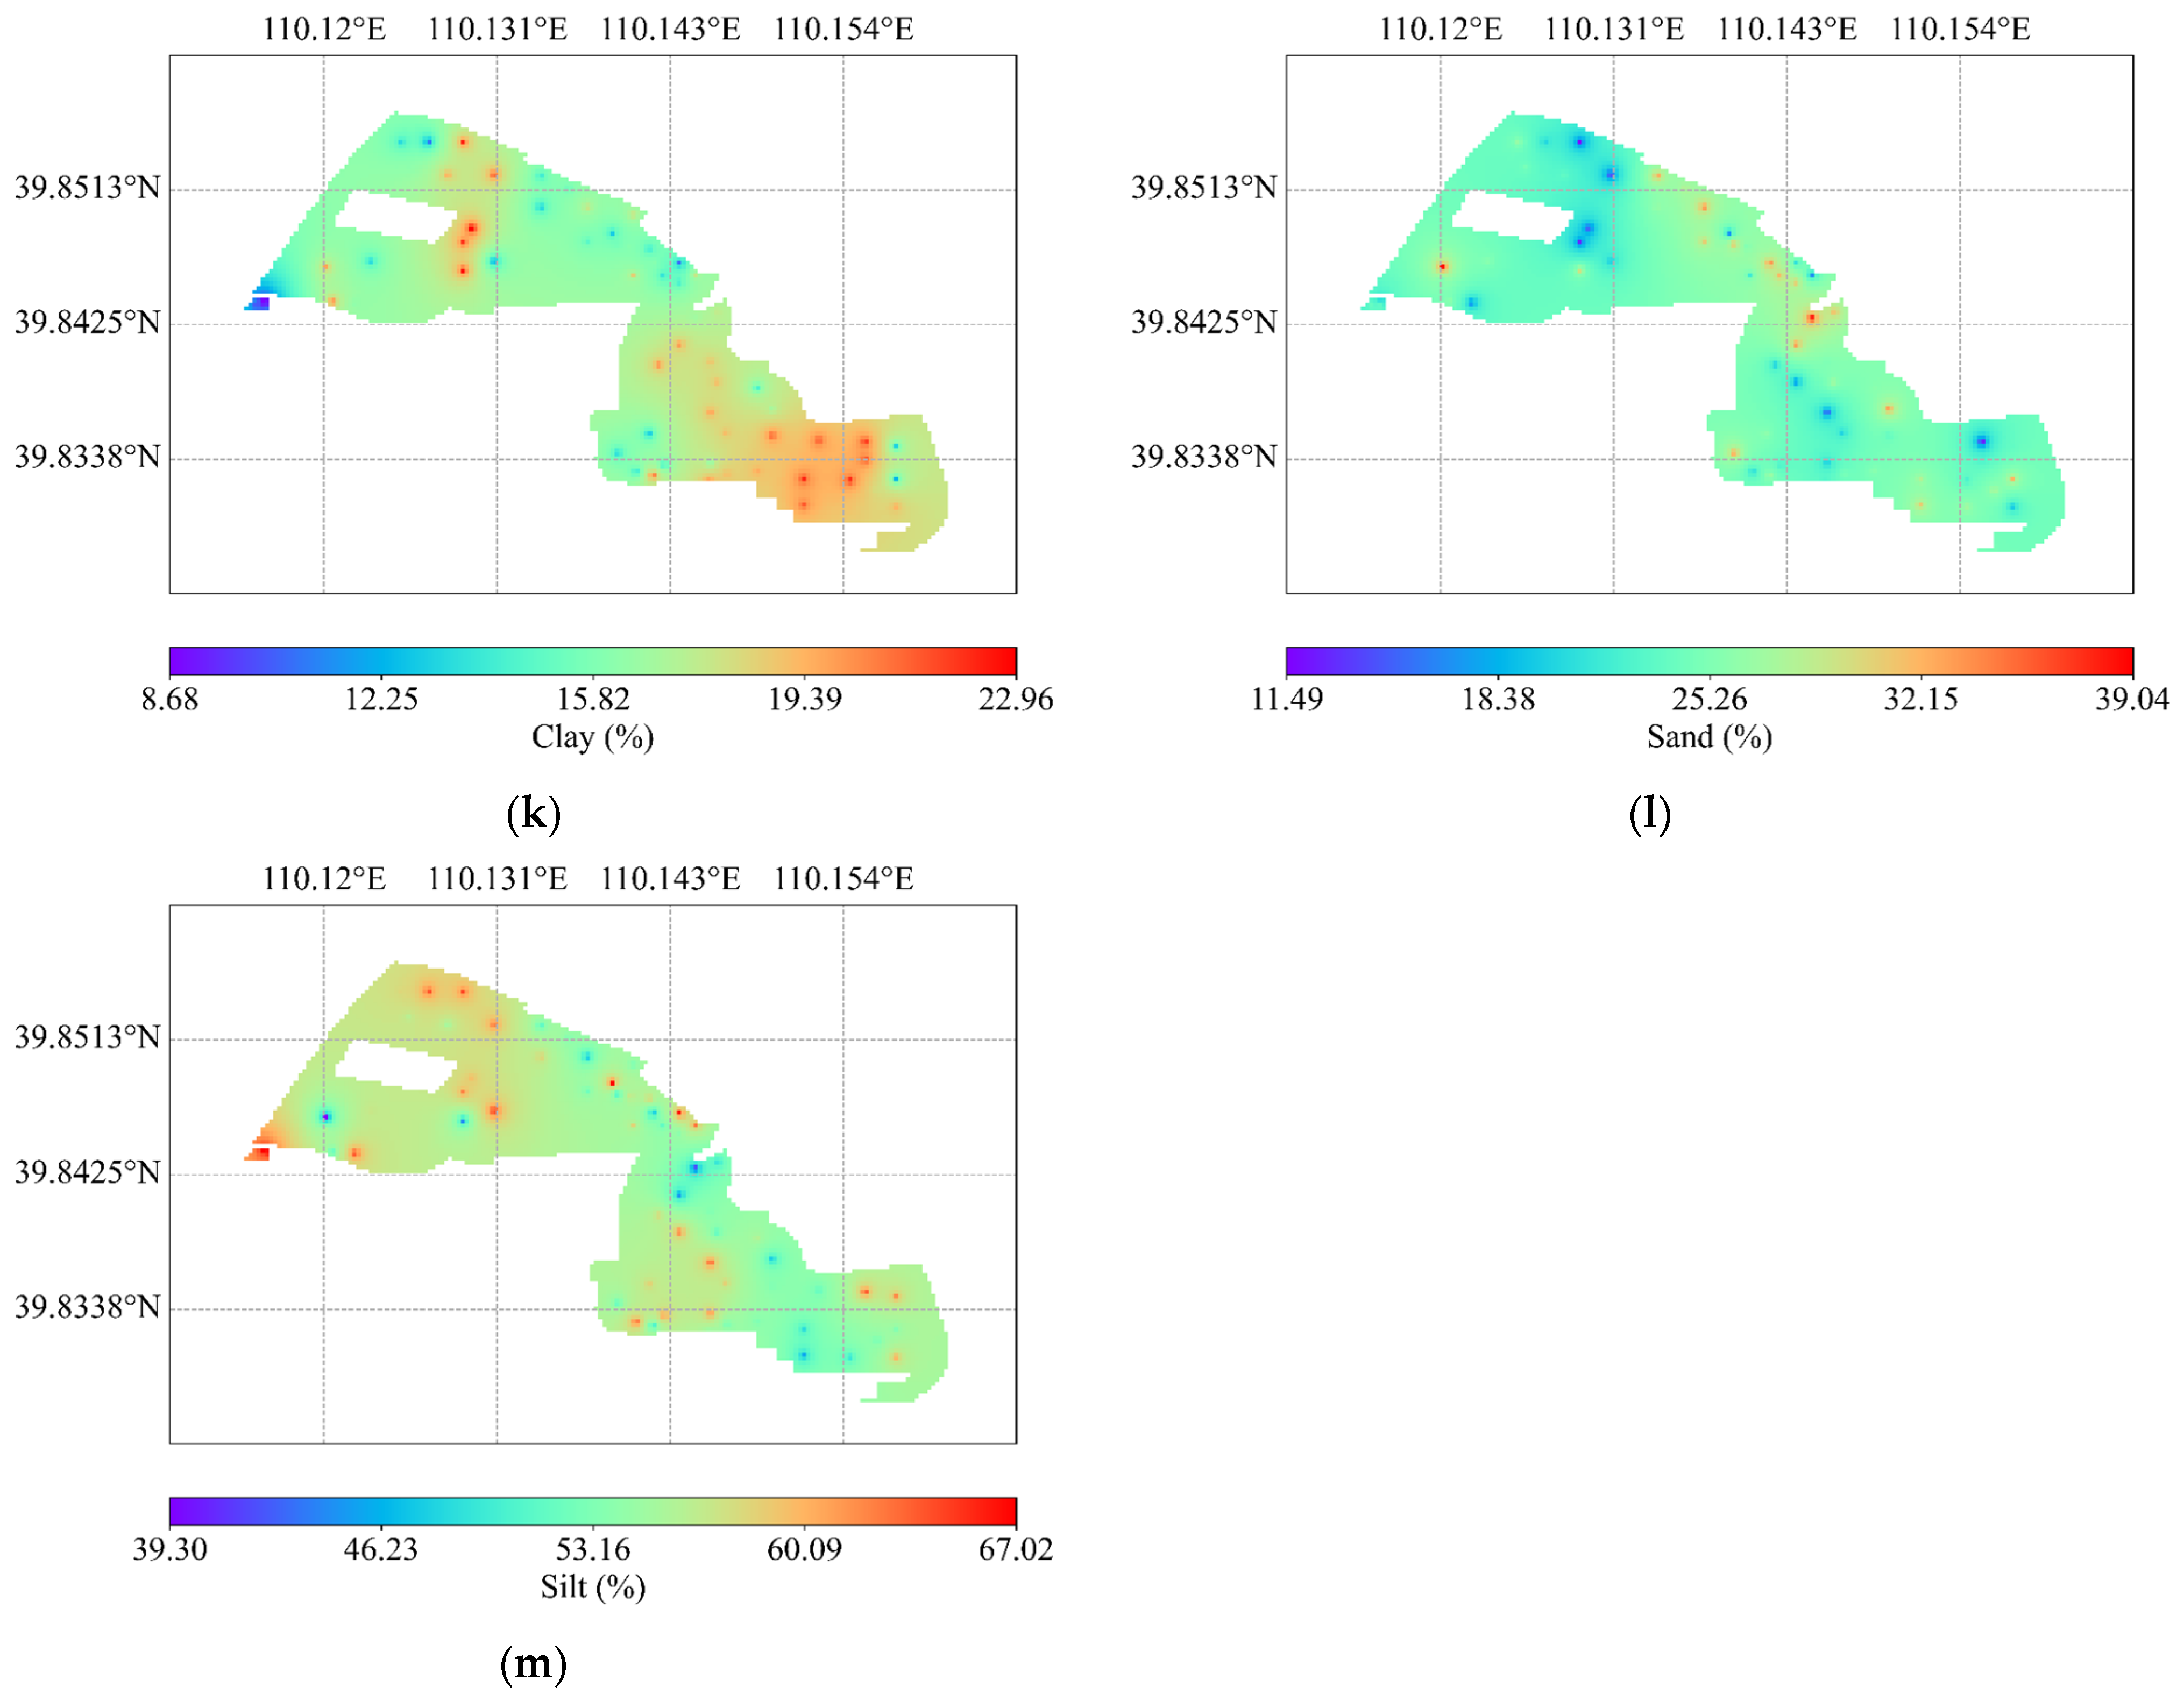
Figure 3 shows the spatial distribution of multiple soil indicators in a specific study area. There is great spatial variability in soil properties across the area. For instance, the content or values of BD, clay, Hg, K, N, Ni, P, Pb, pH, sand, silt, SM, and Zn vary significantly across different locations. Overall, many indicator values are higher in the right part (higher longitude) and lower in the left part (lower longitude), with medium levels in the middle. This distribution pattern may be linked to local topography, the soil parent material, vegetation cover, and human activities.
In addition, the continuous accumulation of heavy metals such as Pb, Zn, and Ni in reclaimed soils may be attributed to multiple interacting factors. First, the filling materials used during reclamation, such as dredged sediments, construction waste, or industrial by-products, may contain considerable amounts of heavy metals, serving as initial sources of contamination. Second, agricultural activities in the reclaimed areas, including fertilization, pesticide application, and irrigation water quality, can introduce exogenous heavy metals, resulting in their gradual accumulation in the soil over time. Furthermore, changes in soil physicochemical properties, such as stabilized pH, increased organic matter content, and enhanced cation exchange capacity, may improve the adsorption and retention of heavy metals, affecting their vertical migration within the soil profile. Root exudates and microbial activities may also influence the transformation of these metals through complexation or reduction processes, thereby altering their chemical speciation and bioavailability. The combined effects of these physical, chemical, and biological processes may explain why elements like Pb, Zn, and Ni remain significantly higher in older reclaimed plots compared to the CK (control) area. This indicates a potential risk of secondary accumulation of heavy metals, highlighting the necessity of long-term monitoring and ecological regulation to ensure soil environmental quality in reclaimed lands.

4.1.2. Factorial Analysis

PCA identified four components with eigenvalues exceeding one (pH, P, K, and silt), collectively accounting for 79.497% of the cumulative variance (Table 4), demonstrating their capacity to represent the majority of variability in soil indicators. For Factor 1 (F1), Zn exhibited the highest loading, followed by Ni, with Ni’s loading value within 10% of Zn’s maximum. For Factor 2 (F2) and Factor 3 (F3), silt and clay displayed the highest loadings, respectively, with no additional indicators meeting the 10% higher-loading threshold. For Factor 4 (F4), sand showed the highest loading, while Hg and Pb were classified as higher-loading indicators due to loadings within 10% of the maximum.
For the MDS, selection criteria prioritized indicators with correlations > 0.5 and higher Norm values. Zn was selected over Ni due to its superior Norm value, while Pb was chosen over sand and Hg for the same reason (Table 5). The MDS weight analysis revealed that all indicators except nitrogen (N; communality = 0.478) exhibited communality values > 0.7. Silt demonstrated the highest communality (0.909) and weight coefficient (0.153), highlighting its dominant role in soil index construction. Comparatively, pH, Pb, Zn, P, K, clay, and silt contributed more significantly than N to the soil indices.
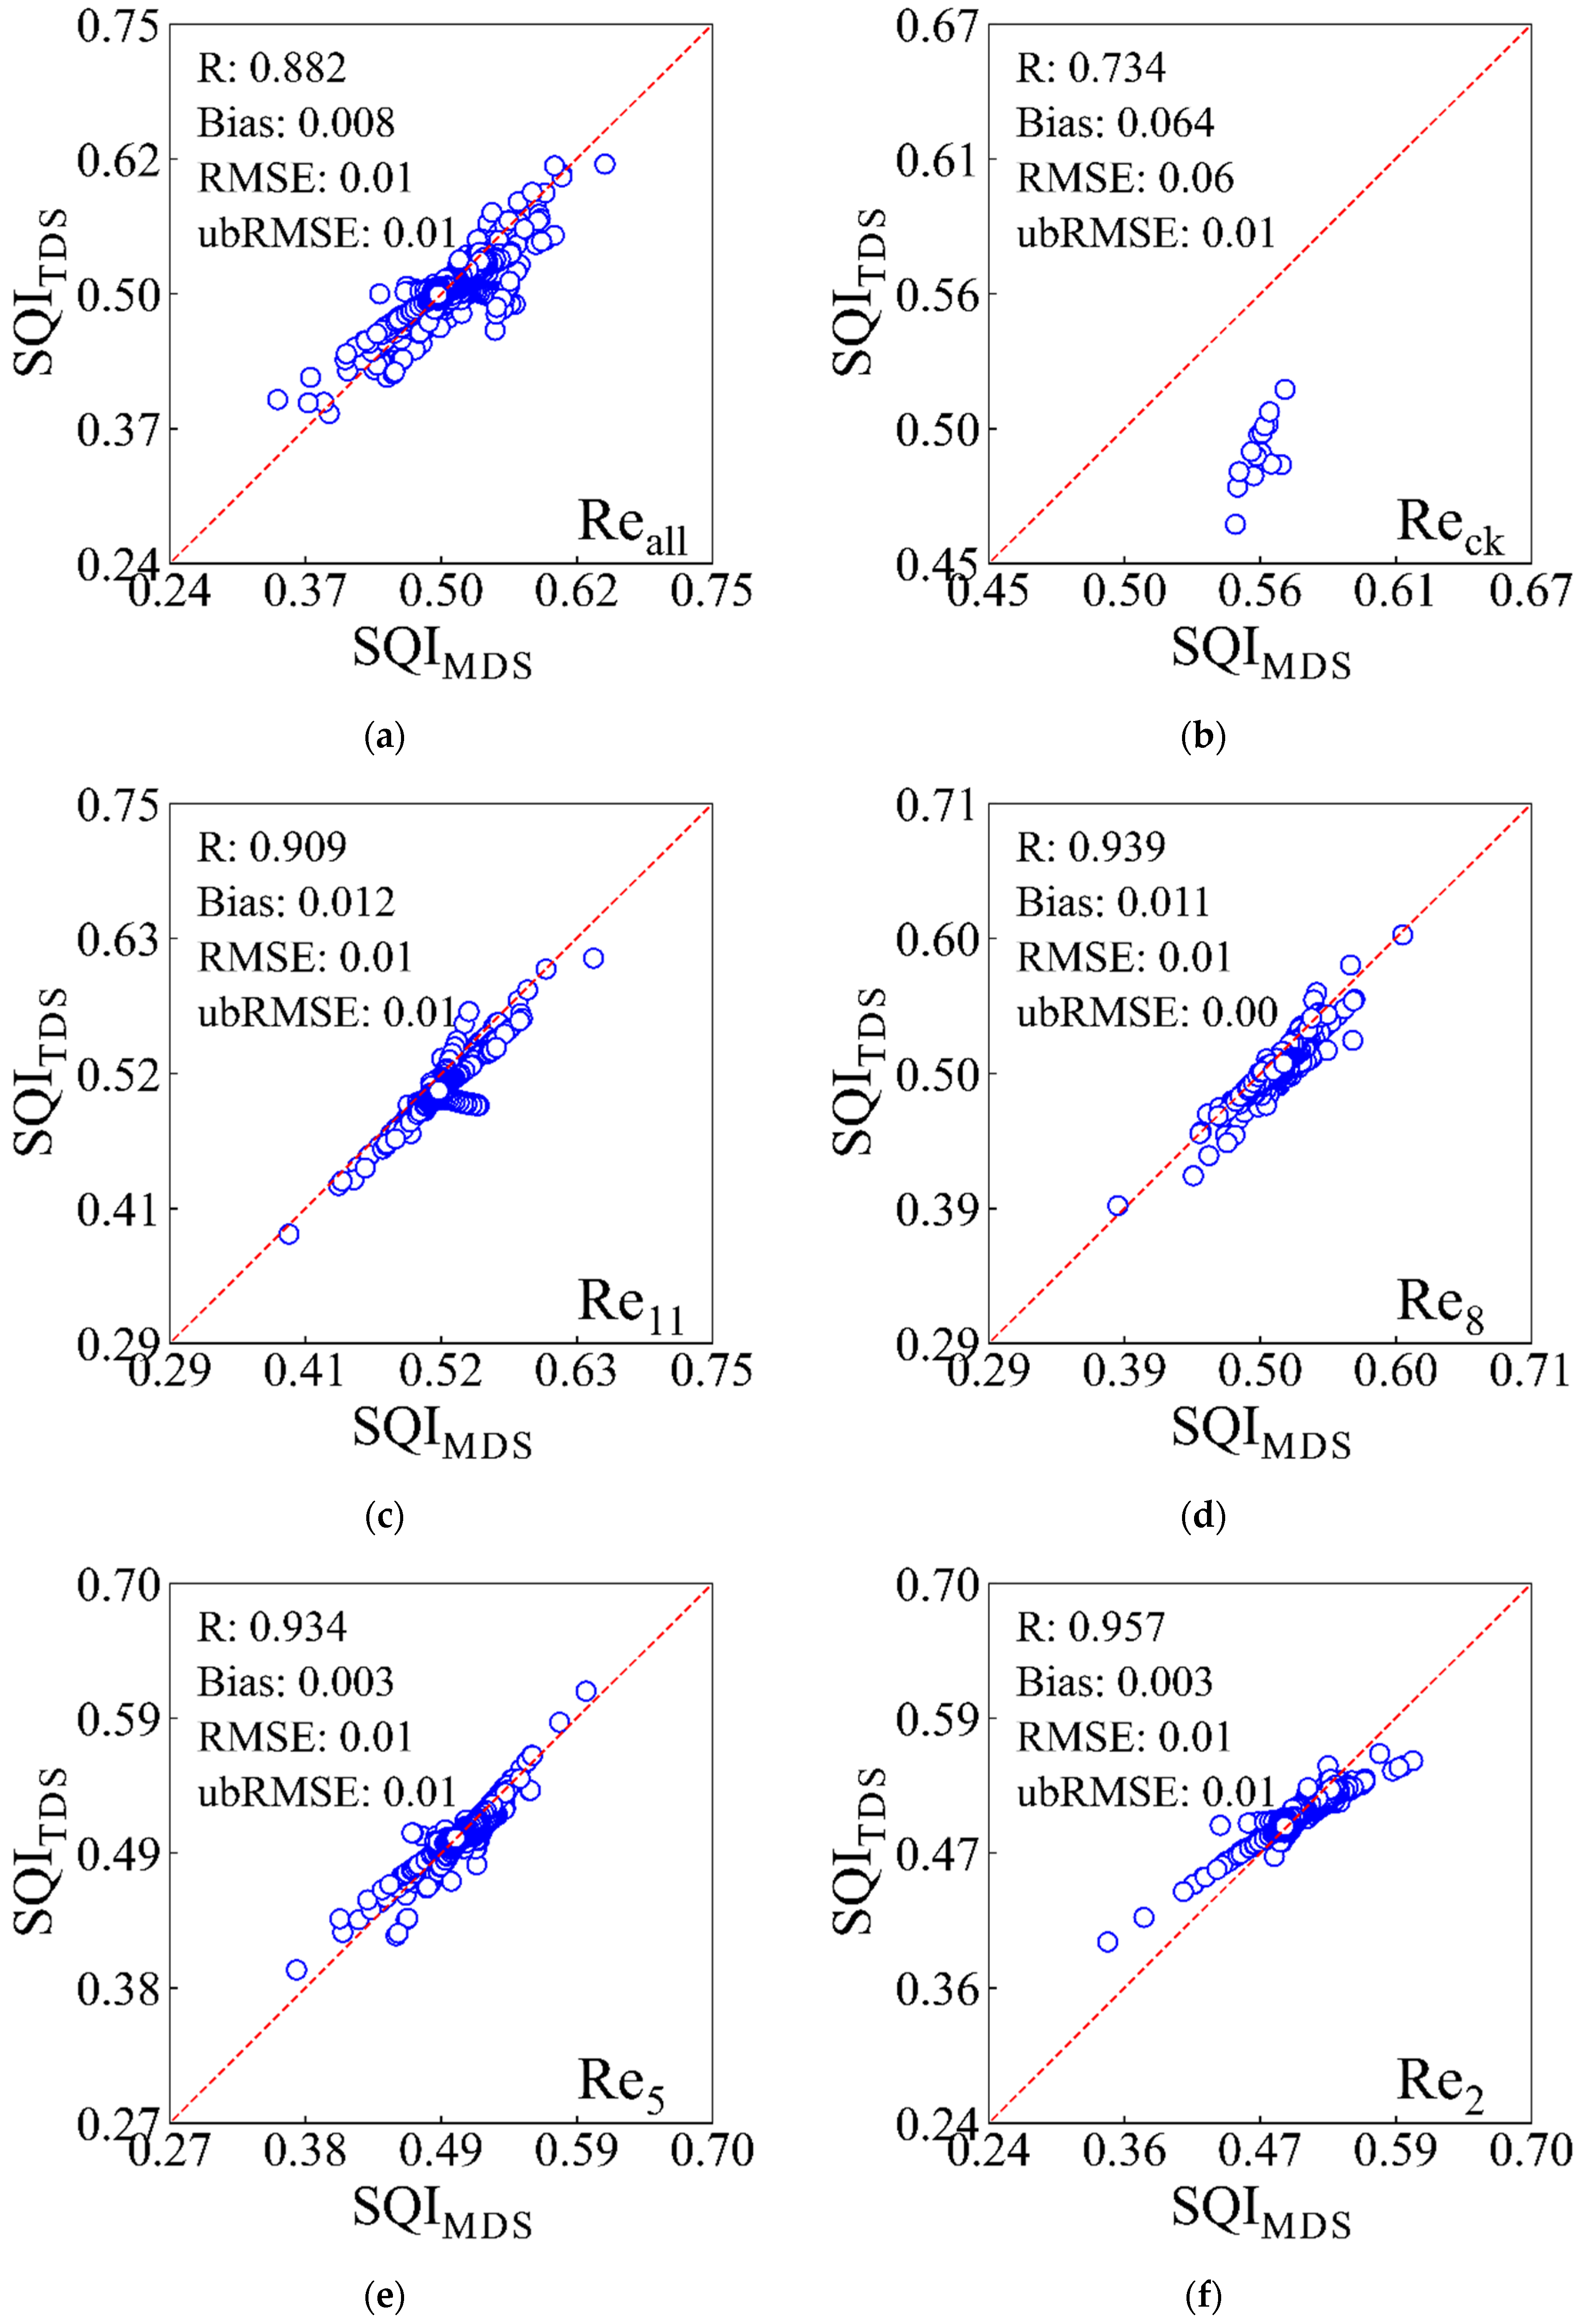
To evaluate the validity of the MDS, the accuracy of soil quality indices (SQIMDS and SQITDS) across reclamation zones was assessed using R, bias, RMSE, and ubRMSE (Figure 4). Across the study area, SQIMDS and SQITDS exhibited strong agreement (R = 0.882). In all reclamation zones except Reck (R = 0.734), correlations between SQIMDS and SQITDS exceeded 0.9, with bias values < 0.05, confirming that the MDS effectively captured the comprehensive information of the TDS.
However, lower correlations were observed in the CK area (R < 0.9), likely attributed to the limited sample size, reduced representativeness, and higher heterogeneity in soil or vegetation characteristics within CK. These factors suggest that the MDS performance in the CK area may be influenced by data scarcity and sampling bias.

4.1.3. Statistical Features of SQI

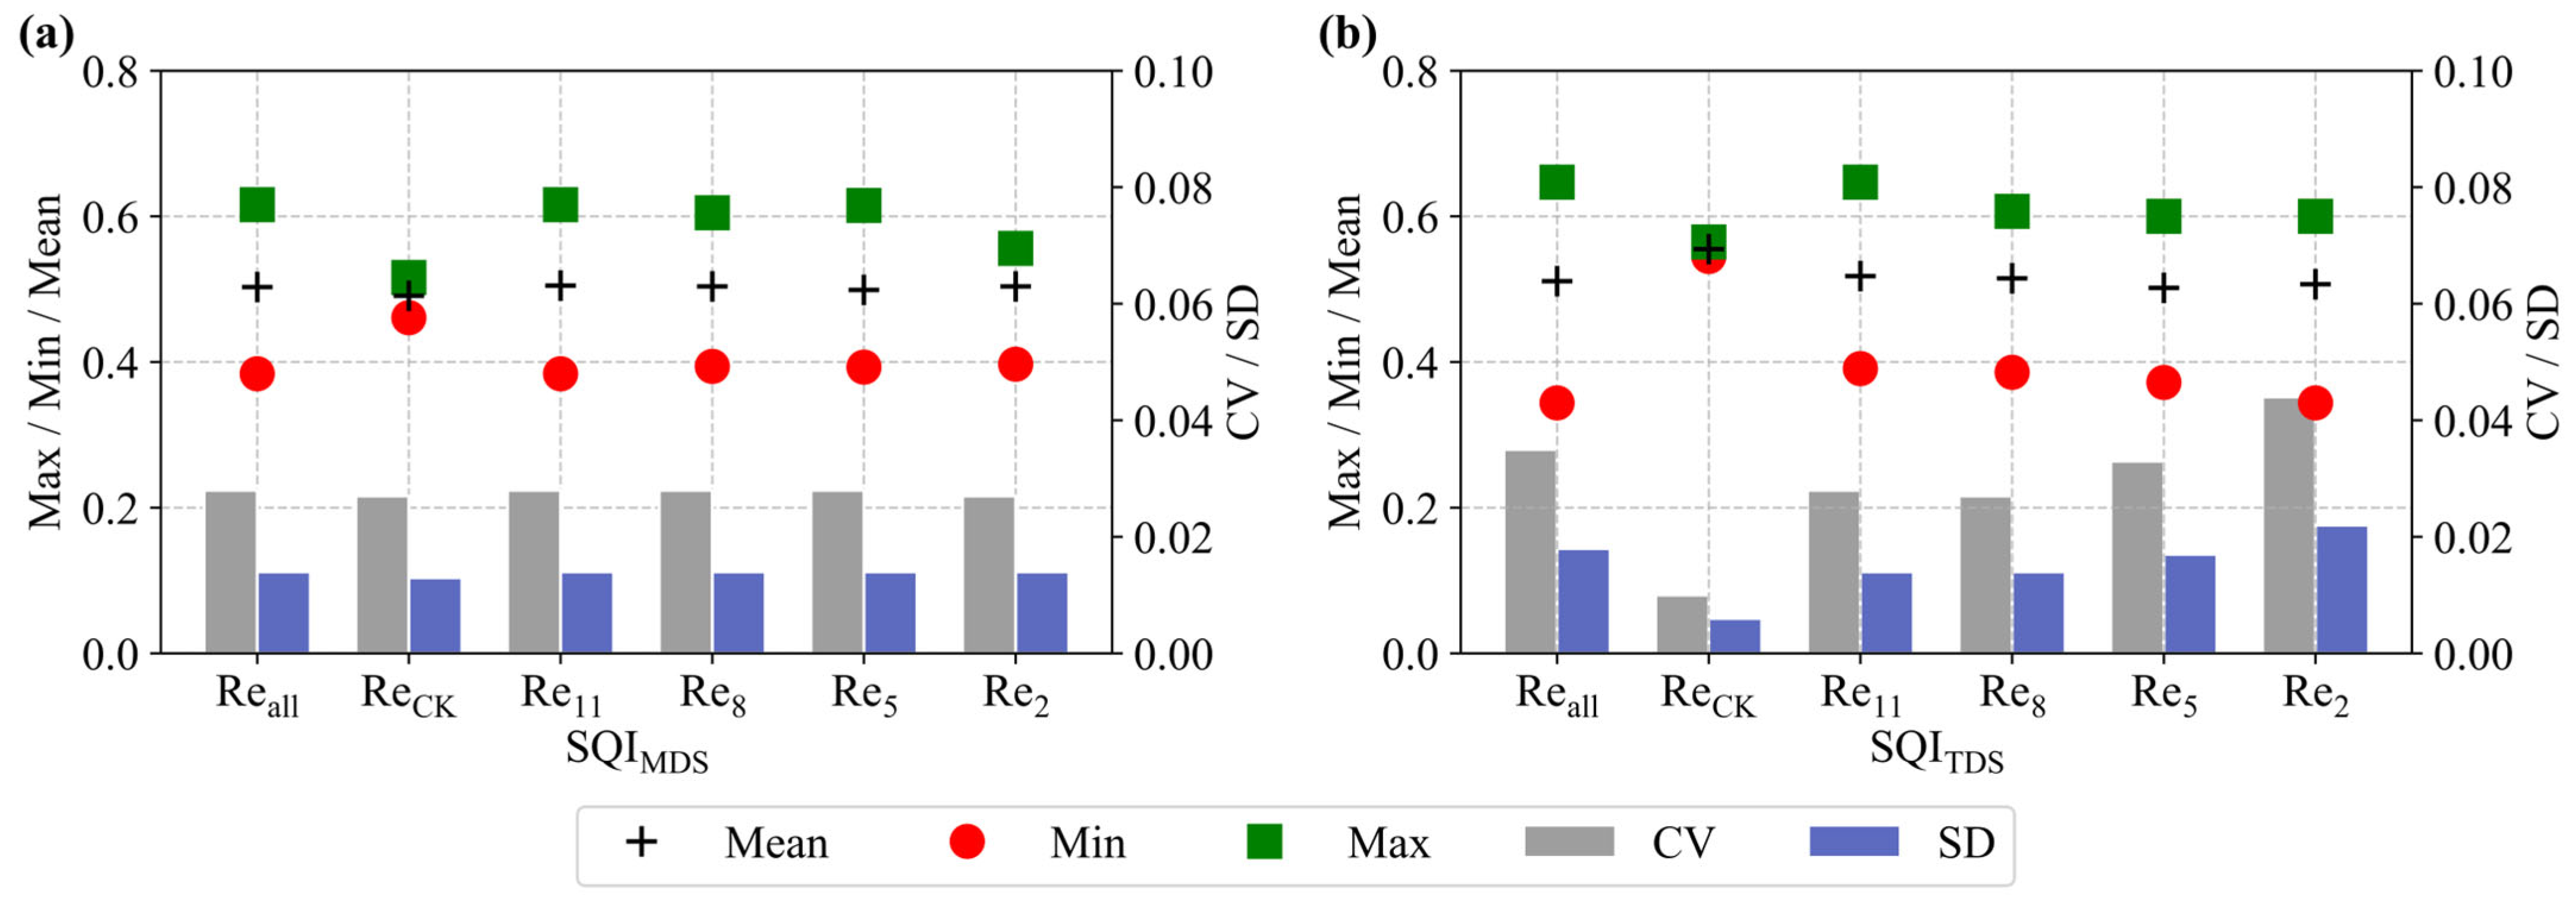
Statistical analysis of the SQI across reclamation zones revealed significant trends (Figure 5). As reclamation duration increased, both SQIMDS and SQITDS demonstrated upward trends, indicating progressive improvement in soil quality. SQITDS exhibited greater sensitivity to soil quality changes, capturing larger variability, while SQIMDS provided smoother trends suitable for long-term analysis. However, SQIMDS may potentially mask finer-scale variations.
A comparison of CV and SD across zones showed that longer reclamation periods resulted in CV and SD values approaching those of the CK area, reflecting a more uniform spatial distribution of soil quality. SQITDS outperformed SQIMDS in detecting variability, with higher sensitivity to changes in CV and SD. In contrast, SQIMDS displayed more balanced value distributions and lower spatial variability, with significantly reduced CV and SD values compared to SQITDS.
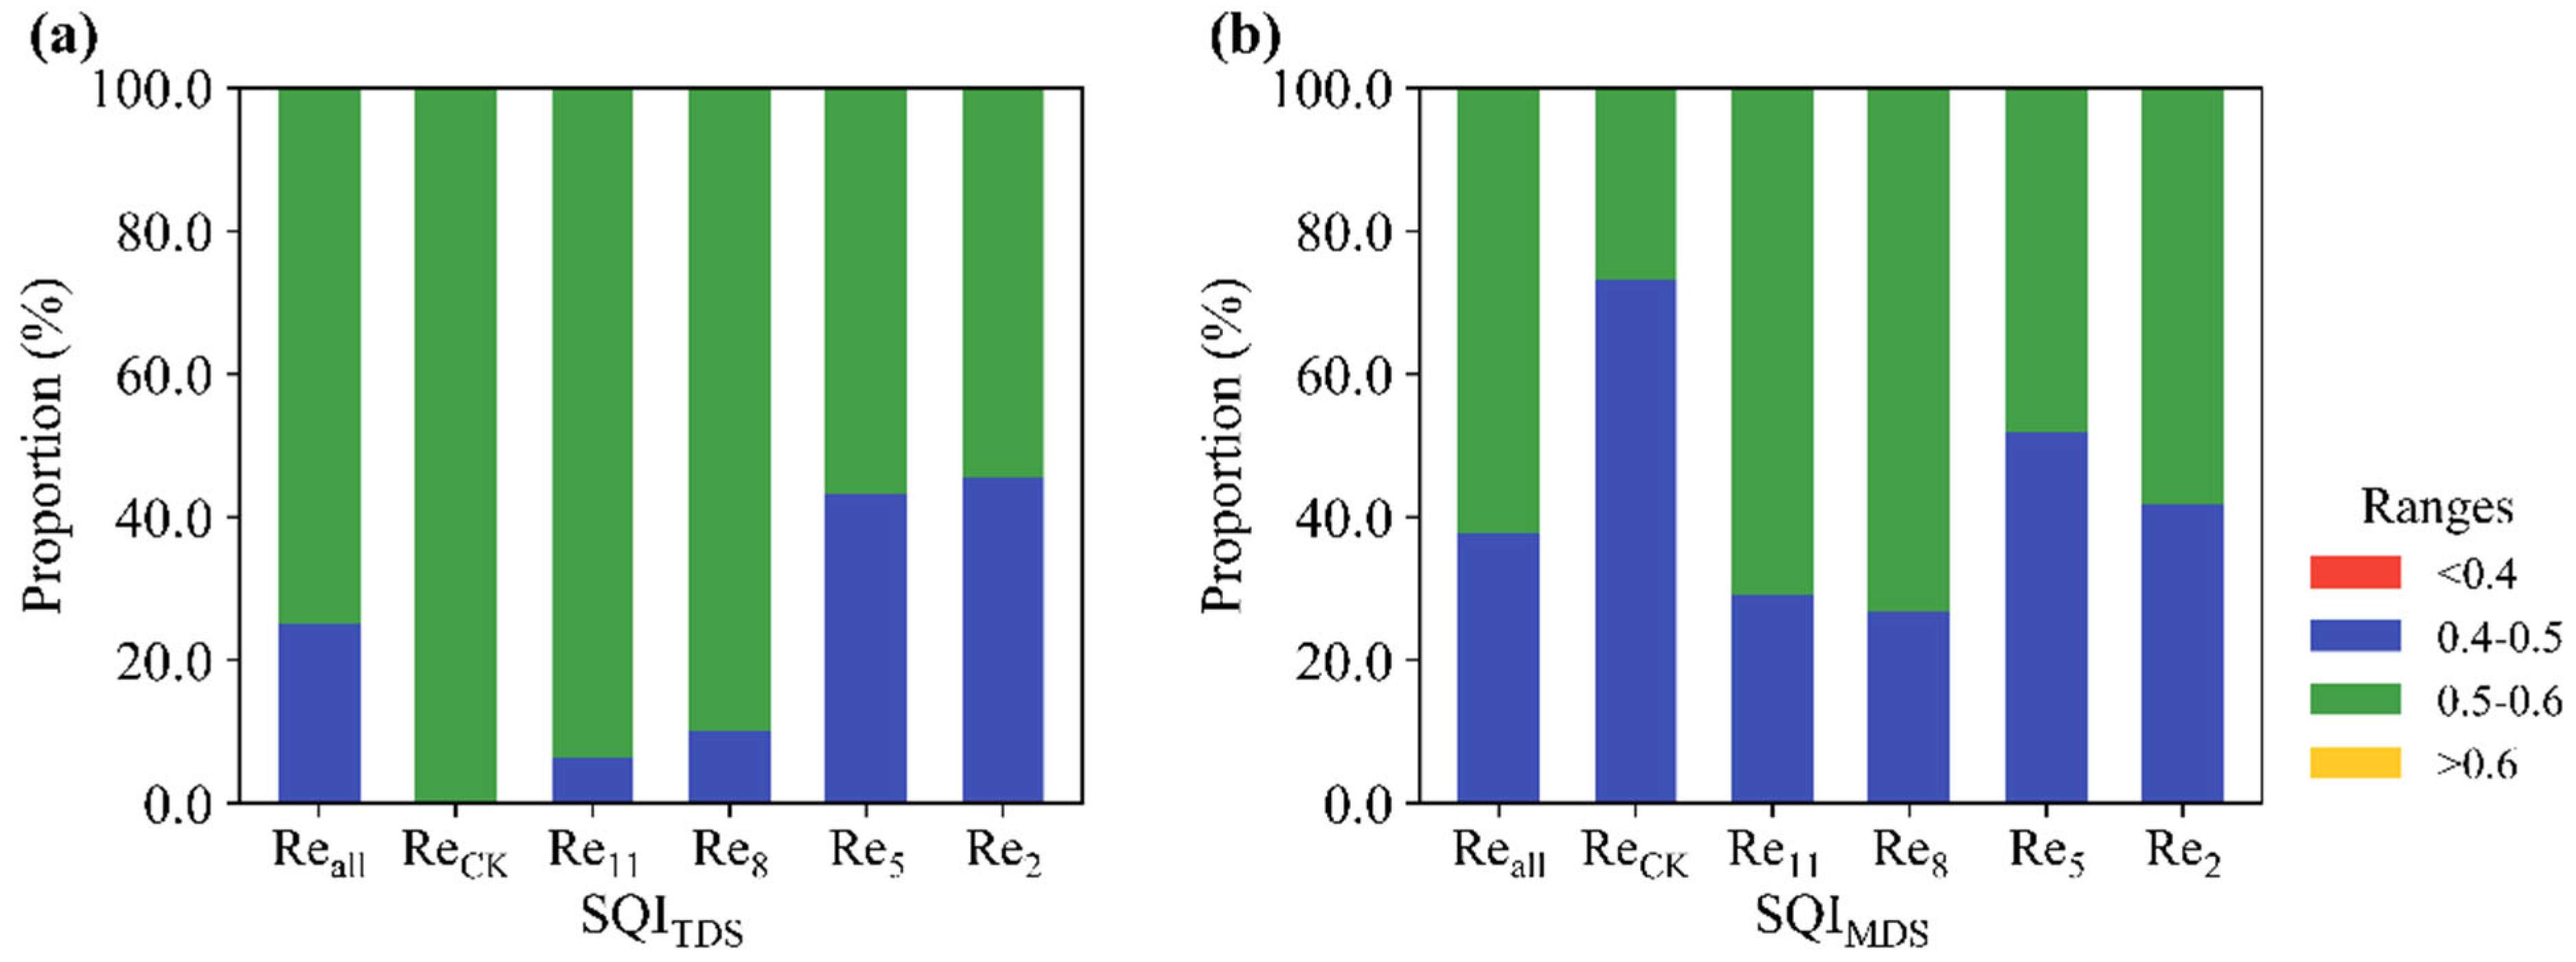
Further analysis of SQI value distributions across reclamation zones (Figure 6) revealed that most SQITDS values were concentrated between 0.4 and 0.6. The CK area exhibited SQI values entirely within the 0.5–0.6 range. As reclamation duration increased, the proportion of SQI values in reclaimed zones within the 0.5–0.6 range rose from 54.5% to 93.5%. This increase accelerated during the 5–8-year period and slowed thereafter (8–11 years), suggesting a rapid initial improvement in soil quality, followed by gradual stabilization. The distribution patterns of SQIMDS closely mirrored those of SQITDS, with most values also concentrated between 0.4 and 0.6.
In summary, the SQI analysis demonstrated significant soil quality improvement with prolonged reclamation. While SQITDS and SQIMDS exhibited minor numerical differences, both indices consistently reflected progressive soil quality enhancement over time. Notably, soil quality variability stabilized in zones with longer reclamation histories, underscoring the positive impact of reclamation measures and management practices.

4.2. DRDI Characteristics of Reclaimed Areas

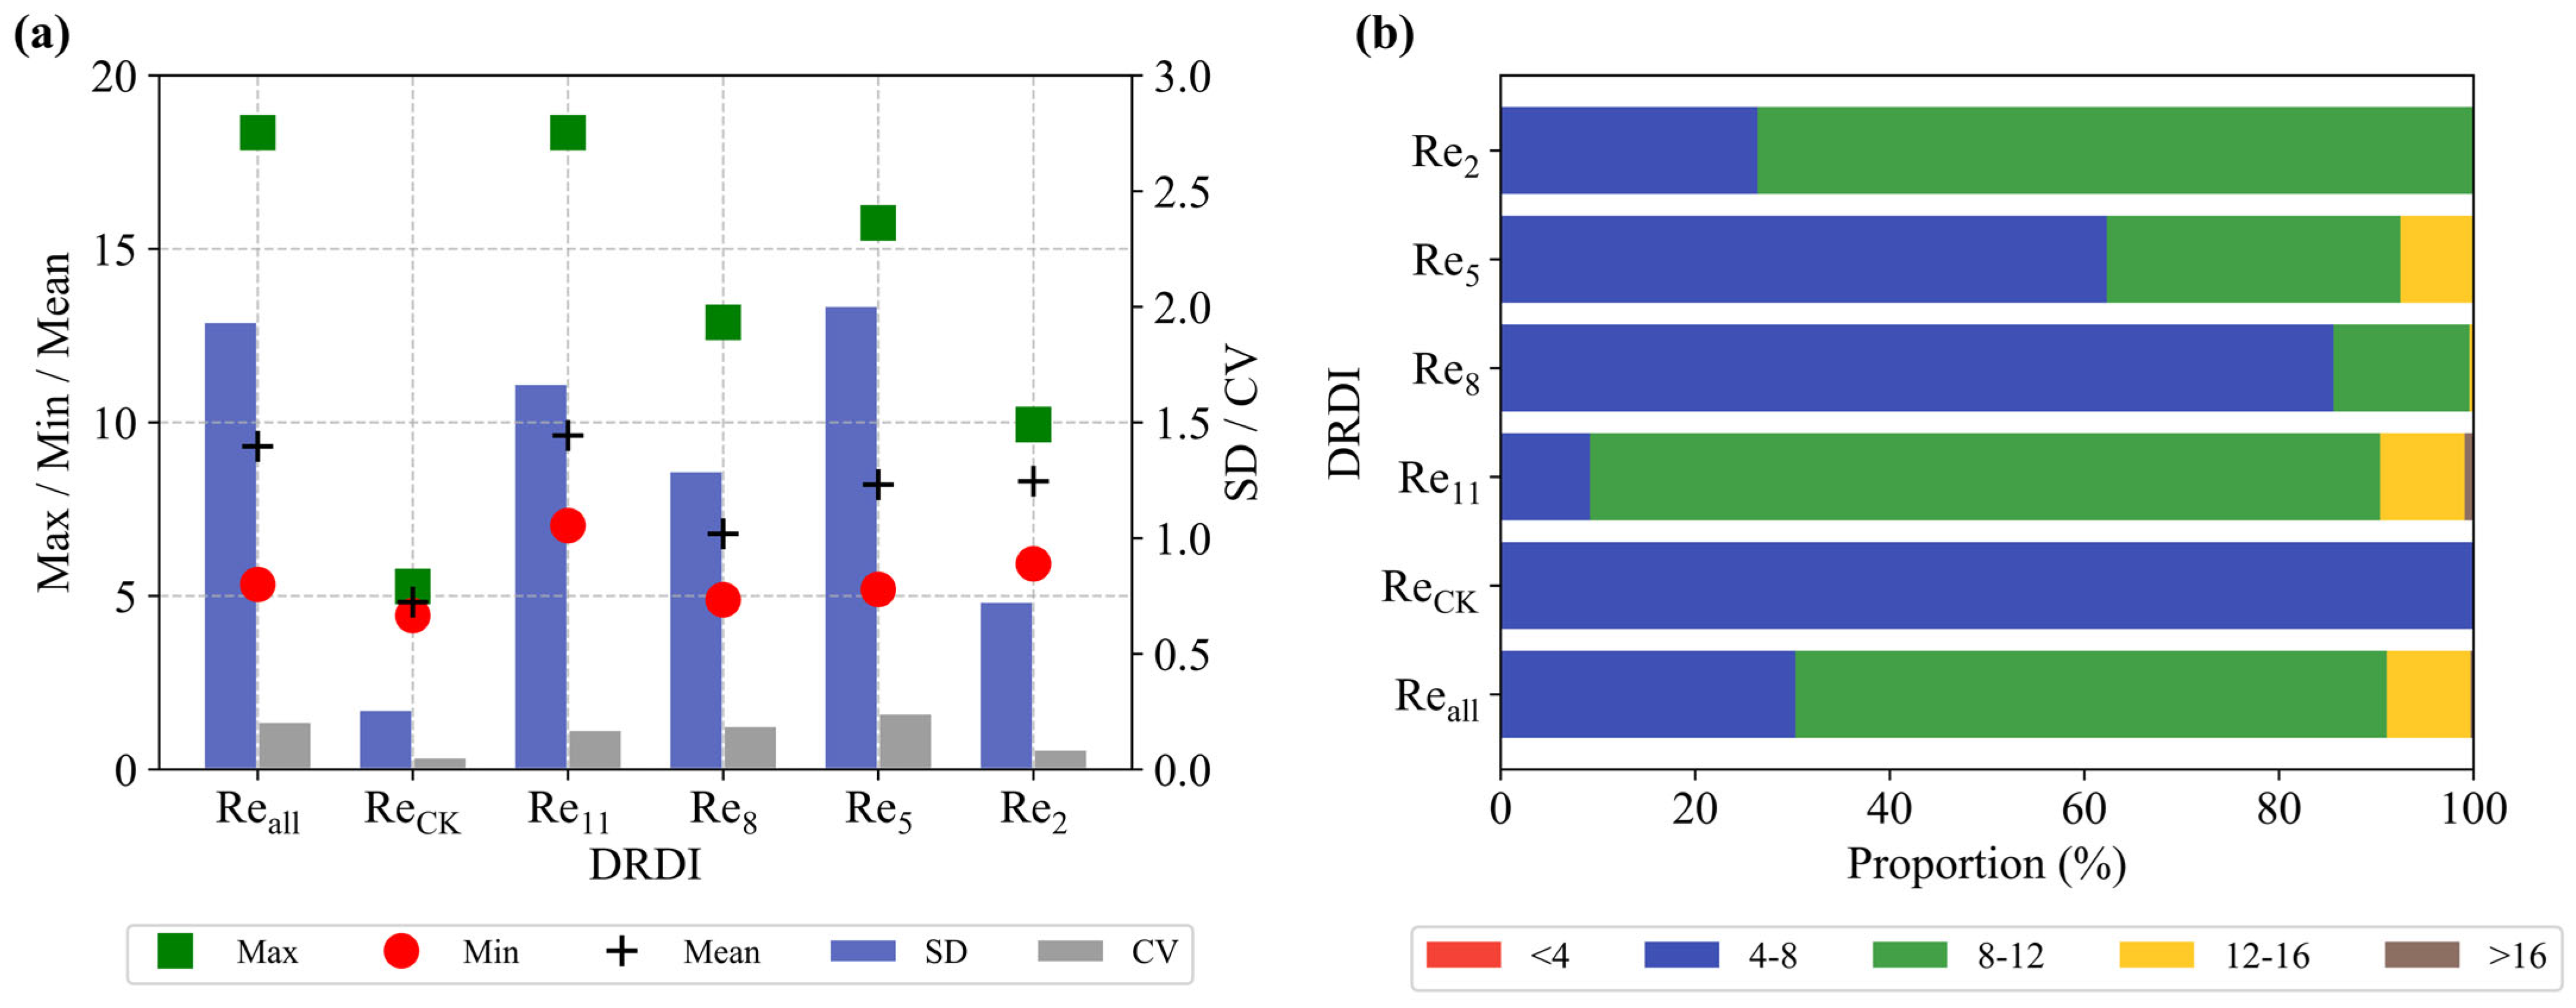
The statistical analysis of the DRDI indices across reclamation zones is presented in Figure 7a. In zones with identical vegetation configurations (Re8, Re5, and Re2), the vegetation status exhibited a transitional trend with increasing reclamation duration. The mean DRDI value in the CK area was significantly lower than in reclaimed zones, indicating stable vegetation conditions without human interventions. In Re11, which is dominated by tree plantations, the transpiration and shading effects of trees moderately reduced LST, resulting in higher LST and consequently elevated DRDI values compared to other zones.
While higher mean DRDI values generally corresponded to greater SD and CV, this relationship was not consistent across all zones. Reck and Re2 displayed more stable data with lower variability. In Reck, this stability likely reflects a balance between natural recovery and vegetation growth, whereas in Re2, it may be attributed to the shorter reclamation period and stronger influence of management practices rather than natural processes.
A further analysis of DRDI value distributions (Figure 7b) revealed that most reclaimed zones exhibited DRDI values between 4 and 12, while the CK area consistently fell within the 4–8 range. Higher DRDI values indicate poorer vegetation conditions, and vice versa. Under identical vegetation configurations (Re8, Re5, and Re2), the proportion of DRDI values within the 4–8 range decreased from 85.6% to 26.4% with increasing reclamation time. This decline accelerated during the 2–5 year-period, though overall vegetation conditions improved over time.
The CK area exhibited poorer vegetation conditions, likely due to the dominance of weeds. In contrast, Re11, characterized by a mix of trees (e.g., almond and pine), shrubs (e.g., buckthorn), and grasses (e.g., acacia and hyacinth), had only 9.2% of DRDI values within the 4–8 range, which is significantly lower than the CK area.

4.3. ECDI Characteristics of Reclaimed Areas

The statistical analysis of the ECDI across reclamation zones is presented in Figure 8a. With increasing reclamation duration, the ECDI index exhibited a declining trend, indicating a significant reduction in fly ash content and improved environmental quality. As mining and reclamation activities progressed, fly ash content was higher in areas closer to the pit and lower in areas farther away, a pattern consistent with our findings.
The CK area displayed higher ECDI values compared to reclaimed zones, likely due to its lower elevation. Across the study area, the average SD of ECDI was 0.218, with higher CV and SD values observed in reclaimed zones than in the CK area. This suggests greater variability and data dispersion in reclaimed zones, potentially attributable to uneven reclamation management, varying progress across zones, and differences in reclamation measures. Particularly in early reclamation stages, significant disparities in land quality and environmental conditions contributed to inconsistent index distributions.
A further analysis of ECDI value distributions (Figure 8b) revealed that most reclaimed zones exhibited dispersed ECDI values primarily within the 1.2–1.6 range. In contrast, the CK area showed ECDI values concentrated between 1.4 and 1.6. As the reclamation duration increased, the proportion of ECDI values within the 1.4–1.6 range decreased from 58.7% to 16.4%, demonstrating substantial environmental quality improvement with advancing mining and reclamation activities.

4.4. CEQI Characteristics of Reclaimed Areas

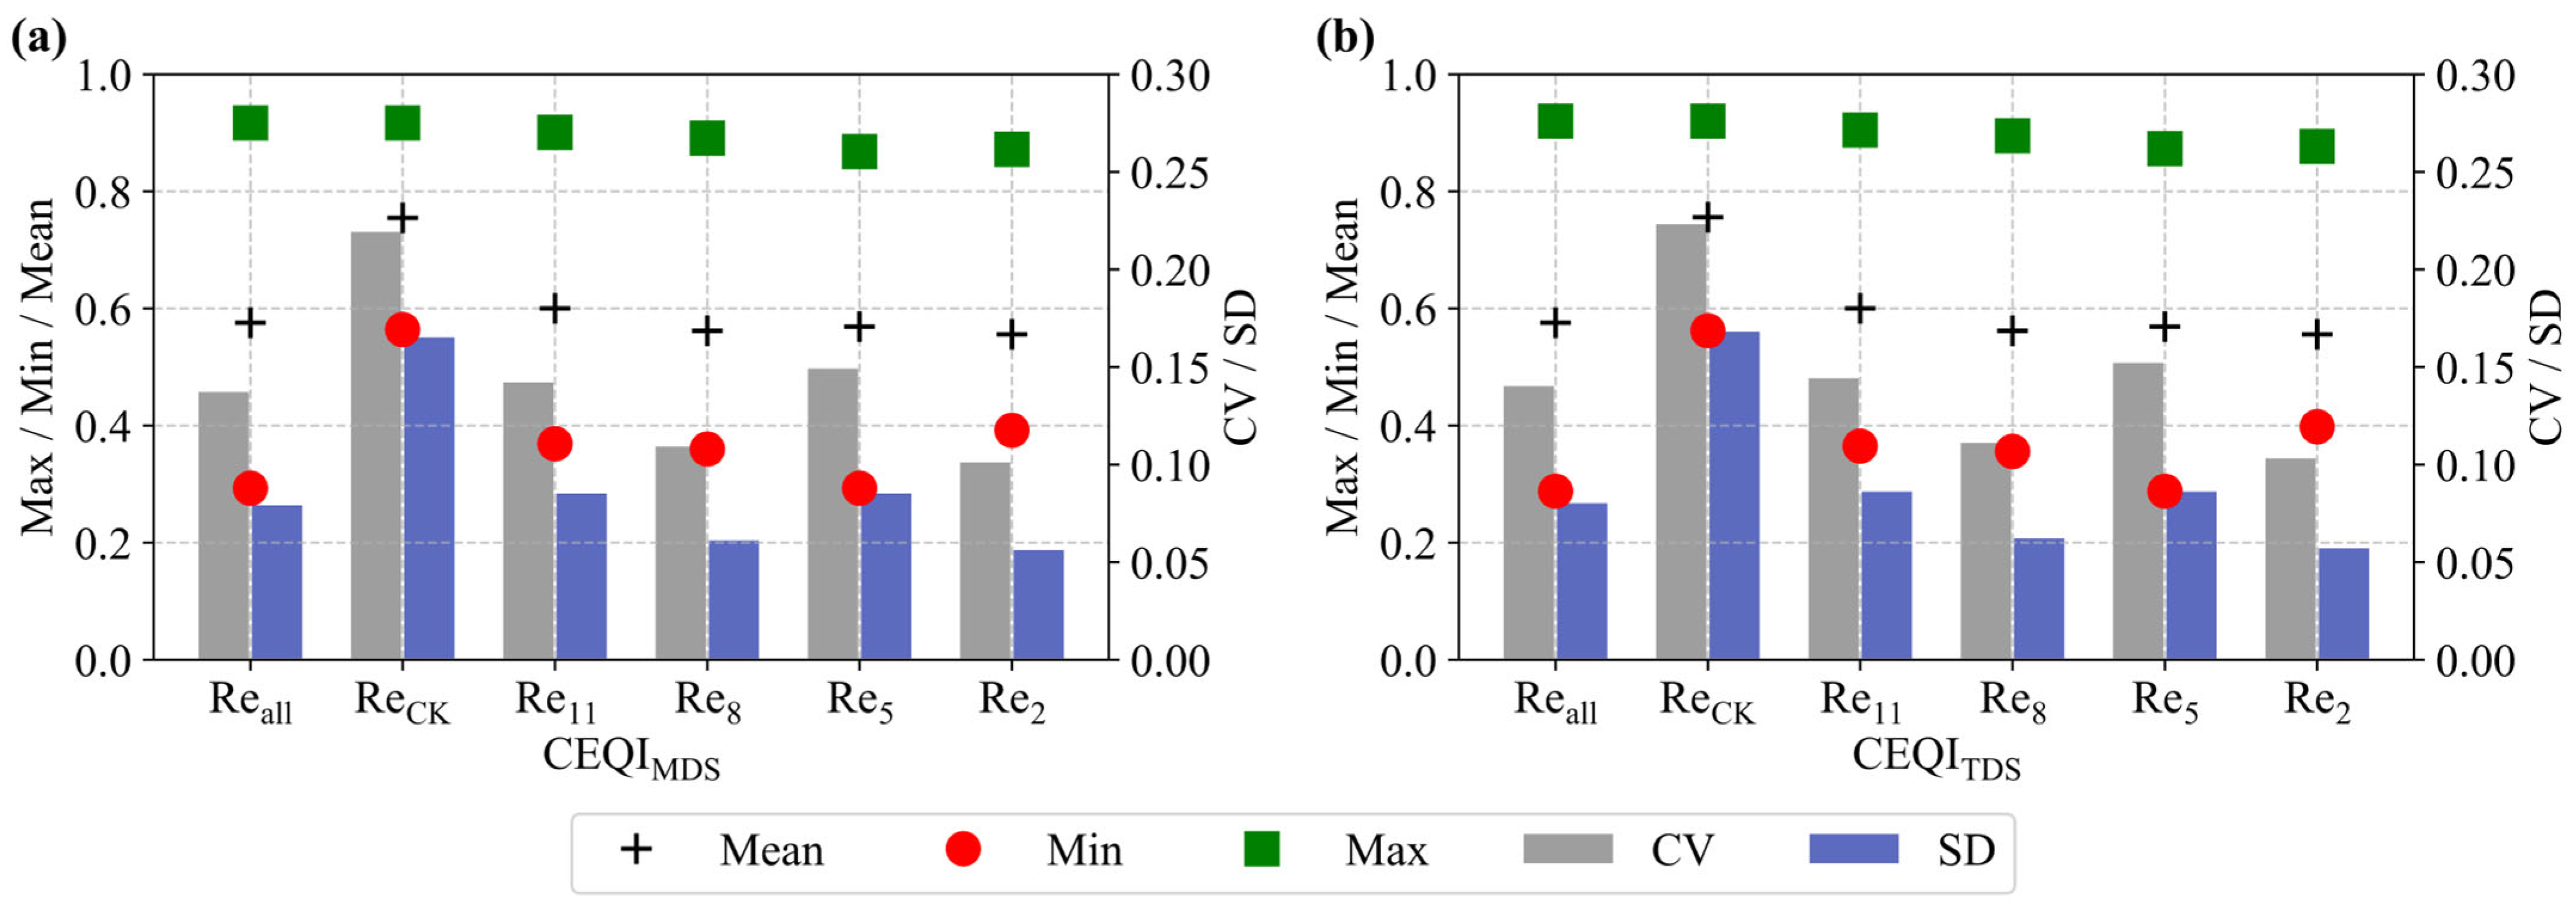
The CEQI, calculated using a weighting ratio of 0.38:0.47:0.15 for SQI, ECDI, and DRDI, was statistically analyzed across reclamation zones (Figure 9). The results demonstrate that prolonged reclamation duration led to overall improvements in soil quality, vegetation status, and environmental conditions, though differences persisted compared to the CK area.
A comprehensive assessment of reclamation effectiveness requires integrating multiple factors rather than evaluating vegetation or soil quality in isolation. When considering soil quality alone, reclaimed zones exhibited progressive improvement over time, surpassing the CK area. In contrast, vegetation conditions in tree-dominated zones were poorer than in shrub-dominated zones, and despite gradual improvements with reclamation duration, vegetation in reclaimed zones remained inferior to the CK area. Environmental conditions improved steadily with ongoing mining and reclamation activities.
Notably, the higher weighting of ECDI reduced the numerical differences between the TDS and MDS. While MDS exhibited smoother trends than TDS, both indices displayed consistent patterns, confirming that MDS can effectively replace TDS in constructing the CEQI.
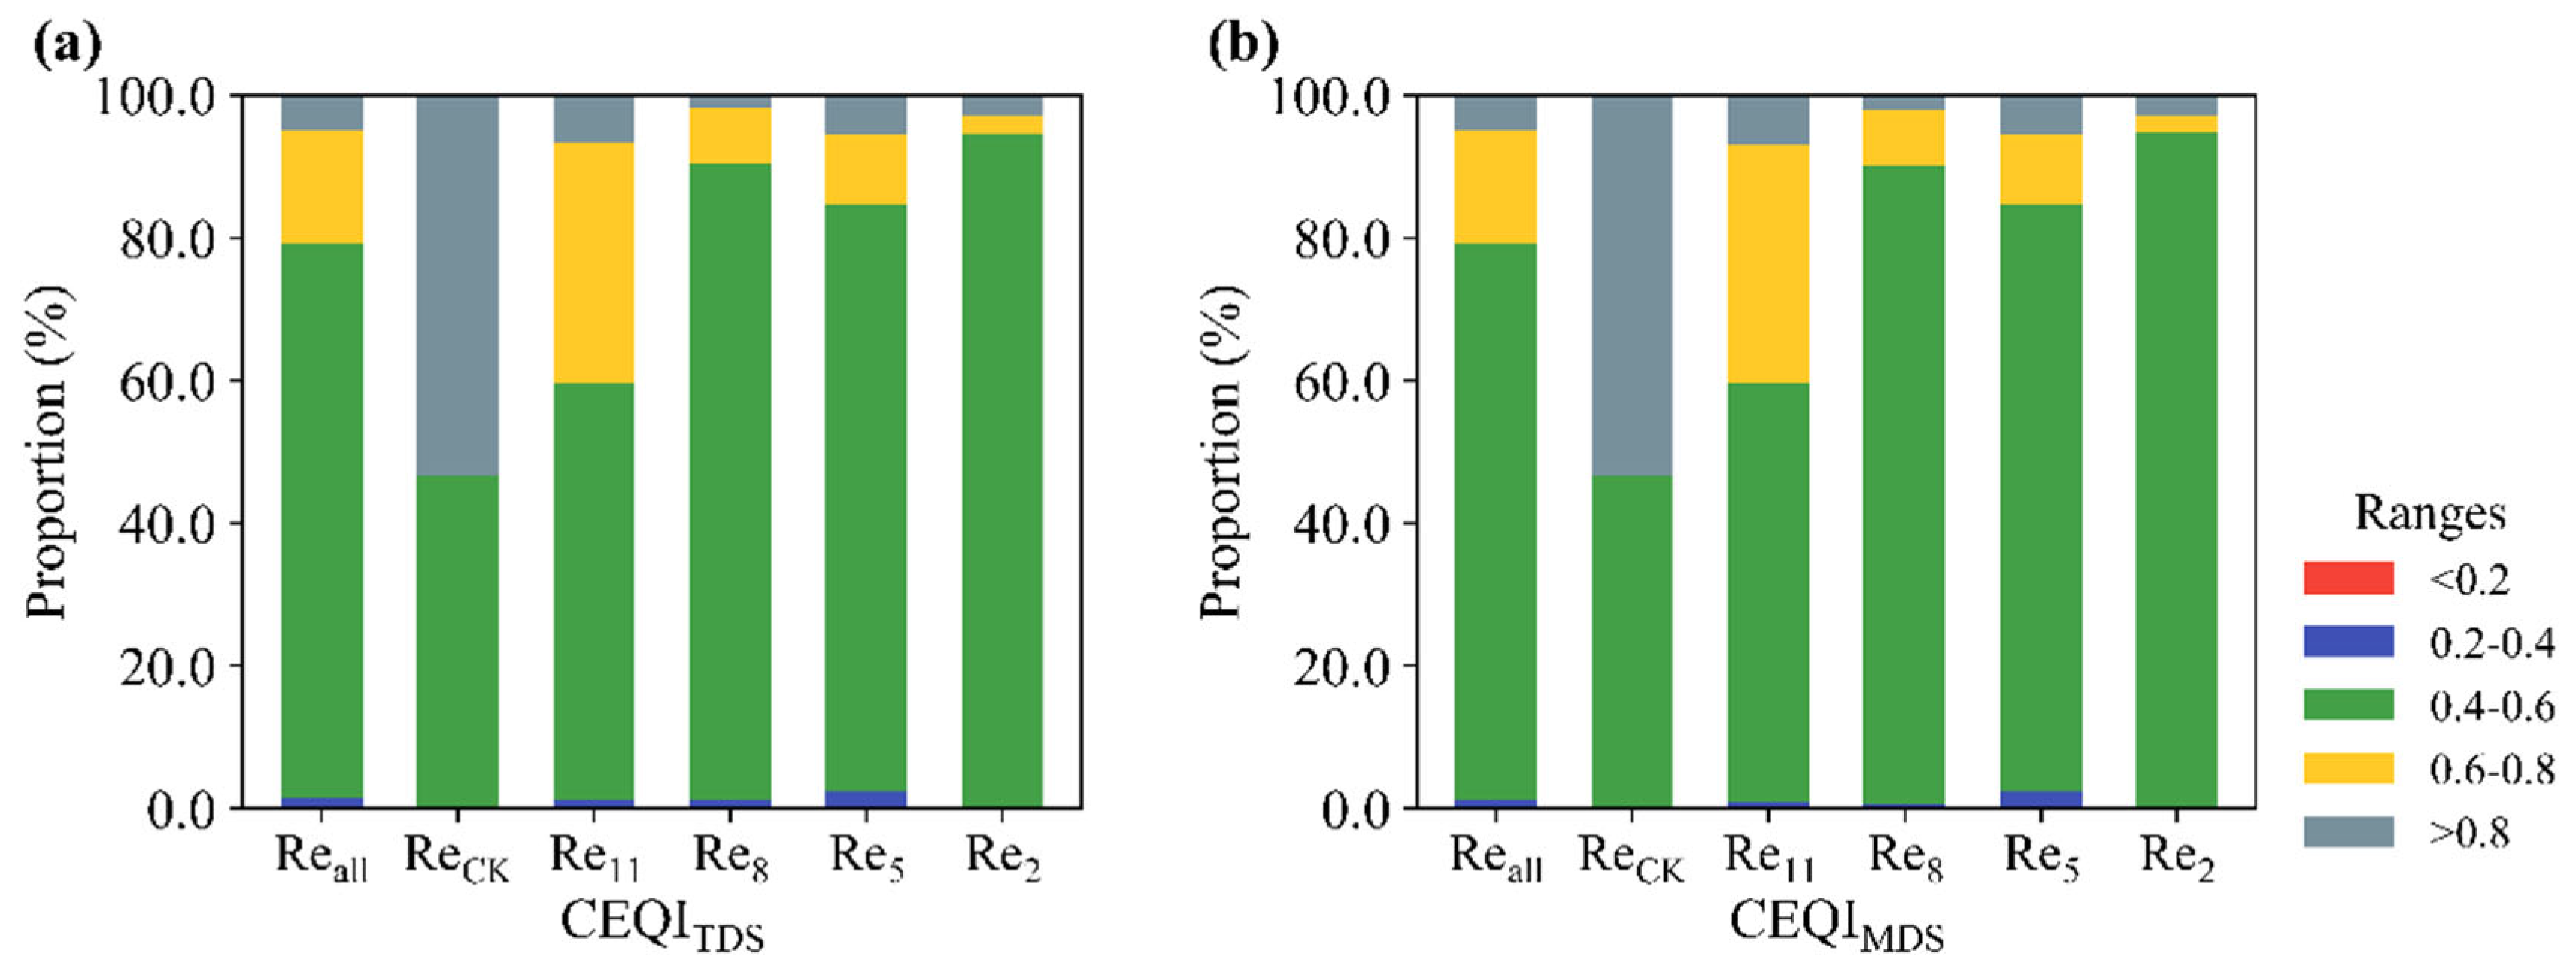
The distribution of CEQI values, calculated using both CEQITDS and CEQIMDS, was compared across reclamation zones (Figure 10). The CK area exhibited higher overall CEQI values compared to reclaimed zones, with 53.3% of values exceeding 0.8, a percentage significantly higher than the corresponding proportions in reclaimed zones. This indicates superior soil quality and ecological conditions in the CK area, while reclaimed zones demonstrated slower progress in soil and environmental improvement.
Over time, CEQI values in reclaimed zones showed gradual growth, though the rate of improvement decelerated with increasing reclamation duration. For example, in Re2, both CEQITDS and CEQIMDS values were predominantly concentrated in the 0.4–0.6 range, with only 2.8% exceeding 0.8. This suggests partial soil and ecological improvement in Re2, though overall conditions remained inferior to those of the CK area. In Re2 and Re5, CEQI distributions were similar, reflecting comparable reclamation progress. In Re8, most values fell within the 0.4–0.6 range, with a low proportion exceeding 0.8, but the smoother distribution indicated more significant advancements in vegetation restoration and soil improvement.
A further analysis of CEQITDS and CEQIMDS distributions revealed consistent trends across regions. Minor differences, such as slightly higher CEQIMDS values in Re2, did not alter the overall alignment between the two indices. This consistency demonstrates that both TDS and MDS can effectively construct CEQI, yielding highly comparable spatial assessments of soil quality and environmental improvement in reclaimed zones.
These findings underscore the effectiveness of reclamation measures in enhancing soil quality, restoring vegetation, and improving environmental conditions. However, regional disparities persist and are influenced by factors such as reclamation start time, management practices, and climatic conditions. To comprehensively evaluate reclamation effectiveness, a multidimensional analytical approach is essential, integrating diverse environmental factors and land management strategies to derive precise and reliable conclusions.

5. Discussion

Soil quality, vegetation restoration, and ecological environment changes are critical factors in evaluating reclamation effectiveness. This study further validates the significant influence of these factors on reclamation outcomes. By integrating multiple indicators into a comprehensive assessment system, this study provides a holistic perspective on the spatial and temporal patterns of reclamation effects, offering new insights and deepening previous research.
Soil properties serve as direct indicators of land reclamation progress [43,44]. The rate of soil improvement is closely linked to reclamation duration, with faster recovery observed in the early stages and a gradual flattening of improvement rates over time. This pattern may result from the combined effects of changes in soil physicochemical properties and the positive influence of vegetation restoration. Vegetation restoration, a primary driver of soil quality enhancement, is also shaped by climatic conditions, vegetation types, and reclamation methods [45,46]. Trees exhibit slower but more sustained recovery, while shrubs show rapid early-stage improvement. Vegetation species and cover effectively indicate ecosystem stability and biodiversity [47,48]. Additionally, reductions in coal dust, changes in surface temperature, and improvements in moisture regulation are key indicators of enhanced ecosystem quality. However, ecological environment changes are influenced by multiple factors, including land use patterns, mining management practices, and external conditions (e.g., precipitation and temperature fluctuations), leading to some variability in their indicative value for reclamation effects. By constructing a comprehensive assessment index system, this study effectively reveals the spatial and temporal patterns of reclamation effects, providing a valuable foundation for optimizing land reclamation strategies.
Despite these contributions, this study is subject to several limitations related to methods, data, and conclusions, which may affect the generalizability and accuracy of the findings.
From a methodological perspective, although multiple methods were employed to assess land reclamation effectiveness, certain limitations remain. For instance, the construction of the soil quality index (SQI) relied on principal component analysis (PCA) and Minimum Data Set (MDS) approaches. While effective, these methods are inherently influenced by data availability and site-specific environmental conditions, which may restrict the transferability of the SQI to other regions with differing soil or climate characteristics [49,50]. Additionally, remote sensing indicators such as the land surface temperature (LST) and the Enhanced Vegetation Index (EVI), which are derived from Landsat 8 imagery, are limited by their spatial and temporal resolution. This may reduce the sensitivity of monitoring small-scale vegetation changes or short-term ecological responses, particularly in fragmented or heterogeneous landscapes [51,52].
To address temporal limitations in long-term monitoring, this study applied the space-for-time substitution strategy. While this method facilitates trend inference in the absence of multi-year data, it is also subject to limitations. Differences in micro-environmental factors across sites may compromise comparability, and the method does not fully capture the continuous temporal evolution at individual locations.
Finally, surface soil indicators such as soil moisture (SM) and heavy metal content (e.g., Pb) exhibit strong spatial heterogeneity, which is influenced by fluctuations in precipitation, temperature, and land use. These factors add further uncertainty to the interpretation of reclamation effects. Sudden weather events and seasonal shifts can also cause transient surface changes, affecting the accuracy of remote sensing-derived indices such as NDVI and LST.
In summary, this study’s conclusions may be influenced by (1) the regional dependence and variable selection in SQI construction, (2) the limited spatial–temporal resolution and potential gaps in remote sensing data, (3) the omission of terrain elevation effects on LST interpretation, and (4) inherent assumptions and trade-offs in the space-for-time substitution approach. Future research should aim to reduce these uncertainties by incorporating higher-resolution imagery, increasing sampling density and frequency, applying topographic corrections, and establishing long-term observation plots to improve reliability and extend applicability.

6. Conclusions

In this study, we developed a CEQI that integrates SQIMDS, DRDI, and ECDI to assess spatial and temporal patterns during the reclamation of surface coal mines. By addressing critical challenges in ecosystem trajectory prediction and indicator selection, we present the following key findings:
The reclamation duration significantly enhanced soil quality, with SQIMDS during the Re2–Re11 stages increasing by approximately 17.4% to 26.6% compared to Reck, ensuring consistency with the latest calculation results and avoiding potential misunderstandings. Spatial analysis using IDW revealed the gradual homogenization of key soil parameters (e.g., heavy metals and pH), with pH: ubRMSE < 0.01. These results validate the MDS as a reliable alternative for large-scale degradation monitoring (coefficient of determination, R2: 0.5–0.77).
With increasing reclamation duration, vegetation cover gradually improved, but structural complexity influenced the restoration rates. Tree-dominated systems (Re11) exhibited slower DRDI growth (ΔDRDI = 0.44) but demonstrated higher erosion resistance. In contrast, mixed shrub–herb systems (Re5/Re8) showed rapid initial recovery (ΔDRDI = 0.24–0.67) but required intensive irrigation in arid areas, highlighting the importance of species selection tailored to environmental conditions.
The decline in ECDI values indicated effective fly ash reduction, although contamination hotspots persisted near excavated pits. Volatility analysis (coefficient of variation, CV < 15%) linked these patterns to inconsistent reclamation practices, emphasizing the need for topographic redesign (e.g., slopes < 25°) and enhanced soil amendments, such as biochar, in high-risk areas.
The CEQI framework demonstrated synergies between soil and environmental restoration (ΔCEQI = 0.01–0.1). However, a 23.8% gap between reclaimed and natural areas (CK) was observed, underscoring the need for further optimization of reclamation strategies.
This study has certain limitations regarding the spatial and temporal resolution of remote sensing data, data reliability, and the inclusion of key variables. Future research could reduce these uncertainties and further improve the accuracy of the study by enhancing the resolution of remote sensing data, considering elevation effects, and incorporating long-term monitoring.

Author Contributions

Y.T. and Y.Z. conceived the work; Y.T. performed the analysis with inputs from H.R. and Z.H.; the research data were provided by Z.L., Y.S., and M.H.; the initial draft of the manuscript was written by Y.T. All authors have read and agreed to the published version of the manuscript.

Funding

This research was funded by the National Natural Science Foundation of China (No. 420701250).

Data Availability Statement

The publicly available datasets used in this study are indicated in the text with their sources and access links. The raw sampling data supporting the conclusions of this article will be made available by the authors on request.

Acknowledgments

Thanks to the editor and all reviewers for their valuable comments.

Conflicts of Interest

The authors declare no conflicts of interest.

Abbreviations

The following abbreviations are used in this manuscript:
SQI Soil Quality Index
CKControl Area
MDS Minimum Data Set
TDSTotal Data Set
DRDIDump Reclamation Disturbance Index
ECDIEnhanced Coal Dust Index
CEQI Comprehensive Evaluation Quality Index
PCAPrincipal Component Analysis
EVIEnhanced Vegetation Index
LSTLand Surface Temperature
NIRNear-Infrared
SWIR1Short-Wave Infrared 1
SWIR2Short-Wave Infrared 2
IDWInverse Distance Weight

References

  1. Gao, Z. Sustainable Development and Upgrading Mode of Coal Industry in China. Int. J. Min. Sci. Technol. 2012, 22, 335–340. [Google Scholar] [CrossRef]
  2. Li, Z.; Zhang, J.; Chen, H.; Shi, X.; Zhang, Y.; Zhang, Y. A Safe and Efficient Mining Method with Reasonable Stress Release and Surface Ecological Protection. Sustainability 2022, 14, 5348. [Google Scholar] [CrossRef]
  3. Wang, G.; Deng, J.; Zhang, Y.; Zhang, Q.; Duan, L.; Jiang, J.; Hao, J. Air Pollutant Emissions from Coal-Fired Power Plants in China over the Past Two Decades. Sci. Total Environ. 2020, 741, 140326. [Google Scholar] [CrossRef]
  4. Wang, W.; Zhang, C. Evaluation of Relative Technological Innovation Capability: Model and Case Study for China’s Coal Mine. Resour. Policy 2018, 58, 144–149. [Google Scholar] [CrossRef]
  5. Cao, W.; Bluth, C. Challenges and Countermeasures of China’s Energy Security. Energy Policy 2013, 53, 381–388. [Google Scholar] [CrossRef]
  6. Alemayehu, E.; Chala, E.T.; Jilo, N.Z.; Tiyasha, T.; Moges, B. Optimizing Design and Stability of Open Pit Slopes in Tolay Coal Mine, Ethiopia. Sci. Rep. 2025, 15, 1570. [Google Scholar] [CrossRef]
  7. Wang, Z.; Zhou, W.; Jiskani, I.M.; Yan, J.; Luo, H. Optimizing Open-Pit Coal Mining Operations: Leveraging Meteorological Conditions for Dust Removal and Diffusion. Int. J. Coal Sci. Technol. 2024, 11, 54. [Google Scholar] [CrossRef]
  8. Chen, Z.; Yang, Y.; Zhou, L.; Hou, H.; Zhang, Y.; Liang, J.; Zhang, S. Ecological Restoration in Mining Areas in the Context of the Belt and Road Initiative: Capability and Challenges. Environ. Impact Assess. Rev. 2022, 95, 106767. [Google Scholar] [CrossRef]
  9. Yang, W.; Mu, Y.; Zhang, W.; Wang, W.; Liu, J.; Peng, J.; Liu, X.; He, T. Assessment of Ecological Cumulative Effect Due to Mining Disturbance Using Google Earth Engine. Remote Sens. 2022, 14, 4381. [Google Scholar] [CrossRef]
  10. Shi, Z.; Bai, Z.; Guo, D.; Li, S.; Chen, M. Species Diversity and Soil Interconstraints Exert Significant Influences on Plant Survival during Ecological Restoration in Semi-Arid Mining Areas. Diversity 2023, 15, 1100. [Google Scholar] [CrossRef]
  11. Xu, Y.; Guo, L.; Li, J.; Zhang, C.; Ran, W.; Hu, J.; Mao, H. Automatically Identifying the Vegetation Destruction and Restoration of Various Open-Pit Mines Utilizing Remotely Sensed Images: Auto-VDR. J. Clean. Prod. 2023, 414, 137490. [Google Scholar] [CrossRef]
  12. Menta, C.; Conti, F.D.; Pinto, S.; Leoni, A.; Lozano-Fondon, C. Monitoring Soil Restoration in an Open-Pit Mine in Northern Italy. Appl. Soil. Ecol. 2014, 83, 22–29. [Google Scholar] [CrossRef]
  13. Han, Y.; Kou, J.; Jiang, B.; Li, J.; Liu, C.; Lei, S.; Xiao, H.; Feng, C. Bryophytes Adapt to Open-Pit Coal Mine Environments by Changing Their Functional Traits in Response to Heavy Metal-Induced Soil Environmental Changes. J. Hazard. Mater. 2025, 482, 136613. [Google Scholar] [CrossRef] [PubMed]
  14. Zhang, L.; Zhai, Z.; Zhou, Y.; Liu, S.; Wang, L. The Landscape Pattern Evolution of Typical Open-Pit Coal Mines Based on Land Use in Inner Mongolia of China during 20 Years. Sustainability 2022, 14, 9590. [Google Scholar] [CrossRef]
  15. Liu, X.; Zhou, W.; Bai, Z. Vegetation Coverage Change and Stability in Large Open-Pit Coal Mine Dumps in China during 1990–2015. Ecol. Eng. 2016, 95, 447–451. [Google Scholar] [CrossRef]
  16. Wang, Y.; Qin, K.; Zhang, Z.; He, Q.; Cohen, J. Mapping Open-Pit Mining Area in Complex Mining and Mixed Land Cover Zone Using Landsat Imagery. Int. J. Appl. Earth Obs. Geoinf. 2024, 129, 103782. [Google Scholar] [CrossRef]
  17. Li, Y.; Zhao, H.; Liu, J.; Chaonan, C.; Yuxuan, G. A Framework for Selecting and Assessing Soil Quality Indicators for Sustainable Soil Management in Waste Dumps. Sci. Rep. 2024, 14, 8491. [Google Scholar] [CrossRef]
  18. Dutta, M.; Saikia, J.; Taffarel, S.R.; Waanders, F.B.; de Medeiros, D.; Cutruneo, C.M.N.L.; Silva, L.F.O.; Saikia, B.K. Environmental Assessment and Nano-Mineralogical Characterization of Coal, Overburden and Sediment from Indian Coal Mining Acid Drainage. Geosci. Front. 2017, 8, 1285–1297. [Google Scholar] [CrossRef]
  19. Zhu, J.; Yang, Z.; Qin, F.; Guo, J.; Zhang, T.; Miao, P. Soil Quality Assessment of Several Kinds of Typical Artificial Forestlands in the Inner Mongolia Basin of the Yellow River. Land 2023, 12, 1024. [Google Scholar] [CrossRef]
  20. Xie, J.; Liu, Y.; Xie, M.; Xia, L.; Yang, R.; Li, J. Exploring the Restoration Stability of Abandoned Open-Pit Mines by Vegetation Resilience Indicator Based on the LandTrendr Algorithm. Ecol. Indic. 2024, 166, 112392. [Google Scholar] [CrossRef]
  21. He, J.; Yan, Z.; Du, Y.; Wang, Z.; Hu, Y.; Wu, L.; Luo, R.; Wang, J.; Zhang, D.; Cao, Y. Identifying Key Indicators for Soil Quality Assessment in Reclaimed Loess Coal Mining Areas of China: A Case Study of the Suancigou Coal Mine, Inner Mongolia. Land Degradation & Development. 2025. [Google Scholar] [CrossRef]
  22. Yuanhe, X.; Xiaojie, Y.; Yongming, W. Techniques Ecological Restoration and Plant Restoration on Spoil Dump of Modern Strip Mine. Sci. Soil. Water Conserv. 2013, 11, 48–54. [Google Scholar] [CrossRef]
  23. Zhu, Q.; Nie, X.; Zhang, Y.; Hu, Z. Herbaceous Plant Species Selection for Ecological Restoration of Coal Gangue Hills in North China. J. Beijing For. Univ. 2021, 43, 90–97. [Google Scholar] [CrossRef]
  24. Zhou, G.; Qi, X. Analysis of Inter-Annual Variation in Land Reclamation Success in Open-pit Mining Dumps in Cold and Arid Regions. Open-Pit Min. Technol. 2023, 38, 28–31. [Google Scholar] [CrossRef]
  25. Wang, S.; Ma, C.; Ma, Y.; Li, T. Monitoring and Evaluation of Ecological Restoration in Open-Pit Coal Mine Using Remote Sensing Data Based on a OM-RSEI Model. Int. J. Min. Reclam. Environ. 2025, 1–23. [Google Scholar] [CrossRef]
  26. Hu, J.; Ye, B.; Bai, Z.; Feng, Y. Remote Sensing Monitoring of Vegetation Reclamation in the Antaibao Open-Pit Mine. Remote Sens. 2022, 14, 5634. [Google Scholar] [CrossRef]
  27. Zhong, A.; Wang, Z.; Zhang, Z.; Hu, C. Remote Sensing Monitoring of Ecological Environment Quality in Mining Areas under the Perspective of Ecological Engineering. Environ. Earth Sci. 2024, 83, 587. [Google Scholar] [CrossRef]
  28. Yu, H.; Zahidi, I.; Liang, D. Mine Land Reclamation, Mine Land Reuse, and Vegetation Cover Change: An Intriguing Case Study in Dartford, the United Kingdom. Environ. Res. 2023, 225, 115613. [Google Scholar] [CrossRef]
  29. Gordon, S.; Xu, X.; Wang, Y. Remote Sensing-Based Revegetation Assessment at Post-Closure Mine Sites in Canada. Sustainability 2023, 15, 11287. [Google Scholar] [CrossRef]
  30. Xu, H.; Xu, F.; Lin, T.; Xu, Q.; Yu, P.; Wang, C.; Aili, A.; Zhao, X.; Zhao, W.; Zhang, P.; et al. A Systematic Review and Comprehensive Analysis on Ecological Restoration of Mining Areas in the Arid Region of China: Challenge, Capability and Reconsideration. Ecol. Indic. 2023, 154, 110630. [Google Scholar] [CrossRef]
  31. Chen, X.; Li, W.; Chen, J.; Rao, Y.; Yamaguchi, Y. A Combination of TsHARP and Thin Plate Spline Interpolation for Spatial Sharpening of Thermal Imagery. Remote Sens. 2014, 6, 2845–2863. [Google Scholar] [CrossRef]
  32. Sattari, F.; Hashim, M.; Sookhak, M.; Banihashemi, S.; Pour, A.B. Assessment of the TsHARP Method for Spatial Downscaling of Land Surface Temperature over Urban Regions. Urban. Clim. 2022, 45, 101265. [Google Scholar] [CrossRef]
  33. Li, H.; Chen, W.; Fu, K.; Zhang, C.; Liang, H. Changes in Soil Quality during Different Ecological Restoration Years in the Abandoned Coal Mine Area of Southern China. Soil. Sci. Soc. Am. J. 2024, 88, 2311–2328. [Google Scholar] [CrossRef]
  34. Guo, S.; Xu, Y.; He, C.; Wu, S.; Ren, C.; Han, X.; Feng, Y.; Ren, G.; Yang, G. Differential Responses of Soil Quality in Revegetation Types to Precipitation Gradients on the Loess Plateau. Agric. For. Meteorol. 2019, 276, 107622. [Google Scholar] [CrossRef]
  35. Peng, J.; Long, L.; Guo, Z.; Wang, J.; Cai, C. Construction of Soil Quality Index and Its Spatial Distribution in Eroded Farmlands of Northeast Black Soil Region. J. Agric. Eng. 2024, 40, 54–64. [Google Scholar]
  36. Li, X.; Wang, D.; Ren, Y.; Wang, Z.; Zhou, Y. Soil Quality Assessment of Croplands in the Black Soil Zone of Jilin Province, China: Establishing a Minimum Data Set Model. Ecol. Indic. 2019, 107, 105251. [Google Scholar] [CrossRef]
  37. Andrews, S.S.; Karlen, D.L.; Mitchell, J.P. A Comparison of Soil Quality Indexing Methods for Vegetable Production Systems in Northern California. Agric. Ecosyst. Environ. 2002, 90, 25–45. [Google Scholar] [CrossRef]
  38. Miaomiao, X.; Shuting, G.; Shaoling, L.; Yan, Z.; Zhongke, B.; Yu, Z. Construction and Spatiotemporal Variation of Dump Reclamation Disturbance Index. Trans. Chin. Soc. Agric. Eng. 2019, 35, 258–265. [Google Scholar] [CrossRef]
  39. Yang, J.; Zhang, D. Soil Moisture Estimation with a Remotely Sensed Dry Edge Determination Based on the Land Surface Temperature-Vegetation Index Method. JARS 2019, 13, 024511. [Google Scholar] [CrossRef]
  40. Peng, Q.; Wang, R.; Jiang, Y.; Wu, X. Adaptability of Drought Situation Monitoring in Xinjiang with the NDVI-LST Index. Acta Ecol. Sin. 2018, 38, 4694–4703. [Google Scholar] [CrossRef]
  41. Xia, N.; Hai, W.; Song, G.; Tang, M. Identification and Monitoring of Coal Dust Pollution in Wucaiwan Mining Area, Xinjiang (China) Using Landsat Derived Enhanced Coal Dust Index. PLoS ONE 2022, 17, e0266517. [Google Scholar] [CrossRef]
  42. Krishnan, A.R.; Kasim, M.M.; Hamid, R.; Ghazali, M.F. A Modified CRITIC Method to Estimate the Objective Weights of Decision Criteria. Symmetry 2021, 13, 973. [Google Scholar] [CrossRef]
  43. Huang, Y.; Kuang, X.; Cao, Y.; Bai, Z. The Soil Chemical Properties of Reclaimed Land in an Arid Grassland Dump in an Opencast Mining Area in China. RSC Adv. 2018, 8, 41499–41508. [Google Scholar] [CrossRef]
  44. Cao, Y.; Ai, Z.; Dang, X.; Hou, M.; Liu, H.; Li, Q.; Yao, Y.; Deng, Y.; Zhu, S.; Xiao, L. Effects of Different Reclamation Measures on Soil Quality Restoration in Open-Pit Mines: A Meta-Analysis Based on the Chinese Loess Plateau. Ecol. Eng. 2024, 203, 107257. [Google Scholar] [CrossRef]
  45. Qiu, H.; Zhang, J.; Han, H.; Cheng, X.; Kang, F. Study on the Impact of Vegetation Change on Ecosystem Services in the Loess Plateau, China. Ecol. Indic. 2023, 154, 110812. [Google Scholar] [CrossRef]
  46. Long, Z.; Zhu, H.; Wu, Y.; Ma, Z.; Yu, D.; Bing, H. Aboveground Plant Biomass Drove the Reclamation-Year Dependence of Soil Quality along a 49-Year Vegetation Reclamation Chronosequence. Plant Soil 2024, 1–15. [Google Scholar] [CrossRef]
  47. Kayet, N.; Pathak, K.; Singh, C.P.; Chaturvedi, R.K.; Brahmandam, A.S.V.; Mandal, C. Assessment and Estimation of Coal Dust Impact on Vegetation Using VIs Difference Model and PRISMA Hyperspectral Data in Mining Sites. J. Environ. Manag. 2024, 367, 121935. [Google Scholar] [CrossRef]
  48. Salazar, M.; Bosch-Serra, A.; Estudillos, G.; Poch, R.M. Rehabilitation of Semi-Arid Coal Mine Spoil Bank Soils with Mine Residues and Farm Organic By-Products. Arid Land Res. Manag. 2009, 23, 327–341. [Google Scholar] [CrossRef]
  49. Gómez-Plaza, A.; Martínez-Mena, M.; Albaladejo, J.; Castillo, V.M. Factors Regulating Spatial Distribution of Soil Water Content in Small Semiarid Catchments. J. Hydrol. 2001, 253, 211–226. [Google Scholar] [CrossRef]
  50. Cho, E.; Choi, M. Regional Scale Spatio-Temporal Variability of Soil Moisture and Its Relationship with Meteorological Factors over the Korean Peninsula. J. Hydrol. 2014, 516, 317–329. [Google Scholar] [CrossRef]
  51. Zhou, J.; Sun, W.; Meng, X.; Yang, G.; Ren, K.; Peng, J. Generalized Linear Spectral Mixing Model for Spatial–Temporal–Spectral Fusion. IEEE Trans. Geosci. Remote Sens. 2022, 60, 1–16. [Google Scholar] [CrossRef]
  52. Lei, D.; Zhu, Q.; Li, Y.; Tan, J.; Wang, S.; Zhou, T.; Zhang, L. HPLTS-GAN: A High-Precision Remote Sensing Spatiotemporal Fusion Method Based on Low Temporal Sensitivity. IEEE Trans. Geosci. Remote Sens. 2024, 62, 5407416. [Google Scholar] [CrossRef]
Figure 1. Spatial location of the study area.
Remotesensing 17 01744 g001
Figure 2. Accuracy of IDW interpolation results. (am) represent the interpolation accuracy assessment results for the soil indicators of BD, SM, pH, N, Pb, Zn, Ni, P, K, Hg, clay, sand, and silt.
Remotesensing 17 01744 g002aRemotesensing 17 01744 g002bRemotesensing 17 01744 g002c
Figure 3. Spatial distribution of soil indicators after IDW interpolation. (a–m), respectively, represent the spatial distribution of BD, SM, pH, N, Pb, Zn, Ni, P, K, Hg, clay, sand, and silt.
Remotesensing 17 01744 g003aRemotesensing 17 01744 g003bRemotesensing 17 01744 g003c
Figure 4. Rationality verification of MDS. (af) represent the rationality verification of MDS in the Reall, Reck, Re11, Re8, Re5, and Re2 regions.
Remotesensing 17 01744 g004
Figure 5. Statistics of SQIMDS (a) and SQITDS (b).
Remotesensing 17 01744 g005
Figure 6. Numerical distribution of SQITDS (a) and SQIMDS (b).
Remotesensing 17 01744 g006
Figure 7. DRDI’s statistical characteristics (a) and numerical distribution (b).
Remotesensing 17 01744 g007
Figure 8. ECDI’s statistical characteristics (a) and numerical distribution (b).
Remotesensing 17 01744 g008
Figure 9. Statistics of CEQIMDS (a) and CEQITDS (b).
Remotesensing 17 01744 g009
Figure 10. Numerical distribution of CEQITDS (a) and CEQIMDS (b).
Remotesensing 17 01744 g010
Table 1. Information on different reclamation areas.
Reclaimed
Area
Reclamation
Period
Vegetation
Configurations
Plot Size
(km2)
Re22021~2022Shrubs and Grass0.732
Re52018~2021Shrubs and Grass1.153
Re82015~2018Shrubs and Grass0.786
Re112012~2015Tree, Shrubs, and Grass1.282
CK-Grass-
Table 2. Determination of positive/negative indicators.
FunctionProperties
Positive indicatorsSM (m3/m3), pH, N(g/kg), P (mg/kg), K(mg/kg), Clay (%), and Sand (%)
Negative indicatorsBD (g/cm3), Silt (%), Pb (mg/kg), Zn (mg/kg), Ni (mg/kg), and Hg (mg/kg)
Table 3. Descriptive statistics of the soil properties (0–10 cm) in different reclamation areas.
PropertiesRe2Re5Re8Re11CKReall
BD (g/cm3)Mean1.6581.6271.6211.4691.4801.597
Median1.6781.591.6351.481.4131.606
SD0.1020.1270.1170.1290.1030.065
SM (m3/m3)Mean0.1560.1510.1660.2060.0500.154
Median0.120.1320.1490.210.0470.153
SD0.0810.0540.0560.0580.0110.034
pHMean8.9068.8368.7958.798.8348.831
Median8.8958.8858.788.8008.8008.838
SD0.180.1610.3110.1630.0970.082
N (g/kg)Mean0.3760.3510.3560.3480.3340.358
Median0.3690.3570.3680.3520.3080.357
SD0.0610.0380.0360.0390.0520.021
Pb (mg/kg)Mean26.81330.01923.9533.5825.34027.946
Median25.8529.723.7534.825.30027.709
SD4.9752.6093.3334.011.2052.628
Zn (mg/kg)Mean68.64483.43181.35697.1233.10075.919
Median59.8582.981.0597.532.70078.248
SD20.39613.42416.94919.0146.29612.843
Ni (mg/kg)Mean27.83832.06332.77533.0615.30030.154
Median25.631.831.2533.115.10031.275
SD6.2623.9145.7037.4212.5664.205
P (g/kg)Mean0.360.3960.4110.3590.2760.393
Median0.3580.4060.4060.3640.2850.395
SD0.1280.1070.1060.0690.1090.058
K (g/kg)Mean19.38820.37321.18121.34218.25120.360
Median19.10620.76721.6921.30417.98320.649
SD2.6961.4161.9252.3571.6171.023
Hg (mg/kg)Mean0.0520.0590.0410.060.0510.053
Median0.0450.0560.0380.060.0500.052
SD0.0280.0070.010.010.0040.010
Clay (%)Mean17.89219.38814.48812.978.62616.887
Median19.53220.10214.29912.849.14516.996
SD5.3653.8973.5586.1433.4893.011
Sand (%)Mean25.91924.29828.3821.6521.96724.758
Median26.82624.13228.26221.7121.71125.141
SD6.69712.3079.4354.6693.3554.201
Silt (%)Mean53.97853.88455.02362.8965.93755.982
Median52.20953.07152.32561.8561.85255.370
SD8.61811.63210.337.8815.8774.607
Table 4. Principal component factor loadings and Norm values of soil properties.
PropertiesF1F2F3F4FCNorm Value
BD (g/cm3)−0.3560.7390.308−0.259-2.296
SM (m3/m3)−0.574−0.2380.0870.285-1.720
pH0.715−0.148−0.440−0.03612.714
N (g/kg)0.4690.0500.262−0.39721.307
Pb (mg/kg)0.615−0.3680.4820.42742.726
Zn (mg/kg)0.8540.4420.101−0.04213.768
Ni (mg/kg)0.8260.441−0.022−0.098-3.547
P (g/kg)−0.7450.1440.410−0.22632.912
K (g/kg)−0.7400.0390.3400.22542.719
Hg (mg/kg)0.512−0.3450.5720.424-2.360
Clay (%)−0.230−0.462−0.7420.04031.932
Sand (%)−0.1550.644−0.5240.470-2.042
Silt (%)0.0010.869−0.0250.43522.250
Variance Percentage33.97920.60315.7199.196--
Cumulative Variance Percentage33.97954.58270.30179.497--
Table 5. Commonality and weight of soil properties.
PropertiesTDSMDS
CommonalityWeightCommonalityWeight
BD (g/cm3)0.8350.081--
SM (m3/m3)0.4750.046--
pH0.7270.0700.7380.124
N (g/kg)0.4480.0430.4780.080
Pb (mg/kg)0.9290.0900.6250.105
Zn (mg/kg)0.9360.0910.8550.144
Ni (mg/kg)0.8860.086--
P (g/kg)0.7950.0770.7550.127
K (g/kg)0.7160.0690.7250.122
Hg (mg/kg)0.8880.086--
Clay (%)0.8180.0790.8560.144
Sand (%)0.9350.090--
Silt (%)0.9460.0920.9090.153
Disclaimer/Publisher’s Note: The statements, opinions and data contained in all publications are solely those of the individual author(s) and contributor(s) and not of MDPI and/or the editor(s). MDPI and/or the editor(s) disclaim responsibility for any injury to people or property resulting from any ideas, methods, instructions or products referred to in the content.