
Multi-Granularity Domain-Adaptive Teacher for Unsupervised Remote Sensing Object Detection

 ,
,  ,
,
Abstract
:1. Introduction
- This study proposes a method to improve the detection of remote sensing objects by incorporating three levels of feature alignment and the teacher–student framework.
- A multi-granularity domain-adaptive teacher (MGDAT) method is developed, which designs three modules, including PFA, IMFA and INFA, to be incorporated with the domain-adaptive teacher to map features between the source domain and the target domain. The method helps domain feature alignment while mitigating the adverse effects of complex backgrounds, providing a solution for various RSI interpretation tasks.
- Experimental results show that the proposed method outperforms the state-of-the-art methods in terms of detection accuracy, which has advantages in object detection for varying object sizes and complex backgrounds.
2. Related Work
2.1. Object Detection of RSIs
2.2. DA-Based Object Detection
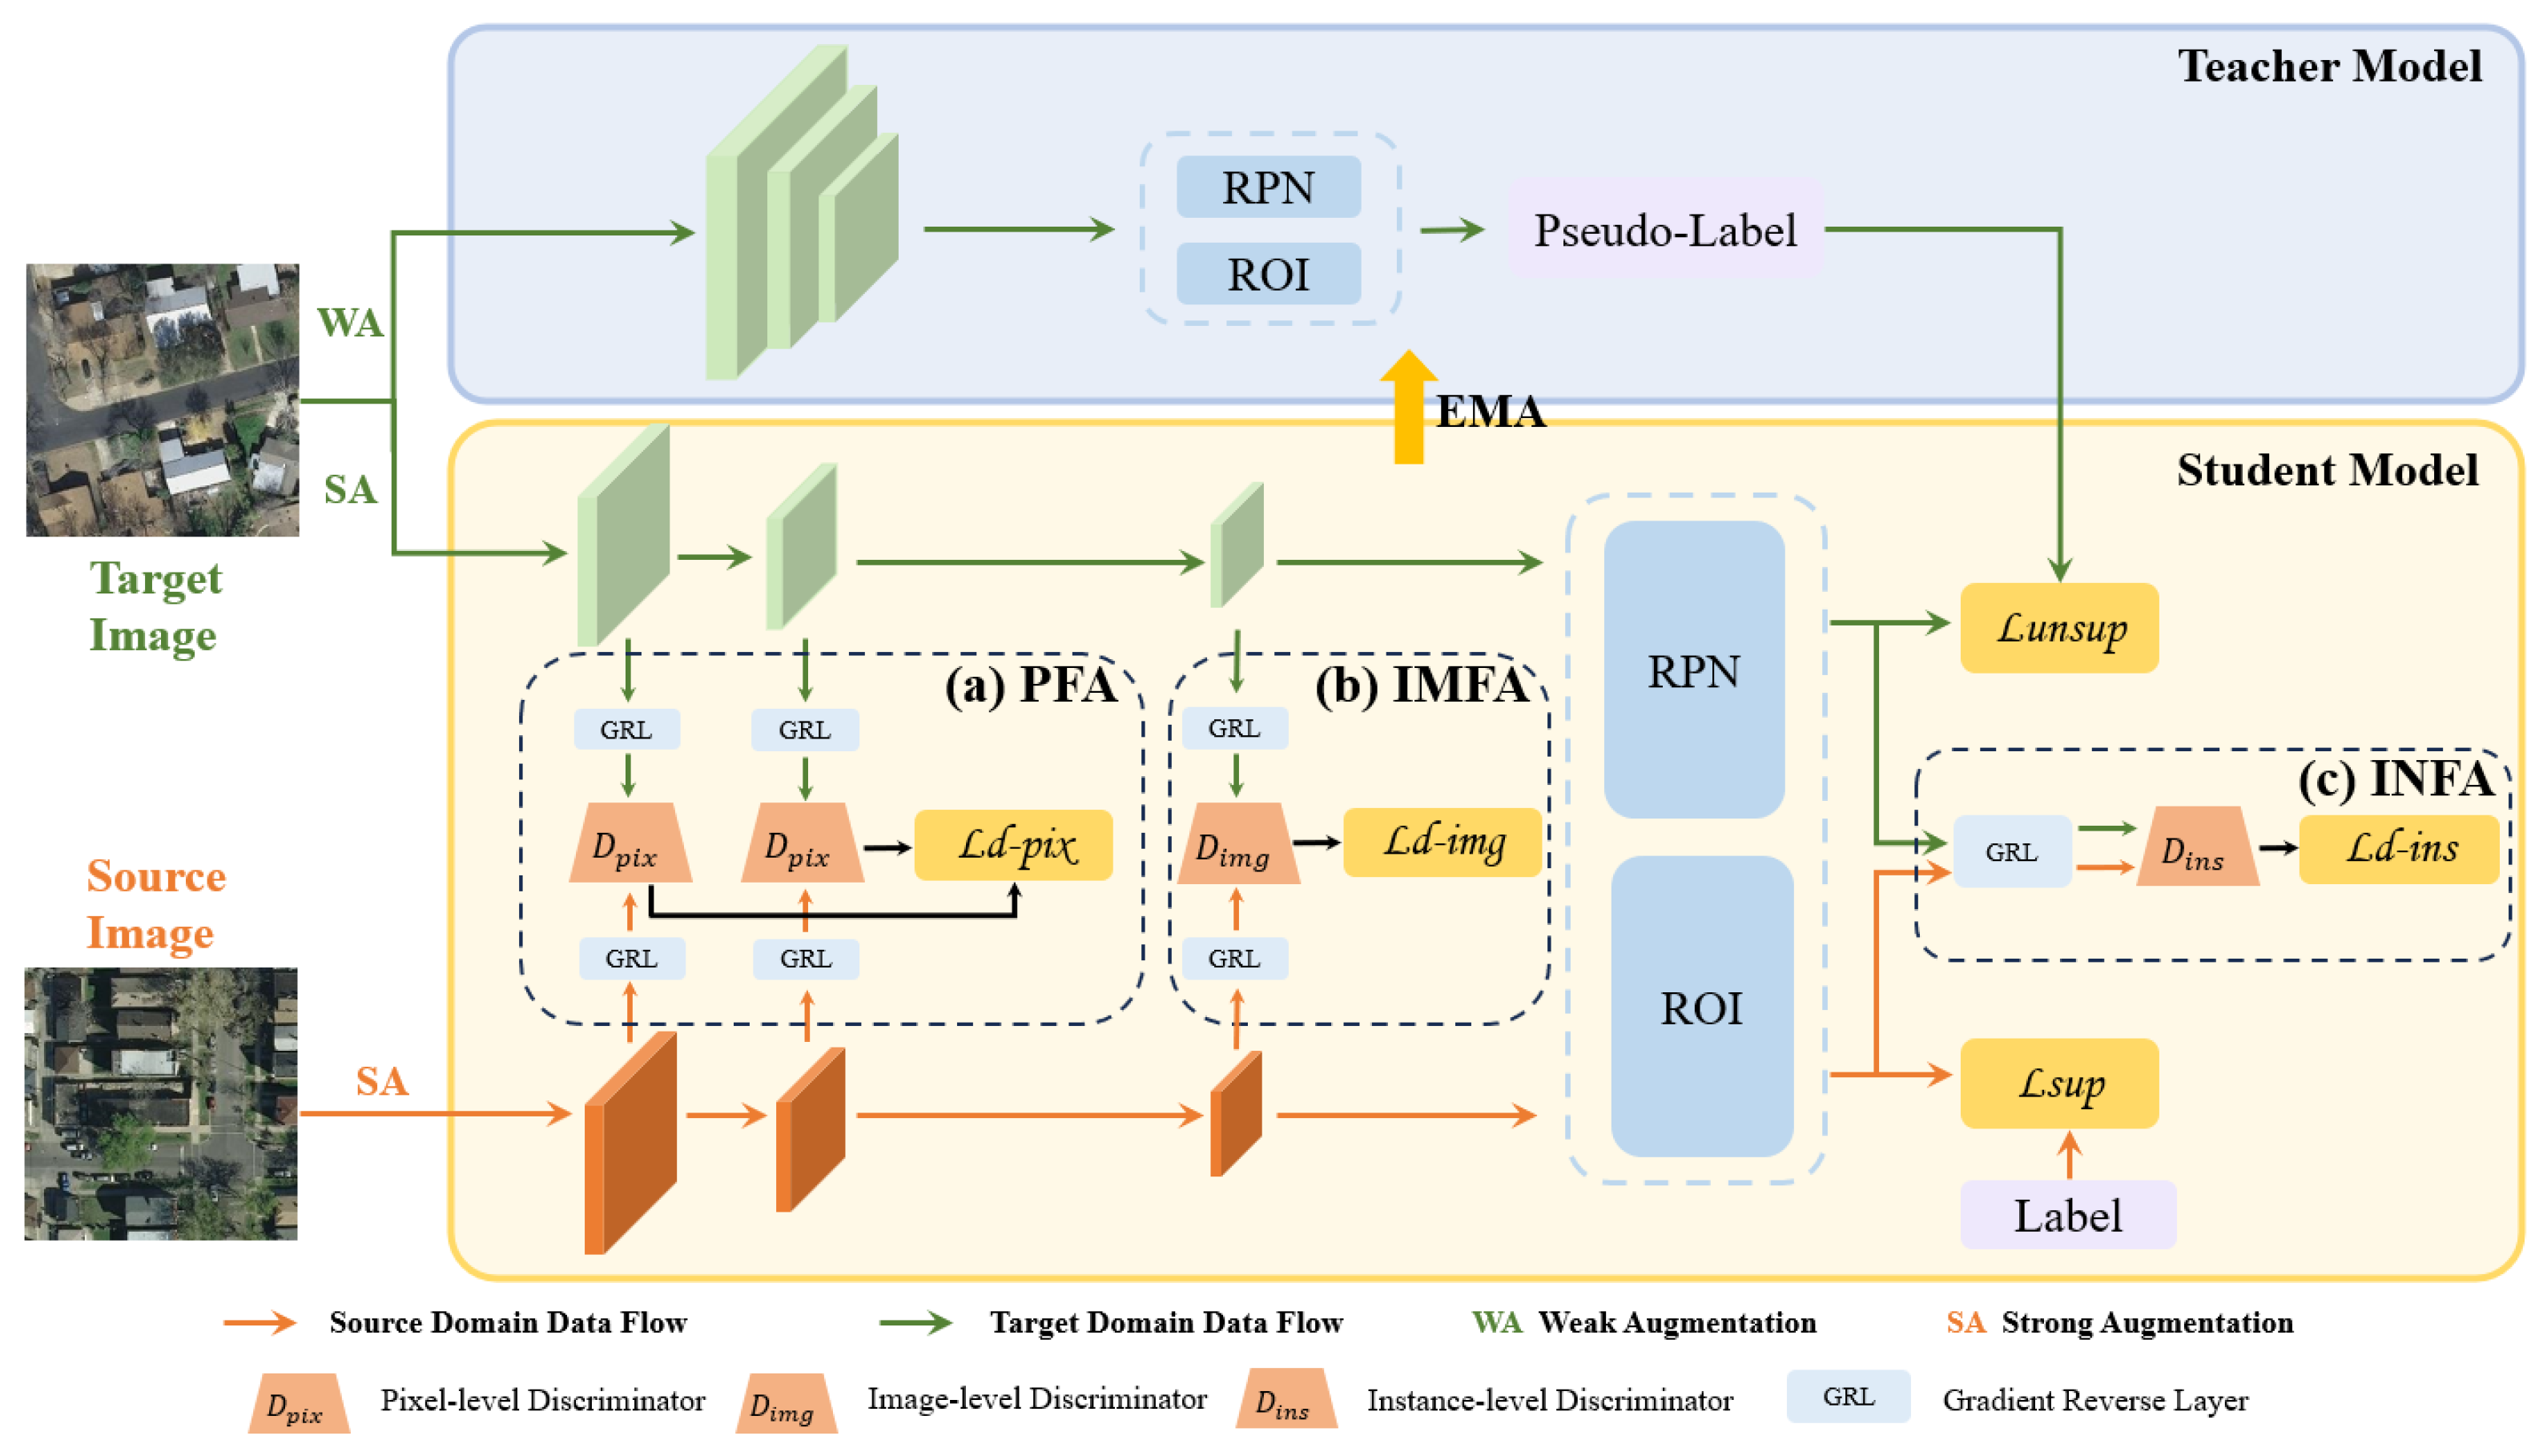
3. Methods
3.1. Pixel-Level Feature Alignment Module (PFA)
3.2. Image-Level Feature Alignment Module (IMFA)
3.3. Instance-Level Feature Alignment Module (INFA)
3.4. Model Training
4. Experiments and Results
4.1. Datasets
4.2. Experimental Settings
4.3. Evaluation Metrics
4.4. Baselines
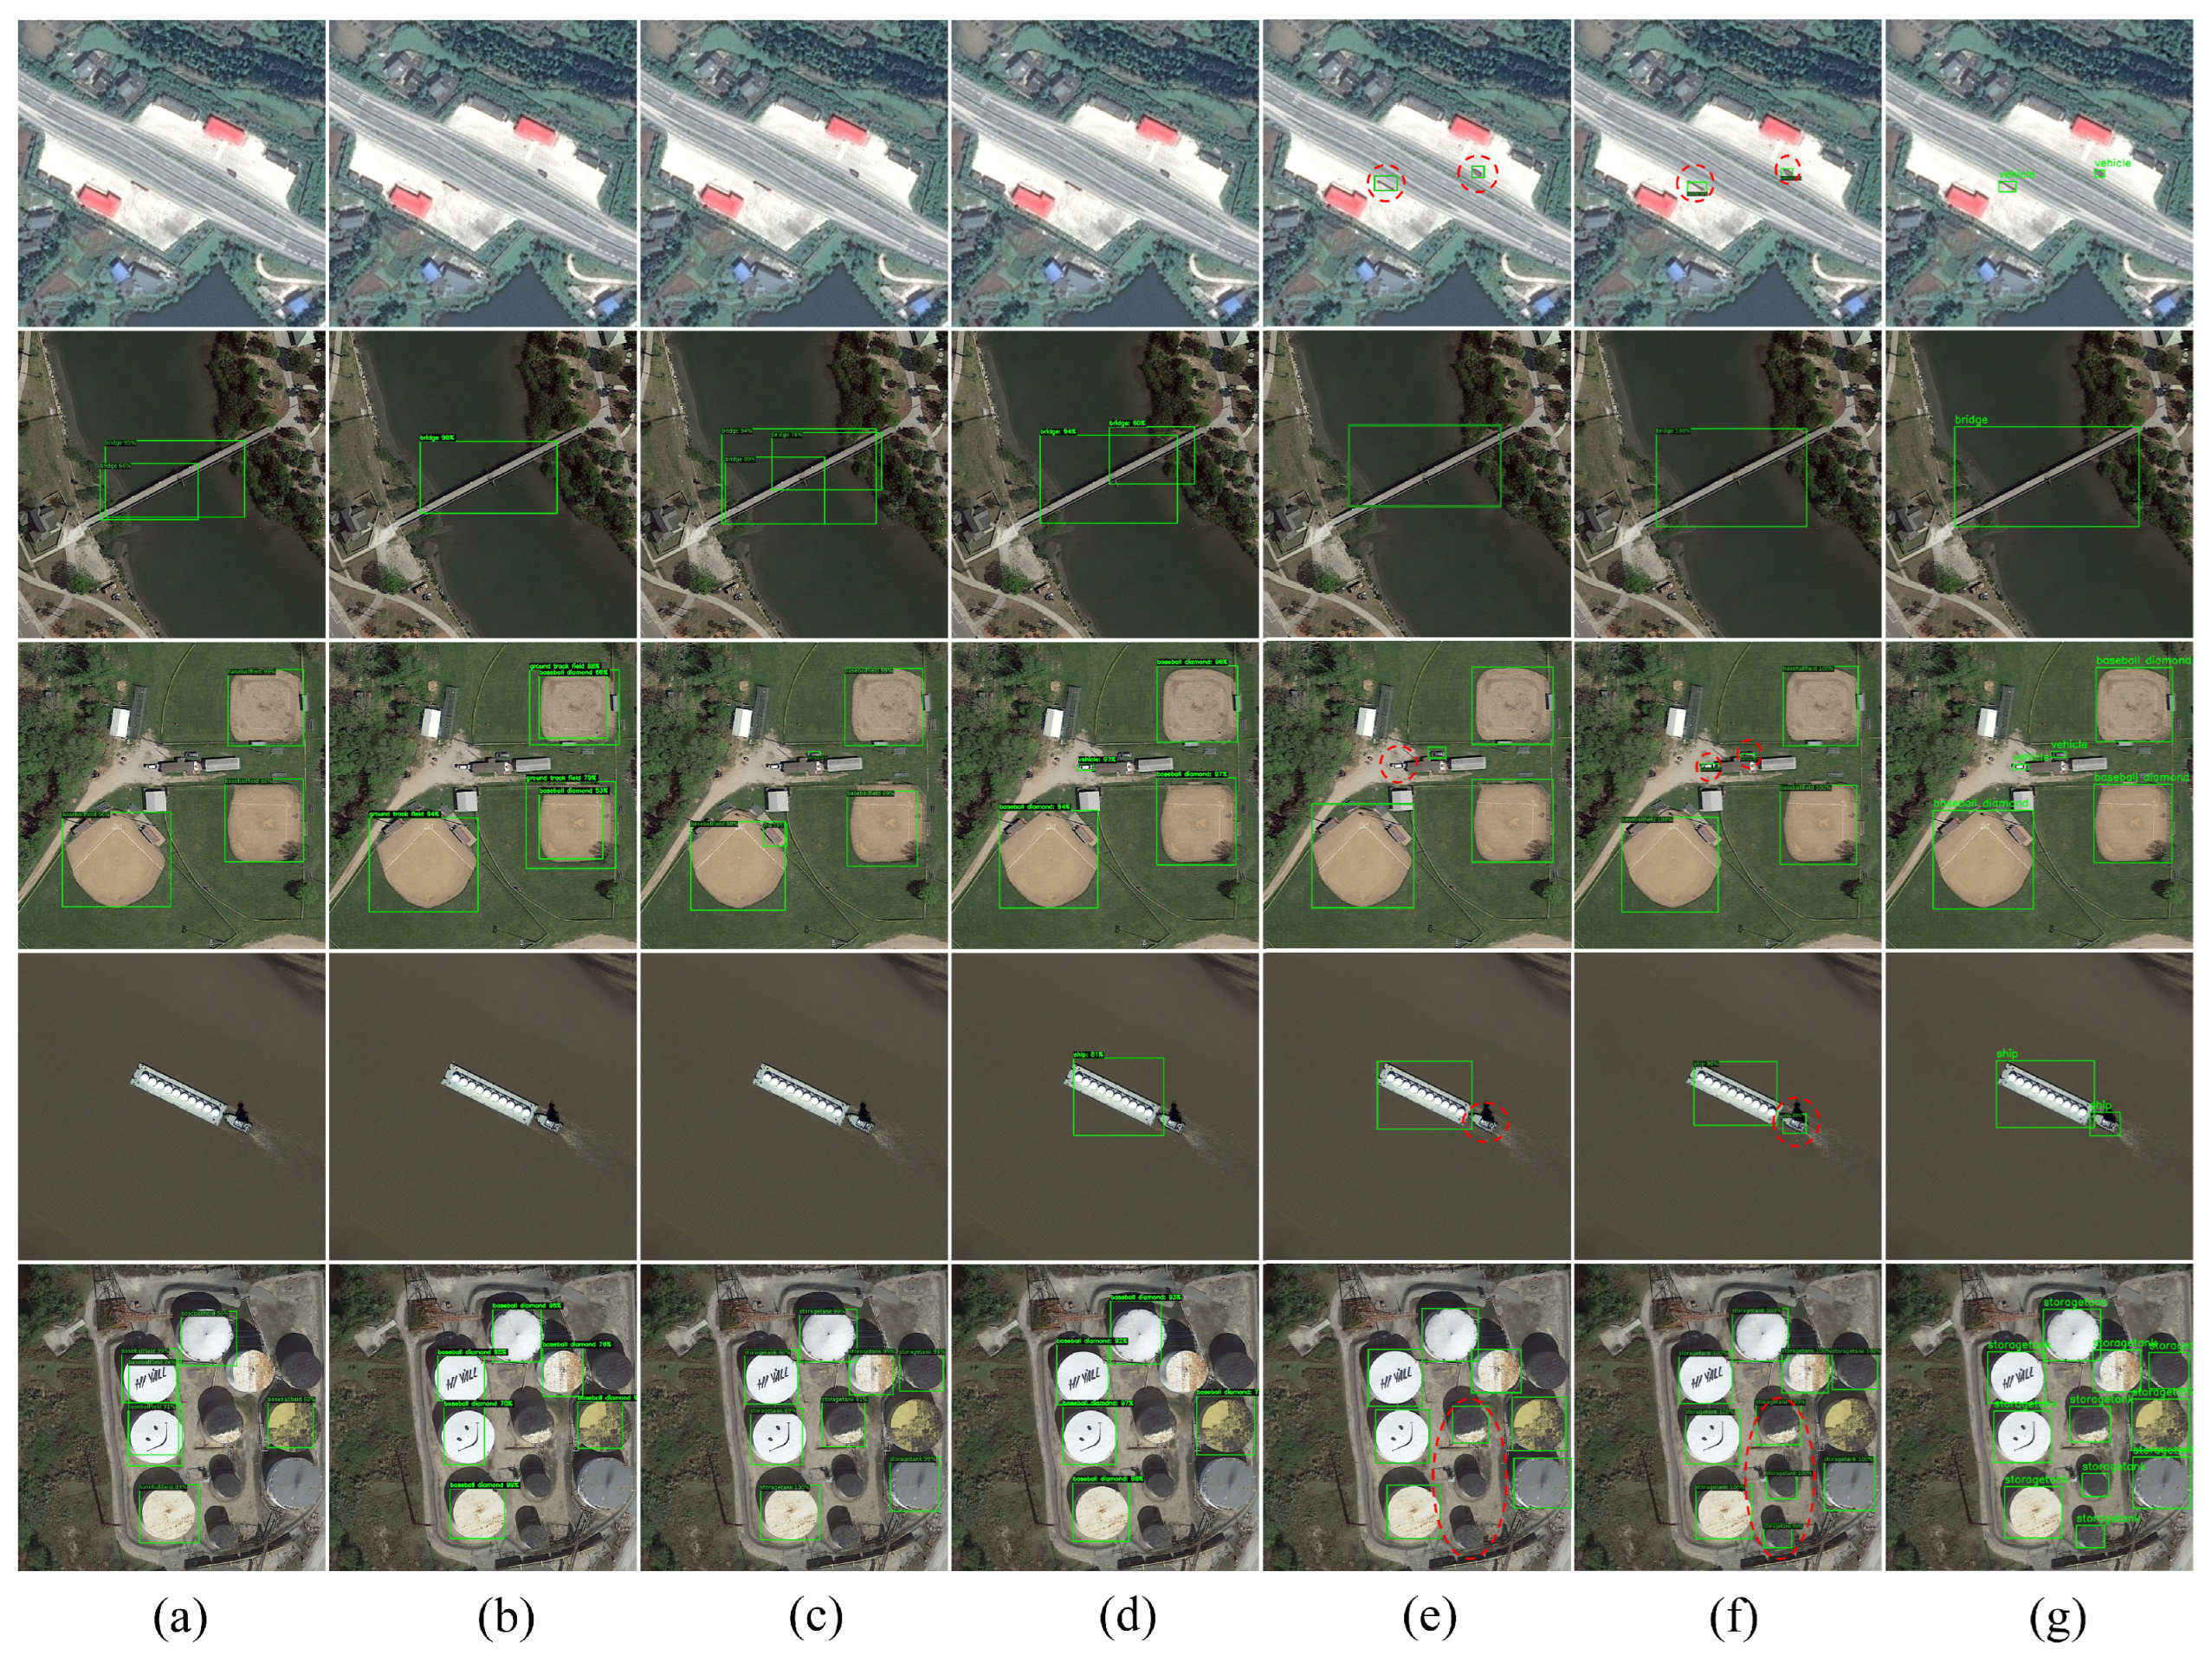
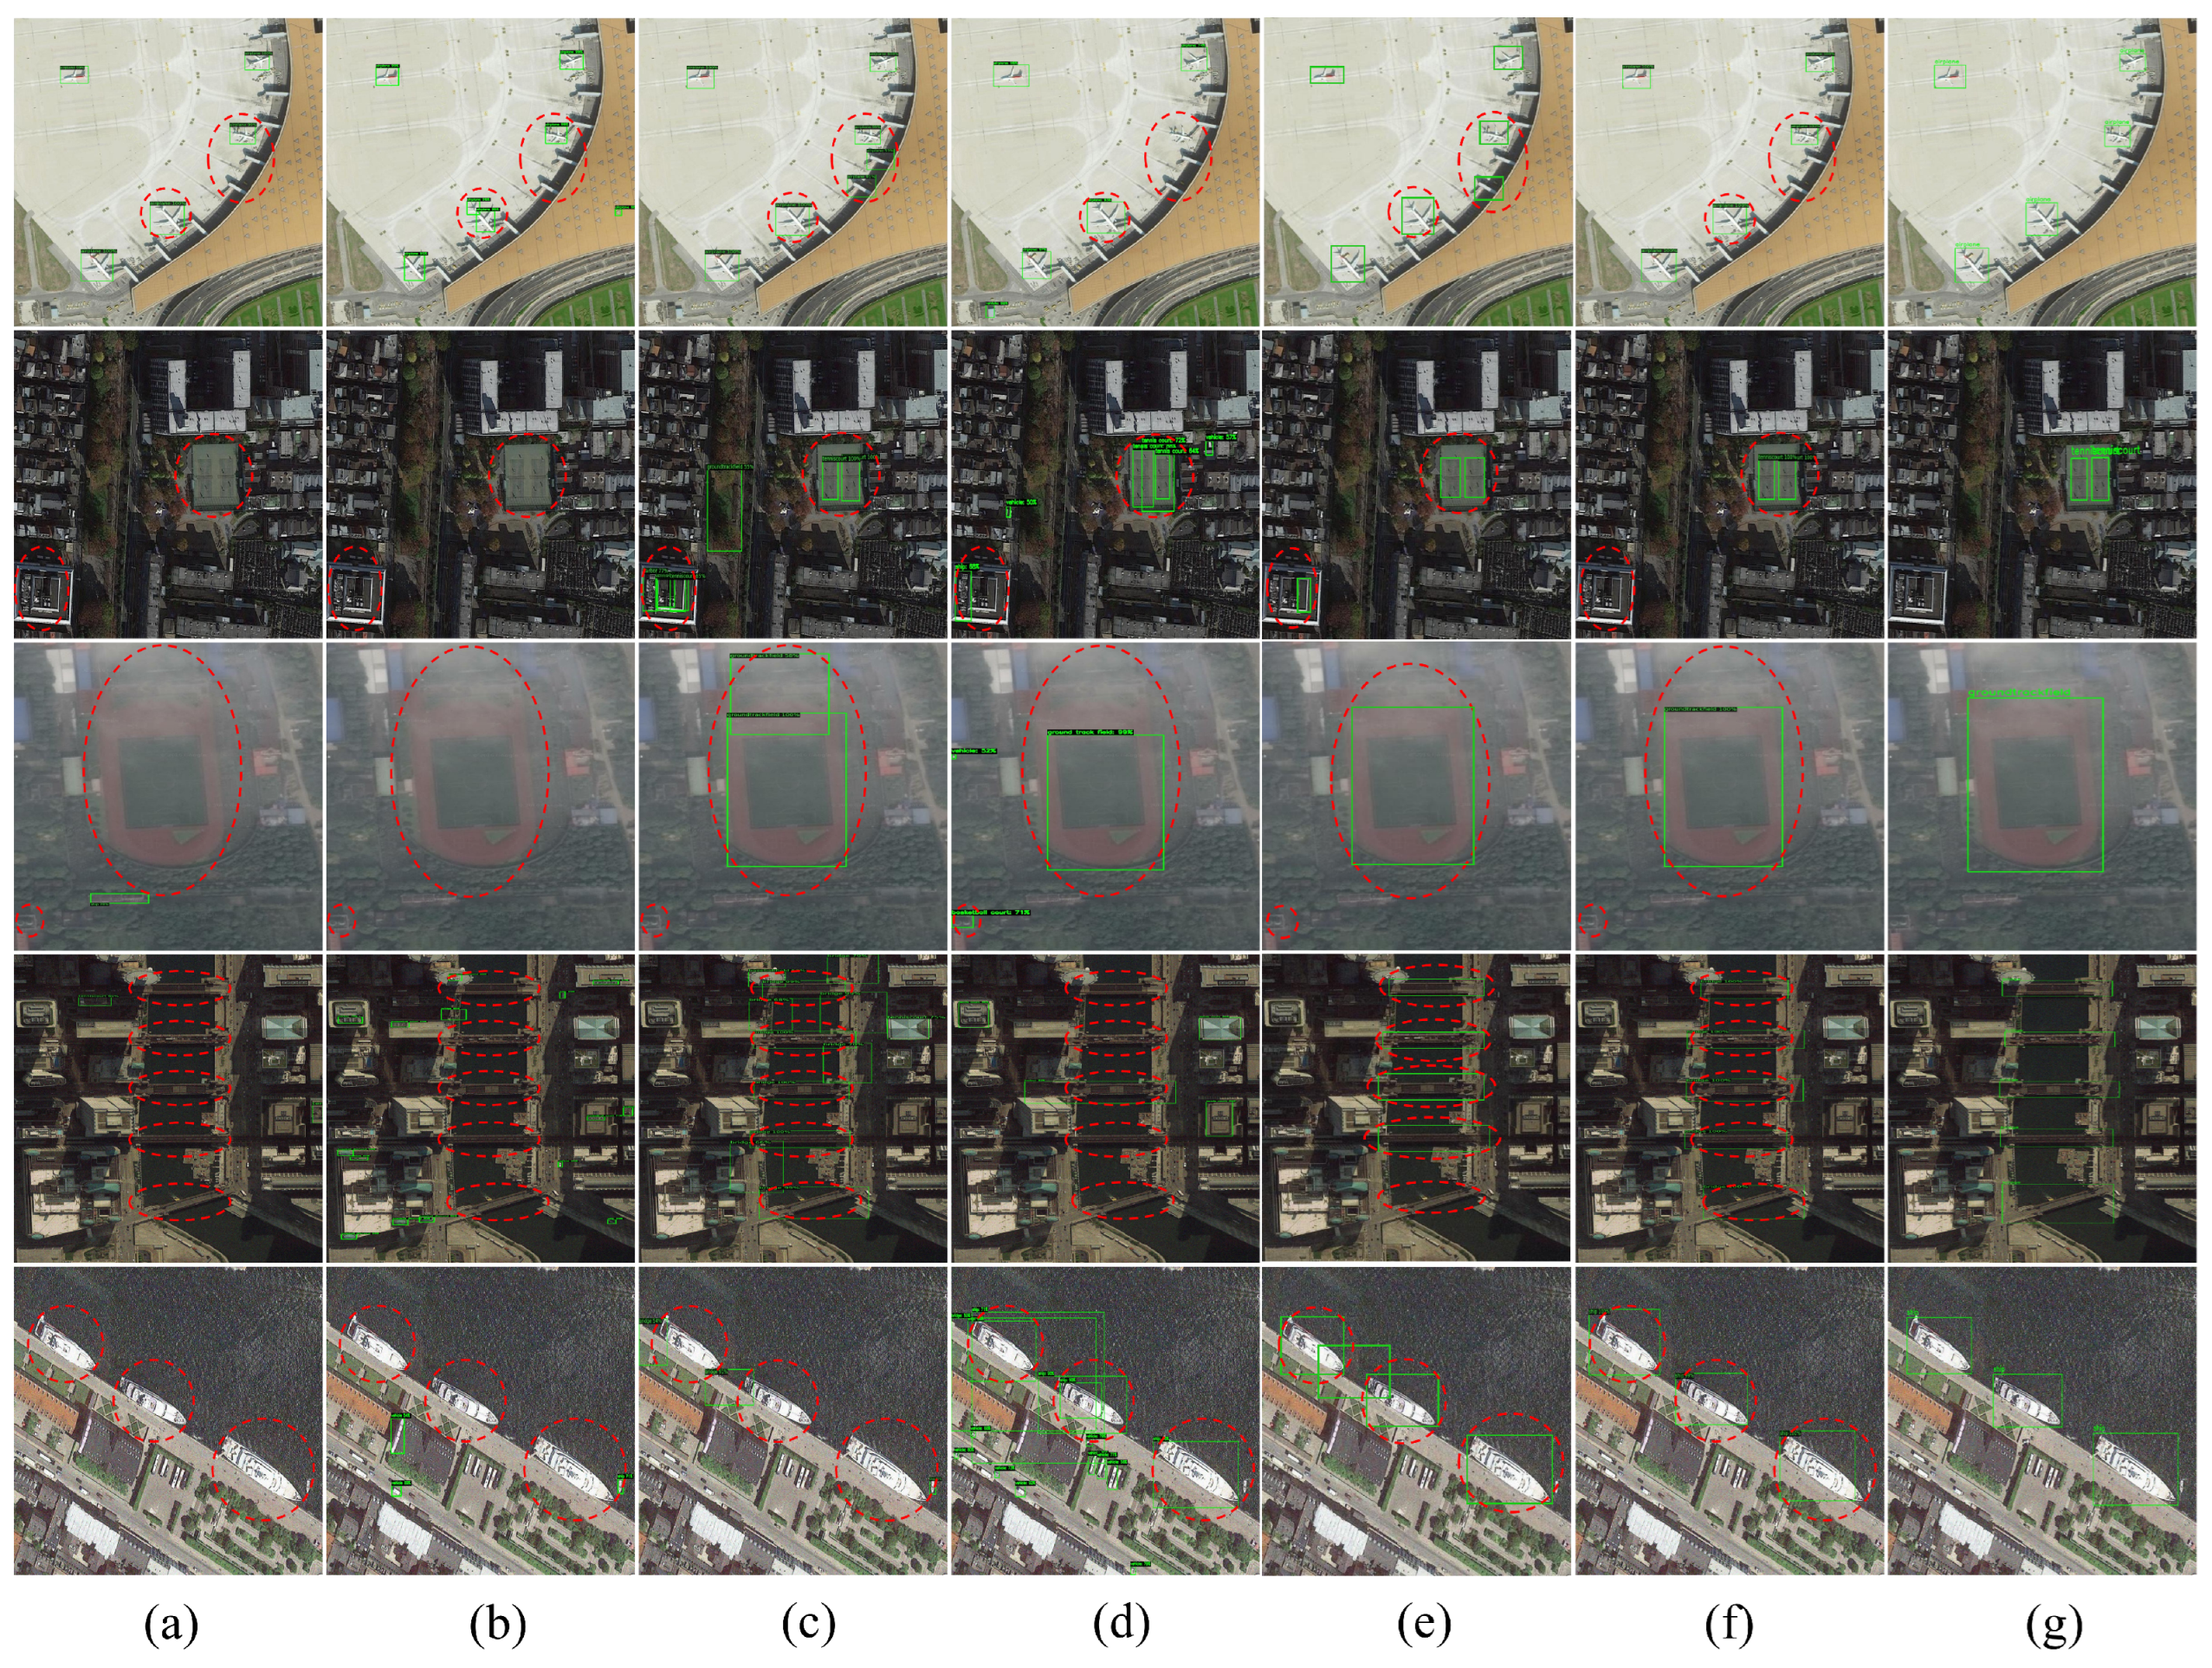
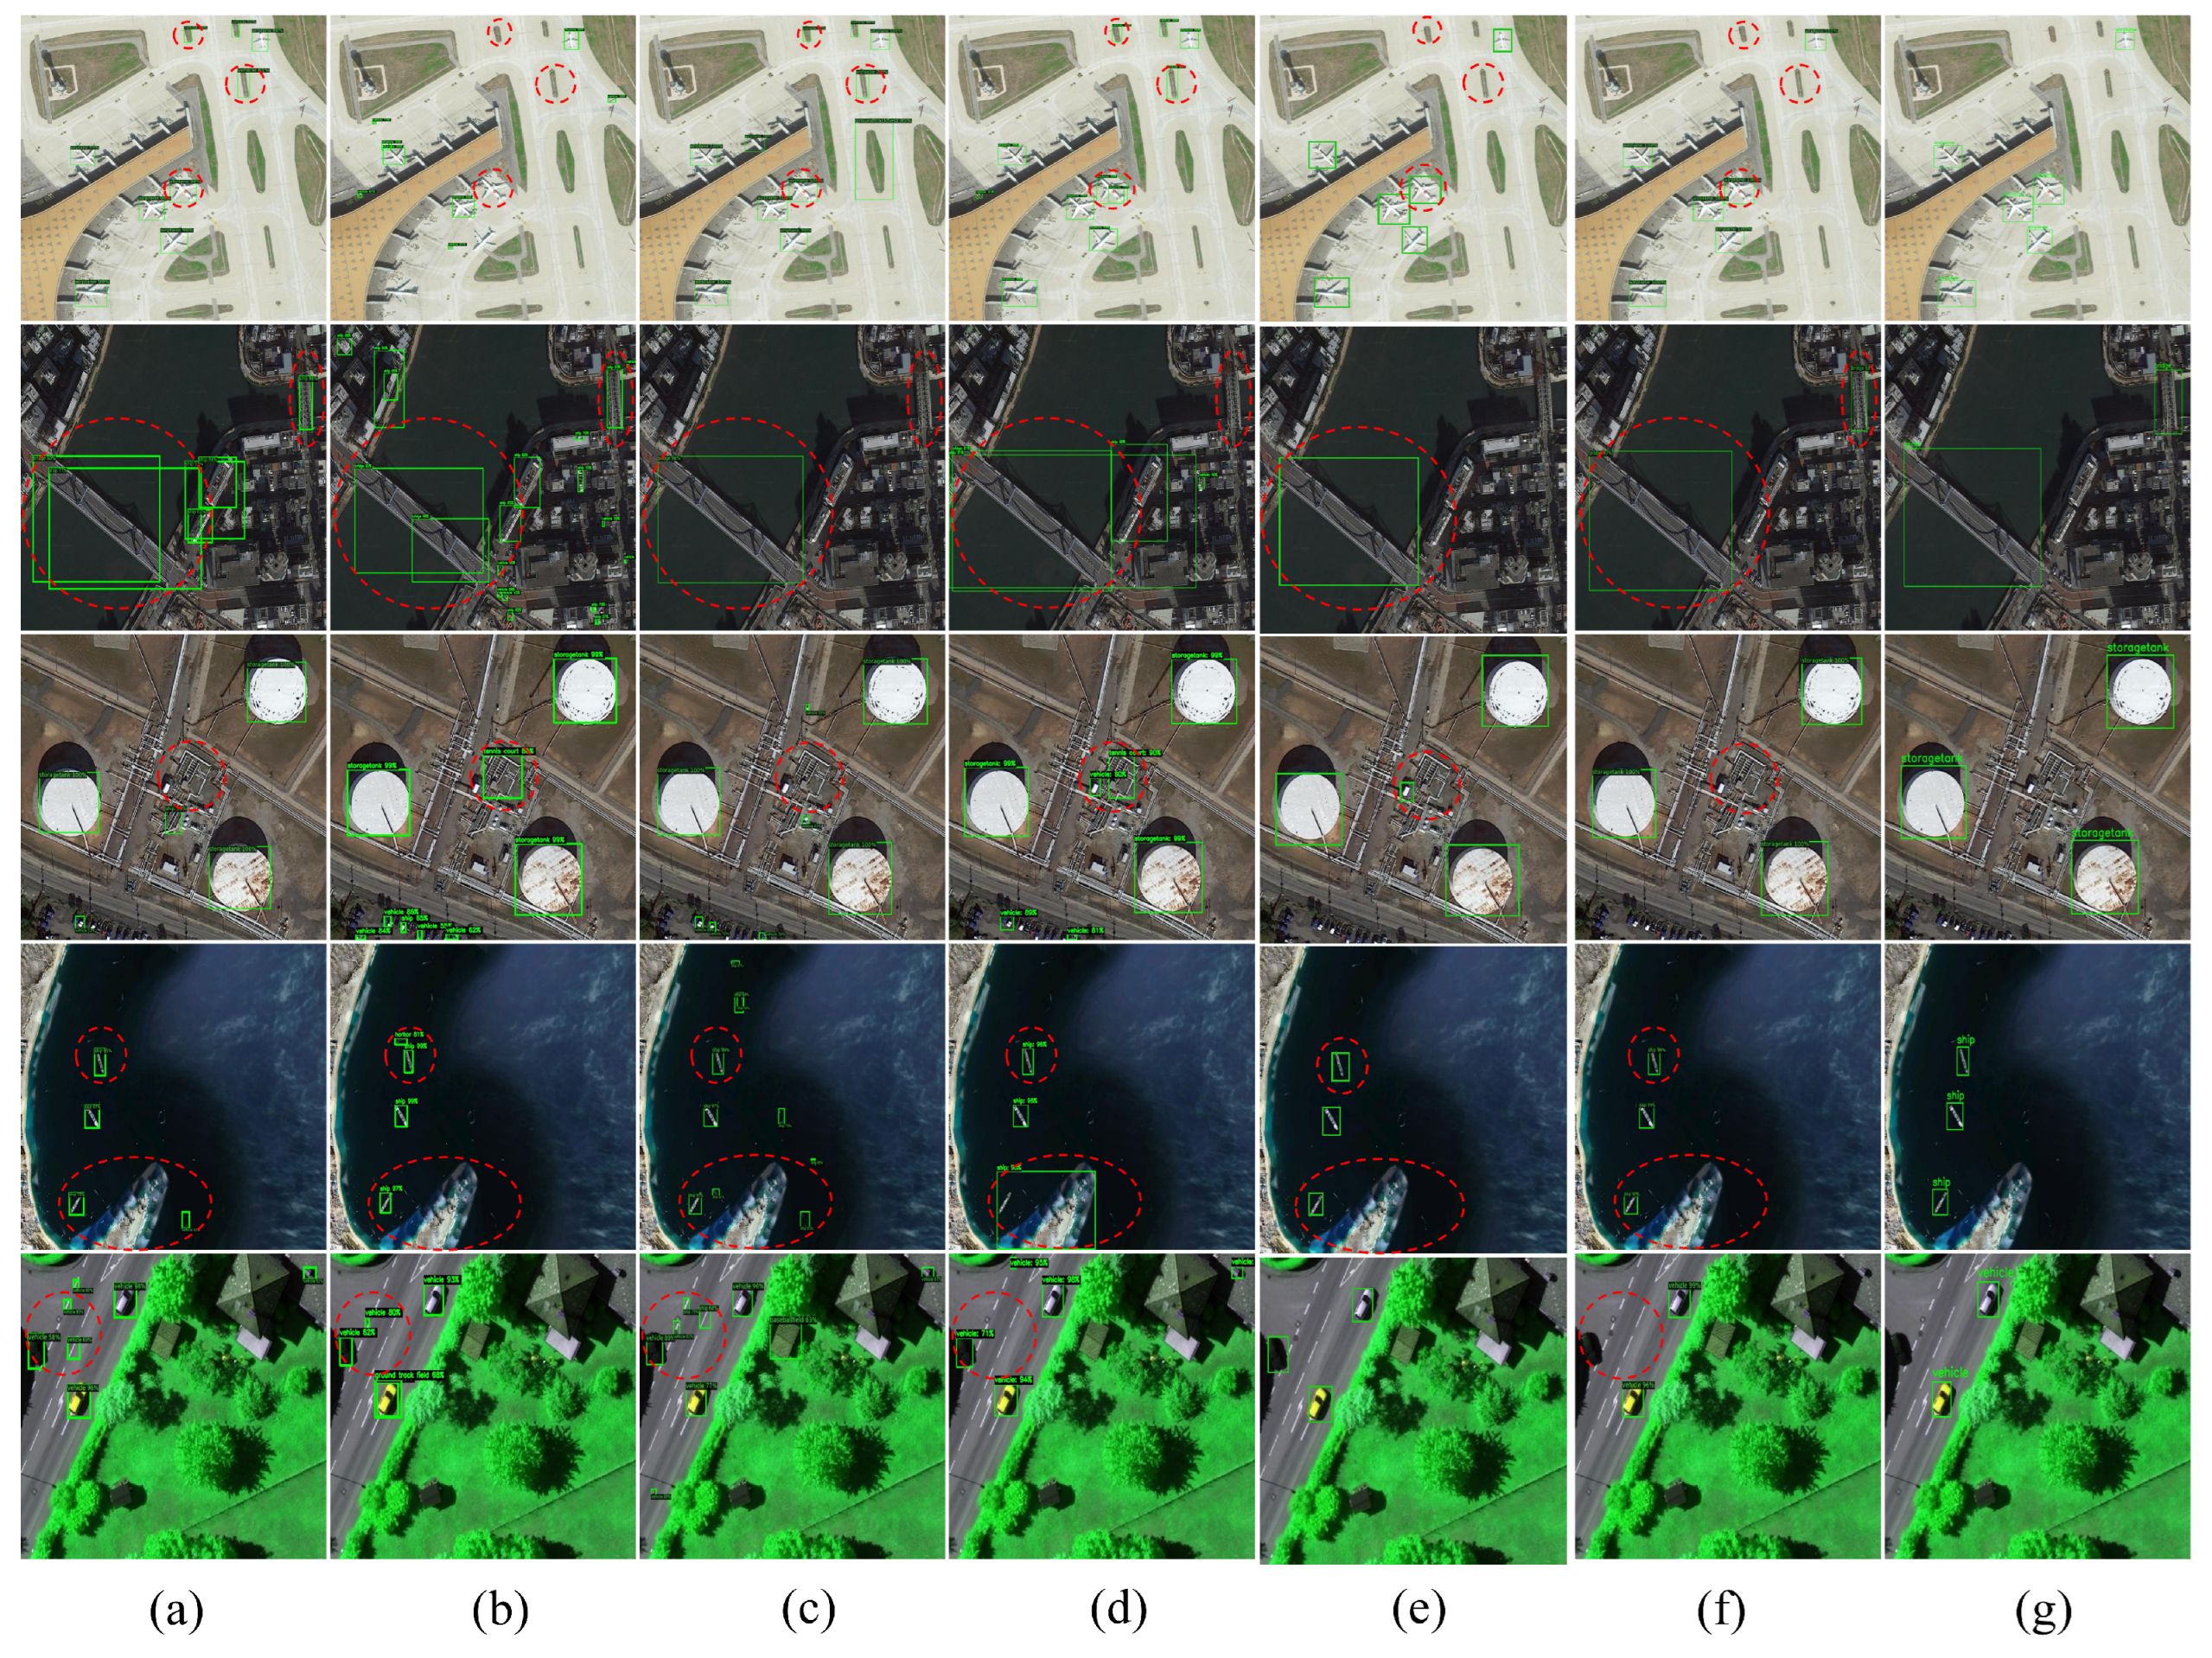
4.5. Overall Results
4.5.1. Results of NWPU VHR-10 to DIOR*
4.5.2. Results of NWPU VHR-10 to HRRSD*
4.5.3. Results of DIOR* to HRRSD*
5. Discussion
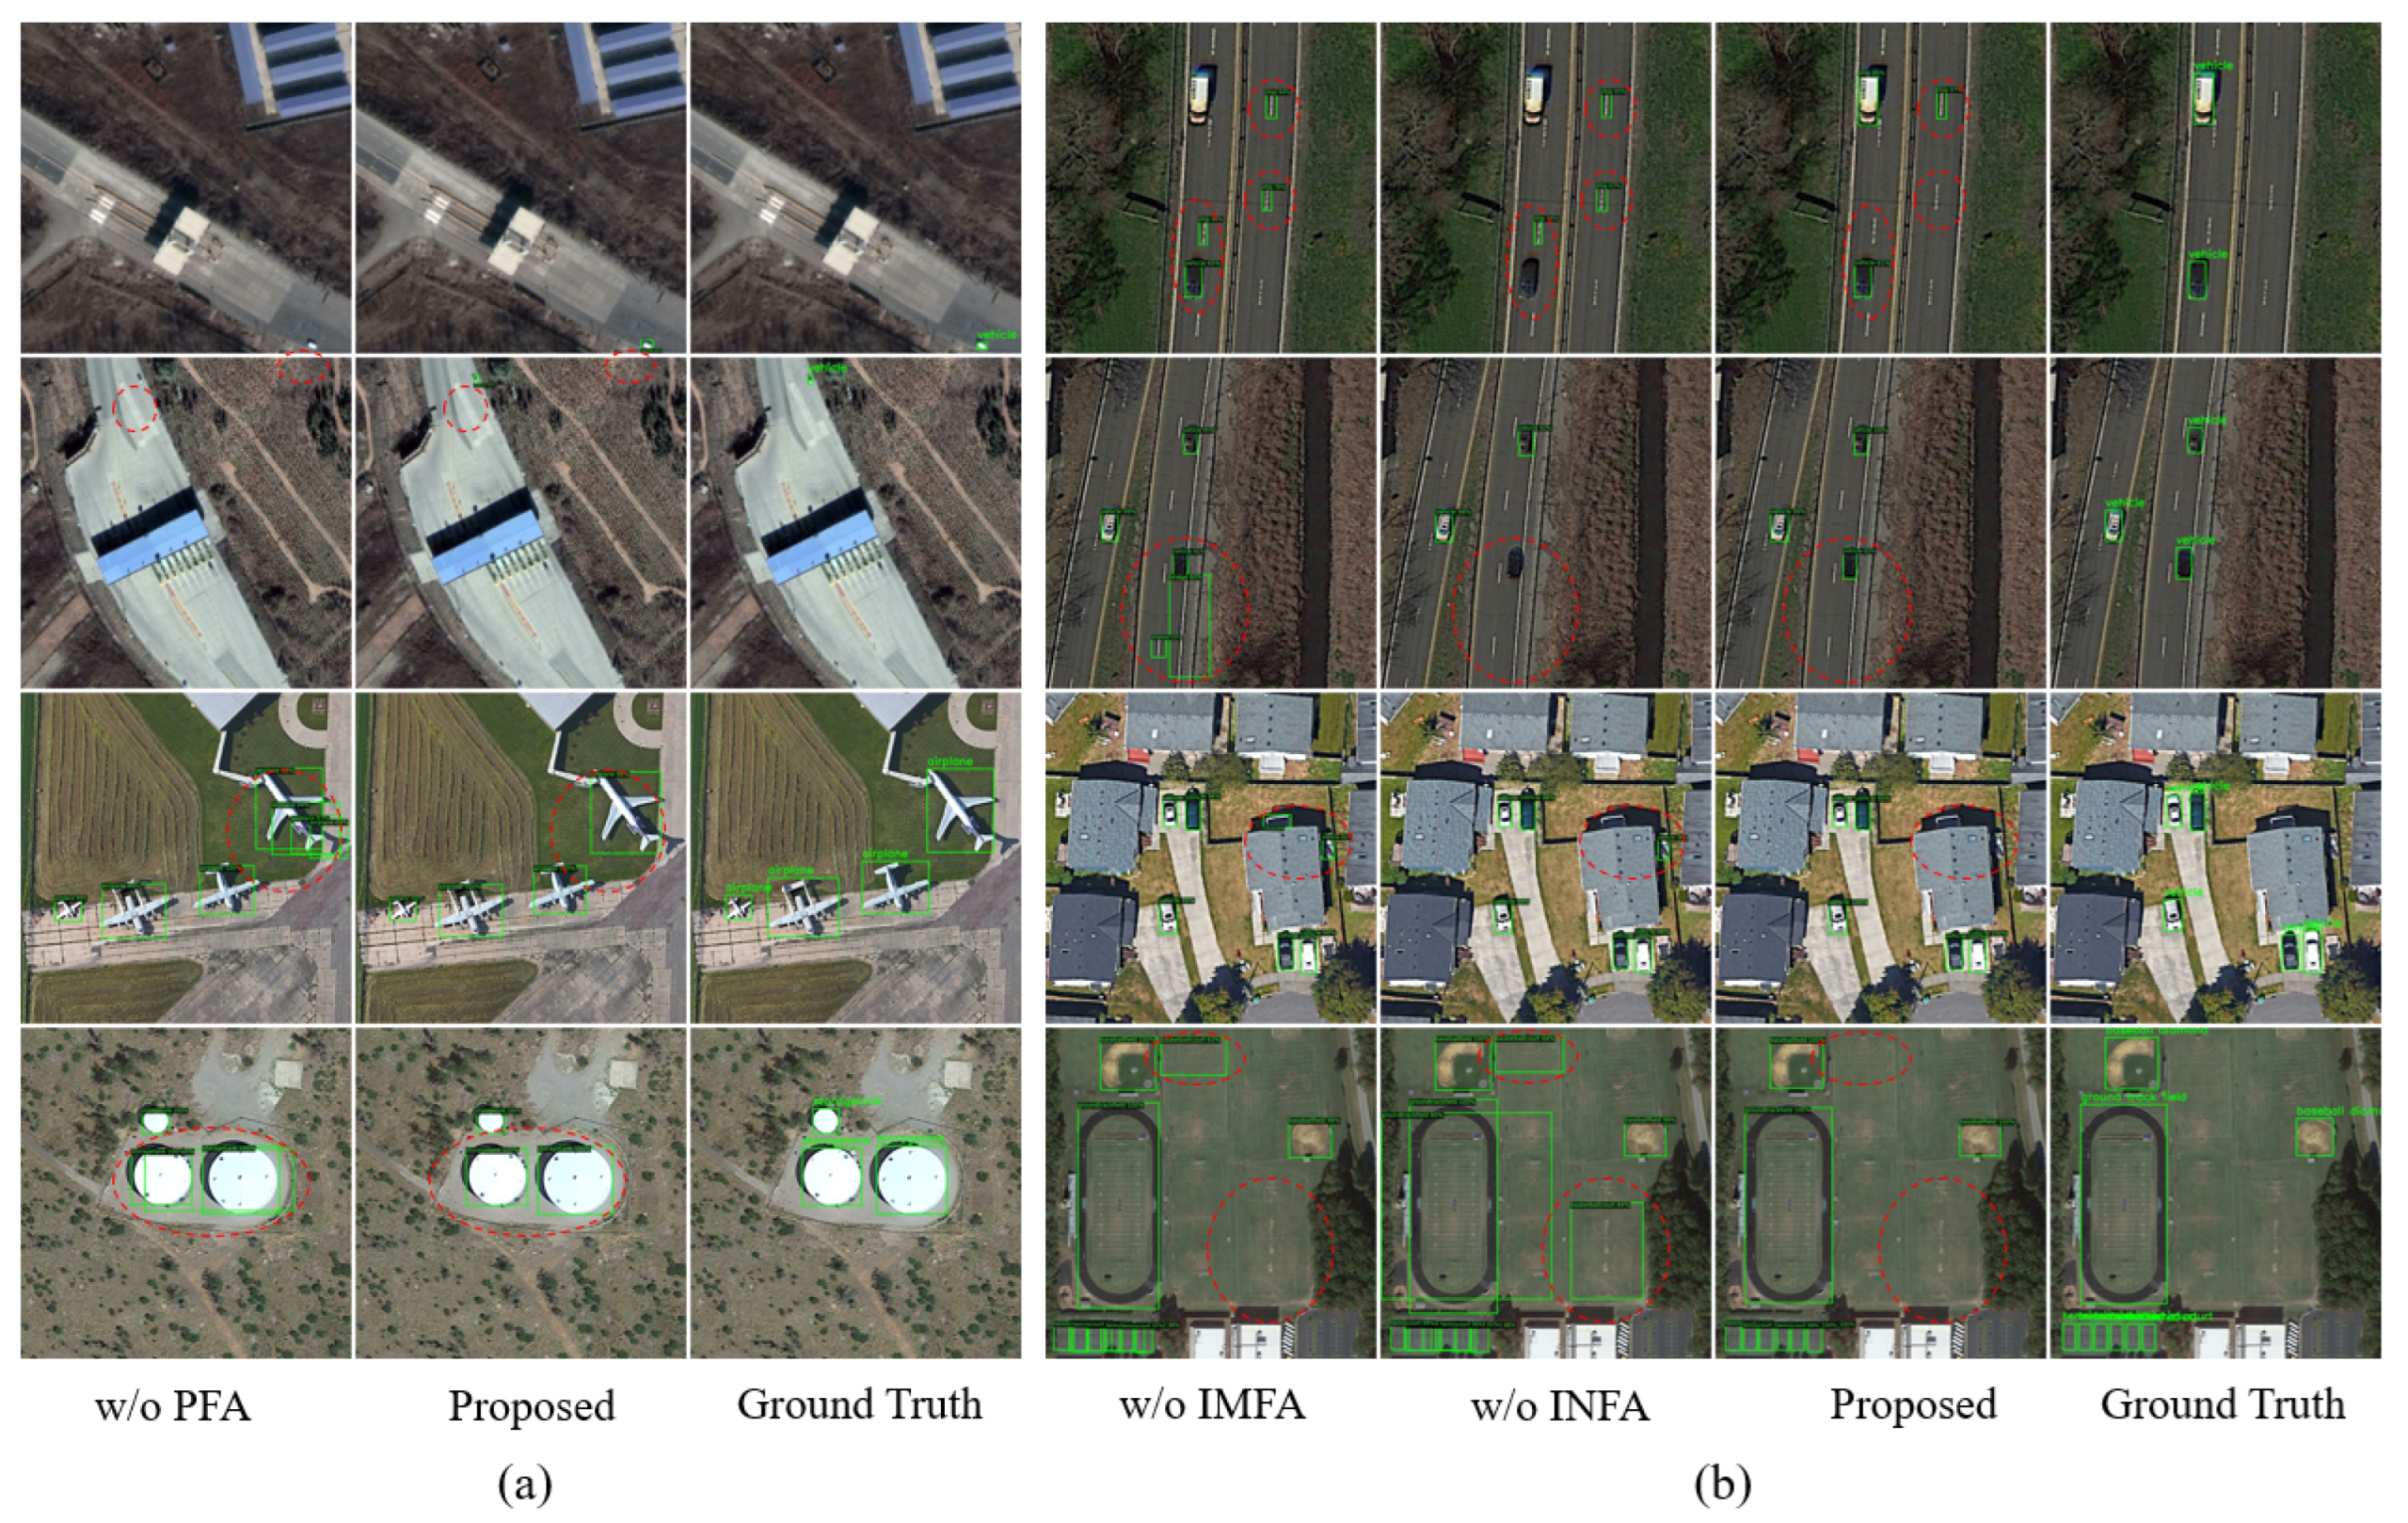
5.1. Ablation Study
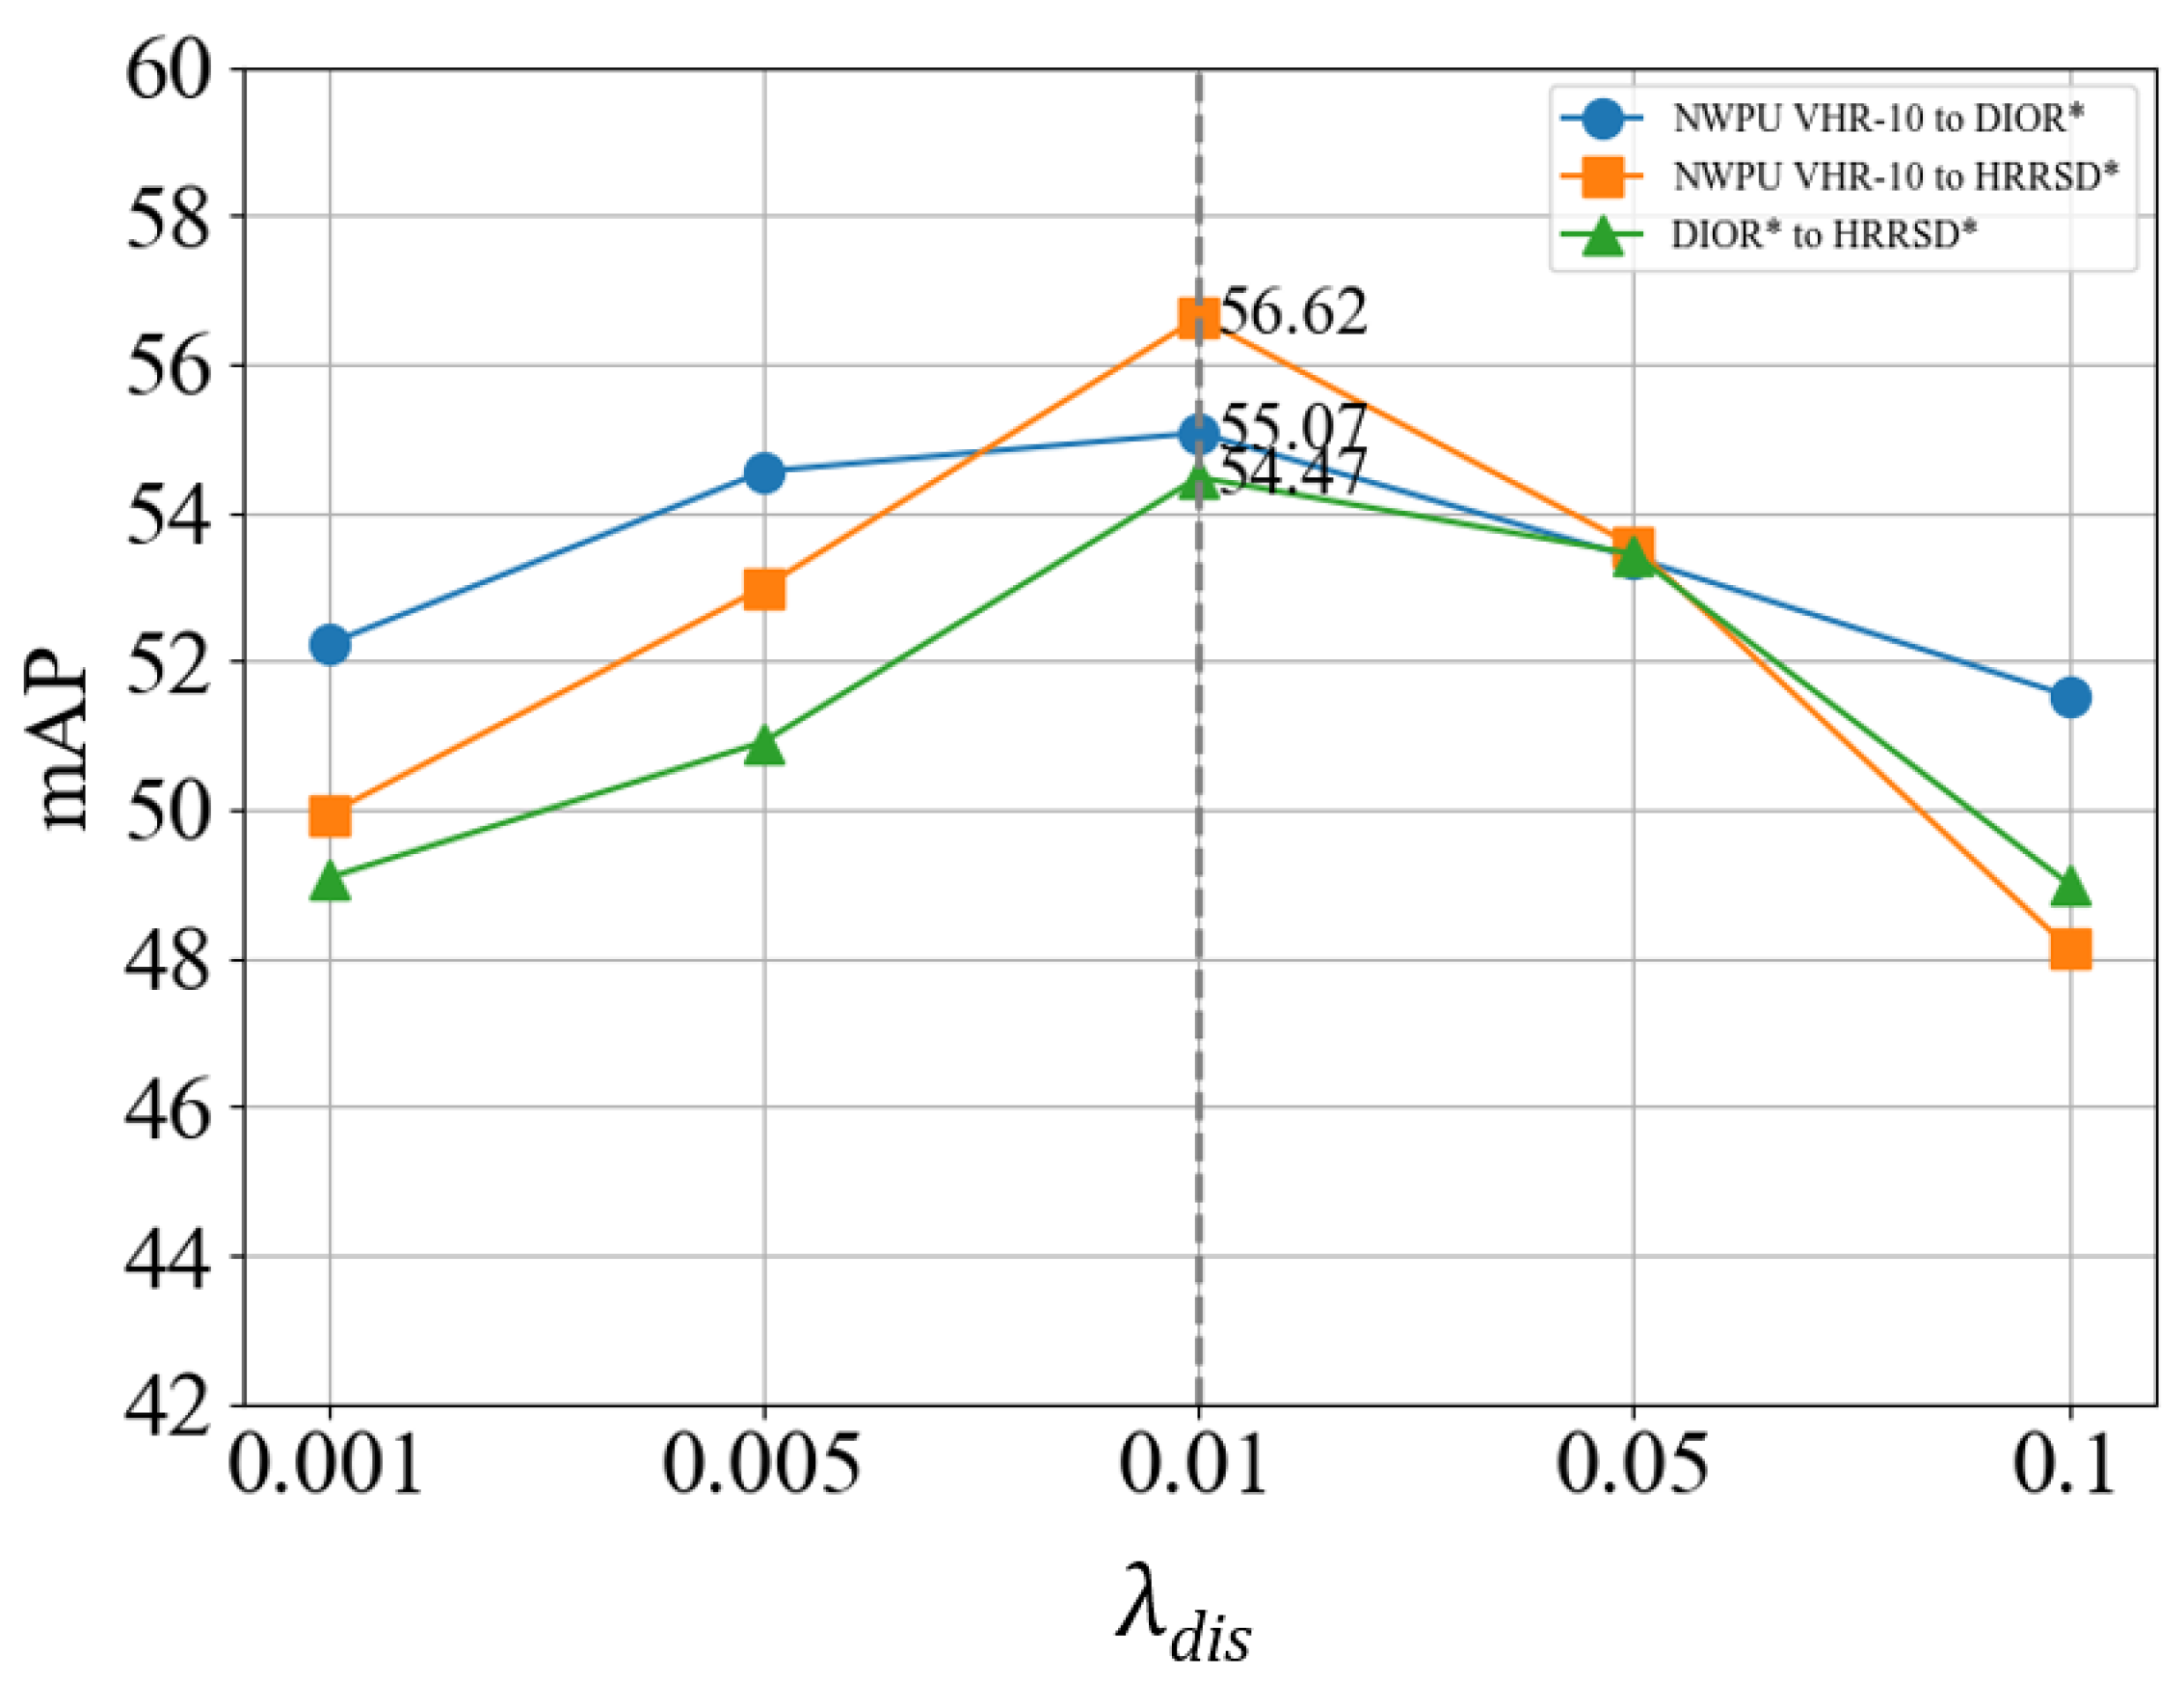
5.2. Effect of
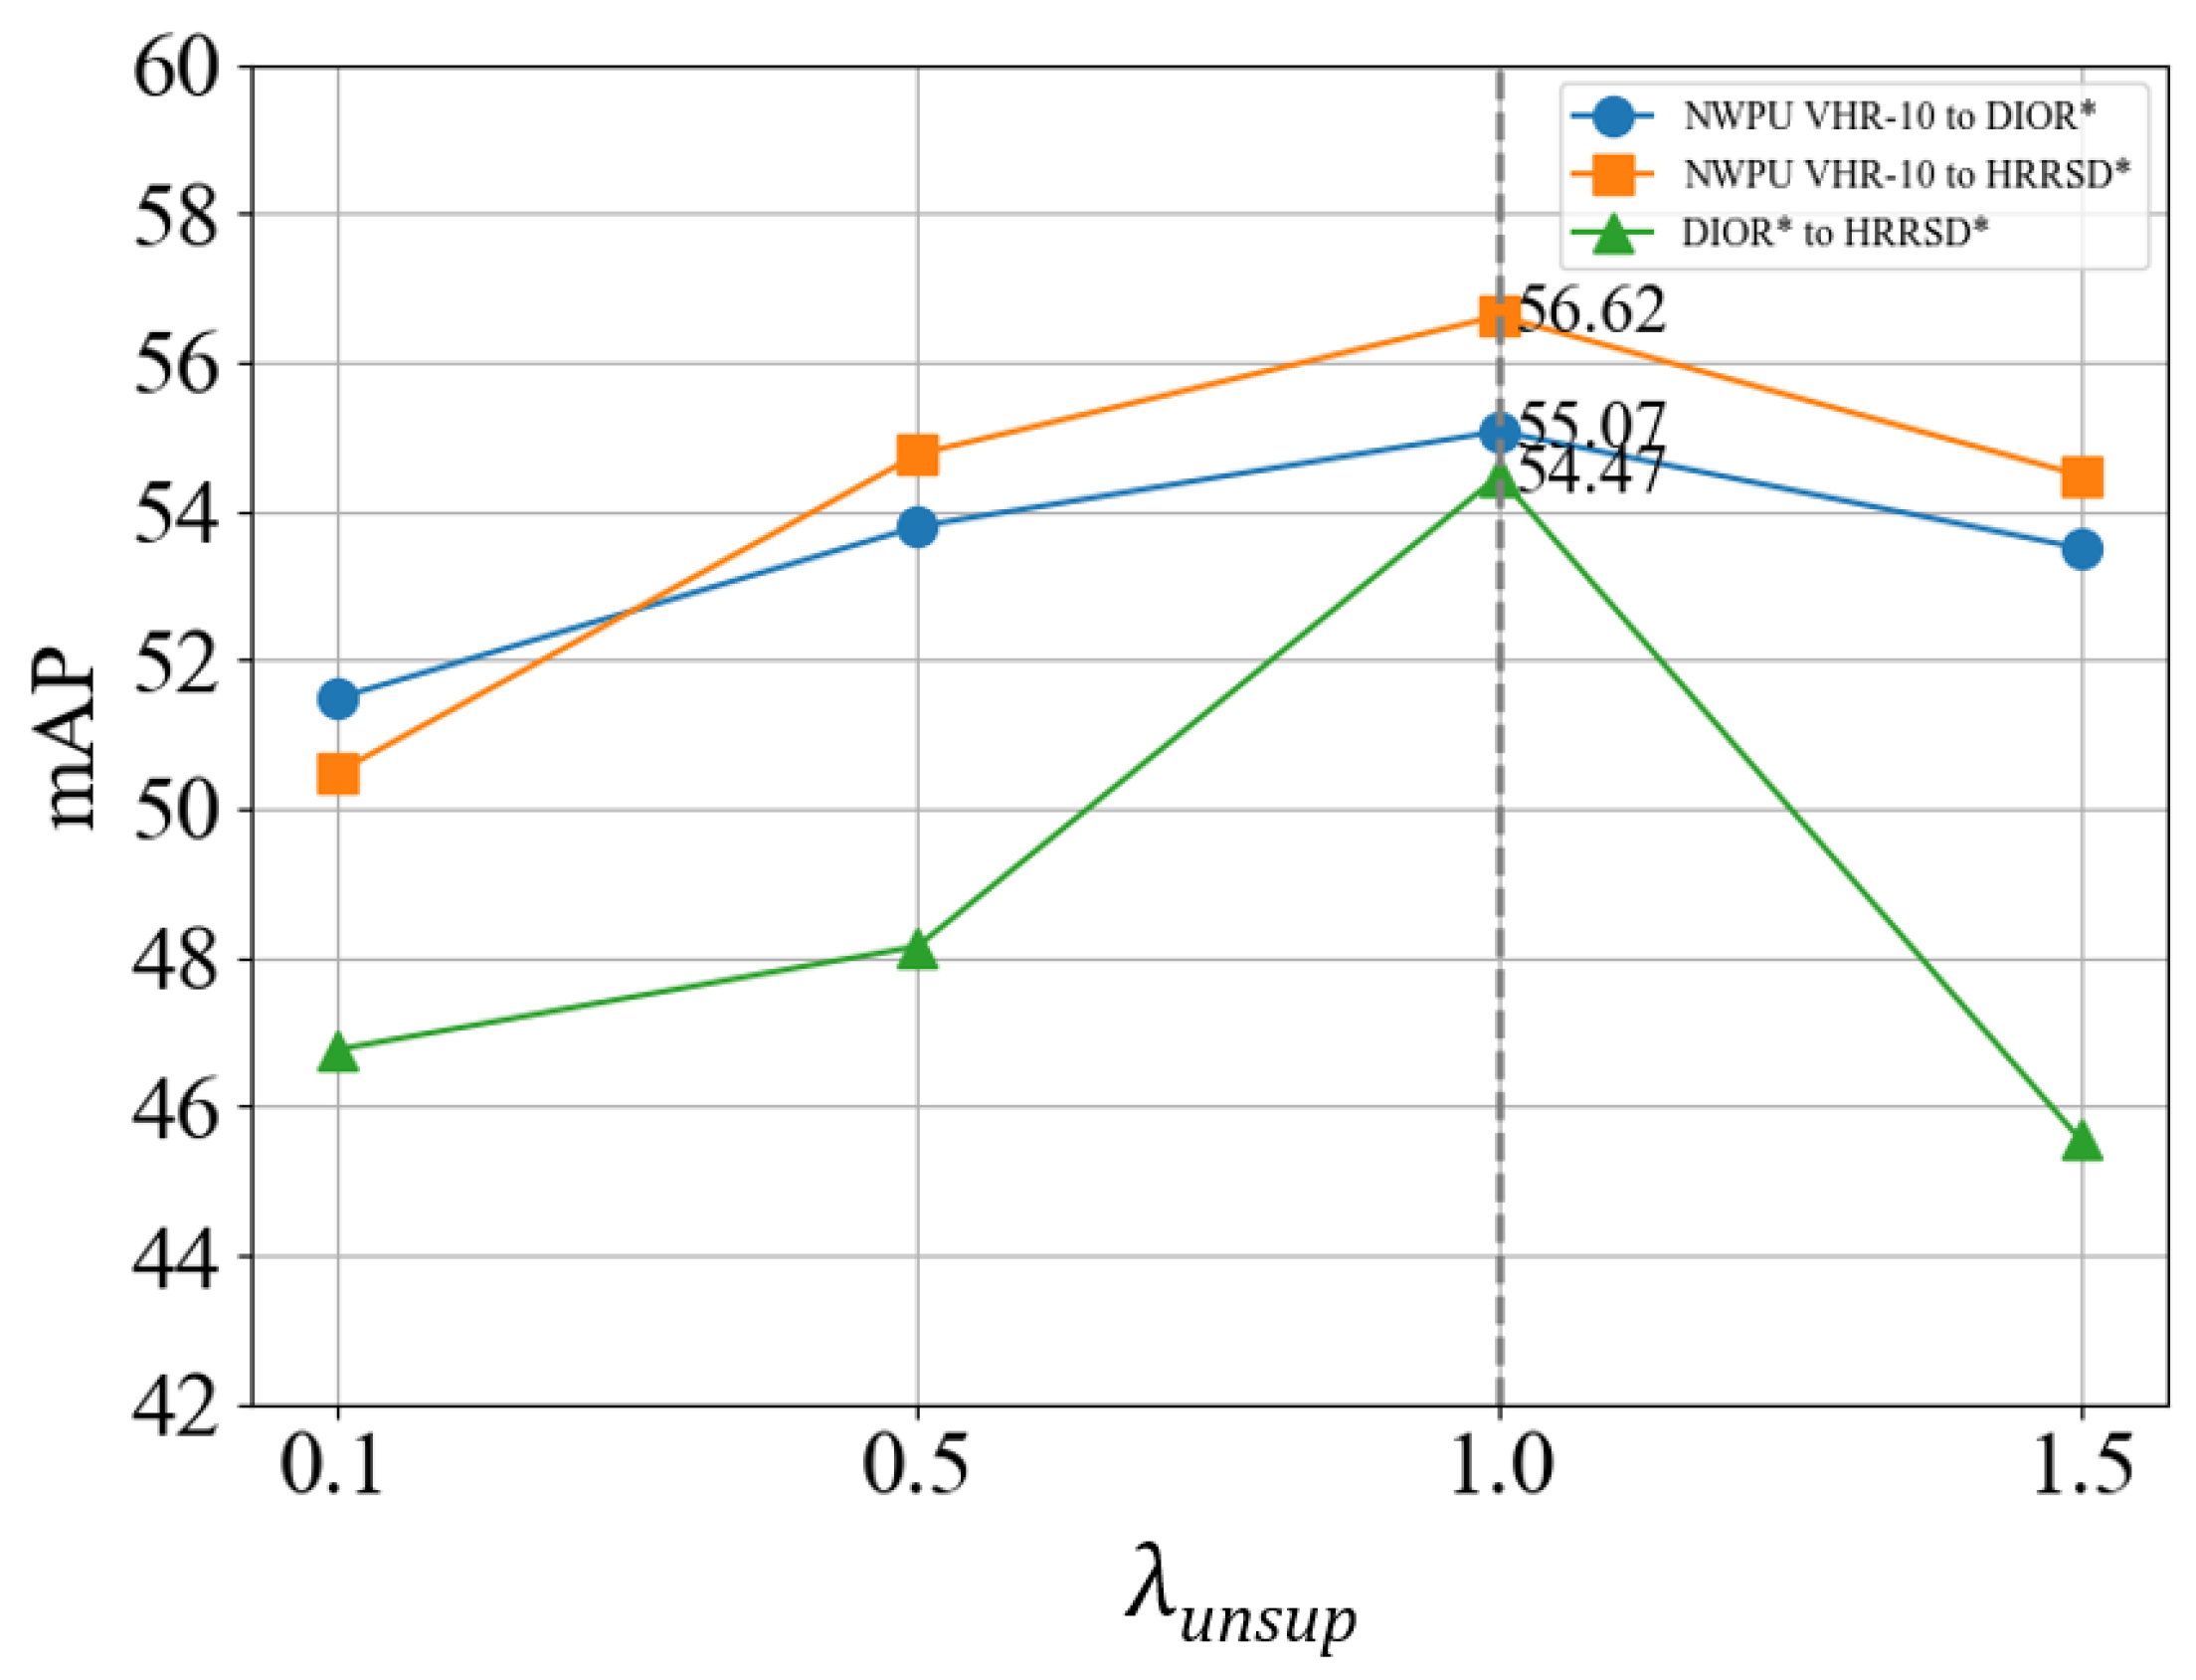
5.3. Effect of
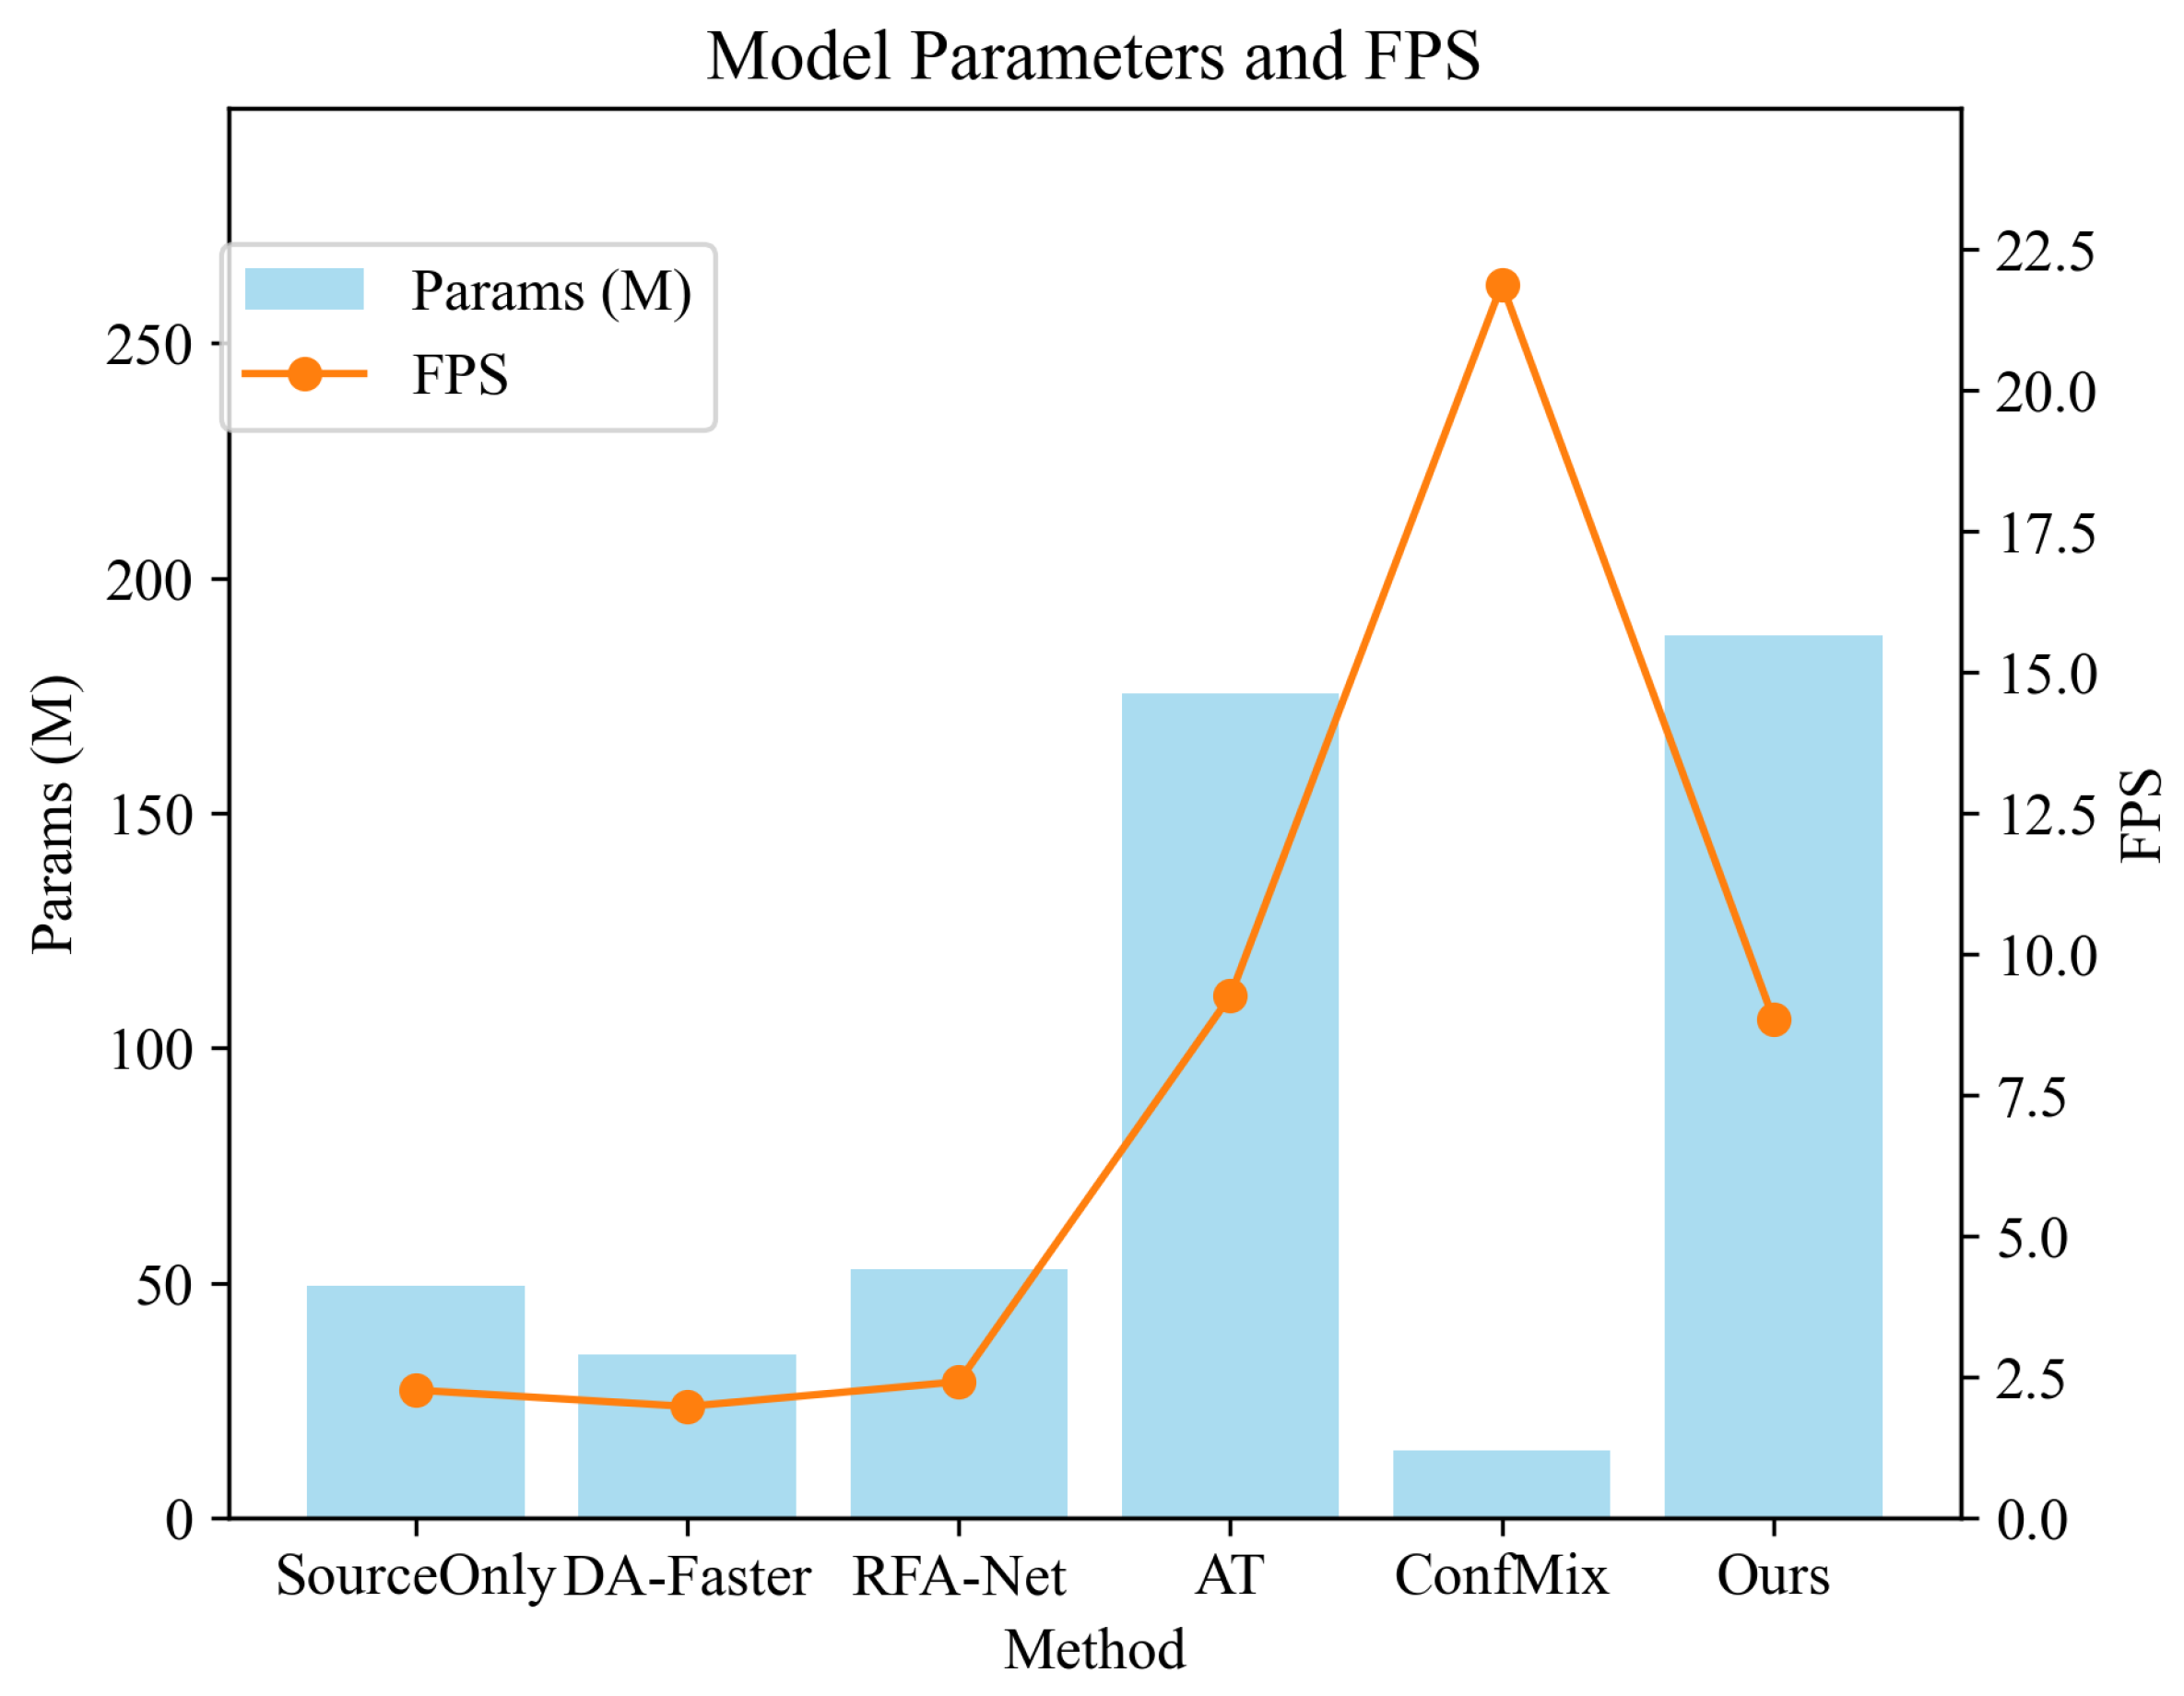
5.4. Model Efficiency
6. Conclusions
Author Contributions
Funding
Data Availability Statement
Conflicts of Interest
References
- Cheng, G.; Han, J. A survey on object detection in optical remote sensing images. ISPRS J. Photogramm. Remote Sens. 2016, 117, 11–28. [Google Scholar] [CrossRef]
- Zheng, Z.; Lei, L.; Sun, H.; Kuang, G. A Review of Remote Sensing Image Object Detection Algorithms Based on Deep Learning. In Proceedings of the 2020 IEEE 5th International Conference on Image, Vision and Computing (ICIVC), Beijing, China, 10–12 July 2020; pp. 34–43. [Google Scholar] [CrossRef]
- Zhang, W.; Tang, P.; Zhao, L. Remote sensing image scene classification using CNN-CapsNet. Remote Sens. 2019, 11, 494. [Google Scholar] [CrossRef]
- Fang, F.; Zheng, K.; Li, S.; Xu, R.; Hao, Q.; Feng, Y.; Zhou, S. Incorporating Superpixel Context for Extracting Building From High-Resolution Remote Sensing Imagery. IEEE J. Sel. Top. Appl. Earth Obs. Remote Sens. 2023, 17, 1176–1190. [Google Scholar] [CrossRef]
- Cheng, G.; Han, J.; Guo, L.; Liu, Z.; Bu, S.; Ren, J. Effective and efficient midlevel visual elements-oriented land-use classification using VHR remote sensing images. IEEE Trans. Geosci. Remote Sens. 2015, 53, 4238–4249. [Google Scholar] [CrossRef]
- Liu, X.; He, J.; Yao, Y.; Zhang, J.; Liang, H.; Wang, H.; Hong, Y. Classifying urban land use by integrating remote sensing and social media data. Int. J. Geogr. Inf. Sci. 2017, 31, 1675–1696. [Google Scholar] [CrossRef]
- Xu, Z.; Zhang, W.; Zhang, T.; Yang, Z.; Li, J. Efficient transformer for remote sensing image segmentation. Remote Sens. 2021, 13, 3585. [Google Scholar] [CrossRef]
- Fang, F.; Xu, R.; Li, S.; Hao, Q.; Zheng, K.; Wu, K.; Wan, B. Semi-supervised building instance extraction from high-resolution remote sensing imagery. IEEE Trans. Geosci. Remote Sens. 2023, 61, 5619212. [Google Scholar] [CrossRef]
- Zhou, S.; Feng, Y.; Li, S.; Zheng, D.; Fang, F.; Liu, Y.; Wan, B. DSM-assisted unsupervised domain adaptive network for semantic segmentation of remote sensing imagery. IEEE Trans. Geosci. Remote Sens. 2023, 61, 5608216. [Google Scholar] [CrossRef]
- Zheng, D.; Li, S.; Fang, F.; Zhang, J.; Feng, Y.; Wan, B.; Liu, Y. Utilizing Bounding Box Annotations for Weakly Supervised Building Extraction from Remote Sensing Images. IEEE Trans. Geosci. Remote Sens. 2023, 61, 4702517. [Google Scholar] [CrossRef]
- Zhang, Y.; Yuan, Y.; Feng, Y.; Lu, X. Hierarchical and robust convolutional neural network for very high-resolution remote sensing object detection. IEEE Trans. Geosci. Remote Sens. 2019, 57, 5535–5548. [Google Scholar] [CrossRef]
- Shi, G.; Zhang, J.; Liu, J.; Zhang, C.; Zhou, C.; Yang, S. Global context-augmented objection detection in VHR optical remote sensing images. IEEE Trans. Geosci. Remote Sens. 2020, 59, 10604–10617. [Google Scholar] [CrossRef]
- Tian, Z.; Zhan, R.; Hu, J.; Wang, W.; He, Z.; Zhuang, Z. Generating anchor boxes based on attention mechanism for object detection in remote sensing images. Remote Sens. 2020, 12, 2416. [Google Scholar] [CrossRef]
- Yu, D.; Ji, S. A new spatial-oriented object detection framework for remote sensing images. IEEE Trans. Geosci. Remote Sens. 2021, 60, 4407416. [Google Scholar] [CrossRef]
- Li, X.; Deng, J.; Fang, Y. Few-shot object detection on remote sensing images. IEEE Trans. Geosci. Remote Sens. 2021, 60, 5601614. [Google Scholar] [CrossRef]
- Ma, W.; Li, N.; Zhu, H.; Jiao, L.; Tang, X.; Guo, Y.; Hou, B. Feature split–merge–enhancement network for remote sensing object detection. IEEE Trans. Geosci. Remote Sens. 2022, 60, 5616217. [Google Scholar] [CrossRef]
- Deng, Z.; Sun, H.; Zhou, S.; Zhao, J.; Lei, L.; Zou, H. Multi-scale object detection in remote sensing imagery with convolutional neural networks. ISPRS J. Photogramm. Remote Sens. 2018, 145, 3–22. [Google Scholar] [CrossRef]
- Li, Q.; Chen, Y.; Zeng, Y. Transformer with transfer CNN for remote-sensing-image object detection. Remote Sens. 2022, 14, 984. [Google Scholar] [CrossRef]
- Zhang, G.; Lu, S.; Zhang, W. CAD-Net: A context-aware detection network for objects in remote sensing imagery. IEEE Trans. Geosci. Remote Sens. 2019, 57, 10015–10024. [Google Scholar] [CrossRef]
- Sun, X.; Wang, P.; Wang, C.; Liu, Y.; Fu, K. PBNet: Part-based convolutional neural network for complex composite object detection in remote sensing imagery. ISPRS J. Photogramm. Remote Sens. 2021, 173, 50–65. [Google Scholar] [CrossRef]
- Wang, C.; Bai, X.; Wang, S.; Zhou, J.; Ren, P. Multiscale visual attention networks for object detection in VHR remote sensing images. IEEE Geosci. Remote Sens. Lett. 2018, 16, 310–314. [Google Scholar] [CrossRef]
- Sharifuzzaman Sagar, A.; Chen, Y.; Xie, Y.; Kim, H.S. MSA R-CNN: A comprehensive approach to remote sensing object detection and scene understanding. Expert Syst. Appl. 2024, 241, 122788. [Google Scholar] [CrossRef]
- Xiao, J.; Yao, Y.; Zhou, J.; Guo, H.; Yu, Q.; Wang, Y.F. FDLR-Net: A feature decoupling and localization refinement network for object detection in remote sensing images. Expert Syst. Appl. 2023, 225, 120068. [Google Scholar] [CrossRef]
- Chen, Y.; Liu, Q.; Wang, T.; Wang, B.; Meng, X. Rotation-invariant and relation-aware cross-domain adaptation object detection network for optical remote sensing images. Remote Sens. 2021, 13, 4386. [Google Scholar] [CrossRef]
- Xu, T.; Sun, X.; Diao, W.; Zhao, L.; Fu, K.; Wang, H. FADA: Feature aligned domain adaptive object detection in remote sensing imagery. IEEE Trans. Geosci. Remote Sens. 2022, 60, 5617916. [Google Scholar] [CrossRef]
- Zhu, Y.; Sun, X.; Diao, W.; Li, H.; Fu, K. Rfa-net: Reconstructed feature alignment network for domain adaptation object detection in remote sensing imagery. IEEE J. Sel. Top. Appl. Earth Obs. Remote Sens. 2022, 15, 5689–5703. [Google Scholar] [CrossRef]
- Zhu, Y.; Sun, X.; Diao, W.; Wei, H.; Fu, K. Dualda-net: Dual-head rectification for cross domain object detection of remote sensing. IEEE Trans. Geosci. Remote Sens. 2023, 61, 5612616. [Google Scholar] [CrossRef]
- Koga, Y.; Miyazaki, H.; Shibasaki, R. Adapting Vehicle Detector to Target Domain by Adversarial Prediction Alignment. In Proceedings of the 2021 IEEE International Geoscience and Remote Sensing Symposium IGARSS, Brussels, Belgium, 11–16 July 2021; pp. 2341–2344. [Google Scholar]
- Li, X.; Luo, M.; Ji, S.; Zhang, L.; Lu, M. Evaluating generative adversarial networks based image-level domain transfer for multi-source remote sensing image segmentation and object detection. Int. J. Remote Sens. 2020, 41, 7343–7367. [Google Scholar] [CrossRef]
- Chen, J.; Sun, J.; Li, Y.; Hou, C. Object detection in remote sensing images based on deep transfer learning. Multimed. Tools Appl. 2022, 81, 12093–12109. [Google Scholar] [CrossRef]
- Koga, Y.; Miyazaki, H.; Shibasaki, R. A method for vehicle detection in high-resolution satellite images that uses a region-based object detector and unsupervised domain adaptation. Remote Sens. 2020, 12, 575. [Google Scholar] [CrossRef]
- Liu, Y.C.; Ma, C.Y.; He, Z.; Kuo, C.C.; Chen, K.; Zhang, P.; Wu, B.; Kira, Z.; Vajda, P. Unbiased Teacher for Semi-Supervised Object Detection. In Proceedings of the International Conference on Learning Representations, Online, 3–7 May 2021. [Google Scholar]
- Zhou, J.; Bischof, W.F.; Caelli, T. Road tracking in aerial images based on human–computer interaction and Bayesian filtering. ISPRS J. Photogramm. Remote Sens. 2006, 61, 108–124. [Google Scholar] [CrossRef]
- Kim, T.; Park, S.R.; Kim, M.G.; Jeong, S.; Kim, K.O. Tracking road centerlines from high resolution remote sensing images by least squares correlation matching. Photogramm. Eng. Remote Sens. 2004, 70, 1417–1422. [Google Scholar] [CrossRef]
- Zhang, J.; Lin, X.; Liu, Z.; Shen, J. Semi-automatic road tracking by template matching and distance transformation in urban areas. Int. J. Remote Sens. 2011, 32, 8331–8347. [Google Scholar] [CrossRef]
- Irvin, R.B.; McKeown, D.M. Methods for exploiting the relationship between buildings and their shadows in aerial imagery. IEEE Trans. Syst. Man. Cybern. 1989, 19, 1564–1575. [Google Scholar] [CrossRef]
- Huertas, A.; Nevatia, R. Detecting buildings in aerial images. Comput. Vis. Graph. Image Process. 1988, 41, 131–152. [Google Scholar] [CrossRef]
- Weidner, U.; Förstner, W. Towards automatic building extraction from high-resolution digital elevation models. ISPRS J. Photogramm. Remote Sens. 1995, 50, 38–49. [Google Scholar] [CrossRef]
- Li, Z.; Wang, Y.; Zhang, N.; Zhang, Y.; Zhao, Z.; Xu, D.; Ben, G.; Gao, Y. Deep learning-based object detection techniques for remote sensing images: A survey. Remote Sens. 2022, 14, 2385. [Google Scholar] [CrossRef]
- Shi, Z.; Yu, X.; Jiang, Z.; Li, B. Ship detection in high-resolution optical imagery based on anomaly detector and local shape feature. IEEE Trans. Geosci. Remote Sens. 2013, 52, 4511–4523. [Google Scholar]
- Zhang, W.; Sun, X.; Fu, K.; Wang, C.; Wang, H. Object detection in high-resolution remote sensing images using rotation invariant parts based model. IEEE Geosci. Remote Sens. Lett. 2013, 11, 74–78. [Google Scholar] [CrossRef]
- Zhang, W.; Sun, X.; Wang, H.; Fu, K. A generic discriminative part-based model for geospatial object detection in optical remote sensing images. ISPRS J. Photogramm. Remote Sens. 2015, 99, 30–44. [Google Scholar] [CrossRef]
- Zheng, Y.; Sun, P.; Zhou, Z.; Xu, W.; Ren, Q. ADT-Det: Adaptive dynamic refined single-stage transformer detector for arbitrary-oriented object detection in satellite optical imagery. Remote Sens. 2021, 13, 2623. [Google Scholar] [CrossRef]
- Zhang, Y.; Liu, X.; Wa, S.; Chen, S.; Ma, Q. GANsformer: A detection network for aerial images with high performance combining convolutional network and transformer. Remote Sens. 2022, 14, 923. [Google Scholar] [CrossRef]
- Oza, P.; Sindagi, V.A.; Sharmini, V.V.; Patel, V.M. Unsupervised domain adaptation of object detectors: A survey. IEEE Trans. Pattern Anal. Mach. Intell. 2023, 14, 4018–4040. [Google Scholar] [CrossRef] [PubMed]
- Zheng, Y.; Huang, D.; Liu, S.; Wang, Y. Cross-domain object detection through coarse-to-fine feature adaptation. In Proceedings of the IEEE/CVF Conference on Computer Vision and Pattern Recognition, Seattle, WA, USA, 13–19 June 2020; pp. 13766–13775. [Google Scholar]
- Zhu, J.Y.; Park, T.; Isola, P.; Efros, A.A. Unpaired image-to-image translation using cycle-consistent adversarial networks. In Proceedings of the IEEE international Conference on Computer Vision, Venice, Italy, 22–29 October 2017; pp. 2223–2232. [Google Scholar]
- Deng, J.; Li, W.; Chen, Y.; Duan, L. Unbiased mean teacher for cross-domain object detection. In Proceedings of the IEEE/CVF Conference on Computer Vision and Pattern Recognition, Nashville, TN, USA, 20–25 June 2021; pp. 4091–4101. [Google Scholar]
- Zhang, D.; Li, J.; Xiong, L.; Lin, L.; Ye, M.; Yang, S. Cycle-consistent domain adaptive faster RCNN. IEEE Access 2019, 7, 123903–123911. [Google Scholar] [CrossRef]
- Arruda, V.F.; Paixao, T.M.; Berriel, R.F.; De Souza, A.F.; Badue, C.; Sebe, N.; Oliveira-Santos, T. Cross-domain car detection using unsupervised image-to-image translation: From day to night. In Proceedings of the 2019 International Joint Conference on Neural Networks (IJCNN), Budapest, Hungary, 14–19 July 2019; pp. 1–8. [Google Scholar]
- Li, Y.J.; Dai, X.; Ma, C.Y.; Liu, Y.C.; Chen, K.; Wu, B.; He, Z.; Kitani, K.; Vajda, P. Cross-domain adaptive teacher for object detection. In Proceedings of the IEEE/CVF Conference on Computer Vision and Pattern Recognition, New Orleans, LA, USA, 18–24 June 2022; pp. 7581–7590. [Google Scholar]
- Cai, Q.; Pan, Y.; Ngo, C.W.; Tian, X.; Duan, L.; Yao, T. Exploring object relation in mean teacher for cross-domain detection. In Proceedings of the IEEE/CVF Conference on Computer Vision and Pattern Recognition, Long Beach, CA, USA, 15–20 June 2019; pp. 11457–11466. [Google Scholar]
- Tang, S.; Cheng, Z.; Pu, S.; Guo, D.; Niu, Y.; Wu, F. Learning a domain classifier bank for unsupervised adaptive object detection. arXiv 2020, arXiv:2007.02595. [Google Scholar]
- Biswas, D.; Tešić, J. Domain Adaptation With Contrastive Learning for Object Detection in Satellite Imagery. IEEE Trans. Geosci. Remote Sens. 2024, 62, 5620615. [Google Scholar] [CrossRef]
- Saito, K.; Ushiku, Y.; Harada, T.; Saenko, K. Strong-weak distribution alignment for adaptive object detection. In Proceedings of the IEEE/CVF Conference on Computer Vision and Pattern Recognition, Long Beach, CA, USA, 15–20 June 2019; pp. 6956–6965. [Google Scholar]
- Lin, T.Y.; Goyal, P.; Girshick, R.; He, K.; Dollár, P. Focal loss for dense object detection. In Proceedings of the IEEE International Conference on Computer Vision, Venice, Italy, 22–29 October 2017; pp. 2980–2988. [Google Scholar]
- Ren, S.; He, K.; Girshick, R.; Sun, J. Faster r-cnn: Towards real-time object detection with region proposal networks. Adv. Neural Inf. Process. Syst. 2015, 28, 1137–1149. [Google Scholar] [CrossRef]
- Cheng, G.; Han, J.; Zhou, P.; Guo, L. Multi-class geospatial object detection and geographic image classification based on collection of part detectors. ISPRS J. Photogramm. Remote Sens. 2014, 98, 119–132. [Google Scholar] [CrossRef]
- Cramer, M. The DGPF-test on digital airborne camera evaluation overview and test design. Photogramm.-Fernerkund.-Geoinf. 2010, 2010, 73–82. [Google Scholar] [CrossRef]
- Li, K.; Wan, G.; Cheng, G.; Meng, L.; Han, J. Object detection in optical remote sensing images: A survey and a new benchmark. ISPRS J. Photogramm. Remote Sens. 2020, 159, 296–307. [Google Scholar] [CrossRef]
- Chen, Y.; Li, W.; Sakaridis, C.; Dai, D.; Van Gool, L. Domain adaptive faster r-cnn for object detection in the wild. In Proceedings of the IEEE Conference on Computer Vision and Pattern Recognition, Salt Lake City, UT, USA, 18–23 June 2018; pp. 3339–3348. [Google Scholar]
- Mattolin, G.; Zanella, L.; Ricci, E.; Wang, Y. Confmix: Unsupervised domain adaptation for object detection via confidence-based mixing. In Proceedings of the IEEE/CVF Winter Conference on Applications of Computer Vision, Waikoloa, HI, USA, 2–7 January 2023; pp. 423–433. [Google Scholar]

| Dataset | NWPU VHR-10 | DIOR* | HRRSD* |
|---|---|---|---|
| Vehicle | 598 | 11,582 | 4756 |
| Ship | 302 | 23,319 | 3975 |
| Harbor | 224 | 2041 | 3902 |
| Airplane | 757 | 1712 | 4901 |
| Ground track field | 163 | 998 | 4033 |
| Tennis court | 524 | 4142 | 4402 |
| Storage tank | 655 | 2502 | 4424 |
| Bridge | 124 | 1122 | 4651 |
| Basketball court | 159 | 909 | 4064 |
| Baseball field | 390 | 2083 | 4042 |
| Image number | 650 | 6997 | 17,016 |
| Instance number | 3896 | 50,410 | 43,168 |
| Method | Vehicle | Storage Tank | Ship | Harbor | Airplane | Ground Track Field | Tennis Court | Basketball Court | Baseball Field | Bridge | mAP |
|---|---|---|---|---|---|---|---|---|---|---|---|
| SourceOnly | 25.62 | 10.33 | 5.80 | 4.38 | 50.67 | 44.65 | 71.97 | 25.61 | 72.72 | 1.70 | 31.34 |
| DA-Faster | 23.21 | 16.78 | 3.92 | 10.94 | 54.66 | 64.28 | 77.71 | 41.42 | 80.95 | 4.02 | 37.79 |
| RFA-Net | 37.93 | 42.78 | 15.98 | 17.94 | 80.47 | 70.29 | 88.62 | 66.86 | 87.95 | 8.64 | 51.74 |
| AT | 35.55 | 60.92 | 12.11 | 6.76 | 73.18 | 63.59 | 90.53 | 43.79 | 90.32 | 11.08 | 48.78 |
| ConfMix | 37.28 | 66.61 | 20.62 | 17.73 | 77.94 | 63.52 | 91.76 | 62.66 | 92.35 | 10.04 | 54.05 |
| Proposed method | 39.75 | 64.83 | 21.88 | 14.78 | 82.13 | 63.91 | 92.68 | 61.93 | 94.11 | 14.67 | 55.07 |
| Method | Vehicle | Storage Tank | Ship | Harbor | Airplane | Ground Track Field | Tennis Court | Basketball Court | Baseball Field | Bridge | mAP |
|---|---|---|---|---|---|---|---|---|---|---|---|
| SourceOnly | 56.95 | 12.49 | 24.29 | 21.74 | 67.38 | 21.83 | 50.37 | 16.42 | 10.42 | 12.57 | 29.45 |
| DA-Faster | 72.51 | 14.92 | 35.27 | 47.55 | 71.64 | 66.57 | 55.83 | 17.82 | 15.50 | 25.72 | 42.33 |
| RFA-Net | 46.11 | 65.86 | 43.09 | 56.19 | 88.15 | 70.29 | 64.34 | 22.06 | 19.25 | 47.16 | 52.25 |
| AT | 56.45 | 93.02 | 39.21 | 20.56 | 70.11 | 83.82 | 67.27 | 25.00 | 16.59 | 34.05 | 50.61 |
| ConfMix | 69.91 | 73.25 | 34.66 | 37.93 | 73.21 | 67.08 | 72.18 | 29.24 | 16.93 | 53.05 | 52.74 |
| Proposed method | 70.48 | 92.06 | 41.70 | 26.04 | 80.77 | 74.65 | 76.36 | 31.78 | 17.08 | 55.30 | 56.62 |
| Method | Vehicle | Storage Tank | Ship | Harbor | Airplane | Ground Track Field | Tennis Court | Basketball Court | Baseball Field | Bridge | mAP |
|---|---|---|---|---|---|---|---|---|---|---|---|
| SourceOnly | 17.85 | 79.00 | 19.69 | 21.87 | 86.02 | 57.80 | 66.75 | 14.14 | 10.57 | 17.87 | 39.16 |
| DA-Faster | 21.63 | 88.61 | 9.32 | 30.95 | 82.46 | 58.04 | 66.15 | 14.21 | 11.52 | 14.66 | 39.76 |
| RFA-Net | 27.17 | 83.21 | 52.58 | 36.84 | 90.05 | 83.73 | 70.07 | 22.35 | 24.65 | 37.46 | 52.81 |
| AT | 20.94 | 86.02 | 23.70 | 45.87 | 96.78 | 86.83 | 85.72 | 24.30 | 18.02 | 24.89 | 51.31 |
| ConfMix | 25.47 | 86.21 | 38.25 | 41.73 | 97.26 | 86.41 | 87.02 | 25.32 | 17.21 | 33.26 | 53.81 |
| Proposed method | 26.75 | 90.09 | 41.65 | 33.35 | 97.52 | 88.42 | 85.04 | 23.00 | 16.37 | 41.53 | 54.47 |
| PFA | IMFA | INFA | mAP | |
|---|---|---|---|---|
| Proposed method | ✓ | ✓ | ✓ | 55.07 |
| w/o PFA | - | ✓ | ✓ | 51.34 |
| w/o IMFA | ✓ | - | ✓ | 52.61 |
| w/o INFA | ✓ | ✓ | - | 51.98 |
| w/o IMFA and INFA | ✓ | - | - | 50.22 |
| w/o MPFA and INFA | - | ✓ | - | 49.18 |
| w/o MPFA and IMFA | - | - | ✓ | 49.59 |
Disclaimer/Publisher’s Note: The statements, opinions and data contained in all publications are solely those of the individual author(s) and contributor(s) and not of MDPI and/or the editor(s). MDPI and/or the editor(s) disclaim responsibility for any injury to people or property resulting from any ideas, methods, instructions or products referred to in the content. |
© 2025 by the authors. Licensee MDPI, Basel, Switzerland. This article is an open access article distributed under the terms and conditions of the Creative Commons Attribution (CC BY) license (https://creativecommons.org/licenses/by/4.0/).
Share and Cite
Fang, F.; Kang, J.; Li, S.; Tian, P.; Liu, Y.; Luo, C.; Zhou, S. Multi-Granularity Domain-Adaptive Teacher for Unsupervised Remote Sensing Object Detection. Remote Sens. 2025, 17, 1743. https://doi.org/10.3390/rs17101743
Fang F, Kang J, Li S, Tian P, Liu Y, Luo C, Zhou S. Multi-Granularity Domain-Adaptive Teacher for Unsupervised Remote Sensing Object Detection. Remote Sensing. 2025; 17(10):1743. https://doi.org/10.3390/rs17101743
Chicago/Turabian StyleFang, Fang, Jianing Kang, Shengwen Li, Panpan Tian, Yang Liu, Chaoliang Luo, and Shunping Zhou. 2025. "Multi-Granularity Domain-Adaptive Teacher for Unsupervised Remote Sensing Object Detection" Remote Sensing 17, no. 10: 1743. https://doi.org/10.3390/rs17101743
APA StyleFang, F., Kang, J., Li, S., Tian, P., Liu, Y., Luo, C., & Zhou, S. (2025). Multi-Granularity Domain-Adaptive Teacher for Unsupervised Remote Sensing Object Detection. Remote Sensing, 17(10), 1743. https://doi.org/10.3390/rs17101743