Article

Anthropogenic Forcing on the Coevolution of Tidal Creeks and Vegetation in the Dongtan Wetland, Changjiang Estuary

1
State Key Laboratory of Marine Geology, Tongji University, Shanghai 200092, China
2
Laboratory of Marine Geology, Qingdao Marine Science and Technology Center, Qingdao 266237, China
3
Shanghai Institute of Natural Resources Survey and Utilization, Shanghai 200072, China
*
Author to whom correspondence should be addressed.
Remote Sens. 2025, 17(10), 1692; https://doi.org/10.3390/rs17101692
Submission received: 1 March 2025 / Revised: 2 May 2025 / Accepted: 6 May 2025 / Published: 12 May 2025
(This article belongs to the Special Issue Remote Sensing of Coastal, Wetland, and Intertidal Zones)

Abstract

:
Multi-driver interactions shape estuarine wetland evolution, yet the intricate evolution patterns and their controlling factors their spatiotemporal dynamics remain inadequately understood. This study employs high-resolution satellite data (1985–2020) and 3S technology (overall classification accuracy: 92.44%, Kappa coefficient: 0.9132) to reveal the development of tidal creeks and vegetation evolution patterns of the Dongtan wetland. Our findings indicate a transition in the development of tidal creeks and vegetation from a natural stage to an artificial intervention stage. Northern regions exhibited severe degradation of both vegetation and tidal creeks influenced by reclamation, contrasting with southern recovery post-restoration. This disparity highlights the varied responses to human activities across different areas of the Dongtan wetland. Notably, the introduction of the invasive species Spartina alterniflora has negatively impacted the habitat of native vegetation. The interaction mechanism between vegetation and tidal creeks manifest as: vegetation constrains tidal creek development through substrate stabilization, wave dissipation, and sediment retention, while tidal creeks modulate physicochemical properties of the substrate hydrological connectivity and seed dispersal, affecting vegetation zonation and community structures. Human activities exert dual modulation effects on the Dongtan wetland, driving its phase transition from natural to artificial landscapes, with artificial landscapes exhibiting the most dynamic landscape type through reclamation and ecological restoration projects. Our findings enhance the understanding of the mechanisms underlying estuarine wetland development and inform strategies for restoring healthy estuarine wetland ecosystems.

1. Introduction

Tidal-flat wetlands serve as critical transition zones characterized by significant interactions between land and sea ecosystems, making them an essential component of coastal zones [1,2,3,4,5]. These wetlands are distinguished by their rich biodiversity and high productivity, serving important ecological functions such as sediment siltation, material cycling, and pollution mitigation [6,7,8,9]. However, the dynamic interplay of physical, chemical, and biological processes within tidal-flat wetlands renders their ecosystems fragile and susceptible to external disturbances [10,11].
Research on tidal-flat wetlands began in the 1950s, with scholars conducting preliminary explorations, long-term surveys, and sampling analyses through field studies. These efforts elucidated the topographic features and evolutionary patterns of tidal-flat wetlands during their initial stages [12,13]. The advent of remote sensing technology in the 1980s significantly enhanced research capabilities by overcoming the limitations of traditional field investigations. This technology provided cost-effective, high-resolution spatial and temporal data, enabling large-scale monitoring of dynamic changes in tidal-flat wetlands over extended periods [14,15,16,17].
Tidal creeks are essential conduits for exchanging energy and materials between tidal-flat wetlands and the sea, functioning as the most active micro-geomorphic units of land–sea interactions within tidal flats. Their morphological features exhibit significant variations influenced by hydrodynamic forces and human activities [17,18,19,20]. Research on tidal creeks has primarily focused on the mechanisms underlying their formation, evolution, and sedimentary characteristics. Numerous studies have examined the impact of various factors on tidal creek development through field observations and numerical simulations, providing new insights into their formation mechanisms [14,17,21,22,23]. Previous research has underscored the ecological significance of tidal creeks by investigating biodiversity, species composition, and ecological functions, proposing recommendations for their conservation and management [24,25,26]. Furthermore, researchers have analyzed the evolutionary processes and sedimentary dynamics of tidal creek systems by integrating field investigations, remote sensing technologies, and sediment analysis, thereby elucidating mechanisms and sedimentary patterns governing tidal creek evolution [2,27,28,29,30].
As a vital geomorphological component of estuarine wetlands, saltmarsh vegetation provides critical habitats and breeding grounds for waterbirds and diverse benthic organisms. It also delivers essential ecological services, including siltation promotion, flat stabilization, wave dissipation, and shoreline protection [2,31,32,33,34]. The morphological characteristics and evolutionary patterns of saltmarsh vegetation directly reflect biophysical processes shaped by environmental and anthropogenic factors. Recent research on saltmarsh vegetation has focused on three primary areas: vegetation pattern evolution, phenological dynamics, and biomass estimation. Researchers have optimized vegetation classification algorithms by integrating field-collected spectral data with reflectance spectra derived from remote sensing imagery. This approach has improved the classification accuracy of vegetation types and clarified the evolutionary mechanisms and phenological traits of saltmarsh vegetation [35,36,37,38]. Other studies have investigated the impacts of multi-scale dynamic geomorphological processes on saltmarsh vegetation through field investigations and numerical simulations, offering insights for sustainable wetland resource management [39,40,41]. Additionally, researchers have quantified the aboveground biomass of saltmarsh vegetation using field surveys and remote sensing techniques, supporting ecological conservation and blue carbon initiatives in tidal-flat wetlands [42,43,44].
The demand for land in coastal areas has increased significantly over the past few decades due to rising population density and rapid economic development. Reclamation of tidal-flat wetlands has emerged as a primary solution to land scarcity in coastal regions, resulting in the loss of approximately 25–50% of tidal-flat wetlands worldwide [45,46,47]. Since the 1980s, large-scale coastal reclamation projects have been implemented in Shanghai to meet the demands of urban expansion, agriculture, and industrial development [48,49]. Countries that have undertaken extensive tidal-flat wetland reclamation primarily include the Netherlands, Japan, the United States, Italy, South Korea, and Singapore. The objectives of these reclamation efforts align with those in Shanghai, focusing on agricultural development, salt production, and the construction of ports and urban areas [50]. However, the rapid increase in both the rate and scale of reclamation has led to severe environmental degradation. Previous studies have demonstrated that large-scale reclamation poses significant threats to tidal-flat wetlands, including wetland loss, biodiversity decline, habitat destruction, water pollution, and eutrophication [31,51,52,53,54].
Despite a significant reduction in sediment input from upstream of the Changjiang River, siltation in the Dongtan wetland persists. This phenomenon contrasts with the widespread erosion observed at the estuarine delta front and is primarily attributed to large-scale reclamation projects and dike construction [55]. Unlike other tidal flats, the Dongtan wetland has demonstrated exceptional self-adaptation capacity through this process, exhibiting a temporal sequence of both active and passive ecological responses. Such adaptability is critical for deciphering the mechanisms of self-regulation and mediation in human-altered wetland systems. Although extensive research on the Dongtan wetland has employed conventional field surveys and remote sensing technologies, challenges including poor site accessibility, high costs, and prolonged survey timelines have hindered field investigations. Consequently, analyses relying solely on limited short-term cross-sectional data fail to capture the wetland’s comprehensive spatial dynamics. Furthermore, existing remote sensing studies in the Dongtan wetland have focused predominantly on geometric and morphological characterizations, with limited integration of long-term tidal creek development and vegetation evolution patterns.
This gap can be addressed through the use of multi-source, high-resolution satellite data with fine temporal and spatial resolution, which improves the accuracy of landscape type identification and facilitates the extraction of tidal creek attributes and vegetation indices over long-term scales for continuity analysis. This study focuses on the Dongtan wetland in the Changjiang Estuary, aiming to elucidate the bidirectional feedback mechanisms between vegetation pattern evolution (characterized by Normalized Difference Vegetation Index (NDVI)) and tidal creek system development (quantified by tidal creek density, TCD) through the integrated analysis of multi-source high-resolution remote sensing data and field surveys. By further coupling historical engineering construction data, we identified critical stress thresholds and spatially sensitive zones within these feedback relationships. Through the selection of four representative landscape regions of interest (ROIs) and time-series correlation analyses, we deciphered the transition pathway from “natural-dominated” to “human-dominated”. These findings reveal the regulatory role of anthropogenic activities in modulating vegetation-creek interactions, thereby providing theoretical underpinnings for maintaining ecological stability in estuarine wetlands.

2. Materials and Methods
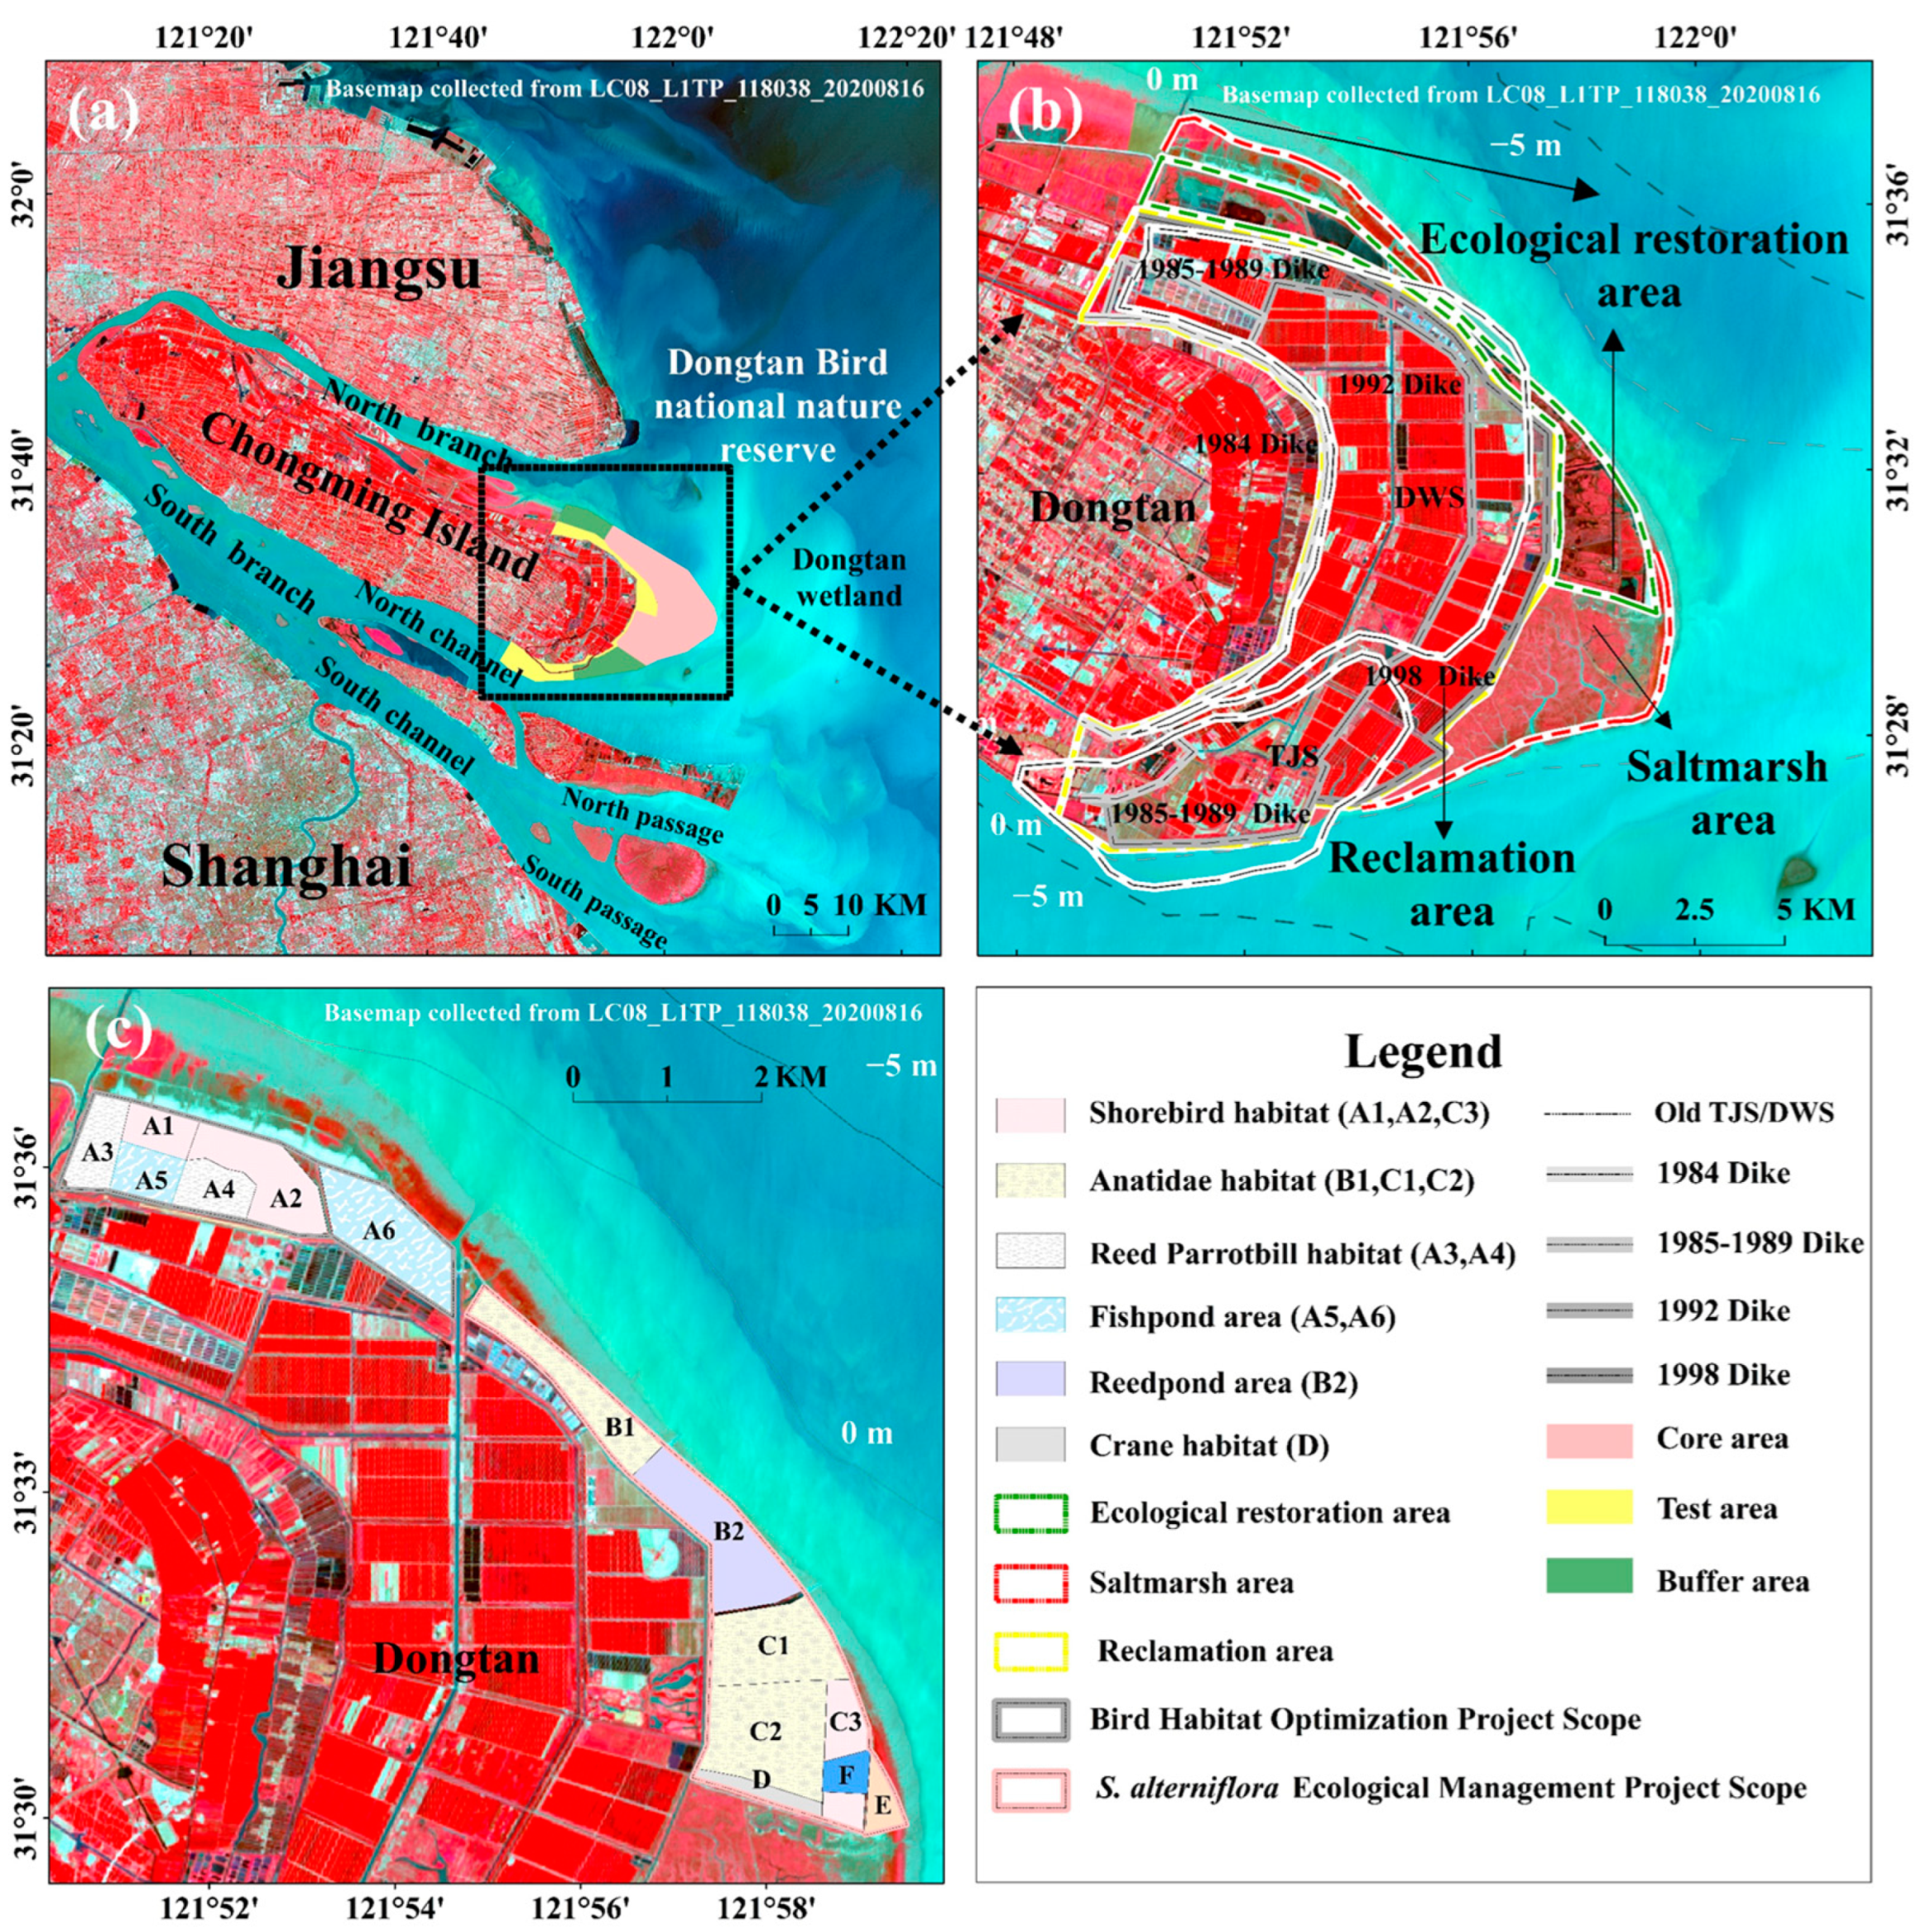
2.1. Study Area

The Changjiang Estuary features a three-tiered branching system with four outlets to the sea (Figure 1a). Characterized by unique hydrodynamic conditions, abundant fine-grained sediment supply, and a gentle slope gradient, the estuary supports the development of extensive tidal-flat wetlands arranged alternately parallel to the main channels [2,3]. The Dongtan wetland, located at the easternmost part of Chongming Island (121°50′–122°05′E, 31°25′–31°38′N), represents the youngest landmass within the estuary. It exhibits the highest siltation rates and is recognized as the largest and most well-developed estuarine tidal-flat wetland in the Changjiang Estuary (Figure 1a) [16,17]. As an open tidal flat, the Dongtan wetland is shaped by the combined influences of river runoff, tidal currents, and wave action. The average tidal range along the Changjiang river mouth varies from 1.96 to 3.08 m, with maximum tidal ranges reaching 4.62–5.95 m [24,55,56,57].
To promote the sustainable development of the Dongtan wetland, the Shanghai government established the Dongtan Bird National Nature Reserve (DBNNR) in 1998. The reserve spans 241.55 km2, accounting for 7.8% of Shanghai’s total wetland area. It is divided into three zones: a core area (165.92 km2), a buffer zone (10.7 km2), and a test zone (64.93 km2) [58,59]. The tidal-flat wetlands are dominated by three vegetation types: Phragmites australis (P. australis), Scirpus mariqueter (S. mariqueter), and Spartina alterniflora (S. alterniflora). Additionally, the Dongtan wetland supports over 70 species of benthic fauna. As a critical habitat along migratory routes, the reserve hosts over one million overwintering waterbirds annually [55,57,60].
Over the past few decades, the Dongtan wetland has undergone multiple large-scale reclamation projects to alleviate intensifying human-land conflicts driven by socio-economic development. The spatial distribution and extent of major reclamation activities between 1985 and 2020 are illustrated in Figure 1b. The cumulative reclaimed areas during this period are as follows: 14.08 km2 (1985–1989), 73.96 km2 (1990–1993), 31.98 km2 (1998–1999), 6 km2 (2001), and 42.93 km2 (2013–2017) (Table S2). Prior to 2013, reclamation primarily aimed at developing backup land resources, whereas post-2013 efforts shifted toward ecological restoration initiatives. In 2013, the S. alterniflora Ecological Management Project (SEMP) and the Bird Habitat Optimization Project (BHOP) were launched in the DBNNR, collectively covering 24.19 km2 (Figure 1c) [59,61].

2.2. Data Sources

The selection of remote sensing images for this study considered the geomorphological dynamics of the Dongtan wetland under varying tidal conditions. We utilized Landsat TM/ETM+/OLI and SPOT 1–5 series satellite imagery acquired during low-tide level (LTL: defined as the lowest water level reached by seawater during periodic tidal fluctuations) with minimal cloud cover in summer months from 1985 to 2020. This study selected 8 primary remote sensing images and 16 auxiliary remote sensing images (Table 1). The 8 primary images were uniformly acquired during summer low-tide periods when the three dominant vegetation types in the Changjiang Estuary (P. australis, S. alterniflora, and S. mariqueter) simultaneously reached their biomass peak phases: P. australis peaks in August, S. alterniflora enters a morphologically stable phase before its September peak, and S. mariqueter exhibits maximum growth in July. This temporal selection minimizes the impact of phenological variations on vegetation cover information extraction. The 16 auxiliary images, covering spring and autumn seasons, serve dual purposes: quantifying seasonal spectral differences in vegetation to optimize classification thresholds for improved accuracy, and leveraging their higher resolution to cross-validate tidal creek extraction results, ensuring morphological inversion reliability. To ensure the spatial comparability of multi-source remote sensing data, this study uniformly resampled all images to a 30-m resolution using the bilinear interpolation method and standardized the coordinate system with the WGS84 UTM projection (Zone 51N), thereby eliminating potential bias effects caused by cross-sensor scale discrepancies on the extraction of vegetation indices (NDVI) and tidal creek properties (TCD).

2.3. Vegetation Information Extraction

2.3.1. Preprocessing Workflow

Vegetation classification was conducted through a multi-stage workflow. Initial preprocessing in ENVI 5.3 included radiometric calibration, FLAASH atmospheric correction, band recombination, mosaicking, and clipping based on optimal indices from literature [55,62].

2.3.2. Feature Extraction and Hierarchical Classification

A multi-feature composite image was synthesized by stacking original spectral bands, vegetation indices (NDVI, TVRI, DVI), and Tasseled Cap components (Brightness, Greenness, Wetness).
The Normalized Difference Vegetation Index (NDVI) was employed to evaluate vegetation vigor, calculated as:
NDVI = ρ N i r ρ R e d ρ N i r + ρ R e d
The Difference Vegetation Index (DVI) was employed to evaluate vegetation coverage, calculated as:
DVI = ρ N i r ρ R e d
The Triangular Vegetation Ratio Index (TVRI) was employed to enhance ability to distinguish between vegetative and non-vegetative features, calculated as:
TVRI = ρ N i r ρ R e d ρ B l u e
where ρ B l u e ,   ρ R e d ,   ρ N i r represent the reflectance values in the blue (450–520 nm), red (630–690 nm), near-infrared (760–900 nm) bands of Landsat TM and ETM+ images, respectively.
Hierarchical classification employed NDVI thresholds (>0.28 for vegetation masking) and spectral signatures: S. alterniflora (NDVI 0.60–0.78; Greenness 0.24–0.32) was distinguished from P. australis (NDVI 0.30–0.67) and S. mariqueter (Brightness 0.15–0.20).

2.3.3. Accuracy Assessment

The accuracy of the classification results is verified through the following steps: ①Post-classification Refinement: historical field surveys and ancillary data were used to correct misclassified pixels and remove spurious polygons caused by spectral noise. ②Accuracy Assessment: a confusion matrix was generated to evaluate classification performance with overall accuracy (OA) and Kappa coefficient (K) as key metrics, with the following formulas:
O A = i = 1 n x i i N
K = N i = 1 n x i i i = 1 n ( x i + · x + i ) N 2 i = 1 n ( x i + · x + i )
where x i i is the number of correctly classified pixels on row i and column i of the error matrix, x i + is the total number of pixels in row i, x + i is the number of pixels in column i , and N is the number of columns in the matrix.
The accuracy assessment yielded an Overall Accuracy of 92.44% and a Kappa coefficient of 0.9132 (Table S1), ensuring reliability for spatiotemporal analysis.

2.4. Tidal Creek Morphometric Analysis

2.4.1. Object-Based Segmentation

Tidal creek networks were extracted via object-based segmentation (ECognition 8.7) with optimized parameters (scale = 10, compactness = 0.5, shape heterogeneity weight = 0.2). This configuration effectively suppressed spectral noise and minimized fragmented patches, enabling accurate extraction of tidal creek morphology across the Dongtan wetland.

2.4.2. Horton–Strahler Classification

Horton–Strahler ordering classified creeks into four hierarchies: ① First-level tidal creeks (TCL1): Unbranched terminal creeks, ② Second-level tidal creeks (TCL2): Confluence of 2 TCL1, ③ Third-level tidal creeks (TCL3): TCL2 convergences, ④ Fourth-level tidal creeks (TCL4): TCL3 convergences, and ⑤ Higher orders: Iteratively defined through upstream convergence [63].

2.4.3. Morphometric Quantification

Three key metrics—Tidal Creek Number (TCN, total count per hierarchy), Tidal Creek Length (TCl, cumulative length per order), and Tidal Creek Density (TCD, length per unit area)—were quantified using ArcGIS 10.2 geometric analytics. TCL exhibited a positive correlation with tidal prism volume and sediment transport capacity, where higher TCL values (e.g., TCL3–TCL4) indicated enhanced geomorphic maturity through efficient material exchange, consistent with established deltaic system dynamics [20]. TCN reflected lateral branching intensity (dominant in lower-order TCL1–TCL2), while TCD (>1.2 km/km2) signaled well-developed drainage networks.

2.4.4. Fractal Dimension Quantification

As a typical fractal structure, tidal creek networks exhibit geometric complexity that cannot be adequately characterized by Euclidean metrics (e.g., length, density). Serving as a proxy indicator for hydrological connectivity and habitat heterogeneity, the fractal dimension (FD) quantifies “spatial filling efficiency” to comprehensively reflect branching complexity and developmental stages. Furthermore, FD’s inherent scale invariance enables seamless integration with multi-source remote sensing data, while its high responsiveness to both natural and anthropogenic disturbances strengthens its validity. These attributes collectively justify FD as a robust quantitative indicator for assessing tidal creek development. FD was computed via the box-counting method implemented in MATLAB (R2021a), following these steps: ① Grid Overlay: a series of square grids with side lengths r (scaled from 10 m to 1000 m) were superimposed on the tidal creek vector layer, ② Grid Occupation Count: for each r, the number of grid cells N(r) intersecting tidal creek channels was recorded. According to the box-counting method, the following relationship exists between FD, r, and N(r):
F D = lim r 0 ln N r ln 1 r
By logarithmically transforming the formula, a one-dimensional linear regression equation can be derived in the Ln(r)-ln(N(r)) coordinate system, where the absolute value of the slope represents the subdimensions of the tidal creek system.

2.5. Spatiotemporal Dynamics Analysis

2.5.1. Markov Transition Matrix

The Markov transition matrix served dual purposes: ① Visualizing spatiotemporal pathways of vegetation succession across consecutive time intervals, and ② Quantifying state transition magnitudes through area-weighted conversion rates. Using ArcGIS 10.2 zonal statistics tools, we computed land cover transitions by spatially intersecting multi-temporal vegetation classification maps. The vegetation transfer matrix was defined as:
    L = L 11 L 12 L 1 n L 21 L 22 L n 1 L n 2 L 2 n L n n
where L 12 represents the degree of transition from state 1 to state 2. The transfer matrix exhibits two key properties based on the degree of state transition within the system: (1) 0 ≤ L 12 ≤ 1; (2) a larger value of L 12 indicates a greater likelihood of transition from state 1 to state 2.

2.5.2. TCD-NDVI Coupling Analysis

The spatiotemporal interplay between TCD-NDVI was quantified using Pearson’s correlation coefficient via MATLAB’s corrcoef function. The spatial correlation analysis adopted a non-overlapping sliding window approach with a grid resolution of 11 × 11 pixels (corresponding to a ground scale of 330 × 330 m, based on Landsat’s 30-m spatial resolution). This window size strikes a balance between capturing the local heterogeneity of tidal creek morphology and the patchy distribution of vegetation communities, while ensuring statistical significance (each window contains 121 valid pixels, satisfying the degrees of freedom requirement for Pearson’s correlation test). Correlation coefficients (CCs) were categorized as: ① Strong Negative (SNC): −1~–0.75, ② Weak Negative (WNC): −0.75~−0.5, ③ Low Correlation (LC): −0.5~0.5, ④ Weak Positive (WPC): 0.5~0.75, and ⑤ Strong Positive (SPC): 0.75~1.
Four regions of interest (ROIs) were analyzed to decode human-natural feedback. ROIs were selected across the Dongtan wetland based on the principles of spatial uniformity, significant landscape transitions, and distinct tidal creek system modifications. These ROIs were utilized to demonstrate spatiotemporal changes in landscape types, combined with time-series correlation analysis (NDVI-TCD), to quantify the influence intensity of different landscapes on tidal creek development. The alternating signs and fluctuations of correlation coefficients reflected the migration or shrinkage of tidal creek systems associated with landscape succession within ROIs. The retention of three decimal places for correlation coefficients was justified by two considerations: 1. NDVI and TCD derived from high-resolution remote sensing data initially yielded 4–5 decimal places; truncating to three decimals balanced the representation of subtle variations with result interpretability; 2. The coefficient sign indicated promotion (positive) or inhibition (negative) of tidal creek development by landscape types, while the absolute value reflected the magnitude. For instance, mudflat areas exhibited positive correlations due to low vegetation coverage (low NDVI) and tidal dynamics promoting creek formation (high TCD), whereas salt marsh zones (high NDVI) showed negative correlations as plant stabilization suppressed creek extension (low TCD).

3. Results

3.1. Vegetation Pattern Evolution

3.1.1. Spatial and Temporal Changes in the Landscape Pattern of the Dongtan Wetland

The evolution of the Dongtan wetland, as analyzed through remote sensing images from 1985 to 2020, shows a continuous seaward expansion of tidal flats. However, recent large-scale land reclamation efforts involving dike construction have resulted in a significant decline in vegetation outside the dike (Figure 2). In 1985, Dongtan wetland exhibited natural development, with P. australis and S. mariqueter as the predominant plant species. P. australis primarily occupied patches in the upper saltmarsh zone, while S. mariqueter was predominately distributed in the lower saltmarsh zone (Figure 2a). By 1990, the merging of the TJS and DWS sandbars facilitated the expansion of the Dongtan wetland; however, a slight decline in the saltmarsh area was recorded. The reclamation project initiated in the southern part of the Dongtan wetland in 1995 significantly diminished the population of P. australis due to dike construction, leading to a drastic reduction in its area. Subsequently, S. mariqueter replaced P. australis and established dominance for the following decade (Figure 2b,c).
S. alterniflora was not accurately identified in remote sensing images until 2000 due to its extremely small patches (Figure 2d). Within a span of just five years, the coverage area of S. alterniflora expanded rapidly (Figure 2e). Following P. australis and S. mariqueter, S. alterniflora emerged as the third dominant vegetation in the Dongtan wetland. By 2010, S. alterniflora aggressively occupied areas previously held by P. australis and S. mariqueter, significantly compromising their variability (Figure 2f).
Recognizing the impacts and potential hazards of biological invasions on native vegetation, the Shanghai government launched three phases of the SEMP in the Dongtan wetland to restore ecosystem balance and rehabilitate habitats (Figure 1c). The northeastern wetland area was enclosed and subjected to harvesting of S. alterniflora to curtail its growth, leading to a drastic reduction in its coverage (Figure 2g). By 2020, the effectiveness of these interventions was evident, with the area of S. alterniflora reduced to less than 1 km2. Native vegetation habitats were restored in the southern wetland, supporting the growth of P. australis as a critical resource for benthic organisms and avian habitats, thereby re-establishing its status as the dominant vegetation (Figure 2h).

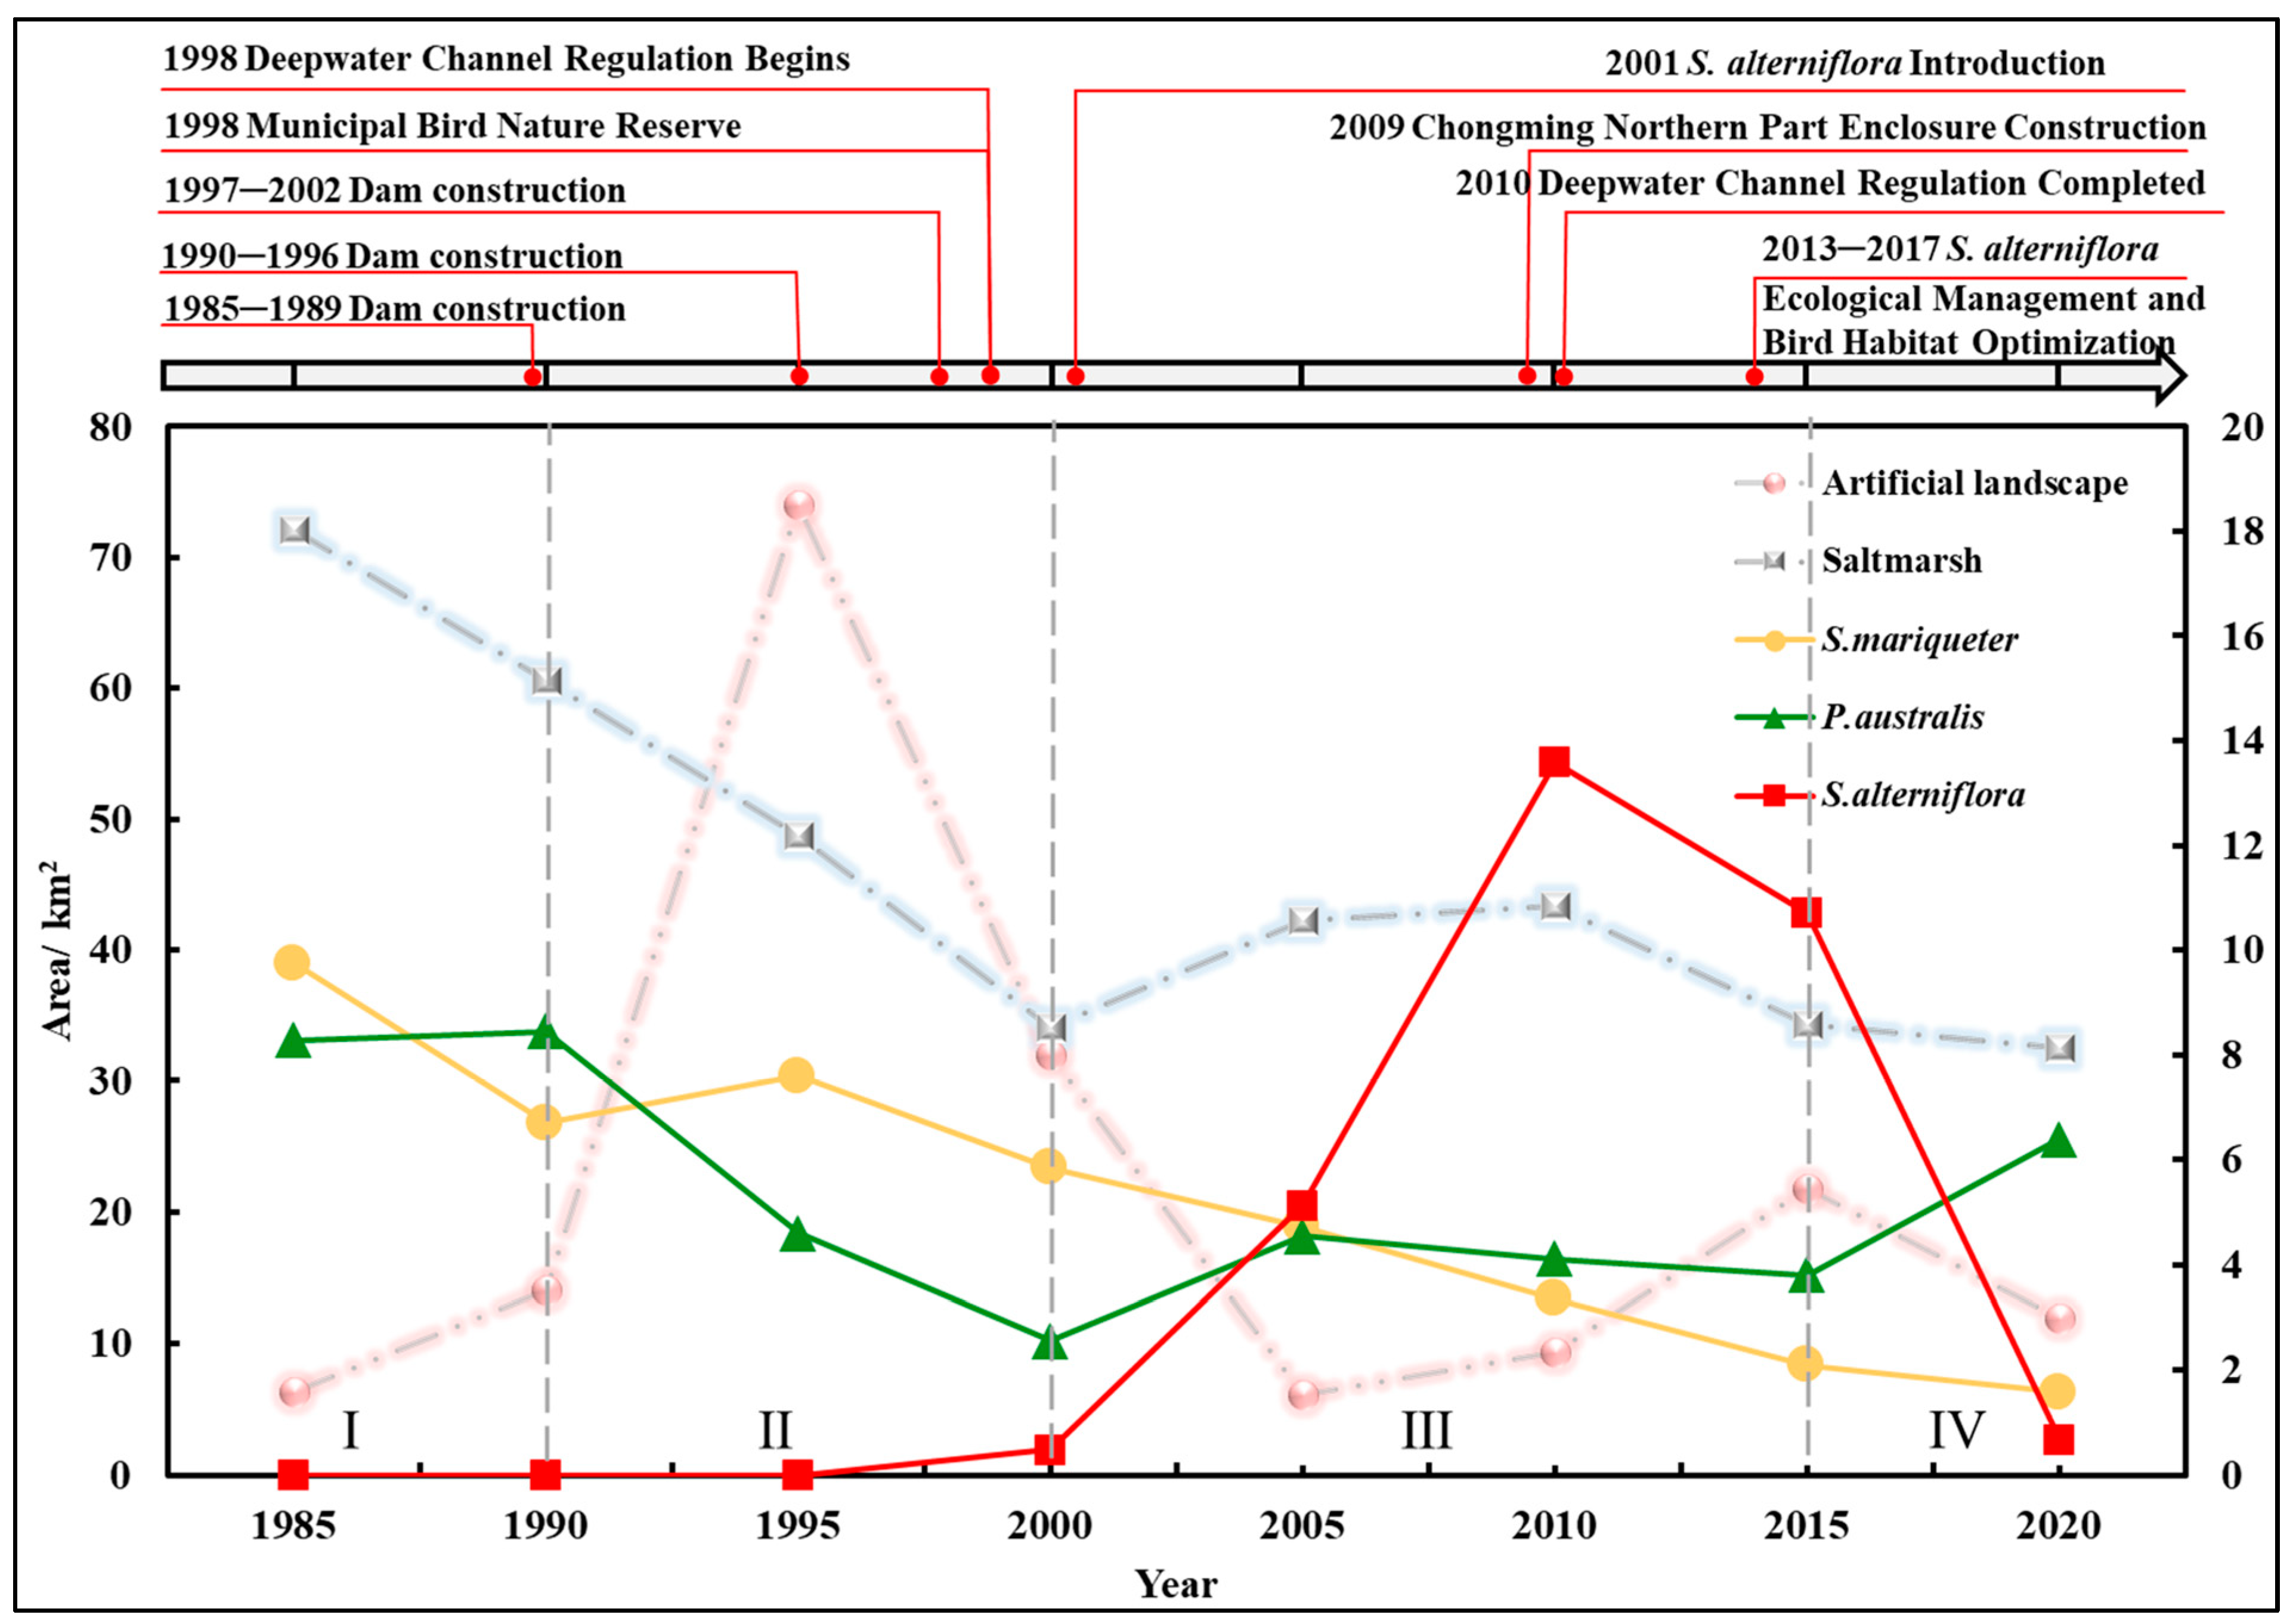
3.1.2. Changes in the Area of Dominant Vegetation

The changes in the coverage areas of different vegetation types from 1985 to 2020 were calculated based on the observed vegetation pattern evolution (Figure 2). The construction intervals of various project types were incorporated to provide a more intuitive representation of the positive or negative responses of vegetation patterns to human activities (Figure 3).
From 1985 to 2020, cumulative land reclamation in the Dongtan wetland reached 175.38 km2, resulting in a 54.8% reduction in saltmarsh area (72.1 km2→32.56 km2). The accelerated loss period (1985–2000) coincided with three large-scale reclamation projects, demonstrating anthropogenic dominance over natural dynamics. During this period, the Changjiang Estuary Deepwater Channel Regulation Project (1998–2010) significantly altered hydrodynamic conditions on the southern Dongtan wetland through its navigation dike system, weakening tidal asymmetry and reducing flood-dominated flow [64]. Diminished hydrodynamic energy triggered sediment dynamic equilibrium restructuring, promoting accretion along the southern front of the engineering zone and creating new sedimentary substrates for saltmarsh vegetation. This engineered accretion effect, coupled with reduced reclamation pressure post-2000, drove tidal flat expansion, enabling a 9.33 km2 recovery in saltmarsh area (2000–2010). The 33.6 km2 ecological restoration zone established in 2013 facilitated native habitat recovery through strategic removal of invasive S. alterniflora biomass (13.59→0.68 km2), achieving measurable rehabilitation of indigenous vegetation, epitomizing adaptive management in human-natural coupled systems.
In 1985, the Dongtan wetland’s two dominant species—P. australis (33 km2) and S. mariqueter (39 km2)—collectively occupied 65% of the saltmarsh area (72.1 km2 total). By 1990, P. australis expanded (+2% areal proportion) while S. mariqueter declined sharply (−31%), reducing their combined dominance to 52% despite tidal flat expansion. The 1995 reclamation surge precipitated a 45% contraction in P. australis (33.79 km2 → 18.39 km2), whereas S. mariqueter—adapted to lower intertidal zones—increased to 30.33 km2, securing its decadal dominance in vegetation succession. Initiated in the 1990s by the Shanghai authorities, S. alterniflora introduction on Chongming Island manifested invasive spread dynamics. Detectable in 2000 satellite imagery (0.49 km2), its coverage surged to 5.13 km2 (2005) and 13.59 km2 (2010) at 1.31 km2/yr expansion rate—displacing native P. australis (16.41 km2) and S. mariqueter (13.39 km2) through competitive exclusion. The three-phase SEMP initiated in 2013 achieved measurable success: S. alterniflora coverage decreased from 13.59 km2 to 10.71 km2 (2015) and further to 0.68 km2 by 2020 (cumulative reduction: 95%). Concurrently, the southern ecological reserve zone facilitated native vegetation rehabilitation, restoring P. australis to 25.56 km2 and S. mariqueter to 6.32 km2.

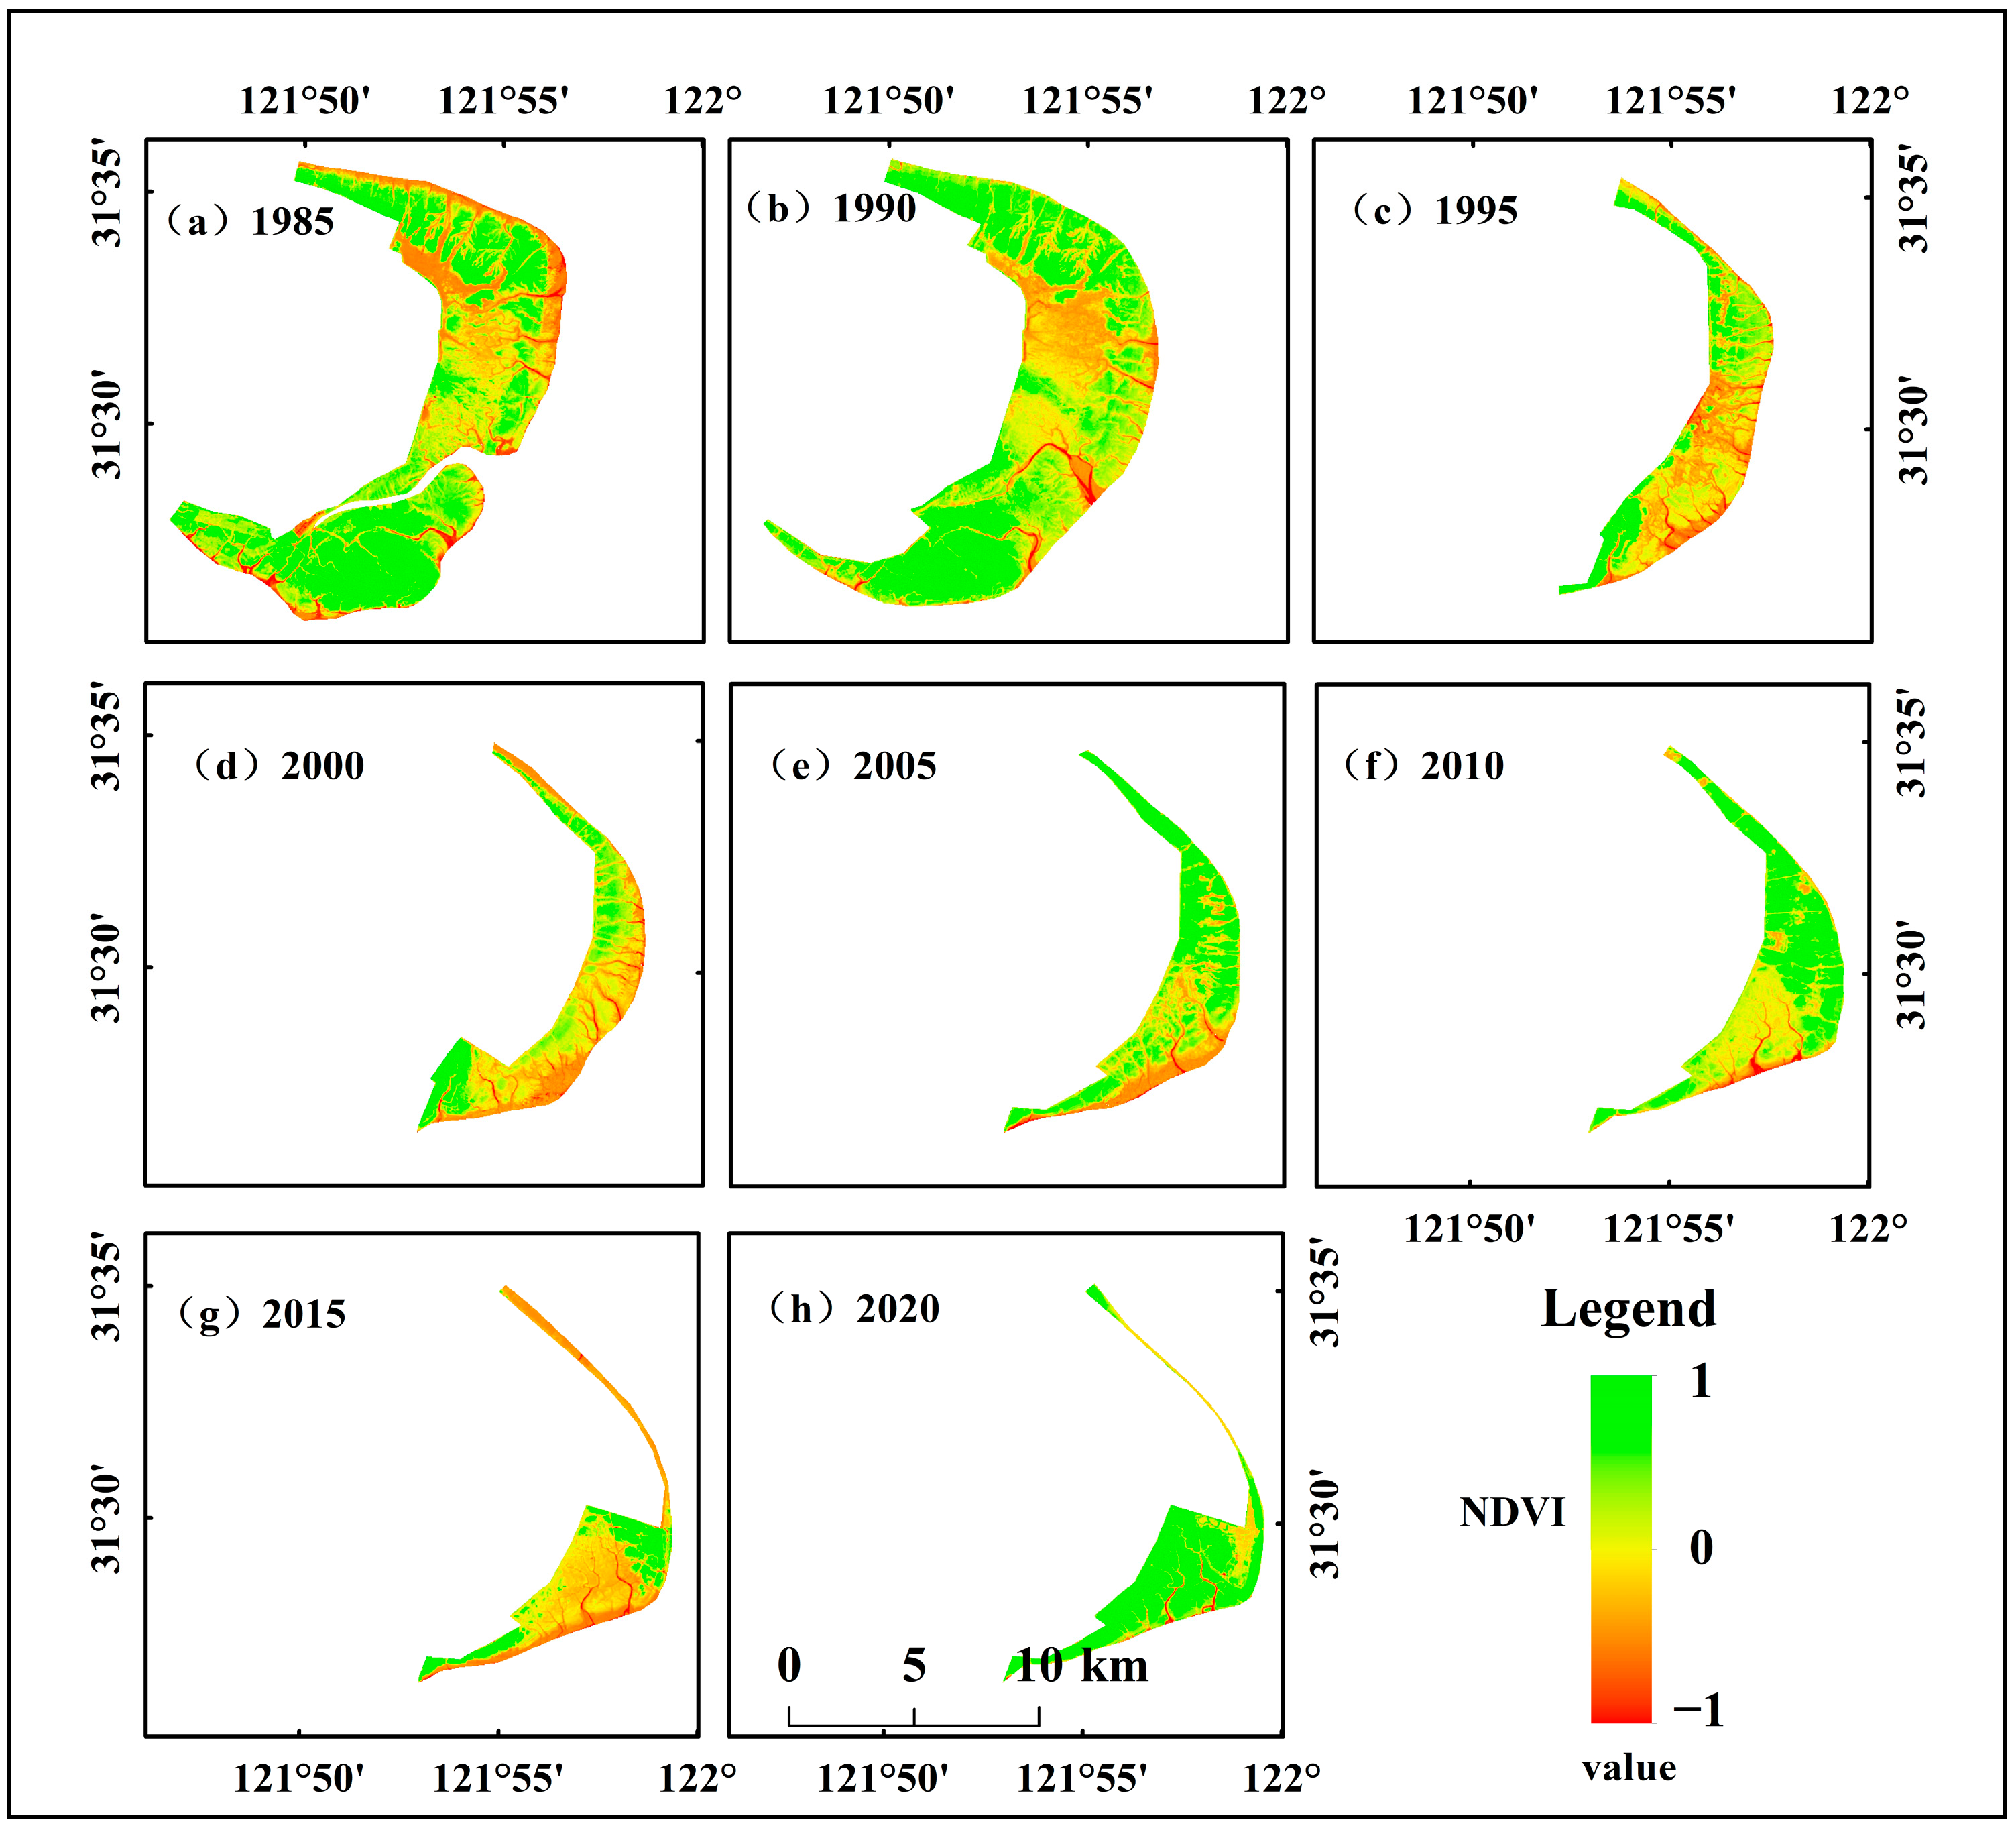
3.1.3. Changes in Vegetation Growth in the Dongtan Wetland

The NDVI distribution in the Dongtan wetland revealed vegetation vigor (NDVI > 0.8) during 1985–1990 (Figure 4a,b). Post-1990 landscape consolidation (TJS and DWS merger into Chongming Island) intensified saline intrusion through tidal creeks, suppressing adjacent vegetation (NDVI < 0.1). Subsequent anthropogenic forcing (1995 onward) triggered geomorphic regime shifts, with over 50% of saltmarshes displaying NDVI < 0.3 by 2000 (Figure 4c,d).
Post-2000, the northern wetland—dominated by S. alterniflora—exhibited peak NDVI values (>0.93) due to dense vegetation cover, while the southern wetland (covered by S. mariqueter and mudflat) showed suppressed growth (NDVI < 0.4) (Figure 4e,f). This north-south dichotomy correlated with salinization gradients, which constrained southern vegetation productivity. The SEMP abruptly reduced northern NDVI to sub-baseline levels (<0.1) in 2015 (Figure 4g). Concurrently, the central wetland’s P. australis stands maintained NDVI up to 0.8, and BHOP successfully restored southern wetlands (Figure 4h).

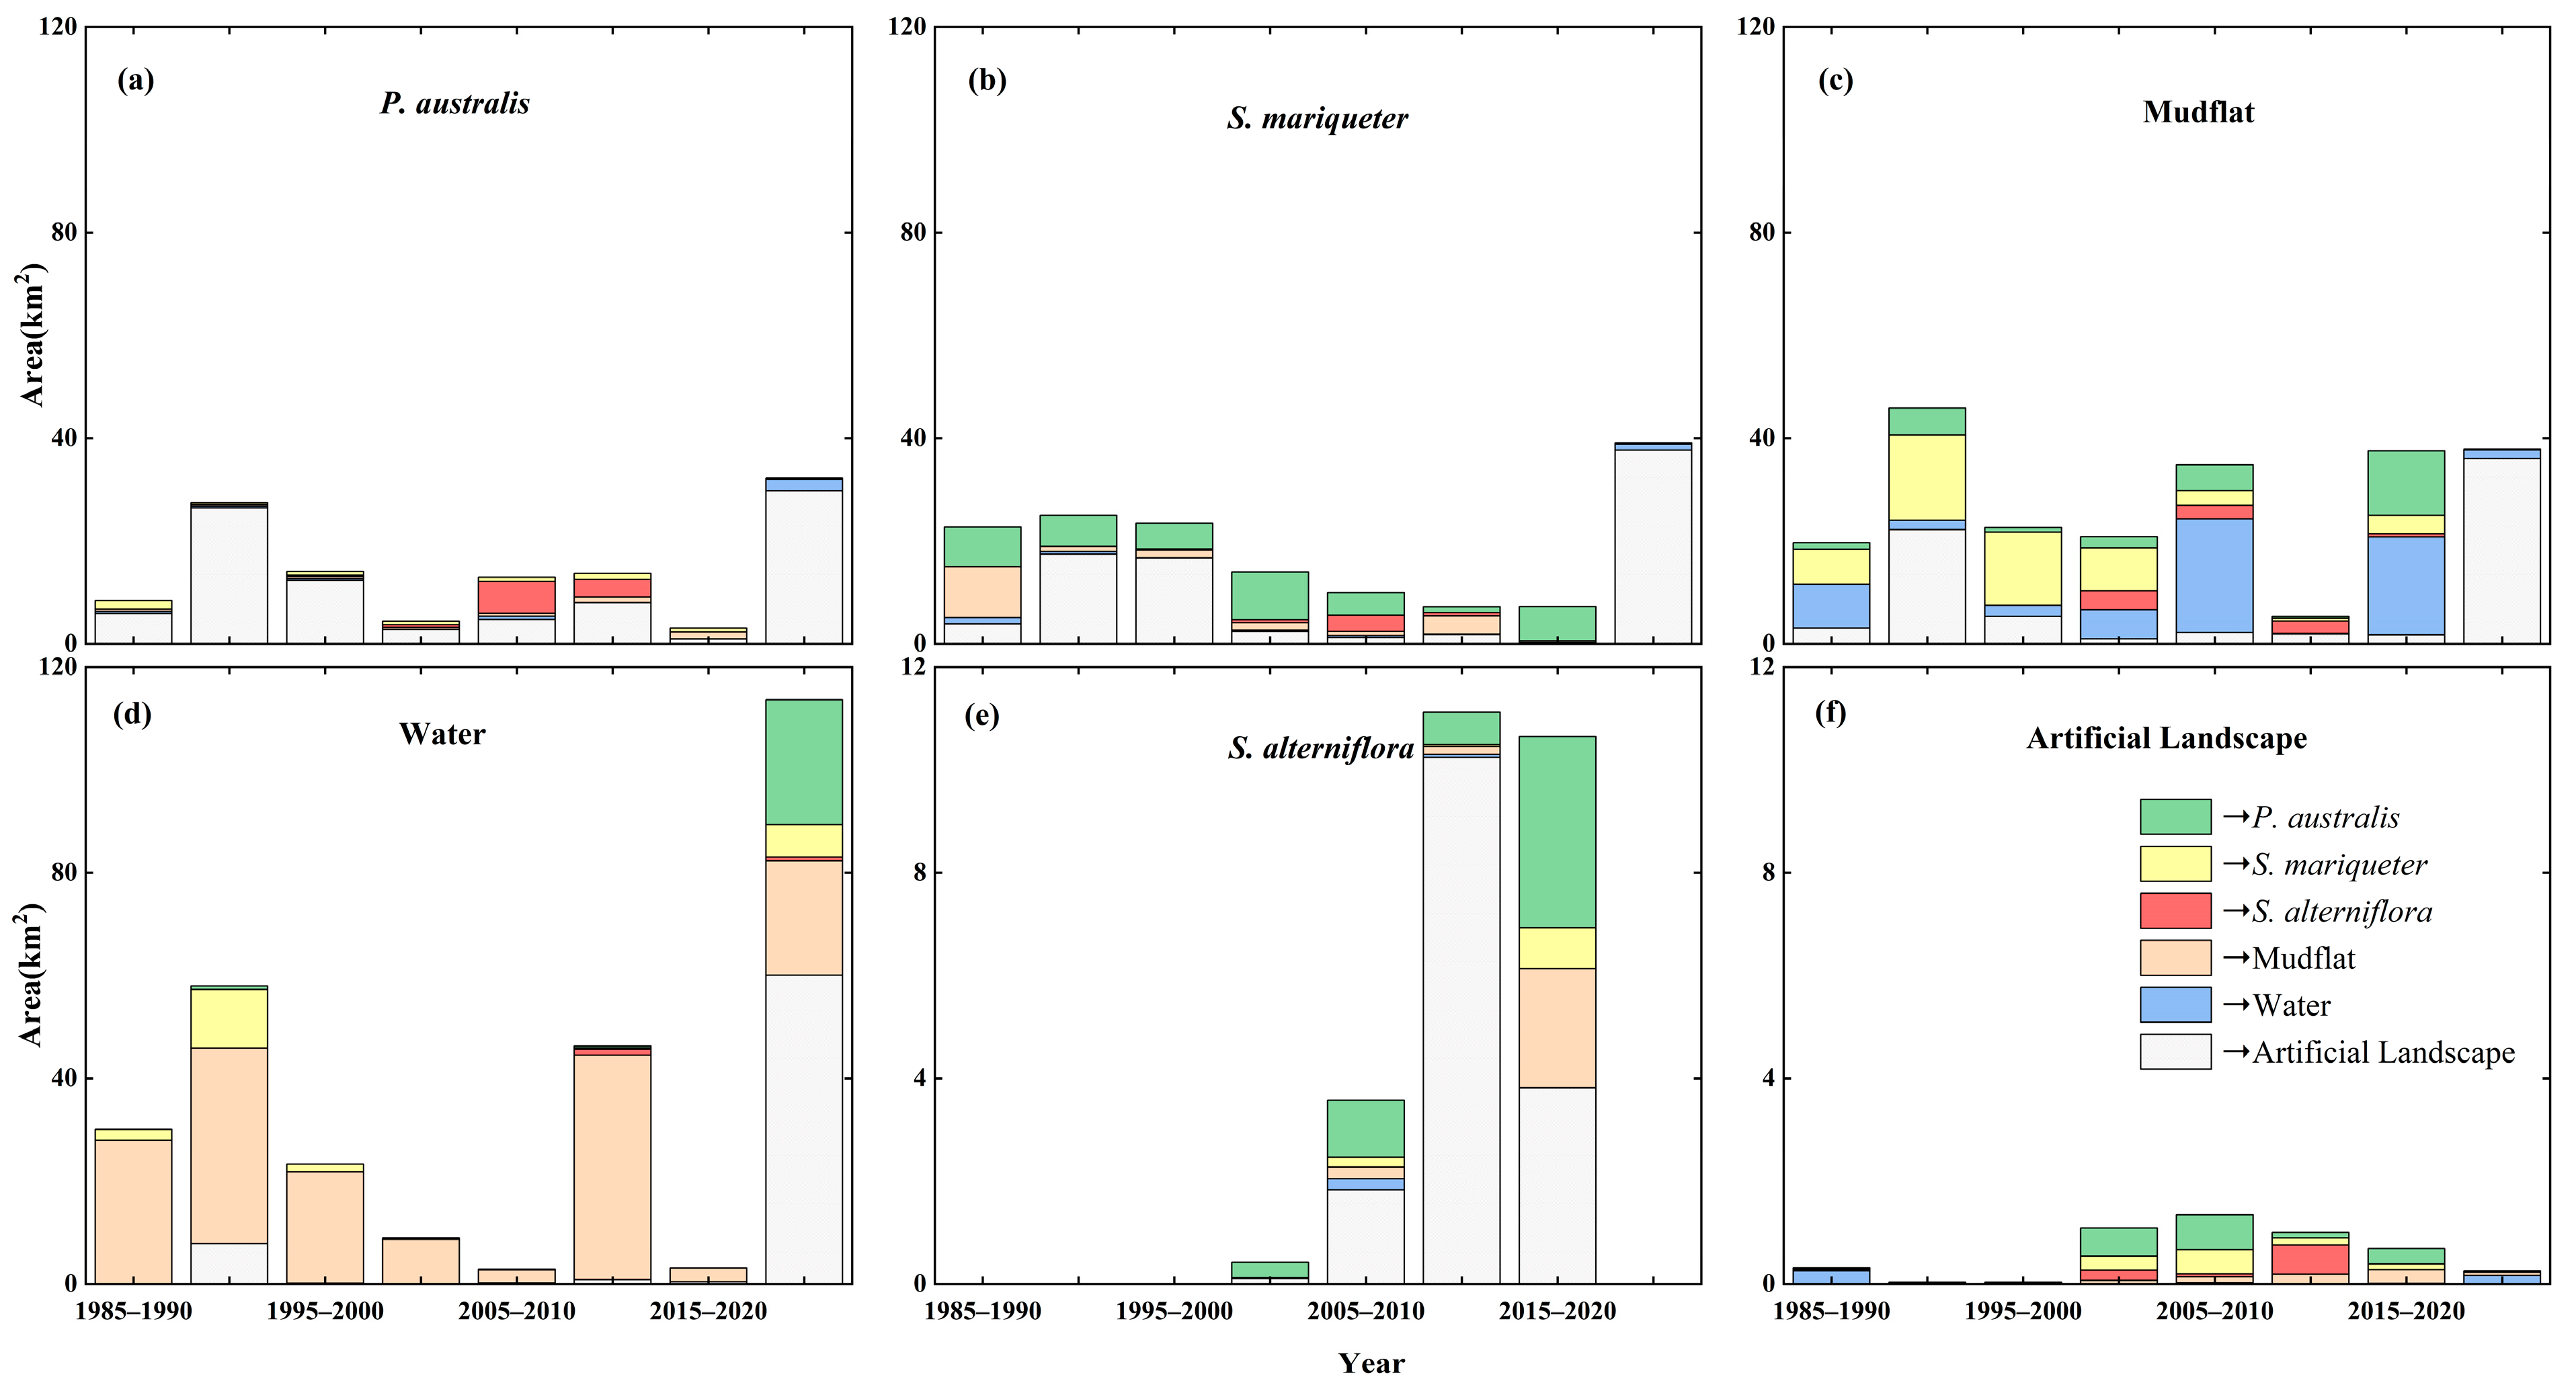
3.1.4. Landscape Transfer Patterns Under the Influence of Human Activities and Natural Factors

A total of 26 landscape types exhibited mutual transfers within the Dongtan wetland, with areas lacking any landscape transfer indicated by a white background (Figure 5). In 1985, Chongming Island was designated as an “agricultural island”, maintained 92.3% natural landscape coverage [65,66], dominated by P. australis, S. mariqueter, and mudflat (99.1% of Dongtan wetland), while artificial landscapes constituted less than 0.1% (Figure 5a and Figure 6). Post-1995 agro-industrial intensification catalyzed coastal megaprojects—dike networks, aquaculture ponds, and reclamation—initiating a regime shift from natural to artificial landscapes [67]. The transfers among various landscapes during this period were relatively balanced.
During 1990–1995, aquaculture-driven reclamation under Shanghai’s state-led development transformed Chongming Island through eight agri-industrial farms, elevating anthropogenic landscapes to dominance (57.08 km2 cumulative conversion; Figure 5b and Figure 6) [60]. Vegetation transition matrices revealed symmetrical turnover in S. mariqueter (~25 km2 net loss) and accelerated depletion of P. australis (27.43 km2 loss vs. 12.01 km2 gain; net deficit: 15.42 km2) (Figure 5c and Figure 6). This land-use intensification converted 38% of native vegetation to agricultural reserve zones, concurrent with progradation mudflat expansion (+19.3 km2)—a signature of anthropogenically mediated coastal squeeze where human interventions override autonomous landscape adjustments.
From 2000 to 2005, the introduction of S. alterniflora fundamentally restructured landscape transition dynamics in the study area (Figure 5d and Figure 6). Anthropogenic landscapes ceded dominance to tripartite species competition—P. australis and S. mariqueter experienced bidirectional conversion (net flux: −4.2 km2 and −3.1 km2, respectively), while S. alterniflora exhibited invasive asymmetry (net gain: 4.61 km2, 10× higher than losses). This bioinvasion trajectory intensified during 2005–2010 (Figure 5e and Figure 6), with S. alterniflora achieving monopolistic expansion (net gain: 10.05 km2, 3.8× native species’ cumulative loss). Concurrently, mudflat-to-vegetation succession demonstrated their role as sediment buffer reservoirs, whereas the transition into water is primarily attributed to tidal influences.
Aligned with invasive species control mandates and ecosystem resilience targets, the SEM and BHOP were implemented in Dongtan Wetland during 2010–2015 (Figure 1), driving anthropogenic landscapes to dominance type (Figure 5f and Figure 6). Post-intervention metrics revealed 10.69 km2 S. alterniflora eradication—86% invasion suppression efficiency—while the 2015–2020 transition matrix demonstrated the significant influence of anthropogenic factors on the transitions between natural and artificial landscapes (Figure 5g and Figure 6). Concurrently, habitat engineering prioritized P. australis as avian refugia keystone species, achieving 25.44 km2 colonization (+154% vs. 2010 baseline) and restoring wetland stability to pre-2000 levels.
The 1985–2020 landscape succession hierarchy (by area) progressed as: artificial landscape (peak 63.4% in 2015) > mudflat > P. australis > water > S. mariqueter > S. alterniflora (Figure 5h and Figure 6), exhibiting a regime shift from natural to anthropogenic dominance (1985–2010) followed by ecosystem engineering-mediated reversal (2010–2020). Through landscape optimization, the Shanghai government achieved synergistic coupling between wetland conservation and Agri-productivity.

3.2. Development of the Tidal Creek System

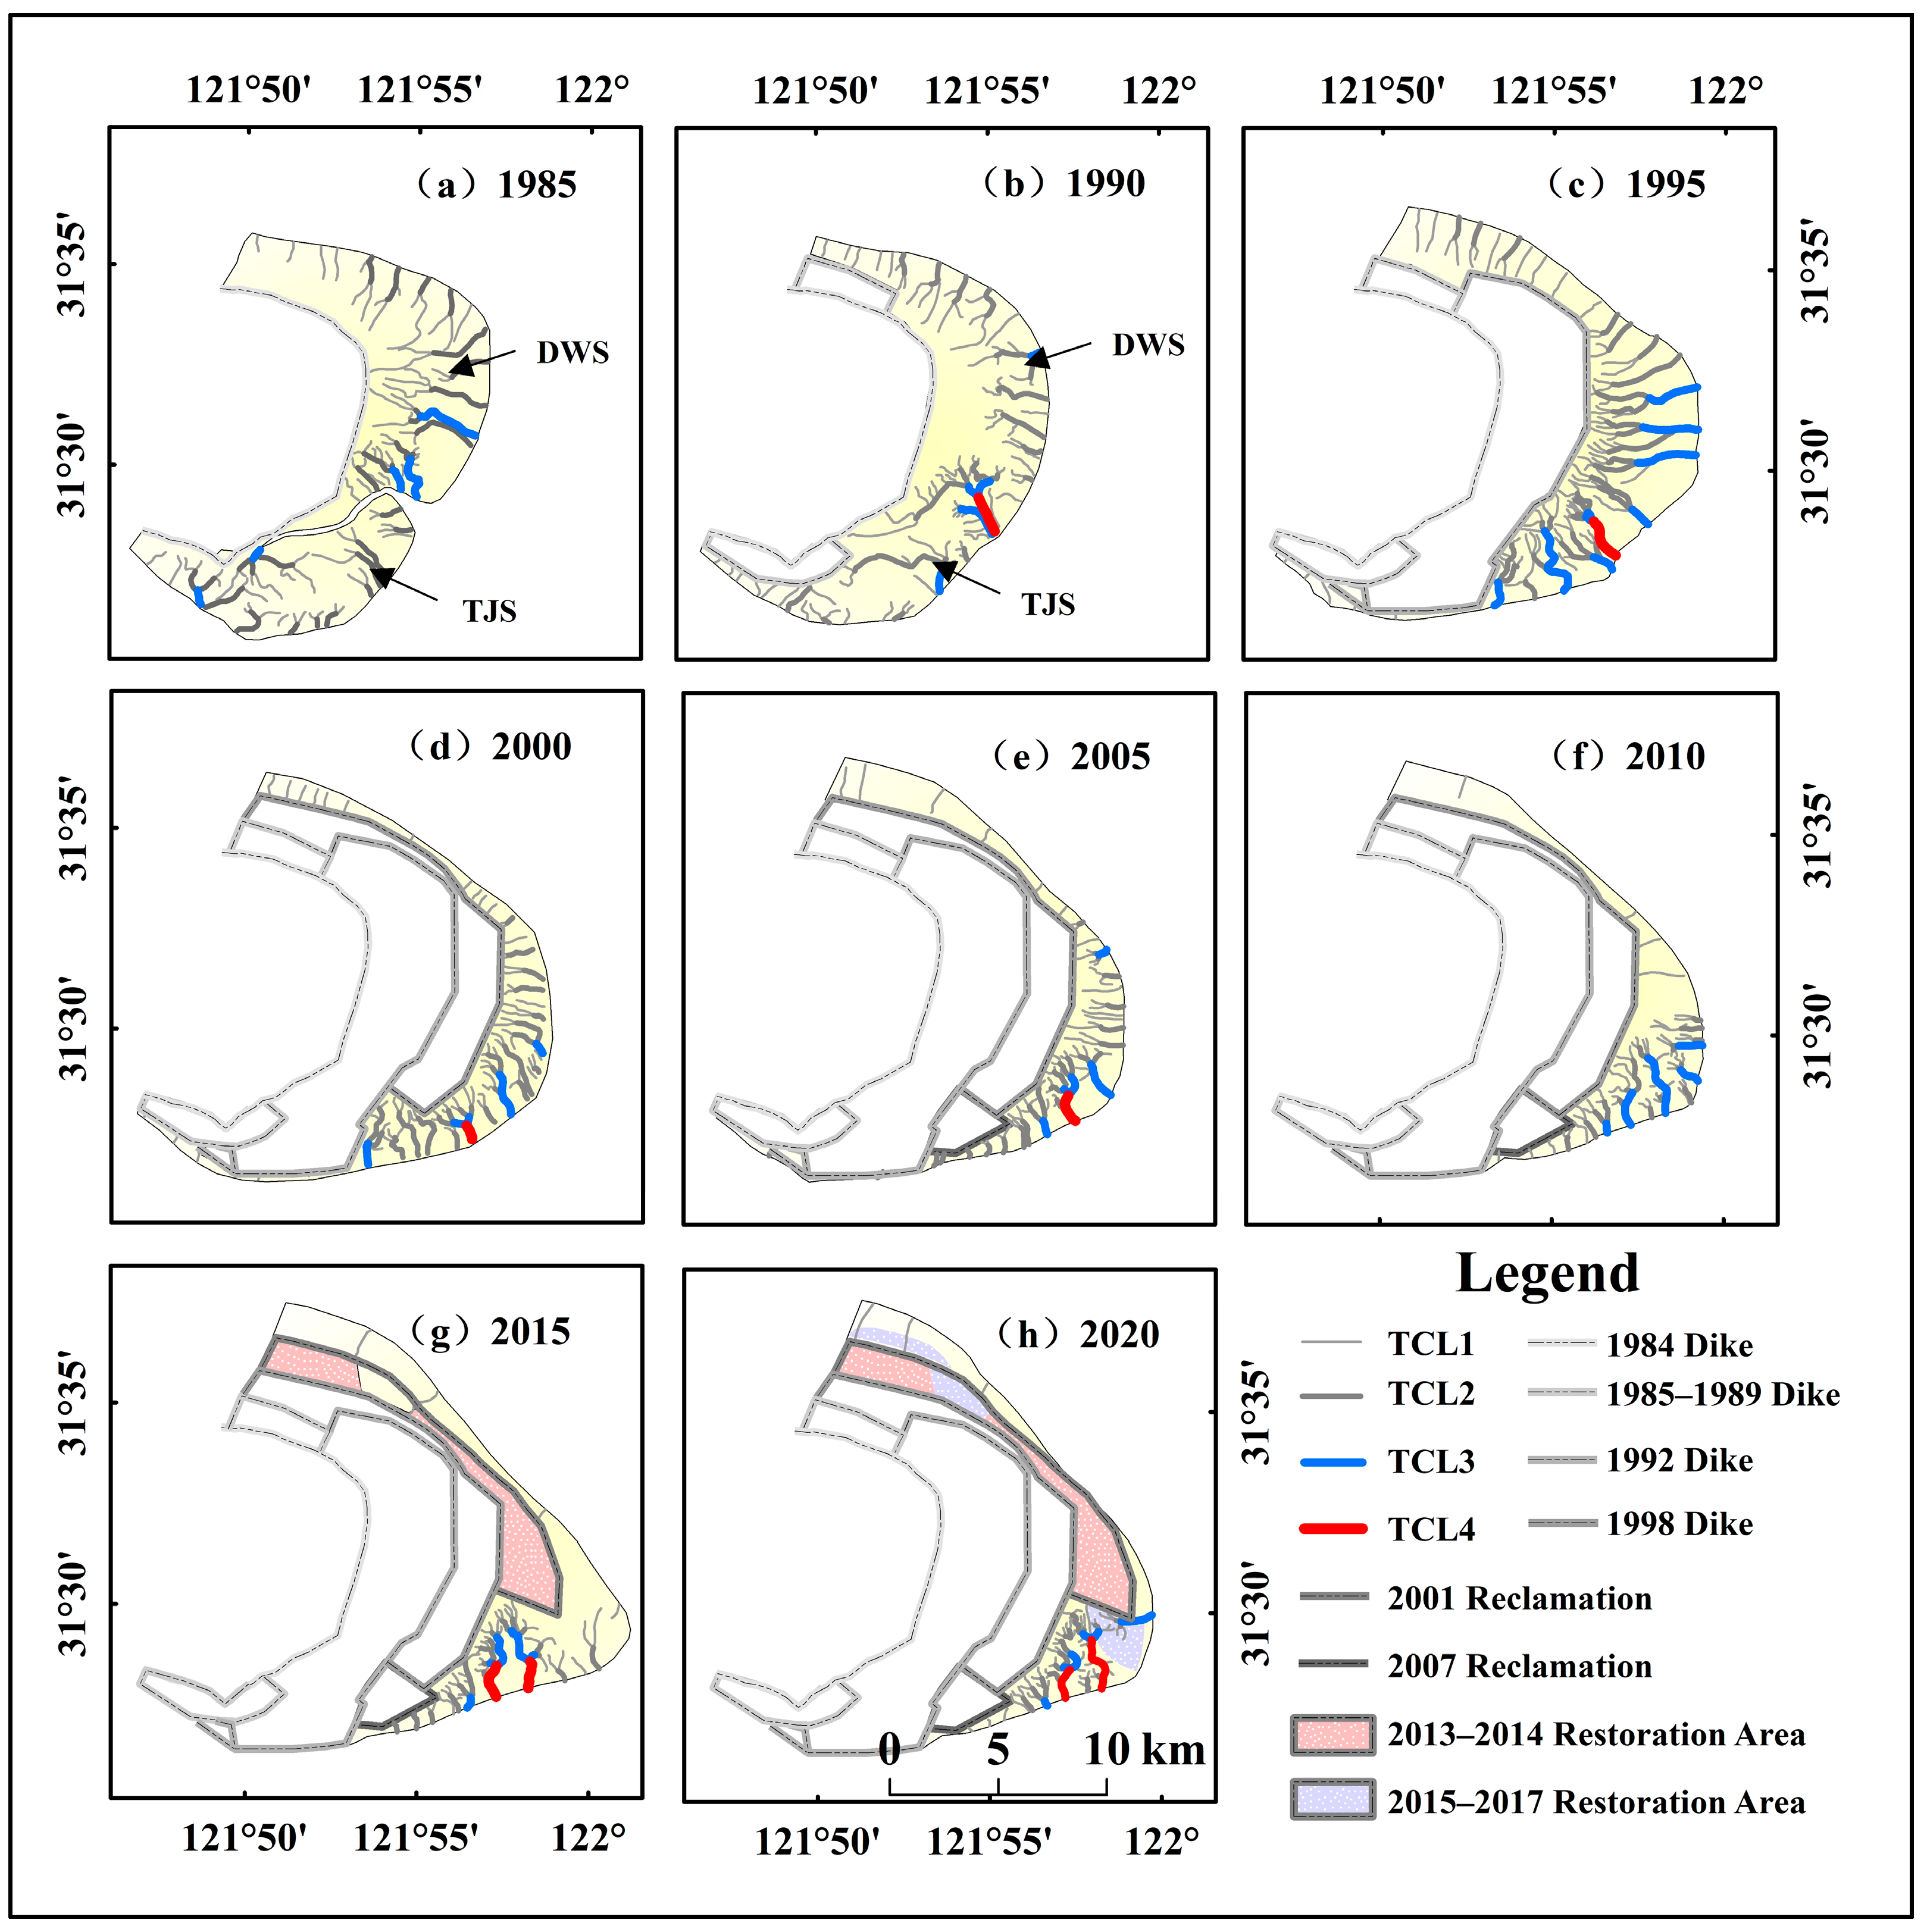
3.2.1. Spatial and Temporal Variations in Tidal Creek Distribution

The tidal creek network in Dongtan Wetland demonstrates strong spatiotemporal heterogeneity under Horton–Strahler classification. From 1985 to 2020, the system underwent structural maturation—total TCN declined from 37 to 10 (Δ = −0.77/yr) while geomorphic complexity increased. This paradox reflects hierarchical reorganization: TCL1-TCL2) dominated (93% coverage), whereas higher-order systems (TCL3-TCL4) specialized in southern wetland (Figure 7).
The 1985–1990 period marked the automorphic evolution phase of Dongtan’s tidal creek system, as evidenced by Figure 7a,b. In 1985, TCL1–TCL2 creeks constituted 89% of the system, with only five proto-TCL3 creeks clustered in central-southern wetlands (Figure 7a). By 1990, bifurcation dynamics elevated 23% of TCL1–TCL2 to TCL3, driving morpho dynamic complexity (Figure 7b). This phase culminated with the prototype TCL4 creeks formation through hydrodynamic convergence at the TJS and DWS.
The 1992 dike construction induced tidal flat compression, truncating most of TCL1–TCL2 in northern wetlands and driving accelerated TCN decline (ΔTCN = −2.1/yr). By 1995, higher-order channels (TCL3+) became spatially constrained to southeastern wetland, resulting in parallel-aligned TCL3 proliferation (+80% vs. 1990) (Figure 7c).
The 1995–2000 delta-wide reclamation megaprojects triggered sediment-starved conditions, exacerbating erosion in northeastern tidal flat. This geomorphic stressor eliminated 72% of TCL1–TCL2 and reduced TCL3 from 12 to 7 (Δ = −1.1/yr) (Figure 7c,d). Post-2005 coastal squeeze intensification compressed intertidal zone width, eradicating northern wetland tidal channels except a few TCL1 fragments. In contrast, the TCL4 in the southern wetland experienced degradation to TCL3 (Figure 7e,f).
Pre-2013 ecological restoration project, there were notable differences in the spatial distribution of tidal creeks within the Dongtan wetland. Specifically, northern tidal creeks were oriented northeast, characterized by low density, slender morphology, shorter lengths, straight curvature, and fewer gradations. In contrast, southern tidal creeks were oriented southeast, exhibiting high density, coarser morphology, longer lengths, curved shapes, multiple gradations, and predominantly dendritic configurations (Figure 7a–f). Post-SEMP implementation (2013–2020), northern tidal creeks largely disappeared, while the southern wetland transitioned into a semi-natural restoration pattern post-intervention, leading to the development of new tidal creek units in certain areas. The original tidal creek units experienced a resurgence, with two new TCL4 appearing, and the system gradually stabilized in both morphology and number (Figure 7g,h).

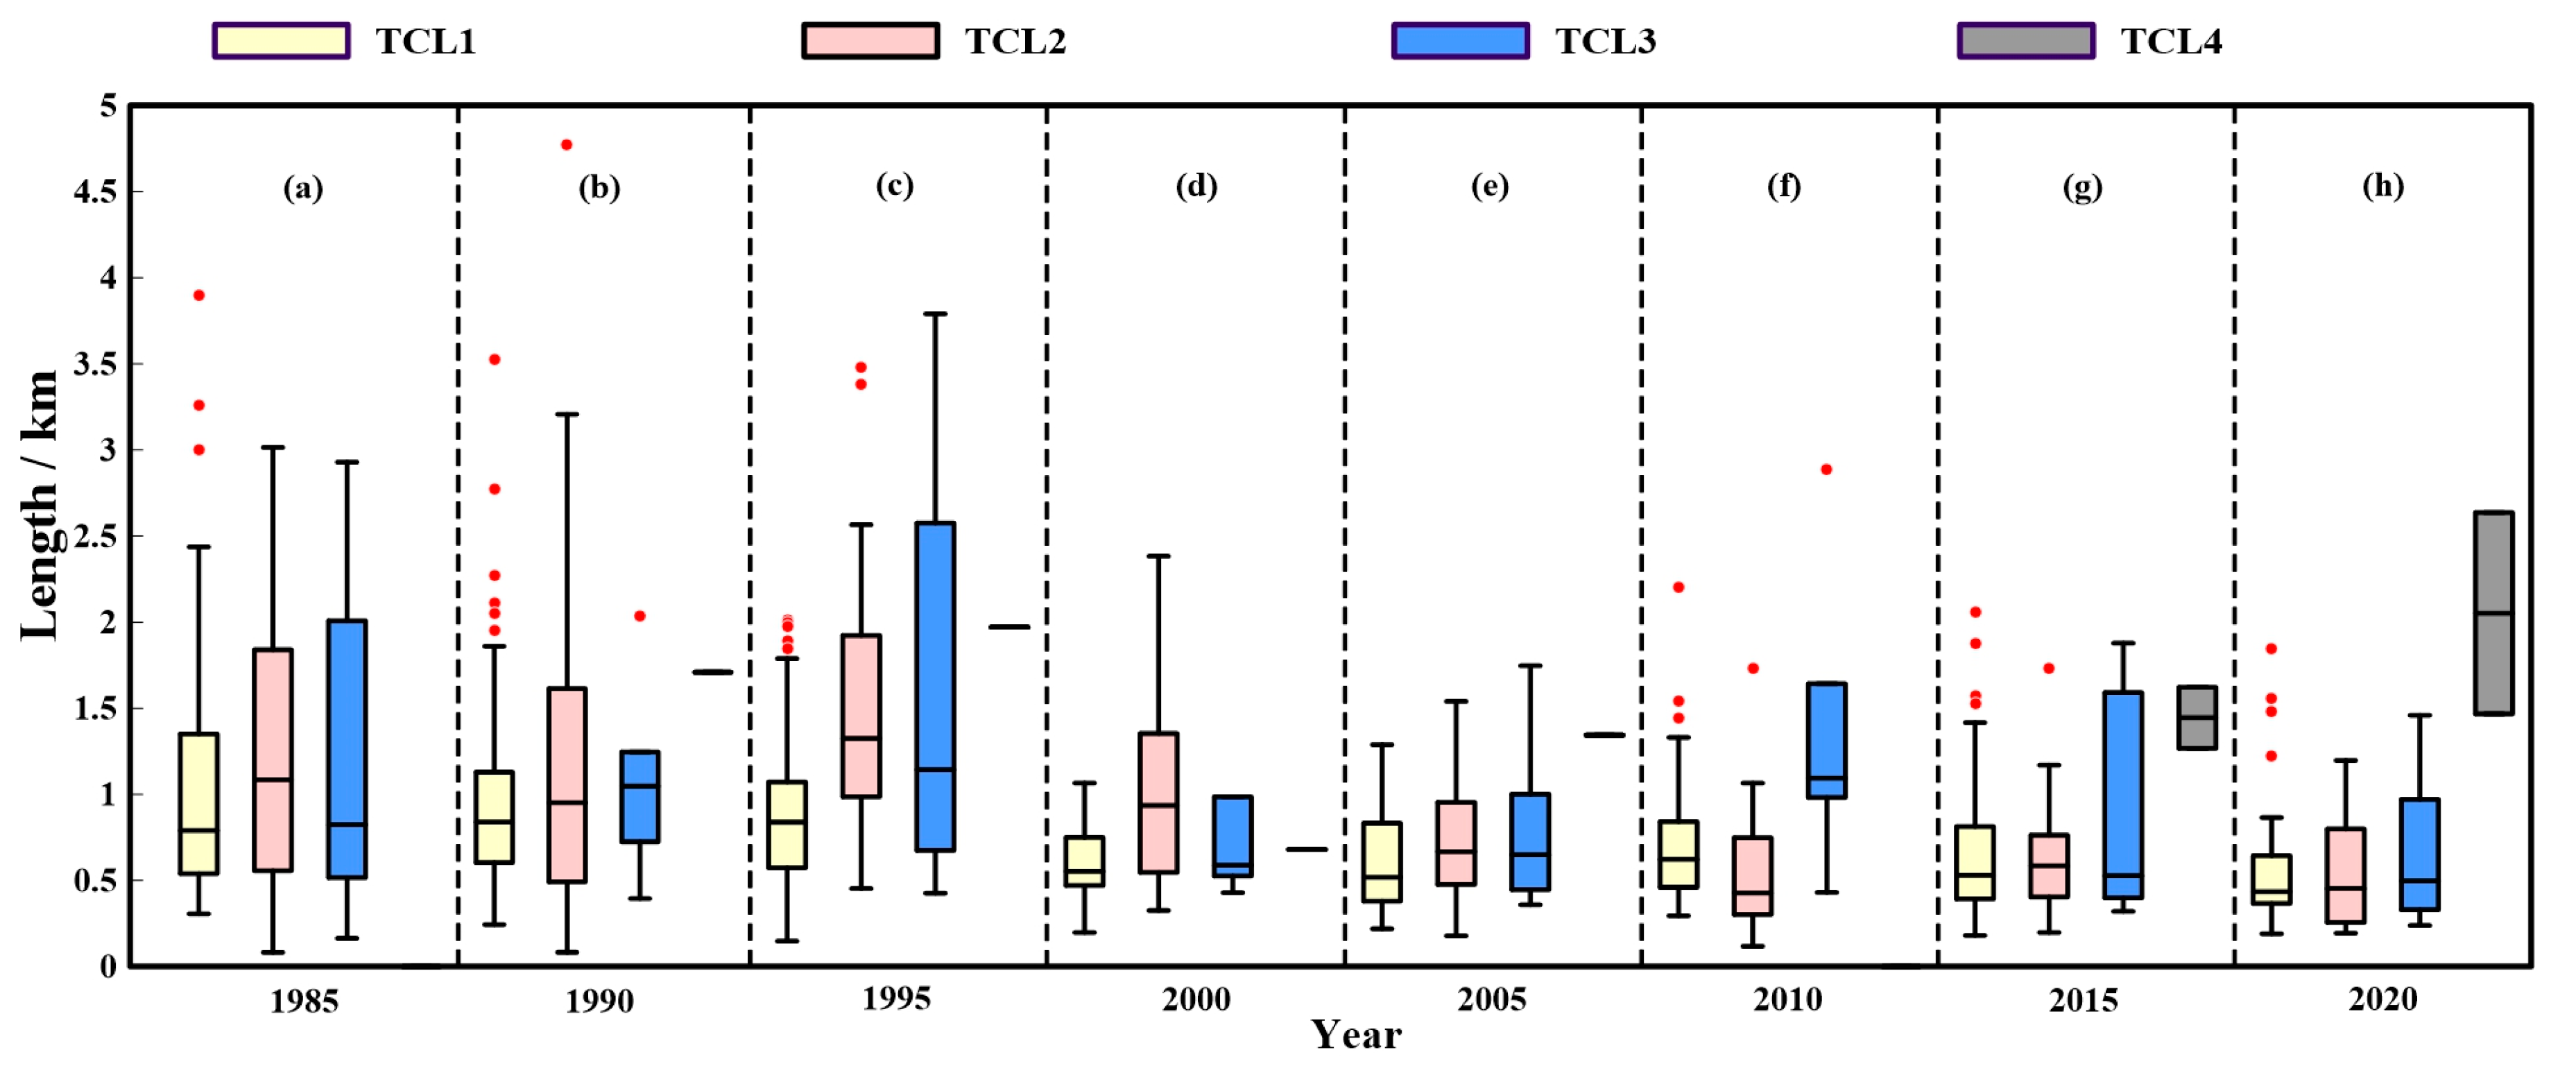
3.2.2. Changes in Length of Each Tidal Creek Level

The relationship between TCL and TCl generally adheres to the principle that “higher TCL corresponds to longer TCl”, which aligns with Horton’s law [63,67]. Furthermore, by fitting TCL and the corresponding TCN for the years 1985 to 2020 using an exponential function, we observed correlation coefficients exceeding 0.97 (Figure 8). This finding supports the inverse geometric progression described in Horton’s law regarding the relationship between the river number and level, indicating that the development of the tidal creek system in the Dongtan wetland is analogous to that of inland river networks, which dissipate energy through stochastic configurations. However, energy dissipation in tidal creeks is influenced by tidal range, while it is primarily driven by rainfall accumulation and flow in inland rivers.
The results demonstrate marked declines in both TCN and TCl for TCL1–TCL2, with cumulative reductions exceeding 50%. Conversely, TCL4 exhibited sustained expansion in later periods (ΔTCN = +3.2/yr; ΔTCl = +0.41 km/yr). TCL1 mean length decreased from 1.04 km to 0.49 km (−53%), while TCL2 and TCL3 displayed nonmonotonic trajectories: peaking at 1.51 km (1990–1995) and 1.64 km (1995–2000), respectively, before declining to 0.56 km (TCL2) and 0.66 km (TCL3) by 2020 (Figure 3). Phase I (1985–1995) saw consolidation of primary tidal creeks lengthening TCL2–TCL3. However, anthropogenic forcing via 1990–1995 dike construction triggered network fragmentation—TCL1 eradication (Δ = −82%) and TCL2–TCL3 length compression (−0.28 km/yr).
TCL4 exhibited distinct evolutionary dynamics compared to primary tidal creeks. Figure 6b,c documents its nonlinear trajectory—initial emergence in 1990 (mean length = 1.70 km), peaking at 1.97 km (1995) through fluvial-tidal synergy, followed by a drastic decline to 0.67 km post-1997 central dike construction (intertidal zone compression). Post-2000 geomorphic refugia formation in southern sectors enabled autogenic recovery (ΔTCl = +0.12 km/yr), culminating in TCL4 dominance (2.05 km mean length) by 2020—exceeding TCL1–TCL3 metrics (0.49/0.56/0.67 km).

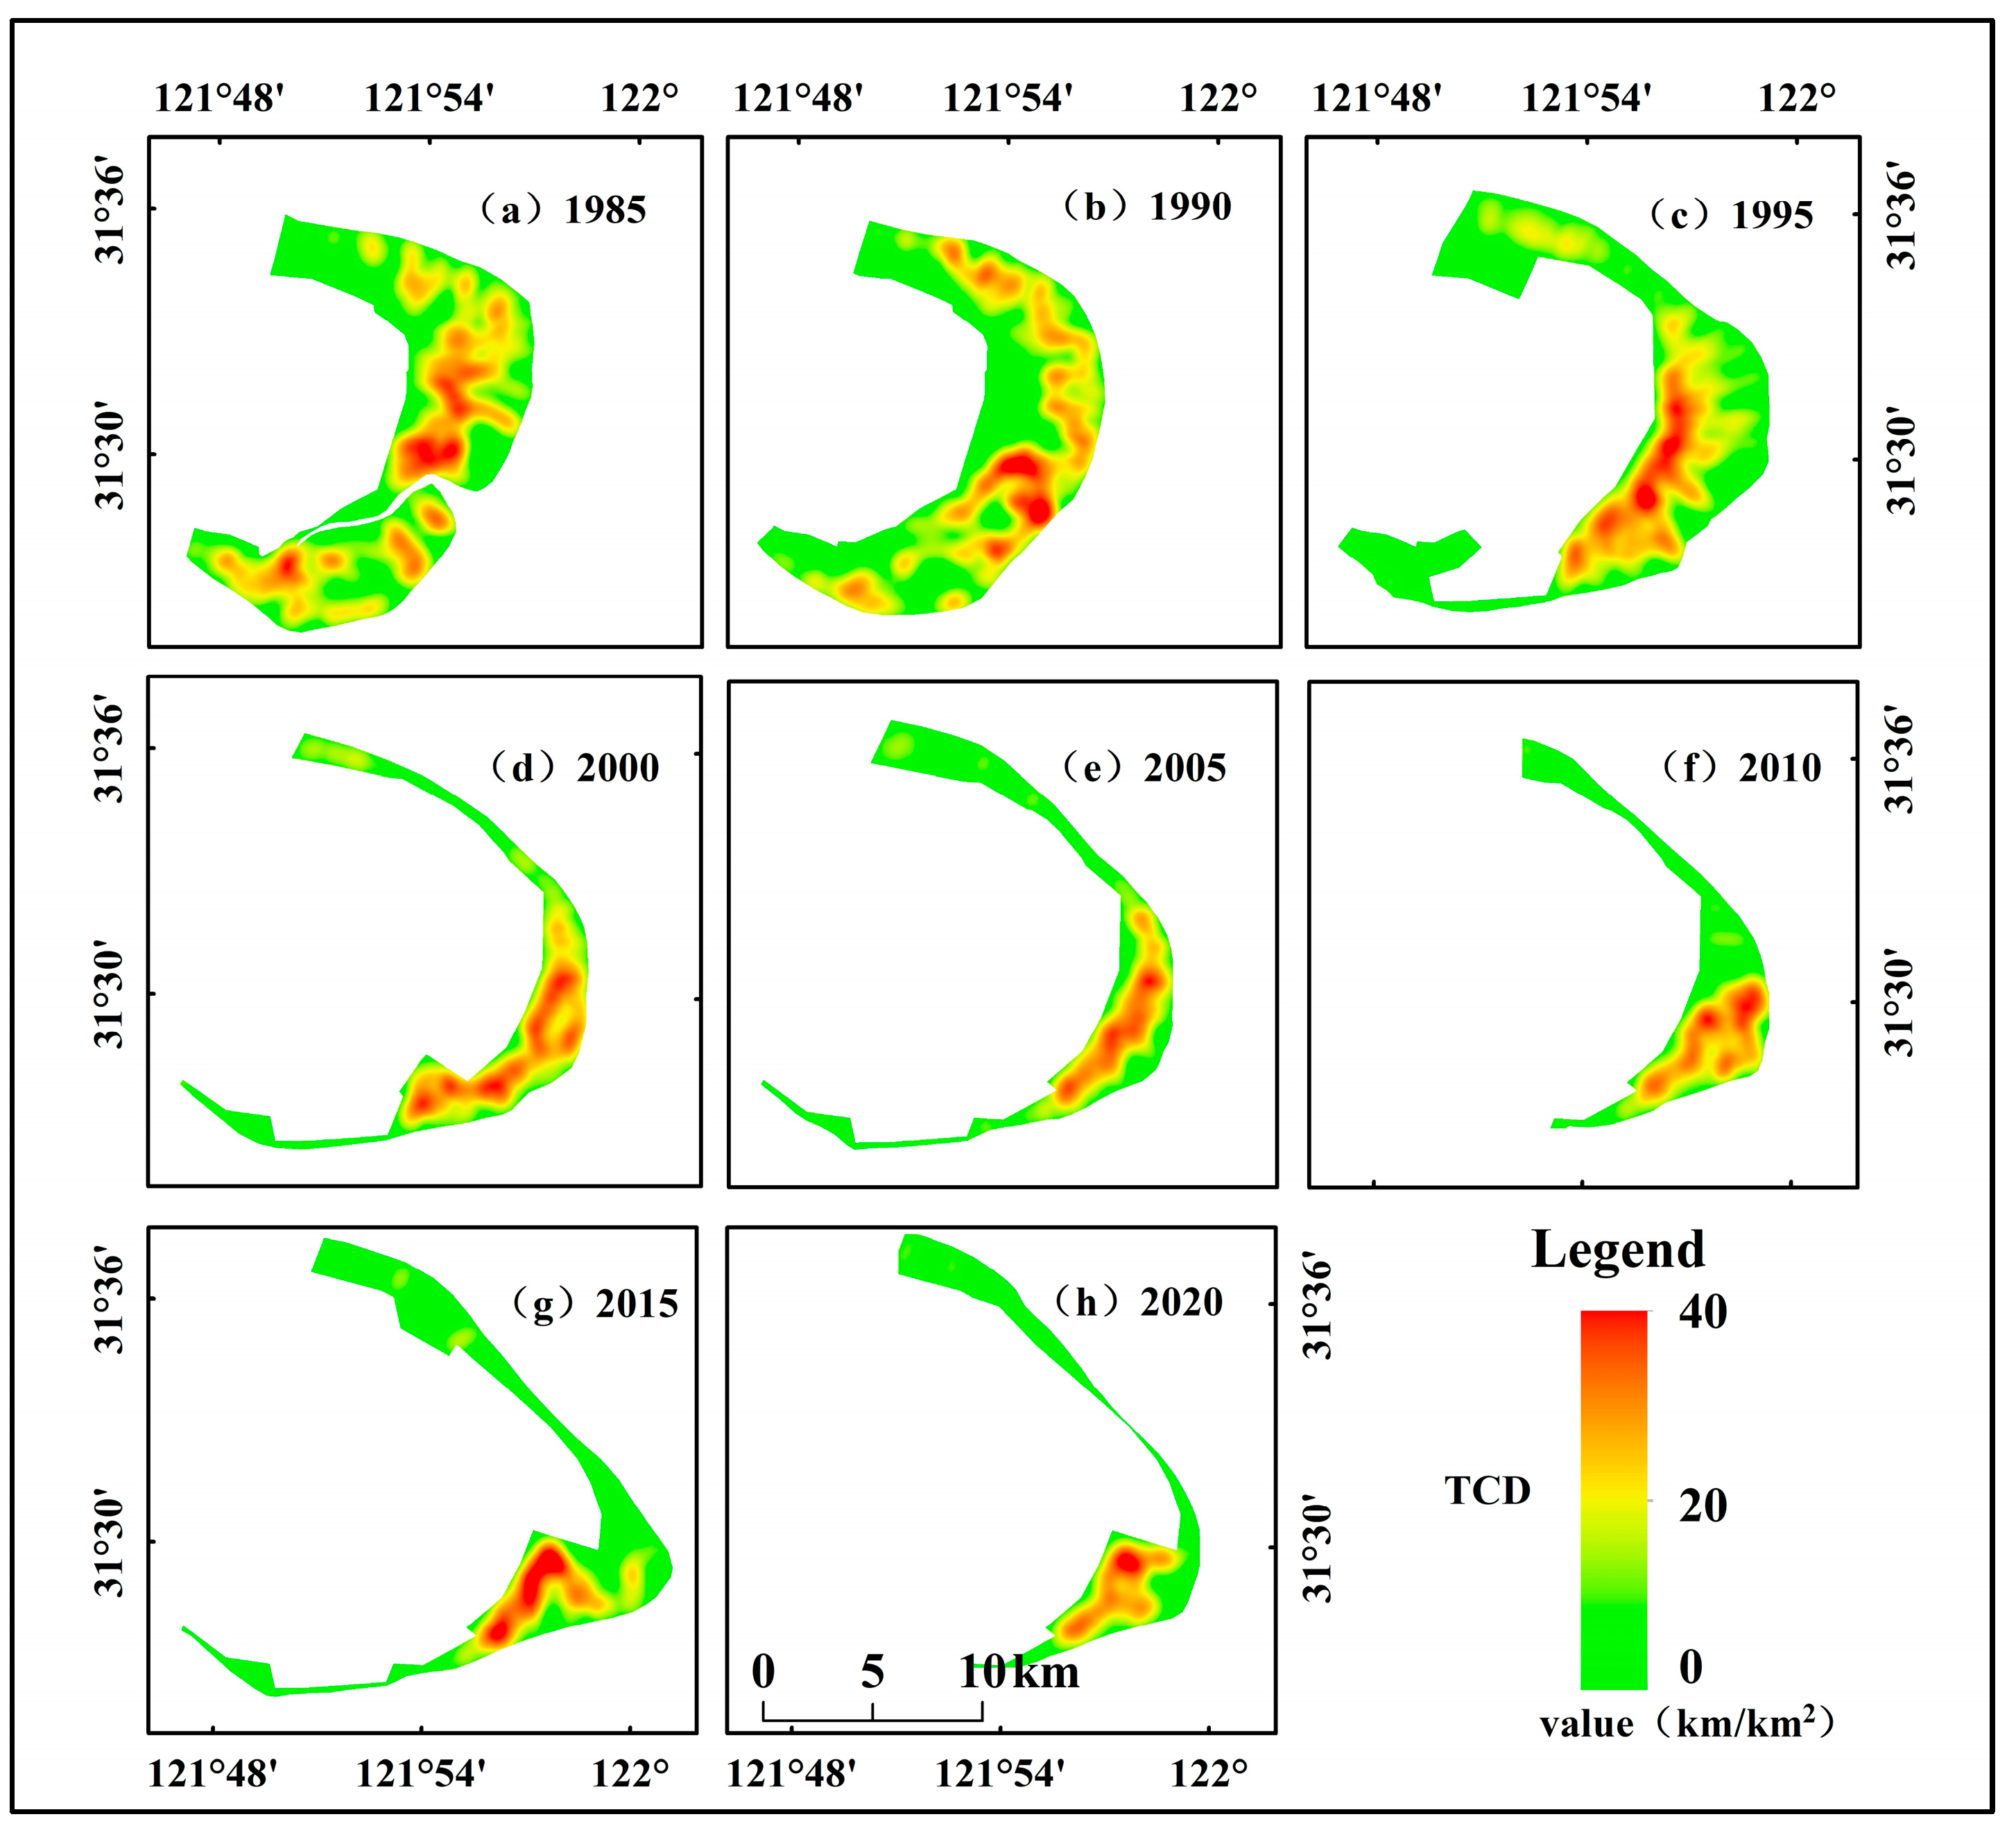
3.2.3. Changes in Tidal Creek Density Distribution

TCD was calculated as the tidal creek length per unit area, based on geospatial distribution data. (Figure 7), with contour analysis revealing TCD high-value core areas migration. Figure 9a captures the 1985 natural regime where maximum TCD (30.8 km/km2) clustered centrally, reflecting tidal creeks were predominantly developed in the upper tidal zone. Northern wetlands underwent TCD collapse from 11.54→9.17 km/km2 (Δ = −20.5%) by 1990, driven by TCL contraction (−21%). Conversely, southern sectors achieved TCD amplification (29.63 km/km2) through TJS-DWS consolidation—boosted TCL by 63% (Figure 9b,c).
The 1995–2000 reclamation triggered an anthropogenic regime shift, with tidal flat loss through upstream channel truncation and hydrodynamic connectivity disruption. This coastal squeeze drove northern wetland TCD collapse to <2.24 km/km2 (precipitous Δ = −82%). In response, the tidal creek system adjusted its morphology to maintain overall tidal flat equilibrium, with the upstream sections undergoing constant oscillating that facilitated lateral development, leading to TCD values exceeding 25.86 km/km2 adjacent to the dike (Figure 9d,e).
Following 2005, the presence of S. alterniflora in the northern wetland contributed to the solidification of tidal flats, elevated the water levels of return channels, and increased the volume of tidal water discharged during low tide. This bio geomorphic cascade depressed TCN (−2.4/yr) and TCl (−0.6 km/yr), collapsing northern wetland TCD to <2 km/km2. Post-2010 saw southern wetland TCD stabilization (23.61 km/km2) (Figure 9f). After the establishment of the Ecological Reserve in 2015, the restoration of the vegetation ecosystem resulted in dense vegetation growth, which played a stabilizing role in the wetlands. This growth inhibited the lateral expansion and down-cutting of tidal creeks to a certain extent. As a result, TCN decreased, resulting in a decrease in TCD, with values falling below 21.13 km/km2(Δ = −12% vs. 2010) compared to previous periods (Figure 9g,h).

3.2.4. Characterization of Changes in Tidal Creek Properties Due to Human Activities and Natural Factors

This section examines the changes in tidal creek properties influenced by human activities and natural factors, based on the distribution of tidal creeks (Figure 3). The tidal creeks in the Dongtan wetland are classified as tidal flushing types. Enhanced nearshore hydrodynamic conditions have increased the kinetic energy on the tidal flat surface and intensified erosion, resulting in deeper longitudinal flushing of tidal creeks and more pronounced horizontal branching [2,3,20,56,68]. Geometrically, tidal creeks with higher FD exhibit wide and deep main stems, extensive branching, curved shapes, and large dendritic surfaces. In contrast, lower FD are characterized by singular and narrow stem morphologies, few branches, low curvature, and limited envelopment [8,69,70,71]. In general, FD values ranged from 1.0935 to 1.6042, while TCD values varied from 0.64 to 6.39 km/km2 in the Dongtan wetland (Figure 10).
In 1985, the tidal creek system was relatively well-developed, with minimal human impact. Although complex and high-order tidal creeks had not yet formed, the existing tidal creeks were numerous, longer and more extensive, featuring larger envelope areas and higher degrees of fractalization. At this stage, fractal metrics peaked at FD = 1.58 (mean = 1.22) and TCD = 2.78 km/km2 (mean = 1.39). By 1990, the merging of TJS and DWS sandbars in the southern wetland led to a significant increase in tidal creek length and envelope area, resulting in TCD surging to 2.78 km/km2 (mean = 2.09; Δ = +32% vs. 1985). However, the degree of fractality decreased, FD collapse (mean = 1.2058; Δ = −0.016/yr).
The high-value core area of FD shifted from the northern to the south-central wetlands, indicating that anthropogenic impacts in the northern wetland suppressed tidal creek development. Reclamation projects truncated the leading edges of tidal creeks, contributing to a decrease in the fractal degree of each tidal creek unit. FD in the Dongtan wetland continued to decrease until 2000, reaching a mean value of 1.1927 (Δ = −2.4%), while TCD exhibited an increasing trend, with a mean value of 2.80 km/km2 and a maximum of 6.39 km/km2. During this stage, pre-existing tidal creeks undergo degradation, while newly formed incipient creeks remain relatively unstable.
Post-2013 ecological management projects enforcement catalyzed southern wetland bio geomorphic resilience, with FD stabilization (2015: mean = 1.262, max = 1.5879) progressing to maturation thresholds (2020: mean = 1.2718, max = 1.6042). Network optimization manifested as TCN reduction and TCD intensification (high value of 4.92 km/km2). This managed realignment revived high-level tidal creeks (≥3).

4. Discussion

4.1. Interactions Between Vegetation and Tidal Creeks Under the Influence of Human Activities and Natural Factors

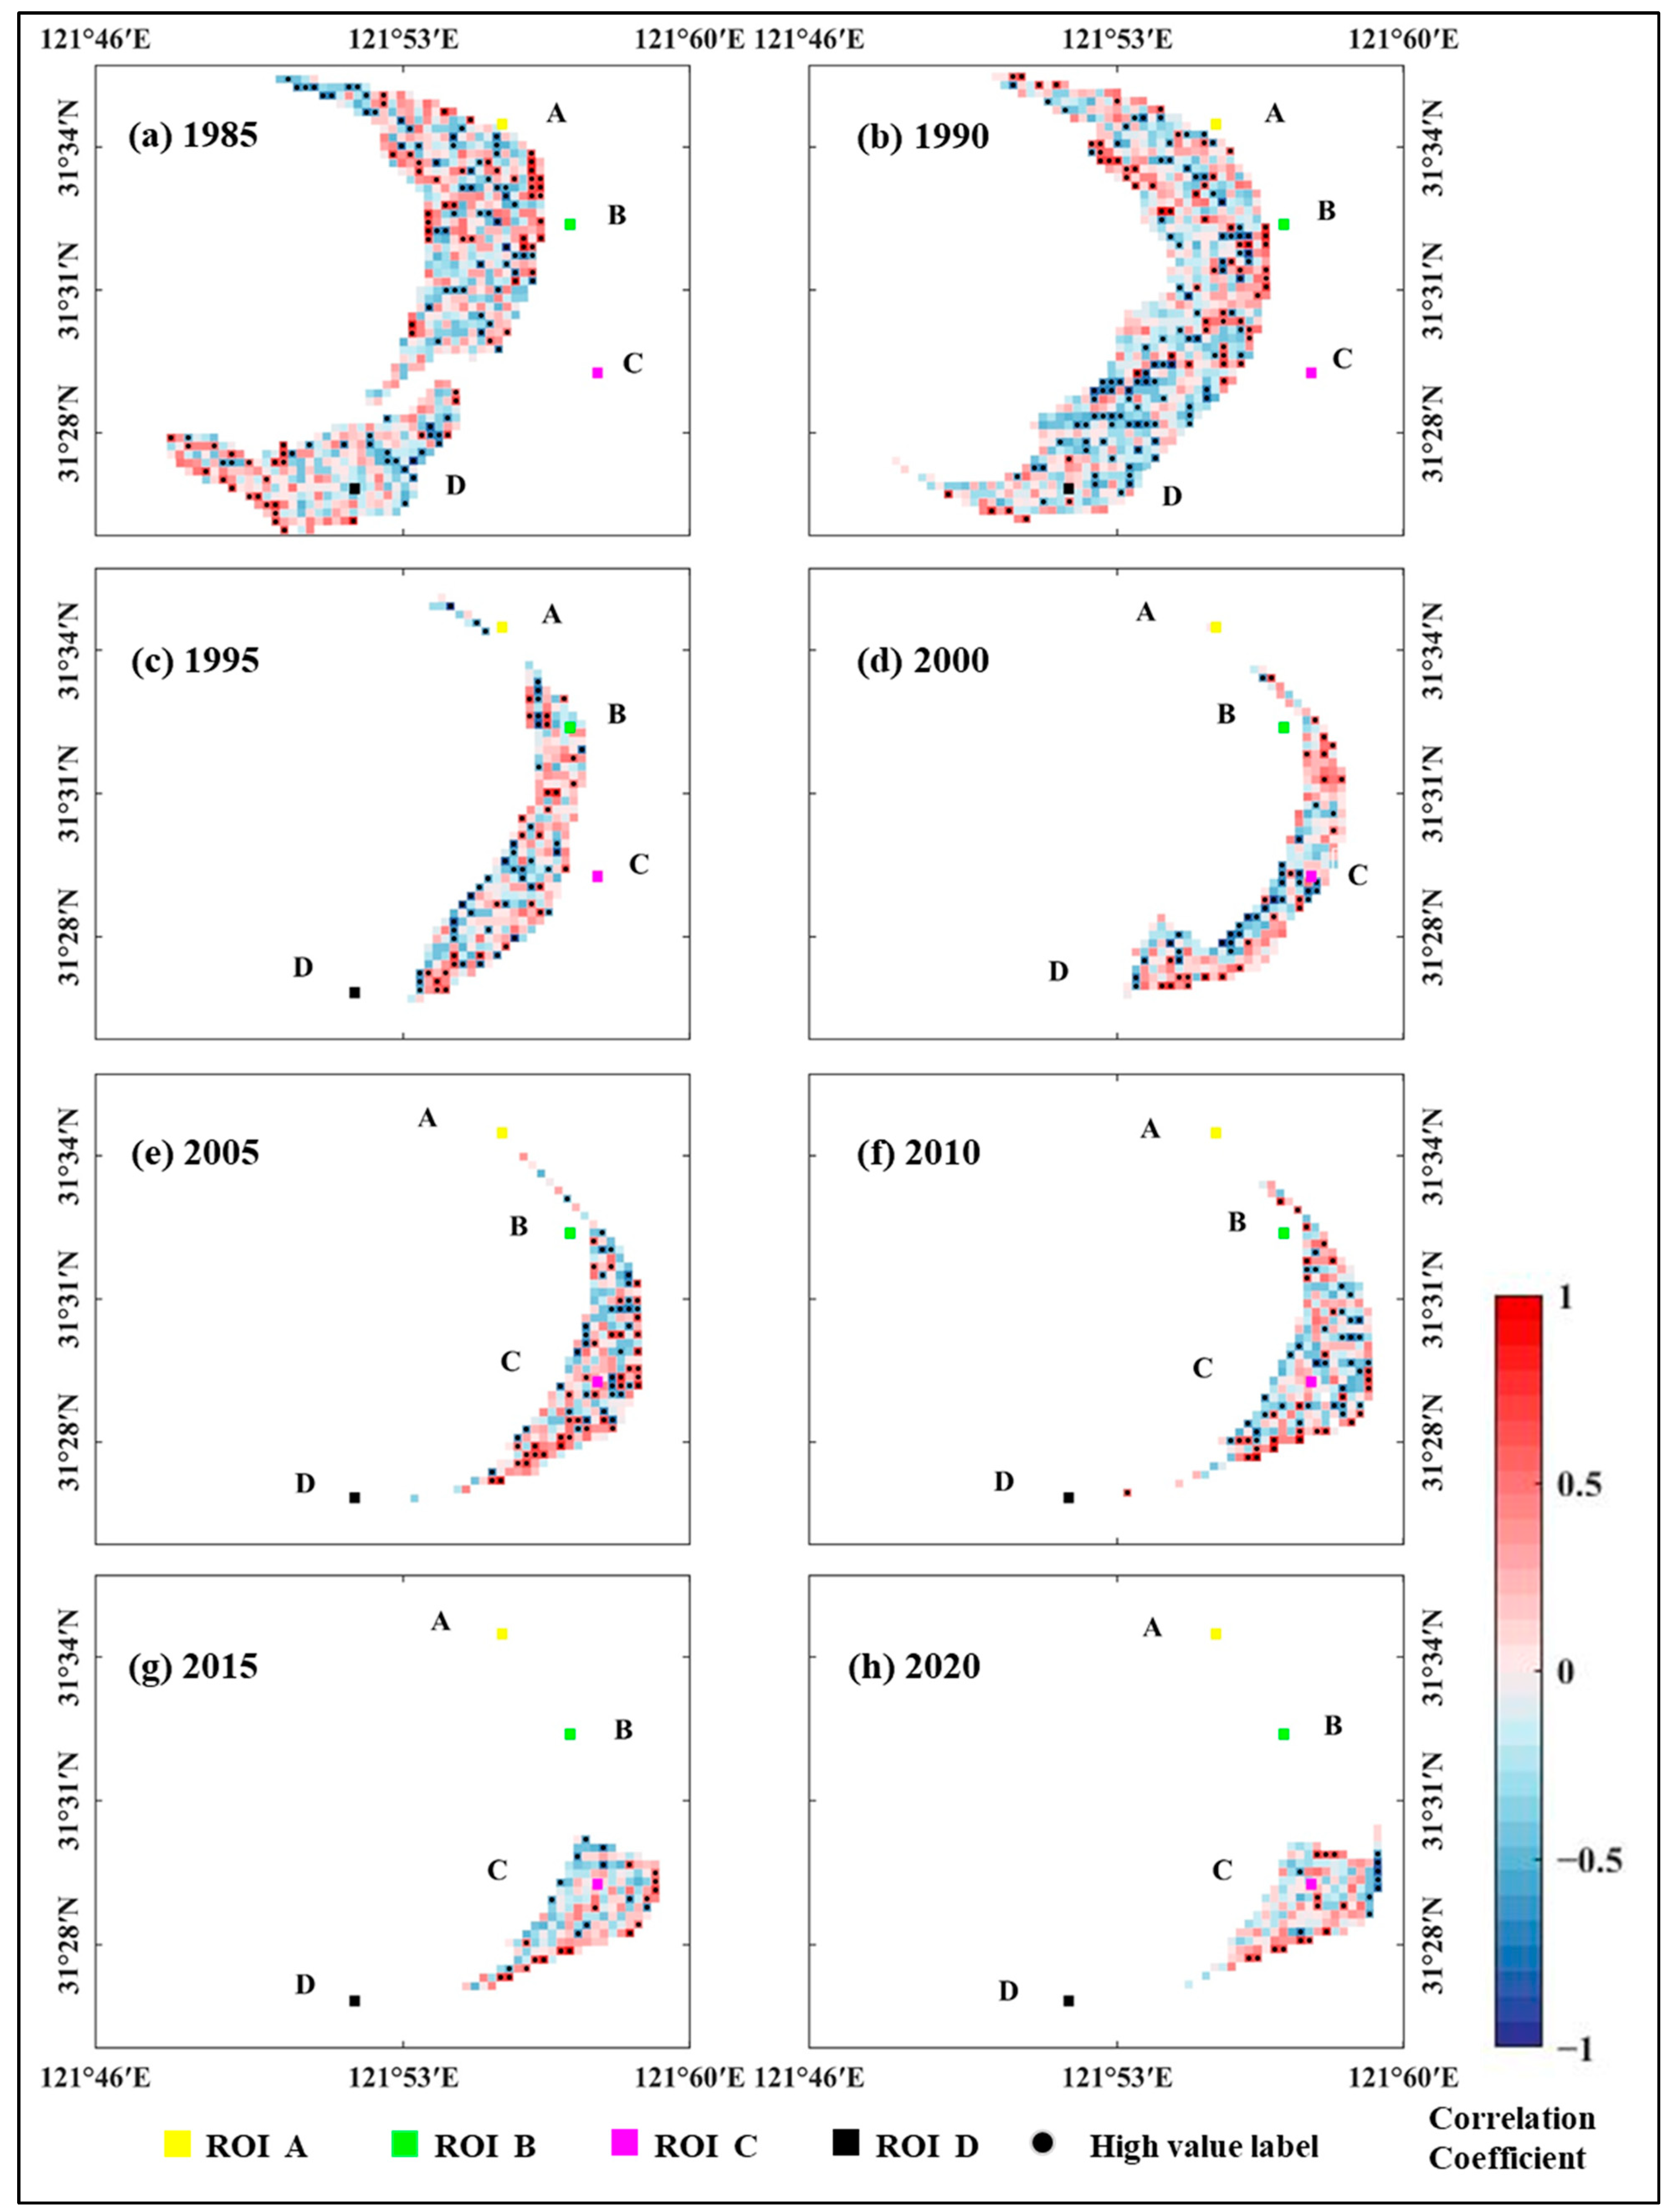
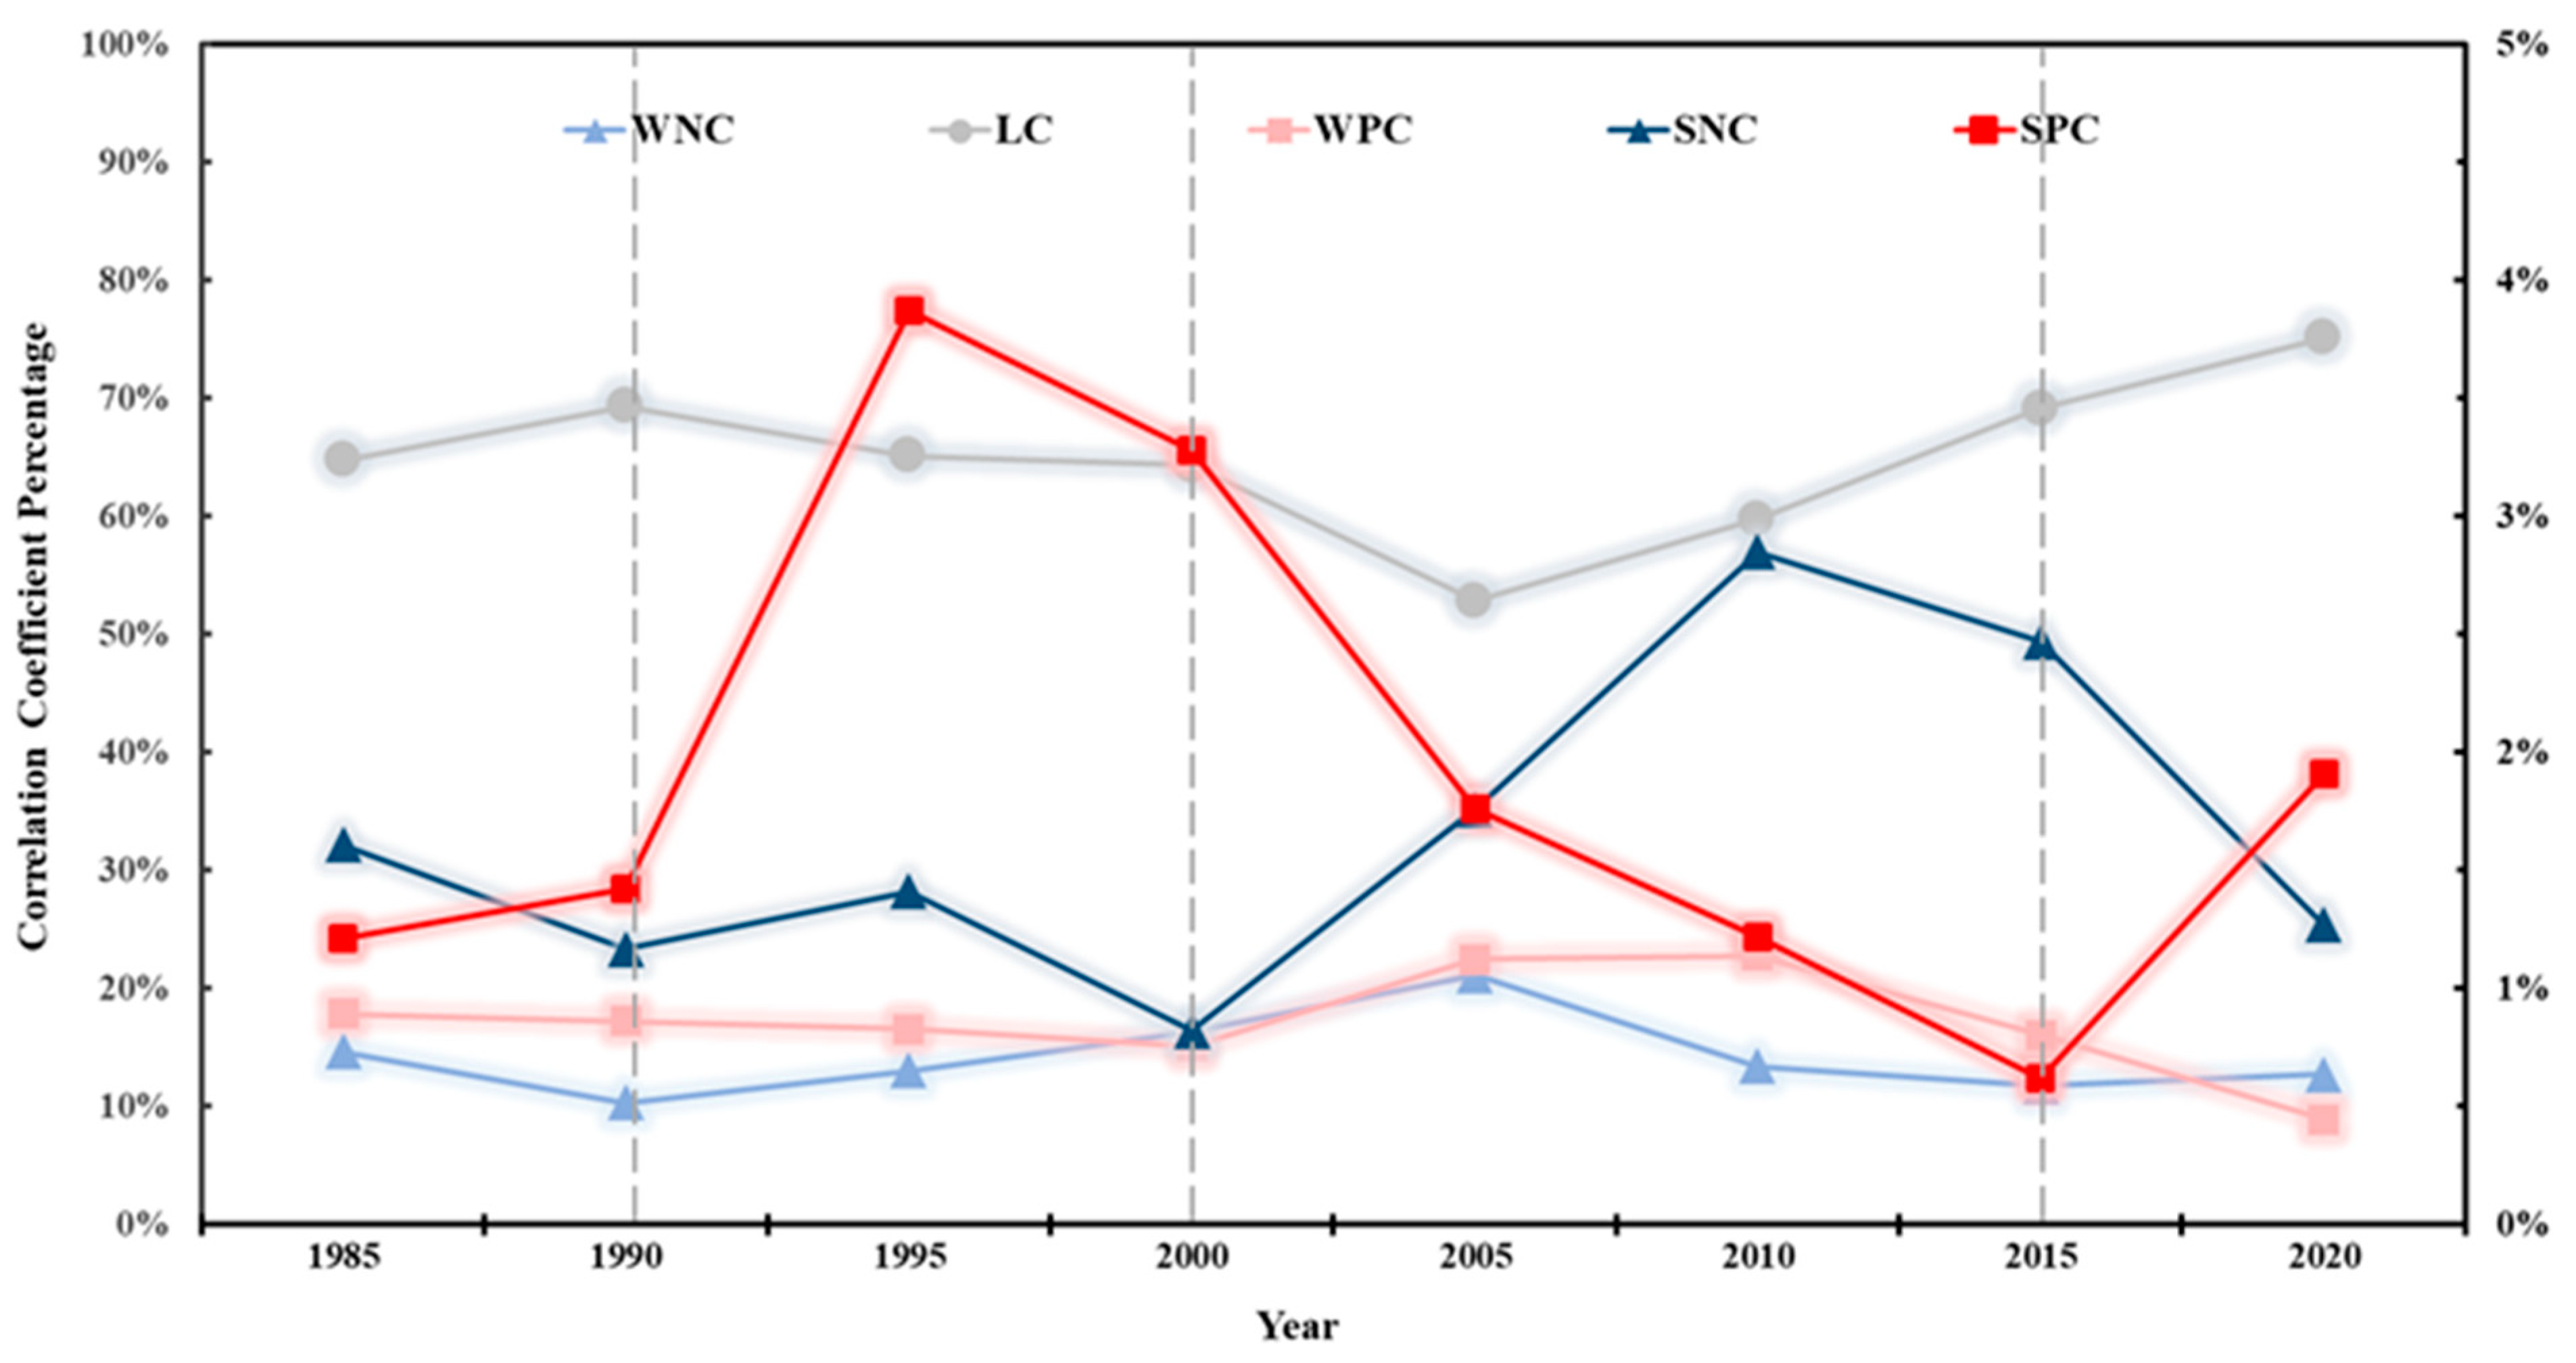
4.1.1. Spatial and Temporal Evolution of the Correlation Between Tidal Creek Attributes and Vegetation Indices

The temporal and spatial distributions of the CC between these two variables from 1985 to 2020 are presented in Figure 11. Four areas (A, B, C, and D) were selected based on spatial homogeneity principles and their ability to represent the successional progression of different landscape types. The mean CC values in these four areas were analyzed alongside the corresponding landscape classification patterns over time. This study discusses the mediating role of human activities in the interaction dynamics between the tidal creek system and vegetation patterns, and quantifies the active or passive responses arising from the shift from natural to anthropogenic influences in the study area.
In 1985, the high-value core area for SPC was primarily located near the dike and the edge of the mudflat (Figure 11a). This distribution was attributed to the tidal creek’s development closely following natural patterns at that time, allowing the primary tidal creek to extend to the dike [47,55,56]. Most of this area was dominated by S. mariqueter (CC < −0.4) or the mudflat devoid of vegetation (CC = 0.6–0.8). The high-value core area for SNC corresponded to regions with dense vegetation of P. australis (CC ∈ (−0.7, −0.8)).
By 1990, the TCL experienced a significant increase, resulting in a high-value aggregation of negative correlations (mean CC = −0.84) (Figure 11b). The northern area enclosed by the new dike transitioned from SNC to WPC because of the disappearance of P. australis (cover < 12%), which facilitated tidal creek development. Conversely, the southern area enclosed by the dike transitioned from SPC to SNC as P. australis occupied the space left by the vanished S. mariqueter (Δ cover = +43%/yr), thereby restricting tidal creek expansion [58,61,62]. This indicates that changes in vegetation types significantly influence the development of the tidal creek system.
Post-1995 regime stabilization saw dike-adjacent SPC depletion and SNC dominance persisting for two decades (Figure 11c,d). This shift was attributed to frequent construction activities near the dike, which inhibited the upstream extension of the primary tidal creeks, resulting in a shrinkage and retreat of tidal creeks [69,72]. The increase in the proportion of SNC in the northern part from 2000 to 2010 correlated with the magnitude and extent of the invasion of the exotic species S. alterniflora, amplified SNC intensity (CC < −0.85). This suggests that the vegetation types most affecting tidal creek development, in order of magnitude, are S. alterniflora > P. australis > S. mariqueter. Following the implementation of the ecological restoration project in 2013, the proportion of WPC decreased in the southern area because of the rehabilitation of P. australis, which significantly increased vegetation cover (Figure 11g,h).
A distinct phase can be observed in the historical changes in the percentage of CC for each classification (Figure 12). Compared to the temporal turning point of changes in the percentage of WNC, WPC exhibited a latency period of about 10 years, suggesting that vegetation growth and community dispersal occur at a faster rate than the development of the tidal creek system.
From 1985 to 1990, the proportion of SPC area increased slightly, primarily attributed to sedimentation, which facilitated the seaward expansion of the tidal flats [2,3]. This process positively contributed to tidal creek development, indicating a stage of natural development. However, during the period from 1990 to 1995, human activities such as dike construction and land reclamation significantly impacted the topography and geomorphology of the Dongtan wetland. Consequently, the tidal creek system and vegetation patterns showed a passive development trajectory, deviating from established natural processes. Notably, the percentage of SPC increased sustainably during this timeframe, reaching 3.87%.
By the year 2000, the intensified human activities resulted in a reduction of upstream sediment input, a decrease in the TCN, a decline in elevation, and diminished vegetation cover [2,3,4,5,6,7,9,16,18,20]. This led to a significant decrease in the SPC and SNC. The increasing influence of anthropogenic factors during this period is evident, marking a transition in the development pattern of the Dongtan wetland from a completely natural state to one characterized by passive responses to external pressures.
The 71% increase in the percentage of SNC from 2000 to 2015 can be largely attributed to the biological invasion of S. alterniflora, which rapidly expanded and outcompeted native vegetation, thereby inhibiting the extension of tidal creeks within the invaded areas [41,42,45]. By 2015, the percentage of SPC sharply declined by 84%, reflecting the overall degradation of the tidal creek system, as evidenced by decreases in TCN and TCD due to human activities.
In 2015, the Dongtan wetland initiated an ecological restoration project, marking a transition toward artificial intervention, which indirectly affected natural factors and facilitated a shift into a semi-natural recovery stage [69,72]. During this timeframe, the percentage of SNC decreased, while the percentage of SPC and LC continued to rise. This indicates that artificial interventions successfully mitigated the development instability, supported the growth of native dominant vegetation, and contributed to the gradual stabilization of the tidal creek system, reflecting a positive response to these interventions. The sequence of staged changes demonstrates that following the adverse impacts of human activities, local government implemented timely and appropriate measures for artificial intervention, effectively addressing potential hazards through scientific management, and allowing the Dongtan wetland to resume its natural development trajectory.

4.1.2. Temporal Variation of Correlation Coefficients in Areas of Interest

Using the three nodes established by human activities and their corresponding vegetation patterns as references (Figure 1 and Figure 2), we conducted a detailed analysis of the temporal interaction characteristics of CC across the four ROI. The observed alternation and fluctuations between positive and negative values of CC reflect shifts or declines in the tidal creek system and changes in landscape types (Figure 13).
The chronological changes in CC of Areas A and B over the years illustrate the invasion of native vegetation communities of P. australis and S. mariqueter by the exotic species S. alterniflora, followed by subsequent restoration efforts. In Area C, the temporal changes in CC reflect the restoration of native vegetation in the mudflat, which served as a backup space, transitioning into an ecological reserve during the seaward progradation process in the south-central region. For Area D, the chronological changes in CC reflect the direct impacts of dike construction and land reclamation projects on vegetation communities and tidal creek systems in the southern region. The analysis showed that the degree of influence of landscape type changes on the tidal creek system varied as follows: S. alterniflora (CC: −0.894), P. australis (CC: −0.732), mudflat (CC: 0.725) and S. mariqueter (CC: −0.375), which is more consistent with previous studies analyzing the sequential changes in vegetation cover and root development degree for these three vegetation types [16,20,45,55,58]. Notably, areas characterized by water and artificial landscapes could not support both vegetation cover and tidal creek systems, resulting in CC to be 0.

4.2. Mechanisms of Interaction Between Vegetation and Tidal Creeks

4.2.1. Mechanism of Vegetation Affecting the Development of Tidal Creeks

By combining previous studies with the analysis in this paper, the mechanism of vegetation growth restricting the development of tidal creeks is summarized into the following three aspects:
Roots consolidation: According to previous studies, vegetation root systems exert radial pressures (0.2–1.8 kPa range) during growth [73], enhancing sediment cohesion through rhizosphere bonding [74]. Belowground biomass density (BB) demonstrates a positive correlation with substrate stability (R2 = 0.67, p < 0.01) [75], where BB > 450 g/m3 reduces erosion potential by 38–52% [76]. Dense root networks (root length density > 15 cm/cm3) [77] increase bed roughness) [72], attenuating tidal current erosional energy (shear stress τ₀ reduction: 0.6 → 0.3 N/m2) [78]. This consolidation cascade inhibits tidal creek migration and stabilizes the morphology of tidal creeks.
Slow down the flow and dissipate the waves: Vegetation communities modulate nearshore hydrodynamics through biophysical interactions: As tidal currents propagate through salt marshes, S. alterniflora stems (density > 200 stems/m2) induce form drag (drag coefficient Cₐ = 0.8–1.2), attenuating flow velocities by 20–60% relative to unvegetated channels [79,80,81,82]. Concurrently, flexible stems dissipate wave energy via viscoelastic damping (wave height reduction: 38–72% during spring tides) [82], with dissipation efficiency scaling with vegetation biomass (R2 = 0.83, p < 0.001). This altered hydrodynamics reduces sediment transport capacity, promotes sedimentation, and inhibits tidal creeks development.
Sediment retaining: Vegetation communities enhance flocculation efficiency and sediment retention through biophysical filtration and hydrodynamic buffering. Vegetation communities exhibit significant sediment aggregation and retention effects on suspended sediment transported by tidal creeks. Combined with the decline in hydrodynamic energy, this process reduces suspended sediment mobility, leading to enhanced deposition of fine-grained particles within salt marsh zones. Consequently, surface sediments in vegetated marshes display finer grain sizes (compared to unvegetated mudflats) and exhibit higher substrate stability [83,84]. The increased consolidation of these sediments correlates with greater erosion resistance, thereby reducing the likelihood of tidal creek development in established salt marsh areas.

4.2.2. Mechanisms of Tidal Creeks Affecting the Evolution of Vegetation Patterns

The role of tidal creeks on vegetation is mainly reflected in the influence on the spatial and temporal distribution pattern of salt marsh vegetation, the structure of vegetation communities, and the growth condition of vegetation. The mechanism of action is mainly reflected in the following three aspects:
Substrate properties: The high salinity of tidal creek flows alters tidal flat substrate conditions, with associated fluctuations in soil salinity and moisture content directly impacting vegetation root development and photosynthetic efficiency [85,86]. Higher salinity tolerant species exhibit unhindered growth and community expansion under these conditions, whereas lower salinity tolerant species experience constrained growth and population decline. This differential response alters the spatial distribution of salt marsh vegetation, exhibiting a distinct zonation pattern correlated with tidal creek lateral extension gradients.
Seed transportation: When hydrodynamic conditions are met, the lateral extension of tidal creeks can span the upper, middle, and lower tidal zones. Combined with the transport capacity of tidal creek flows, vegetation seeds are dispersed across most tidal flats, providing foundational conditions for vegetation growth, species succession, and community expansion [87]. Building on previous studies and this research [88], tidal creek-mediated seed transport enabled the invasive species S. alterniflora to establish and proliferate, rapidly forming dominant communities along creek margins while displacing native vegetation habitats. The developmental extent of tidal creek systems shows a strong positive correlation with S. alterniflora’s expansion range [64,89]. Highly developed tidal creeks with broad lateral extension facilitate widespread seed dispersal into tidal flat interiors, resulting in expansive S. alterniflora colonization and enhanced invasive dominance.
Hydrological connectivity: As a conduit for material flux, the configuration of tidal creek networks governs the hydrological connectivity of tidal flats [79,84,86]. This connectivity modulates habitat zonation patterns and substrate geochemistry (e.g., redox potential, organic content), thereby indirectly shaping salt marsh vegetation distribution through bio geomorphic feedback.

4.3. Implications of Human Activities on the Dongtan Wetland

Comparative analyses with previous studies indicate that human activities exert both positive and negative impacts on the Dongtan wetland, with these activities playing a regulatory role in the wetland’s ecological dynamics through various interventions [30,31,32].
Negative impacts include: (1) the construction of dikes and land reclamation projects, which reduce vegetation cover and inhibit the development of tidal creek systems by disrupting vegetation communities and the upstream components of these systems [46,47,48,49]; (2) the introduction of non-native vegetation, which has led to the invasion by exotic species, thereby constraining the habitat of native dominant vegetation, significantly diminishing foraging and nesting opportunities for avian species, threatening the living space of benthic organisms, and causing alterations of the tidal creek system [65,66,74].
Conversely, positive impacts are evident in the form of ecological restoration projects that have mitigated the threats posed by biological invasions, restored habitats for native vegetation, and reestablished bird habitats [59,61,62]. These efforts contribute to the conservation of wetland biodiversity and enhance the resilience of coastal ecosystems.

5. Conclusions

This study reveals the morphodynamic interactions between tidal creek systems and vegetation evolution in Dongtan wetland under anthropogenic influences (1985–2020). Two regimes emerged: (A) Natural-process dominance: ① Completely natural phase (1985–1990): Absence of anthropogenic interventions; ② Semi-natural rehabilitation phase (2015–2020): Ecological restoration projects with adaptive management. (B) Anthropogenic-process dominance: ③ Passive developmental phase (1990–2000): Direct impacts of construction of human activity projects; ④ Biotic invasion phase (2000–2015): Indirect effects via exotic species colonization (e.g., S. alterniflora).
Vegetation growth conditions inversely correlate with tidal creek density, ranked in order of influence as follows: S. alterniflora, P. australis, and S. mariqueter. Vegetation stabilizes substrates through root consolidation and sediment retention, reducing erosivity and creek incision. Concurrently, tidal creeks transport saline water that inhibits root growth, while their extension governs hydrological connectivity, dispersing seeds to most of the tidal flats and restructuring habitat mosaics. This interaction exhibited a high degree of synergy and significant regularity.
Under anthropogenic dominance, direct interventions (e.g., reclamation) and indirect drivers (e.g., exotic vegetation introduction) triggered adaptive adjustments in tidal creek networks and vegetation patterns. The scale-dependent nature of human activities diminished system coupling efficiency and delayed feedback cycles, yet revealed dual regulatory effects; anthropogenic forcing (e.g., reclamation, species invasion) disrupted natural morpho-dynamics, while subsequent ecological engineering partially restored ecosystem functions. This cyclic landscape transformation—marked by natural-to-artificial-to-seminatural transitions—highlights the Dongtan wetland’s adaptive resilience. Notably, artificial landscapes exhibited the highest dynamism, underscoring persistent anthropogenic imprint on coastal evolution.
Limitations and perspective: To ensure spatial comparability of multi-source remote sensing data, the unified resampling to 30-m resolution may lead to the omission of primary tidal creeks shorter than 30 m and underestimate subtle morphodynamical changes caused by mixed pixel effects, particularly in vegetated areas. Future studies will establish a synergistic framework by coupling high-resolution remote sensing data, UAV-derived datasets, and multiscale geomorphodynamic models to advance small-scale tidal creek morphological inversion accuracy, complemented by optimized multi-temporal image acquisition strategies (low/spring/neap tides) to enhance spatiotemporal resolution and process reliability of intertidal dynamic monitoring.
This work clarifies the feedback mechanisms and human–nature coevolution in tidal wetlands, providing insights for sustainable coastal management.

Supplementary Materials

The following supporting information can be downloaded at: https://www.mdpi.com/article/10.3390/rs17101692/s1, Table S1: Validation results of vegetation classification accuracy in Chongming East Beach; Table S2: 1985–2020 construction project overview in Dongtan wetland; Figure S1: Landscape type transfer matrix.

Author Contributions

Conceptualization, D.F.; methodology, Y.S., D.F., Y.D. and B.L.; software, Y.S. and Y.D.; validation, D.F. and B.L.; formal analysis, Y.S.; investigation, Y.S.; resources, B.L.; data curation, Y.S.; writing—original draft preparation, Y.S.; writing—review and editing, Y.S., D.F. and Y.D.; visualization, Y.S.; supervision, D.F.; project administration, D.F.; funding acquisition, D.F. All authors have read and agreed to the published version of the manuscript.

Funding

This research was funded by the National Natural Science Foundation of China, grant number 42330411, and the Innovation Program of Shanghai Municipal Education Commission, grant number 2021-0107-00-07-E00093.

Data Availability Statement

The LANDSAT images are provided by the Geospatial Data Cloud site, Computer Network Information Center, Chinese Academy of Sciences: “http://www.gscloud.cn (accessed on 15 August 2020)”. SPOT images acquired by CNES’s Spot World Heritage Program: “https://regards.cnes.fr (accessed on 20 August 2020)”.

Acknowledgments

We acknowledge the use of the LANDSAT images supported by the Geospatial Data Cloud site. We acknowledge the use of the SPOT images supported by CNES’s Spot World Heritage Program. We express our gratitude to Yijin Wu, Xintao Jiang, Ling Wang, and Xianen Luo for their discussion and comments. We sincerely extend our gratitude to the manuscript reviewers for their constructive feedback. Your expert suggestions and critical revisions have significantly enhanced the academic rigor and structural coherence of this paper.

Conflicts of Interest

The authors declare that they have no known competing financial interests or personal relationships that could have appeared to influence the work reported in this paper.

References

  1. Odum, H.T.; Odum, E.P. The Energetic Basis for Valuation of Ecosystem Services. Ecosystems 2000, 3, 21–23. [Google Scholar] [CrossRef]
  2. Daidu, F.; Yuan, W.; Min, L. Classifications, sedimentary features and facies associations of tidal flats. J. Palaeogeogr. 2013, 2, 66–80. [Google Scholar] [CrossRef]
  3. Fan, D.; Li, C.; Wang, D.; Wang, P.; Greb, A.S.F. Morphology and Sedimentation on Open-Coast Intertidal Flats of the Changjiang Delta, China. J. Coast. Res. 2004, 20, 23–35. [Google Scholar]
  4. Wang, X.; Xiao, X.; Xu, X.; Zou, Z.; Chen, B.; Qin, Y.; Zhang, X.; Dong, J.; Liu, D.; Pan, L.; et al. Rebound in China’s coastal wetlands following conservation and restoration. Nat. Sustain. 2021, 4, 1076–1083. [Google Scholar] [CrossRef]
  5. Xu, Y.; Esposito, C.R.; Beltran-Burgos, M.; Nepf, H.M. Competing effects of vegetation density on sedimentation in deltaic marshes. Nat. Commun. 2022, 13, 4641. [Google Scholar] [CrossRef]
  6. Nicholls, R.J.; Wong, P.P.; Burkett, V.; Codignotto, J.; Saito, Y. Coastal systems and low-lying areas. J. Bacteriol. 2007, 2, 313–356. [Google Scholar]
  7. Gedan, K.B.; Silliman, B.R.; Bertness, M.D. Centuries of human-driven change in salt marsh ecosystems. Ann. Rev. Mar. Sci. 2009, 1, 117–141. [Google Scholar] [CrossRef]
  8. Coco, G.; Zhou, Z.; van Maanen, B.; Olabarrieta, M.; Tinoco, R.; Townend, I. Morphodynamics of tidal networks: Advances and challenges. Mar. Geol. 2013, 346, 1–16. [Google Scholar] [CrossRef]
  9. Murray, N.J.; Phinn, S.R.; DeWitt, M.; Ferrari, R.; Johnston, R.; Lyons, M.B.; Clinton, N.; Thau, D.; Fuller, R.A. The global distribution and trajectory of tidal flats. Nature 2019, 565, 222–225. [Google Scholar] [CrossRef]
  10. Blum, M.D.; Roberts, H.H. Drowning of the Mississippi Delta due to insufficient sediment supply and global sea-level rise. Nat. Geosci. 2009, 2, 488–491. [Google Scholar] [CrossRef]
  11. Francalanci, S.; Bendoni, M.; Rinaldi, M.; Solari, L. Ecomorphodynamic evolution of salt marshes: Experimental observations of bank retreat processes. Geomorphology 2013, 195, 53–65. [Google Scholar] [CrossRef]
  12. Davy, A.J. Development and Structure of Salt Marshes: Community Patterns in Time and Space. In Concepts and Controversies in Tidal Marsh Ecology; Weinstein, M.P., Kreeger, D.A., Eds.; Springer: Dordrecht, The Netherlands, 2000; pp. 137–156. [Google Scholar]
  13. Weinstein, M.P.; Kreeger, D.A. Concepts and Controversies in Tidal Marsh Ecology || Twenty More Years of Marsh and Estuarine Flux Studies: Revisiting Nixon (1980); Springer: Cham, Switzerland, 2002; pp. 391–423. [Google Scholar]
  14. Shi, Z.; Lamb, H.F.; Collin, R.L. Geomorphic change of saltmarsh tidal creek networks in the Dyfi Estuary, Wales. Mar. Geol. 1995, 128, 73–83. [Google Scholar] [CrossRef]
  15. Huang, H.; Fan, H. Change Detection of Tidal Flats and Tidal Creeks in the Yellow River Delta Using Landsat TM/ETM+ Images. Acta Geogr. Sin. 2004, 59, 723–730. [Google Scholar] [CrossRef]
  16. Chen, Y.; He, Z.; Li, B. Spatial Distribution of Tidal Creeks and Quantitative Analysis of Its Driving Factors in Chongming Dongtan, Shanghai. J. Jilin Univ. 2013, 43, 212–219. [Google Scholar]
  17. Zhou, Z.; Wei, Y.; Geng, L.; Zhang, Y.; Gu, Y.; Finotello, A.; D’Alpaos, A.; Gong, Z.; Xu, F.; Zhang, C.; et al. Cross-shore parallel tidal channel systems formed by alongshore currents. Nat. Commun. 2024, 15, 4732. [Google Scholar] [CrossRef] [PubMed]
  18. Mitsch, W.J.; Gosselink, J.G. Wetlands, 4th ed.; John Wiley & Sons: New York, NY, USA, 2007. [Google Scholar]
  19. Marani, M.; Belluco, E. On the drainage density of tidal networks. Water Resour. Res. 2003, 39, 1040. [Google Scholar] [CrossRef]
  20. Glaser, C.; Frei, S.; Massmann, G.; Gilfedder, B.S. Tidal creeks as hot-spots for hydrological exchange in a coastal landscape. J. Hydrol. 2021, 597, 126158. [Google Scholar] [CrossRef]
  21. Wallace, K.J.; Zedler, C.J.B. Evolution of tidal creek networks in a high sedimentation environment: A 5-year experiment at Tijuana Estuary, California. Estuaries 2005, 28, 795–811. [Google Scholar] [CrossRef]
  22. Schwarz, C.; Cox, T.; Van Engeland, T.; Van Oevelen, D.; Van Belzen, J.; Van de Koppel, J.; Soetaert, K.; Bouma, T.J.; Meire, P.; Temmerman, S. Field estimates of floc dynamics and settling velocities in a tidal creek with significant along-channel gradients in velocity and SPM. Estuar. Coast. Shelf Sci. 2017, 197, 221–235. [Google Scholar] [CrossRef]
  23. Gong, Z.; Zhao, K.; Zhang, C.; Dai, W.; Coco, G.; Zhou, Z. The role of bank collapse on tidal creek ontogeny: A novel process-based model for bank retreat. Geomorphology 2018, 311, 13–26. [Google Scholar] [CrossRef]
  24. Sun, J.; van Prooijen, B.; Wang, X.; Zhao, Z.; He, Q.; Wang, Z. Sediment fluxes within salt marsh tidal creek systems in the Yangtze Estuary. Geomorphology 2024, 449, 109031. [Google Scholar] [CrossRef]
  25. Sanger, D.M.; Holland, A.F.; Scott, G.I. Tidal creek and salt marsh sediments in South Carolina coastal estuaries: II. Distribution of organic contaminants. Arch. Environ. Contam. Toxicol. 1999, 37, 458–471. [Google Scholar]
  26. Kim, D. Modeling spatial and temporal dynamics of plant species richness across tidal creeks in a temperate salt marsh. Ecol. Indic. 2018, 93, 188–195. [Google Scholar] [CrossRef]
  27. Voulgaris, G.; Meyers, S.T. Temporal variability of hydrodynamics, sediment concentration and sediment settling velocity in a tidal creek. Cont. Shelf Res. 2004, 15, 1659–1683. [Google Scholar] [CrossRef]
  28. Larcombe, P.; Ridd, P.V. Megaripple dynamics and sediment transport in a mesotidal mangrove creek: Implications for palaeoflow reconstructions. Sedimentology 2010, 42, 593–606. [Google Scholar] [CrossRef]
  29. Catharine, P.; Denise, S.; Edward, W. An Assessment of Southeast United States Headwater Tidal Creek Sediment Contamination Over a Twenty-Year Period in Relation to Coastal Development. Environ. Manag. 2023, 72, 883–901. [Google Scholar]
  30. Dybiec, J.M.; Sharbaugh, M.; Cherry, R.J.A. Seasonal Sediment Dynamics in a Constructed and Natural Tidal Marsh in the Northern Gulf of Mexico. Wetl. J. Soc. Wetl. Sci. 2023, 43, 70.71–70.79. [Google Scholar] [CrossRef]
  31. Watson, E.B.; Wigand, C.; Davey, E.W.; Andrews, H.M.; Bishop, J.; Raposa, K.B. Wetland Loss Patterns and Inundation-Productivity Relationships Prognosticate Widespread Salt Marsh Loss for Southern New England. Estuaries Coasts 2017, 40, 662–681. [Google Scholar] [CrossRef]
  32. Hinkle, R.L.; Mitsch, W.J. Salt marsh vegetation recovery at salt hay farm wetland restoration sites on Delaware Bay. Ecol. Eng. 2005, 25, 240–251. [Google Scholar] [CrossRef]
  33. Tognin, D.; Finotello, A.; D’Alpaos, A.; Viero, D.P.; Pivato, M.; Mel, R.A.; Defina, A.; Bertuzzo, E.; Marani, M.; Carniello, L. Loss of geomorphic diversity in shallow tidal embayments promoted by storm-surge barriers. Sci. Adv. 2022, 8, eabm8446. [Google Scholar] [CrossRef]
  34. Moeller, I. Quantifying saltmarsh vegetation and its effect on wave height dissipation: Results from a UK East coast saltmarsh. Estuar. Coast. Shelf Sci. 2006, 69, 337–351. [Google Scholar] [CrossRef]
  35. Belluco, E.; Camuffo, M.; Ferrari, S.; Modenese, L.; Silvestri, S.; Marani, A.; Marani, M. Mapping salt-marsh vegetation by multispectral and hyperspectral remote sensing. Remote Sens. Environ. 2006, 105, 54–67. [Google Scholar] [CrossRef]
  36. Eastwood, J.A.; Yates, M.G.; Thomson, A.G.; Fuller, R.M. The reliability of vegetation indices for monitoring saltmarsh vegetation cover. Int. J. Remote Sens. 1997, 18, 3901–3907. [Google Scholar] [CrossRef]
  37. Beijma, S.V.; Comber, A.; Lamb, A. Random forest classification of salt marsh vegetation habitats using quad-polarimetric airborne SAR, elevation and optical RS data. Remote Sens. Environ. 2014, 149, 118–129. [Google Scholar] [CrossRef]
  38. Zhang, D.; Hu, Y.; Liu, M.; Chang, Y.; Yan, X.; Bu, R.; Zhao, D.; Li, Z. Introduction and Spread of an Exotic Plant, Spartina alterniflora, Along Coastal Marshes of China. Wetlands 2017, 37, 1181–1193. [Google Scholar] [CrossRef]
  39. Adamowicz, S.C.; Roman, C.T. New England salt marsh pools: A quantitative analysis of geomorphic and geographic features. Wetlands 2005, 25, 279–288. [Google Scholar] [CrossRef]
  40. Balke, T.; Webb, E.L.; Elzen, E.V.D.; Galli, D.; Herman, P.M.J.; Bouma, T.J. Seedling establishment in a dynamic sedimentary environment: A conceptual framework using mangroves. J. Appl. Ecol. 2013, 50, 740–747. [Google Scholar] [CrossRef]
  41. Li, S.H.; Ge, Z.M.; Xin, P.; Tan, L.S.; Li, Y.L.; Xie, L.N. Interactions between biotic and abiotic processes determine biogeomorphology in Yangtze Estuary coastal marshes: Observation with a modeling approach. Geomorphology 2021, 395, 107970. [Google Scholar] [CrossRef]
  42. Liu, W.; Chen, X.; Wang, J.; Zhang, Y. Does the effect of flowering time on biomass allocation across latitudes differ between invasive and native salt marsh grass Spartina alterniflora? Ecol. Evol. 2022, 12, e8681. [Google Scholar] [CrossRef]
  43. Dusseux, P.; Hubert-Moy, L.; Corpetti, T.; Vertès, F. Evaluation of SPOT imagery for the estimation of grassland biomass. Int. J. Appl. Earth Obs. Geoinf. 2015, 38, 72–77. [Google Scholar] [CrossRef]
  44. Chen, J.; Gu, S.; Shen, M.; Tang, Y.; Matsushita, B. Estimating aboveground biomass of grassland having a high canopy cover: An exploratory analysis of hyperspectral data. Int. J. Remote Sens. 2009, 30, 6497–6517. [Google Scholar] [CrossRef]
  45. Jackson, M.V.; Fuller, R.A.; Gan, X.; Li, J.; Choi, C.Y. Dual threat of tidal flat loss and invasive Spartina alterniflora endanger important shorebird habitat in coastal mainland China. J. Environ. Manag. 2021, 278, 111549. [Google Scholar] [CrossRef] [PubMed]
  46. Feng, L.H.; Ma, Y.J. Evolution of tidal flats in China and ecological exploitation of tidal flat resources. Environ. Earth Sci. 2012, 67, 1639–1649. [Google Scholar] [CrossRef]
  47. Cui, B.; He, Q.; Gu, B.; Bai, J.; Liu, X. China’s Coastal Wetlands: Understanding Environmental Changes and Human Impacts for Management and Conservation. Wetlands 2016, 36, 1–9. [Google Scholar] [CrossRef]
  48. Li, H.Y.; Wang, Z.L.; Meng, W.Q.; Mo, X.Q.; Hu, B.B. Temporal-spatial variations and driving factors analysis of coastal reclamation in China. Estuar. Coast. Shelf Sci. 2017, 191, 39–49. [Google Scholar]
  49. Wang, W.; Liu, H.; Li, Y.; Su, J. Development and management of land reclamation in China. Ocean Coast. Manag. 2014, 102, 415–425. [Google Scholar] [CrossRef]
  50. Wang, J.; Chen, J.; Wen, Y.; Fan, W.; Liu, Q.; Tarolli, P. Monitoring the coastal wetlands dynamics in Northeast Italy from 1984 to 2016. Ecol. Indic. 2021, 129, 107906. [Google Scholar] [CrossRef]
  51. Allen, J.R.L. Retreat rates of soft-sediment cliffs: The contribution from dated fishweirs and traps on Holocene coastal outcrops. Proc. Geol. Assoc. 2002, 113, 1–8. [Google Scholar] [CrossRef]
  52. Yim, J.; Kwon, B.O.; Nam, J.; Hwang, J.H.; Choi, K.; Khim, J.S. Analysis of forty years long changes in coastal land use and land cover of the Yellow Sea: The gains or losses in ecosystem services. Environ. Pollut. 2018, 241, 74–84. [Google Scholar] [CrossRef]
  53. Zhang, H.; Sun, T.; Zhou, Z.; Cao, H.; Qiu, J.; Huang, X. Increased river flow enhances the resilience of spatially patterned mudflats to erosion. Water Res. 2022, 220, 118660. [Google Scholar] [CrossRef]
  54. Zheng, L.; Wang, Y.; Li, J. Quantifying the spatial impact of landscape fragmentation on habitat quality: A multi-temporal dimensional comparison between the Yangtze River Economic Belt and Yellow River Basin of China. Land Use Policy 2023, 125, 106463. [Google Scholar] [CrossRef]
  55. Yuan, S.; Kuang, R.; Liao, Q. Remote sensing extraction and dynamic change of wetland vegetation—A case study of Eastern Chongming Island. J. Jiangxi Univ. Sci. Technol. 2018, 39, 44–51. [Google Scholar]
  56. Xie, D.F.; Fan, D.D.; Gao, S. Flat of Chongming island and its impacts on the sediment distribution. Mar. Geol. Quat. Geol. 2006, 26, 9–16. [Google Scholar]
  57. Wang, H.; Ge, Z.; Yuan, L.; Zhang, L. Evaluation of the combined threat from sea-level rise and sedimentation reduction to the coastal wetlands in the Yangtze Estuary, China. Ecol. Eng. 2014, 71, 346–354. [Google Scholar] [CrossRef]
  58. Chen, J.; Wang, L.; Li, Y.; Zhang, W.; Fu, X.; Le, Y. Effect of Spartina alterniflora invasion and its controlling technologies on soil microbial respiration of a tidal wetland in Chongming Dongtan, China. Ecol. Eng. 2012, 41, 52–59. [Google Scholar] [CrossRef]
  59. Gu, Y.F. Technologies and their effects on ecological control of Spartina alterniflora in Chongming Dongtan. J. Shanghai Jiaotong Univ. 2019, 37, 6. [Google Scholar]
  60. Xie, W.M. Study on Morphodynamic Processes and the Influence of Vegetation in a High-Turbidity Estuarine Tidal Flat; East China Normal University: Shanghai, China, 2018. [Google Scholar]
  61. Tang, C.D. Ecological Control of Spartina alterniflora and Improvement of Birds Habitats in Chongming Dongtan Wetland, Shanghai. Wetl. Sci. Manag. 2016, 12, 4–8. [Google Scholar]
  62. Zhao, G.Q.; Zhang, L.Q.; Liang, X. A comparison of photosynthetic characteristics between an invasive plant Spartina alterniflora and an indigenous plant Phragmites australis. Acta Ecol. Sin. 2005, 25, 1604–1611. [Google Scholar]
  63. Horton, R.E.; Horton, R.; Horton, H. Erosional development of streams and their drainage basins; hydrophysical approach to quantitative morphology. J. Jpn. For. Soc. 1945, 56, 275–370. [Google Scholar] [CrossRef]
  64. Han, X.; Fan, D.; Huang, J.; Tu, J.; Meng, L.; Chen, S. Cumulative impact of human activities on hydro-sediment dynamics and morphodynamics in the highly altered Yangtze Estuary. J. Hydrol. 2025, 651, 132625. [Google Scholar] [CrossRef]
  65. Li, H.; Zhang, L. An experimental study on physical controls of an exotic plant Spartina alterniflora in Shanghai, China. Ecol. Eng. 2008, 32, 11–21. [Google Scholar] [CrossRef]
  66. Zhao, C.; Li, J.; Zhao, X. Mowing plus shading as an effective method to control the invasive plant Spartina alterniflora. Flora 2019, 257, 151408. [Google Scholar] [CrossRef]
  67. Strahler, A.N. Dynamic basis of geomorphology. Geol. Soc. Am. Bull. 1952, 63, 923–938. [Google Scholar] [CrossRef]
  68. Kearney, W.S.; Fagherazzi, S. Salt marsh vegetation promotes efficient tidal channel networks. Nat. Commun. 2016, 7, 12287. [Google Scholar] [CrossRef]
  69. Novakowski, K.I.; Torres, R.; Gardner, L.R.; Voulgaris, G. Geomorphic analysis of tidal creek networks. Water Resour. Res. 2004, 40, W05401. [Google Scholar] [CrossRef]
  70. Chen, L.; Han, Z. Study of the Influence of the Deep-Water Channel Project in the Yangtze River Estuary on Ecological Landscape and Fractal Dimensions of Jiuduan Shoal Tidal Channels. J. Coast. Res. 2015, 73, 146–154. [Google Scholar] [CrossRef]
  71. Zhou, Z.; Wu, Y.; Fan, D.; Wu, G.; Luo, F.; Yao, P.; Gong, Z.; Coco, G. Sediment sorting and bedding dynamics of tidal flat wetlands: Modeling the signature of storms. J. Hydrol. 2022, 610, 127913. [Google Scholar] [CrossRef]
  72. Ai, X.H.; Xin, K.; Zeng, S.J. A Review on Evolution and Ecological Effects of Tidal Creeks. Wetl. Sci. 2024, 22, 603–616. [Google Scholar] [CrossRef]
  73. Bush, N.; Bush, E.; Sokolova, Y.; Bush, N.; Blanchard, P. Utilizing the physiological adaptation mechanisms of coastal plants for vegetative restoration of barrier islands. Ocean Coast. Manag. 2018, 161, 222–227. [Google Scholar] [CrossRef]
  74. Qin, D.U.; Zhong, Q.C.; Kai-Yun, W.A.N.G. Root Effect of Three Vegetation Types on Shoreline Stabilization of Chongming Island, Shanghai. Pedosphere 2010, 20, 692–701. [Google Scholar]
  75. Andreoli, A.; Bischetti, G.B.; Chiaradia, E.; Cislaghi, A.; Comiti, F. The Roots of River Restoration: Role of Vegetation Recover in Bed Stabilization. In Proceedings of the 37th IAHR World Congress: Managing Water for Sustainable Development, Learning from the Past for the Future, Kuala Lumpur, Malaysia, 13–18 August 2017. [Google Scholar]
  76. Davidson-Arnott, R.G.D.; Proosdij, D.V.; Ollerhead, J.; Schostak, L. Hydrodynamics and sedimentation in salt marshes: Examples from a macrotidal marsh, Bay of Fundy. Geomorphology 2002, 48, 209–231. [Google Scholar] [CrossRef]
  77. Eiliott, A.H. Settling of fine sediment in a channel with emergent vegetation. J. Hydraul. Eng. 2000, 126, 570–577. [Google Scholar] [CrossRef]
  78. Gyssels, G.; Poesen, J.; Bochet, E.; Li, Y. Impact of plant roots on the resistance of soils to erosion by water: A review. Prog. Phys. Geogr. 2005, 29, 189–217. [Google Scholar] [CrossRef]
  79. Hughes, Z.J. Tidal Channels on Tidal Flats and Marshes; Springer: Berlin/Heidelberg, Germany, 2012. [Google Scholar]
  80. Rominger, J.T.; Lightbody, A.F.; Nepf, H.M. Effects of Added Vegetation on Sand Bar Stability and Stream Hydrodynamics. J. Hydraul. Eng. 2010, 136, 994–1002. [Google Scholar] [CrossRef]
  81. James, C.S.; Jordanova, A.A.; Nicolson, C.R. Flume experiments and modelling of flow-sediment-vegetation interactions. Int. Assoc. Hydrol. Sci. 2002, 276, 3–9. [Google Scholar]
  82. Bouma, T.J.; Vries, M.B.D.; Low, E.; Kusters, L.; Herman, P.M.J.; Tánczos, I.C.; Temmerman, S.; Hesselink, A.; Meire, P.; Regenmortel, S.V. Flow hydrodynamics on a mudflat and in salt marsh vegetation: Identifying general relationships for habitat characterisations. Hydrobiologia 2005, 540, 259–274. [Google Scholar] [CrossRef]
  83. Yang, S.L.; Li, H.; Ysebaert, T.; Bouma, T.J.; Zhang, W.X.; Wang, Y.Y.; Li, P.; Li, M.; Ding, P.X. Spatial and temporal variations in sediment grain size in tidal wetlands, Yangtze Delta: On the role of physical and biotic controls. Estuar. Coast. Shelf Sci. 2008, 77, 657–671. [Google Scholar] [CrossRef]
  84. Wang, C.; Zheng, S.-s.; Wang, P.-f.; Hou, J. Interactions between vegetation, water flow and sediment transport: A review. J. Hydrodyn. 2015, 27, 24–37. [Google Scholar] [CrossRef]
  85. Lvarez-Rogel, J.; Jiménez-Cárceles, F.J.; Roca, M.J.; Ortiz, R. Changes in soils and vegetation in a Mediterranean coastal salt marsh impacted by human activities. Estuar. Coast. Shelf Sci. 2007, 73, 510–526. [Google Scholar] [CrossRef]
  86. Xin, P.; Li, L.; Barry, D.A. Tidal influence on soil conditions in an intertidal creek-marsh system. Water Resour. Res. 2013, 49, 137–150. [Google Scholar] [CrossRef]
  87. Koretsky, C.M.; Cuellar, A.; Haveman, M.; Beuving, L.; Shattuck, T.; Wagner, M. Influence of Spartina and Juncus on saltmarsh sediments. II. Trace element geochemistry. Chem. Geol. 2008, 255, 100–113. [Google Scholar] [CrossRef]
  88. Rosso, P.H.; Ustin, S.L.; Hastings, A. Use of lidar to study changes associated with Spartina invasion in San Francisco Bay marshes. Remote Sens. Environ. 2006, 99, 295–306. [Google Scholar] [CrossRef]
  89. Fan, Y.; Zhou, D.; Ke, Y.; Wang, Y.; Wang, Q.; Zhang, L. Quantifying the Correlated Spatial Distributions between Tidal Creeks and Coastal Wetland Vegetation in the Yellow River Estuary. Wetlands 2020, 40, 2701–2711. [Google Scholar] [CrossRef]
Figure 1. Overview of the study area. (a) Location of the Dongtan wetland within the Changjiang Estuary, as depicted in a satellite image taken on August 16, 2020; (b) An enlarged view of the Dongtan wetland illustrating historical reclamation projects in terms of different dikes and recent ecological restoration projects; TJS (Tuan-Jie-Sha) and DWS (Dong-Wang-Sha) marking the locations of two isolated sandbars in 1985 which were reclaimed in 1995, and (c) Detail maps depicting recent ecological restoration projects: the S. alterniflora Ecological Management Project (SEMP) and the Bird Habitat Optimization Project (BHOP).
Remotesensing 17 01692 g001
Figure 2. The evolution of vegetation patterns in the Dongtan wetland from 1985 to 2020.
Remotesensing 17 01692 g002
Figure 3. Changes in vegetation coverage in the Dongtan wetland from 1985 to 2020, aligning with the timing of various project constructions.
Remotesensing 17 01692 g003
Figure 4. Distribution of NDVI in the Dongtan wetland from 1985 to 2020 and evolution of vegetation patterns in the Dongtan wetland from 1985 to 2020.
Remotesensing 17 01692 g004
Figure 5. Landscape type transitions in the Dongtan wetland from 1985 to 2020. (1, 2, 3, 4, 5 and 6 represent different landscape types in the order of P. australis, S. mariqueter, S. alterniflora, mudflat, water, and artificial landscape, with the transitions between numbers indicating the transfer of the corresponding landscape types).
Remotesensing 17 01692 g005
Figure 6. Changes in transfer area for different landscape types in the Dongtan wetland from 1985 to 2020.
Remotesensing 17 01692 g006
Figure 7. Distribution of tidal creeks in the Dongtan wetland from 1985 to 2020.
Remotesensing 17 01692 g007
Figure 8. Overviews of box plots depicting tidal creek lengths in the Dongtan wetland from 1985 to 2020. Subfigures (ah) represent the years 1985–2020 respectively.
Remotesensing 17 01692 g008
Figure 9. Development of TCD in the Dongtan wetland from 1985 to 2020.
Remotesensing 17 01692 g009
Figure 10. Changes in the properties of tidal creek units in the Dongtan wetland from 1985 to 2020. To enhance clarity and reduce visual clutter, data points from the years 1985,1990, 2000, 2015, and 2020 were selected for presentation on the right side. The squares represent the average values; the solid lines indicate positive or negative deviations, both horizontally and vertically; I–IV represent different developmental stages of tidal creek evolution in Dongtan wetland; the arrows denote the direction of trend changes; the dotted lines mark the transitions between different stages.
Remotesensing 17 01692 g010
Figure 11. Overview of the spatial and temporal distribution of CC between TCD and NDVI in the Dongtan wetland from 1985 to 2020. CC with absolute values greater than 0.5 are marked with solid dots, and the rectangles of different colors represent the geographic locations of the four selected areas of interest.
Remotesensing 17 01692 g011
Figure 12. Changes in the percentage of CC for each classification from 1985 to 2020.
Remotesensing 17 01692 g012
Figure 13. Temporal variation of CC for areas of interest A, B, C and D from 1985 to 2020. The color bars indicate the homogeneity of vegetation types within the intervals, and the dotted lines denote stages of change.
Remotesensing 17 01692 g013
Table 1. Data Sources.
SatelliteAcquisition DateTidal LevelResolution
LANDSAT523 August 1985LTL30 m
5 July 1984LTL30 m
SPOT127 August 1987LTL20 m
LANDSAT511 September 1990LTL30 m
23 July 1989LTL30 m
SPOT319 March 1995LTL20 m
LANDSAT512 August 1995LTL30 m
03 June 1995LTL30 m
LANDSAT718 September 2000LTL30 m
25 July 2000LTL30 m
SPOT422 July 2000LTL20 m
LANDSAT715 August 2005LTL30 m
18 October 2004LTL30 m
SPOT515 October 2005LTL10 m
LANDSAT508 August 2010LTL20 m
12 July 2009LTL30 m
SPOT416 August 2010LTL20 m
LANDSAT803 August 2015LTL30 m
25 July 2015LTL30 m
23 October 2015LTL30 m
LANDSAT816 August 2020LTL30 m
24 June 2019LTL30 m
28 September 2021LTL30 m
Disclaimer/Publisher’s Note: The statements, opinions and data contained in all publications are solely those of the individual author(s) and contributor(s) and not of MDPI and/or the editor(s). MDPI and/or the editor(s) disclaim responsibility for any injury to people or property resulting from any ideas, methods, instructions or products referred to in the content.

