Article

The Individual and Combined Effects of Natural–Human Factors on Forest Fire Frequency in Northeast China

1
School of Environment, Northeast Normal University, Changchun 130024, China
2
State Environmental Protection Key Laboratory of Wetland Ecology and Vegetation Restoration, Northeast Normal University, Changchun 130024, China
3
Key Laboratory of Vegetation Ecology, Ministry of Education, Changchun 130024, China
*
Author to whom correspondence should be addressed.
Remote Sens. 2025, 17(10), 1685; https://doi.org/10.3390/rs17101685
Submission received: 25 February 2025 / Revised: 27 March 2025 / Accepted: 8 May 2025 / Published: 10 May 2025

Abstract

:
The complex interaction between nature and human factors has led to frequent forest fires, but their combined effects in different areas remain unclear. Taking the Northeast China forest as the study area, this study integrates structural equation modeling (SEM) and Vine Copula analysis to quantify these drivers over 2001–2022. Results show that 70.42% of forest fires were caused by humans, clustering in populated low-elevation areas. SEM revealed partial correlations of 0.48 (weather conditions) and 0.59 (human activities) with forest fire frequency; canopy moisture was negatively correlated with fire (−0.38). Vine Copula indicated a joint probability of 0.32 between the human footprint index (HFI) and forest fires under high temperatures. This study can provide a framework for region-specific fire management in temperate forests by combining the effects of various influences.

1. Introduction

Forests play an essential role in soil and water conservation, intercepting precipitation, conserving water sources, protecting biodiversity, and preventing windproof and sand fixation in the biosphere [1,2,3,4,5]. They are the necessary basis for maintaining ecological balance and security on the earth’s surface. However, forests are also highly vulnerable to fire threats. Forest fires often cause severe environmental and socioeconomic problems worldwide and have become a major issue at present. Forest fires are one of the leading natural disasters affecting forest ecosystems [6]. Forest fires occur globally, and their frequency and burned areas have gradually increased with climate change [7]. Large-scale forest fires not only cause homeless residents in the forest area due to the burning down of buildings but may also result in economic losses and casualties and even have adverse social impacts. Forest fires also cause severe ecological disasters due to damage to the ecosystem [8].
Current research shows that forest fires are vulnerable to the effects of global warming, leading to the increased incidence and destructiveness of forest fires [9]. The occurrence and propagation of forest fires are intricately linked to meteorological elements. Among meteorological factors, wind is a crucial factor affecting the spread of forest fires. Wind speed could accelerate the combustion of forest fuels. The burned area increases with the atmospheric turbulence [10,11,12]. An increase in air temperature directly decreases the moisture content of forest fuel, causing forest fuel to be easily ignited [13,14]. Because precipitation and evaporation affect the moisture content of flammable fuels in the forest, they also impact the frequency of fires [15]. In addition to natural factors, there are also anthropic factors that affect the frequency of forest fires. Certain forested regions with dense populations often experience a heightened occurrence of forest fires. Numerous investigations have demonstrated that human activity is the primary cause of forest fires [16,17,18].
To date, forest fire hazard and risk assessment have become one of the hot topics of current research. Several studies on forest fire danger and risk assessment have been promoted based on GIS (Geographic Information System) [19] and multi-sensor technology [20]. These studies applied solar-powered fire detection systems for forest fire early warning [21], some studies combined 360-degree cameras with multi-scale vision transformers to detect fires [22], and they also utilized machine learning to assess the risk of forest fires by solving nonlinear problems [23]. These endeavors have facilitated the advancement of forest fire risk evaluation and preemptive alert systems. However, current research focuses more on the impact of natural factors on forest fire risk, with less consideration of human factors. Present research has not revealed the contribution rate of natural factors and human factors in forest fire risk.
In Northeast China, abundant forestry resources are often plagued by frequent fires [24], significantly impacting the local ecosystem. Previous research has mainly focused on climatic, topographic, and vegetation factors influencing forest fires over the past two decades [25,26,27]. However, few studies have integrated natural and human factors in analyzing the causes of these fires. This study aims to explore the compound effect of human–natural factors on fires by SEM and the Vine Copula model. Exploring the underlying factors that drive forest fire occurrence is a meaningful endeavor to study forest fire behavior and provide valuable guidance for forest fire management.
SEM was employed to investigate how critical factors, directly and indirectly, affect fire frequency, while the Vine Copula model analyzed joint probability distributions among climate, human activities, and forest fires. SEM can simultaneously analyze relationships among multiple variables, including latent ones, offering comprehensive statistical metrics like χ2/df, the standardized root mean square residual (SRMR), the goodness of fit index (GFI), and the comparative fit index (CFI) to assess model fit rigorously. Meanwhile, the Vine Copula model addresses joint probability distributions among multiple variables, which is useful in understanding dependencies under specific conditions of forest fires.
This study provides a novel integration of SEM and Vine Copula, which quantifies direct/indirect pathways in different latent variables (e.g., human footprint and climate factors), overcoming the ambiguities of correlation causation in traditional models. Vine Copula captures nonlinear dependencies in different forest fire drivers (e.g., maximum temperature and human footprint index interactions) to provide a probabilistic assessment of joint extreme events. Direct/indirect relationships between forest fires and influencing variables are explored in this study to gain insight into how multiple factors combine to cause forest fires to occur in forested areas of Northeast China.

2. Data and Methods

2.1. Study Area

The study area is located in Northeast China (38°43′–53°30′N, 115°20′–135°10′E), covering an area of 1.47 × 10⁶ km2. It includes the provinces of Heilongjiang, Jilin, Liaoning, and the eastern Inner Mongolia Autonomous Region. This area has a temperate continental monsoon climate, with annual precipitation of 300–1000 mm and annual temperature ranging from −10 to −20 °C. Coniferous woods and mixed coniferous and broad-leaved forests are the two primary types of forests [28,29]. The terrain is high in the surrounding mountains and low in the middle plain, with forests mainly distributed in the surrounding mountainous areas (Figure 1).

2.2. Data Sources

Forest fires are affected by multiple factors in the fire environment. Based on previous studies on forest fire risk, we selected relevant factors that affected forest fires for this study. The data sources for these factors are listed in Table 1.
(1)
Fire data
These data were obtained from MODIS satellite forest fire data. For data reliability, another set of fire data from the FIRMS system on NASA’s official website was also used to analyze forest fires.
(2)
Canopy moisture content data
The temperature vegetation dryness index (TVDI) was derived from the National Earth System Science Data Center. It is a soil moisture retrieval model based on the normalized difference vegetation index (NDVI) and land surface temperature. Land cover data were sourced from the National Service Center for Specialty Environmental Observation Stations. The NDVI was obtained from the Third Pole Environment Data Center. The TVDI was calculated as follows (Equations (1)–(3)).
T V D I = T s T m i n T m a x T m i n
T m a x = a + b N D V I
T m i n = c + d N D V I
where Ts is the surface temperature (°C); Tmin is the lowest surface temperature under NDVI; Tmax is the maximum surface temperature at the corresponding NDVI, which corresponds to the wet edge and dry edge equations; and a, b, c, and d are the regression coefficients of the dry and wet edge equations, which are the intercept and slope of the dry and wet edge equations, respectively [30].
(3)
Fire weather data
Using the Google Earth Engine (GEE) platform, the daily meteorological data, including maximum temperature, mean temperature, precipitation, wind speed, and standardized precipitation evapotranspiration index (SPEI), were examined and applied to determine the weather conditions that corresponded with the forest fire by using batch matching in the ERA5 land dataset.
(4)
Landform data
The landform factor consists of four explanatory variables: elevation, slope, aspect, and SMCI. The elevation data were obtained from the Geospatial Data Cloud. The spatial resolution of the given digital elevation map (DEM) is 30 m. The “Spatial Analyst” tool in ArcGIS 10.7 was used to do surface analysis by extracting slope and aspect from the DEM. SMCI data were obtained from the China-wide 1 km dataset of the National Tibetan Plateau Science Data Center.
(5)
Human activity data
To explain how human activity impacts forest fires, variables including the nighttime light index, the HFI (human footprint index), population density, distance to nearest residential areas, and distance to nearest roads were selected to analyze human activities. The population density data were acquired from the LandScan dataset, the nighttime light index was provided by the spatiotemporal third pole environmental big data platform, and the road network data and residential data were sourced from OSM (Open Street Map).
The HFI is a quantitative indicator that characterizes the impact of human activities. The indicator comes from the Urban Environmental Monitoring and Modeling (UEMM) team at the China Agricultural University (CAU), which uses a combination of eight variables to reflect different aspects of human activity, such as the built environment, population density, nighttime lighting, farmland, pastureland, roads, railroads, and navigable waterways. The “Analysis Tools” in ArcGIS 10.7 were used to analyze the distance to the closest residential area and road. These distance indicators can reflect the spatial accessibility and degree of impact of human activities. Through these spatial analysis methods, we were able to more accurately identify the potential areas of influence of human activities on forest fires, which in turn improved the reliability of the study conclusions. In addition, we standardized the human activity data to ensure comparability between different indicators. For example, data such as population density and nighttime lighting index were standardized to the same scale to avoid bias introduced by differences in data magnitude and scale. Such standardization helps to improve the stability and accuracy of the model.

2.3. Methods

2.3.1. Structural Equation Modeling (SEM)

SEM is a statistical model that uses hypothesis testing methods to analyze structural relationships in certain phenomena. It is frequently used to examine and evaluate how latent and explicit variables relate to each other in models [31]. The structural and measurement models are the two primary components of the structural equation model. To analyze the relationship between latent variables, structural models are utilized to build the relations between latent and explicit variables. Measurement models are employed to conduct statistical significance tests on each influence pathway and characterize the relationships between latent variables. Structural equation methods are better suited to handle multi-dimensional and multi-result problems than multiple regression and logistic regression models [32].
The following are the expressions for the structural model and measurement model:
Measurement   model :   x = Λ x ξ
Measurement   model :   y = Λ y η
Structural   model :   η = B η + T ξ
where x and y represent endogenous and exogenous observation variables, respectively; Λx and Λy represent the functional relationship between latent variables corresponding to endogenous and exogenous observation variables, namely the factor loading matrix; ξ and η represent latent variables corresponding to endogenous and exogenous observed variables; the link between the endogenous latent variables is indicated by B; and the impact of external latent factors on endogenous latent variables is represented by T. Latent variables in SEM models are concepts or constructs that cannot be directly observed, explicit variables are data that can be directly measured or observed, endogenous variables are results or manifestations that are influenced by other variables, and exogenous variables are factors that independently influence other variables in the model.
We used SEM to analyze meteorological, vegetation, human activities, and terrain factors that contribute to forest fires. The chi-square (χ2) (p > 0.05) with SRMR (standardized root mean square residual) < 0.05 was used to test and assess the model. The “lavaan” package in RStudio 4.3 was applied to simulate SEM.

2.3.2. Vine Copula

Based on the SEM analysis, the variables with the highest impacts on forest fires were selected from fire weather and human activities. Then, we analyzed their composite relationship and the goodness of fit between these two variables and forest fire occurrence using the Vine Copula model [33]. Copula is often considered the best method for studying the impact of composite events [34].
Copula is a multi-dimensional joint distribution function that connects the multivariate distribution on [0, 1] with the univariate marginal distribution, resulting in a uniform distribution. The multivariate cumulative distribution function obtained through the Copula method can simulate the dependency structure between variables with different marginal probability distributions [35]. Therefore, Copula can evaluate the dependency relationships between variables using joint probability distributions. Table 2 shows the standard Copula functions and their expressions.
The fit quality of the Copula function parameters is assessed using the Akaike information criterion (AIC) criterion approach, and it is calculated as follows:
A I C = 2 ( l n , m a x p )
where l n , m a x is the logarithm of the maximum value of the likelihood function, and p is the number of free parameters. The small AIC value means a good fit of the Copula function.

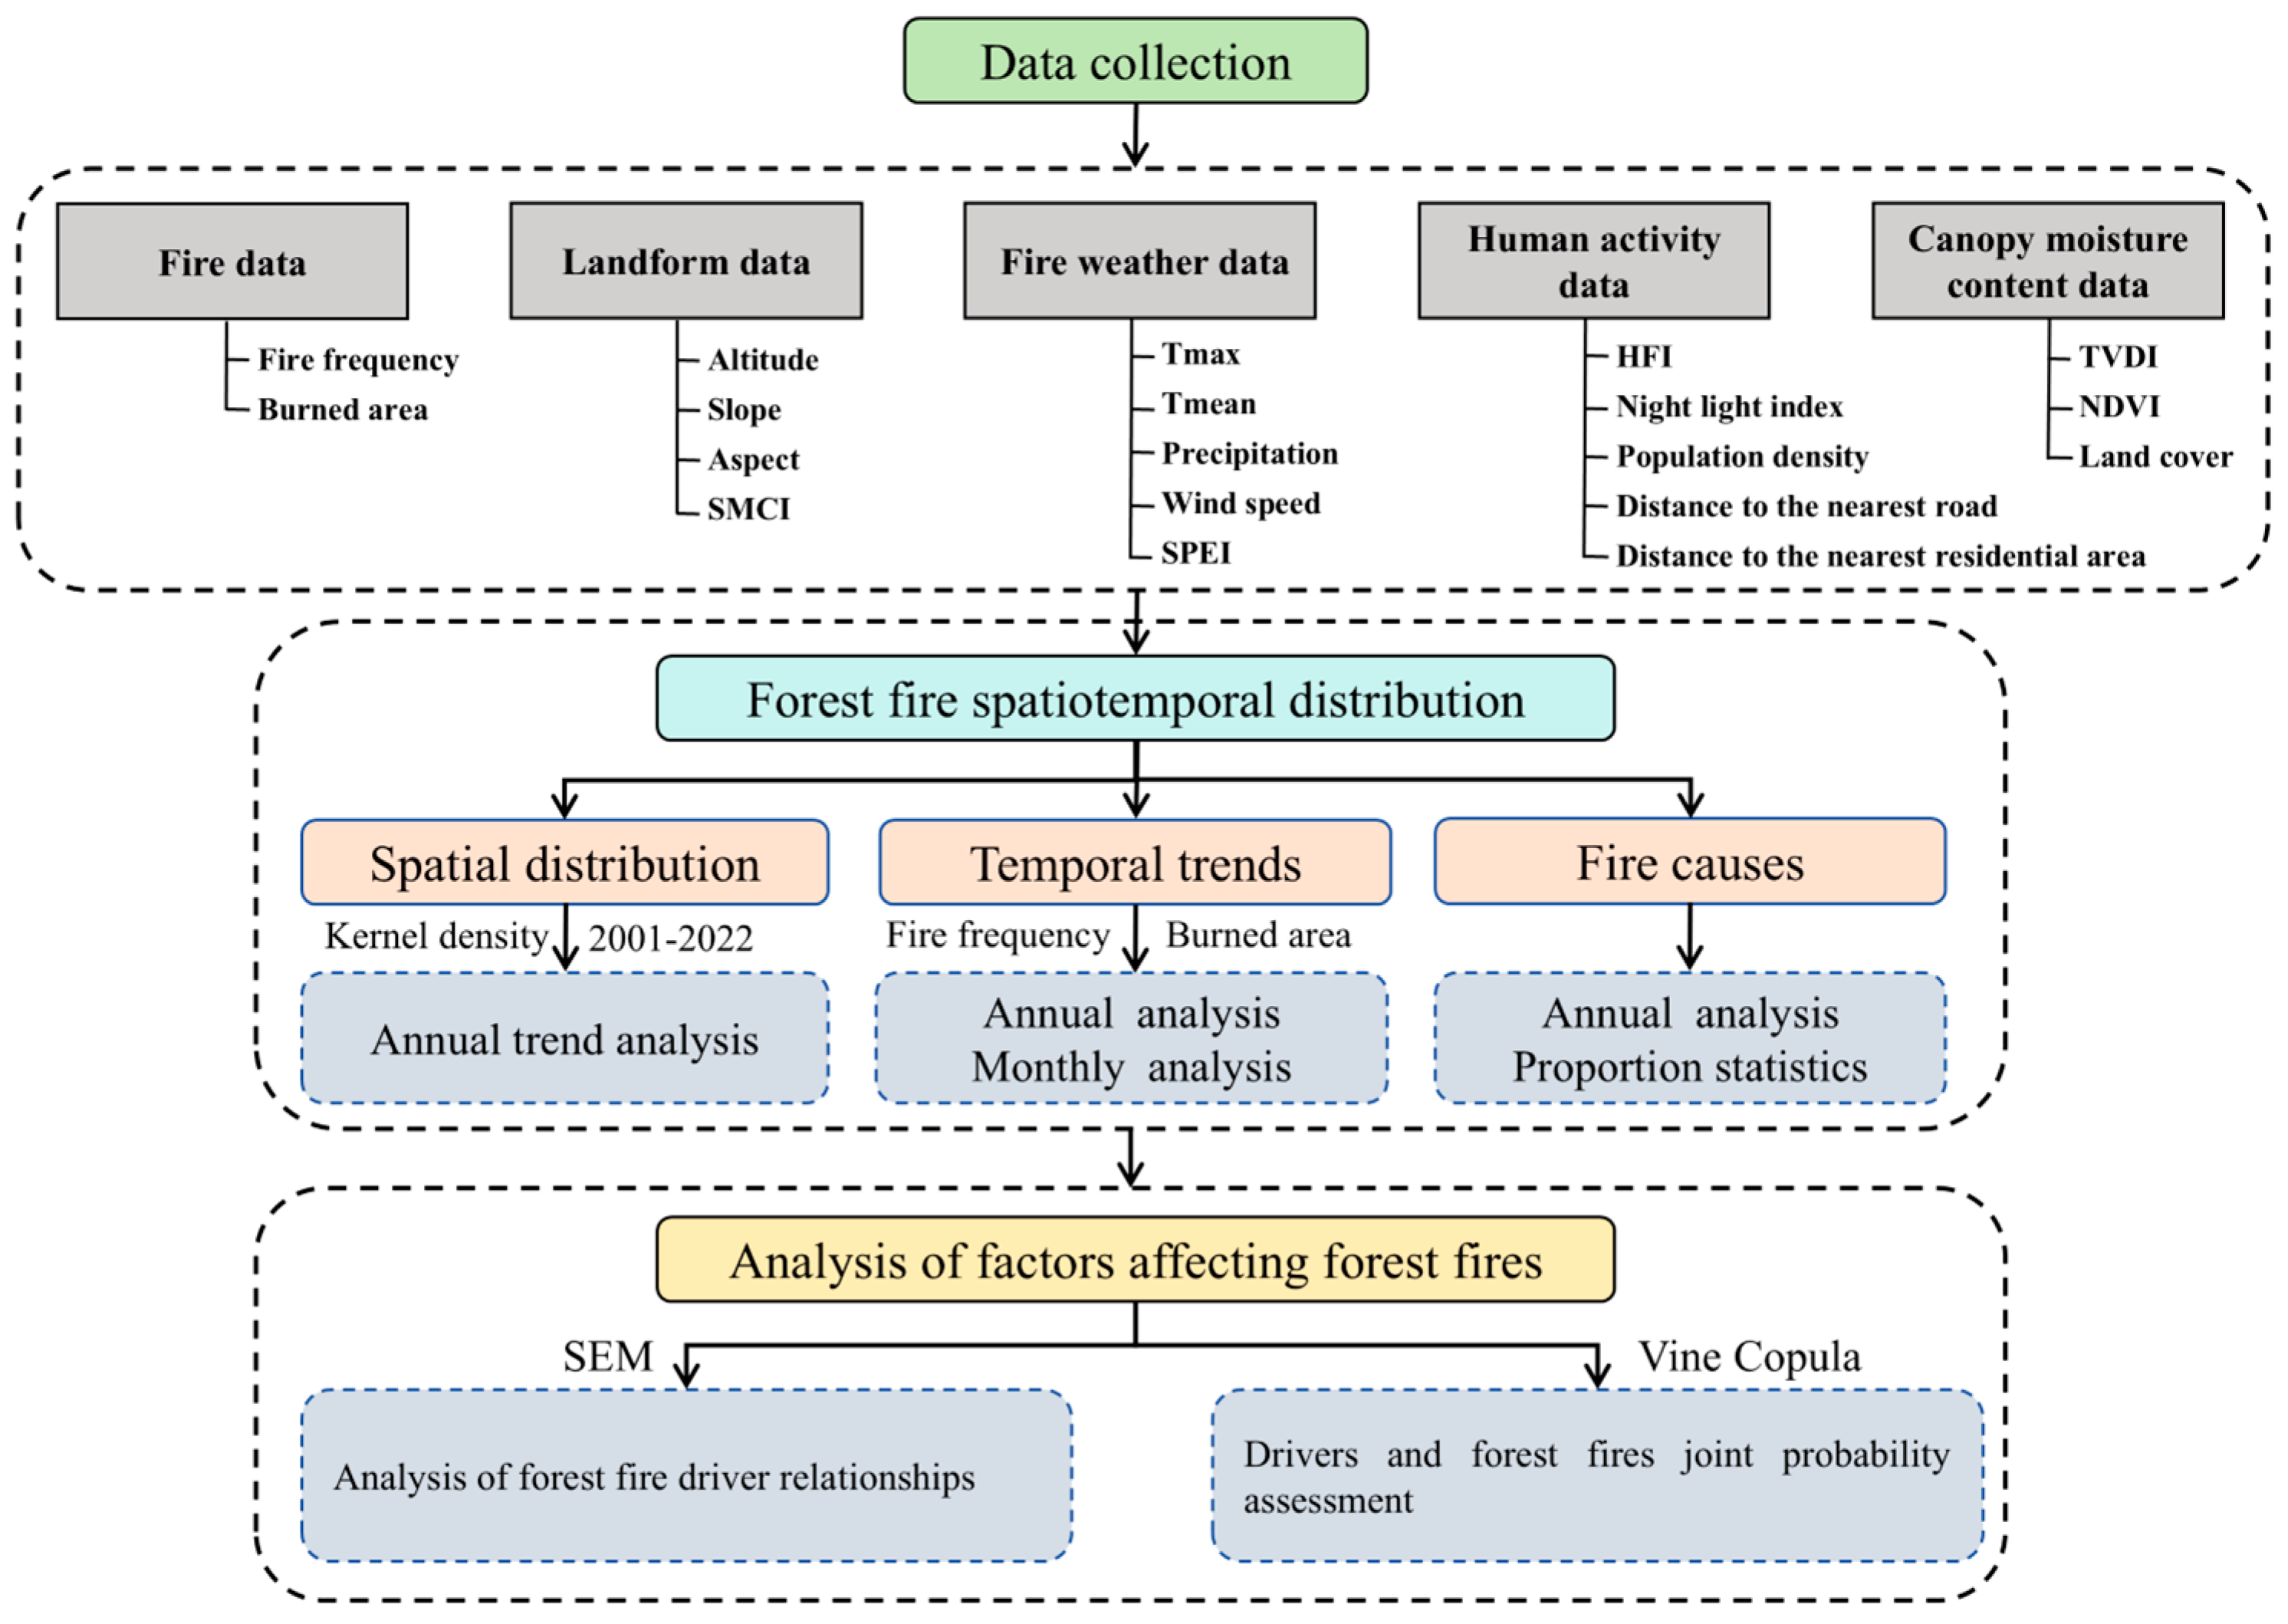
2.3.3. Flowchart of the Study

Figure 2 illustrates the technical flowchart of this study. The following are the primary steps:
(1)
Collect the study data, including forest fires, weather conditions, canopy moisture content, human activity, and landform.
(2)
Use ArcGIS’s “kernel density analysis” to analyze and plot the spatial distribution of forest fires and classify them using the natural breakpoint method. Analyze the temporal distribution of forest fires (annual and monthly). Analyze the yearly changes in the causes of forest fires and the proportion of different causes.
(3)
When using SEM models for data analysis, the collected data are first organized and pre-processed, including cleaning, removing outliers and missing values, and standardization. Then, according to the purpose of the study, appropriate variables are selected as latent and explicit variables to establish measurement and structural models. The “lavaan” package in R software was utilized to construct the SEM model, define the relationship between latent and manifest variables, assess the goodness of fit of the model by χ2 test, SRMR, GFI, and CFI, and finally, interpret the contribution and influence of each variable on forest fire frequency based on the path coefficients and correlation statistics of the model degree.
(4)
In the analysis using the Vine Copula model, the data were first pre-processed, including the standardization of the data and the fitting of the marginal distributions, and then the variables that have a significant effect on forest fires, were selected from the results of the SEM model, and the appropriate Copula function was chosen to construct the joint probability distribution model, using the selected Copula function to construct the Vine Copula model and fit the model, and the joint probability distribution between different variables and forest fire frequency was obtained by analyzing the results of the model.

3. Results

3.1. The Spatiotemporal Distribution of Forest Fires

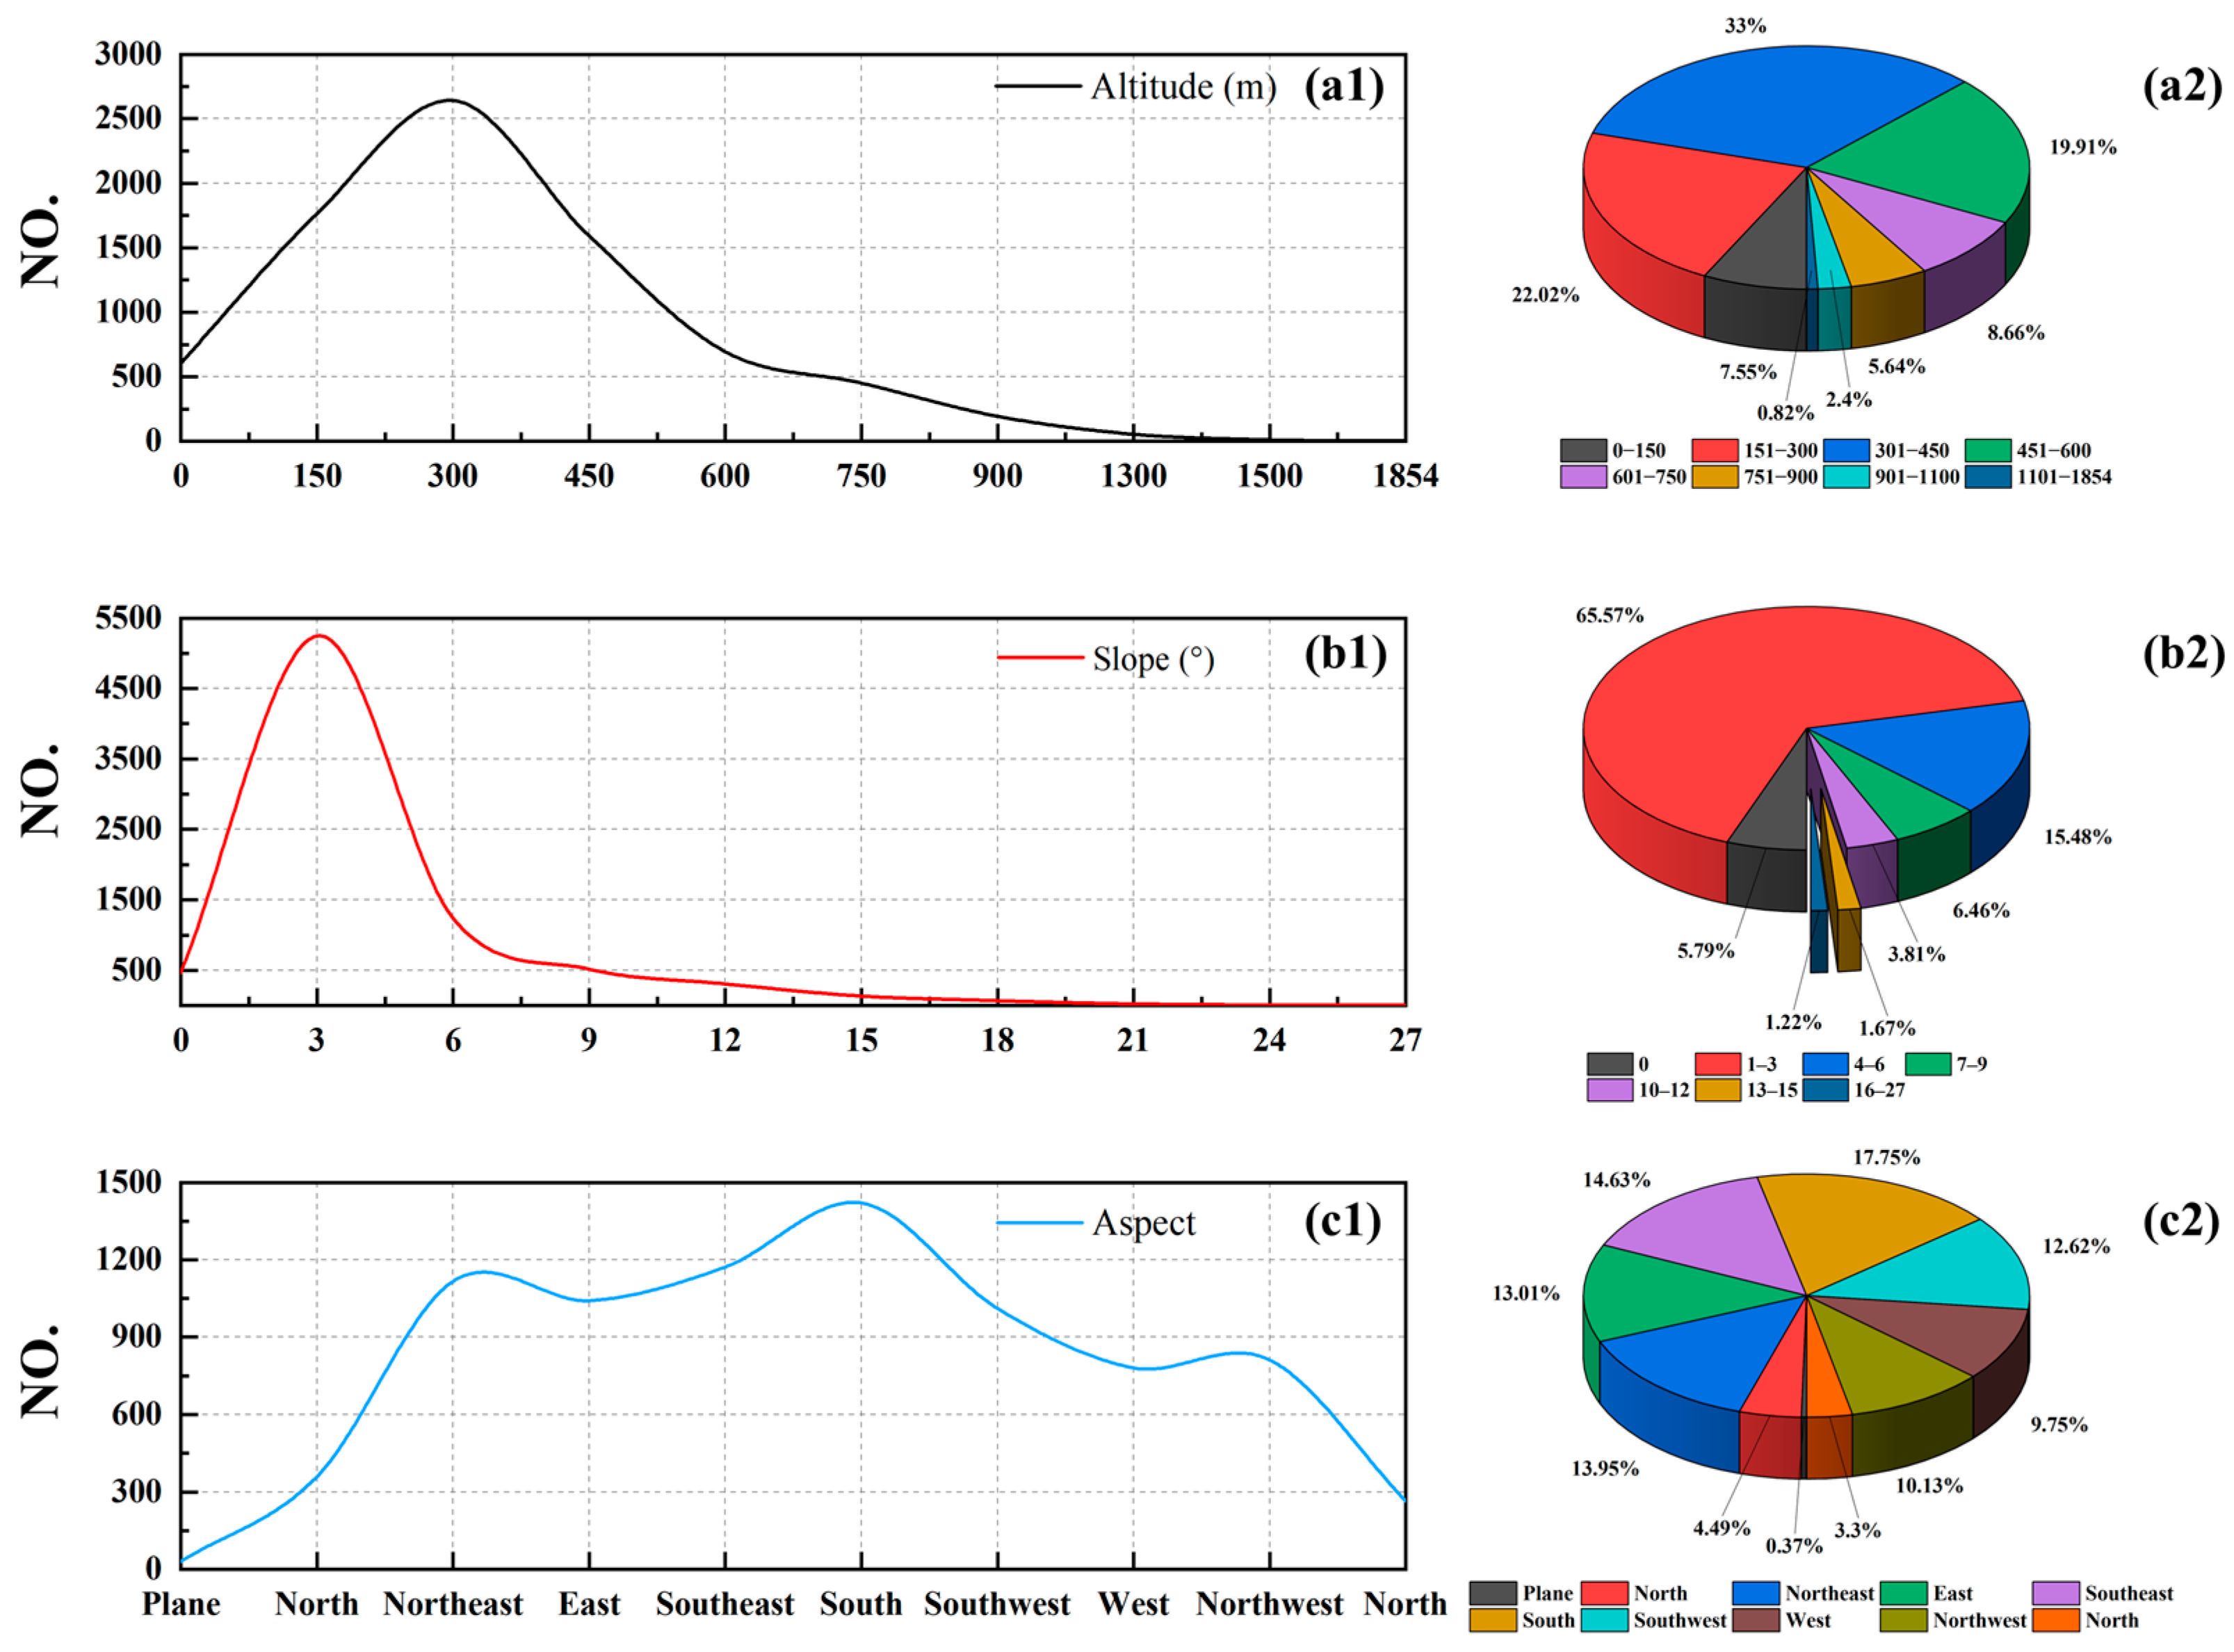
3.1.1. The Spatial Distribution of Forest Fires

Utilizing forest fire point data from 2001 to 2022, we analyzed and mapped the annual spatial distribution pattern within the study area (Figure 3). This visualization aids in comprehending fire frequency and distribution across different regions. The map distinctly shows forest fire prone areas in the Northeast China, with red marked zones indicating higher fire incidence.
Results reveal a scattered distribution of forest fires in Northeast China, with high density in northern and central regions, and less frequent, sporadic occurrences in southern and eastern parts. Figure 3 highlights that most high-density fires occur near the borders of Heilongjiang and Inner Mongolia provinces. Enhanced attention to these fire-vulnerable regions is crucial for effective resource management and fire prevention.
Since forest fires are influenced by climate conditions, being a temperate monsoon region, the local hydrothermal conditions change with latitude and longitude. Therefore, this study analyzed the variation in forest fires along latitudinal and longitudinal directions. As shown in Figure 4, the blue and green lines indicate fire points, while the orange and yellow lines represent population density. Fire points and population density decrease from north to south, with the highest concentration in the northern region, especially near Heilongjiang and Inner Mongolia’s borders. The central and northern forest areas are the areas where most forest fires occur. There are many forest farms here, rich forest resources, and high population density. This area is located in a low mountainous area and is prone to lightning strikes. The area is prone to fires for several reasons, including dense population, abundant forest fuels, and lightning strikes that ignited fires in forest boundary areas.
In Figure 5, it can be seen that forest fires mostly occur in forest zones with low altitudes and slopes. Most forest fires were concentrated in areas below 600 m and with slopes below 6°. Consequently, enhancing the fire administration of low-altitude and level lands is imperative. As can be seen from Figure 5(a1,a2), forest fires with an altitude between 301 and 450 m accounted for 33%, while forest fires with an altitude below 600 m accounted for 82.48%. Figure 5(b1,b2) show that forest fires are inversely related to slope, with 86.84% of forest fires occurring in areas with slopes below 6°. Figure 5(c1,c2) show that forest fires mostly occur in southern slope areas (17.75%), while there are fewer forest fires in plain areas (0.4%).

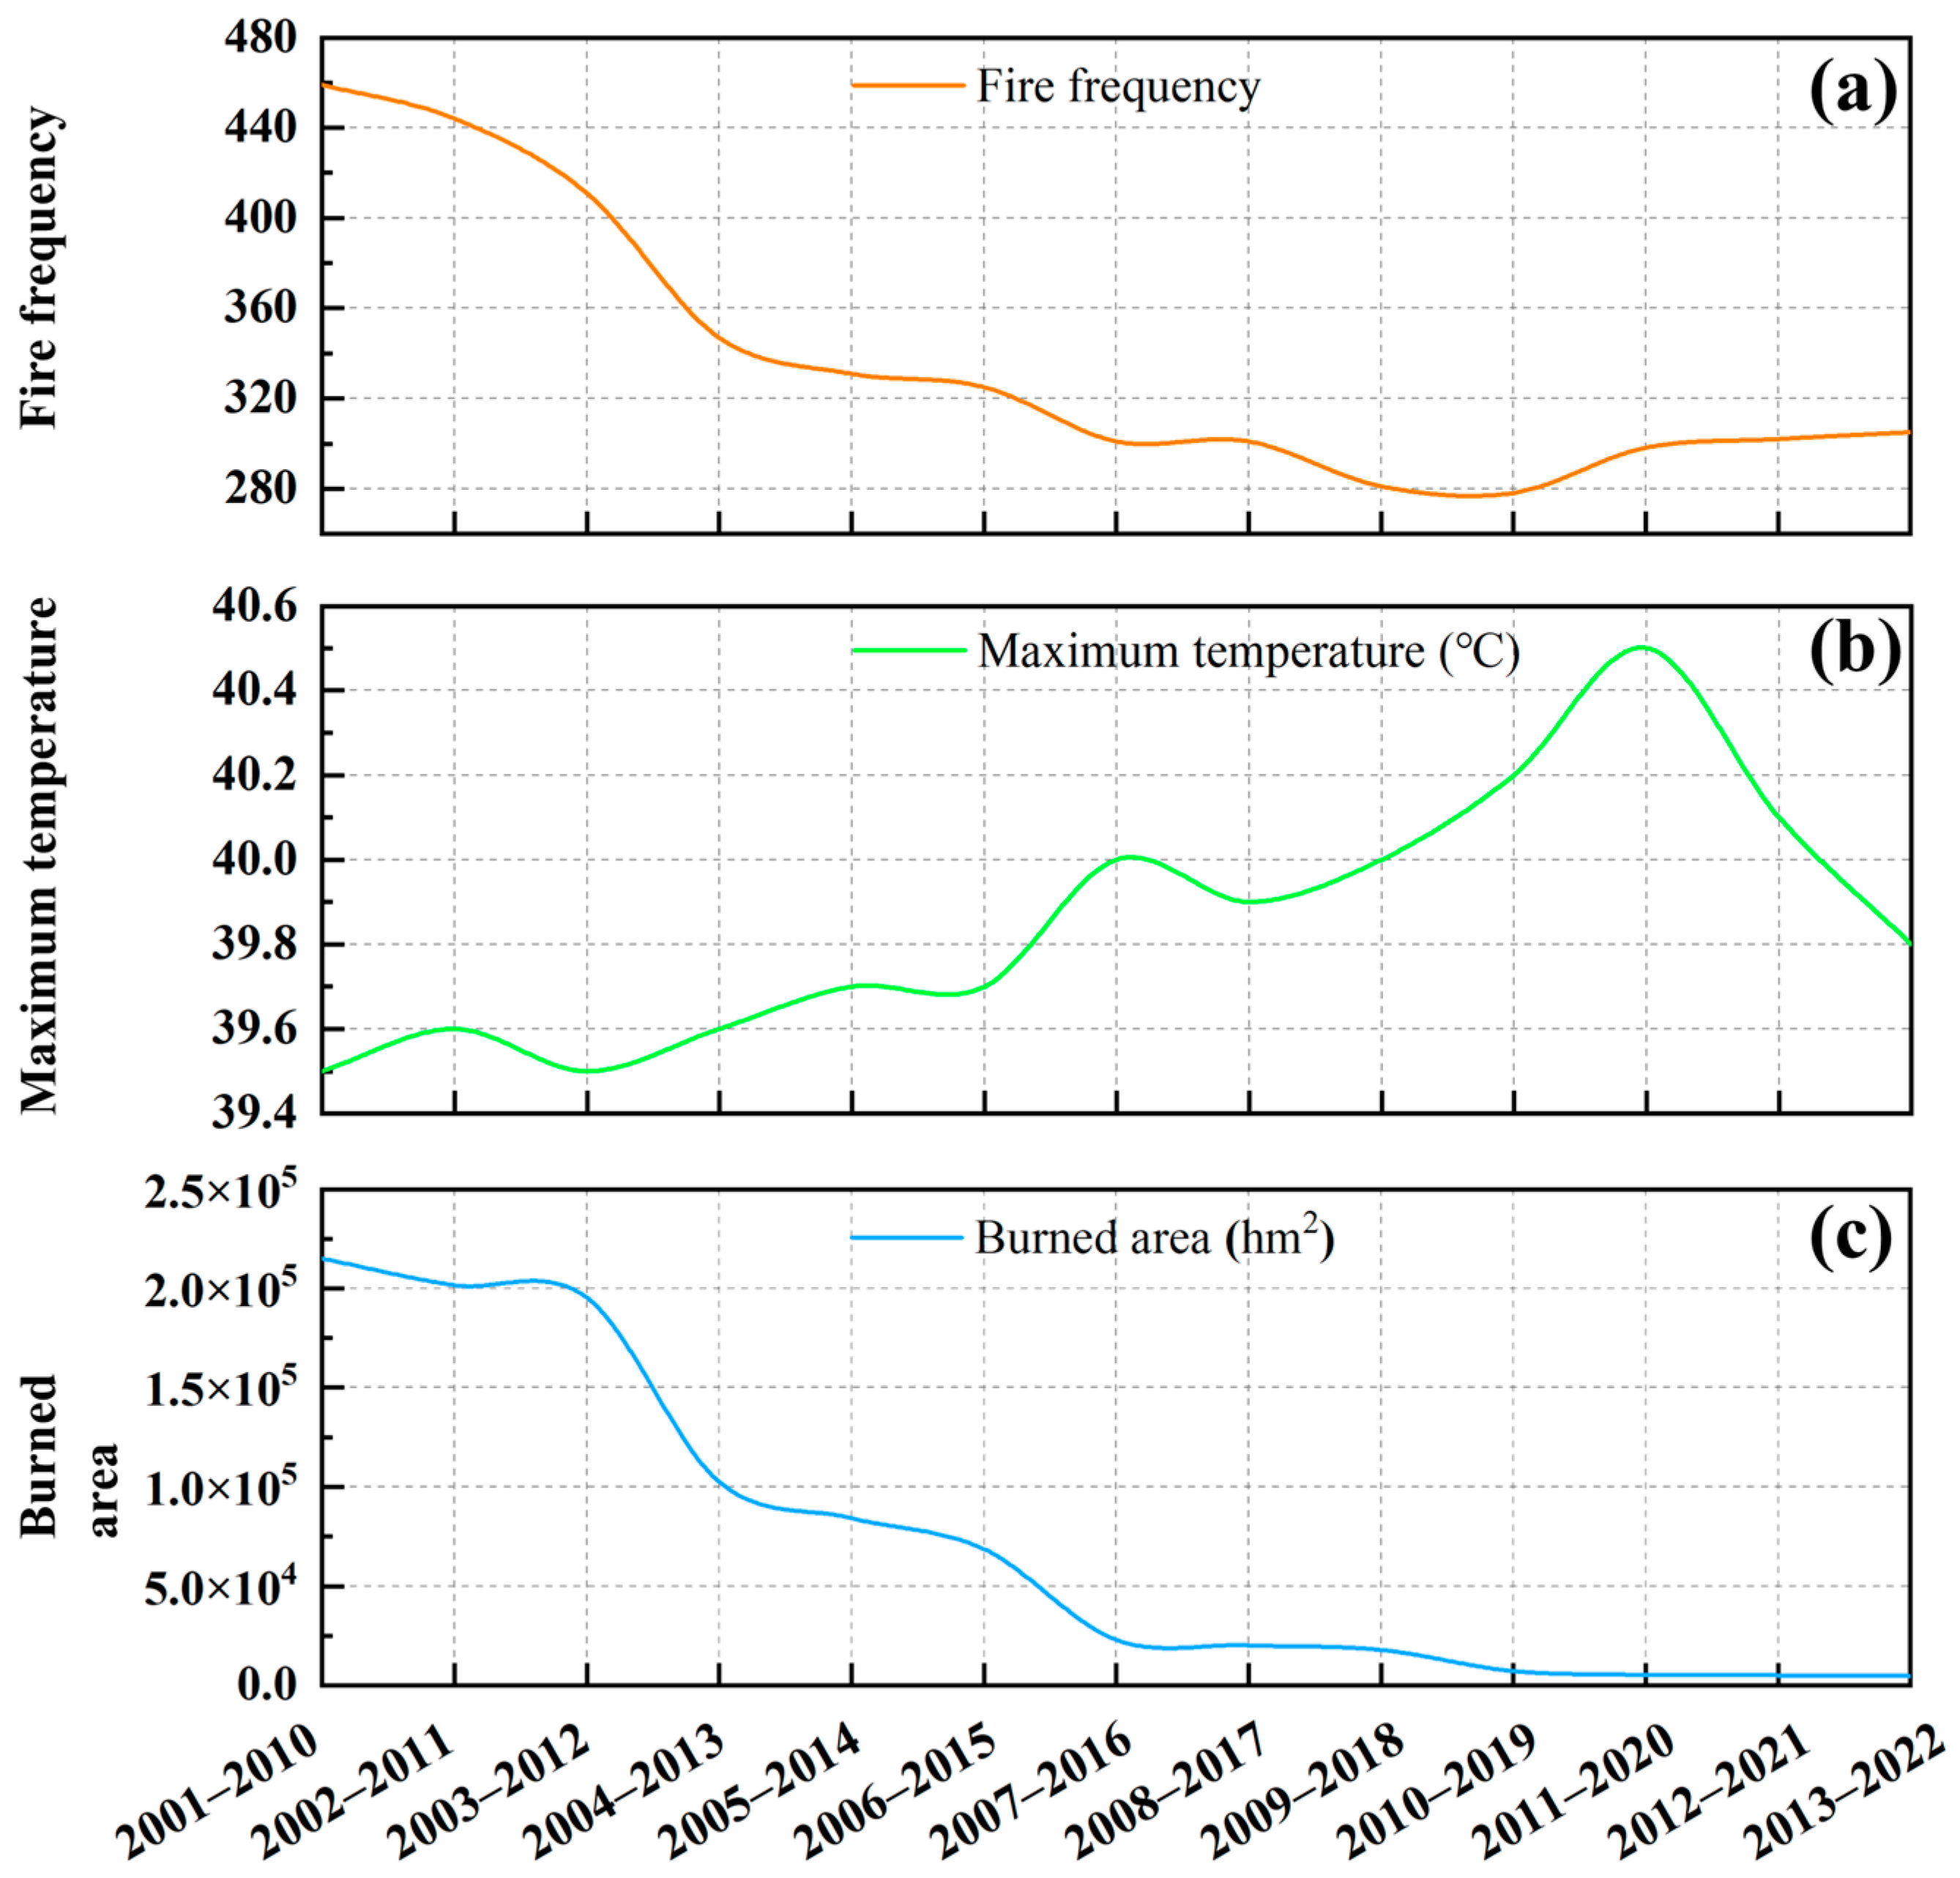
3.1.2. Temporal Patterns of Forest Fires

Forest fire points from 2001 to 2022 were selected to examine the temporal trend of forest fires in the study area. (Figure 6a). Over the past 22 years, 8002 forest fires have occurred in the region, and the burned area has 2.2040 million hectares. The average number of forest fires per year is 363. The peaks of the burned area occurred in 2003 and 2006, which were 927,500 hectares and 460,400 hectares, respectively. Although there were many forest fires between 2004 and 2022, the burned areas were comparatively small. Compared with before 2010, the number of forest fires and the burned area showed a downward trend from 2015 to 2019. From 2001 to 2022, the burned area showed a downward trend, while the frequency of forest fires increased after beginning to decline in 2013. The monthly distribution of forest fires in Northeast China from 2001 to 2022 (Figure 6b) shows that 70.13% of forest fires occurred in spring and autumn (March to May and September to November). According to statistics, the incidence of forest fires is highest in March, May, and April, which are 12.65%, 12.56%, and 12.53%, respectively.
According to the Technical Regulations for Investigation of Historical Forest and Grassland Fires, fire sources are divided into four types: man-caused fire, natural fire, unknown fire, and transit forest fires (forest fires spreading from other countries). Causes, frequency, and burned area by forest fires per year can also be obtained from statistical yearbooks (National Bureau of Statistics of China). Some forest fires are noted as having unknown fire sources because the fire source is unclear, or the fire environment is complex, and the cause is difficult to identify. From Figure 6c, human activities are the main cause of fires, accounting for 70.42%. Lightning strikes are the main natural factor causing forest fires. These fire characteristics also reflect the primary conditions for lightning fires in the northeast forest zone. Although the percentage of forest fires caused by lightning is generally low, managing them can be challenging because they often occur in isolated locations. Therefore, this study did not consider it. The inter-annual change map of fire sources shows that between 2001 and 2022, the number of human-caused forest fires in Northeast China reached 5635, with an average of 256 per year (Figure 6d). An important tipping point was reached in 2003, when forest fires reached 609, making it the worst year on record. Compared with 2001, the number of lightning fires has increased significantly since 2014. According to relevant studies [36], due to climate change, the global frequency of lightning occurrences will increase by 41%, which will increase the risk of forest fires caused by related lightning.
Figure 7a, combined with the number of forest fires in Figure 6a, demonstrates that although forest fires occur frequently, the burned area is decreasing, which may indicate that forest fire monitoring and extinguishing technology or environmental factors play a role in reducing forest fires [37]. With climate change, the maximum temperatures analyzed for the pre-2020 shift show an increasing trend (Figure 7b), which may be related to the greenhouse effect due to greenhouse gas emissions [38]. This warming trend is effectively controlled after 2020. The burned area showed a trending decrease (Figure 7c). For the moving average analysis of forest fire frequency, the values for 2011–2020 increased compared to the data for 2010–2019, which also corresponds to the forest fire characteristics in Figure 6a.

3.2. The Factors Affecting Forest Fires
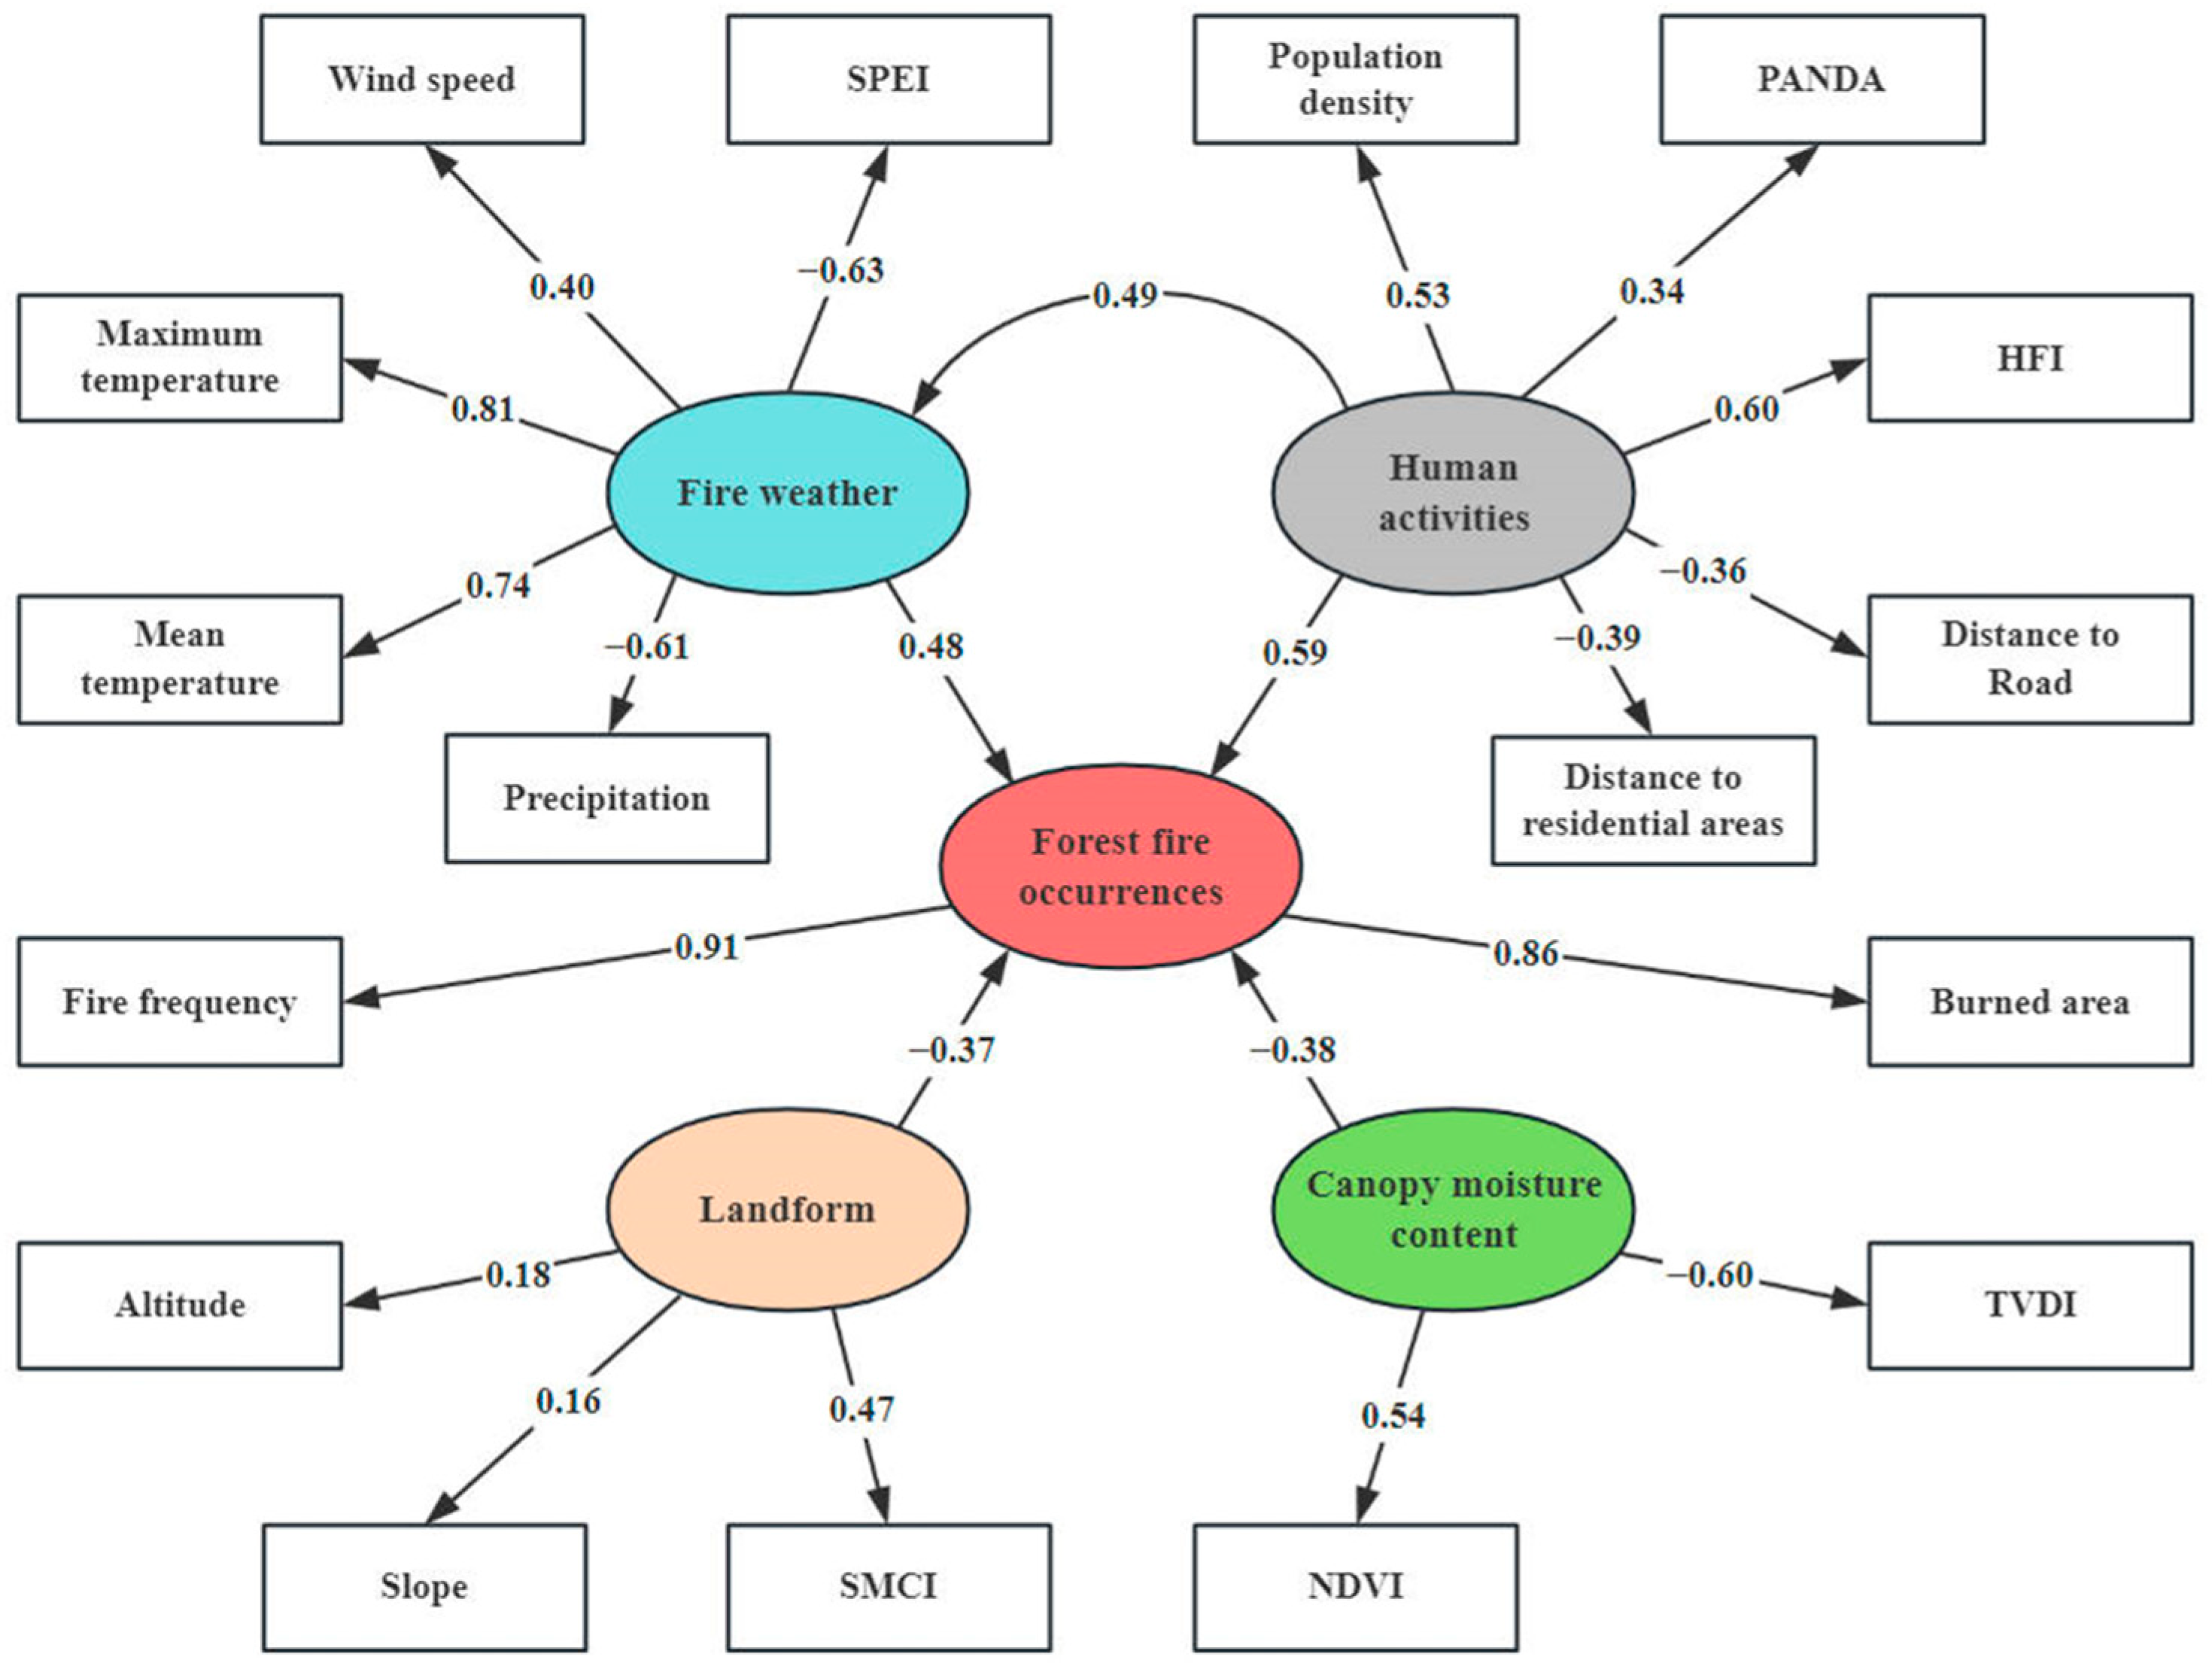
3.2.1. SEM Analysis

Based on previous studies, this study selected 15 factors closely related to forest fire factors including fire weather, human activities, landform, and canopy moisture content and established SEM. The structural equation model includes five latent variables and 17 observable indicators, where forest fire occurrences, fire weather, human activities, landform, and canopy moisture content are latent variables, and the remainder, represented by rectangles, are explicit variables.
SEM analysis reveals the relative contributions of distinct latent variables in wildfire dynamics. The occurrence frequency of forest fires exhibits significant associations with fire weather (partial correlation coefficient: 0.48) and human activity (partial correlation coefficient: 0.59). In contrast, the direct impact of landform (partial correlation coefficient: −0.37) is relatively limited. Notably, the HFI and Tmax were identified as critical drivers affecting anthropogenic factors and fire-conducive weather patterns, respectively, thereby indirectly elevating the incidence of forest fire events (Figure 8).
SEM shows that the daily maximum and mean temperatures correlate with the fire weather, with values of 0.84 and 0.79, respectively. Among human activities, the observable indicator HFI has the highest correlation (0.63). The landform observable indicator SMCI is inversely correlated (−0.47). Specifically, when the SMCI value increases, it indicates a relative increase in soil moisture, thereby reducing the flammability of forest fuels. TVDI has an inverse relationship with canopy water content (−0.60), while NDVI (0.54) has a positive relationship. When TVDI values rise, surface forest fuels become drier and more flammable, causing fires to spread faster and become more difficult to control and extinguish. When vegetation is in a drought or unhealthy state, NDVI values may decrease, making fires more likely.
The results of the SEM evaluation indicated that the model was overall well-fitted (Table 3). The χ2/df value of 1.37 was within the acceptable range of one to three, indicating that the model did not overfit the data. The p-value, GFI value, and CFI value were within the thresholds, indicating that the model had a high degree of goodness of fit. The SRMR value of 0.04 was below the threshold of 0.05, which further confirms the model’s goodness of fit. The RMSEA value of 0.077 is less than the general criterion of 0.08. Overall, it is concluded that the SEM model can be considered an acceptable and well-fitted model that can effectively explain the relationship between forest fires and their influencing factors.

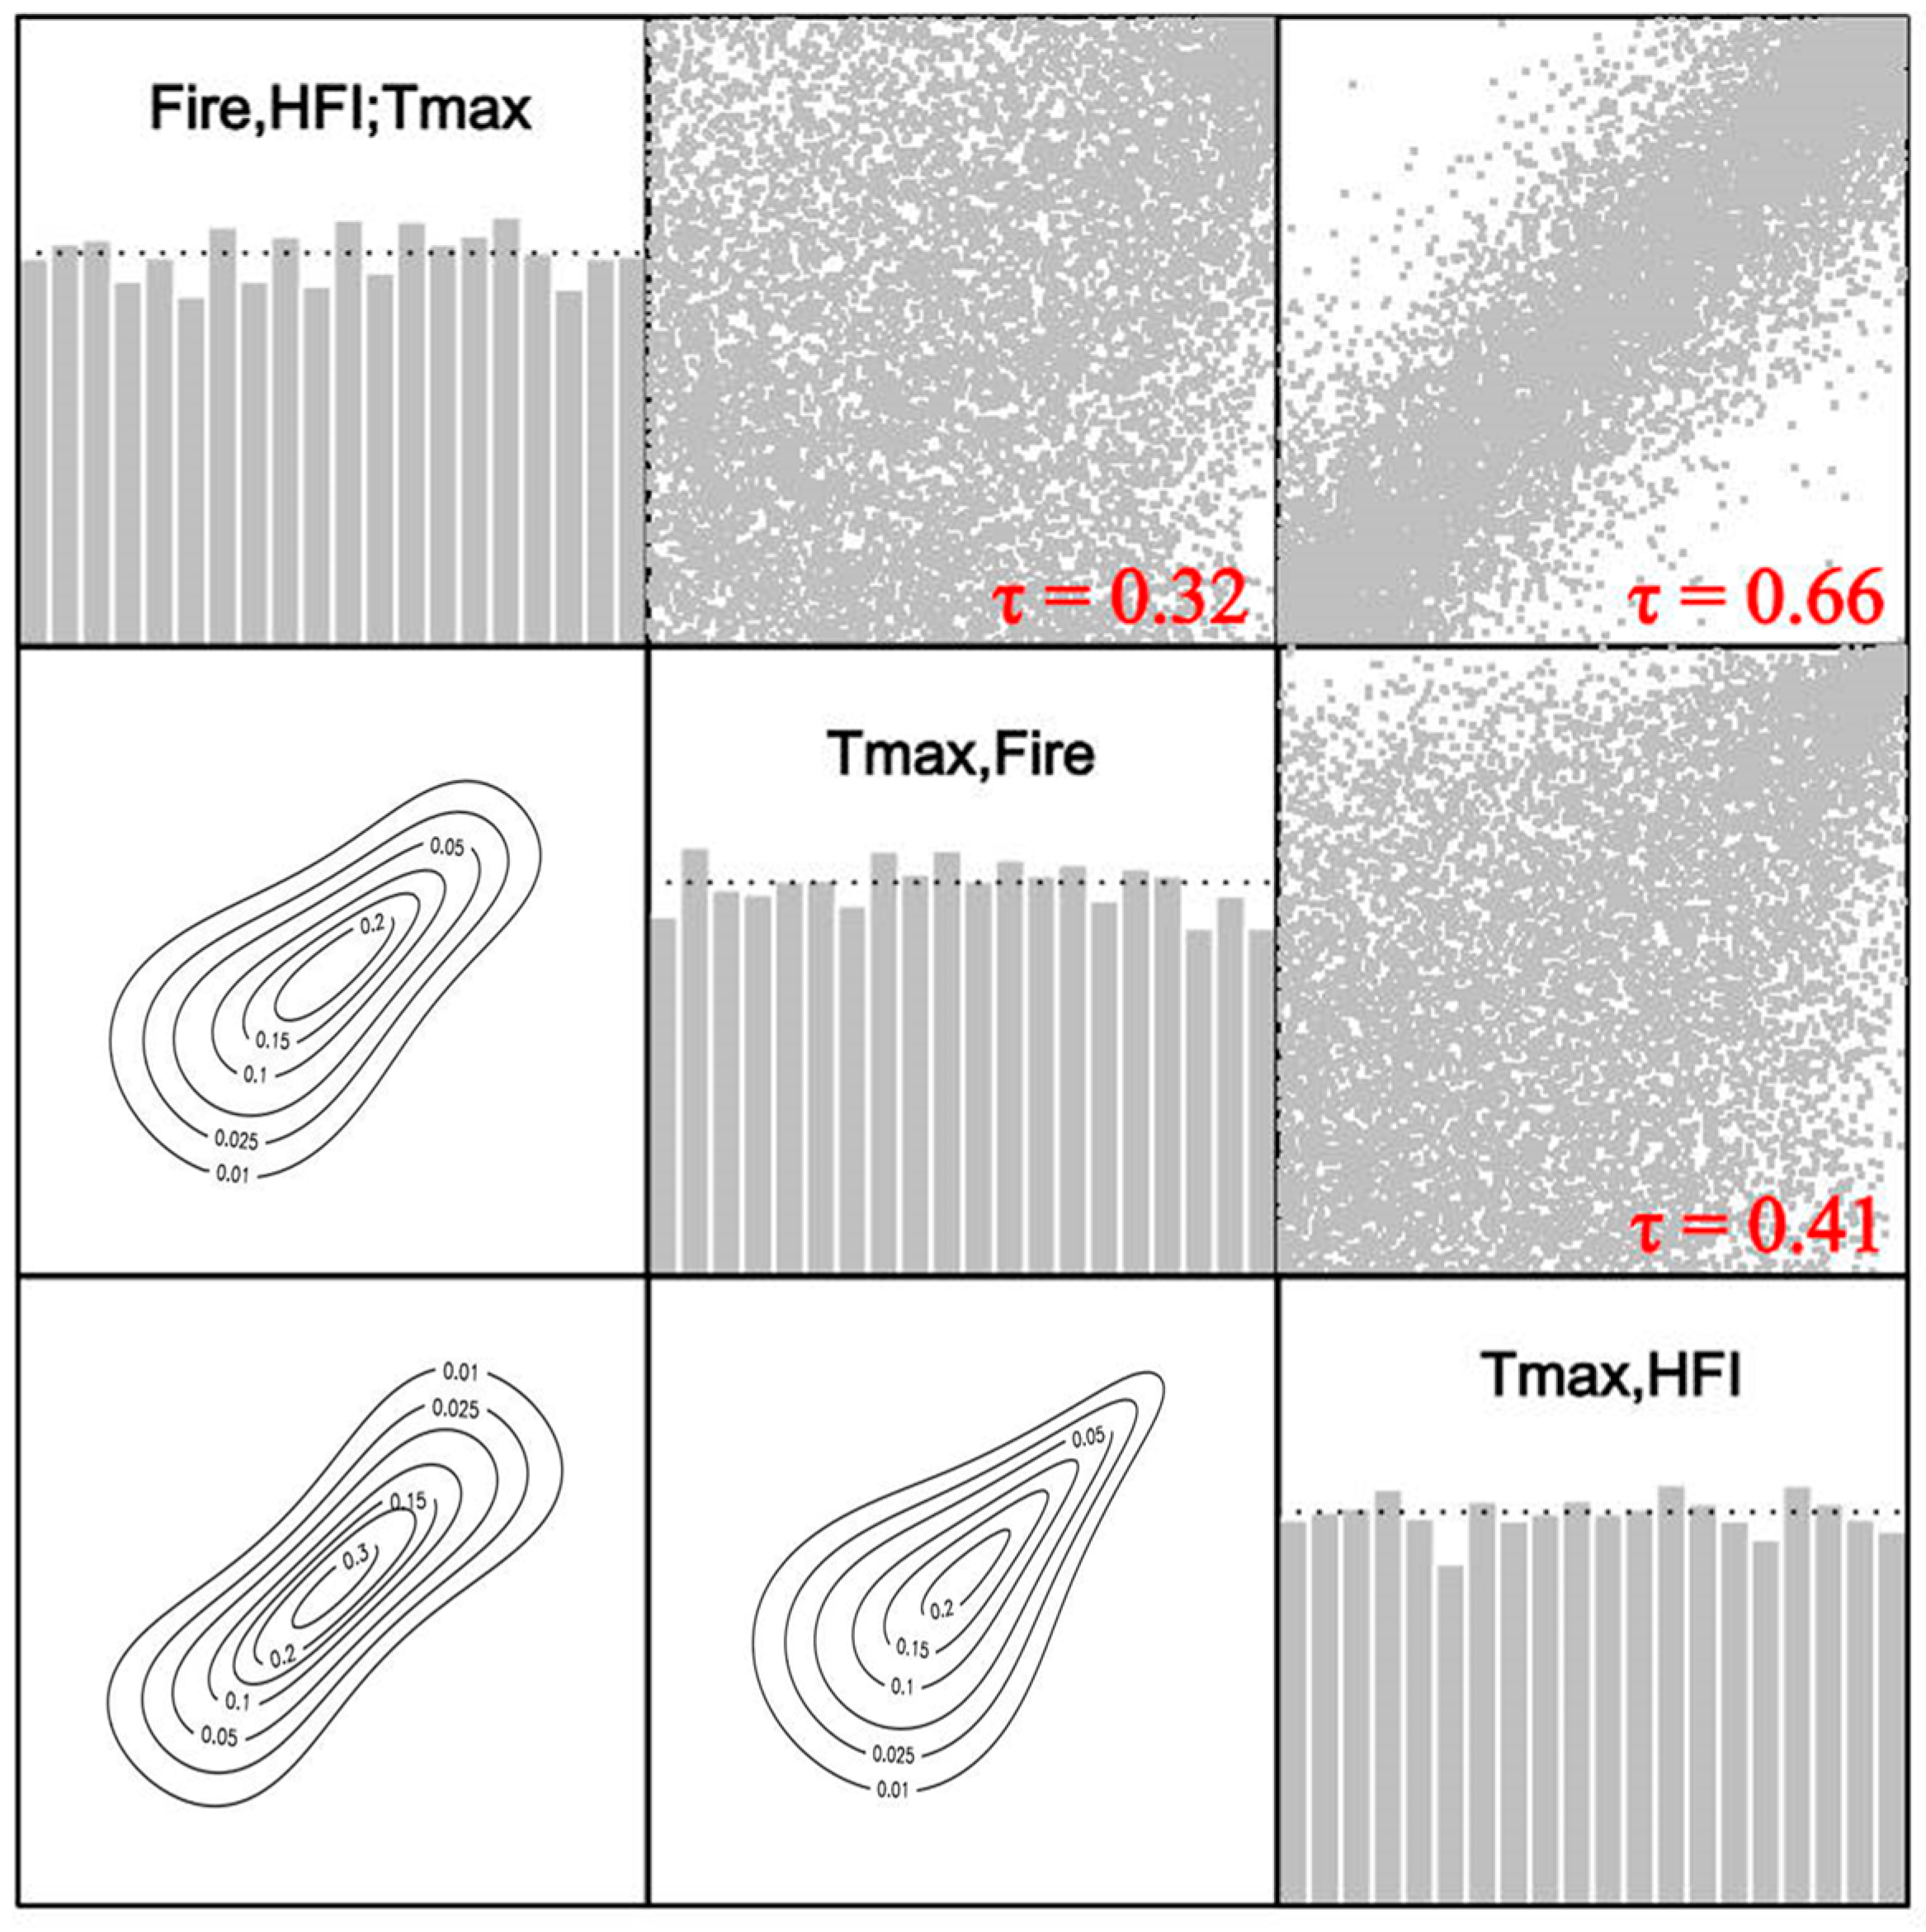
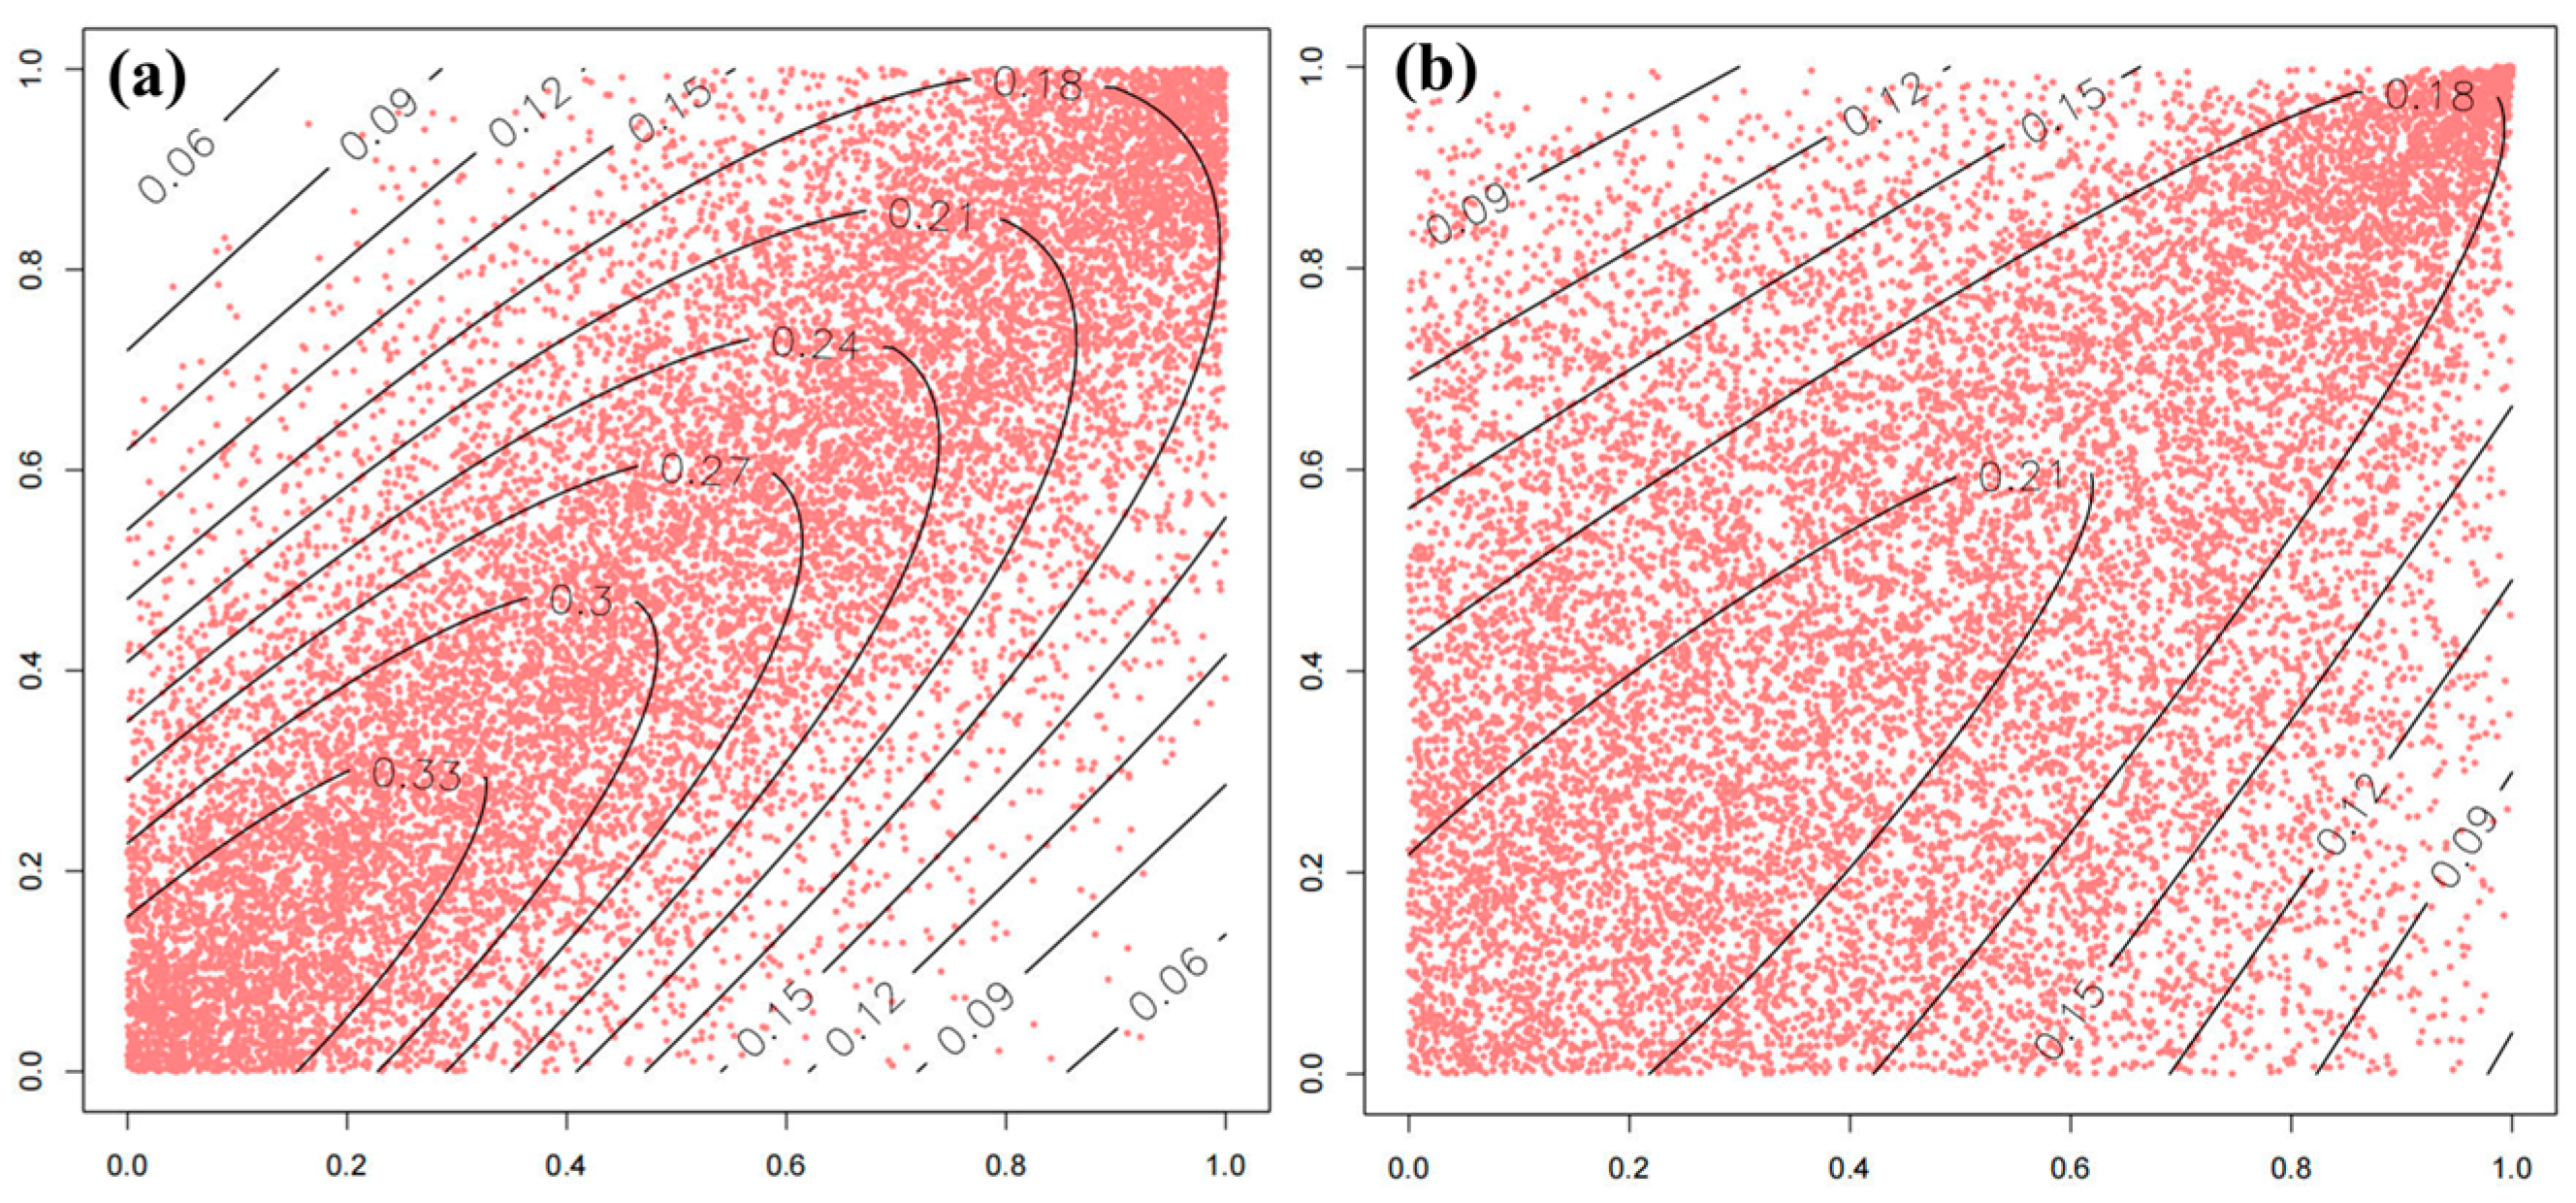
3.2.2. Vine Copula Analysis

SEM results show that the HFI in human activities and Tmax in fire weather are observable indicators that are strongly correlated with forest fires, respectively. Therefore, these two indicators were selected to study the relationship with the frequency of forest fires. The three-dimensional (3D) copula was determined using Vine Copula, as seen in (Figure 9), where each edge denotes the matching two-dimensional (2D) copula and each ellipse a node. Taking Tmax as the root node, HFI and fire (forest fire frequency) were linked. Next, the best Copula function was chosen to build the model.
Within the Vine Copula framework, Kendall’s τ coefficient serves as a nonparametric measure to evaluate the monotonic dependence structure among multivariate datasets. This dependency structure demonstrates asymmetric tail behavior, where upper-tail dependence intensifies in the lower left quadrant of the copula distribution, suggesting heightened sensitivity to Tmax–HFI co-occurrences. As shown in Figure 10, the analysis indicated a statistically significant positive correlation between maximum ambient temperature (Tmax) and fire event frequency with Kendall’s τ value of 0.66, which suggests that the frequency of forest fires increases with increasing temperatures. Table 4 confirms the model superiority through minimized AIC values relative to alternative configurations. A joint probability of 0.32 implies that the relative contribution of human activities to forest fire occurrence under high-temperature conditions is 32%. This reflects the synergistic amplification of ignition probabilities through high-temperature and human activities (e.g., agricultural farming, tourism activities, negligent smoking, etc.).
The contour plot in the bottom left of Figure 10 shows the following characteristics: the data points in the lower left and upper right regions are more dispersed, while the data distribution in the middle region near the upper right corner is more concentrated. The other contour map in the lower center of Figure 10 shows sparse data in the lower left corner and dense data in the upper right corner, a phenomenon that may suggest a spatial correlation between high-temperature areas and areas of high HFI (usually corresponding to areas of intense human activities such as urban and industrial areas). These areas are prone to the urban heat island effect due to the accumulation of heat released from buildings, transportation, and other human activities, resulting in generally higher temperatures than the surrounding countryside or natural areas. As shown in Figure 11a, the frequency of forest fires shows a significant positive correlation with the daily maximum temperature (Tmax), while the relationship between Tmax and HFI in Figure 11b also shows a positive correlation trend, although the scatterplot trend is relatively vague.

4. Discussion

4.1. Spatiotemporal Distribution and the Source Type of Forest Fires

4.1.1. Spatial Distribution Analysis of Forest Fires

Due to the unique location of the monsoon zone in this area, winter is cold and dry, and summer may also be relatively hot. This climate characteristic has led to relatively dry climate conditions in the northern region [39]. In contrast, the southern region of the study area has relatively mild summers, relatively warm winters, and relatively high humidity [40]. The northern and central regions were more likely to have forest fires due to urbanization, agricultural land, and other human activities [41]. Additionally, the northern part of the study area contains most of its forest resources, which increases the likelihood of forest fires.
The dense distribution area of fire points is mainly located below 600 m. This area is rich in forests and mostly coniferous forests, such as pine and spruce, which are more susceptible to fires in dry conditions. In addition, these trees often have flammable substances such as resins, increasing the risk of fires [42]. Therefore, it is necessary to strengthen forest fire monitoring in relevant locations. Forest fires mostly occur between 304 and 450 m above sea level, while high temperatures and low precipitation in low-altitude areas exacerbate the severity of fires [43]. The slope in this area ranges from zero to 27°, resulting in slight differences in surface runoff. Forest fires mainly occur within the slope range of 1–3. The southern slopes of the Northeast have the highest fire incidence due to differences in the flammability of combustibles caused by vegetation type, terrain slope, and precipitation [44].

4.1.2. Temporal Distribution Analysis and the Fire Reason Analysis

Due to the timely detection and extinguishing of fires, the burned area remained within a relatively low range. Forest fires mainly occur in spring and autumn due to various reasons: dry weather conditions [45], strong winds [46], and lots of forest flammables [47]. In addition to natural factors, human activities may also increase forest fires in spring and autumn [48]. The meteorological and ecological conditions in spring and autumn are more likely to trigger forest fires. Many other activities, like farming, ancestor worship, and spring hiking, may potentially raise forest fire risk. Influenced by traditional Chinese culture, when people hold rituals, the frequency of using fire increases and so does the fire risk. Forest fires are especially common during International Labor Day, the Mid-Autumn Festival (mid-September), and National Day (October 1). Preventing and managing these fires usually requires carefully considering these factors and implementing appropriate fire prevention measures and monitoring systems.
Analytical methods combined with previous studies [49,50,51] indicated that human activities were the primary cause of forest fires. Lightning strikes and other natural fires also accounted for a high proportion, accounting for 13.78% and 15.8%, respectively. Understanding the mechanisms behind these natural causes is crucial for preventing and responding to fires. Local governments should strengthen fire prevention publicity and education to prevent and control human-made fire sources.

4.2. Significant Factors Leading to the Forest Fire Occurrence

The study results indicate a strong positive correlation between the intensification of fire weather conditions (e.g., high temperatures, prolonged drought, and low humidity) and an increase in the frequency of forest fire events, which is consistent with the fire-climate feedback mechanism described in the Fire Weather Index (FWI) framework [52]. Precipitation, temperature, and wind speed are the three observed weather-related variables that have the most significant effects, consistent with findings from other studies [53,54]. Precipitation variables in fire weather directly increase fuel moisture, hindering forest fires [55,56]. Dead forest fuels can have less moisture at high temperatures [57]. Additionally, it might raise the fuel temperature, which would raise the risk of forest fires [58]. In Northeast China, there is a positive correlation between temperature and the frequency of forest fires. The drought represented by SPEI is undoubtedly the main driving factor for forest fires [59,60,61].
The strong correlation between human activity elements and the frequency of forest fires in Northeast China was mainly shown in the observed variable of the HFI. Prior research demonstrated that human greenhouse gas emissions raise the risk of forest fires [62,63]. Forest fire frequency and intensity will rise due to human-caused climate change [64]. Therefore, people’s awareness of fire prevention still needs to be improved. Some studies demonstrated an inverse correlation between population density and the frequency of forest fires [57]. Nonetheless, the findings of this study showed a positive correlation between the studied area’s population density and the number of forest fires, with the majority of forest fires happening close to densely inhabited areas [41]. The proximity of residential areas and road distance to the fire site was negatively associated with forest fires. As these distances shorten, human activity will increase, increasing the possibility of human-induced fires [65,66]. Most forest fires occur near roads and populated areas at lower altitudes [67].
The SMCI in the landform latent variables (altitude, slope, and SMCI) also had an indirect effect on forest fire occurrence because soil moisture indirectly represents the moisture content of ground-level forest dead fuels [68]. There was a negative relationship between altitude and local forest fires. Humidity is influenced by altitude; in a forest, a high altitude will result in low relative humidity and air temperature [69]. Due to the abundance of forest resources and the frequency of human activities in the gentle slope area, the likelihood of forest fires has increased.
This study demonstrated a negative correlation between canopy moisture indicators (NDVI and TVDI) and forest fire occurrence. Specifically, elevated NDVI values corresponded to suppressed fire activity, as dense vegetation with higher chlorophyll content retains more moisture, thereby reducing combustibility [70]. Given the sensitivity of NDVI to precipitation dynamics, changes in its values can be used to infer the effects of drought on tree health, enabling the assessment of vegetation flammability potential. TVDI mainly monitors drought, retrieves soil moisture, and reflects vegetation water shortage. The higher the TVDI value, the higher the ratio of temperature to vegetation index in the area, and the greater the possibility of forest fires.
Human activities are an important cause of forest fires, especially in hot and dry conditions [71,72]. Human activities may directly contribute to the ignition of fires, for example, through inappropriate burning behavior or negligence. In addition, human activities may indirectly increase the risk of fire by altering the structure and vegetation cover of the forest. When Tmax is used as a conditioning variable, it already partially explains the risk of fire occurrence. Despite considering climatic conditions (e.g., Tmax), the HFI showed a positive correlation with forest fire frequency. This suggests that human activity remains an important risk factor, even when climatic conditions are taken into account. A number of measures should be taken to better manage forests and reduce fire risks. Public education campaigns should be conducted to raise awareness of fire prevention behavior. Regulations need to be strengthened and enforced to control activities such as camping, logging, and agricultural burning in forested areas. Forest management measures such as reforestation to increase vegetation cover and firebreaks to limit the spread of fire should be implemented. These efforts help to mitigate the effects of human activities and increase the resilience of forests to fire.
Although this study integrated indicators such as population density, nighttime illumination index (PANDA), and HFI, some of the impacts were not adequately captured due to the spatial and temporal heterogeneity of human activities, the diversity of behavioral patterns, and the limitation of data resolution. In the future, real-time monitoring can be combined with drones, meteorological satellites, and Internet of Things (IoT) sensors to dynamically track the spatial and temporal distribution of human activities and improve the accuracy of fire source localization. Future research needs to break through the data and methodological limitations and deepen the understanding of the coupling mechanism of “climate–human–forest fire”, to provide a scientific basis for the precise prevention and control of forest fires and sustainable development.

5. Conclusions

This study assessed the impact of human and natural factors on forest fires by analyzing the spatial distribution, fire source types, significant factors influencing forest fires, and their correlations in the northeastern forest region from 2001 to 2022. The results indicate that forest fires in Northeast China are driven by coupled human–natural interactions. Human activities were found to be responsible for 70.42% of forest fires. The northern and central areas of the study region were identified as the primary locations where forest fires occur. Specific fire prevention management strategies should be implemented in areas with high forest coverage. The copula model and SEM results revealed that maximum temperature and the human footprint index were positively correlated with forest fire frequency. In contrast, the likelihood of forest fires was negatively correlated with SMCI and TVDI levels. The SEM results showed bias correlation indices of 0.48 for fire weather and 0.59 for human activities on forest fires. In the Vine Copula model, the joint probability distribution of HFI and forest fire frequency was 0.32 when maximum temperature was used as the conditional distribution. Local government administrations should emphasize enhancing residents’ knowledge of fire prevention and increasing fire and rescue equipment. This study innovatively integrates SEM with Vine Copula to quantify the synergistic effects of human activities and climate on forest fires, which is of significant scientific importance for composite risk management of forests. Although efforts were made to reduce interfering factors in the data processing, the temporal and spatial resolution limitations of satellite imagery may lead to minor omissions. The integration of higher resolution data sources in future research could further improve the accuracy of monitoring and the effectiveness of fire prevention measures.

Author Contributions

Conceptualization, R.G. and X.L.; methodology, R.G., B.M., M.N. and Z.T.; software, R.G.; validation, R.G.; formal analysis, X.L. and B.M.; resources, J.Z. and Z.T.; data curation, B.M. and J.Z.; writing—original draft, R.G.; writing—review and editing, R.G. and X.L.; supervision, X.W., M.N. and J.X.; funding acquisition, X.L.; project administration, X.L. All authors have read and agreed to the published version of the manuscript.

Funding

This work was funded by National Key R&D Program of China (2022YFC3003001) and Key R&D Project of Jilin Province Science and Technology Development Plan (20250203076SF).

Data Availability Statement

The authors do not have permission to share data.

Conflicts of Interest

The authors declare no conflicts of interest.

References

  1. MacDicken, K.G.; Sola, P.; Hall, J.E.; Sabogal, C.; Tadoum, M.; de Wasseige, C. Global progress toward sustainable forest management. For. Ecol. Manag. 2015, 352, 47–56. [Google Scholar] [CrossRef]
  2. Njana, M.A.; Mbilinyi, B.; Eliakimu, Z. The role of forests in the mitigation of global climate change: Emprical evidence from Tanzania. Environ. Chall. 2021, 4, 100170. [Google Scholar] [CrossRef]
  3. Wang, C.; Yan, X.; Chang, Y.; Wang, Q.; Wang, Y.; Malik, A. Understanding the impact of interprovincial trade on forest resources in China. Renew. Sustain. Energy Rev. 2023, 186, 113673. [Google Scholar] [CrossRef]
  4. Wang, L.; Wang, E.; Mao, X.; Benjamin, W.; Liu, Y. Sustainable poverty alleviation through forests: Pathways and strategies. Sci. Total Environ. 2023, 904, 167336. [Google Scholar] [CrossRef] [PubMed]
  5. Wang, N.; Bi, H.; Peng, R.; Zhao, D.; Liu, Z. Disparities in soil and water conservation functions among different forest types and implications for afforestation on the Loess Plateau. Ecol. Indic. 2023, 155, 110935. [Google Scholar] [CrossRef]
  6. Speck, O.; Speck, T. Is a forest fire a natural disaster? Investigating the fire tolerance of various tree species—An educational module. Biomimetics 2024, 9, 114. [Google Scholar] [CrossRef]
  7. Legge, S.; Rumpff, L.; Garnett, S.T.; Woinarski, J.C.Z. Loss of terrestrial biodiversity in Australia: Magnitude, causation, and response. Science 2023, 381, 622–631. [Google Scholar] [CrossRef]
  8. Sills, J.; de Oliveira, G.; Chen, J.M.; Stark, S.C.; Berenguer, E.; Moutinho, P.; Artaxo, P.; Anderson, L.O.; Aragão, L.E.O.C. Smoke pollution’s impacts in Amazonia. Science 2020, 369, 634–635. [Google Scholar] [CrossRef]
  9. Altman, J.; Fibich, P.; Trotsiuk, V.; Altmanova, N. Global pattern of forest disturbances and its shift under climate change. Sci. Total Environ. 2024, 915, 170117. [Google Scholar] [CrossRef]
  10. Moon, K.; Duff, T.J.; Tolhurst, K.G. Sub-canopy forest winds: Understanding wind profiles for fire behaviour simulation. Fire Saf. J. 2019, 105, 320–329. [Google Scholar] [CrossRef]
  11. Liu, N. Wildland surface fire spread: Mechanism transformation and behavior transition. Fire Saf. J. 2023, 141, 103974. [Google Scholar] [CrossRef]
  12. Cannon, J.B.; O’Brien, J.J.; Loudermilk, E.L.; Dickinson, M.B.; Peterson, C.J. The influence of experimental wind disturbance on forest fuels and fire characteristics. For. Ecol. Manag. 2014, 330, 294–303. [Google Scholar] [CrossRef]
  13. Janssen, T.A.J.; Jones, M.W.; Finney, D.; van der Werf, G.R.; van Wees, D.; Xu, W.; Veraverbeke, S. Extratropical forests increasingly at risk due to lightning fires. Nat. Geosci. 2023, 16, 1136–1144. [Google Scholar] [CrossRef]
  14. Pinto Neto, O.; Pinto, I.R.C.A.; Pinto Junior, O.; Williams, E.R. Evidence of a link between Amazon fires and lightning. J. Atmos. Sol.-Terr. Phys. 2023, 249, 106095. [Google Scholar] [CrossRef]
  15. Zhang, B.; Cai, D.; Ai, S.; Wang, H.; Zuo, X. Research on the influencing factors and prevention measures of long-term forest fire risk in Northeast China. Ecol. Indic. 2023, 155, 110965. [Google Scholar] [CrossRef]
  16. Stocks, B.J.; Mason, J.A.; Todd, J.B.; Bosch, E.M.; Wotton, B.M.; Amiro, B.D.; Flannigan, M.D.; Hirsch, K.G.; Logan, K.A.; Martell, D.L.; et al. Large forest fires in Canada, 1959–1997. J. Geophys. Res. Atmos. 2002, 107, FFR-5. [Google Scholar] [CrossRef]
  17. Sjöström, J.; Plathner, F.V.; Granström, A. Wildfire ignition from forestry machines in boreal Sweden. Int. J. Wildland Fire 2019, 28, 666–677. [Google Scholar] [CrossRef]
  18. Syphard, A.D.; Keeley, J.E.; Pfaff, A.H.; Ferschweiler, K. Human presence diminishes the importance of climate in driving fire activity across the United States. Proc. Natl. Acad. Sci. USA 2017, 114, 13750–13755. [Google Scholar] [CrossRef]
  19. Cetin, M.; Isik Pekkan, Ö.; Ozenen Kavlak, M.; Atmaca, I.; Nasery, S.; Derakhshandeh, M.; Cabuk, S.N. GIS-based forest fire risk determination for Milas district, Turkey. Nat. Hazards 2023, 119, 2299–2320. [Google Scholar] [CrossRef]
  20. Zheng, Y.; Zhao, Y.; Liu, W.; Liu, S.; Yao, R. An intelligent wireless system for field ecology monitoring and forest fire warning. Sensors 2018, 18, 4457. [Google Scholar] [CrossRef]
  21. Zheng, X. Advanced Solar-Powered Fire Detection System: A Wireless Sensor Node Approach to Early Warning and Forest Fire Prevention. Highlights Sci. Eng. Technol. 2023, 62, 90–95. [Google Scholar] [CrossRef]
  22. Barmpoutis, P.; Kastridis, A.; Stathaki, T.; Yuan, J.; Shi, M.; Grammalidis, N. Suburban forest fire risk assessment and forest surveillance using 360-degree cameras and a multiscale deformable transformer. Remote Sens. 2023, 15, 1995. [Google Scholar] [CrossRef]
  23. Naderpour, M.; Rizeei, H.M.; Ramezani, F. Forest fire risk prediction: A spatial deep neural network-based framework. Remote Sens. 2021, 13, 2513. [Google Scholar] [CrossRef]
  24. Ma, T.; Liang, Y.; Li, Z.; Liu, Z.; Liu, B.; Wu, M.M.; Lau, M.K.; Fang, Y. Age-related patterns and climatic driving factors of drought-induced forest mortality in Northeast China. Agr. For. Meteorol. 2023, 332, 109360. [Google Scholar] [CrossRef]
  25. Fan, Q.; Wang, C.; Zhang, D.; Zang, S. Environmental influences on forest fire regime in the greater hinggan mountains, Northeast China. Forests 2017, 8, 372. [Google Scholar] [CrossRef]
  26. Huang, C.; Feng, J.; Tang, F.; He, H.S.; Liang, Y.; Wu, M.M.; Xu, W.; Liu, B.; Shi, F.; Chen, F. Predicting the responses of boreal forests to climate-fire-vegetation interactions in Northeast China. Environ. Modell. Softw. 2022, 153, 105410. [Google Scholar] [CrossRef]
  27. Wu, Z.; Li, M.; Wang, B.; Quan, Y.; Liu, J. Using artificial intelligence to estimate the probability of forest fires in Heilongjiang, Northeast China. Remote Sens. 2021, 13, 1813. [Google Scholar] [CrossRef]
  28. Li, K.; Tong, Z.; Liu, X.; Zhang, J.; Tong, S. Quantitative assessment and driving force analysis of vegetation drought risk to climate change:Methodology and application in Northeast China. Agr. For. Meteorol. 2020, 282–283, 107865. [Google Scholar] [CrossRef]
  29. Pei, W.; Hao, L.; Fu, Q.; Liu, H.; Ren, Y.; Li, T. Analysis of spring drought in Northeast China from the perspective of atmosphere, snow cover, and soil. Catena 2024, 236, 107715. [Google Scholar] [CrossRef]
  30. Sandholt, I.; Rasmussen, K.; Andersen, J. A simple interpretation of the surface temperature/vegetation index space for assessment of surface moisture status. Rem. Sens. Environ. 2002, 79, 213–224. [Google Scholar] [CrossRef]
  31. Deng, L.; Yuan, K. Multiple-group analysis for structural equation modeling with dependent samples. Struct. Equ. Modeling 2015, 22, 552–567. [Google Scholar] [CrossRef]
  32. Wang, Z.; Fang, K.; Yao, Q. Fire history and its forcing in Northeastern Asia boreal forests. Nat. Hazards Res. 2022, 2, 166–171. [Google Scholar] [CrossRef]
  33. Abraj, M.; Wang, Y.-G.; Thompson, M.H. A new mixture copula model for spatially correlated multiple variables with an environmental application. Sci. Rep. 2022, 12, 13867. [Google Scholar] [CrossRef] [PubMed]
  34. Zscheischler, J.; Seneviratne, S.I. Dependence of drivers affects risks associated with compound events. Sci. Adv. 2017, 3, e1700263. [Google Scholar] [CrossRef]
  35. Doshi, S.C.; Lohmann, G.; Ionita, M. Hotspot movement of compound events on the Europe continent. Sci. Rep. 2023, 13, 18100. [Google Scholar] [CrossRef]
  36. Pérez-Invernón, F.J.; Gordillo-Vázquez, F.J.; Huntrieser, H.; Jöckel, P. Variation of lightning-ignited wildfire patterns under climate change. Nat. Commun. 2023, 14, 739. [Google Scholar] [CrossRef]
  37. Yuan, C.; Zhang, Y.; Liu, Z. A survey on technologies for automatic forest fire monitoring, detection, and fighting using unmanned aerial vehicles and remote sensing techniques. Can. J. For. Res. 2015, 45, 783–792. [Google Scholar] [CrossRef]
  38. Stephens, G.L.; Kahn, B.H.; Richardson, M. The super greenhouse effect in a changing climate. J. Clim. 2016, 29, 5469–5482. [Google Scholar] [CrossRef]
  39. Guo, F.; Su, Z.; Wang, G.; Sun, L.; Tigabu, M.; Yang, X.; Hu, H. Understanding fire drivers and relative impacts in different Chinese forest ecosystems. Sci. Total Environ. 2017, 605–606, 411–425. [Google Scholar] [CrossRef]
  40. Chen, Y.; Randerson, J.T.; Morton, D.C.; DeFries, R.S.; Collatz, G.J.; Kasibhatla, P.S.; Giglio, L.; Jin, Y.; Marlier, M.E. Forecasting Fire Season Severity in South America Using Sea Surface Temperature Anomalies. Science 2011, 334, 787–791. [Google Scholar] [CrossRef]
  41. Martínez-Fernández, J.; Chuvieco, E.; Koutsias, N. Modelling long-term fire occurrence factors in Spain by accounting for local variations with geographically weighted regression. Nat. Hazards Earth Syst. Sci. 2013, 13, 311–327. [Google Scholar] [CrossRef]
  42. Pasqualini, V.; Oberti, P.; Vigetta, S.; Riffard, O.; Panaïotis, C.; Cannac, M.; Ferrat, L. A GIS-Based Multicriteria Evaluation for Aiding Risk Management Pinus pinaster Ait. Forests: A Case Study in Corsican Island, Western Mediterranean Region. Environ. Manag. 2011, 48, 38–56. [Google Scholar] [CrossRef]
  43. Guo, F.; Su, Z.; Wang, G.; Sun, L.; Lin, F.; Liu, A. Wildfire ignition in the forests of southeast China: Identifying drivers and spatial distribution to predict wildfire likelihood. Appl. Geogr. 2016, 66, 12–21. [Google Scholar] [CrossRef]
  44. Estes, B.L.; Knapp, E.E.; Skinner, C.N.; Miller, J.D.; Preisler, H.K. Factors influencing fire severity under moderate burning conditions in the Klamath Mountains, northern California, USA. Ecosphere 2017, 8, e01794. [Google Scholar] [CrossRef]
  45. Gillespie, T.W. Policy, drought and fires combine to affect biodiversity in the Amazon basin. Nature 2021, 597, 481–483. [Google Scholar] [CrossRef]
  46. Flannigan, M.; Krawchuk, M.; Groot, W.; Wotton, M.; Johnston, L. Implications of changing climate for global wildland fire. Int. J. Wildland Fire 2009, 18, 483–507. [Google Scholar] [CrossRef]
  47. Barik, A.; Baidya Roy, S. Climate change strongly affects future fire weather danger in Indian forests. Commun. Earth. Environ. 2023, 4, 452. [Google Scholar] [CrossRef]
  48. Zhu, Z.; Deng, X.; Zhao, F.; Li, S.; Wang, L. How environmental factors affect forest fire occurrence in yunnan forest region. Forests 2022, 13, 1392. [Google Scholar] [CrossRef]
  49. Lindenmayer, D.B.; Zylstra, P.; Kooyman, R.; Taylor, C.; Ward, M.; Watson, J.E.M. Logging elevated the probability of high-severity fire in the 2019-20 Australian forest fires. Nat. Ecol. Evol. 2022, 6, 533–535. [Google Scholar] [CrossRef]
  50. Şahan, E.A.; Gürçay, B.; Tuncay Güner, H. The history of fire, human and climate in black pine forests of western Anatolia: The Taurus mountains. Dendrochronologia 2023, 82, 126149. [Google Scholar] [CrossRef]
  51. Ying, L.; Cheng, H.; Shen, Z.; Guan, P.; Luo, C.; Peng, X. Relative humidity and agricultural activities dominate wildfire ignitions in Yunnan, Southwest China: Patterns, thresholds, and implications. Agr. For. Meteorol. 2021, 307, 108540. [Google Scholar] [CrossRef]
  52. Jolly, W.; Cochrane, M.; Freeborn, P.; Holden, Z.; Brown, T.; Williamson, G.; Bowman, D. Climate-induced variations in global wildfire danger from 1979 to 2013. Nat. Commun. 2015, 6, 7537. [Google Scholar] [CrossRef]
  53. Drobyshev, I.; Bergeron, Y.; Vernal, A.d.; Moberg, A.; Ali, A.A.; Niklasson, M. Atlantic SSTs control regime shifts in forest fire activity of Northern Scandinavia. Sci. Rep. 2016, 6, 22532. [Google Scholar] [CrossRef] [PubMed]
  54. Oliveira, S.; Pereira, J.M.C.; San-Miguel-Ayanz, J.; Lourenço, L. Exploring the spatial patterns of fire density in Southern Europe using Geographically Weighted Regression. Appl. Geogr. 2014, 51, 143–157. [Google Scholar] [CrossRef]
  55. Diószegi, G.; Immitzer, M.; Müller, M.M.; Vacik, H. Effects of interaction between forest structure and precipitation event characteristics on fuel moisture conditions. Agr. For. Meteorol. 2023, 342, 109681. [Google Scholar] [CrossRef]
  56. Whitlock, C.; Shafer, S.L.; Marlon, J. The role of climate and vegetation change in shaping past and future fire regimes in the northwestern US and the implications for ecosystem management. For. Ecol. Manag. 2003, 178, 5–21. [Google Scholar] [CrossRef]
  57. Walker, X.J.; Rogers, B.M.; Veraverbeke, S.; Johnstone, J.F.; Baltzer, J.L.; Barrett, K.; Bourgeau-Chavez, L.; Day, N.J.; de Groot, W.J.; Dieleman, C.M.; et al. Fuel availability not fire weather controls boreal wildfire severity and carbon emissions. Nat. Clim. Change 2020, 10, 1130–1136. [Google Scholar] [CrossRef]
  58. Savadogo, P.; Zida, D.; Sawadogo, L.; Tiveau, D.; Tigabu, M.; Oden, P. Fuel and fire characteristics in savanna–woodland of West Africa in relation to grazing and dominant grass type. Int. J. Wildland Fire 2007, 16, 531–539. [Google Scholar] [CrossRef]
  59. Gudmundsson, L.; Rego, F.C.; Rocha, M.; Seneviratne, S.I. Predicting above normal wildfire activity in southern Europe as a function of meteorological drought. Environ. Res. Lett. 2014, 9, 084008. [Google Scholar] [CrossRef]
  60. Turco, M.; Rosa-Cánovas, J.J.; Bedia, J.; Jerez, S.; Montávez, J.P.; Llasat, M.C.; Provenzale, A. Exacerbated fires in Mediterranean Europe due to anthropogenic warming projected with non-stationary climate-fire models. Nat. Commun. 2018, 9, 3821. [Google Scholar] [CrossRef]
  61. Turco, M.; von Hardenberg, J.; AghaKouchak, A.; Llasat, M.C.; Provenzale, A.; Trigo, R.M. On the key role of droughts in the dynamics of summer fires in Mediterranean Europe. Sci. Rep. 2017, 7, 81. [Google Scholar] [CrossRef] [PubMed]
  62. Golding, N.; Betts, R. Fire risk in Amazonia due to climate change in the HadCM3 climate model: Potential interactions with deforestation. Glob. Biogeochem. Cycles 2008, 22, GB4007. [Google Scholar] [CrossRef]
  63. Le Page, Y.; van der Werf, G.R.; Morton, D.C.; Pereira, J.M.C. Modeling fire-driven deforestation potential in Amazonia under current and projected climate conditions. J. Geophys. Res. Biogeosciences 2010, 115, G03012. [Google Scholar] [CrossRef]
  64. Touma, D.; Stevenson, S.; Lehner, F.; Coats, S. Human-driven greenhouse gas and aerosol emissions cause distinct regional impacts on extreme fire weather. Nat. Commun. 2021, 12, 212. [Google Scholar] [CrossRef]
  65. Guo, L.; Li, S.; Wu, Z.; Parsons, R.A.; Lin, S.; Wu, B.; Sun, L. Assessing spatial patterns and drivers of burn severity in subtropical forests in Southern China based on Landsat 8. For. Ecol. Manag. 2022, 524, 120515. [Google Scholar] [CrossRef]
  66. Romero-Calcerrada, R.; Novillo, C.J.; Millington, J.D.A.; Gomez-Jimenez, I. GIS analysis of spatial patterns of human-caused wildfire ignition risk in the SW of Madrid (Central Spain). Landsc. Ecol. 2008, 23, 341–354. [Google Scholar] [CrossRef]
  67. Pourtaghi, Z.S.; Pourghasemi, H.R.; Aretano, R.; Semeraro, T. Investigation of general indicators influencing on forest fire and its susceptibility modeling using different data mining techniques. Ecol. Indic. 2016, 64, 72–84. [Google Scholar] [CrossRef]
  68. Holgate, C.; van Dijk, A.; Cary, G.; Yebra, M. Using alternative soil moisture estimates in the McArthur Forest Fire Danger Index. Int. J. Wildland Fire 2017, 26, 806–819. [Google Scholar] [CrossRef]
  69. Li, W.; Xu, Q.; Yi, J.; Liu, J. Predictive model of spatial scale of forest fire driving factors: A case study of Yunnan Province, China. Sci. Rep. 2022, 12, 19029. [Google Scholar] [CrossRef]
  70. Surbhi Singh, S.; Jeganathan, C. Using ensemble machine learning algorithm to predict forest fire occurrence probability in Madhya Pradesh and Chhattisgarh, India. Adv. Space Res. 2024, 73, 2969–2987. [Google Scholar] [CrossRef]
  71. An, W.; Xu, C.; Marković, S.B.; Sun, S.; Sun, Y.; Gavrilov, M.B.; Govedar, Z.; Hao, Q.; Guo, Z. Anthropogenic warming has exacerbated droughts in southern Europe since the 1850s. Commun. Earth. Environ. 2023, 4, 232. [Google Scholar] [CrossRef]
  72. Treydte, K.; Liu, L.; Padrón, R.S.; Martínez-Sancho, E.; Babst, F.; Frank, D.C.; Gessler, A.; Kahmen, A.; Poulter, B.; Seneviratne, S.I. Recent human-induced atmospheric drying across Europe unprecedented in the last 400 years. Nat. Geosci. 2024, 17, 58–65. [Google Scholar] [CrossRef]
Figure 1. The study area.
Remotesensing 17 01685 g001
Figure 2. Methodological framework of the study.
Remotesensing 17 01685 g002
Figure 3. Annual distribution pattern of forest fires from 2001 to 2022.
Remotesensing 17 01685 g003
Figure 4. Distribution map of fire points and population density in Northeast China. The blue line on the right side and the green line on the bottom represent fire points. The orange line graph on the right side and the yellow line on the bottom represent the population density.
Remotesensing 17 01685 g004
Figure 5. Associations between different altitudes, slopes, and aspects and forest fire frequency (a1,b1,c1). Percentage of forest fires at different altitudes, slopes, and orientations (a2,b2,c2).
Remotesensing 17 01685 g005
Figure 6. Characteristics of fires in the forest areas of Northeast China. (a) Frequency and burned area of forest fires in Northeast China from 2001 to 2022. (b) Monthly distribution of forest fires. (c,d) Causes of forest fires.
Remotesensing 17 01685 g006
Figure 7. Moving average analysis of the forest fire factors per decade during 2001–2022. (a) Fire frequeney. (b) Maximum temperature. (c) Burned area.
Remotesensing 17 01685 g007
Figure 8. The driving factors of forest fires in SEM framework.
Remotesensing 17 01685 g008
Figure 9. Vine structure of Copula.
Remotesensing 17 01685 g009
Figure 10. Three-dimensional correlation between Tmax, HFI, and fire frequency (Fire). Along the diagonal is the histogram of copula data, the upper triangle is the scatterplot of copula data, and the lower triangle displays the contour map.
Remotesensing 17 01685 g010
Figure 11. Detailed distribution map of two-dimensional copula. (a) Normalized contour map of Tmax–Fire and scatterplot. (b) Normalized contour map of Tmax–HFI and scatterplot.
Remotesensing 17 01685 g011
Table 1. Data and data sources.
Types of DataVariableData SourcesResolution/Time Span
Fire dataFire frequencyMODIS Active Fire And Burned Area Products
https://modis-fire.umd.edu,
accessed on 19 March 2025
10 km/2001–2022
Burned area
Canopy moisture content dataTemperature vegetation dryness indexNational Earth System Science Data Center
https://www.geodata.cn,
accessed on 19 March 2025
1k m/2001–2022
Land cover dataNational Service Center for Specialty Environmental Observation Stations
https://www.ncdc.ac.cn,
accessed on 16 May 2024
30 m/1985–2022
Normalized difference vegetation index (NDVI)Third Pole Environment Data Center
https://www.re3data.org/repository/r3d100013285,
accessed on 19 March 2025
1 km/2001–2022
Fire weather dataMean temperatureGoogle Earth Engine
https://www.gscloud.cn,
accessed on 16 May 2024
10 km/1950–2025
Maximum temperature
Precipitation
Wind speed
Standardized precipitation evapotranspiration index (SPEI)
Landform dataAltitudeGeospatial Data Cloud
https://www.gscloud.cn,
accessed on 19 March 2025
30 m/2001–2022
Slope
Aspect
Soil moisture condition index of China by in situ data (SMCI)National Tibetan Plateau
Science Data Center
https://data.tpdc.ac.cn,
accessed on 16 May 2024
1 km/2000–2022
Human activity dataPopulation densityOAK RIDGE National Laboratory
https://landscan.ornl.gov,
accessed on 16 May 2024
1 km/2000–2022
Night light index (PANDA)Third Pole Environment Data Center
https://www.re3data.org/repository/r3d100013285,
accessed on 19 March 2025
1 km/1984–2022
Distance to the nearest residential areaOpen Street Map
https://www.openstreetmap.org,
accessed on 19 March 2025
10 km/2001–2022
Distance to the nearest road
Human footprint index (HFI)China Agricultural University
https://www.x-mol.com,
accessed on 19 March 2025
1 km/2000–2022
Table 2. Four standard Copula functions.
NameExpressionParameter θ Range
Gaussian 1 ( u ) 1 ( v ) 1 2 π 1 2 e x p ( 2 x y x 2 y 2 2 ( 1 2 ) ) d x d y b θ ∈ [−1, 1]
Clayton m a x ( u + v 1,0 ) 1 / θ ∈ [−1, ∞]˄ ≠ 0
Frank 1 I n [ 1 + ( e x p ( u ) 1 ) ( e x p ( v ) 1 ) e x p ( ) 1 ] θ ∈ R˄ ≠ 0
Gumbel e x p [ ( I n ( u ) ) + ( I n ( v ) ) ] 1 / θ ∈ [1, ∞]
Table 3. The model-fitting index.
Model Fitting IndicatorsIndicator NameFit Requirement StandardActual Value
dfDegree of freedom/48.00
CHISQ (χ2)Chi square value/65.76
χ2/df/1~31.37
p-valueSignificance test value>0.050.08
GFIGoodness-of-fit index>0.900.91
CFIComparative fit index>0.950.92
SRMRStandardized root mean square residual<0.050.04
RMSEARoot mean square error of approximation<0.080.077
Table 4. Two-dimensional variables and their parameters.
2D VariablesFamily/Copula FamilyAIC
Tmax–Fire10/BB8 Copula−495,253.7
Tmax–HFI5/Frank Copula−103,720.5
Disclaimer/Publisher’s Note: The statements, opinions and data contained in all publications are solely those of the individual author(s) and contributor(s) and not of MDPI and/or the editor(s). MDPI and/or the editor(s) disclaim responsibility for any injury to people or property resulting from any ideas, methods, instructions or products referred to in the content.

