Article

First-Arrival Tomography for Mountain Tunnel Hazard Assessment Using Unmanned Aerial Vehicle Seismic Source and Enhanced by Supervirtual Interferometry

1
Key Laboratory of Intraplate Volcanoes and Earthquakes (China University of Geosciences, Beijing), Ministry of Education, Beijing 100083, China
2
School of Geophysics and Information Technology, China University of Geosciences, Beijing 100083, China
3
School of Geological Engineering, Qinghai University, Xining 810016, China
4
National Institute of Nature Hazards, Ministry of Emergency Management of China, Beijing 100085, China
*
Author to whom correspondence should be addressed.
Remote Sens. 2025, 17(10), 1686; https://doi.org/10.3390/rs17101686
Submission received: 24 March 2025 / Revised: 27 April 2025 / Accepted: 7 May 2025 / Published: 11 May 2025

Abstract

:
Preliminary tunnel surveys are essential for identifying geological hazards such as aquifers, faults, and karstic zones. While first-arrival tomography is effective for imaging shallow anomalies, traditional seismic sources face significant limitations in forested mountainous regions due to mobility, cost, and environmental impact. To address this, we deployed a seismic source delivered by an unmanned aerial vehicle (UAV) for a highway tunnel survey in Lijiang, China. The UAV system, paired with nodal geophones, enabled rapid, low-impact, and high-resolution data acquisition in rugged terrain. To enhance the weak far-offset refractions affected by near-surface attenuation, we applied supervirtual refraction interferometry (SVI), which significantly improved the signal-to-noise ratio and expanded the usable first-arrival dataset. The combined use of UAV excitation and SVI processing produced a high-precision P-wave velocity model through traveltime tomography, aligned well with borehole data. This model revealed the spatial distribution of weathered zones and bedrock interfaces, and allowed us to infer potential fracture zones. The results offer critical guidance for tunnel alignment and hazard mitigation in complex geological settings.

1. Introduction

As infrastructure continues to advance, the construction of transportation networks thrives in intricate alpine terrains. However, the profoundly heterogeneous topography of these locales often poses challenges [1], with highway and railway tunnel construction encountering issues, such as aquifers, faults, or karst fracture zones [2,3]. These situations can lead to engineering calamities or latent hazards [4] that impede construction progress and efficacy. Undetected risks during the preparatory stages may even jeopardize the eventual completion and operation [5]. Consequently, meticulous pre-construction geological prospecting for engineering purposes is paramount for highway tunneling, particularly in evaluating weathered layer thickness, bedrock surface depth, and tunnel surrounding rock classification [6,7].
Rock weathering and fragmentation induce a decrease in seismic wave velocities, creating a noticeable disparity in velocities between the cover layer and bedrock [8]. Therefore, first-arrival traveltime tomography proves suitable for delineating weathered layers in geological surveys [9,10,11]. This method involves the inversion of subsurface velocity structures through artificially induced seismic waves to acquire first-break traveltime [12], providing valuable physical parameters, such as P-wave velocity and rock depth [13]. However, Traditional seismic sources encounter several challenges in forested mountainous terrains [14]. Explosive sources, although capable of delivering substantial energy, suffer from low operational efficiency, high cost, stringent safety requirements, and considerable environmental damage, often rendering them impractical [15]. Vibroseis, known for its controllability and resistance to interference, remains costly and logistically constrained on steep or rugged terrains due to its limited maneuverability and equipment size [16]. Weight-drop methods, such as sledgehammers, are cost-effective and easy to deploy, but their limited excitation energy output restricts their applicability in deep or complex subsurface investigations [17]. These limitations collectively hinder the efficiency, depth penetration, and adaptability of seismic surveys in mountainous regions, prompting the need for novel source technologies. Furthermore, near-surface wavefields in these regions are complex, with overlying strata displaying marked longitudinal and lateral variations. This complexity results in pronounced absorption and attenuation of seismic waves by the near-surface medium, reducing the signal-to-noise ratio (SNR) of far-offset refractions [18,19]. Consequently, the precise extraction of first-arrival traveltime poses a formidable challenge, causing substantial ray loss within the deeper model and engendering considerable interference with tomography accuracy and depth.
Consequently, to overcome the pivotal obstacles of exciting seismic waves in forested mountains, it is imperative to develop novel sources. The unmanned aerial vehicle (UAV) seismic source emerges as a viable solution, affording secure, rapid, ecologically friendly, and high-quality seismic data acquisition in intricate environments [20,21]. Compared with other seismic sources, this approach boasts cost efficiency, strong energy, and a wider frequency band, making it the only seismic source with broad applicability to tunnel surveys within forested mountainous regions [22]. Simultaneously, to address the attenuated signals that manifest in far-offset first arrivals, supervirtual refraction interferometry (SVI) presents a relatively efficacious approach for enhancing the SNR of refractions [23,24]. It constructs a virtual shot record by cross-correlating and stacking seismic traces from different shots, and then convolves and stacks the virtual traces with the corresponding near-offset traces to recover the true refracted wave traveltime. This methodology can significantly improve the SNR by n (where n is the number of postcritical shots shooting into the same pair of geophones), suppressing random noise and amplifying the far-offset refracted wave energy [25,26,27,28]. In instances where noise magnitudes are sufficiently strong to preclude achieving the desired outcomes with SVI, the computed results can serve as input data for further interference mitigation through iterative SVI [29,30]. Alternatively, executing the SVI in the Radon domain can directly avoid seismic noise participation in the calculations, substantially enhancing the SNR of the reconstructed first arrivals [31]. Additionally, SVI can be extended to 3D seismic datasets, furnishing more dependable first-arrival traveltime at far offsets, and subsequently employed for inverting deeper velocity structures [32,33], leading to superior practical outcomes [34].
The purpose of this study was to investigate a new methodology for evaluating the characteristics of adverse geological formations, such as aquifers, weathered layers, and faults, along the route of the Lijiang Highway tunnel survey in Yunnan, China. The study area is characterized by notably rugged terrain and dense trees, with mountain slopes predominantly ranging from 40 to 60°. Conspicuous dips in the strata and structure significantly impede seismic acquisition efficiency and exploration precision. This study successfully overcomes the primary challenge of seismic wave excitation in forested mountainous regions by efficiently collecting seismic data from a UAV seismic source. Additionally, despite severe near-surface weathering obstructing seismic wave propagation and adversely affecting tomographic imaging, we successfully mitigated the problem of weak signals in far-offset refractions by applying the SVI technique. This study represents the first instance of acquiring highly precise P-wave velocity profiles from UAV-sourced data through traveltime tomography, resolving challenges in geological exploration for mountainous engineering projects. By integrating the results with borehole data, we delineated the weathering zone and bedrock structure in the study area. Moreover, we inferred the potential location of fracture zones, providing a critical foundation for strategic route selection in highway construction.

2. Methods

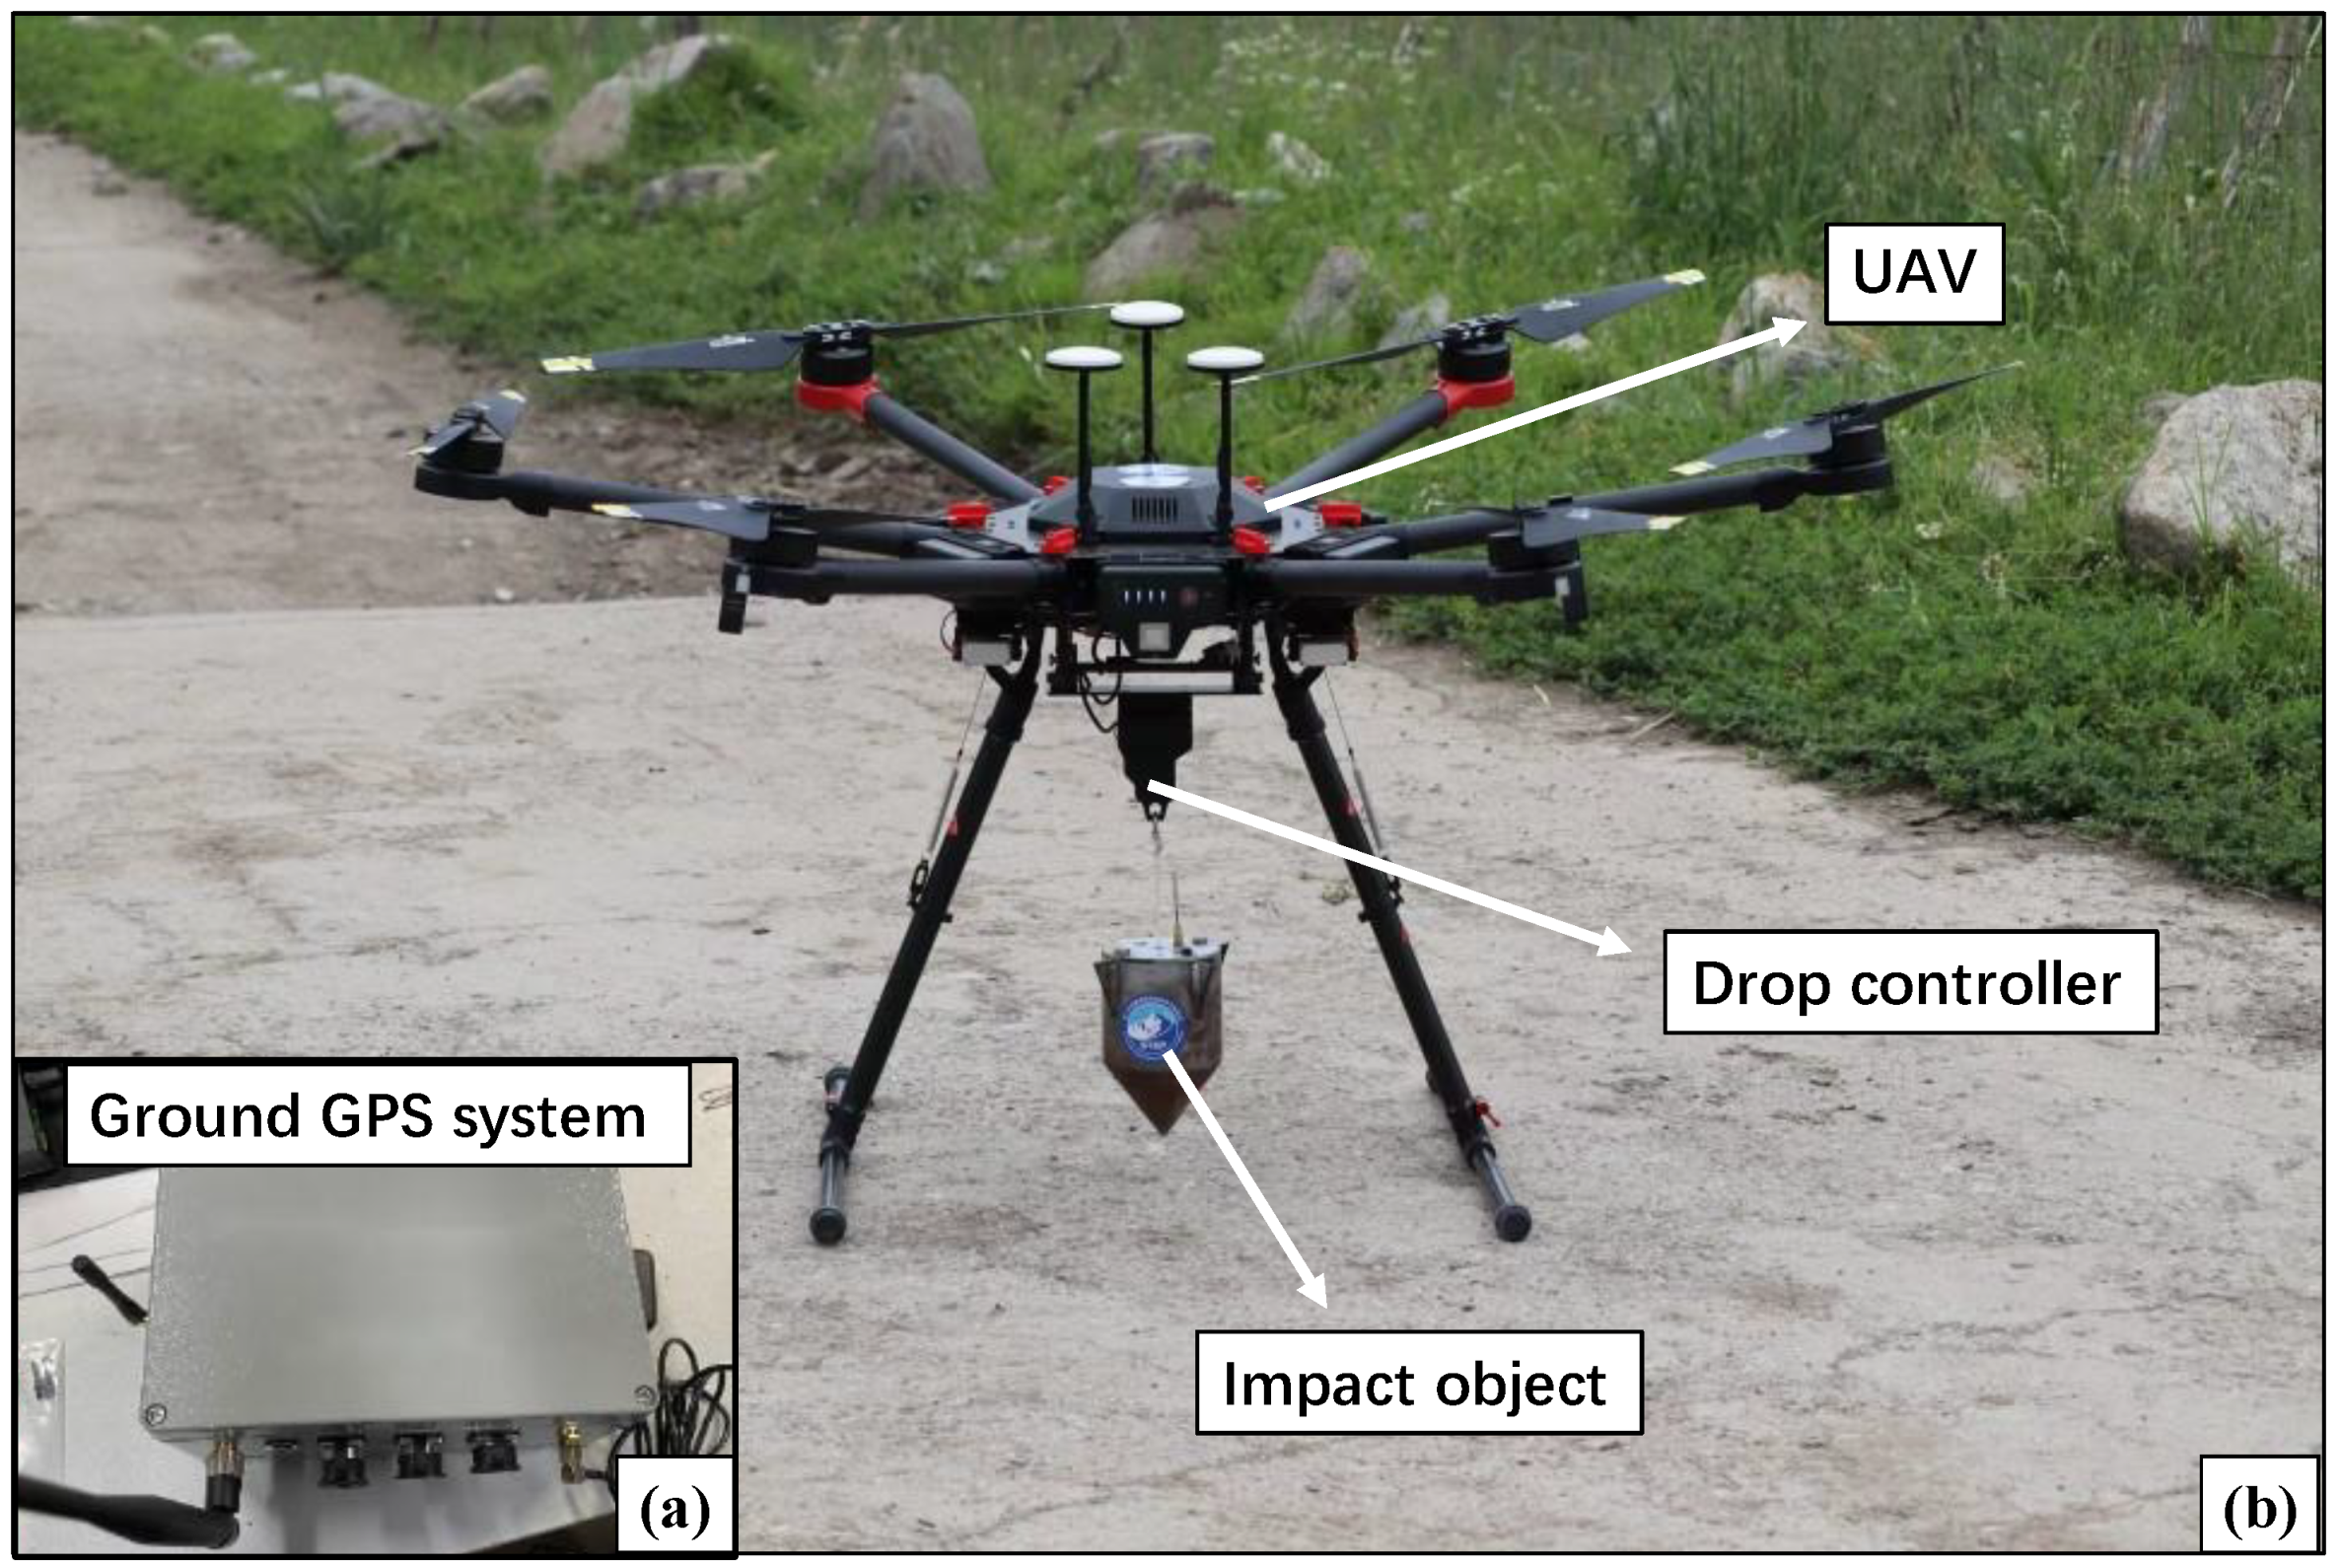
2.1. UAV Seismic Source
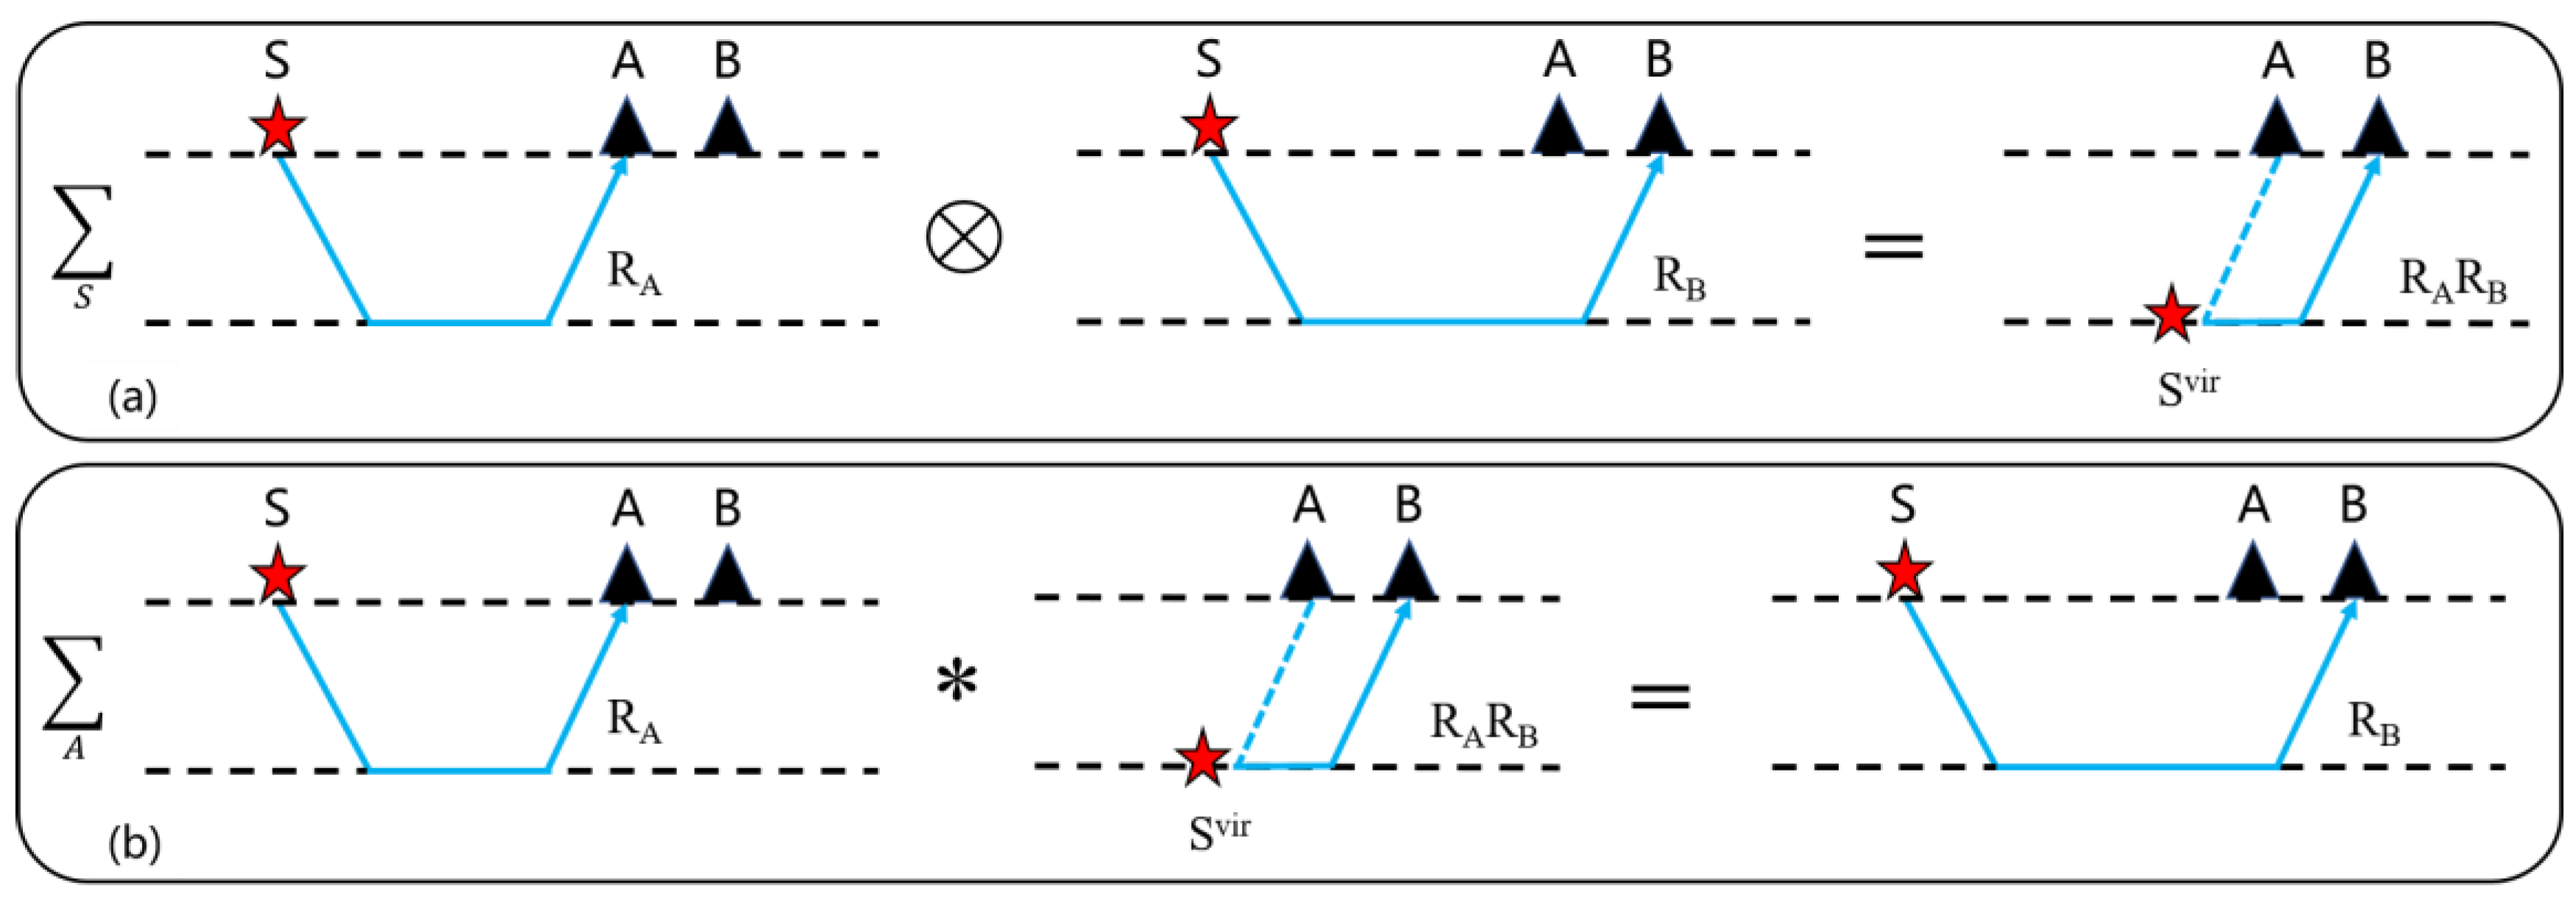
The UAV seismic source comprises three primary components: the multirotor UAV, the remote positioning and release system, and the impact object, as depicted in Figure 1 [21]. The source principle utilizes a multirotor UAV with rapid takeoff and landing capabilities to transport an impact object to a predetermined altitude. It accurately identifies the shot location and releases the object using a drop controller. Upon landing, the internally integrated GPS positioning system, combined with a millisecond-level high-precision timer, automatically records both the current position coordinates and the precise time. These data are transmitted in real time via wireless devices to the ground acquisition system, ensuring meticulous time synchronization between the air and the ground. The system harnesses the potential energy of an impact object at high altitude, converting it into kinetic energy and generating robust seismic waves upon impact with the ground. The energy output of the source can be adjusted based on the flight altitude and impact object mass, rendering it a cost-effective solution. The UAV serves as a transport tool for the seismic source, providing essential power support for the ascent and positioning of the impact object. Its maximum flight altitude extends to several hundred meters, and its maximum load capacity depends on the specific UAV type.
In terrains characterized by precipitous mountains and dense vegetation, seismic source equipment and ground vehicle mobility deployment are frequently constrained by surface geological factors. The UAV source capitalizes on aerial operations, facilitating swift repositioning and release of impact objects after takeoff. In our field tests, a single UAV operator was able to complete up to 42 shot points along a 750 m line within approximately 5 h, which is nearly 60% faster than traditional manual methods using sledgehammers or explosive charges that typically require a full working day for similar coverage due to transport, positioning, and safety clearance times. Moreover, aerial deployment enables flexible access to difficult terrain such as steep slopes and forest-covered areas, allowing acquisition at locations that would otherwise be inaccessible to ground-based sources. This capability allows for rapid excitation virtually anywhere, causing minimal disturbance to the natural vegetation or terrain. This significantly mitigates the environmental impact and contributes to ecological preservation by obviating the labor, resources, and time expenditures associated with traditional seismic sources. Furthermore, in refractive wave investigations, data acquisition frequently requires extensive survey lines with long offset distances. The UAV source effectively circumvents ground condition limitations and averts potential data losses, enhancing construction personnel safety and underscoring its significance for seismic exploration in challenging environments. While UAV-based sources offer considerable advantages in terms of flexibility, efficiency, and minimal environmental impact, certain limitations remain. These include reduced energy stability when operating over steep slopes or dense vegetation, and the potential for impact inaccuracies due to wind or landing surface variability. These factors are addressed in detail later in the discussion.
Despite successful seismic data acquisition using UAV sources, severe bedrock weathering and undulating terrain in mountainous regions have led to significant near-surface seismic wave absorption attenuation, diminishing the energy at far distances. Therefore, further post-processing is imperative to amplify the refracted waves and attain superior P-wave velocity profiles.

2.2. SVI

Mallinson et al. [23] and Bharadwaj et al. [24] proposed the concept of supervirtual interferometry (SVI) to enhance the weak far-offset first arrivals that are often difficult to pick in low-SNR environments. Based on the far-field reciprocity principle formulated by [35], SVI utilizes correlation and convolution operations to generate virtual and supervirtual refractions. In essence, this method reconstructs the refracted wavefield between two receivers by using recorded waveforms to approximate the Green’s function, enabling energy enhancement through stacking. The following equations describe the theoretical foundation of this method:
I m G B | A v i r k G A | S G B | S d 2 S
G B | S s v i 2 i k G B | A v i r G A | S d 2 A
where Im represents the imaginary part of Green’s function, k denotes the average wavenumber, S is the source position, A and B are the receiver positions described in Figure 2, G B | A v i r represents the virtual refraction arrival record for a virtual source at S v i r and a receiver at B (Figure 1a). G B | S s v i is the supervirtual trace obtained by convolving the recorded data G A | S with the virtual record G B | A v i r (Figure 2b).
To implement SVI, two essential steps must be followed: First, by correlating the refracted wave received by geophone A with the refracted wave received by geophone B, the common propagation path can be eliminated, allowing for the reconstruction of a virtual refraction RaRb with Ra serving as the virtual source and Rb as the virtual detector (Figure 2a). If m sources exist in the stationary phase region, the refraction data SNR can be enhanced by m . Second, the supervirtual refraction with the actual source S as the source and geophone B as the receiver point can be reconstructed by convolving the refraction wavefield Ra with the virtual refraction wavefield RaRb (Figure 2b). Moreover, if n geophones are present in the stationary phase region, the data SNR can be further improved by n .
To counteract spurious signals arising from unintended correlations between direct waves, reflections, and refractions, it is essential to circumscribe the refraction waves within a distinct window before using the SVI method [29]. Additionally, an intrinsic constraint of this methodology is the assumption that the targeted refraction originates from the same layer. If the true first arrivals are created by distinct refractive interfaces, the SVI application may result in far-offset refractions that fail to accurately reconstruct the actual deep refractor wavefield [36].

3. Case Study

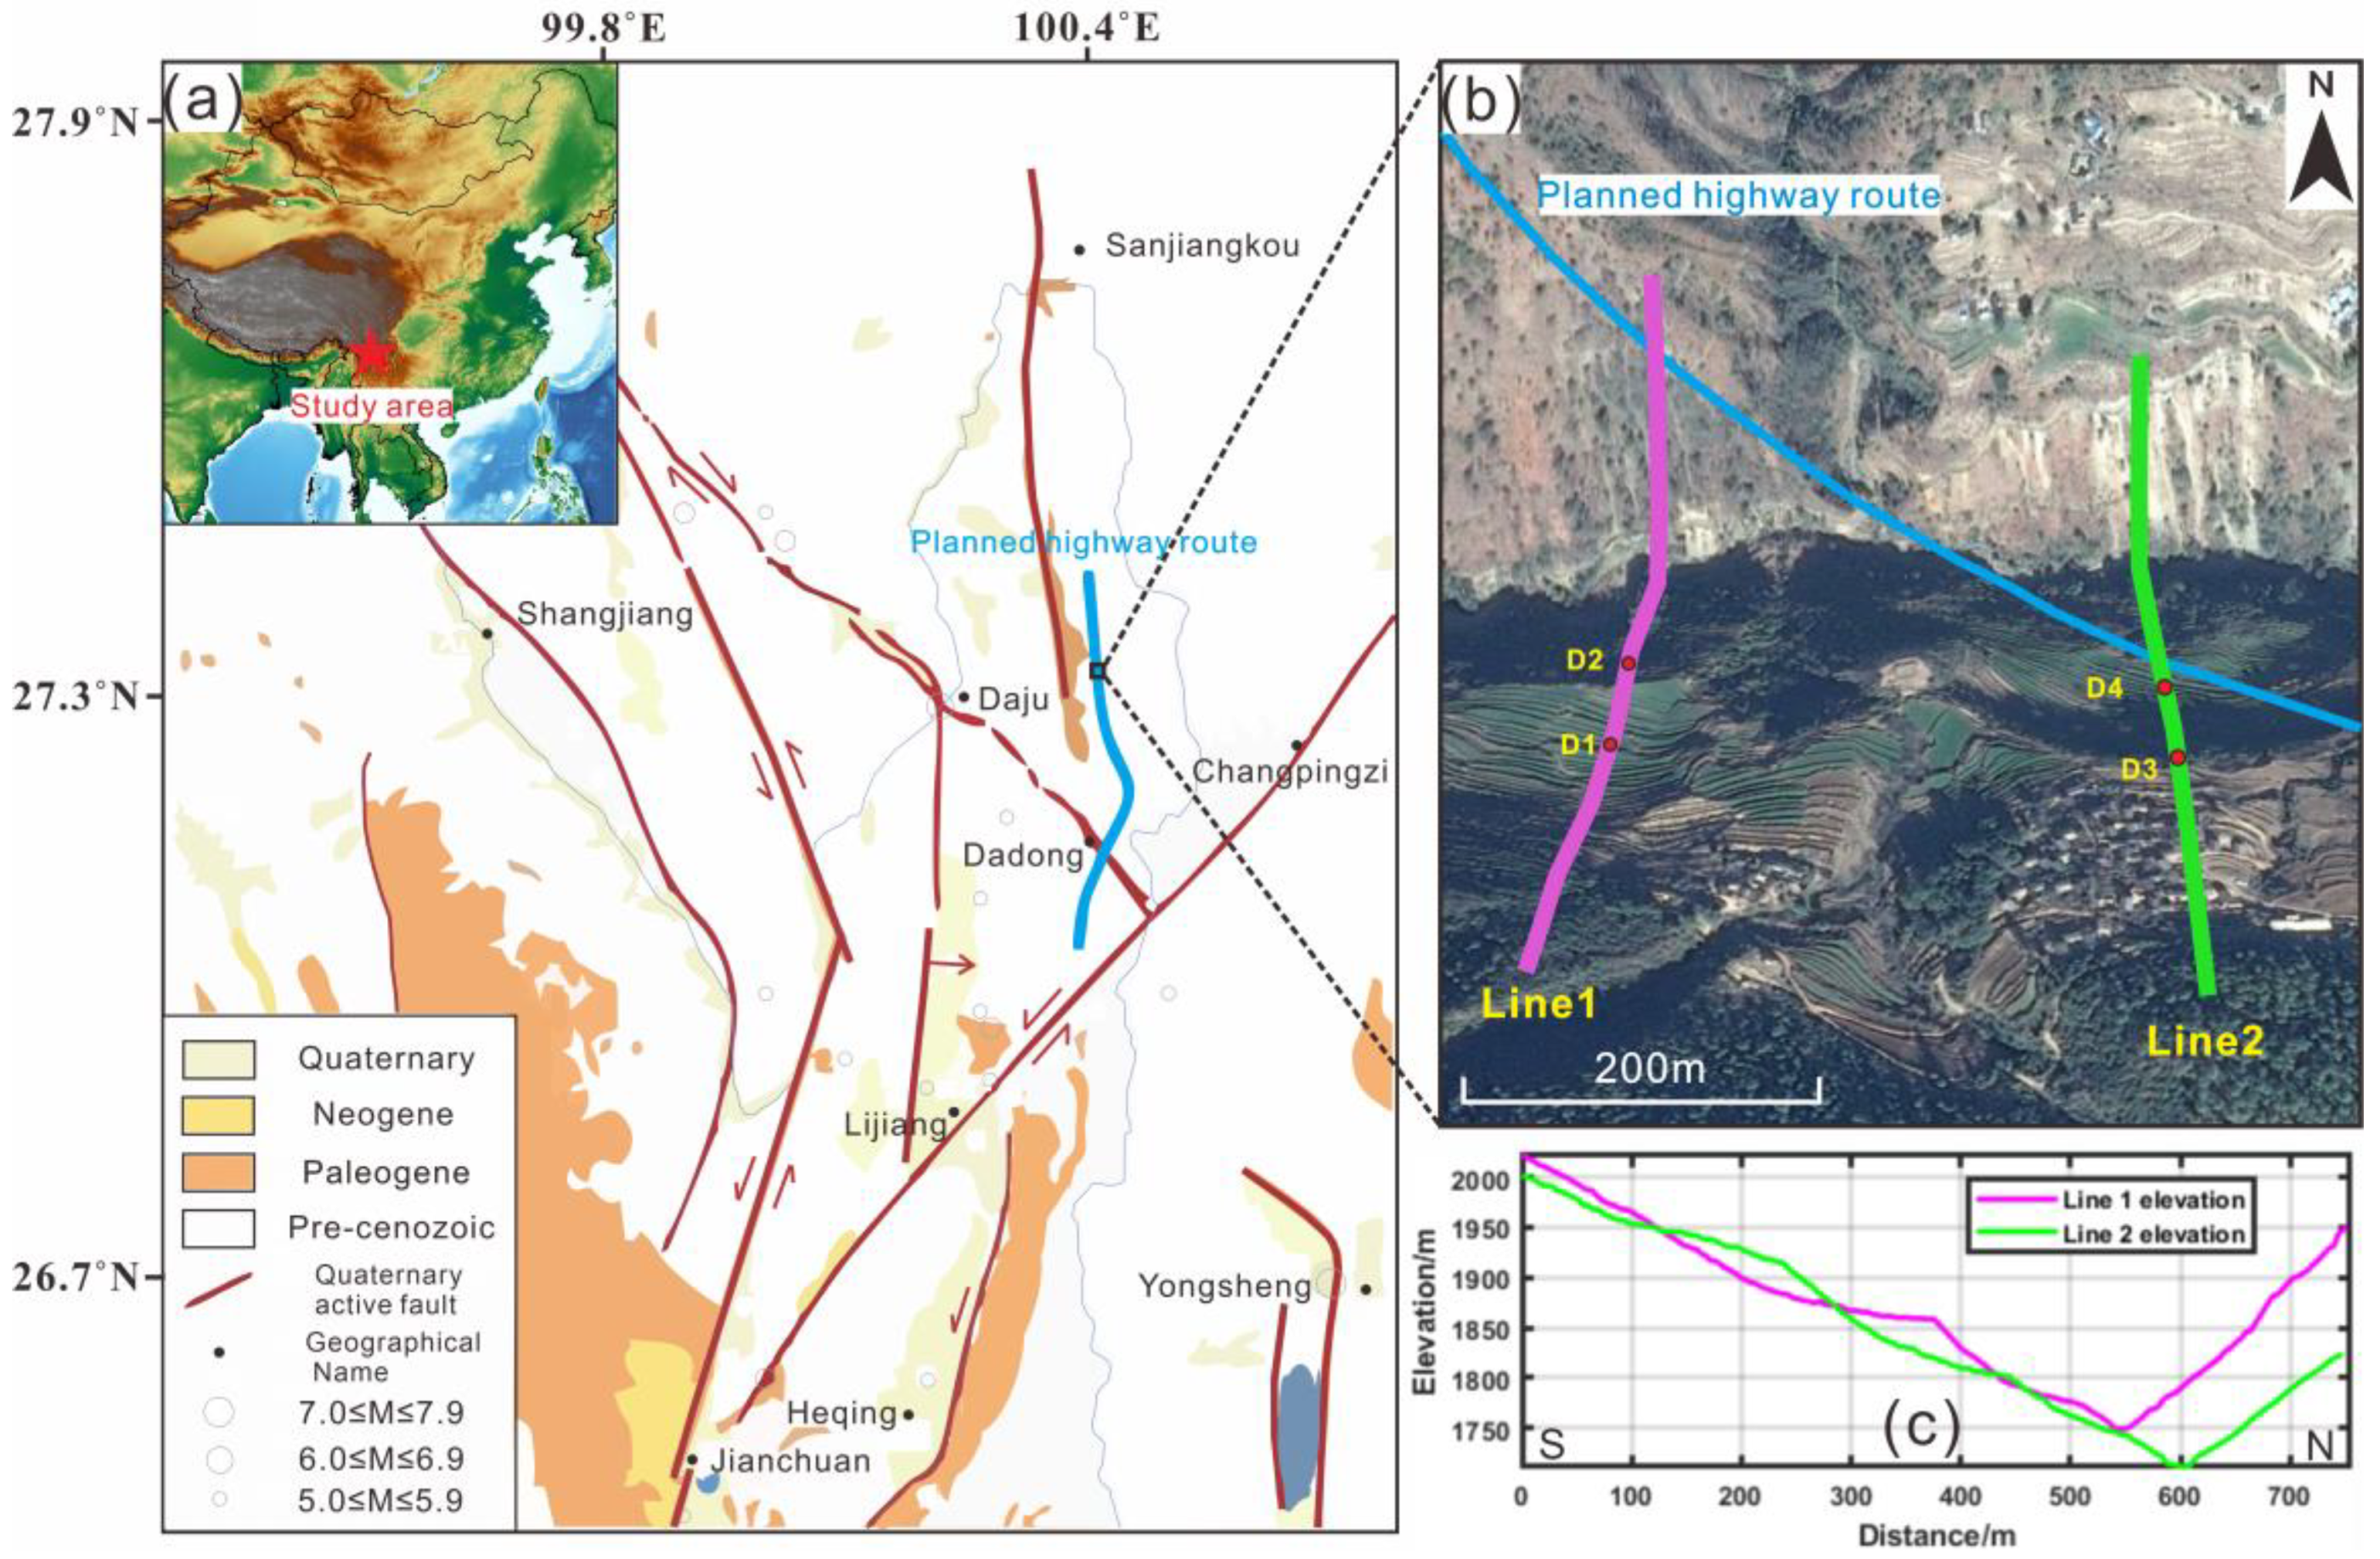
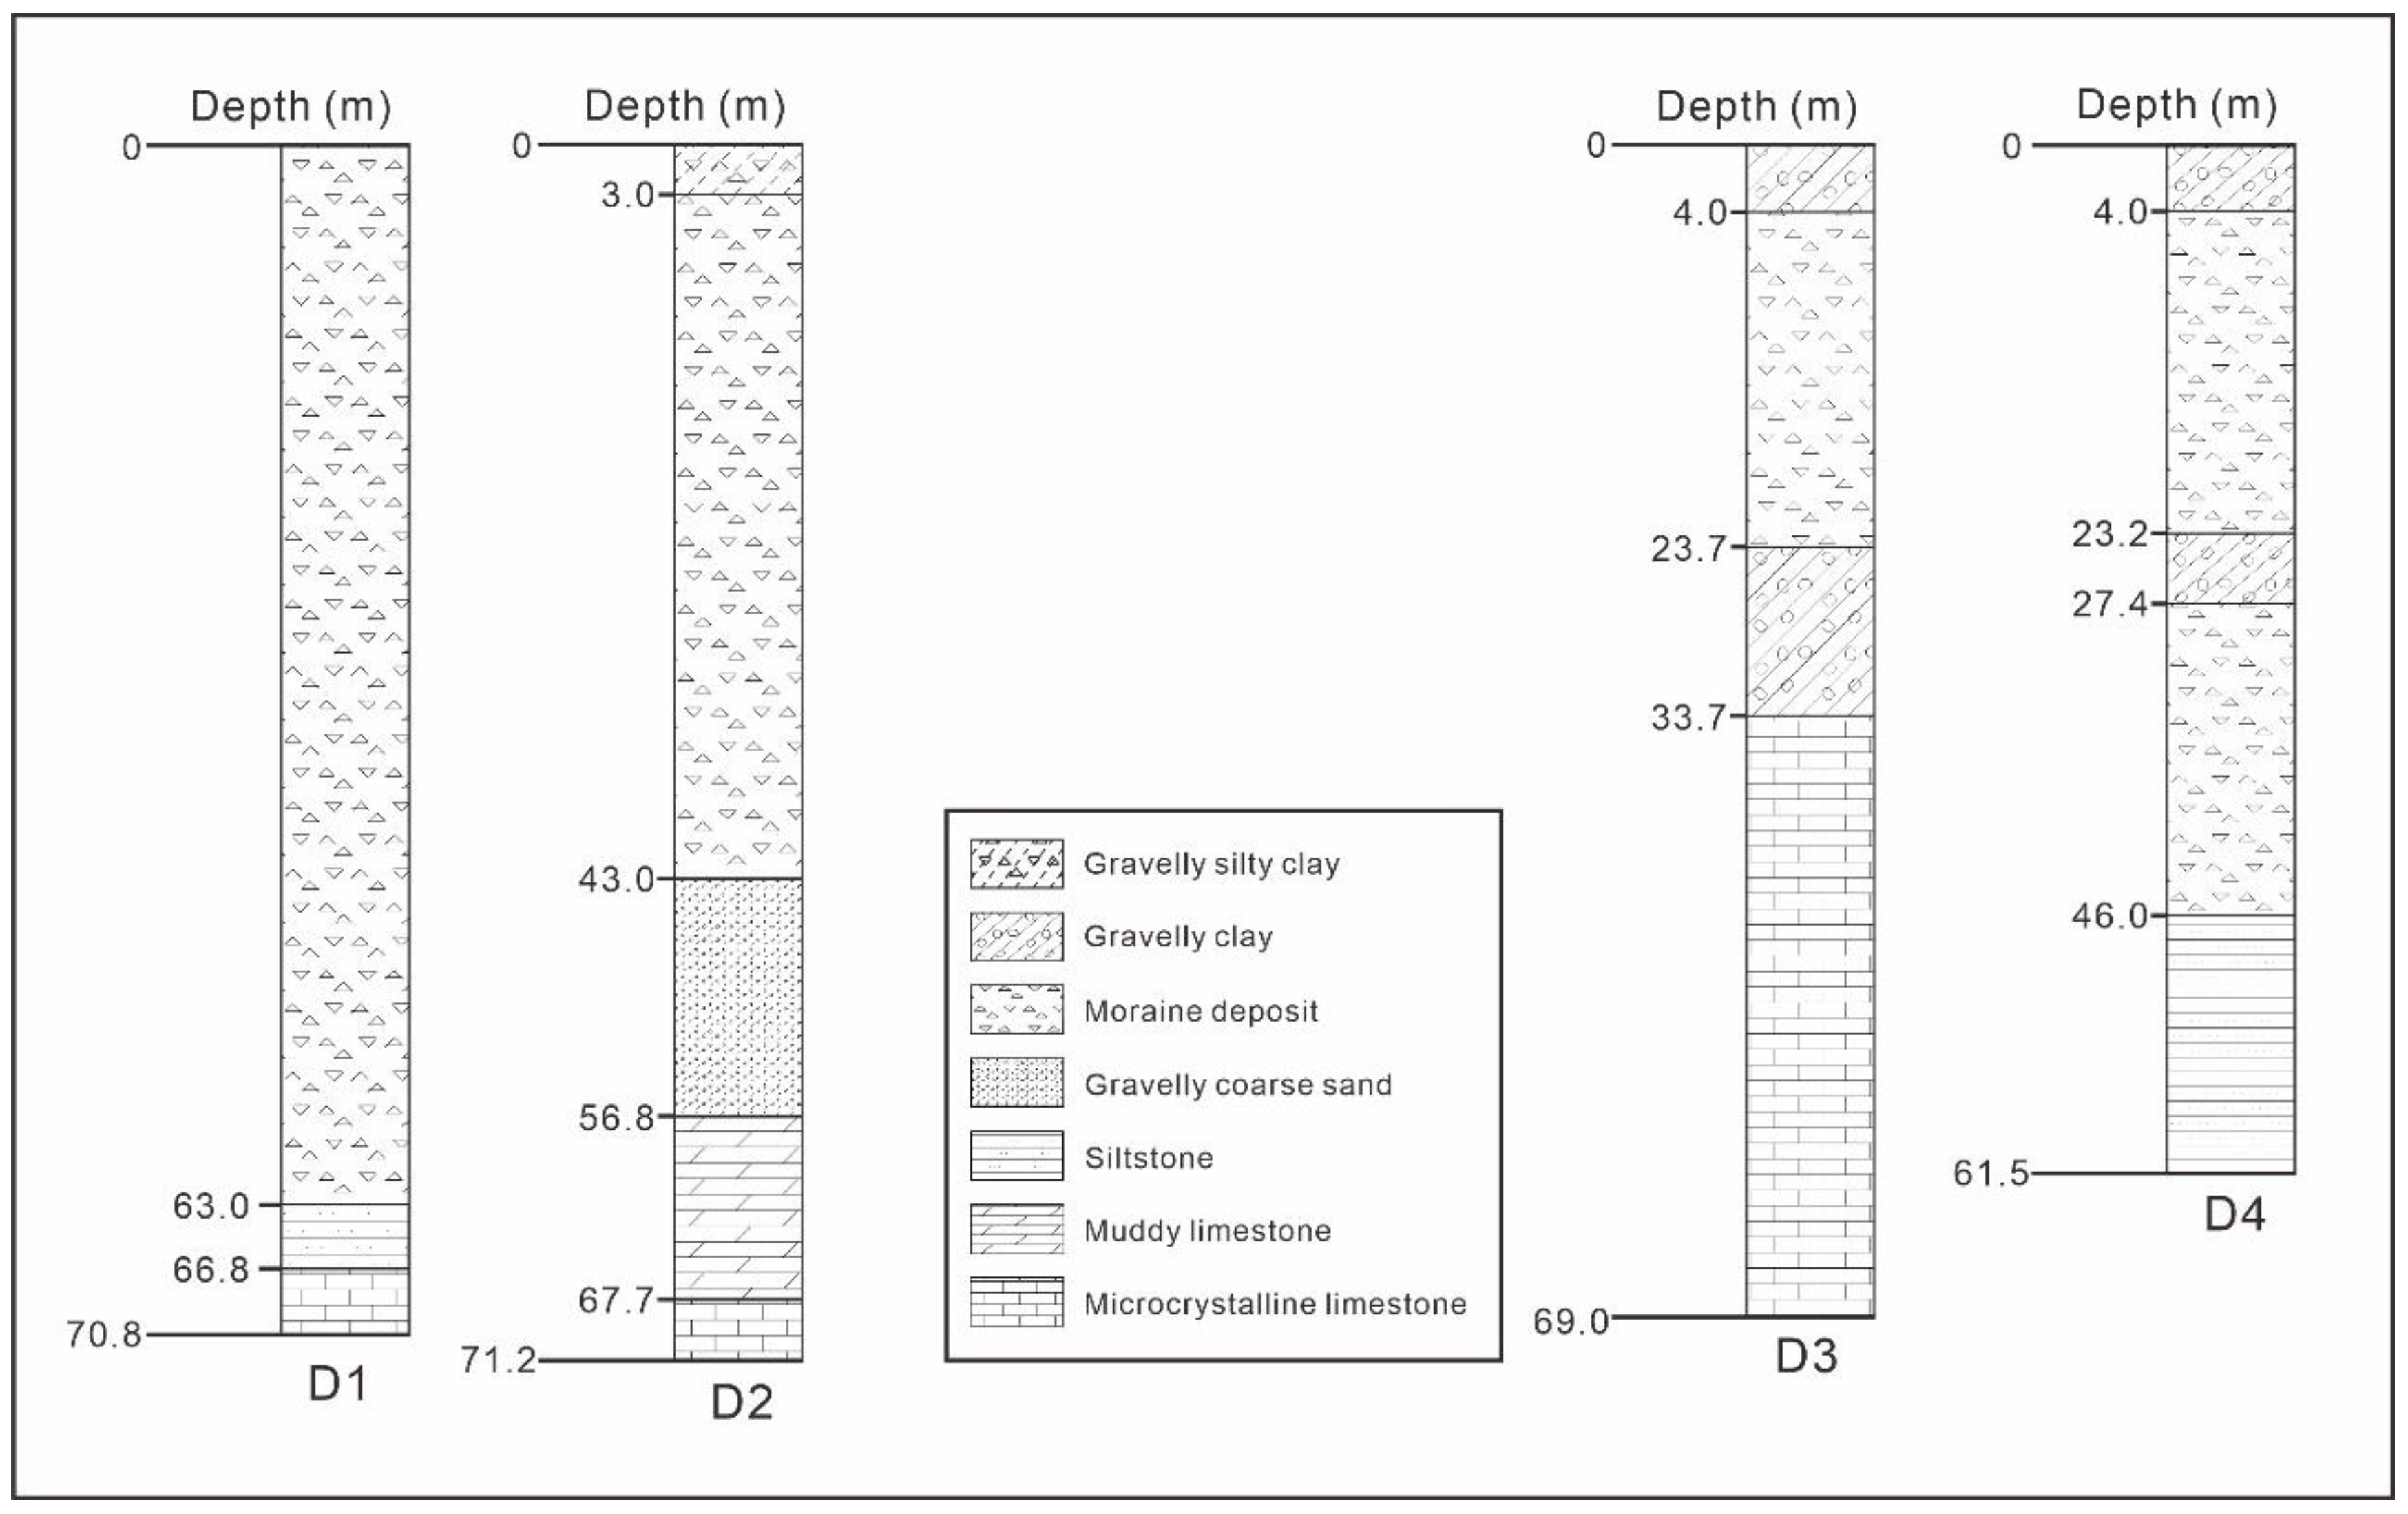
3.1. Geological Setting

The study area is located in the mountainous region of Lijiang City, Yunnan Province, China, which is in the transitional zone from the Hengduan Mountains on the southern edge of the Qinghai–Tibet Plateau to the Yunnan–Kweichow Plateau. It features both the Hengduan Mountain valleys and the northwest Yunnan Plateau terrain. The terrain can be delineated into erosional accumulation, erosional structural, and karst structural landforms. Notably, it exhibits well-developed fold and fault structures, as illustrated in Figure 3.
The outcrops in the study area primarily consist of Quaternary, Devonian, Lower, Middle, and Upper Silurian periods, and the Upper Ordovician period. The Quaternary period residual deposits are widely distributed and mainly composed of limestone, mudstone, limestone, and basic and ultrabasic volcanic rocks. Devonian rocks are mainly located in the north–south section of the survey line, and the rock types include sandstone, siltstone, and shale. The Upper, Middle, and Lower Silurian periods, as well as the Upper Ordovician period, are distributed in the middle section of the seismic line and are mostly covered by residual Quaternary deposits. The Upper Silurian period is composed of shale and argillaceous limestone, the Middle Silurian period is composed of mudstone or limestone, and the Lower Silurian period is composed of shale. Within the study area, there are conspicuous disparities in velocity between the Quaternary deposits and various rock formations, forming discernible refractive interfaces. Using a UAV source, the constraints imposed by steep surface topography were effortlessly transcended. This markedly reduces the cost and risk involved in seismic exploration, thereby facilitating efficient and high-quality seismic data acquisition.
Two parallel north–south seismic lines were deployed, approximately 400 m apart. These seismic lines traverse the core of an anticlinal structure and delineate a conspicuous valley. On either side of this valley, Devonian strata are exposed, while the core of the anticline consists primarily of Upper Ordovician and Silurian rocks. To achieve a more precise demarcation of the subsurface structure, two boreholes exceeding 60 m in depth were drilled along each seismic profile (Figure 3c).
To help visualize the spatial configuration of these geological units, we provide a summary of their arrangement relative to the seismic profiles and boreholes. The seismic lines intersect a symmetrical anticline, where the central axis contains older formations—Ordovician and Silurian—while Devonian rocks appear on both flanks. Quaternary residual deposits blanket the valley floor and lower slopes, with increasing thickness toward lower elevations. Boreholes D1 and D2 (on Line 1) and D3 and D4 (on Line 2) confirm this stratigraphy, documenting transitions from loose surficial materials to compacted sedimentary rocks with depth. This stratigraphic layering reflects the erosional and structural evolution of the region.

3.2. Seismic Data Acquisition

To ensure the safety of highway tunnel construction, the P-wave velocity model was inverted to evaluate the thickness of the weathered layer, fracture zones, and other adverse geological formations along the route. This process is based on the principle that seismic P-wave velocity varies with lithology, degree of weathering, and rock integrity—lower velocities typically indicate unconsolidated sediments or fractured zones, while higher velocities correspond to intact bedrock. By analyzing the lateral and vertical variations in the inverted velocity field, we can delineate interfaces between overburden and bedrock, detect low-velocity anomalies suggestive of potential fracture zones, and assess rock mass quality along the tunnel alignment. However, the study area is characterized by rugged mountainous terrain and dense forest cover. In certain regions, sheer cliffs descend to depths exceeding 10 m, creating significant challenges for seismic data acquisition. In addition, for refraction traveltime tomography, received signals with extended offsets are essential, necessitating a seismic source to generate ample energy. Traditional data collection methods are severely restricted in this context. Therefore, in this study, seismic waves were excited using a UAV source, and the wireless node geophone SmartSolo IGU-16 was chosen as the receiver, jointly accomplishing data acquisition.
In this study, each seismic line comprised 42 shots and 189 receivers, with a 4 m station spacing and 16 m shot spacing. All shots were excited via the UAV source, and the primary acquisition parameters are listed in Table 1. Figure 4 illustrates the common-shot gathers of Line 1 (a,c) and Line 2 (b,d), acquired using a 5 kg impact object released from a 500 m altitude by the UAV. The data are displayed under different frequency band conditions for comparison. Within the low-frequency range (Figure 4a,b), the raw data in the two survey lines clearly display visible first arrivals with a maximum offset reaching 360 and 436 m, respectively. The signals from the far traces were masked by noise, and a discontinuous event occurred, with certain areas exhibiting local dislocations in the green circle. The intricate geological structures in the study area resulted in variations in seismic wave velocities. In addition, the depth of the bedrock and geological formations may be altered by geological phenomena, such as mountain uplift and erosion. Hence, an evident transition from low-velocity sediments (red dashed line) to high-velocity bedrock (blue dashed line) is discernible in Figure 4a,b. Relatively, the low-velocity layer has a shorter propagation distance, and the refracted wave exhibits longer offsets on the northern side of the survey lines, indicating a shallower depth to bedrock and more homogeneous rock formation. In contrast, attenuation on the southern side was more severe, suggesting more intense weathering at that location. Subsequent to the first arrivals, various surface wave magnitudes emerged, characterized by potent low-frequency energy and random noise interference. In the high-frequency range (Figure 4c,d), surface waves were considerably suppressed, resulting in clearer seismic records. This enhances boundary delineation between the bedrock and overlying sediments.
The analysis revealed notable distortions and poor discontinuities in the first arrivals of the two seismic records, accompanied by substantial interference of ambient noise at distant offsets. Nevertheless, a discernible velocity gradient from the low-speed overburden to the bedrock was noticeable. This demonstrates that utilizing a 5 kg impact object dropped from an altitude of 500 m in rugged terrain by a UAV source effectively traverses the overlying layers, fulfilling the requirements for data collection at depth. However, once the maximum offset exceeds the 360 m threshold, intense surface weathering causes significant seismic wave attenuation, diminishing long-range SNR. Simultaneously, random noise interference hinders accurate first-arrival traveltime pick-up. Furthermore, topographical undulations with dense vegetation cover may influence the impact object’s stability when it hits the ground, causing consequential energy dissipation. To address these challenges, this study endeavored to amplify first arrival SNR using the SVI technique, laying the foundation for subsequent high-precision tomographic imaging within this arduous mountainous landscape.

4. Data Processing and Results

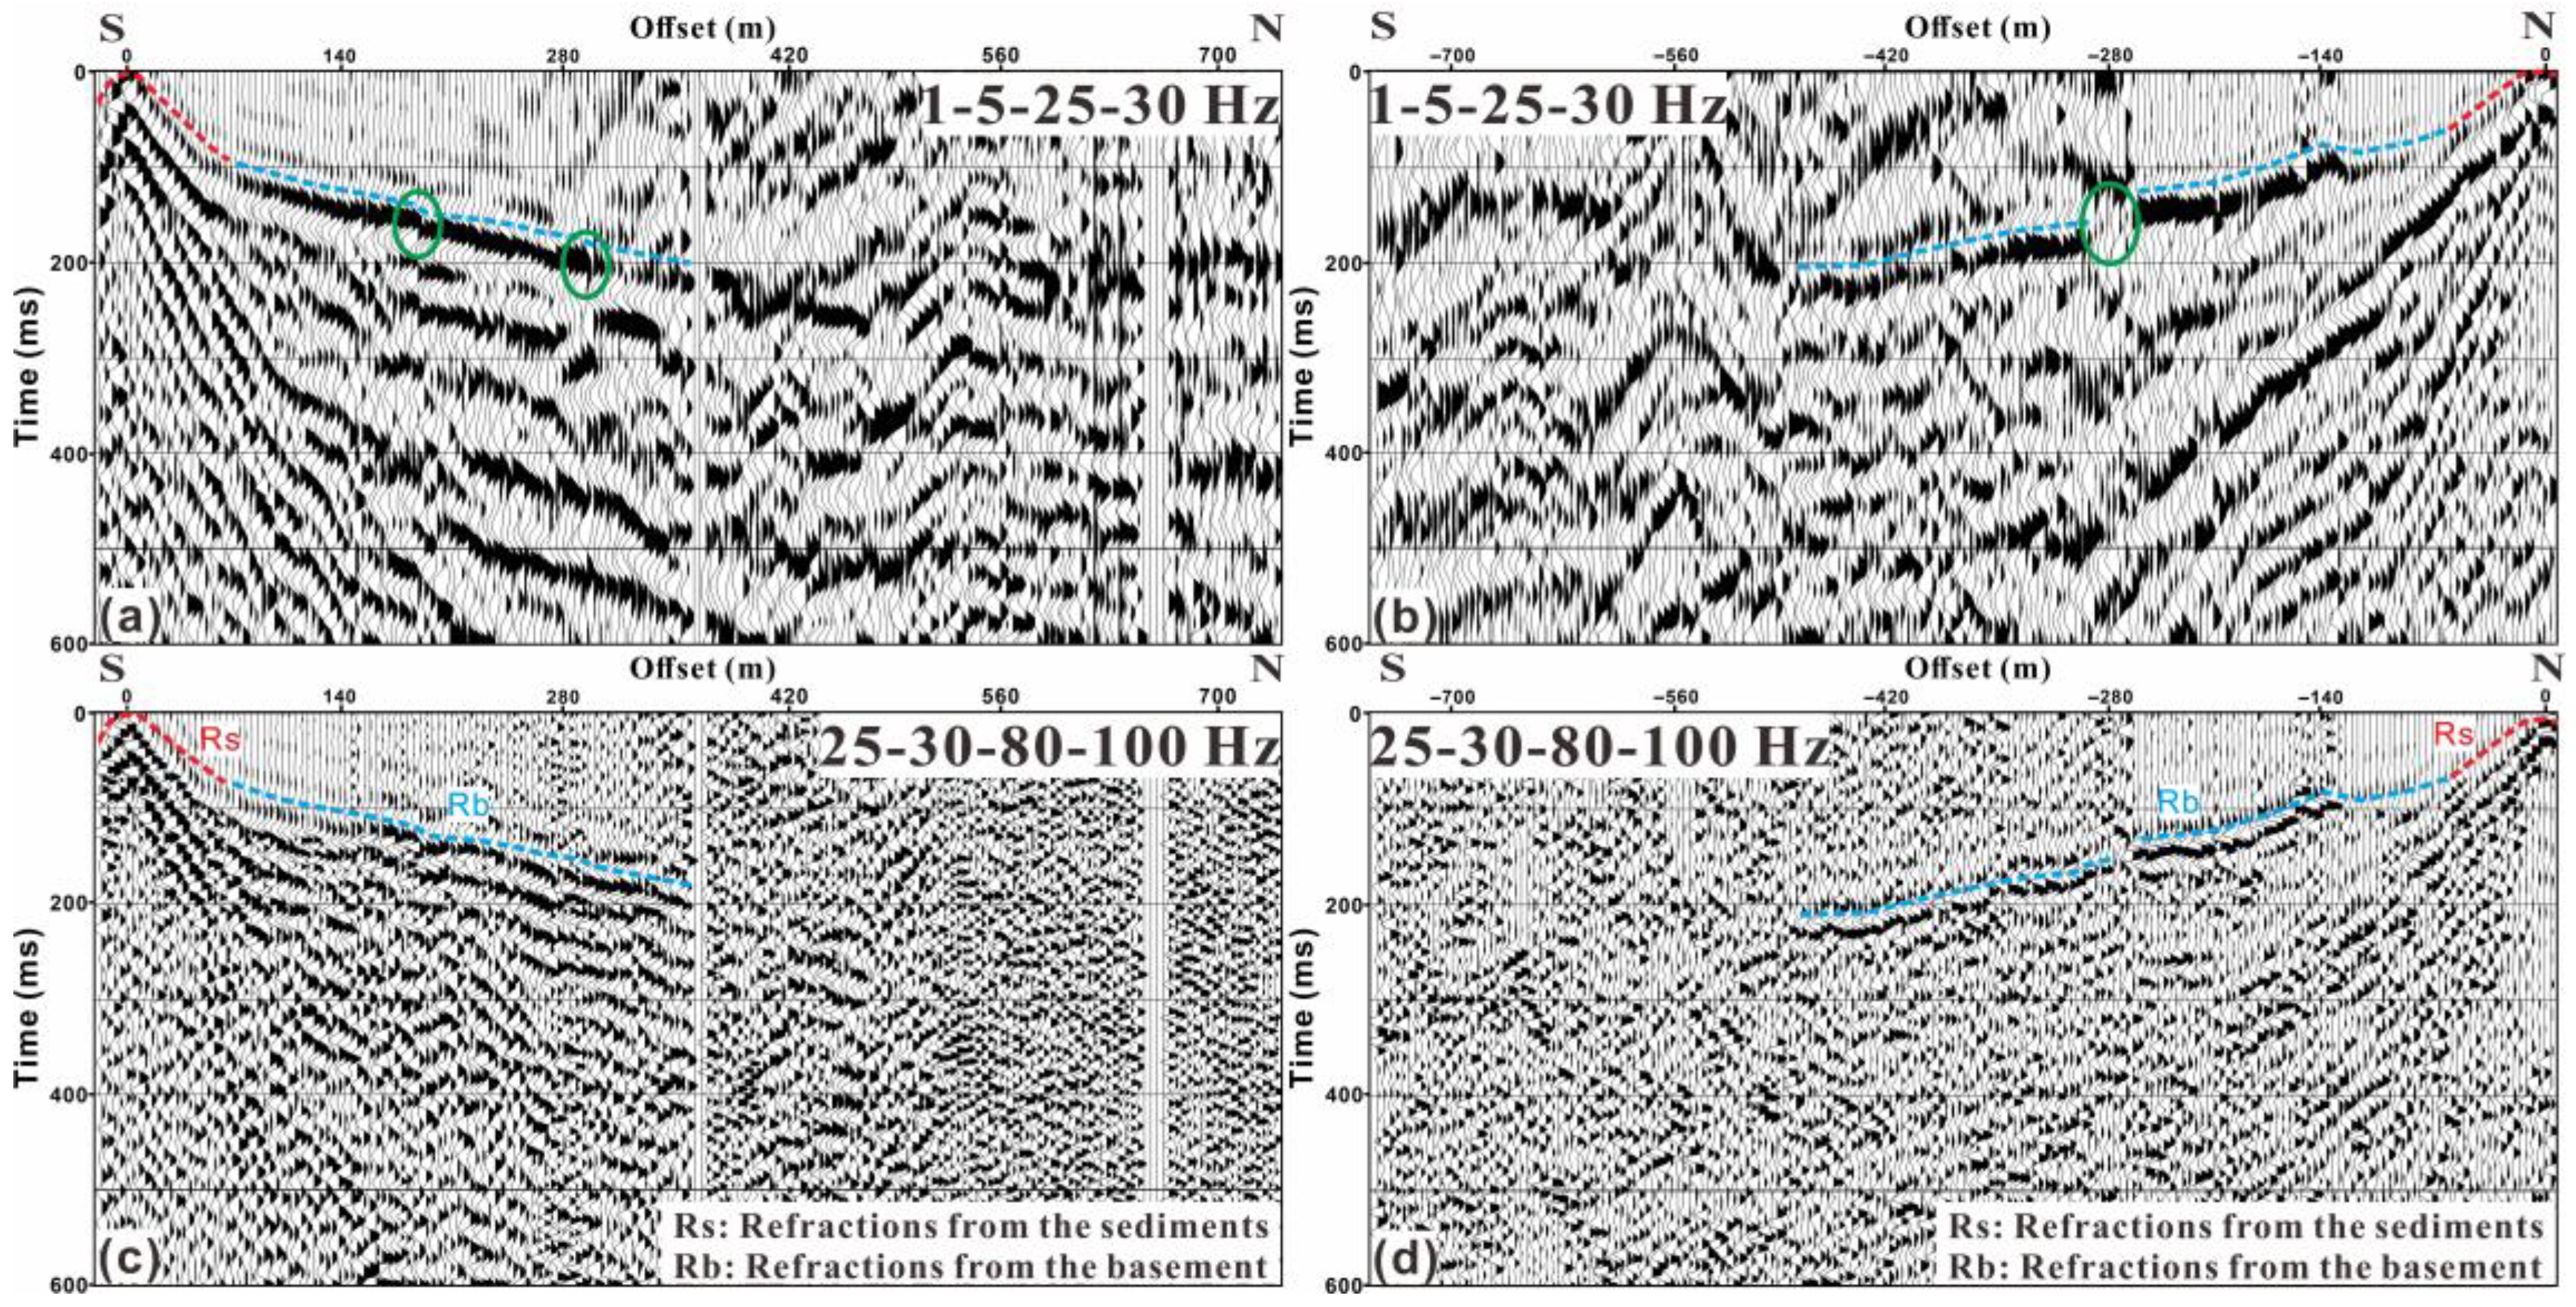
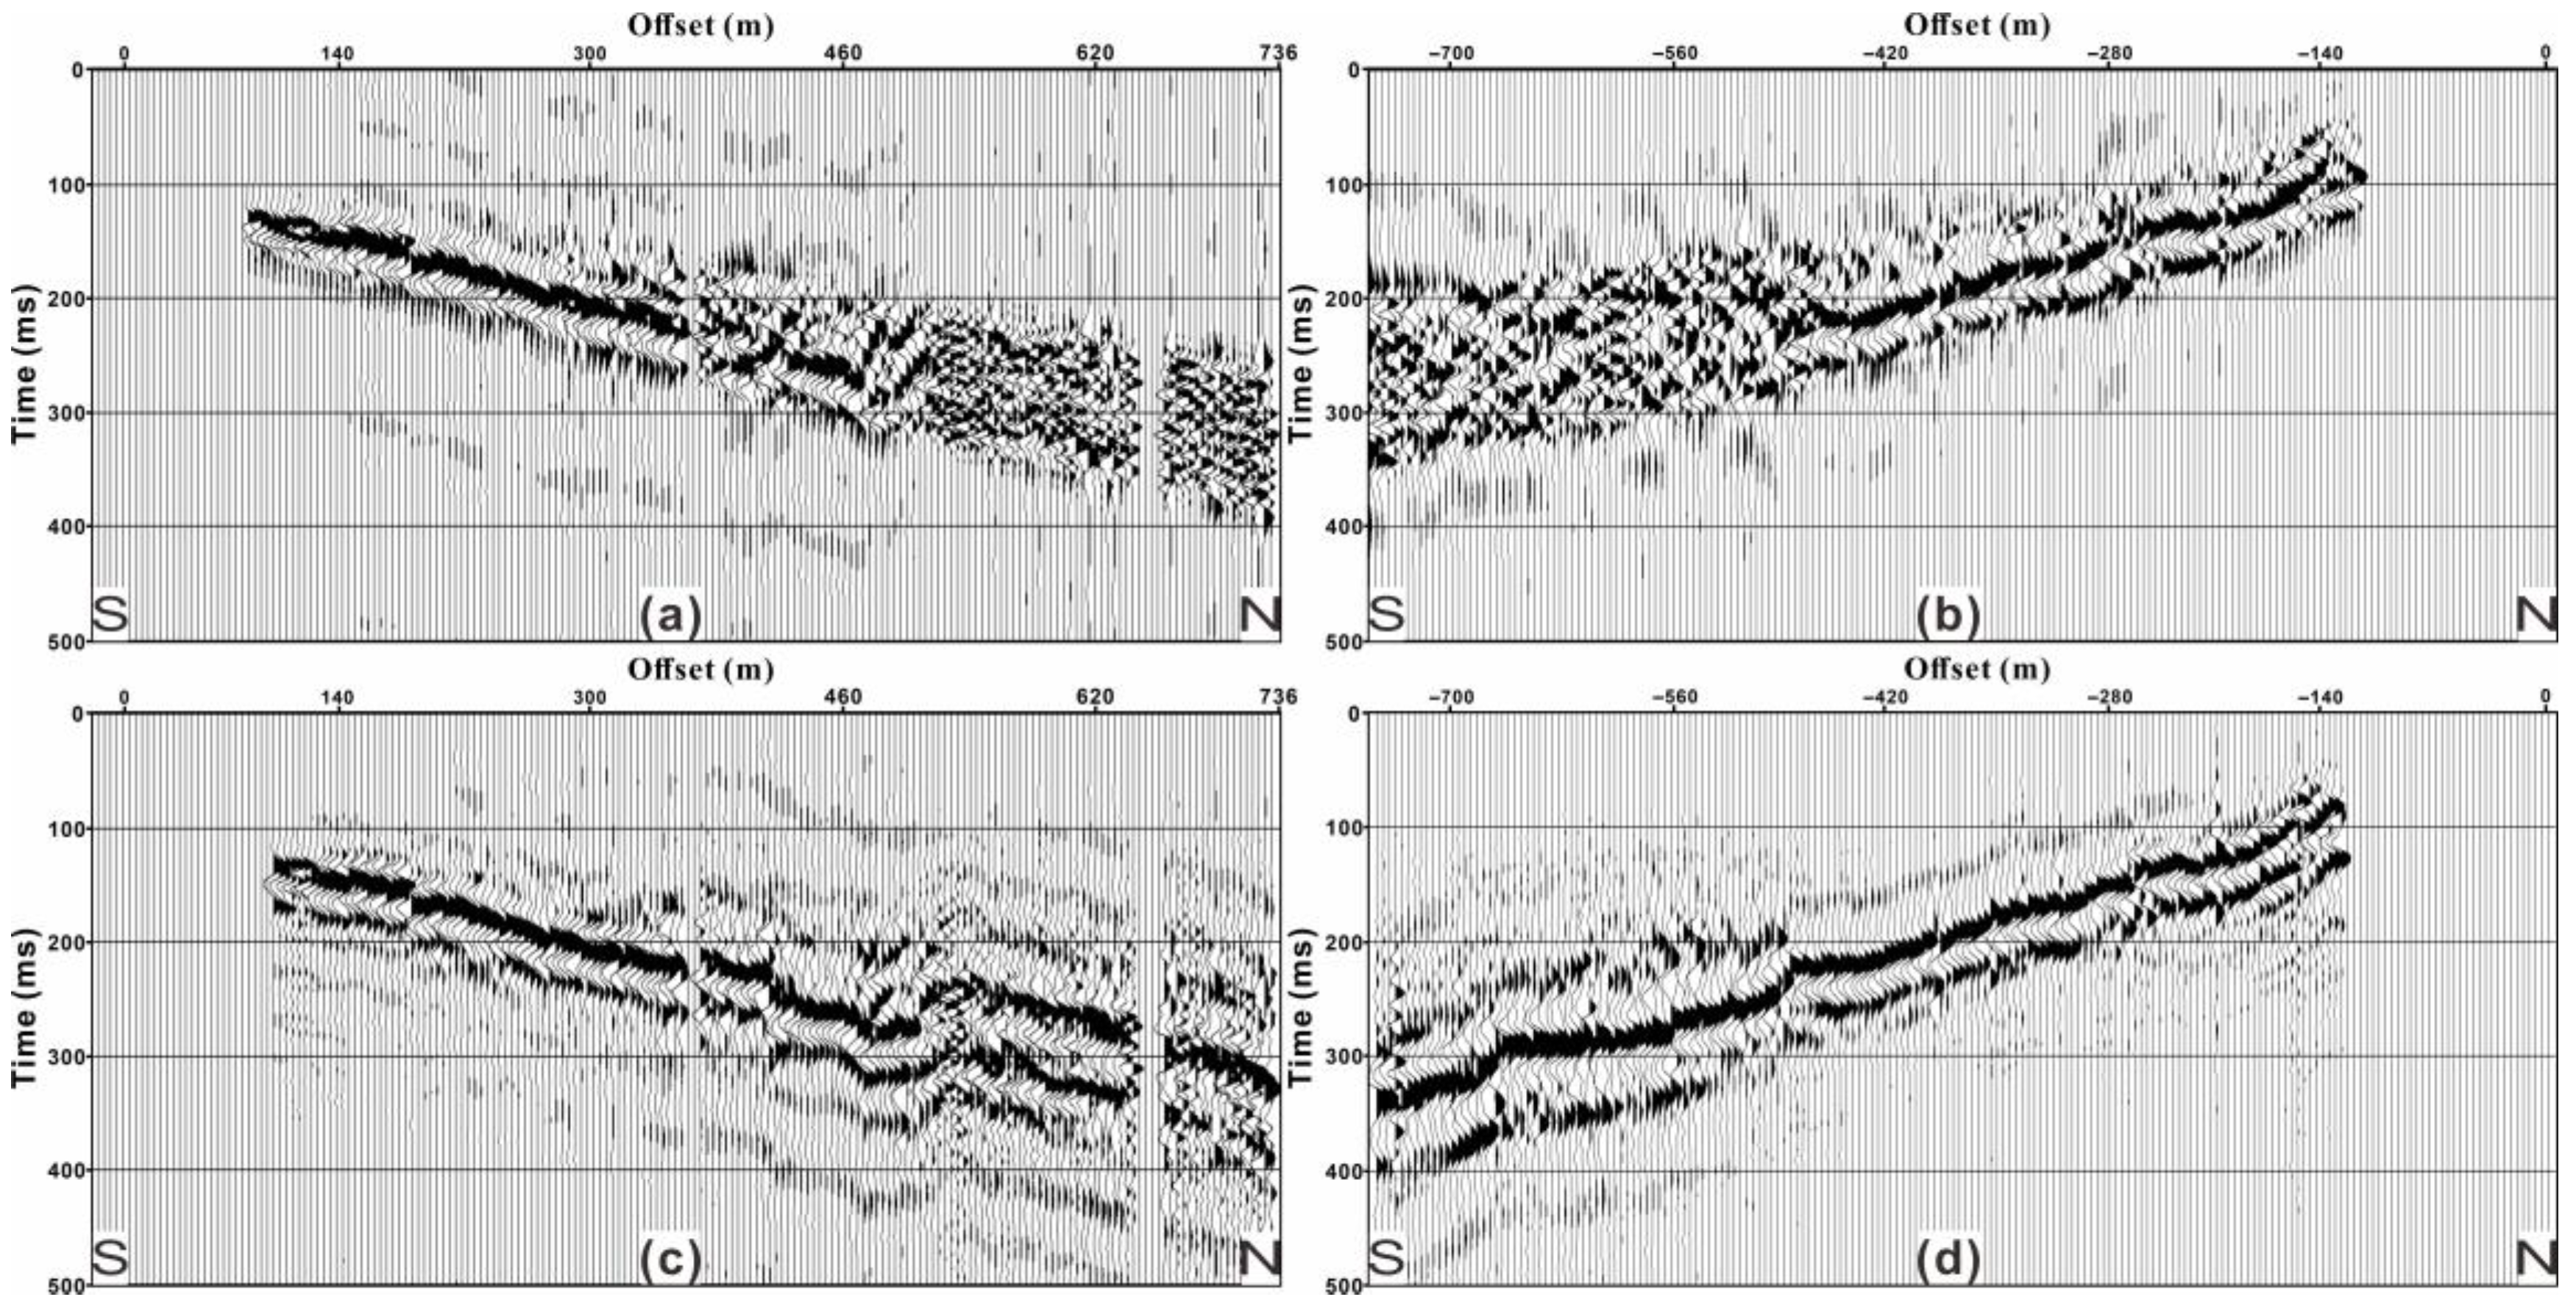
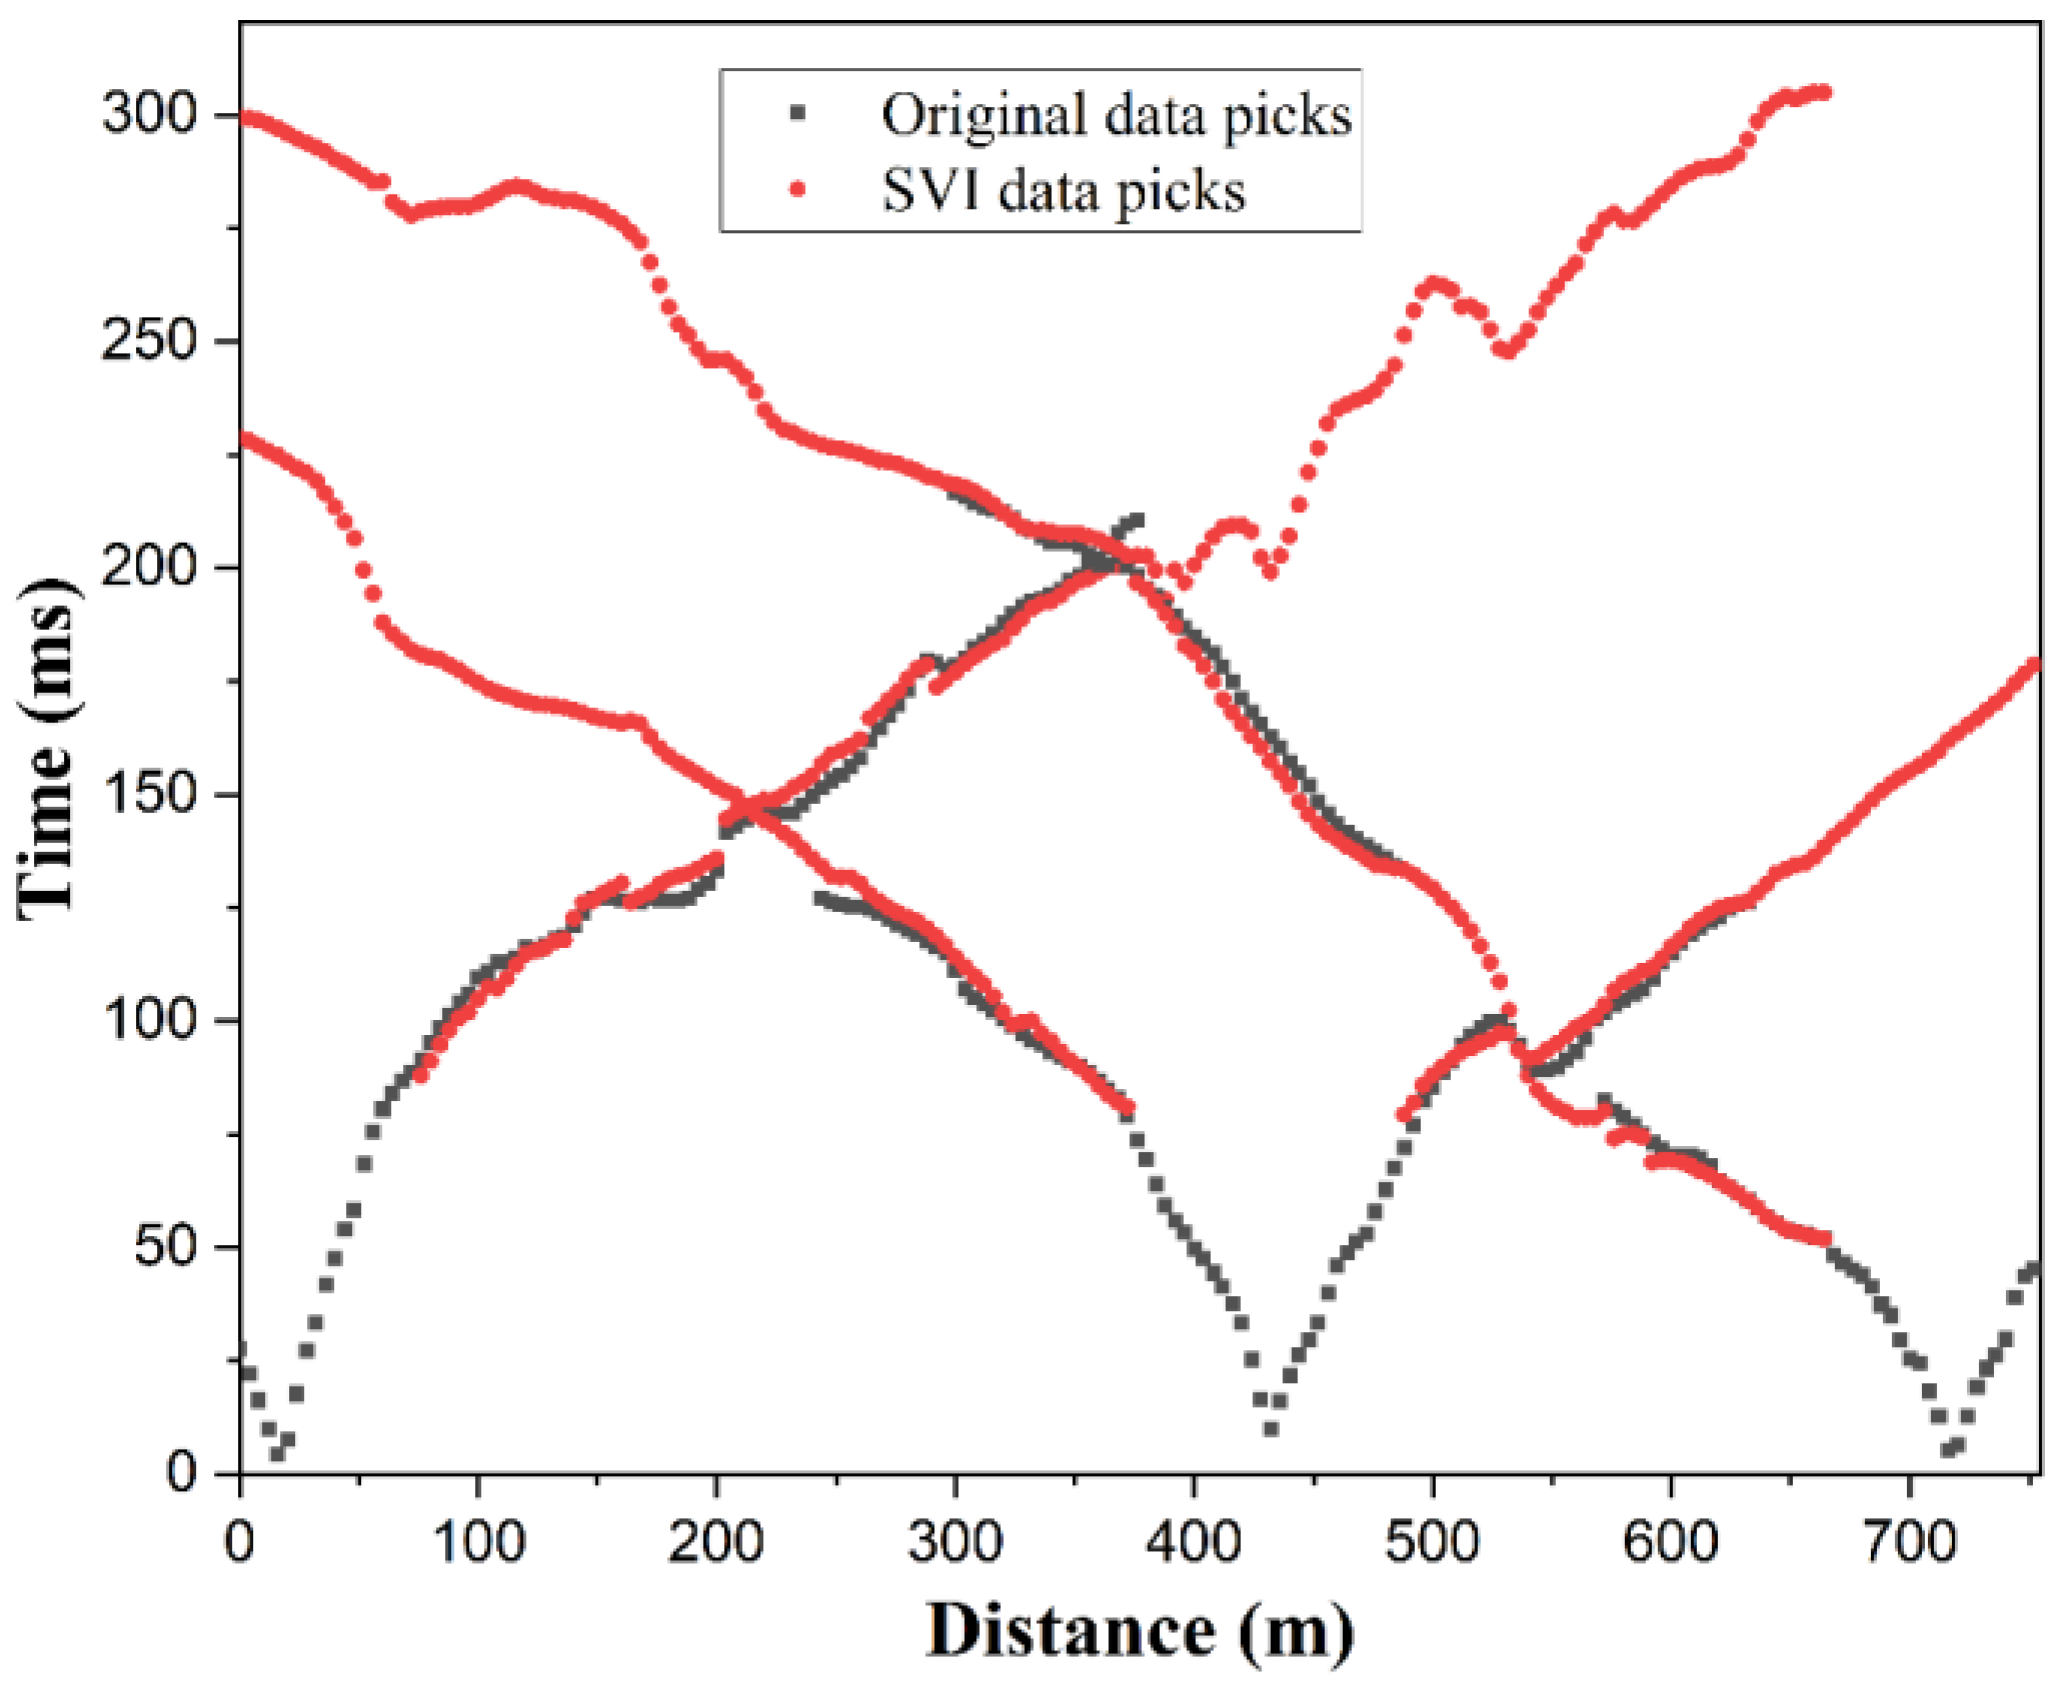
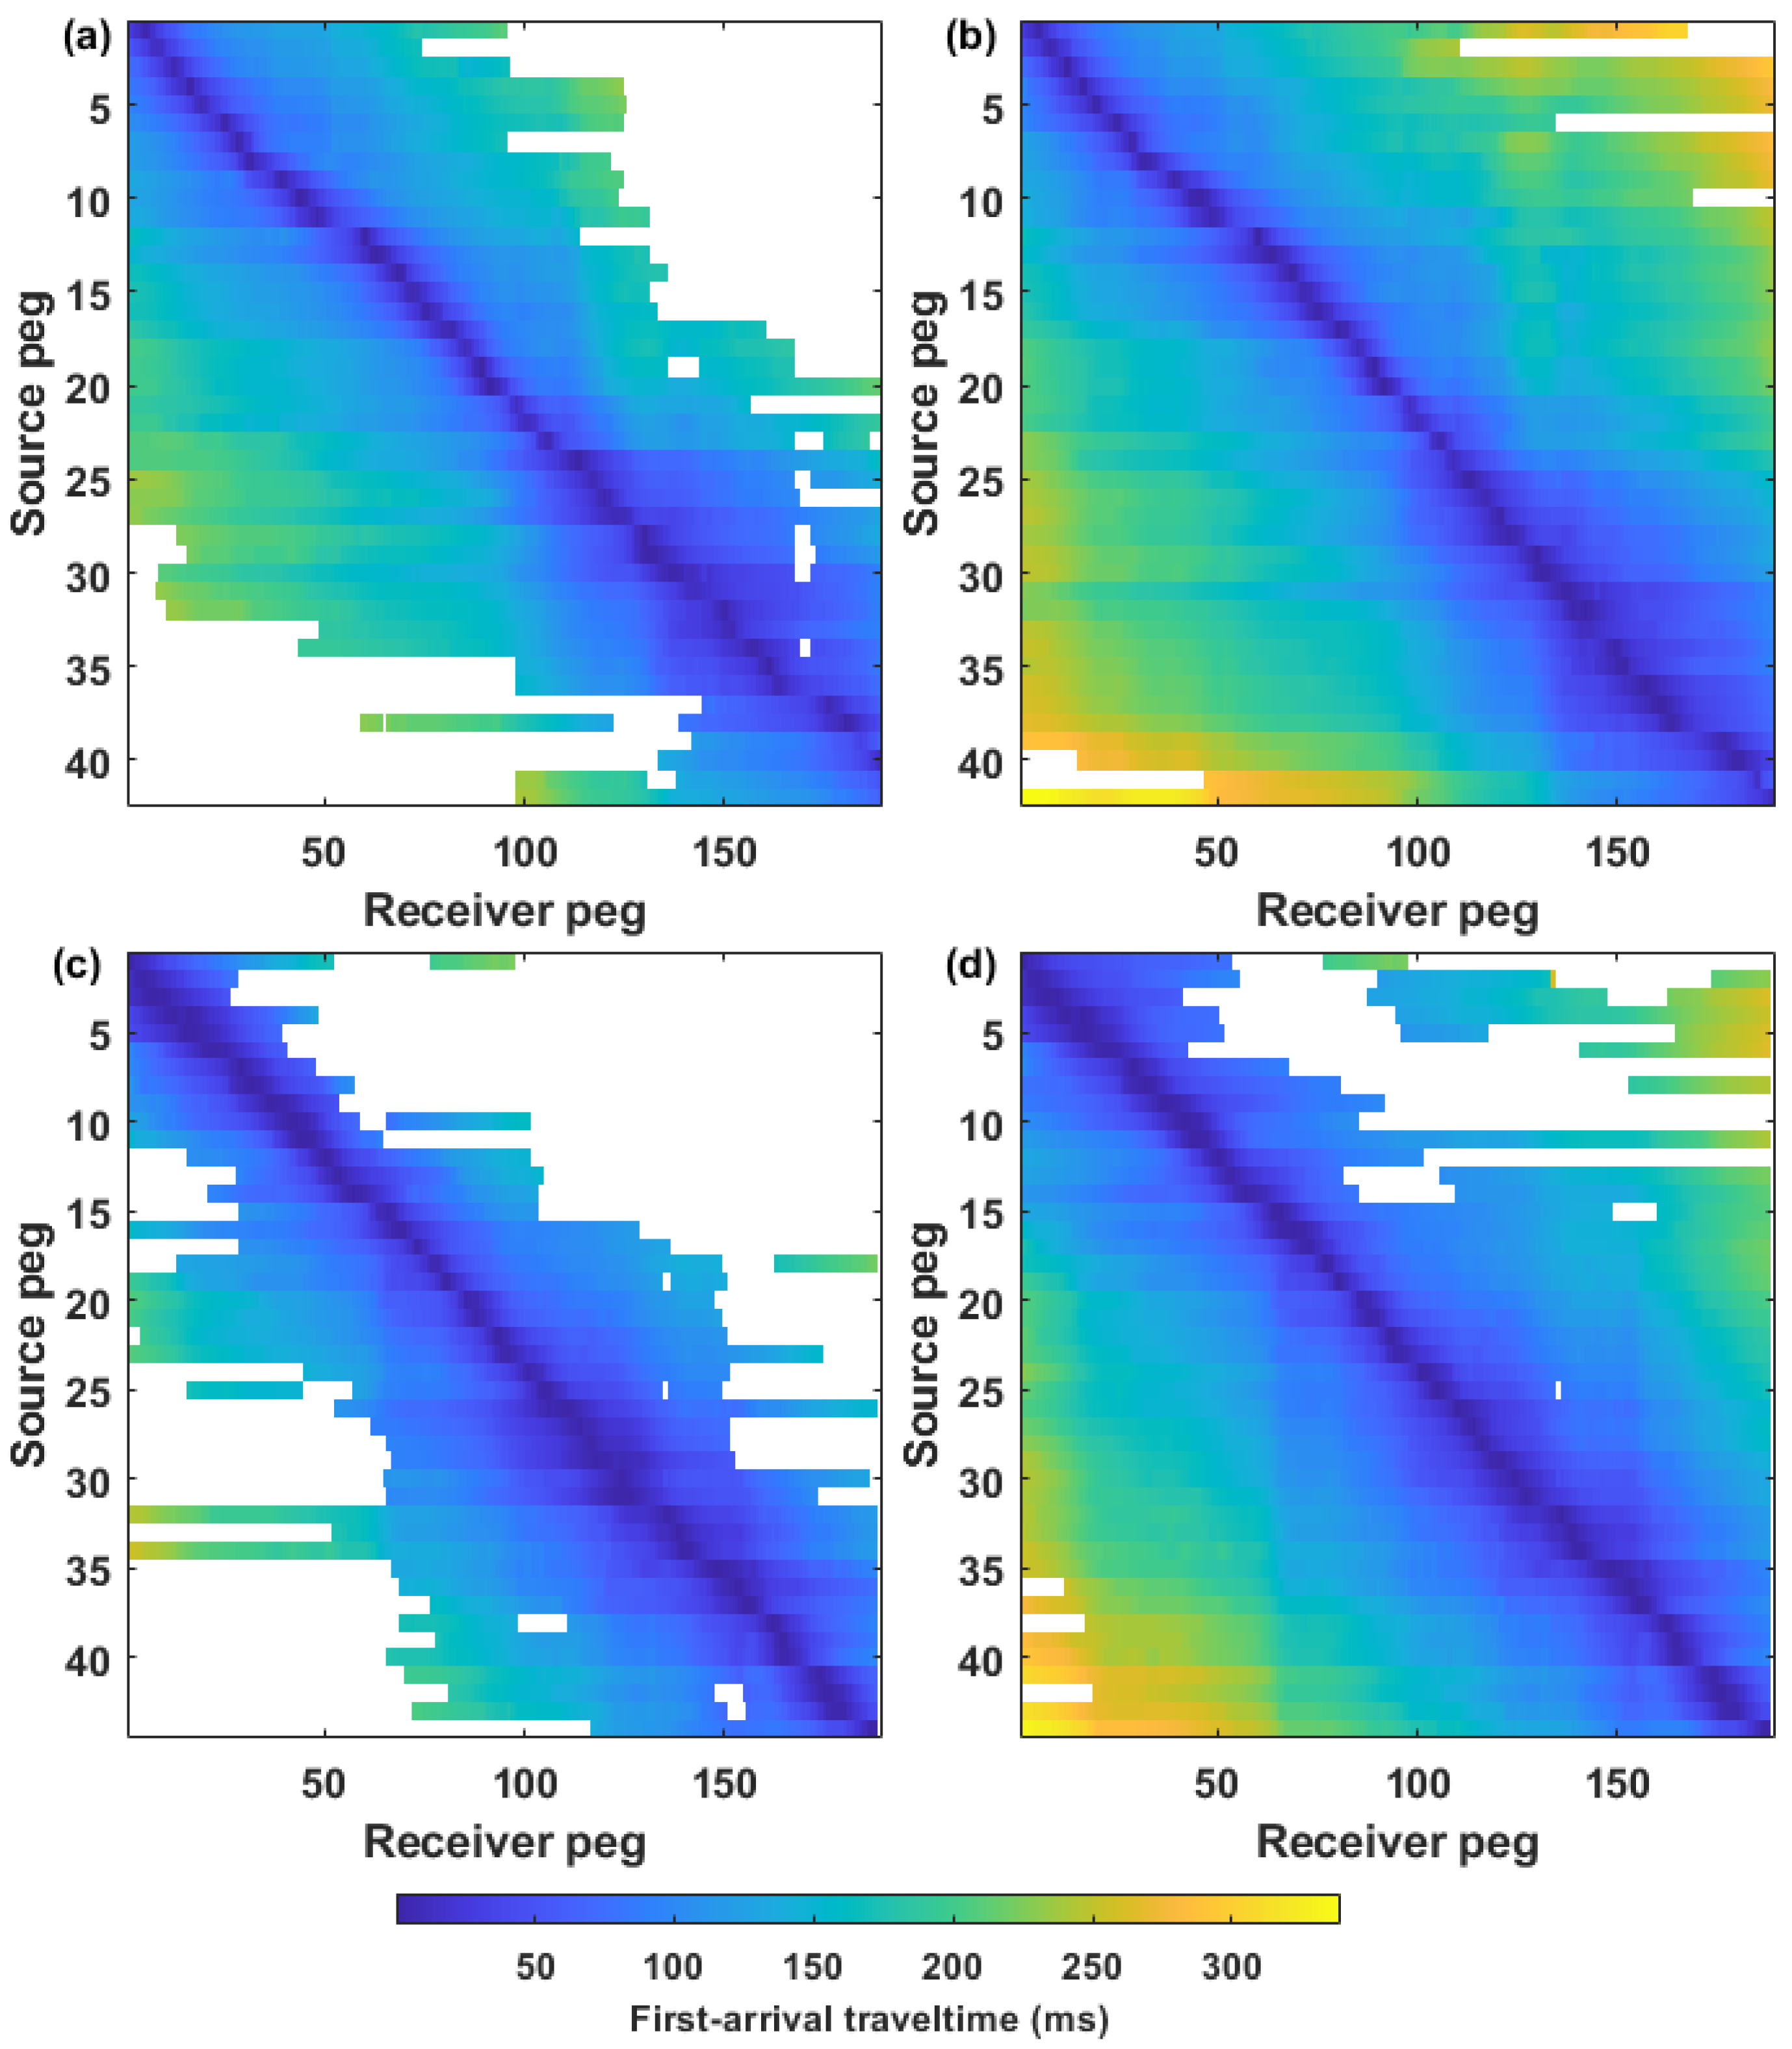
4.1. Supervirtual Refraction Interferometry (SVI) Application and First-Break Picking

Following trace editing, the first arrivals at the far offset of the original data were restored using the method illustrated in Figure 2. First, to prevent SVI contamination from extraneous waves and artifact generation that might compromise reconstruction fidelity, a temporal windowing process was executed on the raw data. This procedure exclusively extracted the first-arrival signals that embodied the refracted waves (Figure 5a,b). The more concise the window encompassing the refracted wave, the more accurate the outcome. The windowed data were then subjected to crosscorrelation and stacking to obtain the virtual refraction wavefields for different shots. Recognizing that crosscorrelation can broaden the source wavelet and finite-recording aperture, which might lead to a decrease in spatial resolution, a wavelet deconvolution filter was employed to mitigate the impact after acquiring the virtual refraction [29]. In addition, during the first SVI step, crosscorrelation can be substituted by crosscoherence. This alternative proved to be more stable in noisy datasets and remained less susceptible to source-signal perturbations [8]. Subsequently, supervirtual refractions with high SNR were reconstructed through convolution and stacking in the receiver domain (Figure 5c,d). It is evident that a substantial portion of the far-offset traces in the raw shot gathers were disturbed by pronounced noise, obstructing accurate first-arrival picking. Nonetheless, after the SVI processing, the contaminated first-arrival signals were successfully recovered. This process not only amplified the energy significantly but also attenuated the noise, conferring remarkable continuity with the original first arrivals.
After implementing the SVI and improving data quality, most of the first arrivals were manually picked. To corroborate selected traveltime precision in the SVI data, Figure 6 compares the traveltime differences between the original data and those picked from the supervirtual reflections. The congruity between these datasets is strikingly obvious, with only a small error, indicating that the SVI method does not alter the original data traveltime but only increases the refraction SNR. Within the near-offset range, only the original data were selected because the SVI data lacked traveltime picks owing to direct-arrival muting during processing. In contrast, for the original data collected at far offsets, the traveltime pickable range was limited, whereas the SVI data encompassed almost the entire line. The final tomographic imaging relied upon traveltime picked from both the original data within the near-offset range and the SVI data from far offsets, as this combination ensures both reliable shallow coverage and improved resolution at greater depths.
Figure 7 shows the selected traveltime matrix for the original and SVI data along the two lines. From the Line 1 raw data of Figure 7a, it is clear that the initial 20 shot gathers mainly lack traveltime after the 130th trace, probably because of near-surface topographic variations and attenuation effects. Starting from the 35th shot onwards, there was a notable absence of traveltime before the 98th trace. In Line 2, this situation was exacerbated, as the shot records in the middle of the line could not pick up the traveltimes of all traces. Overall, 5593 and 4523 picks were collected from the original Line 1 and 2 datasets, accounting for approximately 70 and 57% of the available seismic traces (representing 2345 and 3415 missing picks), respectively. Several picks were discarded at both ends, even in the middle of the seismic line. However, following SVI implementation, the number of picked traveltimes increased to 97 and 91% for Lines 1 and 2, accumulating 7701 and 7206 pickable traces, respectively. Most shots gathered improved significantly, with a noticeable increase in the number of picks. This enhancement extends to the furthest reach of the survey line, encompassing all conceivable positions (Figure 7b,d). Higher pickable trace percentages after SVI indicate improved data continuity and greater inversion depth potential. A comparison of selected traveltimes demonstrates that the data processed via SVI can support subsequent tomographic imaging, ensuring results accuracy.

4.2. First-Arrival Traveltime Tomography
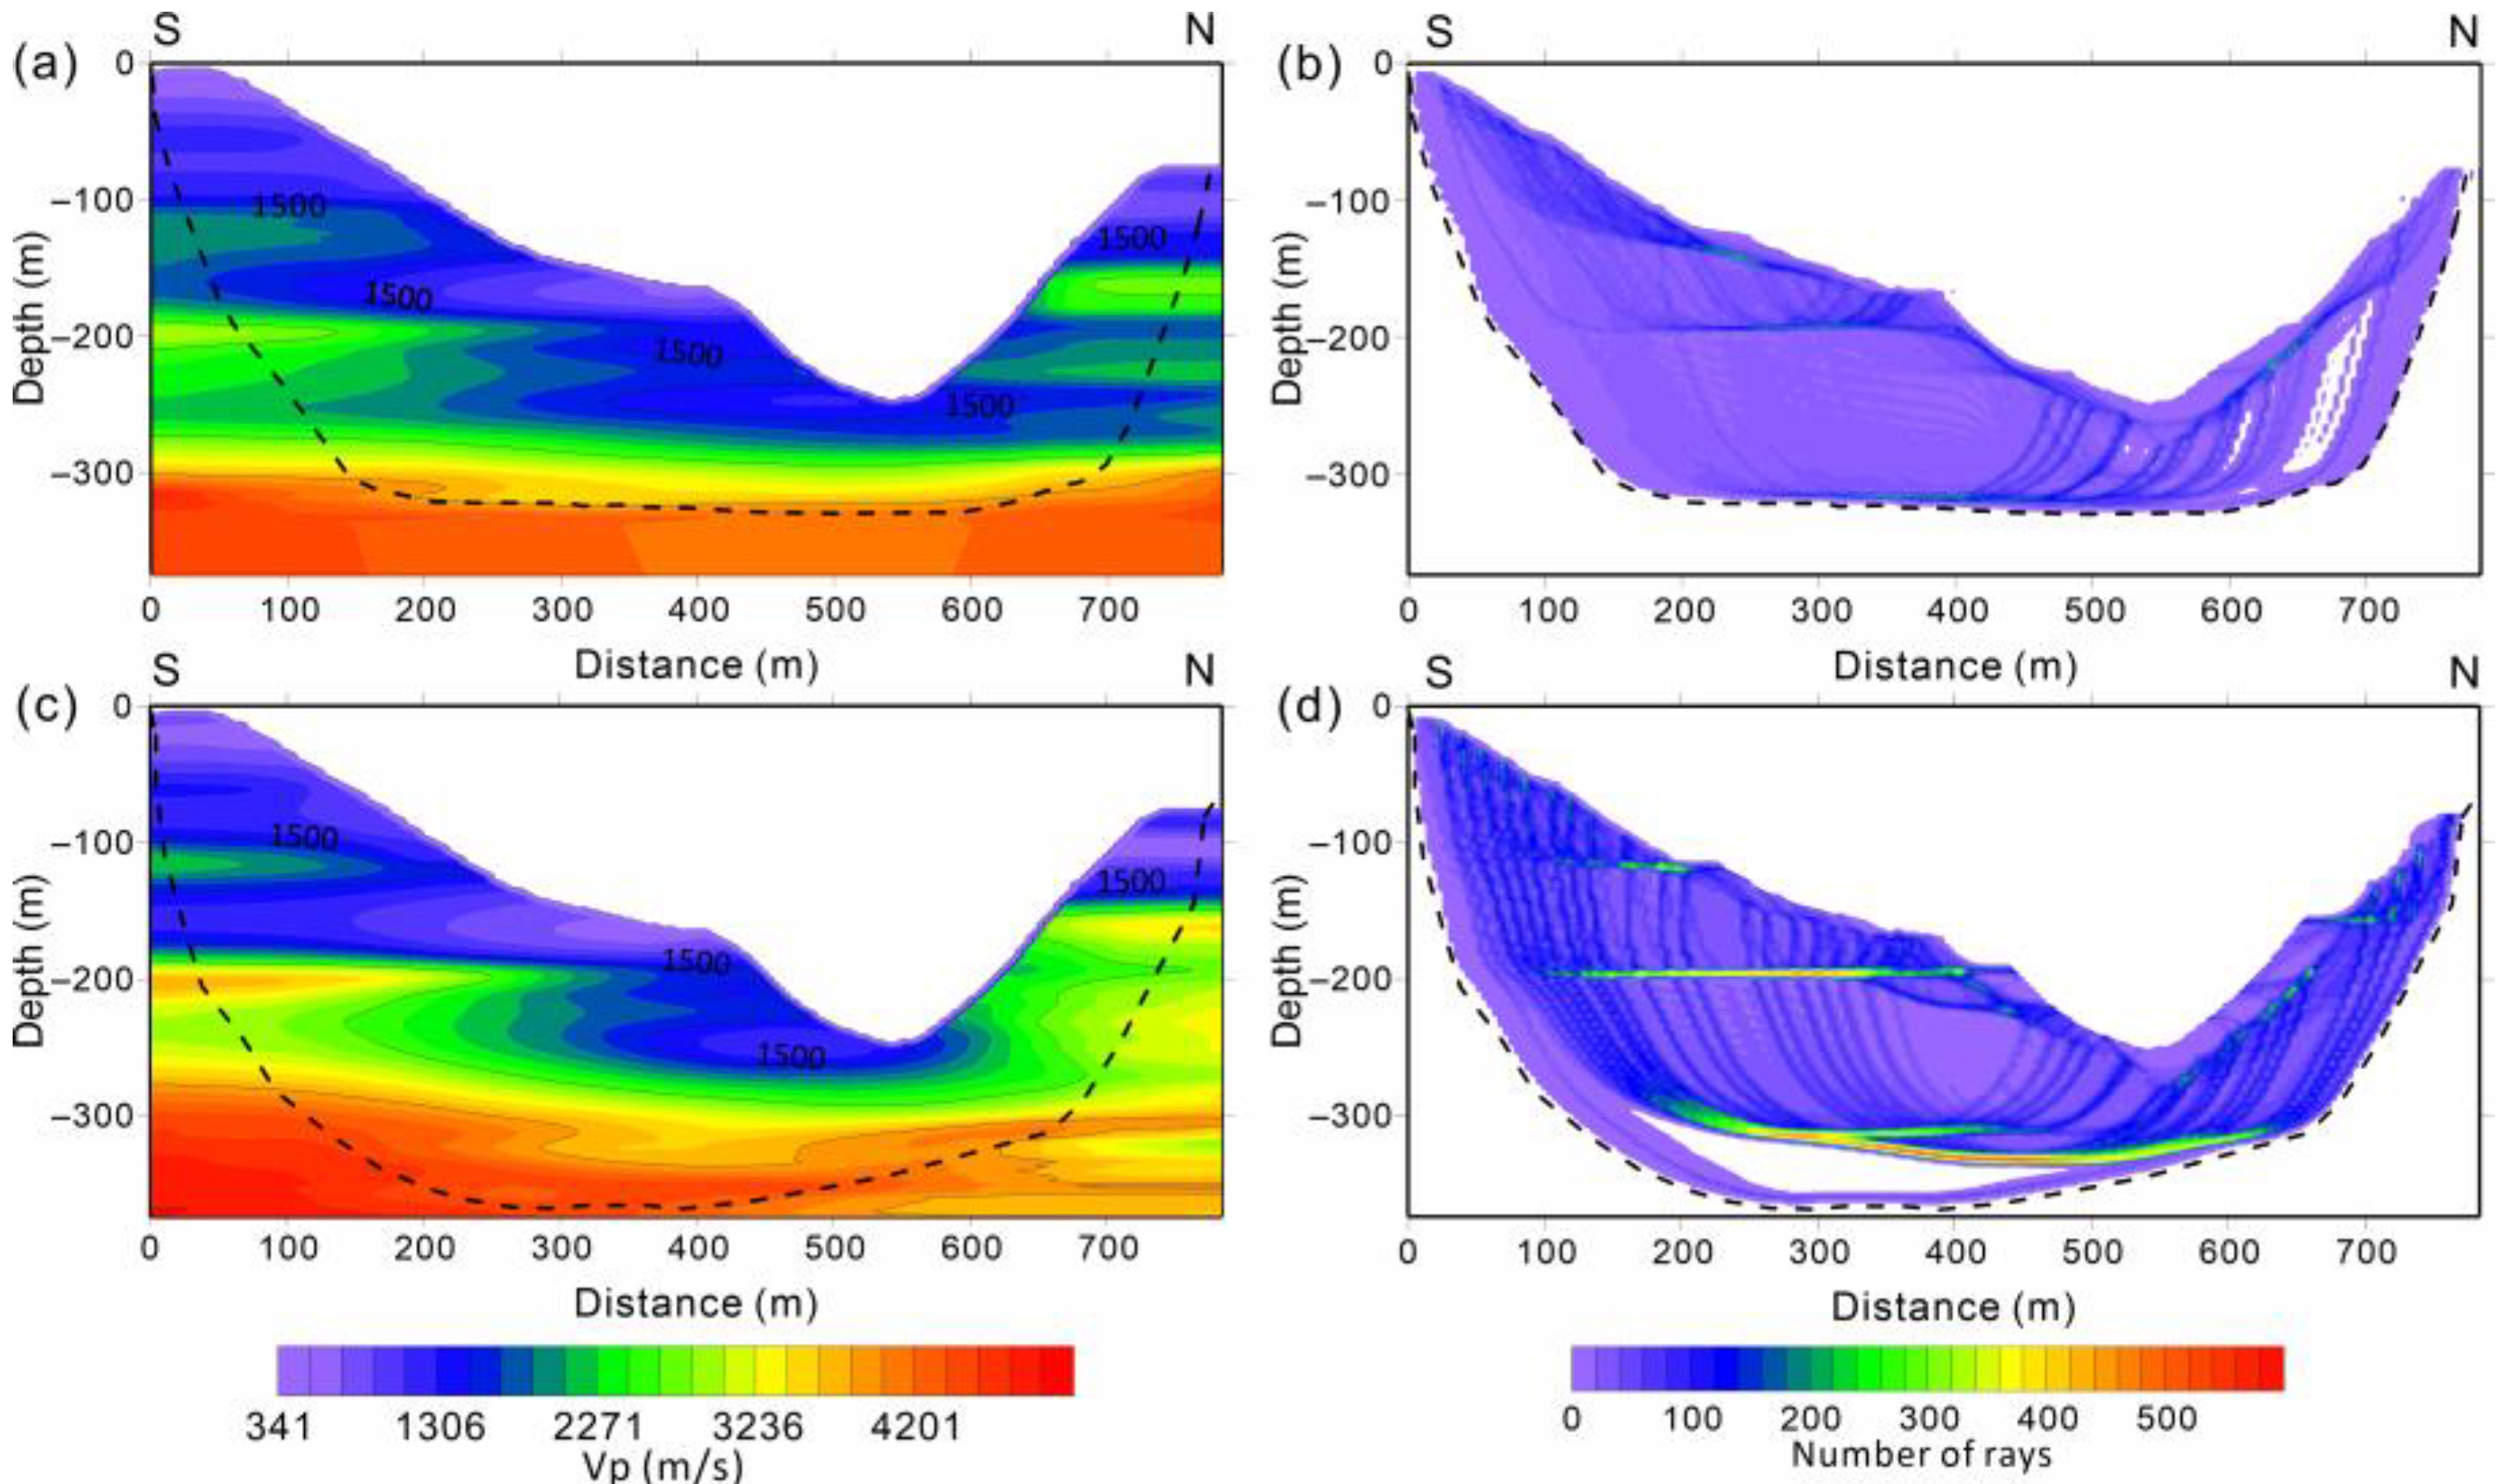
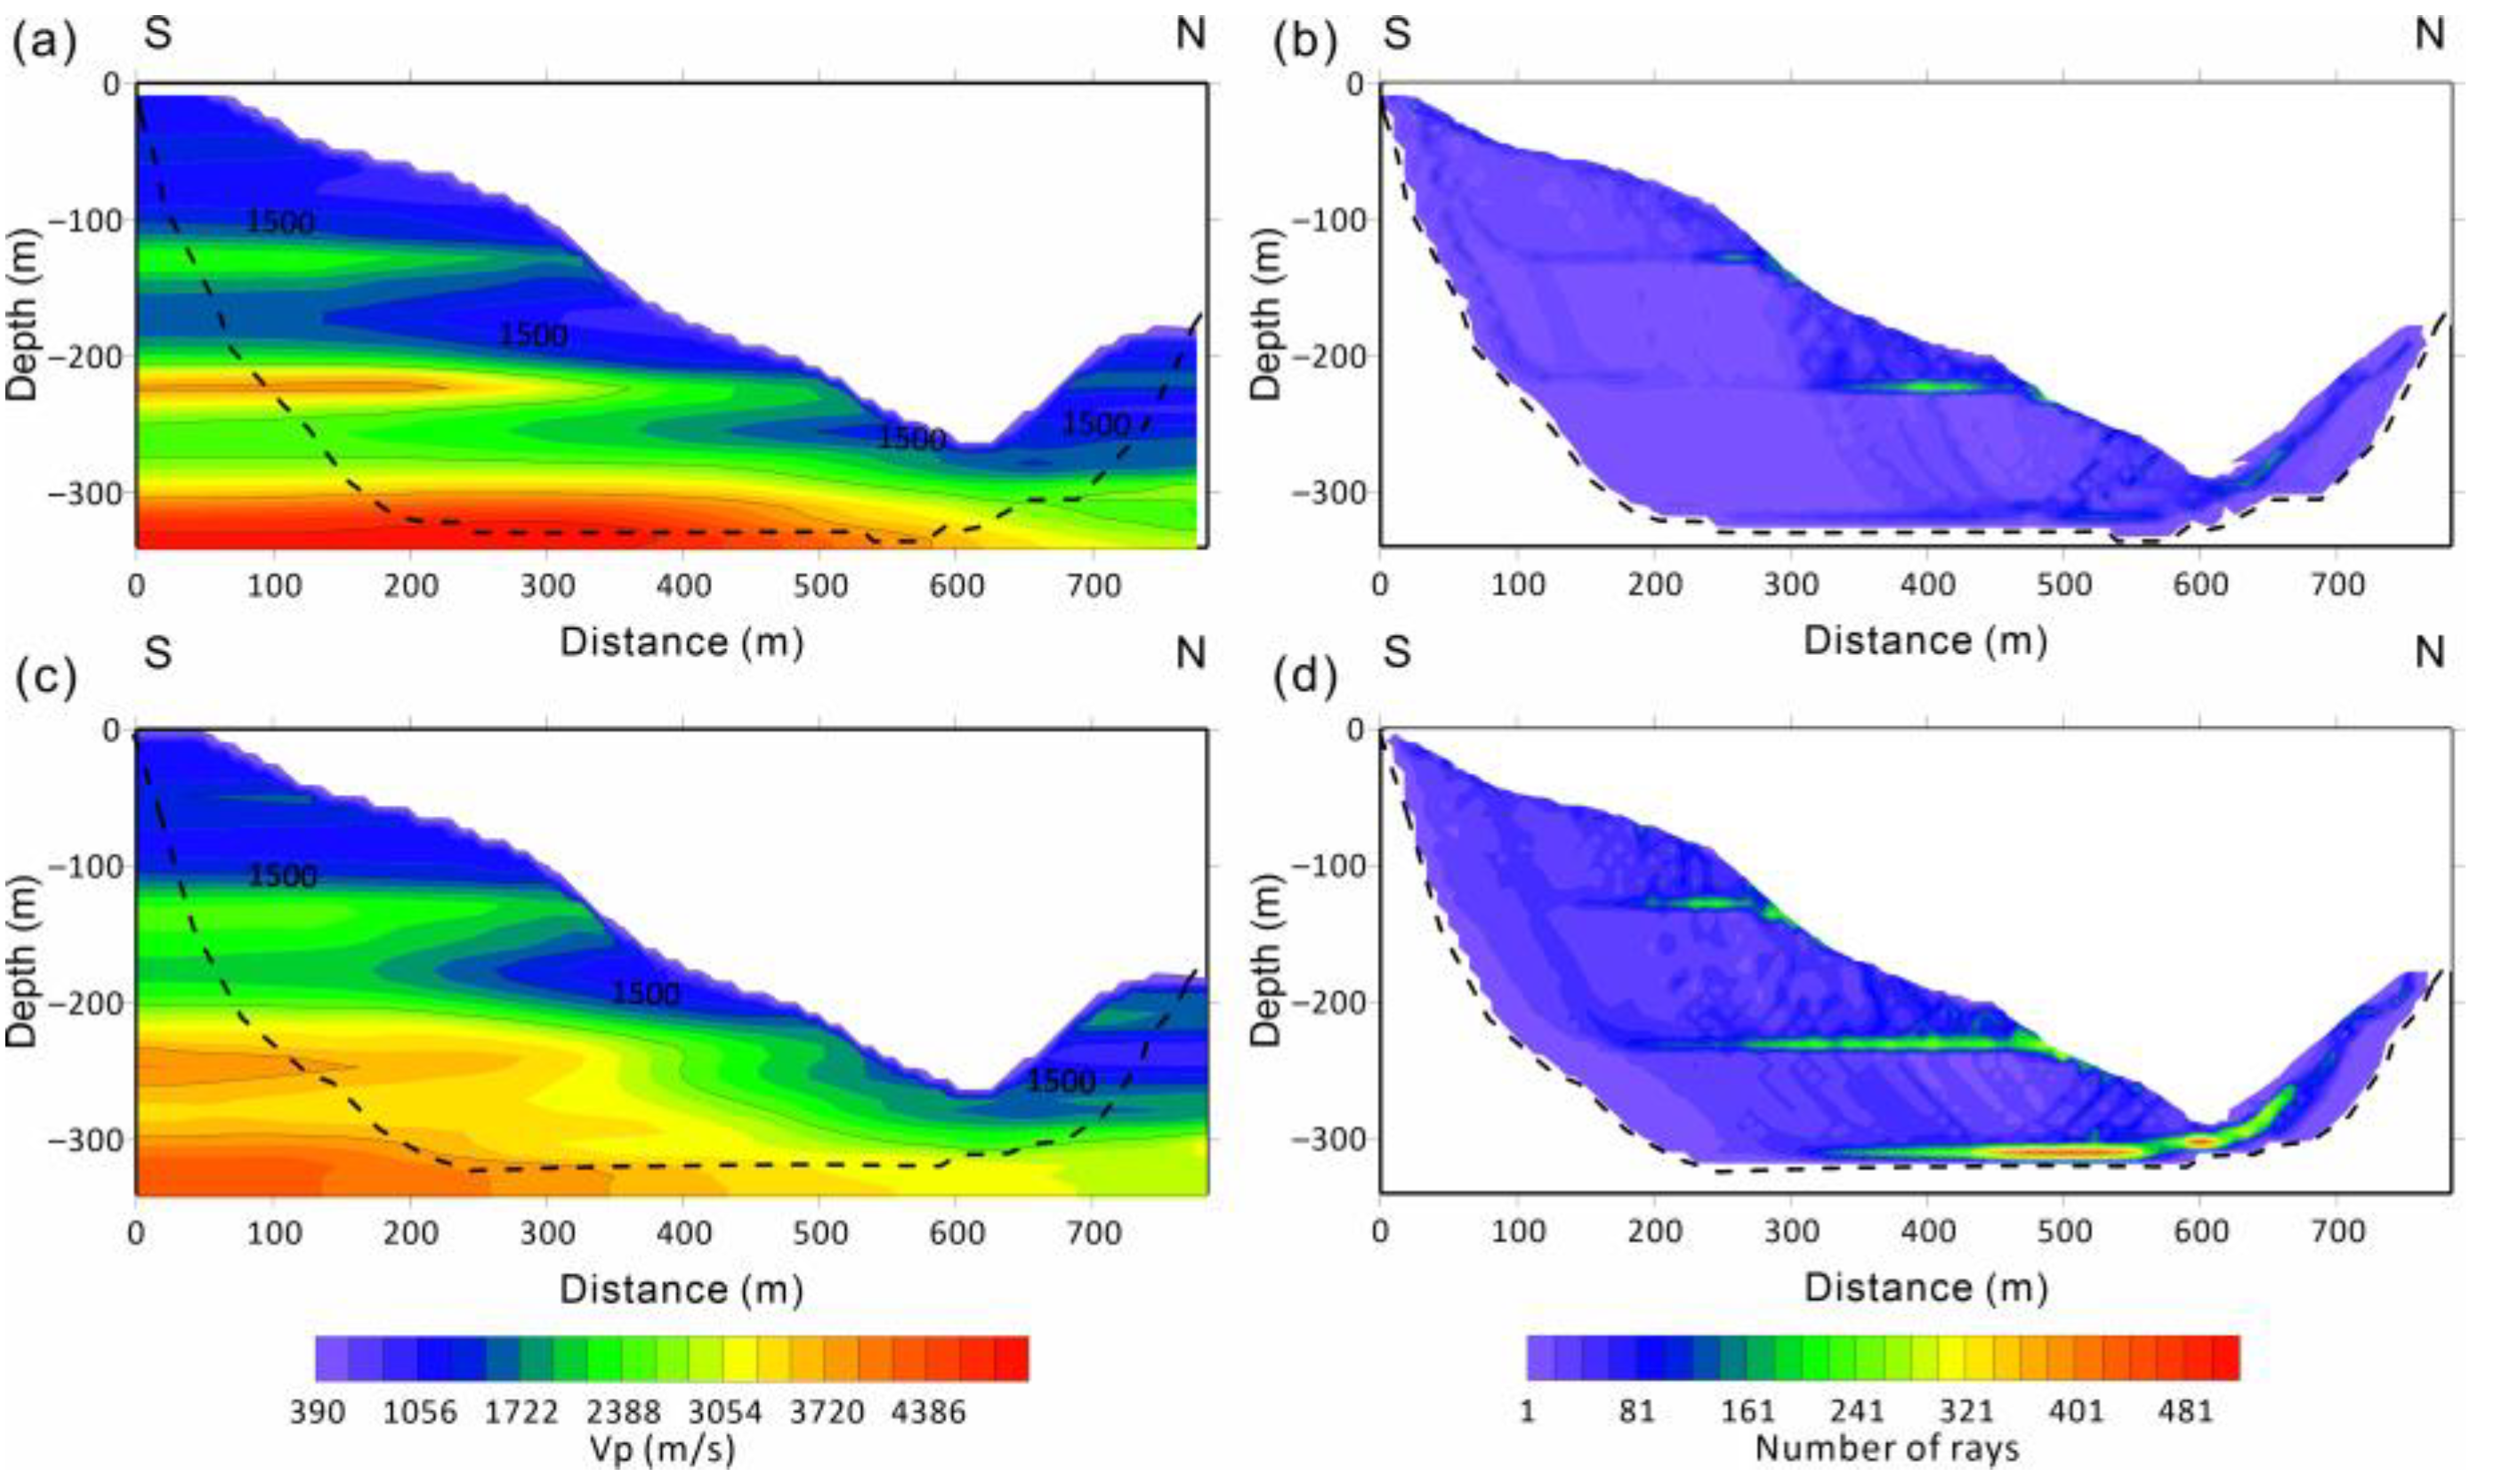
This study investigated the effect of traveltime picks on results before and after the SVI application. For comparison, the same initial model was used for both sets of traveltime data for both lines. The initial velocity was set to increase linearly from 350 to 3000 m/s. The cell size was set at 2 m in the vertical direction and 4 m in the horizontal direction. The inversion process was performed for 20 iterations. Figure 8 and Figure 9 show the final results derived from the raw and supervirtual data in Lines 1 and 2, respectively. In Figure 8b, the ray density in the raw first arrivals is characterized by a maximum number of 250 and a 330 m maximum depth, whereas after processing, the number can extend up to 590, with a 366 m depth. The number of rays increased considerably, as shown in Figure 9b. However, the improvement in traveltimes at far offsets may have been limited, resulting in no substantial increase in depth. The ray density notably increased at distances of 100 and 700 m, improving the artifacts of transverse banding in the original velocity profile. Ray-dense zones formed mainly near depths of 120, 200, and 310 m on both lines and were characterized by distinct stratigraphic features. Concerning the velocity profiles, both results reveal the presence of high-velocity interfaces near the three aforementioned depths, whereas Figure 8c and Figure 9c reveal more details. They provide a clearer characterization of the velocity anomaly, enabling more precise low-velocity zone delineation at an approximate distance of 400 m and a sharper depiction of the high-velocity subsurface structures between 600 and 650 m in Line 1. As anticipated, it is evident that the SVI method increases the number of additional traveltime picks, thereby improving the ray density and tomographic imaging accuracy, enhancing resolution and reliability.
A qualitative comparison of SVI-processed and raw datasets indicates significant improvements in data continuity and coverage. While a full uncertainty quantification was beyond the scope of this study, the SVI enhancement increased pickable traveltimes by approximately 30–40%. The general error of traveltime picks was visually verified to be within ±5 ms, supporting the reliability of the tomographic images.

4.3. Results

Figure 10 shows the borehole logs and geotechnical parameters obtained from drilling. As discerned from the figure, the shallow moraine deposit aligns congruently with the low-velocity zone delineated in the velocity profile, and the high-velocity anomaly correlates with the bedrock stratum at substantial depths. This correspondence further corroborates the accuracy of the results derived from the traveltime tomography, underpinned by the SVI method.
The bedrock and diverse geotechnical strata depths were determined using drilling and traveltime tomography. Guided by the definitive variations in the two P-wave velocity profiles, combined with borehole and geological surveys, a meticulous weathered layer boundary interface delineation in the study area was inferred, as shown in Figure 11. It is deduced that regions characterized by a P-wave velocity < 1300 m/s are indicative of weathering. As the depth increased, there was a notable increase in velocity, signifying a progressive improvement in bedrock quality. The inferred interface (depicted by the red dashed line in Figure 11) aligns closely with the borehole data (Figure 10), with a < ±2 m depth discrepancy. The velocity profile at the surface was markedly susceptible to topographical factors, resulting in disparities between the northern and southern slopes. On the southern slope, the shallow velocity was considerably lower, indicating a relatively thick overburden in this region. The northern slope exhibited a significantly thinner overburden, with the bedrock directly exposed to the surface approximately between 600 and 650 m along Line 1. In summary, areas characterized by steep slopes exhibit a thinner overburden layer, typically ranging from 1 to 10 m in thickness, whereas regions with gentler slopes feature a more substantial overburden, generally measuring > 40 m in thickness.
Beneath the overlying layers, specifically spanning distances of 350–570 m along Line 1, a conspicuous low-velocity anomaly manifests within an area of diminished topographical elevation, suggesting compromised bedrock integrity. Such low-velocity zones are commonly associated with fractured or faulted zones, as documented in similar mountainous settings [8,11,26]. The coincidence of topographic depression and velocity reduction further supports the interpretation of a fracture zone. Based on profile morphology, we deduced the existence of a fracture zone at a depth of approximately 250 m in this area. The fracture zone is frequently marked by rock fractures and deformations that impart a loose and brittle geological structure. Such conditions increase the potential for geological hazards, including rock collapse and surface subsidence, particularly during tunnel excavation. These disasters pose substantial threats to the stability and safety of tunnel projects. Consequently, when designing and constructing highway tunnels, it is imperative to avoid traversing this area and to enforce protective and contingency measures. The absence of a velocity anomaly along Line 2 at the same location indicates that the fracture zone did not extend to this region.

5. Discussion and Conclusions

A preliminary investigation of tunnel engineering is of paramount importance for highway construction. However, in mountainous terrains marked by intricate geological formations and substantial surface elevation variations, seismic data acquisition is both costly and inefficient. The quest for an appropriate seismic source remains a pivotal concern in the pursuit of high-quality seismic imaging. In this study, we employed an innovative UAV source to excite seismic waves to overcome the limitations imposed by surface conditions. The use of UAV sources presents an opportunity for aerial operations, avoiding damage to subterranean rock formations while providing the requisite seismic wave excitation for tunnel surveys. Combined with lightweight and efficient nodal geophones, this technology facilitates rapid, ecologically conscious, cost-effective, and high-quality data acquisition. Nonetheless, it remains incontrovertible that the impact object, when released from a high altitude by a UAV, may encounter sloping terrain or vegetative cover. In our survey area, based on the high-resolution topographic and land cover data, we estimate that approximately 10% of potential impact points fall within zones of steep slope (>40°) or dense vegetation, which could affect landing stability or cause partial energy loss. This highlights the importance of precise positioning and terrain-adaptive control strategies for future UAV-based seismic deployments. In these instances, the landing of the impact object influences the excitation energy, giving rise to issues such as secondary excitation. Intelligent control of landing coordinates represents a forthcoming research plan for UAV source technology, aiming to circumvent these challenges during impact object descent.
First-arrival traveltime tomography can reveal subterranean fracture zones and weathering strata features along the tunnel alignment using the P-wave velocity model. The attainment of high-quality traveltime is crucial for ensuring the effectiveness of tomographic reconstruction, accurate delineation of surrounding rocks, and identification of fault zones and other adverse geological structures. However, in practical datasets, we encountered the challenge of low first-arrival SNR at far offsets, a consequence of pronounced absorption and attenuation within shallow subsurface media. To address this issue, we deployed the SVI technique to enhance refractive signals effectively. This approach improves first-arrival pick precision and quantity, enriches ray density, and increases tomography depth, leading to more reliable imaging. The results unequivocally demonstrate its commendable performance, even when confronted with an undulating surface terrain.
The P-wave velocity profiles from the two seismic lines, in conjunction with borehole data, revealed significant differences in both the longitudinal and transverse velocities on the northern and southern slopes. Notably, the weathered layer exhibited distinct variations in thickness, measuring only 1–10 m in areas with steep slopes, whereas in regions with gentler slopes, the thickness was generally > 40 m. Furthermore, an anomalous low-velocity region was observed along Line 1, which was identified as the fracture zone. This fracture zone has the potential to exert a profound influence on the stability of tunnel projects, necessitating meticulous scrutiny of the tunnel design and construction. This study serves as an essential reference and foundational framework for the secure execution of tunnel projects, effectively circumventing geological hazards.
This study demonstrates that UAV-based seismic sources combined with supervirtual interferometry offer a promising solution for subsurface imaging in forested and rugged terrains. The methodology is scalable and could be readily applied to other mountainous infrastructure projects, such as railway tunnels, hydropower facilities, and landslide hazard monitoring. However, practical deployment still faces operational constraints, including weather limitations (e.g., strong winds, heavy rain) and UAV battery life, which can restrict flight time and operational range. Additionally, while the overall cost is lower than conventional explosive methods, UAV platform maintenance and payload customization represent additional considerations for broader adoption.

Author Contributions

Conceptualization, R.Q. and J.Z.; methodology, J.Z.; software, Z.M., J.L. and X.L. (Xiaoqiong Lei); formal analysis, G.Z.; investigation, J.Z.; resources, R.Q.; data curation, J.Z.; writing—original draft preparation, J.Z.; writing—review and editing, Z.M. and X.L. (Xu Liu); visualization, J.Z.; supervision, R.Q.; project administration, R.Q.; funding acquisition, R.Q. All authors have read and agreed to the published version of the manuscript.

Funding

This research was funded by the National Natural Science Foundation of China (Grant No. 42274193), the Second Tibetan Plateau Scientific Expedition and Research (Grant No. 2019QZKK0204), and the Science and Technology Innovation Program of Xiong’an New Area (2023XAGG0067).

Data Availability Statement

The data that support the findings of this study are available from the corresponding author upon reasonable request.

Acknowledgments

This work was supported by the High-Performance Computing Platform of China University of Geosciences (Beijing). We also acknowledge the equipment support provided by Smartsolo Incorporated. We sincerely thank the editor and the three anonymous reviewers for their valuable comments and constructive suggestions, which greatly improved the quality of this manuscript.

Conflicts of Interest

The authors declare no conflict of interest.

References

  1. Sun, H.; Zhang, N.; Li, D.; Liu, S.; Ye, Q. The first semi-airborne transient electromagnetic survey for tunnel investigation in very complex terrain areas. Tunn. Undergr. Space Technol. 2023, 132, 104893. [Google Scholar] [CrossRef]
  2. Liu, R.; Sun, H.; Liu, D.; Wang, X.; Zhou, X.; Zhao, Y.; Zhao, X.; Yang, Y.; Yang, G.; Sun, H. A joint application of semi-airborne and in-tunnel geophysical survey in complex limestone geology. Bull. Eng. Geol. Environ. 2023, 82, 226. [Google Scholar] [CrossRef]
  3. Qi, X. Three-dimensional inversion of controlled-source electromagnetic data for surveying the Jiutianshan high-speed railway Tunnel, China. J. Appl. Geophys. 2023, 209, 104901. [Google Scholar] [CrossRef]
  4. Xie, Z.Q.; Xiao, H.B.; Li, Z.Y.; Wang, Y.S. The Effectiveness Experiment Study on The Hidden Karst Detection Method of City Tunnel Engineering. Adv. Mater. Res. 2010, 168–170, 2416–2421. [Google Scholar] [CrossRef]
  5. Sogut, A.R.; Samba, N.J. Engineering geological investigations along the Meram railway tunnel, Konya, Turkey. Arab. J. Geosci. 2019, 12, 659. [Google Scholar] [CrossRef]
  6. Parsekian, A.D.; Singha, K.; Minsley, B.J.; Holbrook, W.S.; Slater, L. Multiscale geophysical imaging of the critical zone: Geophysical Imaging of the Critical Zone. Rev. Geophys. 2015, 53, 1–26. [Google Scholar] [CrossRef]
  7. Dong, L.; Pei, Z.; Xie, X.; Zhang, Y.; Yan, X. Early identification of abnormal regions in rock-mass using traveltime tomography. Engineering 2022, 22, 191–200. [Google Scholar] [CrossRef]
  8. Place, J.; Draganov, D.; Malehmir, A.; Juhlin, C.; Wijns, C. Crosscoherence-based interferometry for the retrieval of first arrivals and subsequent tomographic imaging of differential weathering. Geophysics 2019, 84, Q37–Q48. [Google Scholar] [CrossRef]
  9. Sloan, S.D.; Nolan, J.J.; Broadfoot, S.W.; McKenna, J.R.; Metheny, O.M. Using near-surface seismic refraction tomography and multichannel analysis of surface waves to detect shallow tunnels: A feasibility study. J. Appl. Geophys. 2013, 99, 60–65. [Google Scholar] [CrossRef]
  10. Pegah, E.; Liu, H. Application of near-surface seismic refraction tomography and multichannel analysis of surface waves for geotechnical site characterizations: A case study. Eng. Geol. 2016, 208, 100–113. [Google Scholar] [CrossRef]
  11. Babacan, A.E.; Gelisli, K.; Tweeton, D. Refraction and amplitude attenuation tomography for bedrock characterization: Trabzon case (Turkey). Eng. Geol. 2018, 245, 344–355. [Google Scholar] [CrossRef]
  12. Bery, A.A. High Resolution in Seismic Refraction Tomography for Environmental Study. Int. J. Geosci. 2013, 4, 792–796. [Google Scholar] [CrossRef]
  13. Tran, K.T.; Hiltunen, D.R. Inversion of Combined Surface and Borehole First-Arrival Time. J. Geotech. Geoenviron. Eng. 2012, 138, 272–280. [Google Scholar] [CrossRef]
  14. Jolly, A.D.; Chardot, L.; Neuberg, J.; Fournier, N.; Scott, B.J.; Sherburn, S. High impact mass drops from helicopter: A new active seismic source method applied in an active volcanic setting. Geophys. Res. Lett. 2012, 39, L12306. [Google Scholar] [CrossRef]
  15. Yordkayhun, S.; Na Suwan, J. A university-developed seismic source for shallow seismic surveys. J. Appl. Geophys. 2012, 82, 110–118. [Google Scholar] [CrossRef]
  16. Rashed, M.A. GDP: A new source for shallow high-resolution seismic exploration. J. Appl. Geophys. 2009, 68, 243–248. [Google Scholar] [CrossRef]
  17. Brom, A.; Stan-Kłeczek, I. Comparison of seismic sources for shallow seismic: Sledgehammer and pyrotechnics. Contemp. Trends Geosci. 2015, 4, 39–45. [Google Scholar] [CrossRef]
  18. Jain, V.; Ghosal, D.; Verma, S.N. Enhancement of a thumper source far offset refracted phases using super virtual interferometry (SVI). J. Earth Syst. Sci. 2020, 129, 136. [Google Scholar] [CrossRef]
  19. Liang, S.; Hu, T.; Cui, D.; Ding, P. Weak signal enhancement using adaptive local similarity and neighboring super-virtual trace for first arrival picking. J. Geophys. Eng. 2020, 17, 1005–1015. [Google Scholar] [CrossRef]
  20. Qian, R.; Li, J. Integrated System for Geological and Geophysical Survey Based on Unmanned Aerial Vehicle 2020. US20200393593A1, 17 December 2020. Available online: https://patents.google.com/patent/US20200393593A1/en (accessed on 7 November 2023).
  21. Ma, Z.; Qian, R.; Wang, Y.; Zhang, J.; Liu, X.; Ling, J. UAV source: A new economical and environmentally friendly source for seismic exploration in complex areas. J. Appl. Geophys. 2022, 204, 104719. [Google Scholar] [CrossRef]
  22. Ma, Z.; Qian, R.; Zhao, Y.; Huang, Y.; Wu, Z.; Zhang, J.; Liu, X. The aerodynamic assessment and shotpoint position accuracy of an unmanned aerial vehicle seismic source. Geophysics 2025, 90, P1–P12. [Google Scholar] [CrossRef]
  23. Mallinson, I.; Bharadwaj, P.; Schuster, G.; Jakubowicz, H. Enhanced refractor imaging by supervirtual interferometry. Lead. Edge 2011, 30, 546–550. [Google Scholar] [CrossRef]
  24. Bharadwaj, P.; Schuster, G.; Mallinson, I.; Dai, W. Theory of supervirtual refraction interferometry. Geophys. J. Int. 2012, 188, 263–273. [Google Scholar] [CrossRef]
  25. Bharadwaj, P.; Wang, X.; Schuster, G.; McIntosh, K. Increasing the number and signal-to-noise ratio of OBS traces with supervirtual refraction interferometry and free-surface multiples. Geophys. J. Int. 2013, 192, 1070–1084. [Google Scholar] [CrossRef]
  26. Place, J.; Malehmir, A. Using supervirtual first arrivals in controlled-source hardrock seismic imaging—Well worth the effort. Geophys. J. Int. 2016, 206, 716–730. [Google Scholar] [CrossRef]
  27. Xu, S.; Zou, Z. Supervirtual interferometry as a tool for slowness estimation of logging-while-drilling multipole acoustic data. IEEE Trans. Geosci. Remote Sens. 2023, 61, 1–16. [Google Scholar] [CrossRef]
  28. Li, Y.; Liu, L.; Lei, G.; Duan, W.; Zheng, D.; Wang, C. Application of yu’s wavelet and supervirtual seismic refraction interferometry to enhance first arrivals: A case study from kuche mountain. Interpretation 2023, 11, T503–T510. [Google Scholar] [CrossRef]
  29. Al-Hagan, O.; Hanafy, S.M.; Schuster, G.T. Iterative supervirtual refraction interferometry. Geophysics 2014, 79, Q21–Q30. [Google Scholar] [CrossRef]
  30. Qiao, H.; Zhou, Y.; Hanafy, S.M.; Liu, C. Iterative interferometric denoising filter for traveltime picking. Appl. Sci. 2024, 14, 733. [Google Scholar] [CrossRef]
  31. Su, Y.; Wang, D.; Hu, B.; Gong, X.; Zhang, J. Supervirtual Refraction Interferometry in the Radon Domain. Remote Sens. 2023, 15, 384. [Google Scholar] [CrossRef]
  32. Edigbue, P.; Al-Shuhail, A. Three-dimensional supervirtual seismic refraction interferometry. Arab. J. Geosci. 2016, 9, 537. [Google Scholar] [CrossRef]
  33. Lu, K.; Chávez-Pérez, S. 3D supervirtual refraction interferometry. Geophysics 2020, 85, Q1–Q10. [Google Scholar] [CrossRef]
  34. Edigbue, P.; Al-Shuhail, A.; Hanafy, S.M. Three-dimensional supervirtual seismic refraction interferometry: A case study in western Saudi Arabia. Geophysics 2021, 86, B123–B133. [Google Scholar] [CrossRef]
  35. Schuster, G.T. Seismic Interferometry; Cambridge University Press: Cambridge, UK, 2009. [Google Scholar] [CrossRef]
  36. Hanafy, S.M.; Al-Hagan, O. Super-virtual refraction interferometry: An engineering field data example. Near Surf. Geophys. 2012, 10, 443–449. [Google Scholar] [CrossRef]
Figure 1. (a) Ground GPS system; (b) UAV seismic source structure.
Remotesensing 17 01686 g001
Figure 2. The steps for creating supervirtual refraction arrivals; (a) crosscorrelate and stack to generate virtual refractions; (b) convolve and stack to generate supervirtual refractions. The dashed lines indicate negative traveltime.
Remotesensing 17 01686 g002
Figure 3. (a) Geological map of study area; (b) satellite map showing the seismic lines and borehole points (D1 at 260 m and D2 at 358 m on Line 1; D3 at 240 m and D4 at 372 m on Line 2); (c) elevation curves of the seismic lines.
Remotesensing 17 01686 g003
Figure 4. Common-shot gathers of line 1 (a,c) and line 2 (b,d) filtered in different frequency bands via UAV source. Red dashed line: refractions from the sediments (Rs); Blue dashed line: refractions from the basement (Rb); Green circle: discontinuous event.
Remotesensing 17 01686 g004
Figure 5. Comparison of shot gathers before and after SVI processing. (a,b) Raw seismic shot gathers for two representative source points showing far-offset trace noise and low first-arrival energy. (c,d) Corresponding supervirtual interferometry (SVI) processed results, where energy from far-offset refractions has been enhanced and first-arrival continuity significantly improved. All panels are plotted using the same time window and amplitude scale for direct comparison.
Remotesensing 17 01686 g005
Figure 6. Comparison of picked traveltimes before and after SVI enhancement. The curves represent manually picked first arrivals from raw data (black) and SVI-processed data (red) for three selected common-shot gathers. The high consistency between the two indicates that SVI preserves traveltime accuracy while enhancing the ability to reliably identify first arrivals, particularly at far offsets.
Remotesensing 17 01686 g006
Figure 7. Traveltime pick matrices for the original and SVI-enhanced datasets. (a,c) Traveltime picks obtained from raw data for Lines 1 and 2, respectively, with noticeable gaps at far offsets due to noise contamination. (b,d) Traveltime picks from SVI-processed data showing greatly improved pick continuity and spatial coverage.
Remotesensing 17 01686 g007
Figure 8. Line 1 first-break tomograms using traveltimes picked at (a) first arrivals from raw data without SVI processing; (c) SVI first arrivals. (bd) Corresponding raypath diagrams, respectively.
Remotesensing 17 01686 g008
Figure 9. Line 2 first-break tomograms using traveltimes picked at (a) first arrivals from raw data without SVI processing; (c) SVI first arrivals. (bd) Corresponding raypath diagrams, respectively.
Remotesensing 17 01686 g009
Figure 10. Schematic of rock units in boreholes D1, D2, D3, and D4.
Remotesensing 17 01686 g010
Figure 11. Lines 1 and 2 (a,b) VP geophysical models and (c,d) interpreted interfaces.
Remotesensing 17 01686 g011
Table 1. Primary acquisition parameters.
Survey Parameters
SourceUAV source (500 m height and 5 kg impact object)
Source spacing16 m
Number of source points42
Receiver spacing4 m
Number of channels 189
Recording length1 s
Sampling interval0.5 ms
GeophonesVertical: natural frequency: 5 Hz
Disclaimer/Publisher’s Note: The statements, opinions and data contained in all publications are solely those of the individual author(s) and contributor(s) and not of MDPI and/or the editor(s). MDPI and/or the editor(s) disclaim responsibility for any injury to people or property resulting from any ideas, methods, instructions or products referred to in the content.

