Article

The Sensitivity of Polar Mesospheric Clouds to Mesospheric Temperature and Water Vapor

1
Goddard Earth Sciences Technology and Research II, University of Maryland, Baltimore County, Baltimore, MD 20742, USA
2
NASA Goddard Space Flight Center, Greenbelt, MD 20771, USA
3
Center for Space Science and Engineering Research, Bradley Department of Electrical and Computer Engineering, Virginia Tech, Blacksburg, VA 24061, USA
4
Department of Physics, Catholic University of America, Washington, DC 20064, USA
5
Department of Computer and Network Engineering, University of Electro-Communications, Chofu 182-8585, Japan
*
Author to whom correspondence should be addressed.
Remote Sens. 2024, 16(9), 1563; https://doi.org/10.3390/rs16091563
Submission received: 19 March 2024 / Revised: 22 April 2024 / Accepted: 23 April 2024 / Published: 28 April 2024

Abstract

:
Polar mesospheric cloud (PMC) data obtained from the Aeronomy of Ice in the Mesosphere (AIM)/Cloud Imaging and Particle Size (CIPS) experiment and Himawari-8/Advanced Himawari Imager (AHI) observations are analyzed for multi-year climatology and interannual variations. Linkages between PMCs, mesospheric temperature, and water vapor (H2O) are further investigated with data from the Microwave Limb Sounder (MLS). Our analysis shows that PMC onset date and occurrence rate are strongly dependent on the atmospheric environment, i.e., the underlying seasonal behavior of temperature and water vapor. Upper-mesospheric dehydration by PMCs is evident in the MLS water vapor observations. The spatial patterns of the depleted water vapor correspond to the PMC occurrence region over the Arctic and Antarctic during the days after the summer solstice. The year-to-year variabilities in PMC occurrence rates and onset dates are highly correlated with mesospheric temperature and H2O. They show quasi-quadrennial oscillation (QQO) with 4–5-year periods, particularly in the southern hemisphere (SH). The combined influence of mesospheric cooling and the mesospheric H2O increase provides favorable conditions for PMC formation. The global increase in mesospheric H2O during the last decade may explain the increased PMC occurrence in the northern hemisphere (NH). Although mesospheric temperature and H2O exhibit a strong 11-year variation, little solar cycle signatures are found in the PMC occurrence during 2007–2021.

1. Introduction

Polar mesospheric clouds (PMCs), or noctilucent clouds (NLCs), are Earth’s highest clouds that occur in the summertime, at high latitudes in a narrow altitude region near ~82 km. These clouds consist of ice crystals in nanometers that are nucleated onto meteoric particles with an ice water content (IWC) of less than 100 g/km2 [1]. The occurrence of PMCs in the summer polar mesosphere indicates that PMC formation requires favorable atmospheric conditions, i.e., low temperature (T) and sufficient water vapor (H2O) abundance. While the mesospheric H2O supply is largely from the slow ascent of polar air in the mean upper-atmospheric circulation, the regional temperature can be modulated by waves, i.e., planetary waves, gravity waves (GWs), and tides originated from the lower atmosphere. Different from the lower atmosphere, the wave-driven dynamic polar mesosphere is coldest during the summer solstice. The cold mesosphere in the summer hemisphere is a manifestation of strong dynamic forcing [2,3,4,5,6]. Gravity wave momentum deposition induces a mean meridional flow from the summer to winter hemisphere, resulting in an upward flow in the summer mesosphere and downward flow in the winter mesosphere. Adiabatic cooling and warming, associated with this seasonal vertical mean flow, drive strong seasonal variations in mesospheric temperature and atmospheric tracers. Vertical thermal structures and their relations to PMCs have been extensively studied in numerous publications [7,8,9,10].
Upper atmosphere cooling is likely to increase from doubling CO2 radiative forcing [11]. Observational and modeling studies have linked PMC changes to enhanced ice particle production by increased CO2 cooling [10,12,13]. Linkages between increases in PMC occurrence and brightness to climate change on different time scales have been discussed by a number of authors [14,15,16,17,18]. On a centennial timescale, it has been suggested that a H2O increase of about ~1 ppmv due to methane oxidation in the mesosphere during the industrialization era could be one of the major contributing factors to the more frequent occurrence of PMCs observed in recent years [19]. Since 11-year solar cycle variations can also induce changes in PMC occurrence by modulating mesospheric T and H2O, the sensitivity of PMC occurrence to the solar cycle has also been extensively investigated [20,21,22,23,24,25]. The micro-physical properties of PMCs, i.e., vapor pressure over ice and the nucleation of mesospheric ice particles in the relevant temperature range, have also been explored with laboratory observations in combination with detailed microphysical modeling of cloud processes under the conditions of the polar summer mesopause [26,27,28,29,30,31,32,33].
Although PMCs have been observed for more than 120 years [34,35,36], observation techniques have significantly improved in recent decades due to advanced new instruments from the ground and rockets [37,38,39,40,41,42,43,44,45,46]. However, ground-based and rocket observations are limited in terms of spatiotemporal coverage and unable to make consistent daily measurements because they are often obscured by low clouds and local weather conditions. Thus, sampling bias is a fundamental limitation in ground-based PMC observations.
Recent satellite observations of PMCs from low-Earth orbit (LEO) [47,48,49,50,51,52,53,54,55,56] and geostationary-Earth-orbit (GEO) [57,58,59,60] have provided the needed global coverage of PMCs with consistent temporal and spatial samplings. Sun synchronous satellite instruments observe PMCs at two fixed local times from the ascending and descending orbits. As the orbit can shift over the lifetime of the satellite, a local time shift in the observation can affect the multi-year time series of the PMCs due to the interference of the tidal amplitudes and phases with the observation times. Stable and continuous observations of PMCs and the middle atmosphere environment are critical for understanding the variations in PMCs, especially with their implication for long-term and/or solar cycle influences on the mesosphere.
Beyond all the difficulties in diagnosing changes in the mesosphere, observational evidence of the cooling trend in the mesospheric temperature can be found from Rayleigh lidars [61] and satellite records [62,63,64]. The estimated decadal variability in the mesosphere is often hampered by other large interannual fluctuations such as stratospheric sudden warming and warming due to volcanic eruptions. Nevertheless, the observed temperature in the middle atmosphere appears to exhibit a general cooling trend of 1–2 K/decade in response to CO2 increase [65].
Water vapor (H2O), a highly variable greenhouse gas in the lower atmosphere, is an important tracer of the middle atmosphere dynamics [66] and an indicator of climate change. In contrast to its increasing trend in the past, a ~10% decrease in stratospheric water vapor since 2000 has been reported as a potential contributing factor to the global warming hiatus, which may have caused a slow increase in the global surface temperature [67]. A recent analysis from Microwave Limb Sounder (MLS) and Sounding of the Atmosphere using Broadband Emission Radiometry (SABER) observations suggests an increasing H2O trend of 0.2–0.3 ppmv/0.1–0.2 ppmv during the last decade in the stratosphere/lower mesosphere, respectively [13]. An anthropogenic increase in methane (CH4) [68] could possibly drive a steady increase in H2O, since methane oxidation is a principal source of stratospheric water vapor.
In this paper, we conduct a comprehensive study of PMC occurrence and the mesospheric environment for cloud formation to quantify the sensitivity of PMCs to environmental conditions by analyzing two independent satellite PMC measurements. We characterize the monthly and seasonal climatologies as well as year-to-year variations in PMC occurrence rates, as observed by the Aeronomy of Ice in the Mesosphere (AIM)/Cloud Imaging and Particle Size (CIPS) experiment and Himawari-8/Advanced Himawari Imager (AHI).
To evaluate the PMC occurrence changes with respect to the warming climate and altered mesospheric environment, we correlate the MLS T and H2O variations with the PMC occurrence rates and PMC onset dates for the periods when AIM/CIPS and Himawari-8/AHI observations are available. We also examine the interannual variations in PMCs across 4–5-year periods (quasi-quadrennial oscillation) from 2007 to the 2021/2022 PMC season, in conjunction with mesospheric T and H2O.

2. Data

2.1. MLS T and H2O

We use V5.0 MLS T and H2O in the present study. MLS is an instrument onboard the NASA/Aura satellite, launched in July 2004 into a Sun-synchronous polar orbit. MLS measures thermal microwave emissions from the Earth’s limb from 82°S to 82°N. The daily temperature and H2O fields are mapped onto a 4° (latitude) × 8° (longitude) grid for daytime (ascending) and nighttime (descending) orbits. The daily mean is estimated as an average of the data from ascending and descending orbits. MLS observations provide nearly global coverage (82°S–82°N) by passing the same location two times every day: ascending orbit at 1:45 ± 15 PM local time and descending orbit at 1:45 ± 15 AM local time (https://aura.gsfc.nasa.gov/scinst.html, accessed on 31 January 2023). There are differences in the MLS T and H2O data from ascending and descending orbits [69,70], however, averaging the data from the ascending and descending orbits does not affect the results of the paper.
Inferred from the emissions of molecular oxygen [O2] at 118 GHz and its isotope at 239 GHz, MLS temperature measurements have a vertical resolution of ~6 km and precision of ~2.3 K in the mesosphere [71,72]. The uncertainty due to noise and a priori information is ~2.5 K above the mesosphere. MLS temperature measurements are recommended for scientific use up to 0.0005 hPa (~104 km), as updated in the V5.0 data quality and description document (https://mls.jpl.nasa.gov/data/v5-0_data_quality_document.pdf, accessed on 31 January 2023).
The H2O volume mixing ratio (VMR) is derived from the 183.3 GHz line using a 190 GHz radiometer. The typical precision values of the MLS V5.0 water vapor vary between 0.3 and 2 ppmv over the range from 68 to 0.001 hPa with vertical resolution of 12–16 km in the mesosphere. The highest vertical level recommended for scientific use is 316–0.001 hPa. In the comparison with the version 3.0 data from the Sub-Millimetre Radiometer (SMR) aboard the Odin satellite, the profiles of the MLS T and H2O mixing ratio are consistent with those of the SMR with relative differences within 5% in the lower mesosphere [73].

2.2. MLS Relative Humidity with Respect to Ice (RHI)

The MLS relative humidity with respect to ice (RHI) product is only validated and used for tropospheric studies [74]. The analysis of mesospheric RHI in this study is preliminary, in which we focus mainly on its relative variations with time and altitude. As in an earlier MLS algorithm [75], the RHI algorithm is based on the Goff–Gratch function [76] and is recommended for use by the World Meteorological Organization (WMO). In essence, this formula is fundamentally based on the Clausius–Clapeyron equation,
d ( ln e i ) d T = L i c e ( T ) R T 2
where e i is the ice saturation pressure, L i c e ( T ) is the latent heat of the sublimation of ice as a function of temperature, and R is the molar gas constant. If the H2O VMR is measured, RHI (in %) can be expressed as
RHI = p · VMR H 2 O e i × 100
where p is the atmospheric pressure. Therefore, extension to the mesosphere would depend primarily on the knowledge of L i c e ( T ) in a cold environment (130 K–180 K), which is derived from the molar heat capacities of ice and water vapor. The water vapor capacity is approximately constant for these temperatures, whereas the ice capacity as a function of temperature is known quite well down to 15 K. A more comprehensive review on ice and water vapor properties can be found in [77].
In summary, the MLS RHI should contain scientifically useful measurements of H2O saturation in the mesosphere and warrant an in-depth analysis in PMC studies. Figure 1 shows two examples of the averaged RHI profiles in the NH and SH from a 30-day period after the 2011 solstice. Despite the coarse vertical resolution in the mesosphere, the MLS RHI appears to reveal a high saturation level in the upper mesosphere (0.01–0.002 hPa) with a peak near 0.005 hPa. As discussed in later sections, these periods represent the enhanced occurrence of PMC formation in the summer polar region. This high saturation with an RHI > 100% is consistent with the PMC-forming potential at this time of year.

2.3. AIMS/CIPS

The CIPS instrument [78] onboard the AIM satellite has been operational since May 2007. CIPS uses four UV imagers to measure the 265 nm radiation scattered by the atmosphere from a ~30–85° latitude and completes about 15 orbits per day, crossing the equator at 12 AM/PM local times. CIPS is a nadir-imaging instrument that utilizes a unique four-camera design to discriminate the scattering of ultraviolet (UV) solar photons from PMC ice particles against the background sunlit atmosphere. From 2007 through to February of 2016, images were acquired in the summer hemisphere between the terminator and a dayside latitude of about 40 degrees. Since 12 February 2016, images have been acquired at all sunlit latitudes. The fundamental measurement is albedo, defined as the ratio of the scattered radiance to the incoming solar irradiance.
In this study, we use the version 5.20, level 3c data set, which consists of orbit-by-orbit albedos binned in 1° latitude bins for the entire season. We use an albedo threshold of 5 × 10⁻⁶ sr−1 to reduce false detections and determine the PMC occurrence rate. The occurrence rate (OR) is calculated as the ratio of the number of clouds (with albedo values ≥ 5 × 10⁻⁶ sr−1) to the number of observations. Note that PMC retrievals are not available for the NH 2017 and SH 2017–2018 seasons due to the difficulties in accounting for the changing orbital parameters. Detailed descriptions of the observations, algorithms, data products, and uncertainties can be found in [79,80].

2.4. Himawari-8/AHI

Himawari-8 is a Japanese GEO meteorological satellite, operated since July 2015. Himawari-8/AHI has 16 observation bands, including 3 visible bands: blue (0.47 μm), green (0.51 μm), and red (0.64 μm). These visible bands can be used for PMC observations [59]. In this work, we use Himawari-8/AHI PMC occurrence rate data from 2016 to 2021 for the NH and from 2016/2017 to 2021/2022 for the SH. The PMC data sets are produced by the PMC detection method, which was developed in [60]. To perform the PMC detection, the resampled optical intensity data are calculated from the full-disk HSD band-1 (blue) images, which have 11,000 × 11,000 pixels with a time resolution of 10 min. The spatial resolutions (or the resampled grid) of the resampled data are 1 degree in latitude and 1 km in height. Then, the PMC detections are performed for the height profiles of the resampled intensity data at each latitude with a 10-min interval. We calculate the daily PMC occurrence rates from the detected PMC data. The Himawari-8/AHI PMC OR data used in this work are available with resolutions of 1 day in time and 1 degree in latitude. More detailed information for the AHI PMC measurement can be found in [60].

3. Results and Discussion

3.1. Climatology of Mesospheric T and H2O

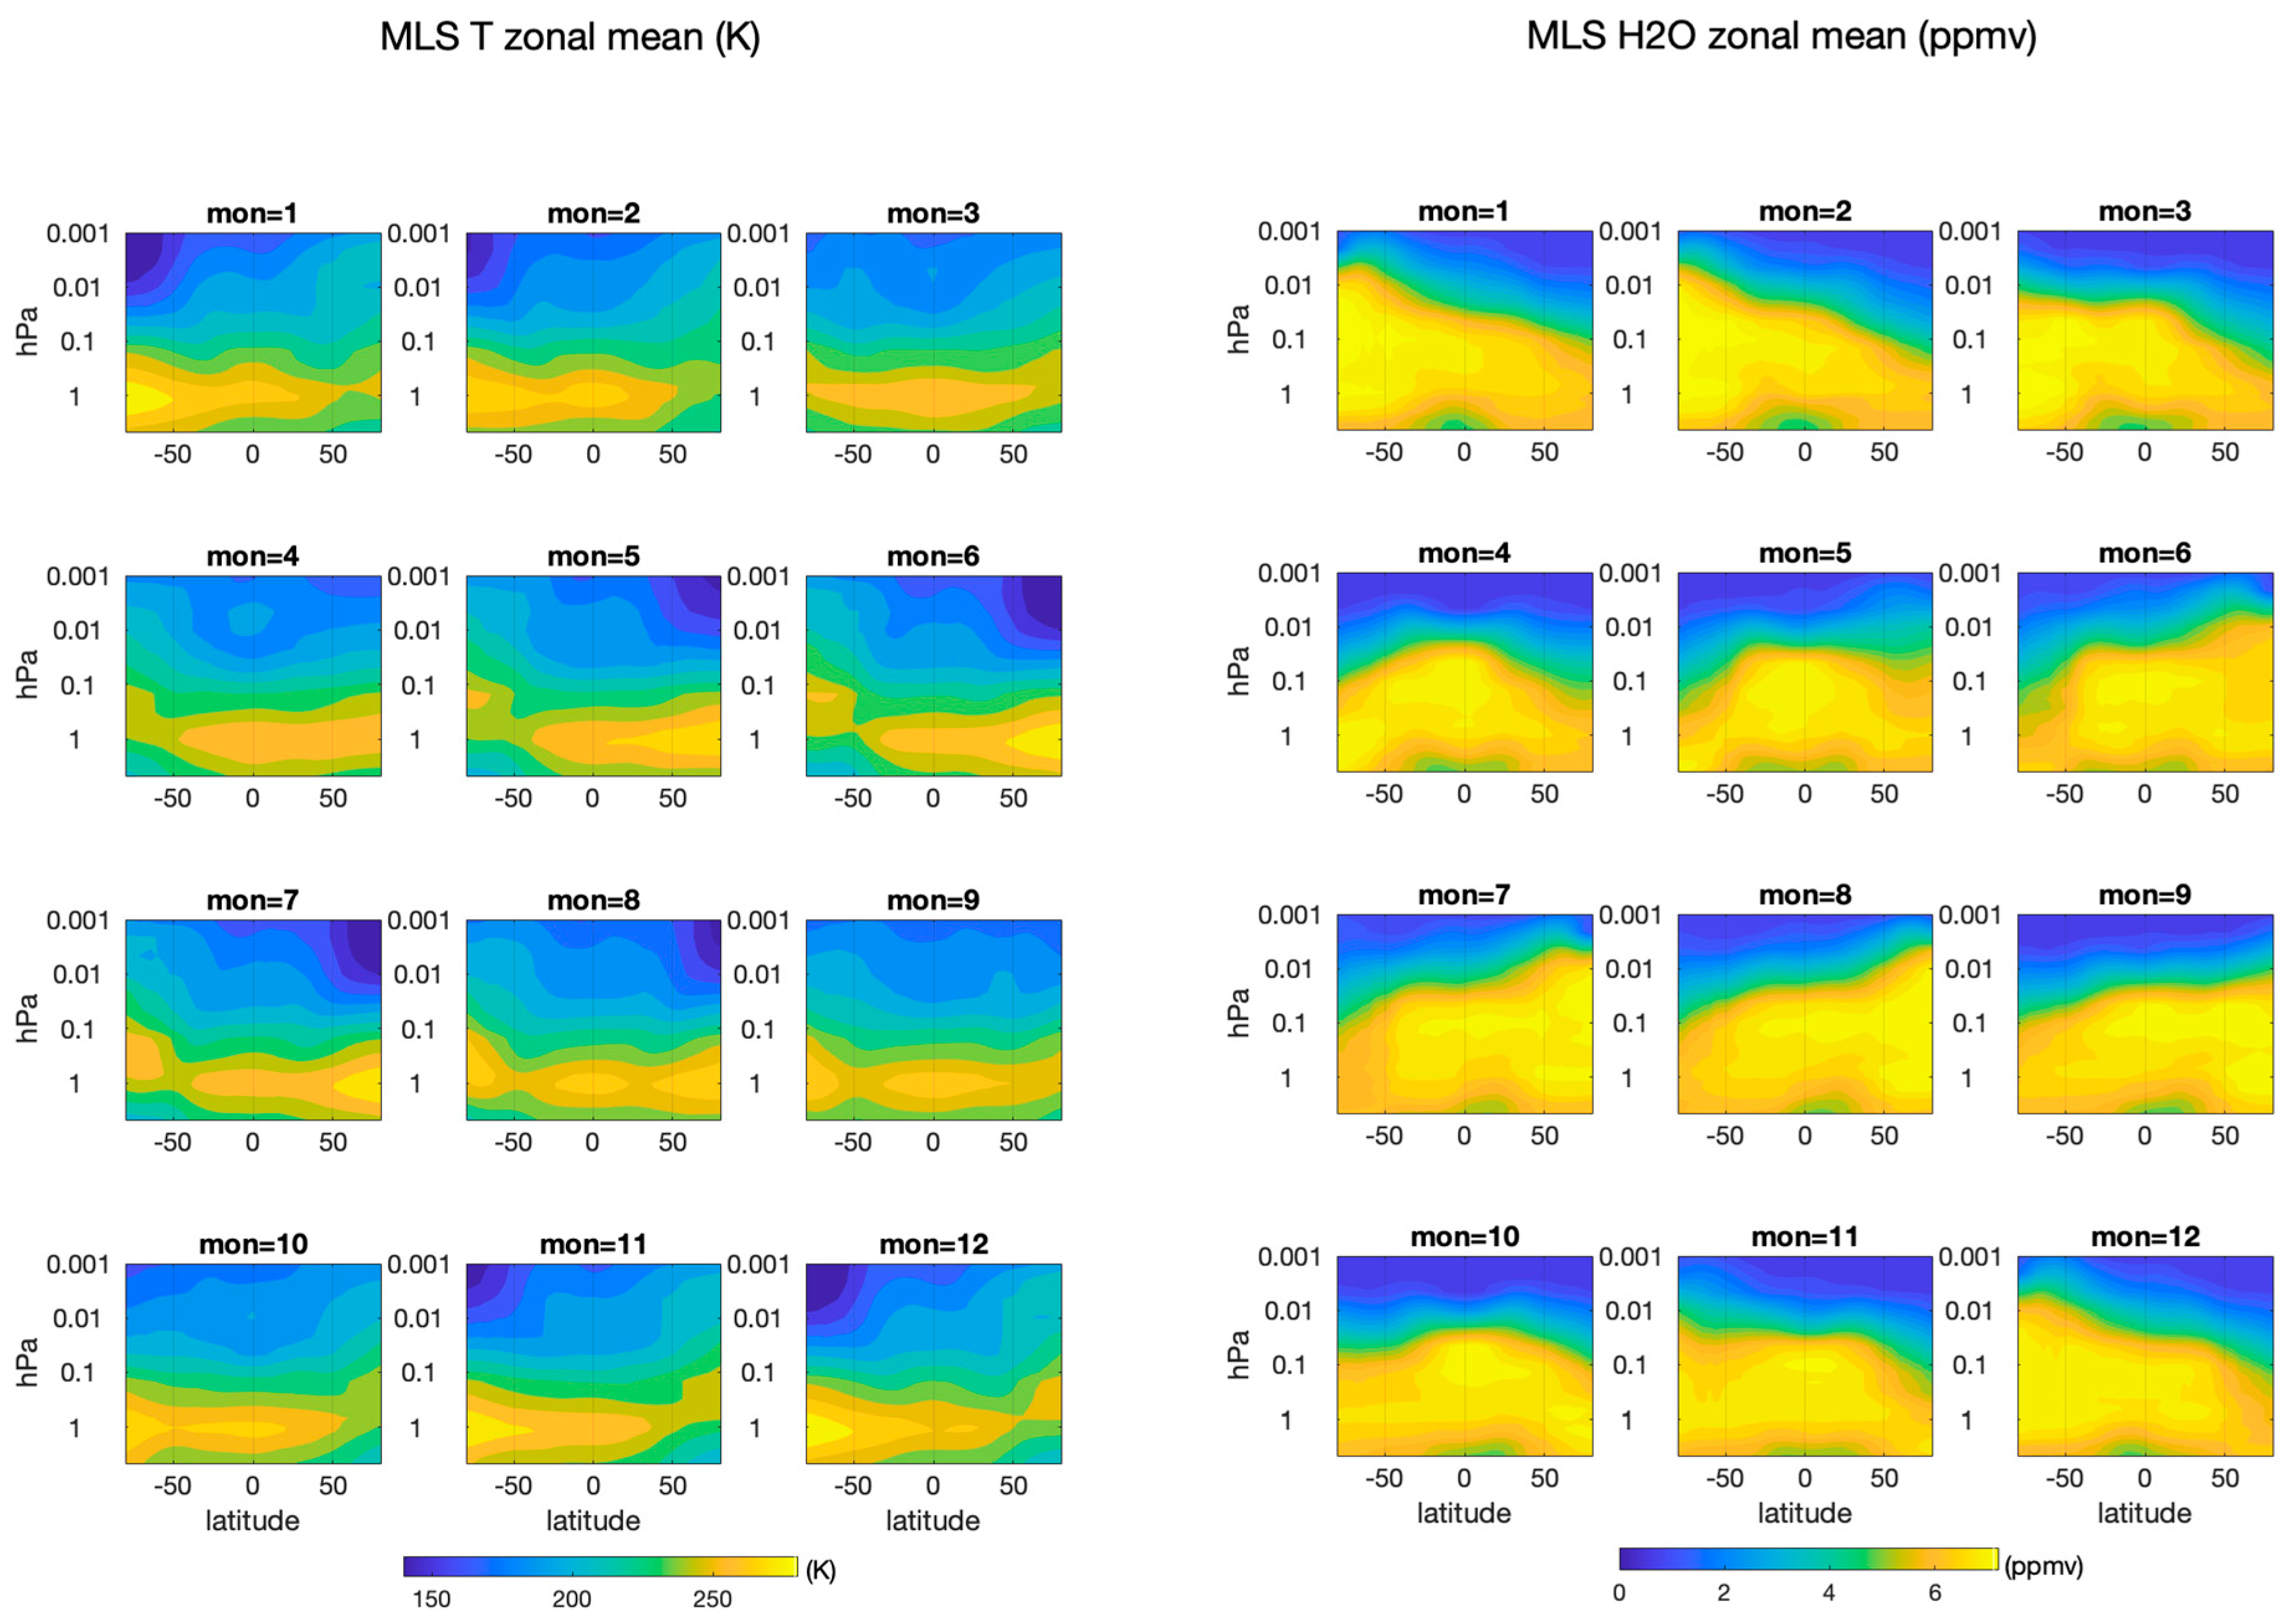
In this section, we investigate the climatology of the MLS T and H2O mixing ratio. PMCs are expected to alter and to be altered by T and H2O in the summer mesopause region. Figure 2 shows the zonal mean monthly climatology calculated from the MLS T (left panel) and H2O (right panel) during 2005–2021 for each month of the year. The climatology is shown for 82°S–82°N over the altitude range from 5 to 0.001 hPa (~37 to ~100 km). The climatology of the middle atmosphere T from MLS clearly shows the hemispheric asymmetry of the cold temperature minimum over high latitudes in both summer hemispheres in the upper mesosphere (between 0.01 hPa and 0.001 hPa). Because the UV absorption by ozone in the Hartley band near 240 nm is a major source of solar heating in the mesosphere, the mean temperature monotonically decreases with altitude as the ozone VMR decreases. However, additional radiative, chemical, and dynamical processes are involved in the determination of the temperature structure near the mesopause [81]. A large amplitude of the annual oscillation in the high latitude implies that dynamic forcing is stronger there, compared to low-latitude zones. The summertime cold region is obvious during summer months, extending from the upper mesosphere to below 0.01 hPa. The temperature range for the summer mesosphere extends from 140 to 180 K in both hemispheres.
The climatology of H2O (right panel) shows a general decrease with altitude to near the mesopause. A meridional tilt is obvious during the solstice season and the H2O mixing ratio decreases from the summer to winter hemisphere. For a given altitude, H2O increases with an increasing latitude, reflecting the summertime upwelling of water vapor following the mean meridional circulation, which maximizes at high latitudes. The H2O amount decreases with latitudes, so a H2O maximum appears at the equator during equinox. A noticeable perturbation in the H2O field in summer high latitudes can be found in the upper mesosphere. At a high latitude above 0.01 hPa, the H2O meridional increase slows down and does not increase with latitude beyond 50°N/S during the summer months. In contrast, the summertime H2O reaches a maximum below the 0.01 hPa level. This perturbation indicates that the summertime high-latitude H2O depletion above the 0.01 hPa level may be linked with the formation of PMCs. The decrease in H2O above this level in the upper polar mesosphere could be due to the photodissiation of the H2O where it is brought up from a lower altitude by the overturning circulation as it reaches the mesopause [82]. The H2O below PMC level can be enhanced by the sublimation of PMCs when they release H2O back into the surrounding environment.

3.2. Upper-Mesospheric Dehydration

We investigate this dehydration process in further detail with the MLS T and H2O measurements to examine its temporal evolution and spatial distribution in connection to PMC formation. In Figure 3, the zonal mean MLS H2O climatology (2005–2021) near the mesopause region above 0.02 hPa is shown at a given time and latitude for the NH (left panel) and SH (right panel). At the 0.02 hPa level, a high amount of H2O VMR i.e., a H2O VMR greater than 6 ppmv, appeared approximately 10 to 15 days before the solstice in both hemispheres. This high H2O concentration continues to grow and peaks at greater than 7 ppmv at 80°N/S during the ‘core’ of PMC seasons around the summer solstice. This high H2O amount at 0.02 hPa in high latitudes persists over the next 90–100 days and shows equatorward propagating signals. The extent of the equatorward propagation signal is slightly more prolonged in the SH relative to the NH, but the structure of the hemispheric distribution of H2O VMR is quite similar.
Significant H2O depletion in the upper mesosphere (above 0.005 hPa) is evident in the MLS climatology. This perturbation suggests that the summertime high-latitude H2O above the PMCs is depleted by the formation of PMCs, while the H2O below the PMC altitudes is enhanced by the sublimation of PMCs when they release H2O back into the surrounding environment. This is consistent with the WACCM model simulations, which indicates that PMC formation is expected to decrease the distribution of atomic hydrogen and H2O around PMCs [83].
In the lower mesosphere at 0.01 hPa and 0.02 hPa, Figure 3 (lower panels) shows the composites of the H2O maximum at 30–40 days after solstice, not near the solstice. The wave-driven ascent is known to be responsible for the cold summer polar temperature and high H2O in the mesosphere. However, delayed H2O maxima (i.e., delayed 30–40 days from solstice) at these altitudes indicate that the wave-driven ascent in the summer pole may not occur simultaneously with the temperature minimum at the summer solstice, but is a delayed response due to additional subsequent dynamic processes.
The MLS H2O measurement is based on its 183 GHz emission feature from the limb atmosphere. There is a two-order magnitude of sensitivity difference between emissions from gas and the condensed phase of water. MLS is very sensitive to water vapor depletion as it freezes into a condensed phase because it is insensitive to cloud ice. Similar studies with these MLS data were carried out for the dehydration process near the tropical tropopause layer (TTL) where water vapor is frozen to cirrus [84], and for the denitrification in the polar stratosphere where nitric acid gas (HNO3) is taken up onto ice surfaces [85].
The spatial patterns of the H2O hole, a region of exceptionally depleted H2O in the upper mesosphere at 0.002 hPa over the Arctic and Antarctic regions, are shown in Figure 4 for NH (Figure 4a,c) and SH (Figure 4b,d) for the 2007 (NH) and 2007/2008 (SH) summers. The H2O VMRs are averaged for 0 to 30 days from the summer solstice. The depleted H2O region appears at the upper mesosphere above 0.002 hPa from the beginning of the summer solstice and lasts more than 30 days. We infer that the H2O holes in these regions are probably caused by the formation of PMCs, not by atmospheric dynamics, since this kind of perturbation is not found in the MLS CO distribution. The H2O bound in ice particles is coupled with the background environment by freeze drying and sublimation. The formation of clouds can dehydrate the surrounding atmosphere, and they release the H2O back to the surrounding atmosphere within ~60 days from the solstice. The presence of PMCs presumably causes an obstruction to the upwelling of H2O and may have caused the H2O holes above the PMCs.
In both hemispheres, these depleted H2O regions are nearly concurrent with low-temperature regions, as shown by the 140 K temperature blue contour lines in Figure 4. At 0.002 hPa, regions of H2O holes are evident where the temperature is lower than 140 K. Note that the 140 K temperature contour lines are almost coincident with the 70°N/S latitude line. The ice particles in the upper mesosphere are transported according to background winds, eddy diffusion, and sedimentation. Ice particle nucleation and growth are well-described with microphysical processes and saturation [86,87].

3.3. Climatology of PMCs

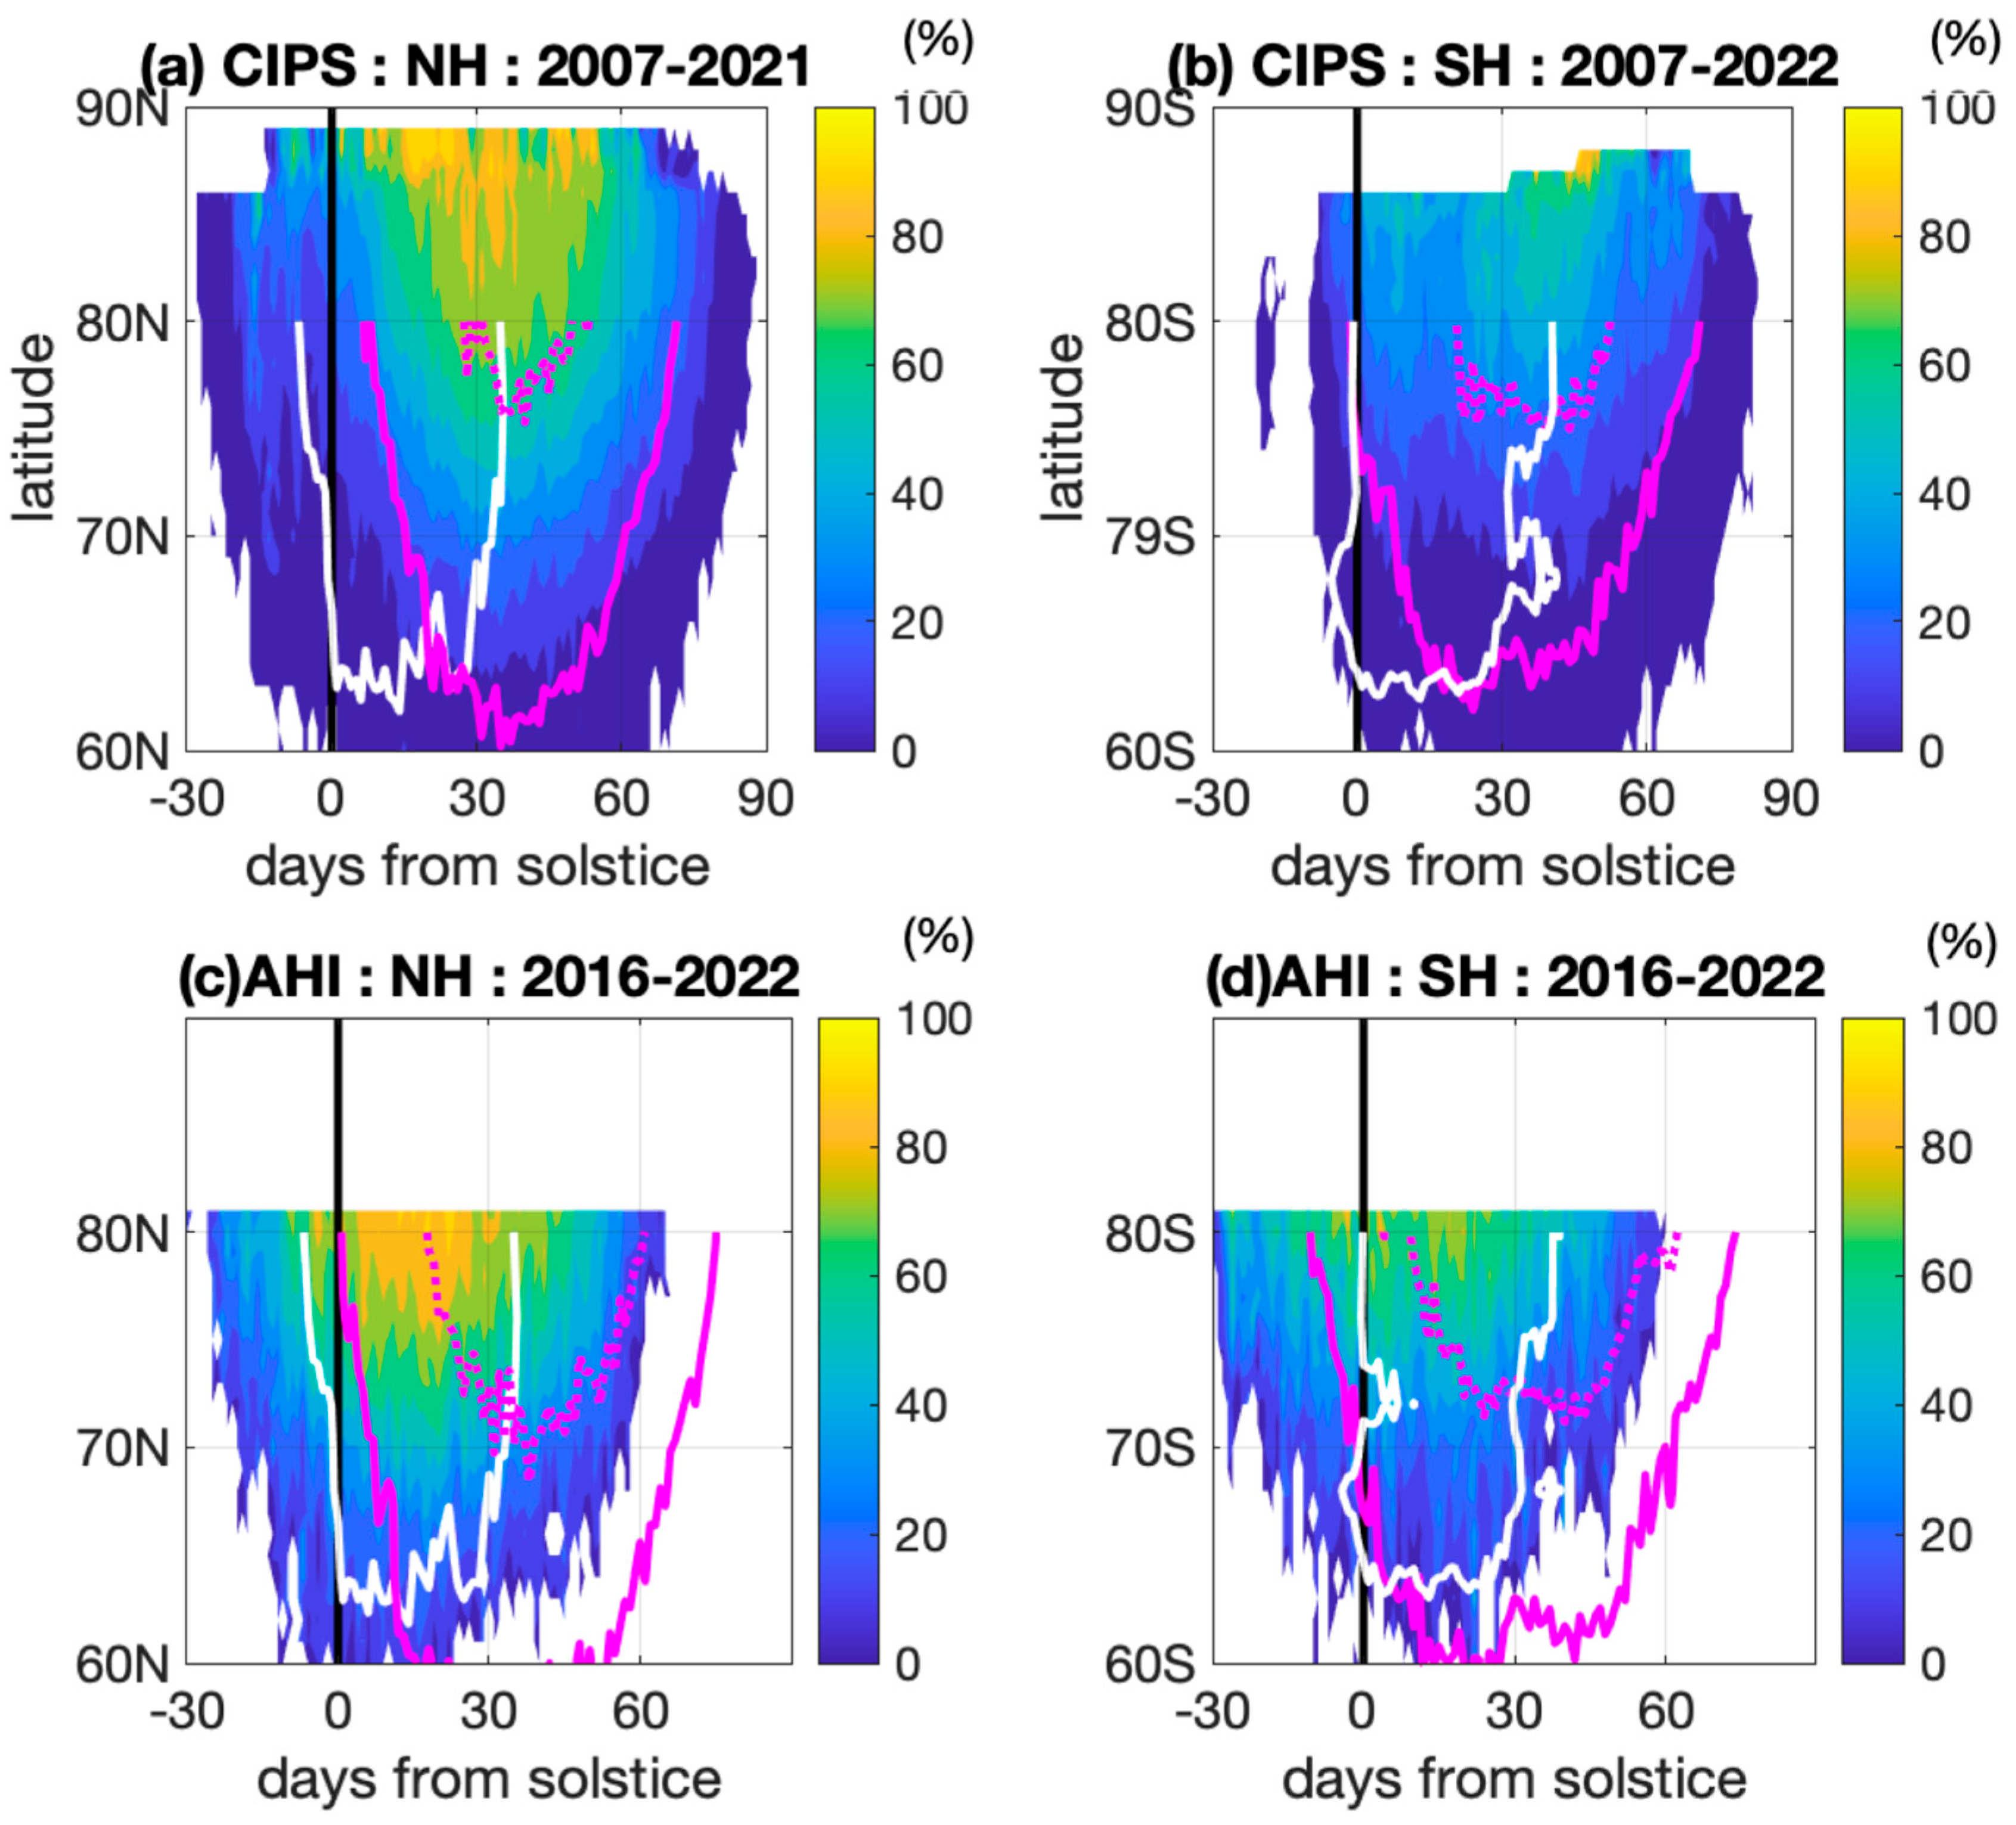
To show the daily variability in the frequency of PMC occurrence at different latitudes, the average PMC occurrence rate (OR) from the two instruments, AIM/CIPS and Himawari-8/AHI, are compared in Figure 5. The upper panel represents AIM/CIPS-measured PMC ORs for the NH (Figure 5a) and SH (Figure 5b) and the lower panel represents those from Himawari-8/AHI for the NH (Figure 5c) and SH (Figure 5d). The PMC ORs are calculated from the daily occurrence rates during 2007–2021 in the NH and 2007/2008–2021/2022 in the SH from AIM/CIPS and 2016–2021 in the NH and 2016/2017–2021/2022 from the Himawari-8/AHI measurements. The AIM/CIPS PMC measurements cover 15+ years from 2007, while Himawari-8/AHI only covers 7 years since 2016. Therefore, the climatologies from the two instruments represent the temporal and spatial distribution of an average PMC OR from two different periods. A comparison of the two data sets also shows different latitudinal coverages, with AHI observations limited to below 81°N/S.
Despite differences in the sampling and algorithms of the measurements, the daily variations in the PMC ORs from two independent measurements show remarkable similarities in their overall spatial extent, timing, and the duration of the cloud occurrence. The latitudinal extent of the PMC occurrence starts increasing from ~30 days before the summer solstice to ~30 days after the solstice, until they reach the peak of occurrence. In both hemispheres, PMCs occur most frequently above 70°N/S in latitude and for a ~60 to 90 day duration centered around the peak, which occurs about 30 days after the summer solstice. The OR from AHI reaches its maximum within 80°N/S latitudes about 20 days after the solstice, which is ~10 days earlier than that from CIPS.
To examine the impact of atmospheric conditions on PMC formation, mesospheric T and H2O climatology at 0.02 hPa during the same periods of each PMC observation are also overlaid with PMC climatology. Solid and dotted contour lines in magenta represent high-latitude (60°N/S–82°N/S) H2O VMRs. Similarly, the white contour line represents the high-latitude mean T at the same level. During the summer solstice, the average temperature is ~5 K higher in the SH compared to the NH within the high-latitude region. Hence, the different threshold values of T are shown in Figure 5 for the two hemispheres. The T threshold values for the SH and NH are 178 K and 173 K, respectively.
In both hemispheres, the maximum PMC OR is not coincident with the date of the minimum temperature, but lags up to 30 days after the summer solstice. The mesospheric temperature at 0.02 hPa and the near-mesopause temperature reaches its local minimum in the PMC region around the summer solstice, but the PMC occurrence peak from CIPS lags the temperature minimum, reaching its maximum ~30 days after the solstice in both hemispheres. The date of the seasonal high-latitude mesospheric H2O maxima seen from MLS is up to 30 days later than the date of the corresponding local T minima. The lagged days between the PMC OR and T are reduced in AHI-measured PMC ORs. In both cases, however, the PMC OR peak occurs between the T minima and H2O maxima.
The two magenta contour lines in Figure 5 represent the daily zonal mean H2O VMR over 60°N/S–82°N/S. On average, the CIPS NH PMC fields greater than 20% of the OR are mostly confined to humid regions where the H2O VMR is higher than 7.1 ppmv (solid magenta lines). The PMC ORs greater than 80% are mostly coincident with the region of a high H2O VMR greater than 7.5 ppmv (dotted magenta lines). On average, high H2O VMRs of >7.1 ppmv and H2O VMRs of >7.5 ppmv last ~60 days and ~30 days, respectively. In the case of AHI, regions of the same high H2O VMR are broader and days of the same high H2O VMR extend as long as ~70 days. The extended days of the high H2O VMR in Figure 5c,d reflect the increase in mesospheric H2O during recent years.
In general, during the MLS observations (2005–2021), the NH high latitude (70°N–82°N) H2O VMR at 0.02 hPa increased by ~0.4 ppmv (~7%). These results are consistent with the current understanding of the conditions of T and H2O needed for forming PMCs. A combination of the recent mesospheric cooling and increments in the mesospheric H2O concentration would provide favorable conditions for the formation of PMCs in the coming years. Detailed analyses of the year-to-year variability in PMCs, T, and H2O are discussed in Section 3.4.
The climatology of the PMC OR exhibits a hemispheric asymmetry, as the multiyear averaged PMC occurrence is more frequent in the NH than in the SH in both the AHI and CIPS observations. The multiyear average of the daily PMC OR can reach 100% in NH high latitudes, but it is rarely higher than 80% in the SH. Several studies have noted the hemispheric asymmetry in PMC occurrence, with PMCs more frequently observed with a greater extent in the NH relative to the SH [27,39,54,87]. The smaller extent of PMCs in the SH compared to the NH is also obvious in recent years (2015–2021), as clearly seen from the Himawari-8/AHI observations [60].
Besides the frequency of their occurrence, distinct interhemispheric differences in PMC altitudes and micro-physical properties have also been reported. For example, it was shown that the mean cloud altitude is higher and they are brighter with a greater mean particle size in the SH compared to the NH [49]. Interhemispheric teleconnections between the two hemispheres via stratospheric wind reversal have been proposed as a dynamic control mechanism [12,21,88,89,90]. In addition to the cold temperature, the upward transport of H2O to the summer polar mesopause region is another important factor in PMC formation. The higher-altitude PMCs in the SH are indicators of the stronger mesospheric upwelling compared to that in the NH. Different solar forcing in the two hemispheres is suggested as a main cause of the interhemispheric differences in the altitudes of the supersaturation region and the upwelling vertical wind, as the solar flux in January is 6% greater than the solar flux in July due to the Earth’s orbital eccentricity [39]. More precise comparison of the daily PMC ORs for latitudes between 38° and 81°, obtained from simultaneous Himawari-8/AHI and AIM/CIPS data, have already been presented in [60].

3.4. Dependence of Year-to-Year Variations of PMC on T and H2O

3.4.1. Onset Time of PMC

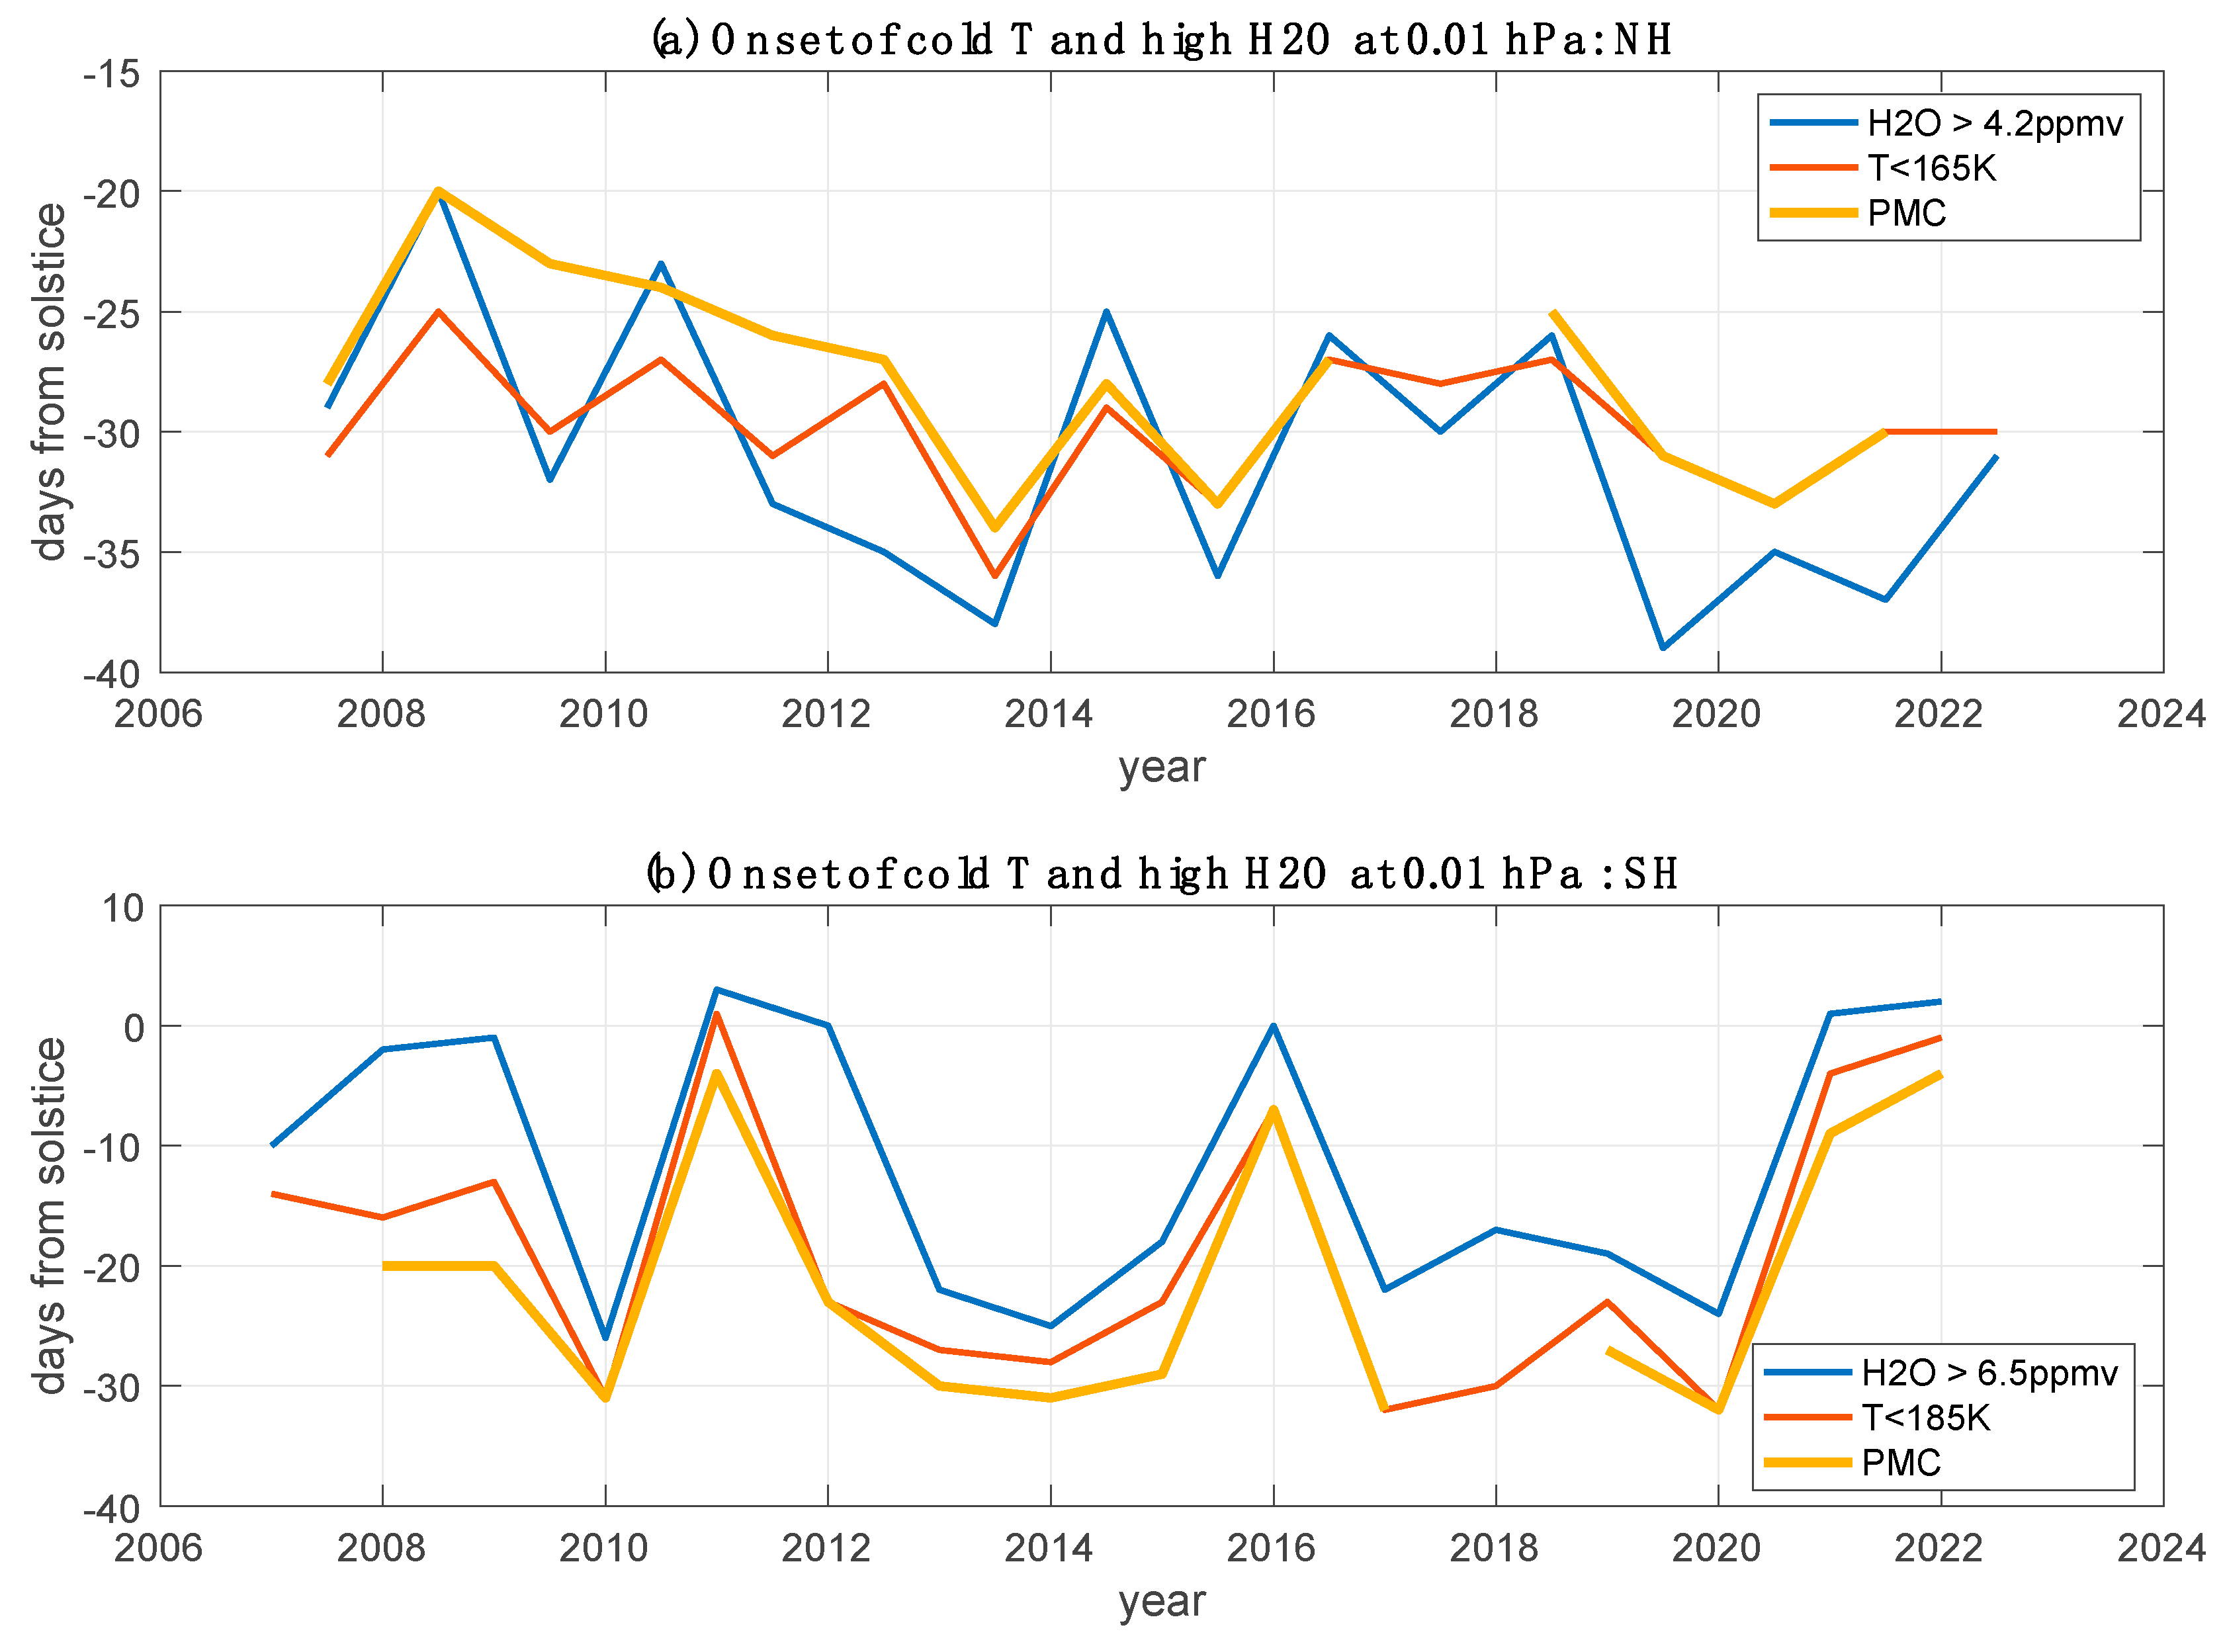
To examine the relationship between PMC formation and atmospheric conditions, the PMC onset dates from CIPs are compared to the timing of the high H2O and cold temperature at 0.01 hPa (Figure 6). The high H2O onset date is estimated as the first day of the PMC season, when the MLS high-latitude (60–82°N/S) zonal mean H2O VMR at 0.01 hPa is greater than 4.2 ppmv and 6.5 ppmv for the NH and SH, respectively. Similarly, the cold temperature onset date is estimated as the first day of the PMC season when the MLS high-latitude (60–82°N/S) zonal mean mesospheric temperature at 0.01 hPa is lower than 165 K and 185 K for the NH and SH, respectively. Besides the frequency of their occurrence, distinct interhemispheric differences in the onset time of PMCs are a good indicator of the wave activity involved in each hemisphere’s PMC season [90].
The PMC onset date, as seen by CIPS, is estimated from the version 5.20 level 3c data. The onset date is the first day of the PMC season, when CIPS observed an orbit-average cloud albedo of at least 5 × 10⁻⁶ sr−1 in the latitude range of 70°–80°N [91]. A good consistency in the onset dates between AHI and CIPS are already shown [60], where the detection threshold for the CIPS albedo is 3 × 10⁻⁶ sr−1. Because the estimate of the onset date is sensitive to the threshold values, the results from AHI may be a bit later if the threshold is increased to 5 × 10⁻⁶ sr−1.
In general, the PMC onset dates occur 20–30 days prior to the summer solstice. During the 15 years of the CIPS measurements, the earliest onset in the NH was 34 days before the solstice in 2013 and the latest onset was 20 days before the solstice in 2008. The NH PMC onset date was from 10 to 20 days earlier than that of the SH. In the NH, the PMC onset date occurs between 20 and 34 days prior to the summer solstice, while it occurs even after the summer solstice in the SH. Nevertheless, this shows that the variability in the SH season onset during CIPS periods is 25 days, significantly greater than that in the NH. The earliest onset in the SH was 30 days before solstice in 2011 and the latest onset was 5 days before the solstice in 2022. The PMC onset dates in the NH tend to show an increasing trend towards an early onset of the season. Interestingly, the onset dates in the SH show dramatic interannual variability with 4- to 5-year oscillation. Furthermore, they show the latest onset during the last year of the observation in 2021/2022.
This year-to-year variability in PMC onset time has been reported in earlier observations. In the SH, solar cycle variation and stratospheric control (inter-hemispheric coupling) have been suggested as the mechanisms which drive the interannual variation in PMC onset [21,90,92]. It was proposed that the SH PMC onset is mainly controlled by the timing of the SH stratospheric polar vortex breaking [93]. An early reversal of winter (eastward) to summer (westward) stratospheric wind causes the early onset of a net eastward GW drag, which can lead to an early deceleration of the mesospheric zonal mean flow. Accordingly, the early onset of an eastward GW drag would accelerate equatorward meridional drift and mesospheric upwelling. In the NH, inter-hemispheric coupling has been suggested as one of the drivers of the variation in PMC season onset [22,92]. In this mechanism, planetary-wave-induced changes in the winter stratosphere modulate the zonal wind, leading to changes in the GW filtering, the mean meridional circulation, and the summer mesospheric temperature. The 11-year solar cycle [21], early springtime PW breaking in the summer stratosphere [43,90], and enhanced quasi 5-day PW activity [91] have also been suggested as drivers of the interannual variation in PMC onset time in the NH.
Our analysis clearly shows that the summer polar mesospheric cold temperature and high H2O VMR onsets are correlated with the interannual variability in PMC onset. In the NH, the mesospheric T and H2O VMR onset time show 2–3-year oscillations and the PMC onset time tracks these variations well. In the SH, the mesospheric T and H2O VMR show unique 4–5-year oscillations and the PMC onset time is highly correlated with these atmospheric oscillations. There are four cases in the SH (2010/2011, 2015/2016, 2020/2021, and 2021/2022) where the PMC onset times are late. Negative ENSO events associated with the westerly Quasi Biennial Oscillation (QBO) phase have been suggested as the potential cause of early SH stratospheric polar vortex breaking around the solstice [92]. Although early PMC onset has occurred during a strong positive ENSO year, anomalous zonal wind filtering may induce anomalous eastward GW forcing in the upper mesosphere. We can infer that the early onset of high mesospheric H2O and cold T at the PMC level, achieved by the enhanced mesospheric upwelling due to the early onset of a GW drag, would lead to an early onset time of SH PMC. More on this oscillation is discussed in Section 3.4.3.

3.4.2. Occurrence of PMC

Many studies have discussed the linkages between the increasing trends in the occurrence and brightness of PMCs and climate change on different time scales [14,16,17]. Substantial trends in PMC occurrence have been consistently reported since a review paper by [50]. A more frequent, brighter, and broader extent of PMCs in the NH compared to those in the SH has been emphasized [39,54,60,88]. A centennial-scale H2O increase of about ~1 ppmv due to CH4 oxidation in the mesosphere during the industrialization era has been proposed as one of the major contributing factors to the increased occurrence of PMCs [19].
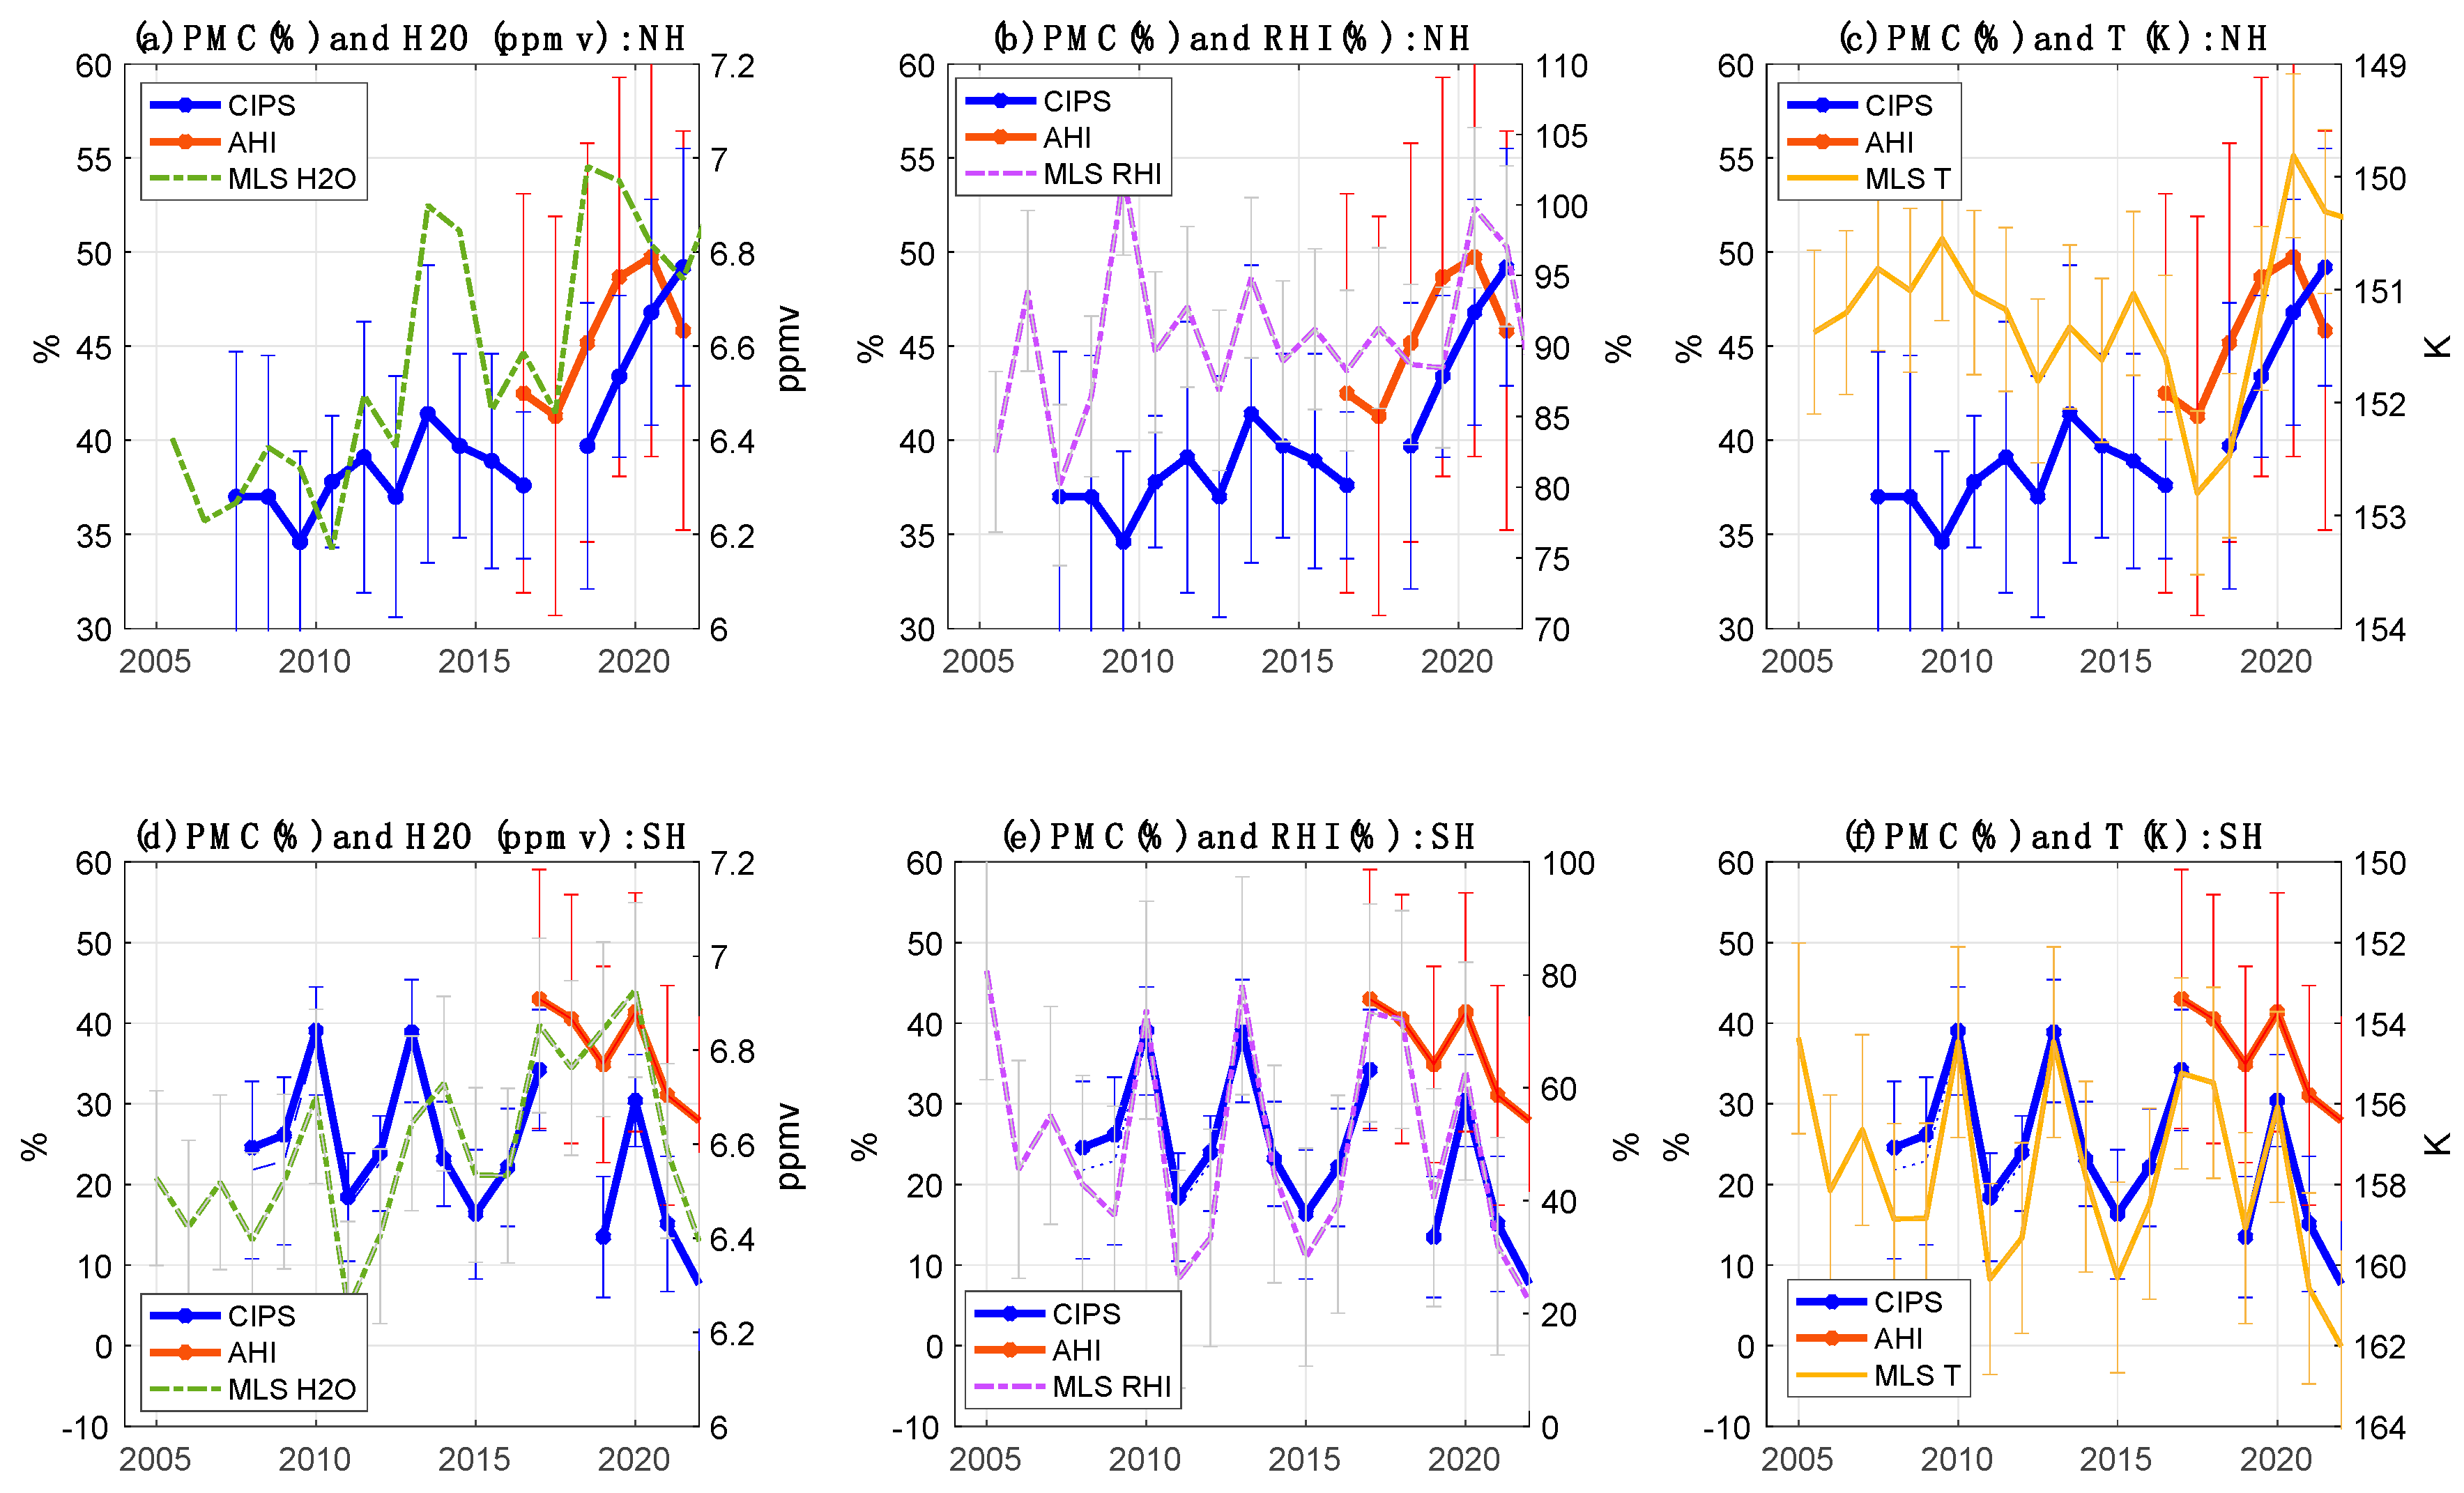
To examine the recent trends and hemispheric asymmetry in the PMC occurrence rate (OR), we compare the interannual variations in PMC ORs from CIPS and AHI in Figure 7. To address the atmospheric environment related to these PMC ORs, a comparison of MLS H2O, RHI, and temperature is also shown for both the NH and SH. For each year, the daily occurrences of PMCs in each latitude bin from 60°–85°N/S are averaged. Similarly, MLS H2O (ppmv) within the H2O hole beyond 72°N/S at 0.01 hPa, MLS RHI, and T at near mesopause (0.001 hPa) beyond 62 N/S are averaged for 0 to 30 days from the summer solstice for each hemisphere. The error bars indicate the standard deviation of the daily time series of each variable during 30 days from the summer solstice.
In the NH (Figure 7, upper panel), the PMC ORs as observed by CIPS increased by 0.75%/year during the observation periods (2007–2021). Even though large discrepancies between CIPS and AHI are shown at the end of the time series in 2021, the ORs, as observed by AHI, also increased from 2017. The MLS H2O VMR within the H2O hole also generally increased by ~0.4 ppmv (~7%) during the analysis periods within 2005–2021. An increase in mesospheric H2O, which is greater in the NH than in the SH, can be the most plausible candidate for the PMC formation process which leads to a consistent positive PMC trend in the NH.
Different from the NH, the PMC occurrence rates in the SH are evident during 2016 and 2022 from both observations. While PMC occurrences consistently increase in the NH (0.75%/year), the SH PMC ORs show a decrease (−0.96%/year). The ORs are relatively low during recent years, i.e., 2020–2022. In the SH, the MLS H2O VMR within the H2O hole only increased by ~0.25 ppmv (~4%) and showed similar low local minima in 2016/2017 and 2021/2022, consistent with the PMC occurrences. PMCs can be indicators of anthropogenic H2O increases, because increasing H2O significantly enhances the visibility of PMCs.
More interestingly, the PMC occurrence rate variations in the SH are highly correlated with the mesospheric (0.01 hPa) RHI (γ = 0.93) and T (γ = 0.97) variations. The PMC, RHI, and T show 4–5 years of mesospheric oscillations. The correlation in the year-to-year variability between the PMC occurrence and H2O, RHI, and temperature in the PMC region can be investigated further, as the PMC and middle atmosphere observations continue. The PMC ORs in the SH show unique features, decoupled from the NH variations. The perturbations in the NH stratosphere and mesosphere, i.e., stratospheric sudden warming, do not impact the SH to change the gravity wave forcing, since the midsummer jet in the SH is strong enough not to be coupled with anomalies in the NH [94].

3.4.3. Quasi Quadrennial Oscillation

In the SH, the PMC and summer mesospheric high-latitude T, H2O, and RHI time series contains an oscillation over an approximately 4–5-year periods (Figure 7). A peak-to-peak amplitude of the QQO feature in PMC is 20–25%. The amplitude of mesospheric T, H2O, and RH oscillation at 0.01 hPa is 4–5 K, 0.3–0.5 ppmv, and 40–50%, respectively. The distinct features of Quasi Quadrennial Oscillation (QQO) and the unusual periodic 4–5-year oscillation in the high-latitude near-mesopause region T and meridional wind are reported [95,96] with multiple satellite and ground observations.
Considering the significant negative correlation between the high-latitude T and H2O at 0.01 hPa, we can infer that the QQO variation in the T and H2O is an adiabatic response. In the SH summer, the equatorward circulation leads to upwelling and adiabatic cooling, while poleward circulation leads to downwelling and warming. Similarly, a lower H2O mixing ratio is expected with the downwelling, and a higher H2O mixing ratio is expected with the upwelling. In the same way, a higher T and lower H2O mixing ratio are still expected with descent in the SH winter. A significant anticorrelation between meridional wind and temperature has been found [96] with wintertime radar measurements at Davis station, Antarctica. They suggest that the wintertime QQO is linked to adiabatic heating and cooling driven by the meridional flow. As a mechanism behind the QQO, their analysis supports tidal and planetary waves, which may filter GWs to drive an adiabatic response in the mesosphere. However, their explanation is a more plausible explanation for the winter hemisphere, since GW is relatively weak in the summer hemisphere.

4. Discussion

Quantifying the relationship between PMC, T, and water vapor (H2O) is complicated due to the interaction of PMC with the surrounding H2O. When the surrounding atmosphere is cold enough to form PMCs, PMCs can dehydrate the surrounding environment. When the surrounding environment is warmed, the clouds sublimate and release the water vapor back into the atmosphere. This process is similar in many aspects to that near the tropical tropopause, where the in situ formed cirrus interacts with local water vapor [84]. In other words, the total water (vapor + ice) is approximately conserved over a short (months) period of time. Although the degree of saturation (S) is commonly used by the PMC community [30], RHI (standard product from the MLS retrieval) is an equivalent variable to S and widely used in Earth and planetary sciences. RHI is simply the ratio of water vapor pressure over the local atmospheric saturation pressure.

4.1. Relationships between T, H2O, and RHI

The MLS mesospheric temperature (T) data have been validated extensively against other measurements [71,72,97]. In the polar regions, they generally agree within ~5 K, with SABER temperature data and improvements have been further made with the version 5 data. As shown in [45], the MLS T is close (within 5 K) to the frost point at the altitude where PMCs form. As shown in Figure 6, at 0.01 hPa, the MLS T is ~150 K, in line with the conditions for PMC formation. The 170 K contour used at 0.02 hPa is used to illustrate the sharp vertical gradient in the atmosphere where PMCs are likely to form at a higher altitude. In addition, it is imperative to recognize that PMC formation can be intermittent, wave-like, or spotty in space and time. The MLS T results shown in this study reflect a daily or monthly mean condition. Transient wave perturbations can occur and induce a colder temperature condition for PMCs to form intermittently.
Atmospheric T and H2O are intimately related through the Clausius Clapeyron (CC) equation. However, the following conditions would be required to determine/validate one from the other: (1) simultaneous PMC detection at the same location as the T and H2O measurements; (2) either T or H2O is precisely measured; and (3) the supersaturation ratio is well known for PMC formation. The MLS RHI uncertainty is typically ~50% [75], which is largely determined by its T error (1 K ~ 16% in the CC equation). The larger MLS T error in the mesosphere is likely to increase the RHI uncertainty to 200%, which may help to constrain PMC supersaturation.
Given the large uncertainties about the range of PMC supersaturation, which is associated with their formation process and ice and nuclei microphysics, the MLS RHI data serve as a surrogate for evaluating the validity of the intimate relationship between T and H2O. Like the situation near the tropopause, the RHI measurement is derived fundamentally from the CC equation. In this study, we presented a basis of how this principle is applicable to a wider temperature and pressure range, including very cold conditions near the mesopause.

4.2. Influence of PMC on H2O and RHI

The impact of the PMC on the atmospheric environment, via the processes of dehydration resulting from ice growth and H2O enhancement resulting from ice sublimation, is examined with MLS RHI. In Figure 8, a comparison of MLS RHI (%) profiles is shown for different time periods of the summer solstice. MLS RHIs are averaged for 0 to 30 days before the solstice, from 0 to 30 days after the solstice, and from 30 to 60 days after the solstice, respectively, for 60°N/S–82°N/S during 2005–2022. The 30 days after the solstice (in red curves) can be considered as the PMC formation phase and the 30 to 60 days after the solstice (in yellow curves) can be considered as the sublimation period. The 30 days before the solstice (in blue curves) can be considered as a background state profile which is not influenced by the PMC formation.
As seen in Figure 8a,b, the RHI profiles show a rapid increase in RHI with an increasing altitude from 0.02 hPa. In both hemispheres, enhanced RHI profiles above 0.02 hPa indicate the increase in RHI from altitudes near the bottom of the PMC layers from 0 to 30 days after the solstice. After 30 days from the solstice, the RHI profiles tend to go back to the background states in both hemispheres. In the SH, the RHI from 30 to 60 days after the solstice is slightly lower than the RHI before the solstice. It is noticeable that the hydration layers in the SH are elevated to above 0.01 hPa in comparison to those in the NH, and that this follows from SH PMC being located ∼1 km higher than that in the NH [62].
To show the differences in the RHI distribution among different periods around the summer solstice, the probability density functions (PDFs) from the same temporal and spatial conditions of RHI at 0.01 hPa are calculated (Figure 8c,d). The bin size is 5%, and the total integration of the area under each PDF is normalized to be one. The PDFs of RHI (%) during different periods indicate that supersaturation (above 100% of RHI) happens more frequently at 30 days after solstice, when PMCs are forming.

4.3. Diminishing Solar Cycle Variations in PMC

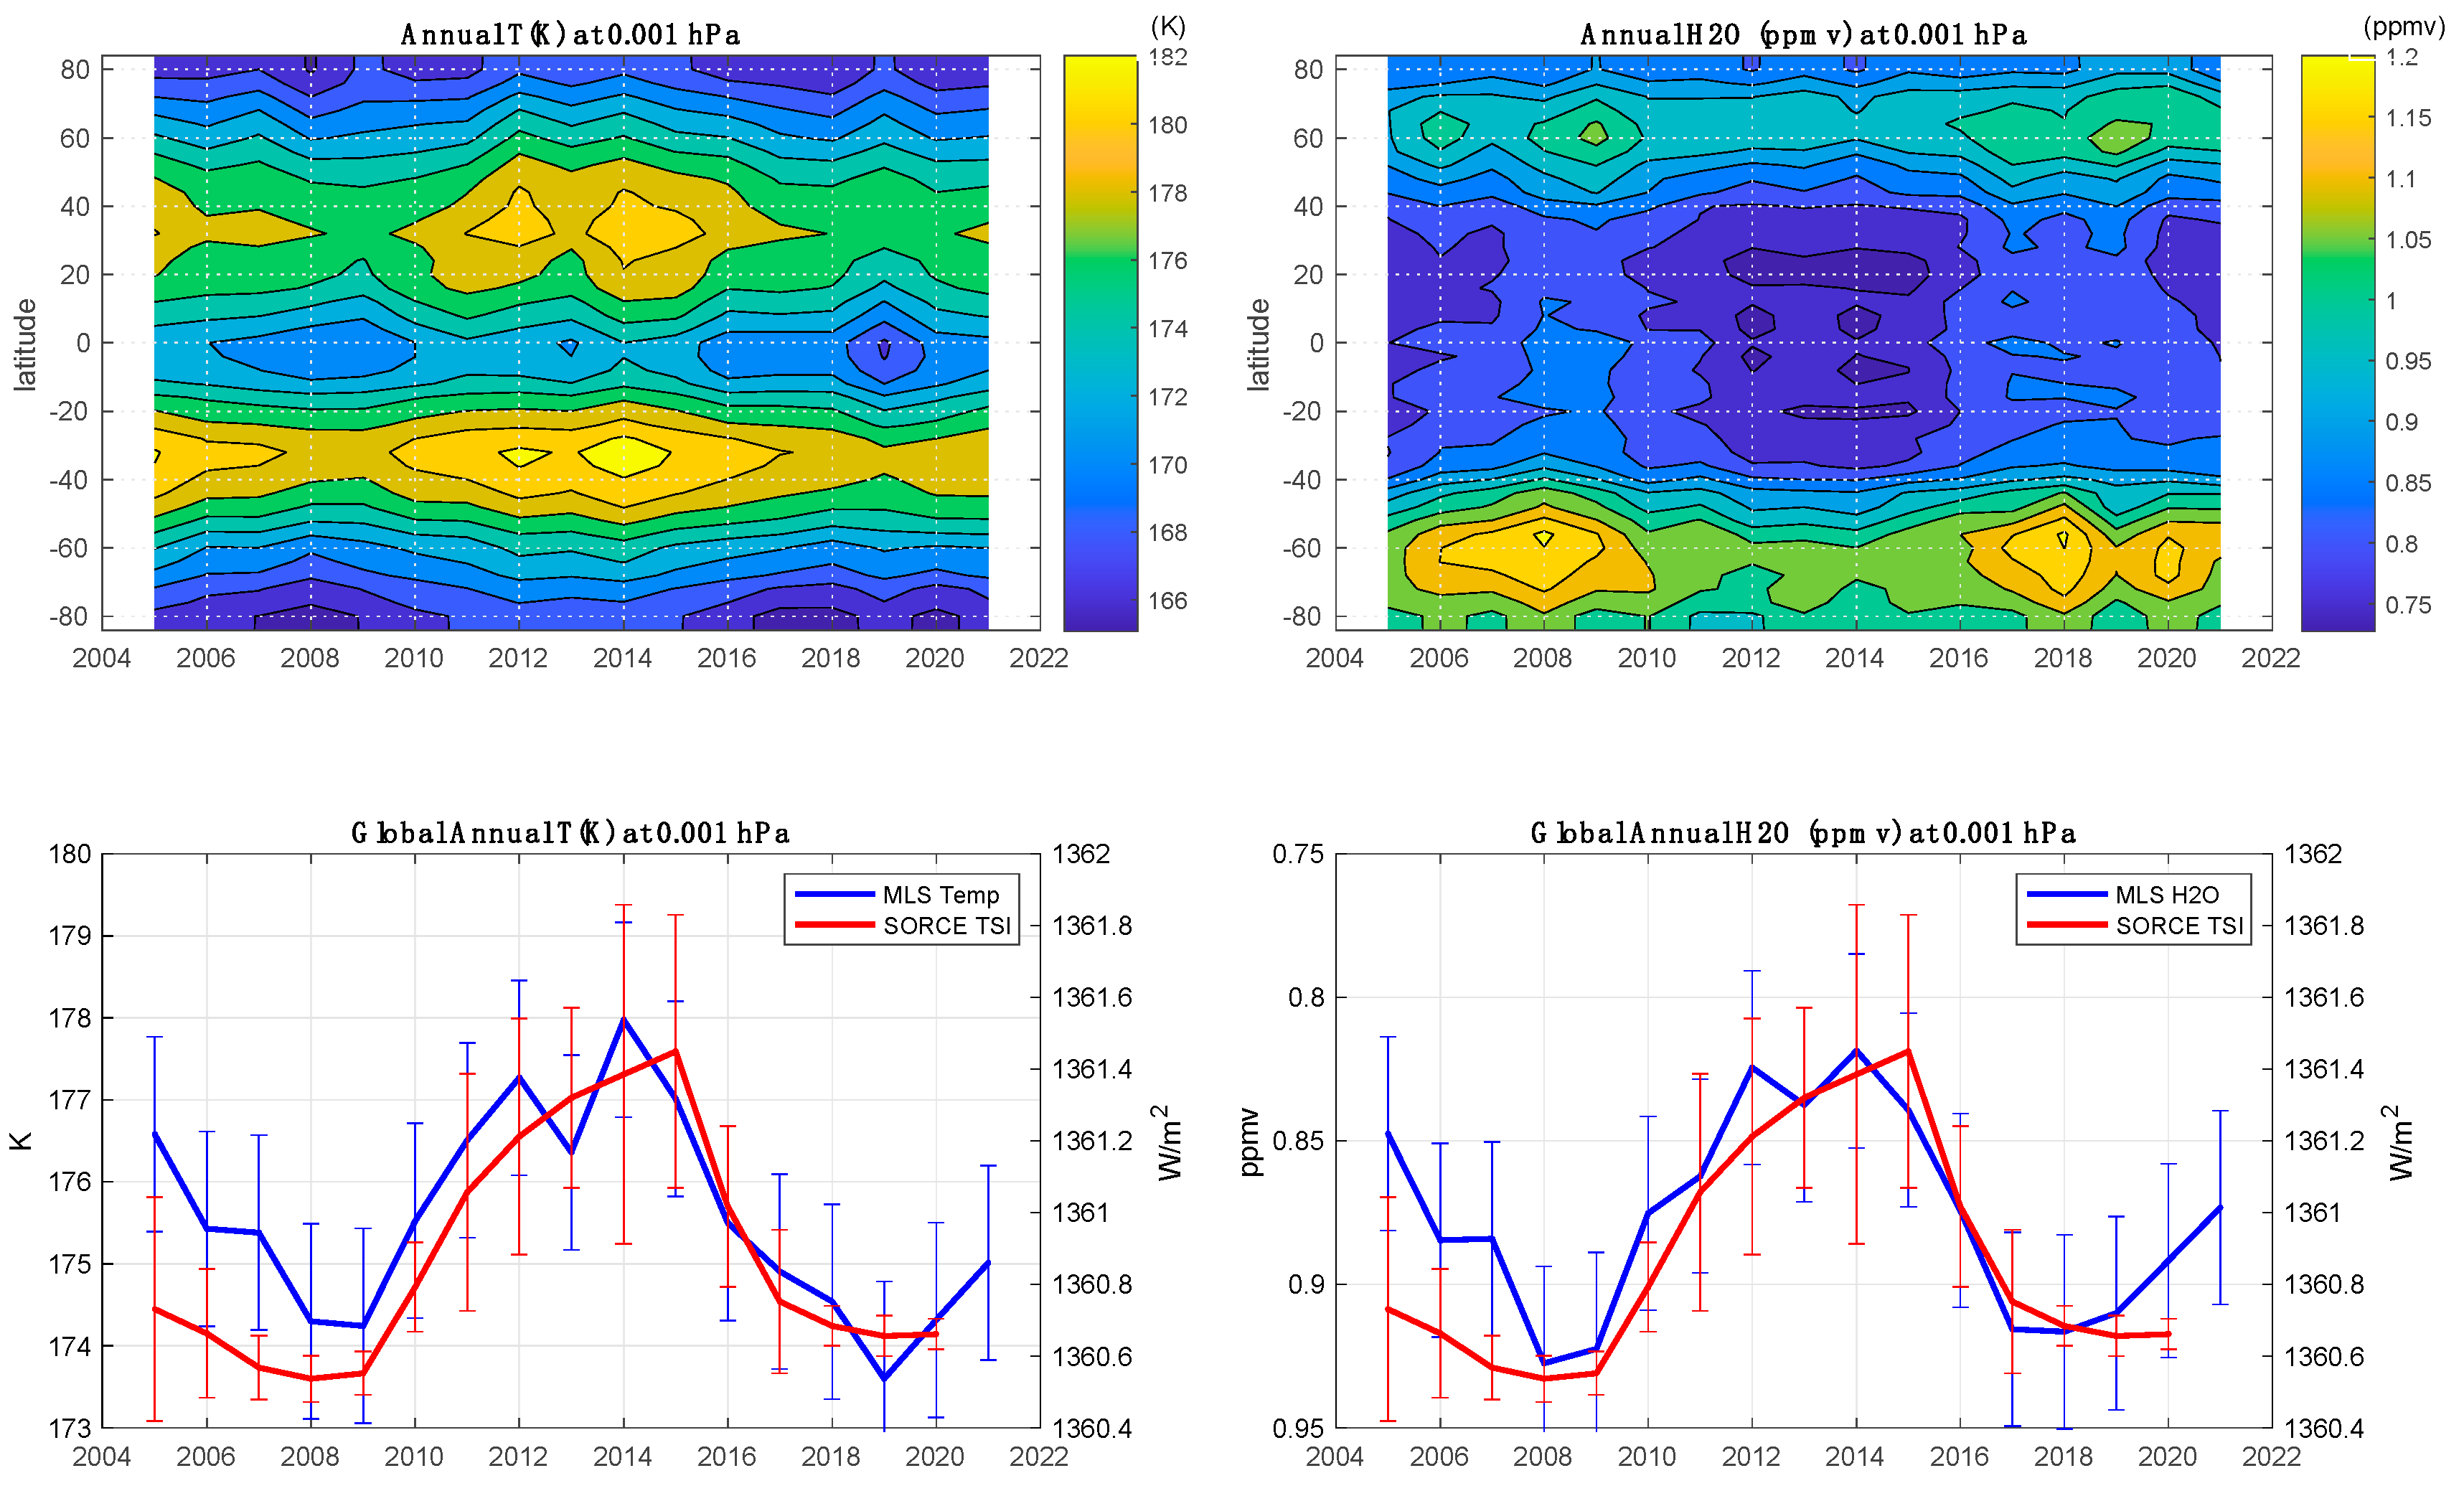
Discerning the near-term trends in the atmospheric tracers from the influence of the solar cycle variation is a challenging task. When the variation associated with the solar cycle is not thoroughly accounted for, there can be biases for any remaining trends. The variations in the annual mean near-global (82°S–82°N) area weighted T and H2O near the mesopause to the 11-year solar cycle are investigated by analyzing MLS observations from 2005 to 2021. In this study, the V19 Total Solar Irradiance (TSI) data from the SOlar Radiation and Climate Experiment (SORCE) Total Irradiance Monitor (TIM) [98] are used as a solar irradiance index, which can indicate the solar activity level over the solar cycle. With an absolute accuracy, the TSI can be the preferred reference data, compared to F10.7 flux and Ly-α flux, to determine the amplitude of solar cycle and difference between two minima. The TIM TSI data have a three times higher accuracy (0.035%) than previous TSI measurements with a long-term stability of 0.001% per year [99].
In Figure 9, the annual mean and standard deviations of T and H2O near the mesopause (0.001 hPa) are shown for the interannual variations related to the solar cycle. At a given level at 0.001 hPa, the annual mean temperature (Figure 9, left panel) is maximum at mid-latitudes (30°N/S–40°N/S) and minimum at high latitudes above 60°N/S. The annual mean temperature clearly shows interannual variations associated with the 11-year solar cycle (SC). The near-global mean temperature shows an in-phase correlation with the SORCE-measured TSI without lag (γ = 0.81) with a 95% confidence level [100], as the T is higher during the solar maximum (2012–2014) and lower during the solar minima (SC 24; 2007–2009 and SC25; 2018–2020). The amplitude of temperature variations associated with the solar cycle is ~5 K during SC 24–25.
The inferred annual mean temperature response to solar forcing from the Hamburg Model of Neutral and Ionized Components (HAMMONIA) is 0.5–1 K/100 sfu [101]. The solar cycle variation amplitude of the global mesopause temperature estimated from the Sounding of the Atmosphere using Broadband Emission Radiometry (SABER) is ~5 K [102] and 3–5 K [103,104] per 100 solar flux unit (sfu) depending on latitude. Since the F10.7 flux changes by roughly ~100 sfu over the 11-year solar cycle, our estimate corroborates with the previous results from the SABER measurements.
The analysis from satellite observations and model simulations suggests a decrease in mesospheric H2O with solar cycle [14,105] which may be less favorable for PMC formation. The Ly-α flux plays an important role in the chemical composition of H2O and the mesosphere [106], by the two major photolysis of H2O at the Ly-α line, i.e.,
H 2 O + h ν H + OH
H 2 O + h ν H 2 + O ( 1 )
For a given altitude at 0.001 hPa, the annual mean H2O VMR (Figure 9, right panel) generally increases with an increasing latitude in both hemispheres, reflecting the summertime upwelling of H2O following the mean meridional circulation, which maximizes at high latitudes. It shows a maximum amount over the SH high latitudes, 60 S–80 S. Similar to temperature, the near-global mean H2O VMR time series also clearly shows an 11-year solar cycle signal without lag (γ = −0.85 with 95% confidence level) with TSI. The response process of water vapor to solar forcing and the pathways of solar signals are complex, because the H2O VMR in the mesosphere is driven by two processes: transport and chemistry. The “top–down” pathway considers solar variations in the Lyman-α (121.6 nm) decreasing the mesospheric H2O, which then couples down to the stratosphere via a wintertime polar vortex [69]. In “bottom-up” pathway, the tropospheric H2O response may play a role because both H2O and CH4 in the stratosphere originate from here. With an increased solar flux during the solar maximum condition, a lower H2O in the upper mesosphere is expected due to the enhanced H2O photolysis process.
The amplitude of the solar-cycle-driven near-global annual mean H2O VMR is about 0.1 ppmv at near mesopause (0.001 hPa). This 0.1 ppmv solar variation in H2O is consistent with [106], shown with the composite data at 68°S and 68°N. The solar cycle signal is significant above 0.005 hPa. But below that level, H2O is insensitive to solar irradiance variation. While the solar maximum is generally expected to induce lower water vapor in the upper mesosphere, estimates of the solar cycle variation from H2O measurements often depend on the analysis period. For example, the relatively large amplitude of the H2O solar cycle variations over 1 ppmv obtained from the Halogen Occultation Experiment (HALOE) (1993–2005) is diminished after 2004. It was suggested that HALOE H2O measurements near the summer mesopause can be contaminated by PMCs [106]. Enhanced PMC extinction during the solar minimum can falsely increase H2O, and a higher H2O concentration during the solar minimum could have included this artifact.
Solar cycle variations are expected to disturb PMC formation by modulating the temperature and humidity in the middle atmosphere. A higher temperature [107] and H2O reduction by Ly-α flux-driven photolysis during the solar maximum period should provide less favorable conditions for PMC formation. However, quantifying solar cycle signals from PMCs from the data record covering less than a few solar cycles is a complicated exercise. Despite an expectation of the high sensitivity of PMCs to solar irradiance, little solar cycle signatures are found in the PMC occurrence during 2007–2021. The linear correlation between yearly PMC ORs and TSI from 2007 to 2021 is not significant (γ < 0.1) for both hemispheres, as can be seen from Figure 6 and Figure 7 in Section 3.4. The steady global increase in the mesospheric H2O during the last decade may have overwhelmed the H2O decrease driven by solar activity. Mesospheric H2O increases due to anthropogenic methane increases probably play a dominant role in weakening the solar cycle response in PMCs.

5. Summary

The sensitivities of PMCs to the MLS-measured T and H2O were analyzed to investigate the characteristics of PMC occurrence in relation to the middle atmosphere conditions. The AIM/CIPS and Himawari-8/AHI measurements of the PMC cover 16 years from 2007 and 6 years from 2016, respectively. The measurements of the middle atmosphere from MLS fully cover more than 18 years from August 2004.
  • We compared the climatology and year-to-year variability in the daily PMC ORs from AIM/CIPS and Himawari-8/AHI. Despite differences in the sampling and algorithms of the measurements, daily variations in the PMC occurrence rate in two independent measurements showed a remarkable similarity in their overall spatial extent, timing, and the duration of the cloud occurrence. The OR from AHI reached its maximum, within 80 N/S latitudes, about 20 days after the solstice, which was ~10 days earlier than that from CIPS. The climatologies of the two PMC ORs exhibited a hemispheric asymmetry between the two hemispheres, as the multiyear averaged PMC occurrence was more frequent in the NH than the SH in both observations.
  • The climatologies of the two PMC ORs were compared with the climatology of the summer solstice H2O VMR and T at the near-PMC level (0.02 hPa) at a high latitude (60°N/S–82°N/S). The PMC occurrence above 60°N/S was directly related to T and H2O variations, and the combination of these two determined the PMC’s seasonal development. In the CIPS case, the high frequency of the occurrence nearly co-occurred with a high H2O, but it lagged up to 30 days from the temperature drop. The date of the seasonal high latitude mesospheric H2O maxima seen from the MLS was up to 30 days later than the date of the corresponding local T minima. The lagged days between the PMC and T were reduced in the AHI-measured PMC ORs. In both cases, the PMC OR peak occurred between the T minima and H2O maxima.
  • We showed the spatial patterns of the H2O hole, a region of exceptionally depleted H2O in the upper mesosphere at 0.002 hPa during the PMC season over the Arctic and Antarctic beyond 70°N/S centered at the poles. We inferred that the H2O depletion in this region was probably caused by the formation of PMCs. These clouds dehydrate the surrounding atmosphere when they are formed. The H2O amount integrated below these PMC regions generally increased during the last 17 years in the NH. It showed consistent interannual variations similar to the CIPS- and AHI-measured PMC occurrence variations in the NH.
  • Our analysis estimated that the 11-year solar cycle signals in the near-global annual mean T and H2O were ~1 K and ~0.1 ppmv at mthe esopause level (0.001 hPa) with TSI variations without a lag (γ = 0.81 for T and γ = 0.85 for H2O with 95% confidence level), respectively. However, there was no significant anti-correlation between the PMC occurrence and solar cycle.
  • In the NH, the increases in PMC during recent years were correlated with the positive trend of the mesospheric H2O, as observed from MLS. Abundant H2O can significantly enhance the PMC formation. In the NH, the PMC onset dates also became 5–10 days earlier during the last decade. The NH PMC OR increased ~0.75%/year during 2007–2021. The significant increase in mesospheric H2O in the NH due to anthropogenic forcing during the last decade may explain the diminished solar cycle signals in PMC occurrences during recent years.
  • While PMC occurrences consistently increased in the NH, the SH PMC ORs showed a decrease (0.96%/year) during 2008–2022 with relatively low rates during recent years i.e., 2020–2022. In the SH, the summer mesospheric high-latitude T and H2O VMR time series showed a unique 4–5 years of quasi-quadrennial oscillations (QQOs). Similarly, the PMC OR and onset time also showed these distinct oscillations. The peak-to-peak amplitude of the QQO feature in PMC was 20–25%. The amplitude of mesospheric T and H2O at 0.01 hPa were 4–5 K and 0.3–0.5 ppmv, respectively. The cold years in the mesosphere coincided with the humid years with abundant H2O.
  • Solar cycle variations are expected to disturb PMC formation by modulating the temperature and humidity in the middle atmosphere. Higher temperature and H2O reduction by Ly-α flux-driven photolysis during solar maximum period should provide less favorable conditions for PMC formation. Despite an expectation of the high sensitivity of the PMC to the solar irradiance, little solar cycle signatures were found in the PMC occurrence during the analysis period of 2007–2021. The steady global increase in the mesospheric H2O due to anthropogenic methane increase during the last decade may have overwhelmed the H2O decrease driven by solar activity.

Author Contributions

Conceptualization, J.N.L. and D.L.W.; methodology, J.N.L. and D.L.W.; software, J.N.L., D.L.W., B.T., Y.H. and T.T.; validation, J.N.L., D.L.W., B.T., Y.H. and T.T.; formal analysis, J.N.L. and D.L.W.; investigation, J.N.L., D.L.W., B.T., Y.H. and T.T.; resources, B.T., Y.H. and T.T.; data curation, J.N.L., D.L.W., B.T., Y.H. and T.T.; writing—original draft preparation, J.N.L., D.L.W. and B.T.; writing—review and editing, B.T., Y.H. and T.T.; visualization, J.N.L.; supervision, D.L.W.; project administration, D.L.W.; funding acquisition, D.L.W. All authors have read and agreed to the published version of the manuscript.

Funding

This work is supported by NASA’s Sun-Climate research at Goddard Space Flight Center. BT was supported by NSF AGS award 2149483.

Data Availability Statement

MLS Level 2, version 5 temperature data can be downloaded from https://disc.gsfc.nasa.gov/datasets/ML2T_005/summary (accessed on 31 January 2023). MLS Level 2, version 5 water vapor data can be downloaded from https://disc.gsfc.nasa.gov/datasets/ML2H2O_005/summary (accessed on 31 January 2023). CIPS Level 3c, version 5.20, revision 05 data can be downloaded from https://lasp.colorado.edu/aim/download/pmc/l3c (accessed on 31 January 2023). The PMC data derived from the Himawari-8/AHI data are available from http://ttt01.cei.uec.ac.jp/himawari/ (accessed on 31 January 2023). The SORCE V19 TSI data can be downloaded from https://disc.gsfc.nasa.gov/datasets/SOR3TSID_019/summary (accessed on 31 January 2023).

Acknowledgments

We thank the MLS, CIPS, Himawari, and SORCE Science Team for making the data available on their websites. We also thank editors and anonymous reviewers for their suggestions that helped to greatly improve this manuscript.

Conflicts of Interest

The authors declare no conflict of interest.

References

  1. Siskind, D.E.; Merkel, A.W.; Marsh, D.R.; Randall, C.E.; Hervig, M.E.; Mlynczak, M.G.; Russell, J.M., III. Understanding the effects of polar mesospheric clouds on the environment of the upper mesosphere and lower thermosphere. J. Geophys. Res. Atmos. 2018, 123, 11705–11719. [Google Scholar] [CrossRef]
  2. Dunkerton, T. On the Mean Meridional Mass Motions of the Stratosphere and Mesosphere. J. Atmos. Sci. 1978, 35, 2325–2333. [Google Scholar] [CrossRef]
  3. Holton, J.R. The dynamics of large scale atmospheric motions. Rev. Geophys. 1983, 21, 1021–1027. [Google Scholar] [CrossRef]
  4. Garcia, R.R.; Solomon, S. The effect of breaking gravity waves on the dynamics and chemical composition of the mesosphere and lower thermosphere. J. Geophys. Res. 1985, 90, 3850–3868. [Google Scholar] [CrossRef]
  5. McLandress, C. On the importance of gravity waves in the middle atmosphere and their parameterization in general circulation models. J. Atmos. Sol.-Terr. Phys. 1998, 60, 1357–1383. [Google Scholar] [CrossRef]
  6. Shepherd, T.G. Transport in the middle atmosphere. J. Meteorol. Soc. Jpn. 2007, 85B, 165–191. [Google Scholar] [CrossRef]
  7. Witt, G. The nature of noctilucent clouds. Space Res. IX 1969, 157–169. Available online: https://ui.adsabs.harvard.edu/abs/1969spre.conf..157W/abstract (accessed on 21 April 2024).
  8. Lübken, F.; Fricke, K.; Langer, M. Noctilucent clouds and the thermal structure near the Arctic mesopause in summer. J. Geophys. Res. 1996, 101, 9489–9508. [Google Scholar] [CrossRef]
  9. Lübken, F.-J. Thermal structure of the Arctic summer mesosphere. J. Geophys. Res. 1999, 10, 9135–9149. [Google Scholar] [CrossRef]
  10. Lübken, F.-J.; Latteck, R.; Becker, E.; Höffner, J.; Murphy, D. Using polar mesosphere summer echoes and stratospheric/mesospheric winds to explain summer mesopause jumps in Antarctica. J. Atmos. Sol.-Terr. Phys. 2017, 162, 106–115. [Google Scholar] [CrossRef]
  11. Roble, R.G.; Dickinson, R.E. How will changes in carbon dioxide and methane modify the mean structure of the mesosphere and thermosphere? Geophys. Res. Lett. 1989, 16, 1441–1444. [Google Scholar] [CrossRef]
  12. Lübken, F.-J.; Höffner, J.; Viehl, T.P.; Becker, E.; Latteck, R.; Kaifler, B.; Murphy, D.J.; Morris, R.J. Winter/summer transition in the Antarctic mesopause region. J. Geophys. Res. Atmos. 2015, 120, 12394–12409. [Google Scholar] [CrossRef]
  13. Yue, J.; Russell, J.; Gan, Q.; Wang, T.; Rong, P.; Garcia, R.; Mlynczak, M. Increasing Water Vapor in the Stratosphere and Mesosphere After 2002. Geophys. Res. Lett. 2019, 46, 13452–13460. [Google Scholar] [CrossRef]
  14. Dalin, P.; Perminov, V.; Pertsev, N.; Romejko, V. Updated long-term trends in mesopause temperature, airglow emissions, and noctilucent clouds. J. Geophys. Res. Atmos. 2020, 125, e2019JD030814. [Google Scholar] [CrossRef]
  15. Dalin, P.; Suzuki, H.; Pertsev, N.; Perminov, V.; Shevchuk, N.; Tsimerinov, E.; Zalcik, M.; Brausch, J.; McEwan, T.; McEachran, I.; et al. The strong activity of noctilucent clouds at middle latitudes in 2020. Polar Sci. 2022, 35, 100920. [Google Scholar] [CrossRef]
  16. DeLand, M.T.; Thomas, G.E. Updated PMC trends derived from SBUV randeldata. J. Geophys. Res. Atmos. 2015, 120, 2140–2166. [Google Scholar] [CrossRef]
  17. Shettle, E.P.; DeLand, M.T.; Thomas, G.E.; Olivero, J.J. Long term variations in the frequency of polar mesospheric clouds in the Northern Hemisphere from SBUV. Geophys. Res. Lett. 2009, 36, L02803. [Google Scholar] [CrossRef]
  18. Thomas, G.E.; Olivero, J.J.; Jensen, E.J.; Schröder, W.; Toon, O.B. Relation between increasing methane and the presence of ice clouds at the mesopause. Nature 1989, 338, 490–492. [Google Scholar] [CrossRef]
  19. Lübken, F.; Berger, U.; Baumgarten, G. On the Anthropogenic Impact on Long-Term Evolution of Noctilucent Clouds. Geophys. Res. Lett. 2018, 45, 6681–6689. [Google Scholar] [CrossRef]
  20. Thomas, G.E.; McPeters, R.D.; Jensen, E.J. Satellite observations of polar mesospheric clouds by the solar backscattered ultraviolet spectral radiometer: Evidence of a solar cycle dependence. J. Geophys. Res. 1991, 96, 927–939. [Google Scholar] [CrossRef]
  21. Benze, S.; Randall, C.E.; Karlsson, B.; Harvey, V.L.; DeLand, M.T.; Thomas, G.E.; Shettle, E.P. On the onset of polar mesospheric cloud seasons as observed by SBUV. J. Geophys. Res. Atmos. 2012, 117, D07104. [Google Scholar] [CrossRef]
  22. Fiedler, J.; Baumgarten, G.; Lübken, F.-J. NLC observations during one solar cycle above ALOMAR. J. Atmos. Sol.-Terres. Phys. 2008, 71, 424–433. [Google Scholar] [CrossRef]
  23. Hervig, M.; Siskind, D. Decadal and inter-hemispheric variability in polar mesospheric clouds, water vapor, and temperature. J. Atmos. Sol.-Terr. Phys. 2006, 68, 30–41. [Google Scholar] [CrossRef]
  24. Hervig, M.E.; Siskind, D.E.; Bailey, S.M.; Russell, J.M. The influence of PMCs on water vapor and drivers behind PMC variability from SOFIE observations. J. Atmos. Sol.-Terr. Phys. 2015, 132, 124–134. [Google Scholar] [CrossRef]
  25. Hervig, M.E.; Berger, U.; Siskind, D.E. Decadal variability in PMCs and implications for changing temperature and water vapor in the upper mesosphere. J. Geophys. Res. Atmos. 2016, 121, 2383–2392. [Google Scholar] [CrossRef]
  26. Turco, R.P.; Toon, O.B.; Whitten, R.C.; Keesee, R.G.; Hollenback, D. Noctilucent clouds: Simulation studies of their genesis, properties, and global influences. Planet. Space Sci. 1982, 30, 1147–1181. [Google Scholar] [CrossRef]
  27. Olivero, J.J.; Thomas, G.E. Climatology of polar mesospheric clouds. J. Atmos. Sci. 1986, 43, 1263–1274. [Google Scholar] [CrossRef]
  28. Jensen, E.; Thomas, G.E. A growth-sedimentation model of polar mesospheric clouds: Comparison with SME measurements. J. Geophys. Res. 1988, 93, 2461–2473. [Google Scholar] [CrossRef]
  29. Aschbrenner, R.; Griffin, J.; Snell, H.E. Polar Mesospheric Cloud Modeling and Seasonal Forecasts with Satellite Data. In Proceedings of the IGARSS 2008—2008 IEEE International Geoscience and Remote Sensing Symposium, Boston, MA, USA, 6–11 July 2008; pp. IV-1006–IV-1009. [Google Scholar] [CrossRef]
  30. Rapp, M.; Thomas, G.E. Modeling the microphysics of mesospheric ice particles: Assessment of current capabilities and basic sensitivities. J. Atmos. Sol.-Terr. Phys. 2006, 68, 715–744. [Google Scholar] [CrossRef]
  31. Nachbar, M.; Wilms, H.; Duft, D.; Aylett, T.; Kitajima, K.; Majima, T.; Plane, J.M.C.; Rapp, M.; Leisner, T. The impact of solar radiation on polar mesospheric ice particle formation. Atmos. Meas. Technol. 2019, 19, 4311–4322. [Google Scholar] [CrossRef]
  32. Nachbar, M.; Duft, D.; Leisner, T. The vapor pressure of liquid and solid water phases at conditions relevant to the atmosphere. J. Chem. Phys. 2019, 151, 064504. [Google Scholar] [CrossRef]
  33. Duft, D.; Nachbar, M.; Leisner, T. Unravelling the microphysics of polar mesospheric cloud formation. Atmos. Chem. Phys. 2019, 19, 2871–2879. [Google Scholar] [CrossRef]
  34. Leslie, R.C. Sky glows. Nature 1885, 32, 245. [Google Scholar]
  35. Gadsden, M.; Schröder, W. Noctilucent Clouds; Springer: New York, NY, USA, 1989. [Google Scholar]
  36. Gordley, L.L.; Hervig, M.E.; Fish, C.; Russell, J.M., III; Bailey, S.; Cook, J.; Hansen, S.; Shumway, A.; Paxton, G.; Deaver, L.; et al. The solar occultation for ice experiment. J. Atmos. Sol.-Terres. Phys. 2009, 71, 300–315. [Google Scholar] [CrossRef]
  37. Baumgarten, G.; Fiedler, J.; Lübken, F.; von Cossart, G. Particle properties and water content of noctilucent clouds and their interannual variation. J. Geophys. Res. 2008, 113, D06203. [Google Scholar] [CrossRef]
  38. Baumgarten, G.; Chandran, A.; Fiedler, J.; Hoffmann, P.; Kaifler, N.; Lumpe, J.; Merkel, A.; Randall, C.E.; Rusch, D.; Thomas, G. On the horizontal and temporal structure of noctilucent clouds as observed by satellite and lidar at ALOMAR (69N). Geophys. Res. Lett. 2012, 39, L01803. [Google Scholar] [CrossRef]
  39. Chu, X.; Gardner, C.S.; Roble, R.G. Lidar studies of interannual, seasonal, and diurnal variations of Polar Mesospheric Clouds at the south pole. J. Geophys. Res. Atmos. 2003, 108. [Google Scholar] [CrossRef]
  40. Chu, X.; Huang, W.; Fong, W.; Yu, Z.; Wang, Z.; Smith, J.A.; Gardner, C.S. First lidar observations of polar mesospheric clouds and Fe temperatures at McMurdo (77.8°S, 166.7°E), Antarctica. Geophys. Res. Lett. 2011, 38, L16810. [Google Scholar] [CrossRef]
  41. Fiedler, J.; Baumgarten, G.; von Cossart, G. Mean diurnal variations of noctilucent clouds during 7 years of lidar observations at ALOMAR. Ann. Geophys. 2005, 23, 1175–1181. [Google Scholar] [CrossRef]
  42. Fiedler, J.; Baumgarten, G.; Berger, U.; Hoffmann, P.; Kaifler, N.; Lübken, F.-J. NLC and the background atmosphere above ALOMAR. Atmos. Meas. Tech. 2011, 11, 5701–5717. [Google Scholar] [CrossRef]
  43. Fiedler, J.; Baumgarten, G.; Berger, U.; Gabriel, A.; Latteck, R.; Lübken, F.-J. On the early onset of the NLC season 2013 as observed at ALOMAR. J. Atmos. Sol.-Terr. Phys. 2015, 127, 73–77. [Google Scholar] [CrossRef]
  44. Gumbel, J.; Stegman, J.; Murtagh, D.P.; Witt, G. Scattering phase functions and particle sizes in noctilucent clouds. Geophys. Res. Lett. 2001, 28, 1415–1418. [Google Scholar] [CrossRef]
  45. Klekociuk, A.R.; Morris, R.J.; Innis, J.L. First Southern Hemisphere common-volume measurements of PMC and PMSE. Geophys. Res. Lett. 2008, 35, L24804. [Google Scholar] [CrossRef]
  46. Seele, C.; Hartogh, P. Water vapor of the polar middle atmosphere: Annual variation and summer mesosphere Conditions as observed by ground-based microwave spectroscopy. Geophys. Res. Lett. 1999, 26, 1517–1520. [Google Scholar] [CrossRef]
  47. Donahue, T.M.; Guenther, B.; Blamont, J.E. Noctilucent clouds in daytime: Circumpolar particulate layers near the summer mesopause. J. Atmos. Sci. 1972, 30, 515–517. [Google Scholar] [CrossRef]
  48. Bailey, S.M.; Merkel, A.W.; Thomas, G.E.; Carstens, J.N. Observations of polar mesospheric clouds from the SNOE satellite. J. Geophys. Res. 2005, 110, D13203. [Google Scholar] [CrossRef]
  49. von Savigny, C.; Petelina, S.V.; Karlsson, B.; Llewellyn, E.J.; Degenstein, D.A.; Lloyd, N.D.; Burrows, J.P. Vertical variation of NLC particle sizes retrieved from Odin/OSIRIS limb scattering observations. Geophys. Res. Lett. 2005, 32. [Google Scholar] [CrossRef]
  50. DeLand, M.T.; Shettle, E.P.; Thomas, G.E.; Olivero, J.J. A quarter-century of satellite PMC observations. J. Atmos. Sol.-Terres. Phys. 2006, 68, 9–29. [Google Scholar] [CrossRef]
  51. DeLand, M.T.; Thomas, G.E. Extending the SBUV polar mesospheric cloud data record with the OMPS NP. Atmos. Meas. Tech. 2019, 19, 7913–7925. [Google Scholar] [CrossRef]
  52. DeLand, M.T.; Gorkavyi, N. PMC observations from the OMPS Limb Profiler. J. Atmos. Sol.-Terr. Phys. 2021, 213, 105505. [Google Scholar] [CrossRef]
  53. Hervig, M.E.; Pagan, K.L.; Foschi, P.G. Analysis of polar stratospheric cloud measurements from AVHRR. J. Geophys. Res. 2001, 106, 10363–10374. [Google Scholar] [CrossRef]
  54. Hervig, M.E.; Gordley, L.L.; Stevens, M.; Russell, J.M.; Bailey, S.; Baumgarten, G. Interpretation of SOFIE PMC measurements: Cloud identification and derivation of mass density, particle shape, and particle size. J. Atmos. Sol.-Terr. Phys. 2009, 71, 316–330. [Google Scholar] [CrossRef]
  55. Hervig, M.E.; Stevens, M.H. Interpreting the 35 year SBUV PMC record with SOFIE observations. J. Geophys. Res. Atmos. 2014, 119, 12689–12705. [Google Scholar] [CrossRef]
  56. Russell, J.M., III; Bailey, S.M.; Gordley, L.L.; Rusch, D.W.; Horányi, M.; Hervig, M.E.; Merkel, A.W. The Aeronomy of Ice in the Mesosphere (AIM) mission: Overview and early science results. J. Atmos. Sol.-Terr. Phys. 2009, 71, 289–299. [Google Scholar] [CrossRef]
  57. Gadsden, M. Polar mesospheric clouds seen from geostationary orbit. J. Atmos. Sol.-Terr. Phys. 2000, 62, 31–36. [Google Scholar] [CrossRef]
  58. Hozumi, Y.; Tsuda, T.T.; Hosokawa, K.; Ando, Y.; Suzuki, H.; Murata, T.; Nakamura, T. Horizontal Movement of Polar Mesospheric Clouds Observed from the Himawari-8 Geostationary Meteorological Satellite. J. Geophys. Res. Atmos. 2021, 126, e2021JD035081. [Google Scholar] [CrossRef]
  59. Tsuda, T.T.; Hozumi, Y.; Kawaura, K.; Hosokawa, K.; Suzuki, H.; Nakamura, T. Initial report on polar mesospheric cloud observations by Himawari-8. Atmos. Meas. Tech. 2018, 11, 6163–6168. [Google Scholar] [CrossRef]
  60. Tsuda, T.T.; Hozumi, Y.; Kawaura, K.; Tatsuzawa, K.; Ando, Y.; Hosokawa, K.; Suzuki, H.; Murata, K.T.; Nakamura, T.; Yue, J.; et al. Detection of polar mesospheric clouds utilizing Himawari-8/AHI full-disk images. Earth Space Sci. 2022, 9, e2021EA002076. [Google Scholar] [CrossRef]
  61. Kishore, P.; Ratnam, M.V.; Velicogna, I.; Sivakumar, V.; Bencherif, H.; Clemesha, B.R.; Simonich, D.M.; Batista, P.P.; Beig, G. Long-term trends observed in the middle atmosphere temperatures using ground based LIDARs and satellite borne measurements. Ann. Geophys. 2014, 32, 301–317. [Google Scholar] [CrossRef]
  62. Bailey, S.M.; Merkel, A.W.; Thomas, G.E.; Rusch, D.W. Hemispheric differences in Polar Mesospheric Cloud morphology observed by the Student Nitric Oxide Explorer. J. Atmos. Sol.-Terr. Phys. 2007, 69, 1407–1418. [Google Scholar] [CrossRef]
  63. Beig, G.; Keckhut, P.; Lowe, R.P.; Roble, R.G.; Mlynczak, M.G.; Scheer, J.; Fomichev, V.I.; Offermann, D.; French, W.J.R.; Shepherd, M.G.; et al. Review of mesospheric temperature trends. Rev. Geophys. 2003, 41. [Google Scholar] [CrossRef]
  64. Ratnam, M.V.; Raj, S.A.; Qian, L. Long-term trends in the low-latitude middle atmosphere temperature and winds: Observations and WACCM-X model simulations. J. Geophys. Res. Space Phys. 2019, 124, 7320–7331. [Google Scholar] [CrossRef]
  65. Bailey, S.M.; Thurairajah, B.; Hervig, M.E.; Siskind, D.E.; Russell, J.M.; Gordley, L.L. Trends in the polar summer mesosphere temperature and pressure altitude from satellite observations. J. Atmos. Sol.-Terr. Phys. 2021, 220, 105650. [Google Scholar] [CrossRef]
  66. Lee, J.N.; Wu, D.L.; Manney, G.L.; Schwartz, M.J.; Lambert, A.; Livesey, N.J.; Minschwaner, K.R.; Pumphrey, H.C.; Read, W.G. Aura Microwave Limb Sounder observations of the polar middle atmosphere: Dynamics and transport of CO and H2O. J. Geophys. Res. Atmos. 2011, 116, D05110. [Google Scholar] [CrossRef]
  67. Solomon, S.; Rosenlof, K.H.; Portmann, R.W.; Daniel, J.S.; Davis, S.M.; Sanford, T.J.; Plattner, G.-K. Contributions of Stratospheric Water Vapor to Decadal Changes in the Rate of Global Warming. Science 2010, 327, 1219–1223. [Google Scholar] [CrossRef]
  68. Grygalashvyly, M.; Sonnemann, G. Trends of mesospheric water vapor due to the increase of methane—A model study particularly considering high latitudes. Adv. Space Res. 2006, 38, 2394–2401. [Google Scholar] [CrossRef]
  69. Salinas, C.C.J.H.; Chang, L.C.; Yue, J.; Qian, L.; Gan, Q.; Russell, J.; Mlynczak, M. Estimating the migrating diurnal tide component of mesospheric water vapor. J. Geophys. Res. Space Phys. 2022, 127, e2021JA030187. [Google Scholar] [CrossRef]
  70. Salinas, C.C.J.H.; Wu, D.L.; Lee, J.N.; Chang, L.C.; Qian, L.; Liu, H. Aura/MLS observes and SD-WACCM-X simulates the seasonality, quasi-biennial oscillation and El Niño–Southern Oscillation of the migrating diurnal tide driving upper mesospheric CO primarily through vertical advection. Atmos. Chem. Phys. 2023, 23, 1705–1730. [Google Scholar] [CrossRef]
  71. Schwartz, M.J.; Lambert, A.; Manney, G.L.; Read, W.G.; Livesey, N.J.; Froidevaux, L.; Ao, C.O.; Bernath, P.F.; Boone, C.D.; Cofield, R.E.; et al. Validation of the Aura Microwave Limb Sounder temperature and geopotential height measurements. J. Geophys. Res. 2008, 113, D15S11. [Google Scholar] [CrossRef]
  72. Schwartz, M.; Livesey, N.; Read, W. MLS/Aura Level 2 Temperature V005; Goddard Earth Sciences Data and Information Services Center (GES DISC): Pasadena, CA, USA, 2020. [Google Scholar] [CrossRef]
  73. Grieco, F.; Pérot, K.; Murtagh, D.; Eriksson, P.; Rydberg, B.; Kiefer, M.; Garcia-Comas, M.; Lambert, A.; Walker, K.A. Improvement of Odin/SMR water vapour and temperature measurements and validation of the obtained data sets. Atmos. Meas. Tech. 2001, 14, 5823–5857. [Google Scholar] [CrossRef]
  74. Read, W.G.; Lambert, A.; Bacmeister, J.; Cofield, R.E.; Christensen, L.E.; Cuddy, D.T.; Daffer, W.H.; Drouin, B.J.; Fetzer, E.; Froidevaux, L.; et al. Aura Microwave Limb Sounder upper tropospheric and lower stratospheric H2O and relative humidity with respect to ice validation. J. Geophys. Res. Atmos. 2007, 112, D24S35. [Google Scholar] [CrossRef]
  75. Read, W.G.; Shippony, Z.; Snyder, W.V. Microwave Limb Sounder Forward Model Algorithm Theoretical Basis Document; Technical Report; Jet Propulsion Laboratory: Pasadena, CA, USA, 2004; JPL D-18130. [Google Scholar]
  76. Goff, J.A.; Gratch, S. Low-pressure properties of water from −160 to 212 F, in Transactions of the American society of heating and ventilating engineers. In Proceedings of the 52nd Annual Meeting of the American Society of Heating and Ventilating Engineers, New York, NY, USA, 10–13 June 1946; pp. 95–122. [Google Scholar]
  77. Murphy, D.M.; Koop, T. Review of the vapour pressures of ice and supercooled water for atmospheric applications. Q. J. R. Meteorol. Soc. 2005, 131, 1539–1565. [Google Scholar] [CrossRef]
  78. McClintock, W.; Rusch, D.W.; Thomas, G.E.; Markel, A.W.; Lankton, M.R.; Drake, V.A.; Bailey, S.M.; Russel, J.M., III. The cloud imaging and particle size experiment on the aeronomy of ice in the mesosphere mission: Instrument concept, design, calibration, and on-orbit performance. J. Atmos. Sol.-Terres. Phys. 2009, 71, 340–355. [Google Scholar] [CrossRef]
  79. Carstens, J.N.; Bailey, S.M.; Lumpe, J.D.; Randall, C.E. Understanding uncertainties in the retrieval of polar mesospheric clouds from the cloud imaging and particle size experiment in the presence of a bright Rayleigh background. J. Atmos. Sol. -Terr. Phys. 2013, 104, 197–212. [Google Scholar] [CrossRef]
  80. Lumpe, J.D.; Bailey, S.M.; Carstens, J.N.; Randall, C.E.; Rusch, D.W.; Thomas, G.E.; Nielsen, K.; Jeppesen, C.; McClintock, W.E.; Merkel, A.W.; et al. Retrieval of polar mesospheric cloud properties from CIPS: Algorithm description, error analysis and cloud detection sensitivity. J. Atmos. Sol.-Terres. Phys. 2013, 104, 167–196. [Google Scholar] [CrossRef]
  81. States, R.J.; Gardner, C.S. Thermal Structure of the Mesopause Region (80–105 km) at 40°N Latitude. Part I: Seasonal Variations. J. Atmos. Sci. 2000, 57, 66–77. [Google Scholar] [CrossRef]
  82. Christensen, O.M.; Eriksson, P.; Urban, J.; Murtagh, D.; Hultgren, K.; Gumbel, J. Tomographic retrieval of water vapour and temperature around polar mesospheric clouds using Odin-SMR. Atmos. Meas. Technol. 2015, 8, 1981–1999. [Google Scholar] [CrossRef]
  83. Merkel, A.W.; Marsh, D.R.; Gettelman, A.; Jensen, E.J. On the relationship of polar mesospheric cloud ice water content, particle radius and mesospheric temperature and its use in multi-dimensional models. Atmos. Meas. Tech. 2009, 9, 8889–8901. [Google Scholar] [CrossRef]
  84. Flury, T.; Wu, D.L.; Read, W.G. Correlation among cirrus ice content, water vapor and temperature in the TTL as observed by CALIPSO and Aura/MLS. Atmos. Meas. Tech. 2012, 12, 683–691. [Google Scholar] [CrossRef]
  85. James, A.D.; Brooke, J.S.A.; Mangan, T.P.; Whale, T.F.; Plane, J.M.C.; Murray, B.J. Nucleation of nitric acid hydrates in polar stratospheric clouds by meteoric material. Atmos. Meas. Tech. 2018, 18, 4519–4531. [Google Scholar] [CrossRef]
  86. Berger, U.; von Zahn, U. Icy particles in the summer mesopause region: Three-dimensional modeling of their environment and two-dimensional modeling of their transport. J. Geophys. Res. 2002, 107, 1366. [Google Scholar] [CrossRef]
  87. Berger, U.; Lübken, F. Trends in mesospheric ice layers in the Northern Hemisphere during 1961–2013. J. Geophys. Res. Atmos. 2015, 120, 11277–11298. [Google Scholar] [CrossRef]
  88. Russell, J.M., III; Rong, P.; Bailey, S.M.; Hervig, M.E.; Petelina, S.V. Relationship between the summer mesopause and polar mesospheric cloud heights. J. Geophys. Res. Atmos. 2010, 115. [Google Scholar] [CrossRef]
  89. Shettle, E.P.; Nedoluha, G.E.; DeLand, M.T.; Thomas, G.E.; Olivero, J.J. SBUV observations of polar mesospheric clouds compared with MLS temperature and water vapor measurements. Geophys. Res. Lett. 2010, 37, L18810. [Google Scholar] [CrossRef]
  90. Karlsson, B.; Randall, C.E.; Shepherd, T.G.; Harvey, V.L.; Lumpe, J.; Nielsen, K.; Bailey, S.M.; Hervig, M.; Russell, J.M. On the seasonal onset of polar mesospheric clouds and the breakdown of the stratospheric polar vortex in the Southern Hemisphere. J. Geophys. Res. 2011, 116, D18107. [Google Scholar] [CrossRef]
  91. Thurairajah, B.; Bailey, S.M.; Harvey, V.L.; Randall, C.E.; France, J.A. The Role of the Quasi 5-Day Wave on the Onset of Polar Mesospheric Cloud Seasons in the Northern Hemisphere. J. Geophys. Res. Atmos. 2023, 128, e2022JD037982. [Google Scholar] [CrossRef]
  92. Li, H.; Wu, J.; Zhou, Z. The formation of multiple layers of ice particles in the polar summer mesopause region. Ann. Geophys. 2016, 34, 117–122. [Google Scholar] [CrossRef]
  93. Yang, C.; Li, T.; Lai, D.; Wang, X.; Xue, X.; Dou, X. The delayed response of the troposphere-stratosphere-mesosphere coupling to the 2019 southern SSW. Geophys. Res. Lett. 2022, 49, e2022GL101759. [Google Scholar] [CrossRef]
  94. Siskind, D.E.; Allen, D.R.; Randall, C.E.; Harvey, V.L.; Hervig, M.E.; Lumpe, J.; Thurairajah, B.; Bailey, S.M.; Russell, J.M. Extreme stratospheric springs and their consequences for the onset of polar mesospheric clouds. J. Atmos. Sol.-Terr. Phys. 2015, 132, 74–81. [Google Scholar] [CrossRef]
  95. French, W.; Mulligan, F.; Klekociuk, A. Analysis of 24 years of mesopause region OH rotational temperature observations at Davis, Antarctica—Part 1: Long-term trends. Atmos. Chem. Phys. 2020, 20, 6379–6394. [Google Scholar] [CrossRef]
  96. French, W.J.R.; Klekociuk, A.R.; Mulligan, F.J. Analysis of 24 years of mesopause region OH rotational temperature observations at Davis, Antarctica—Part 2: Evidence of a quasi-quadrennial oscillation (QQO) in the polar mesosphere. Atmos. Chem. Phys. 2020, 20, 8691–8708. [Google Scholar] [CrossRef]
  97. Chen, Z.; Schwartz, M.J.; Bhartia, P.K.; Schoeberl, M.; Kramarova, N.; Jaross, G.; DeLand, M. Mesospheric and upper stratospheric temperatures from OMPS-LP. Earth Space Sci. 2023, 10, e2022EA002763. [Google Scholar] [CrossRef]
  98. Kopp, G. SORCE Level 3 Total Solar Irradiance Daily Means V019; Goddard Earth Sciences Data and Information Services Center (GES DISC): Greenbelt, MD, USA, 2020. [Google Scholar] [CrossRef]
  99. Kopp, G. Science Highlights and Final Updates from 17 Years of Total Solar Irradiance Measurements from the SOlar Radiation and Climate Experiment/Total Irradiance Monitor (SORCE/TIM). Sol. Phys. 2021, 296, 133. [Google Scholar] [CrossRef] [PubMed]
  100. Angell, J.K.; Korshover, J. Comparison between sea surface temperature in the equatorial eastern Pacific and United States surface temperature. J. Appl. Meteorol. 1981, 20, 1105–1110. [Google Scholar] [CrossRef]
  101. Beig, G.; Fadnavis, S.; Schmidt, H.; Brasseur, G.P. Inter-comparison of 11-year solar cycle response in mesospheric ozone and temperature obtained by HALOE satellite data and HAMMONIA model. J. Geophys. Res. Atmos. 2012, 117. [Google Scholar] [CrossRef]
  102. Tang, C.; Liu, D.; Wei, H.; Wang, Y.; Dai, C.; Wu, P.; Zhu, W.; Rao, R. The response of the temperature of cold-point mesopause to solar activity based on SABER data set. J. Geophys. Res. Space Phys. 2016, 121, 7245–7255. [Google Scholar] [CrossRef]
  103. Forbes, J.M.; Zhang, X.; Marsh, D.R.; Al, F.E.T. Solar cycle dependence of middle atmosphere temperatures. J. Geophys. Res. Atmos. 2014, 119, 9615–9625. [Google Scholar] [CrossRef]
  104. Remsberg, E.; Damadeo, R.; Natarajan, M.; Bhatt, P. Observed responses of mesospheric water vapor to solar cycle and dynamical forcings. J. Geophys. Res. Atmos. 2018, 123, 3830–3843. [Google Scholar] [CrossRef] [PubMed]
  105. Vardavas, I.M.; Carver, J.H.; Taylor, F.W. The role of water-vapour photodissociation on the formation of a deep minimum in mesopause ozone. Ann. Geophys. 1998, 16, 189–196. [Google Scholar] [CrossRef]
  106. Hervig, M.E.; Siskind, D.E.; Bailey, S.M.; Merkel, A.W.; DeLand, M.T.; Russell, J.M. The Missing Solar Cycle Response of the Polar Summer Mesosphere. Geophys. Res. Lett. 2019, 46, 10132–10139. [Google Scholar] [CrossRef]
  107. Lee, J.N.; Wu, D.L.; Ruzmaikin, A.; Fontenla, J. Solar cycle variations in mesospheric carbon monoxide. J. Atmos. Sol.-Terr. Phys. 2018, 170, 21–34. [Google Scholar] [CrossRef]
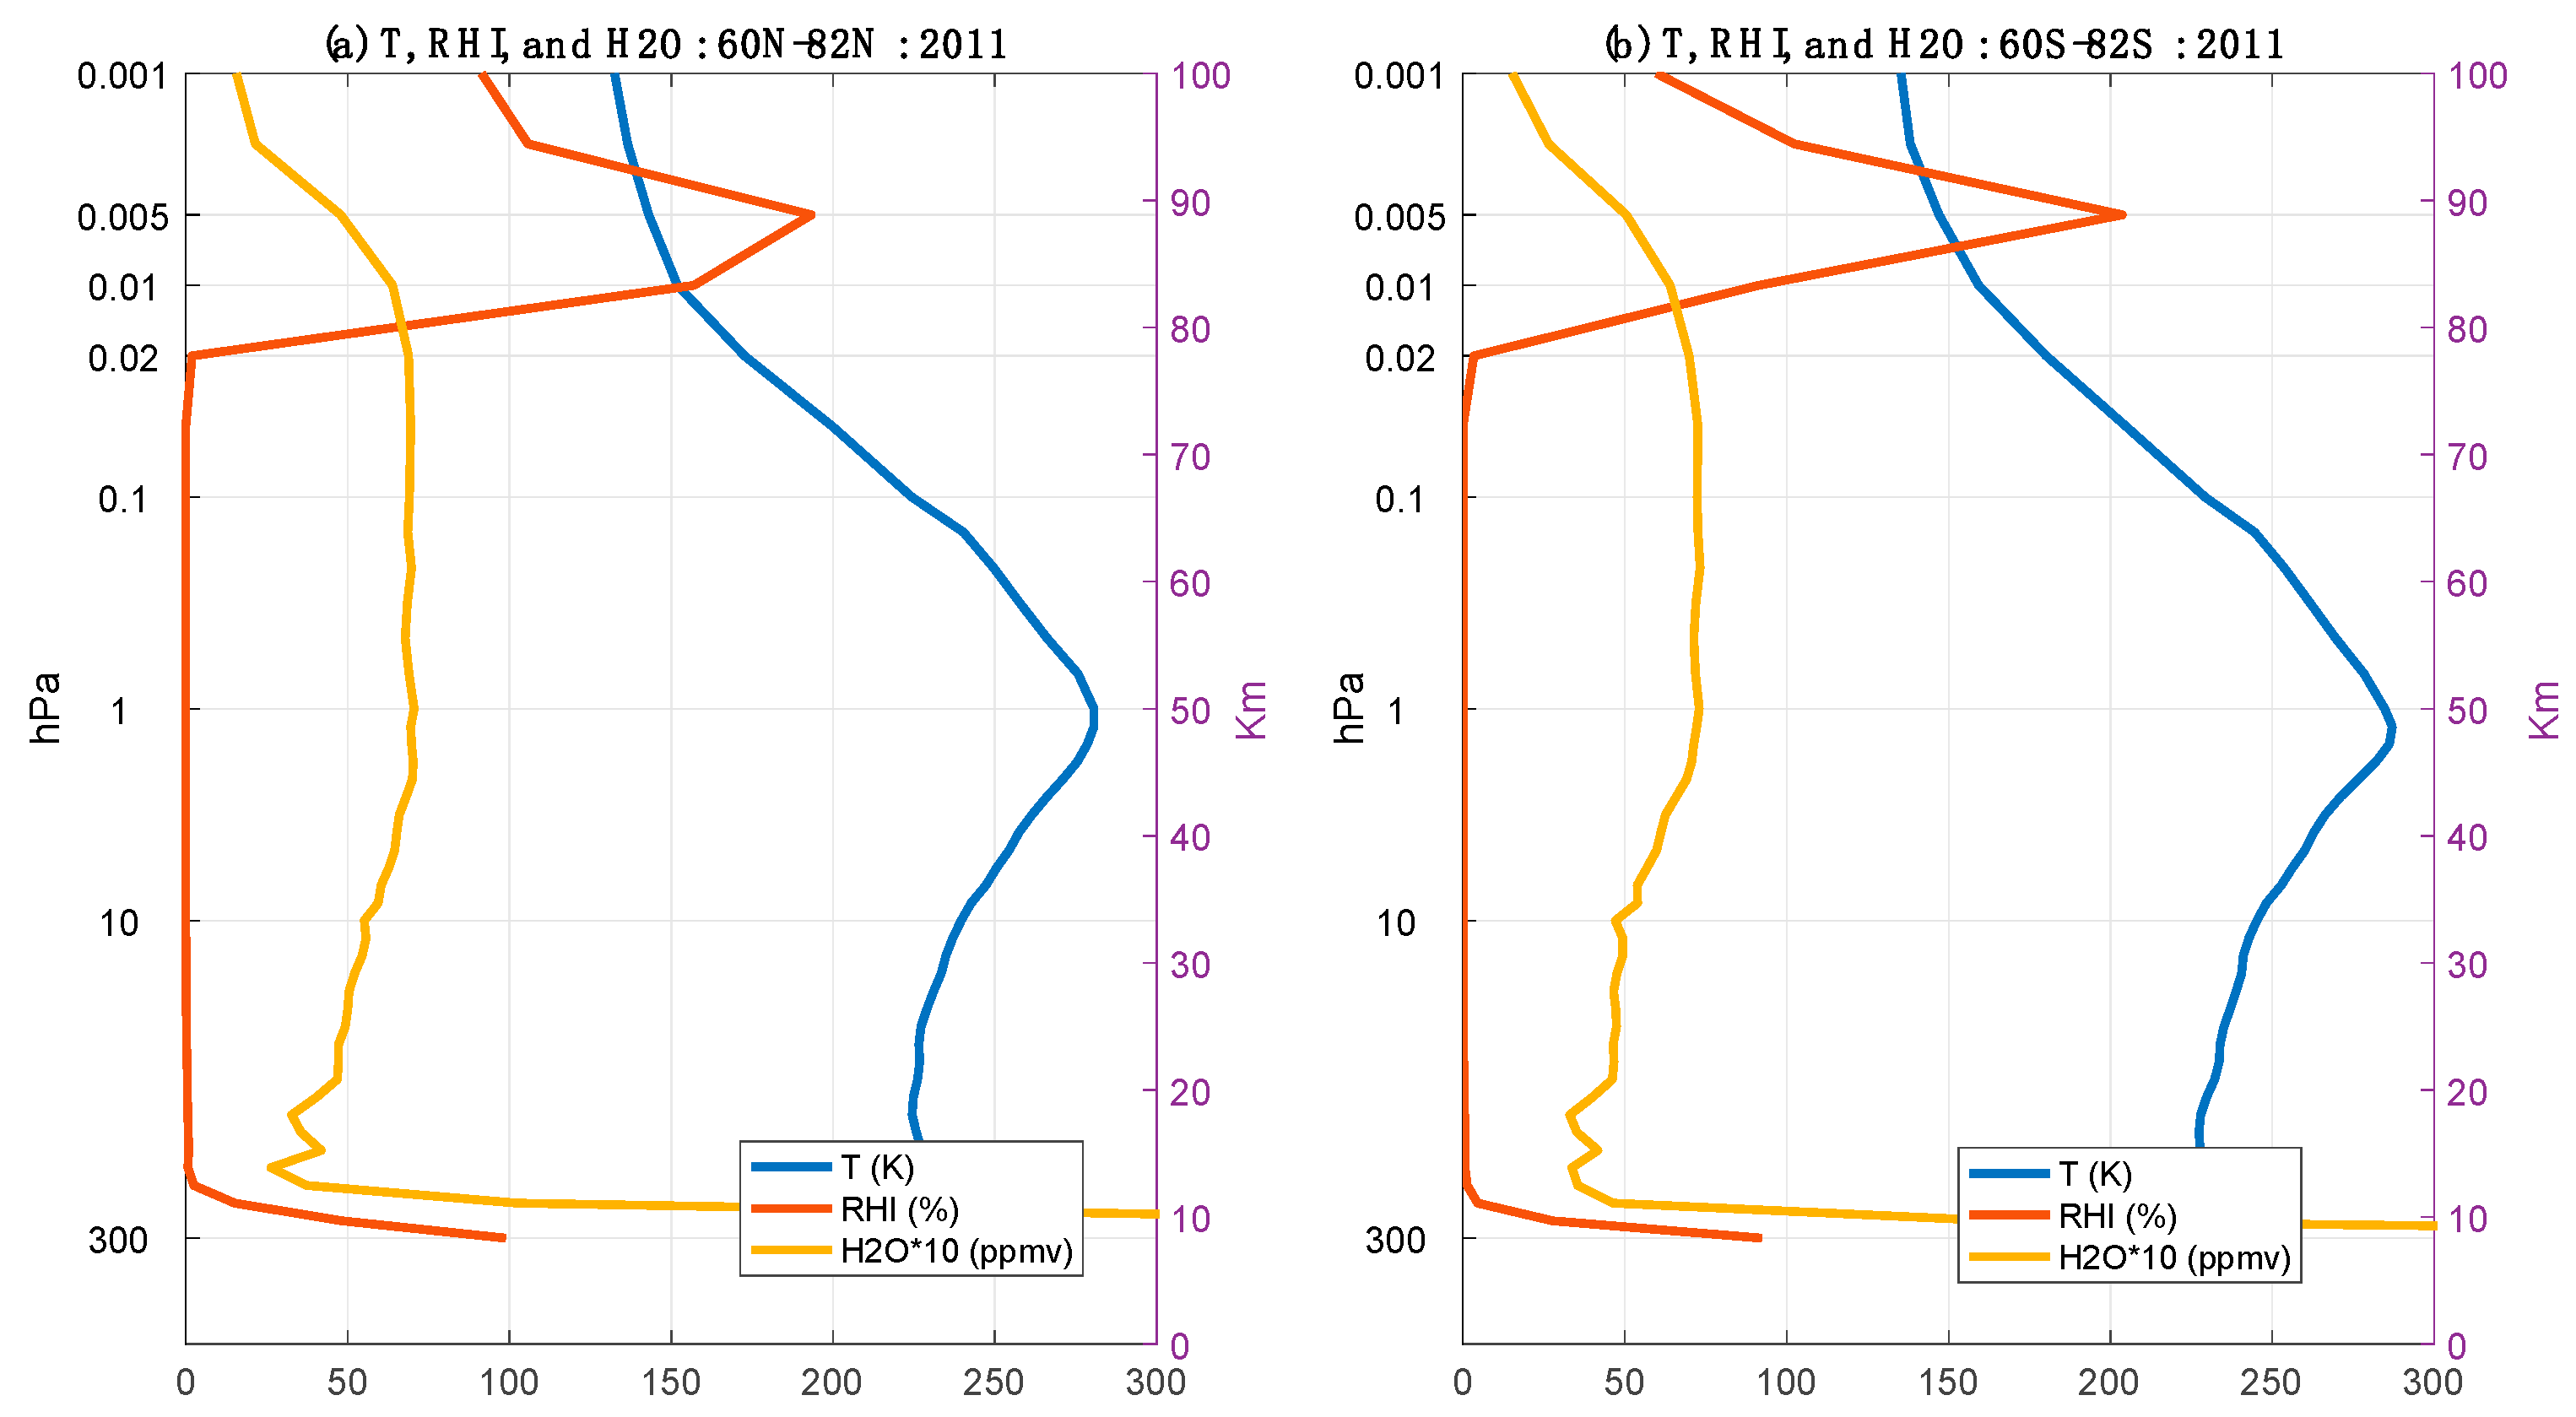
Figure 1. Profiles of MLS T (K), RHI (%), and H2O (ppmv) averaged over 30 days after the 2011 summer solstice for the (a) NH and (b) SH.
Remotesensing 16 01563 g001
Figure 2. Latitude height distribution of MLS T (K) (left panel) and H2O (ppmv) (right panel) monthly zonal mean climatology calculated during 2005–2021.
Remotesensing 16 01563 g002
Figure 3. MLS zonal daily mean H2O VMR climatology (ppmv) in the mesosphere at 0.02, 0.01, 0.005, 0.002, and 0.001 hPa for the NH (left column) and SH (right column) (2005–2021). Black lines indicate local summer solstices. Above 0.01 hPa, white dotted contour lines represent T at 150 K, and solid lines represent T at 140 K (lower latitudes) and 130 K (higher latitudes), respectively.
Remotesensing 16 01563 g003
Figure 4. The H2O dehydration (in ppmv) at 0.002 hPa due to PMC formation in 2007 NH and 2007/2008 SH summer seasons. H2O VMRs are averaged for 0 to 30 days from summer solstice (a) for the NH and (b) for the SH, respectively. Similarly, the H2O (in ppmv) at 0.01 hPa is shown (c) for the NH and (d) for the SH. Overlaid blue lines represent a temperature contour of 140 K for 0.002 hPa and 150 K for 0.01 hPa.
Remotesensing 16 01563 g004
Figure 5. Climatology of the daily PMC occurrence rate (OR) in % as observed from AIM/CIPS (upper panel: 2007–2021) and Himawari-8/AHI (lower panel: 2016–2021) in the NH and SH at each latitude bin. Black lines indicate the day of local summer solstice. Solid and dotted contour lines in magenta represent high latitude (60°N/S–82°N/S) H2O VMR of 7.1 ppmv and 7.5 ppmv, respectively, at 0.02 hPa (near PMC altitude). White lines represent high latitude mean T = 173 K (NH) and T = 178 K (SH) at the same level.
Remotesensing 16 01563 g005
Figure 6. Interannual variations in the CIPS PMC onset date (in yellow) and onset date of the high H2O (in blue) VMR and low temperature (in red) with respect to the summer solstice in the (a) NH and (b) SH. Note the different y axes for each hemisphere’s PMC season.
Remotesensing 16 01563 g006
Figure 7. Year-to-year variations in seasonal mean PMC occurrence Rate (%) for NH (ac) and SH (df) from CIPS (in blue) and AHI (in red). Similarly, year-to-year variations in MLS H2O (ppmv), RHI (%), and T beyond 62°N/S at 0.01 hPa are given on the right axis. H2O VMR, RHI, and T are averaged for 0 to 30 days from summer solstice for each hemisphere. The y-axis for T is reversed for a better presentation. The vertical bars indicate standard deviations for the MLS variables.
Remotesensing 16 01563 g007
Figure 8. Comparison of profiles of MLS RHI (%) among different periods around summer solstice in (a) NH and (b) SH. Comparison of probability density function (PDF) of RHI in (c) NH and (d) SH. RHI data at 0.01 hPa are averaged for 0 to 30 days before solstice (in blue), 0 to 30 days after solstice (in red), and 30 to 60 days after solstice (in yellow), respectively, for 60°–82°N/S latitude band during 2005–2021.
Remotesensing 16 01563 g008
Figure 9. Latitudinal distribution of annual mean temperature (K) and H2O (ppmv) at 0.001 hPa is shown in the upper panel. The near-global averaged (82°S–82°N) annual mean time series and their standard deviations are shown in the lower panel with SORCE TSI (W/m2) variation. The y-axis for H2O plot (lower right) is reversed for a better presentation.
Remotesensing 16 01563 g009
Disclaimer/Publisher’s Note: The statements, opinions and data contained in all publications are solely those of the individual author(s) and contributor(s) and not of MDPI and/or the editor(s). MDPI and/or the editor(s) disclaim responsibility for any injury to people or property resulting from any ideas, methods, instructions or products referred to in the content.