Article

Discontinuous Surface Ruptures and Slip Distributions in the Epicentral Region of the 2021 Mw7.4 Maduo Earthquake, China

1
Institute of Surface-Earth System Science, School of Earth System Science, Tianjin University, Tianjin 300072, China
2
State Key Laboratory of Earthquake Dynamics, Institute of Geology, China Earthquake Administration, Beijing 100029, China
3
Key Laboratory of Earthquake Geodesy, Institute of Seismology, China Earthquake Administration, Wuhan 430071, China
4
Earthquake Agency of Qinghai Province, Xining 810001, China
*
Author to whom correspondence should be addressed.
Remote Sens. 2024, 16(7), 1250; https://doi.org/10.3390/rs16071250
Submission received: 21 July 2023 / Revised: 30 December 2023 / Accepted: 4 January 2024 / Published: 1 April 2024

Abstract

:
Geometric complexities play an important role in the nucleation, propagation, and termination of strike-slip earthquake ruptures. The 2021 Mw7.4 Maduo earthquake rupture initiated at a large releasing stepover with a complex fault intersection. In the epicentral region, we conducted detailed mapping and classification of the surface ruptures and slip measurements associated with the earthquake, combining high-resolution uncrewed aerial vehicle (UAV) images and optical image correlation with field investigations. Our findings indicate that the coseismic ruptures present discontinuous patterns mixed with numerous lateral spreadings due to strong ground shaking. The discontinuous surface ruptures are uncharacteristic in slip to account for the large and clear displacements of offset landforms in the epicentral region. Within the releasing stepovers, the deformation zone revealed from the optical image correlation map indicates that a fault may cut diagonally across the pull-apart basin at depth. The left-lateral horizontal coseismic displacements from field measurements are typically ≤0.6 m, significantly lower than the 1–2.7 m measured from the optical image correlation map. Such a discrepancy indicates a significant proportion of off-fault deformation or the possibility that the rupture stopped at a shallow depth during its initiation phase instead of extending to the surface. The fault network and multi-fault junctions west and south of the epicenter suggest a possible complex path, which retarded the westward propagation at the initial phase of rupture growth. A hampered initiation might enhance the seismic ground motion and the complex ground deformation features at the surface, including widespread shaking-related fissures.

1. Introduction

Fault geometrical complexities, such as bends, branches, and stepovers, are widespread in strike-slip fault systems and separate the fault into segments of varying lengths [1,2,3]. These geometrical complexities can play a critical role in the initiation, propagation, and termination of earthquake ruptures [4,5,6,7,8,9,10] depending on the accumulated initial stress before an earthquake as well as the dynamic stresses during the seismic rupture [11,12,13]. Additionally, these geometrical complexities can impact the coseismic surface rupture pattern, slip distribution, and off-fault deformation, which is of significant importance for understanding fault mechanics, rupture dynamics, and seismic hazard analysis [14,15,16,17].
A compilation of recent ground-rupturing earthquakes worldwide demonstrates that many earthquake ruptures initiate from the geometrical complexity. For instance, King and Nabelek (1985) reviewed eight earthquakes with Ms > 5.7 between 1966 and 1984 that initiated around fault bends [4]. Additionally, Ansari (2021) presented twelve earthquake ruptures that started near fault intersections, restraining stepovers, bends, and fault linkages in Iran [18]. Moreover, the 1994 Gerede-Bolu and the 1951 Kursunlu earthquake ruptures started from the same releasing stepover in Turkey [19]. These cases indicate that the geometrical complexities are locations where significant stress accumulated, making them highly prone to future earthquakes [4,12,20].
The Mw7.4 Maduo earthquake on 22 May 2021 nucleated from a large releasing stepover and bilaterally propagated along the Jiangcuo fault. This earthquake resulted in approximately 158 km of surface ruptures with eight segments separated by stepover, fault bends, and branches [21,22,23,24,25] (Figure 1). Most of the rupture zone exhibits trans-tensional features such as tensional cracks and ridges side by side in pairs. These features appear variably distributed in a wide area or concentrated in one or several localized shear zones [21]. Surface rupture mapping also reveals two distinct discontinuous fracture segments, which were poorly mapped before this earthquake [26,27] (Figure 2a). One of these discontinuous fracture segments, located 40–60 km east of the epicenter, may be attributed to the spreading near-surface sand-dune area, resulting in more distributed deformation rather than clear rupture [26]. However, as for the discontinuous fracture segment in the epicentral region, a recent study labeled all of these fractures as secondary ruptures and described the whole segment as a large surface rupture gap [26]. They thus mixed the tectonic-induced ruptures with numerous lateral spreadings, consequently overlooking the actual surface rupture pattern and fault geometry. Moreover, the slip measurements in the epicentral region are also very few, making it challenging to illustrate the relation between the fault geometry and rupture propagation [22,23,26]. However, detailed mapping of the surface rupture pattern, as well as the coseismic slip are essential in providing constraints for understanding the impact of geometrical complexities on the initiation and propagation in the epicentral region [6,12,15,28,29,30].
Researchers normally carry out surface rupture mapping and slip measurements in the field [30,33,34,35,36] or by using satellite optical images [37,38] after an earthquake occurs in the Qinghai-Xizang (Tibet) Plateau. Recent advancements in uncrewed aerial vehicle (UAV) aerial photogrammetry technology have significantly improved the visualization of surface morphology with unprecedented higher resolution [21,39,40,41]. Additionally, the development of optical image correlation technology allows for quantifying the deformation within an entire deformation zone [15,42,43]. In this study, we present detailed mapping and classification of the 2021 Maduo earthquake surface fractures and slip measurements in the epicentral region in detail. Furthermore, by using the optical image correlation technology, we analyzed both the parallel and perpendicular components of the horizontal coseismic slip and the width of the fault deformation zone [15,42,43,44]. We then evaluated the percentage of off-fault deformation that diffused into the adjacent zone of the surface rupture by comparing the slip distribution from the optical image correlation with discrete field measurements [42,43].

2. Geological and Geodynamic Setting

The ongoing collision between the Indian and Eurasian plates has led to the deformation and uplift of the Qinghai–Xizang (Tibet) Plateau and the eastward extrusion of blocks along a series of significant strike-slip faults [31,45,46,47,48]. Among these blocks, the Bayan Har block is one of the most seismically active blocks, bounded by the Kunlun fault to the north [49], the Altyn Tagh fault to the northwest, the Ganzi-Yushu-Xianshuihe fault to the south [50,51], and the Longmenshan fault to the east [52,53] (Figure 1). Over the last three decades, several strong earthquakes have occurred on these block-bounding faults, such as the 1997 Manyi Ms7.5 earthquake [38,54,55], the 2008 Yutian Ms7.3 earthquake [34,56,57], the 2008 Wenchuan Ms8.0 earthquake [35,58,59,60,61,62], and the 2001 Kunlun Ms8.1 earthquake [30,37,63] (Figure 1).
In addition to these prominent boundary faults, several small, active strike-slip faults exist within the Bayan Har Block, including the Jiangcuo, Maduo, Gande South, and Dari faults, which also contribute to the slip budget of the Block [48,64]. However, only two large earthquakes with magnitudes >7.5 are recorded in the Bayan Har Block: the 1947 M7.7 Dari earthquake, resulting in a >70 km-long surface rupture [65]; and the 1933 M7.5 Diexi earthquake, with an ~24 km long surface rupture along the Songpinggou fault [66]. The Jiangcuo fault, responsible for the 2021 Mw7.4 Maduo earthquake in the central-eastern part of the Bayan Har block aligns with the easternmost Kunlun pass segment of the 2001 Kunlun earthquake rupture to the west [30,37]. This seismogenic fault might also tend to short-cut the Anyemaqen bend to the east [22]. The ~110° striking Jiangcuo fault was not well-mapped prior to the Maduo earthquake, primarily due to its remote location, weak displaced topography imprint, and suspected low Quaternary activity [21,22,26].
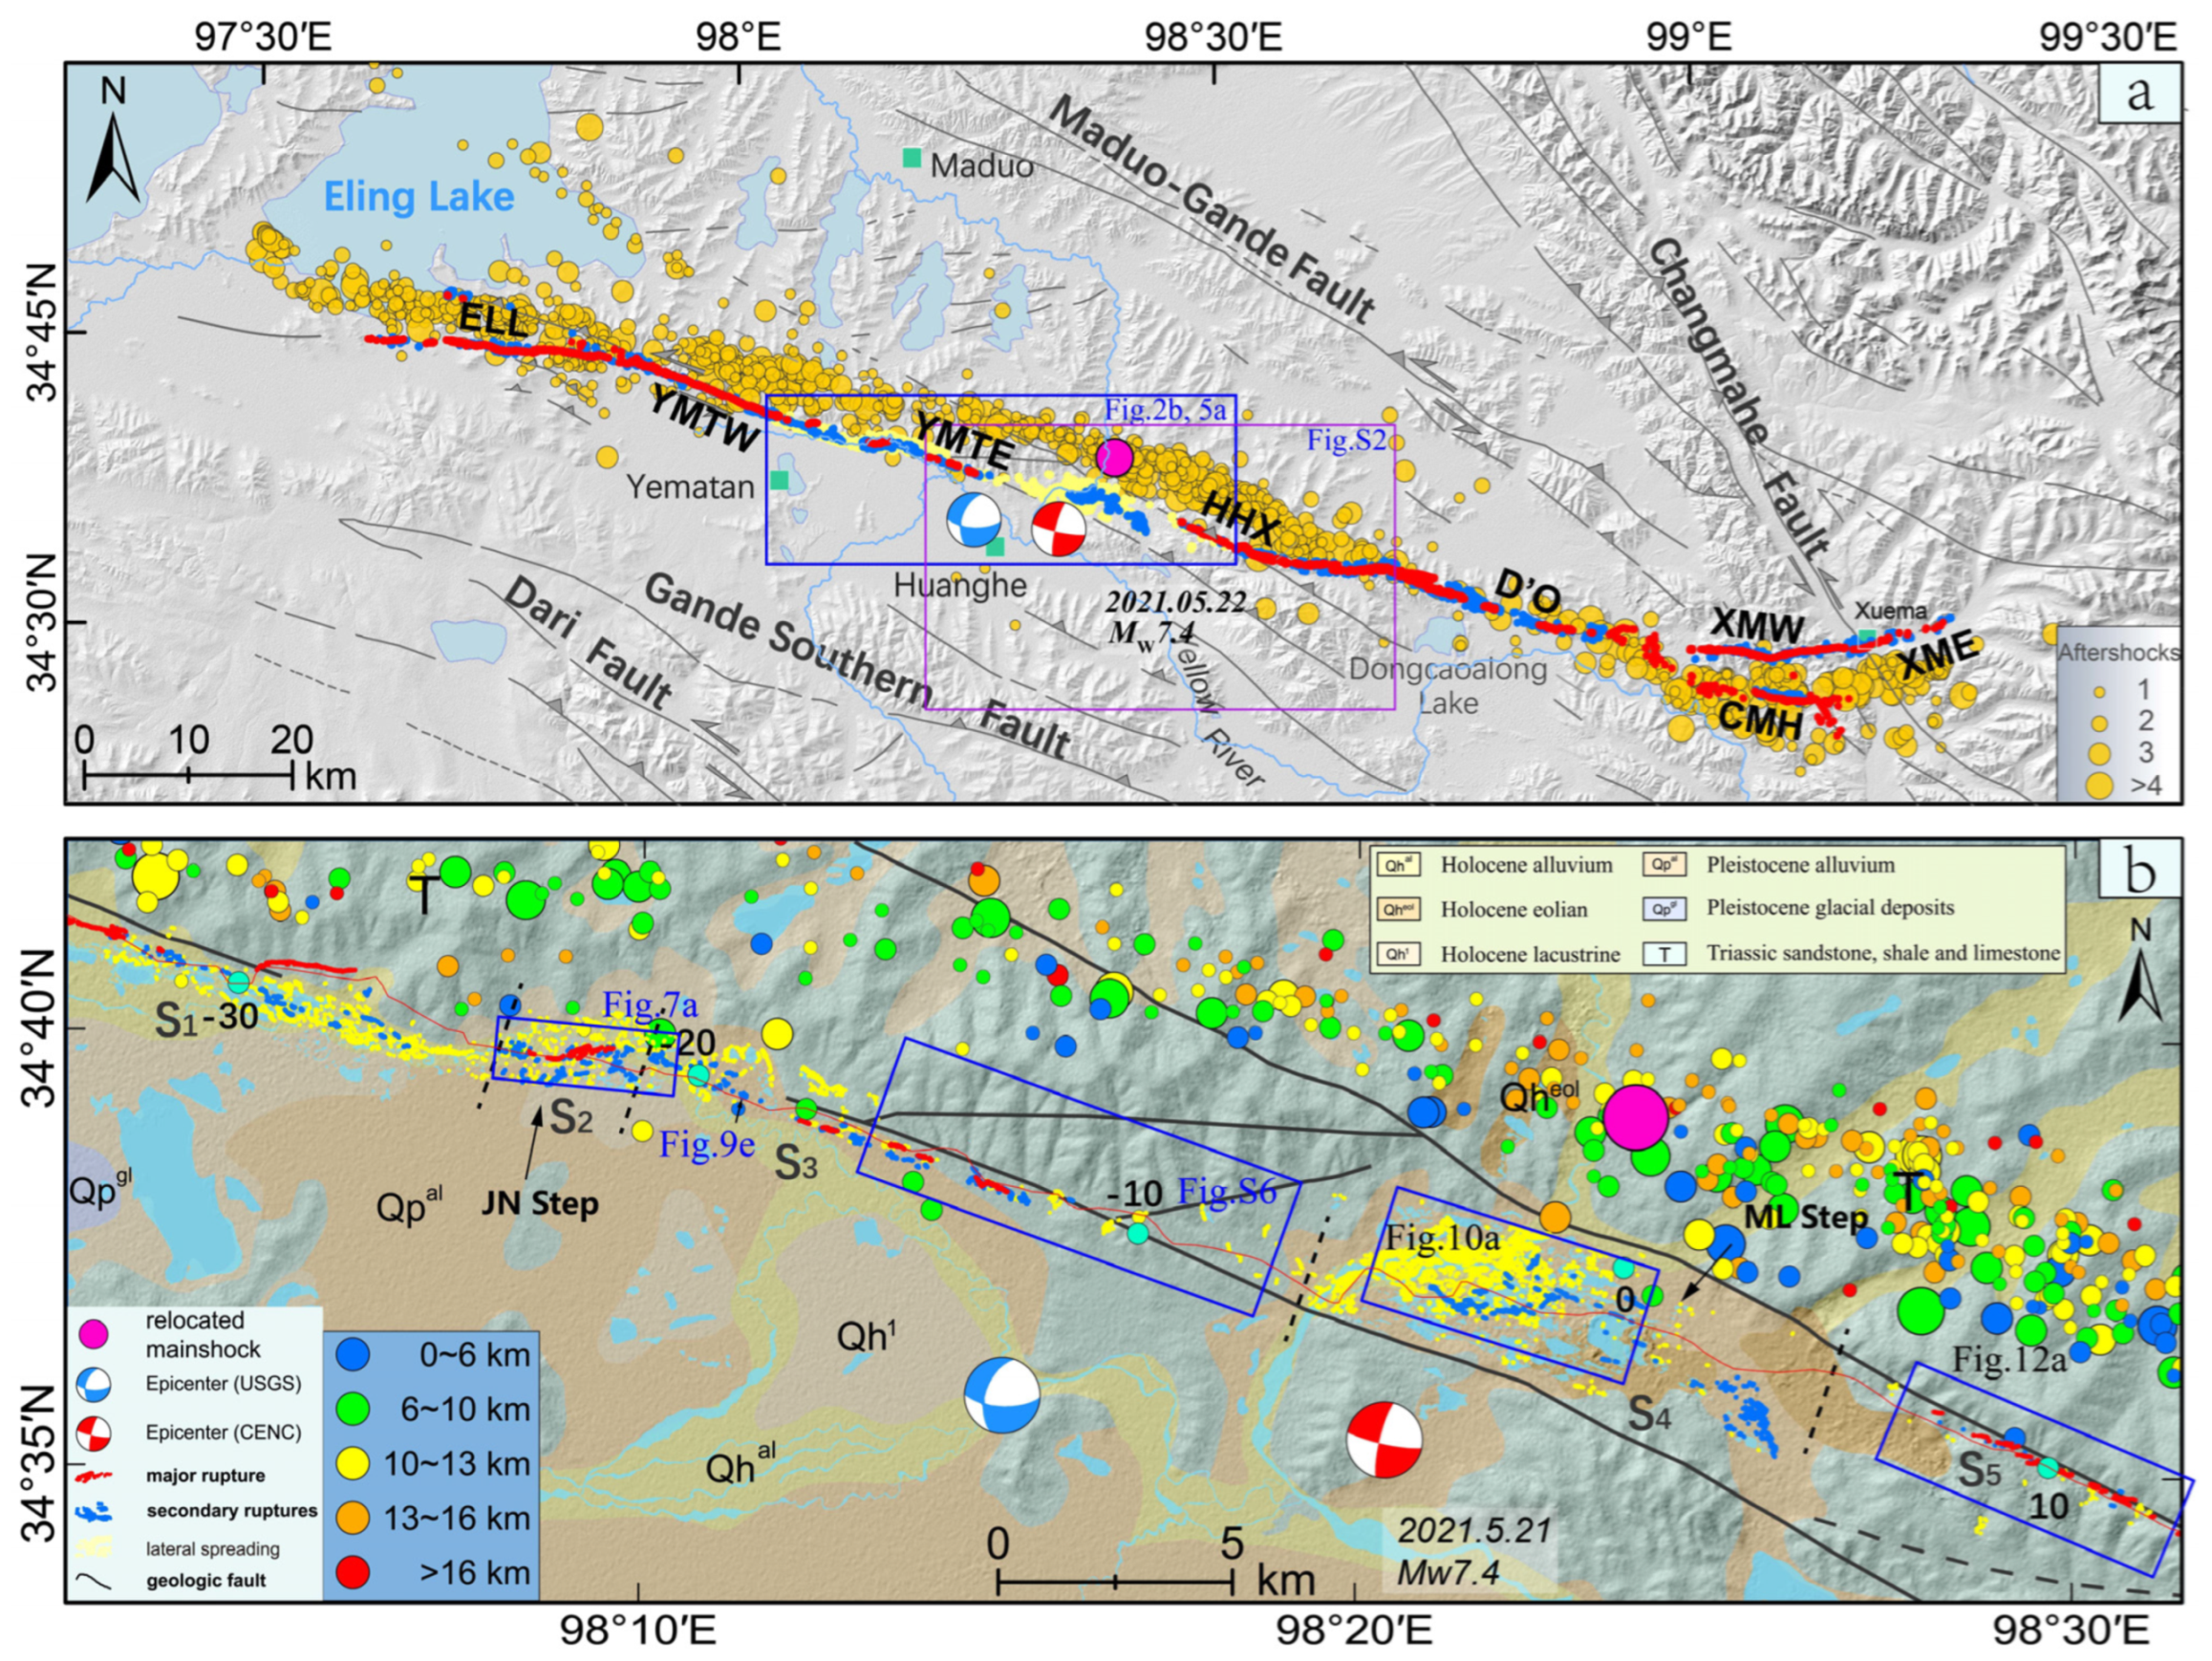
The detailed surface ruptures of the 2021 Mw7.4 Maduo earthquake primarily include the main and secondary ruptures (Figure 2a) [21]. This earthquake generated a 158 km long surface rupture comprising eight segments separated by stepovers, bends, and branches [21]. The faults have a general strike of 110°, while two branches at both ends splay off counter-clockwise with an almost west–east striking [21,25] (Figure 2a). The lengths of rupture segments range from 15 km to 25 km, which may be similar to the thickness of the seismogenic crust [3]. The earthquake-induced surface ruptures are mostly characterized by right-stepping en echelon tensional fractures and mole tracks [22,26]. The coseismic surface ruptures exhibit concentrated patterns within a narrow range (several meters) along the main fault and distributed patterns over a wide range (hundreds of meters) [21,22,23,26].

3. Data and Methods

Acquiring high-resolution Digital Elevation Models (DEMs) and Digital Orthograph Models (DOMs) along the active faults has been facilitated by the widespread utilization of Unmanned Aerial Vehicle (UAV) photogrammetry technology, coupled with the Structure from Motion (SfM) approach [39,41]. The SfM methodology employs algorithms to extract 3D topographic data from overlapping areas captured through multiview photographs [41,67,68]. In the three weeks following the Maduo earthquake, we acquired abundant low-altitude aerial images covering almost all the surface ruptures through a fixed-wing UAV [21]. Utilizing Agisoft Metashape professional (version 1.5.2) software, we processed these photographs to generate high-resolution (3~6 cm/pixel) dense clouds, DEMs, and DOMs [41,68] with widths ranging from 1.3 km to 3.3 km.
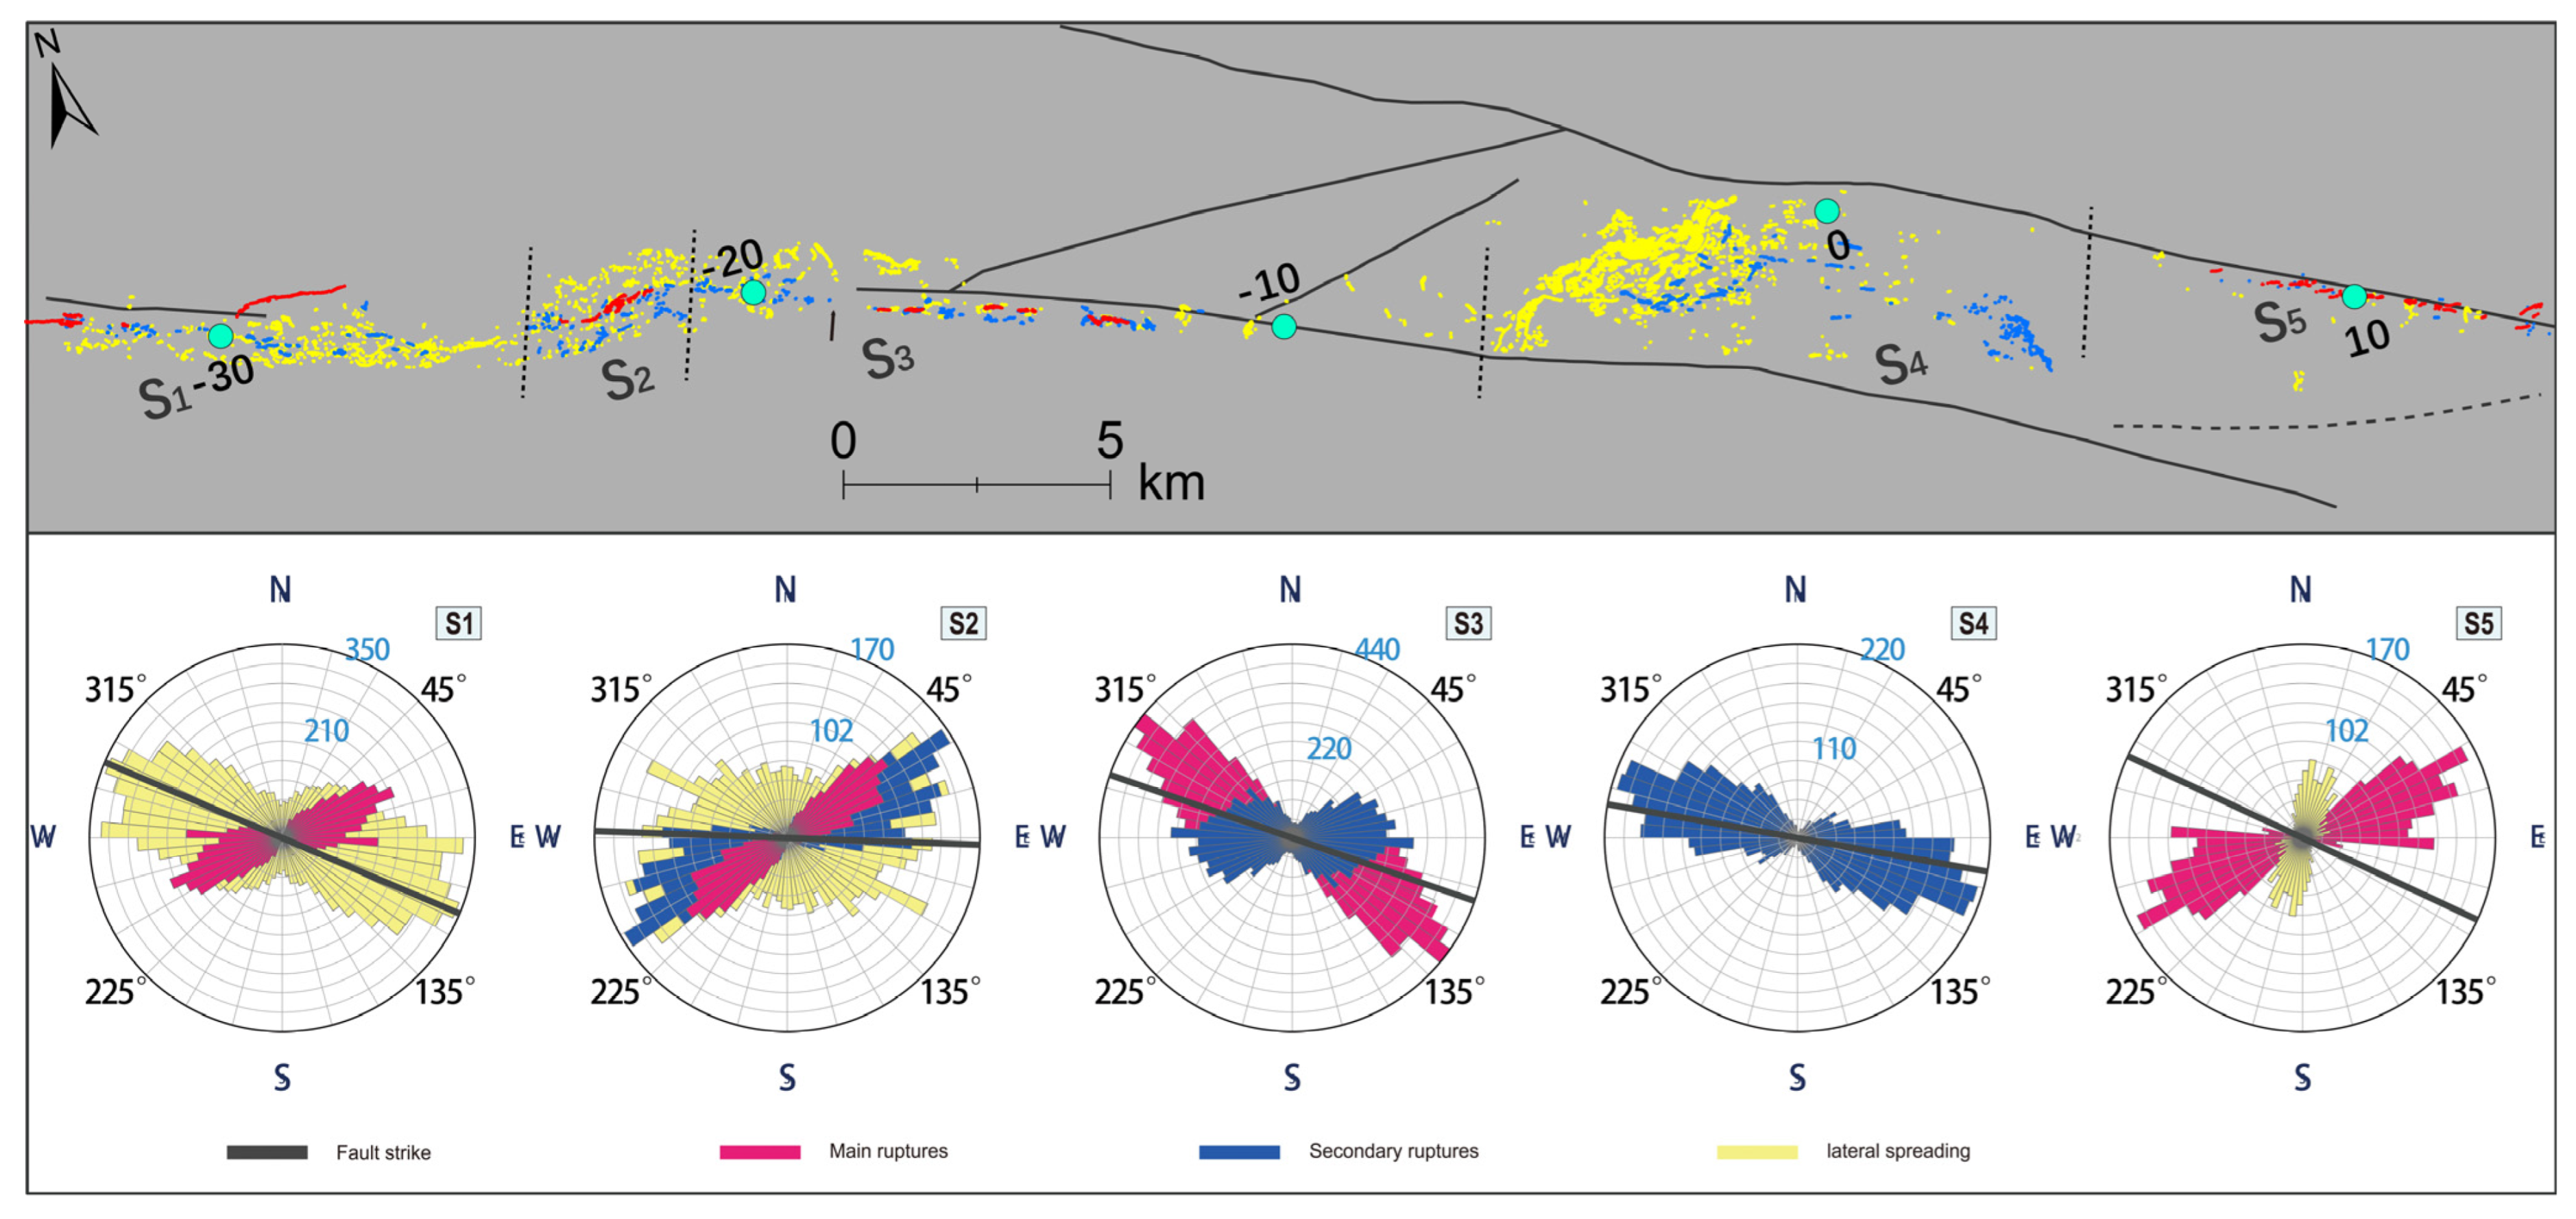
We conducted detailed mapping of the surface ruptures using high-resolution DOMs in the epicentral region, followed by validation through field investigations. After completing the first version of the mapping work, we categorized the surface ruptures as main, secondary, and lateral spreading, allowing us to distinguish between tectonic-induced ruptures and those caused by strong motion (Figure 2b). The lateral spreadings are usually defined by the following criteria: (1) The fracture patterns either trace the perimeters of rivers or lakes or exhibit a configuration distributed in an arc shape. (2) Fractures are distributed along the topographic slope with a different strike compared to the main fault. (3) Fractures have “trellis” and “radial” patterns. Additionally, we ensured questionable fracture categories during the subsequent field investigations in September 2021. Based on the detailed distinguishing between various surface ruptures, we computed rose diagrams of each surface by using GeoRose software (https://www.yongtechnology.com/georose/, accessed on 1 July 2021) (Figure 3).
To facilitate easy referencing of observations along the epicenter [32], we assigned the relocated epicenter as “0 km” and added “E” or “W” in front of the number to indicate the location east or west of the epicenter. Based on the surface rupture and fault geometry, we divided ruptures into five segments from west to east (S1–S5), in which S2 and S4 defined the JiangNing (JN) stepover and MaLong (ML) stepover, respectively (Figure 2a).
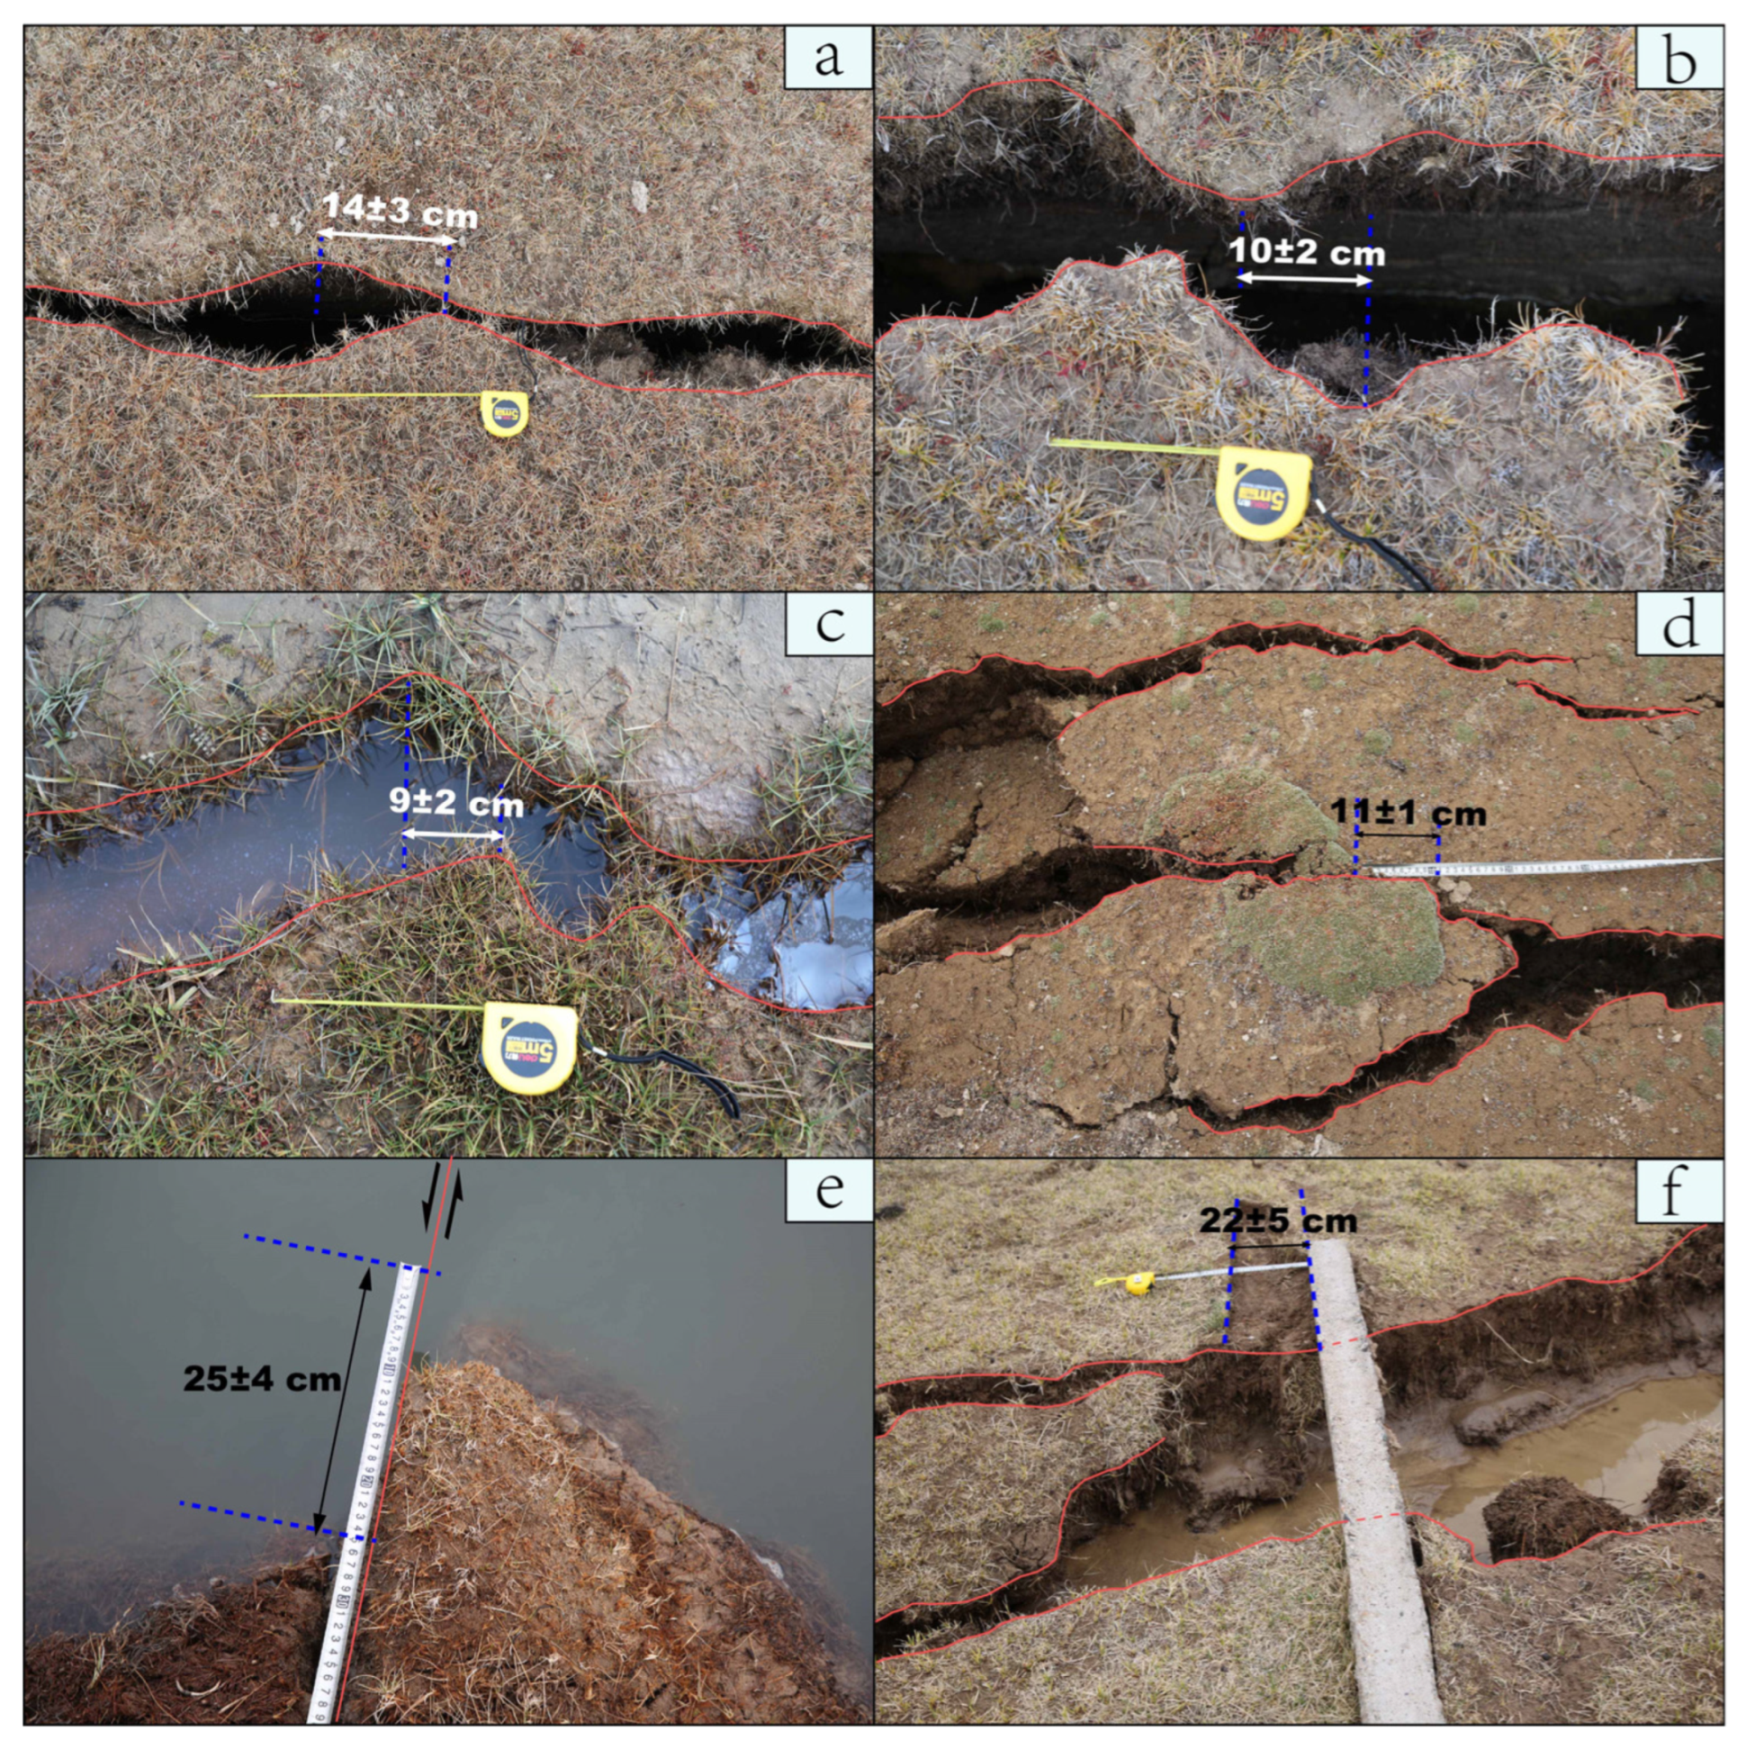
We conducted the on-fault slip measurements in the field in September 2021, taking advantage of the detailed rupture maps. We collected left-lateral offsets along the surface rupture utilizing various displaced markers, such as natural vegetation, topographic lineaments, manufactured features, and small pull-apart fractures. We depicted the surface rupture pattern and annotated the makers for slip measurement. Considering the presence of multiple strands along the rupture, we integrated displacements from each parallel branch by projecting them onto the main fault strike. The on-fault coseismic displacements were thoroughly measured in the field in September 2021. We measured 42 displaced markers in the field, which were integrated into 25 horizontal offset data (Figure 4, Table S1). The left-lateral horizontal coseismic slip exhibits characteristics typically measuring ≤0.6 m (Figure 4, Table S1).
We also measured the total shear accommodated across the fault based on the optical satellite images correlation map associated with the 2021 Maduo earthquake. The optical image correlation productions provided east–west and north–south displacement field maps with a ground resolution of 80 m (the optical image correlation productions were provided by our cooperator, Milliner Chris, University of Southern California). We systematically extracted 10 km long swath profiles with intervals of 800 m to document slip distribution in the epicentral region (Figure 5). Our measurements included the parallel and perpendicular components of the horizontal coseismic slip and the width of the deformation zone in the epicentral region. For the measurements of the total displacement over the entire deformation zone, we acquired 60 parallel and perpendicular components of the horizontal coseismic slip and fault zone width from the optical satellite images correlation map in the epicentral region (W33 km–E14 km) (Figure 5). The correlation map of the east–west horizontal displacement at the epicentral region is shown in Figure 5, including the 5 km long and 200 m wide swath profiles (E1–E8) that depict displacement of the east–west component along the fault. Profile E1 indicates deformation concentrated on the main rupture, while profiles E2, E4, E6, and E7 reveal distributed deformation across a kilometer-scale wide zone. In contrast, E1, E3, E5, and E8 show relatively narrow deformation zones that are several hundred meters wide (Figure 5).
The orientation of the slip vector was calculated from the vector addition of the north–south and east–west components, generally trending toward the NWW (north of the Jiangcuo fault) and the ESE (south of the Jiangcuo fault). We defined the parameter θ as the angle between the slip vector orientation and the local Jiangcuo fault strike. Consequently, the left-lateral displacements parallel to the fault strike and the extension/shortening displacements (θ > 0, extension; θ < 0, shortening) perpendicular to the fault strike were calculated as Cosθ and Sinθ of the integrated displacement, respectively [42] (Figure S1). Finally, we estimated the off-fault deformation by comparing the displacement data from the image correlation map to the displacement measured in the field [42,43].

4. Surface Ruptures and Coseismic Slip Distributions in the Epicentral Region

4.1. Surface Ruptures in the Epicentral Region

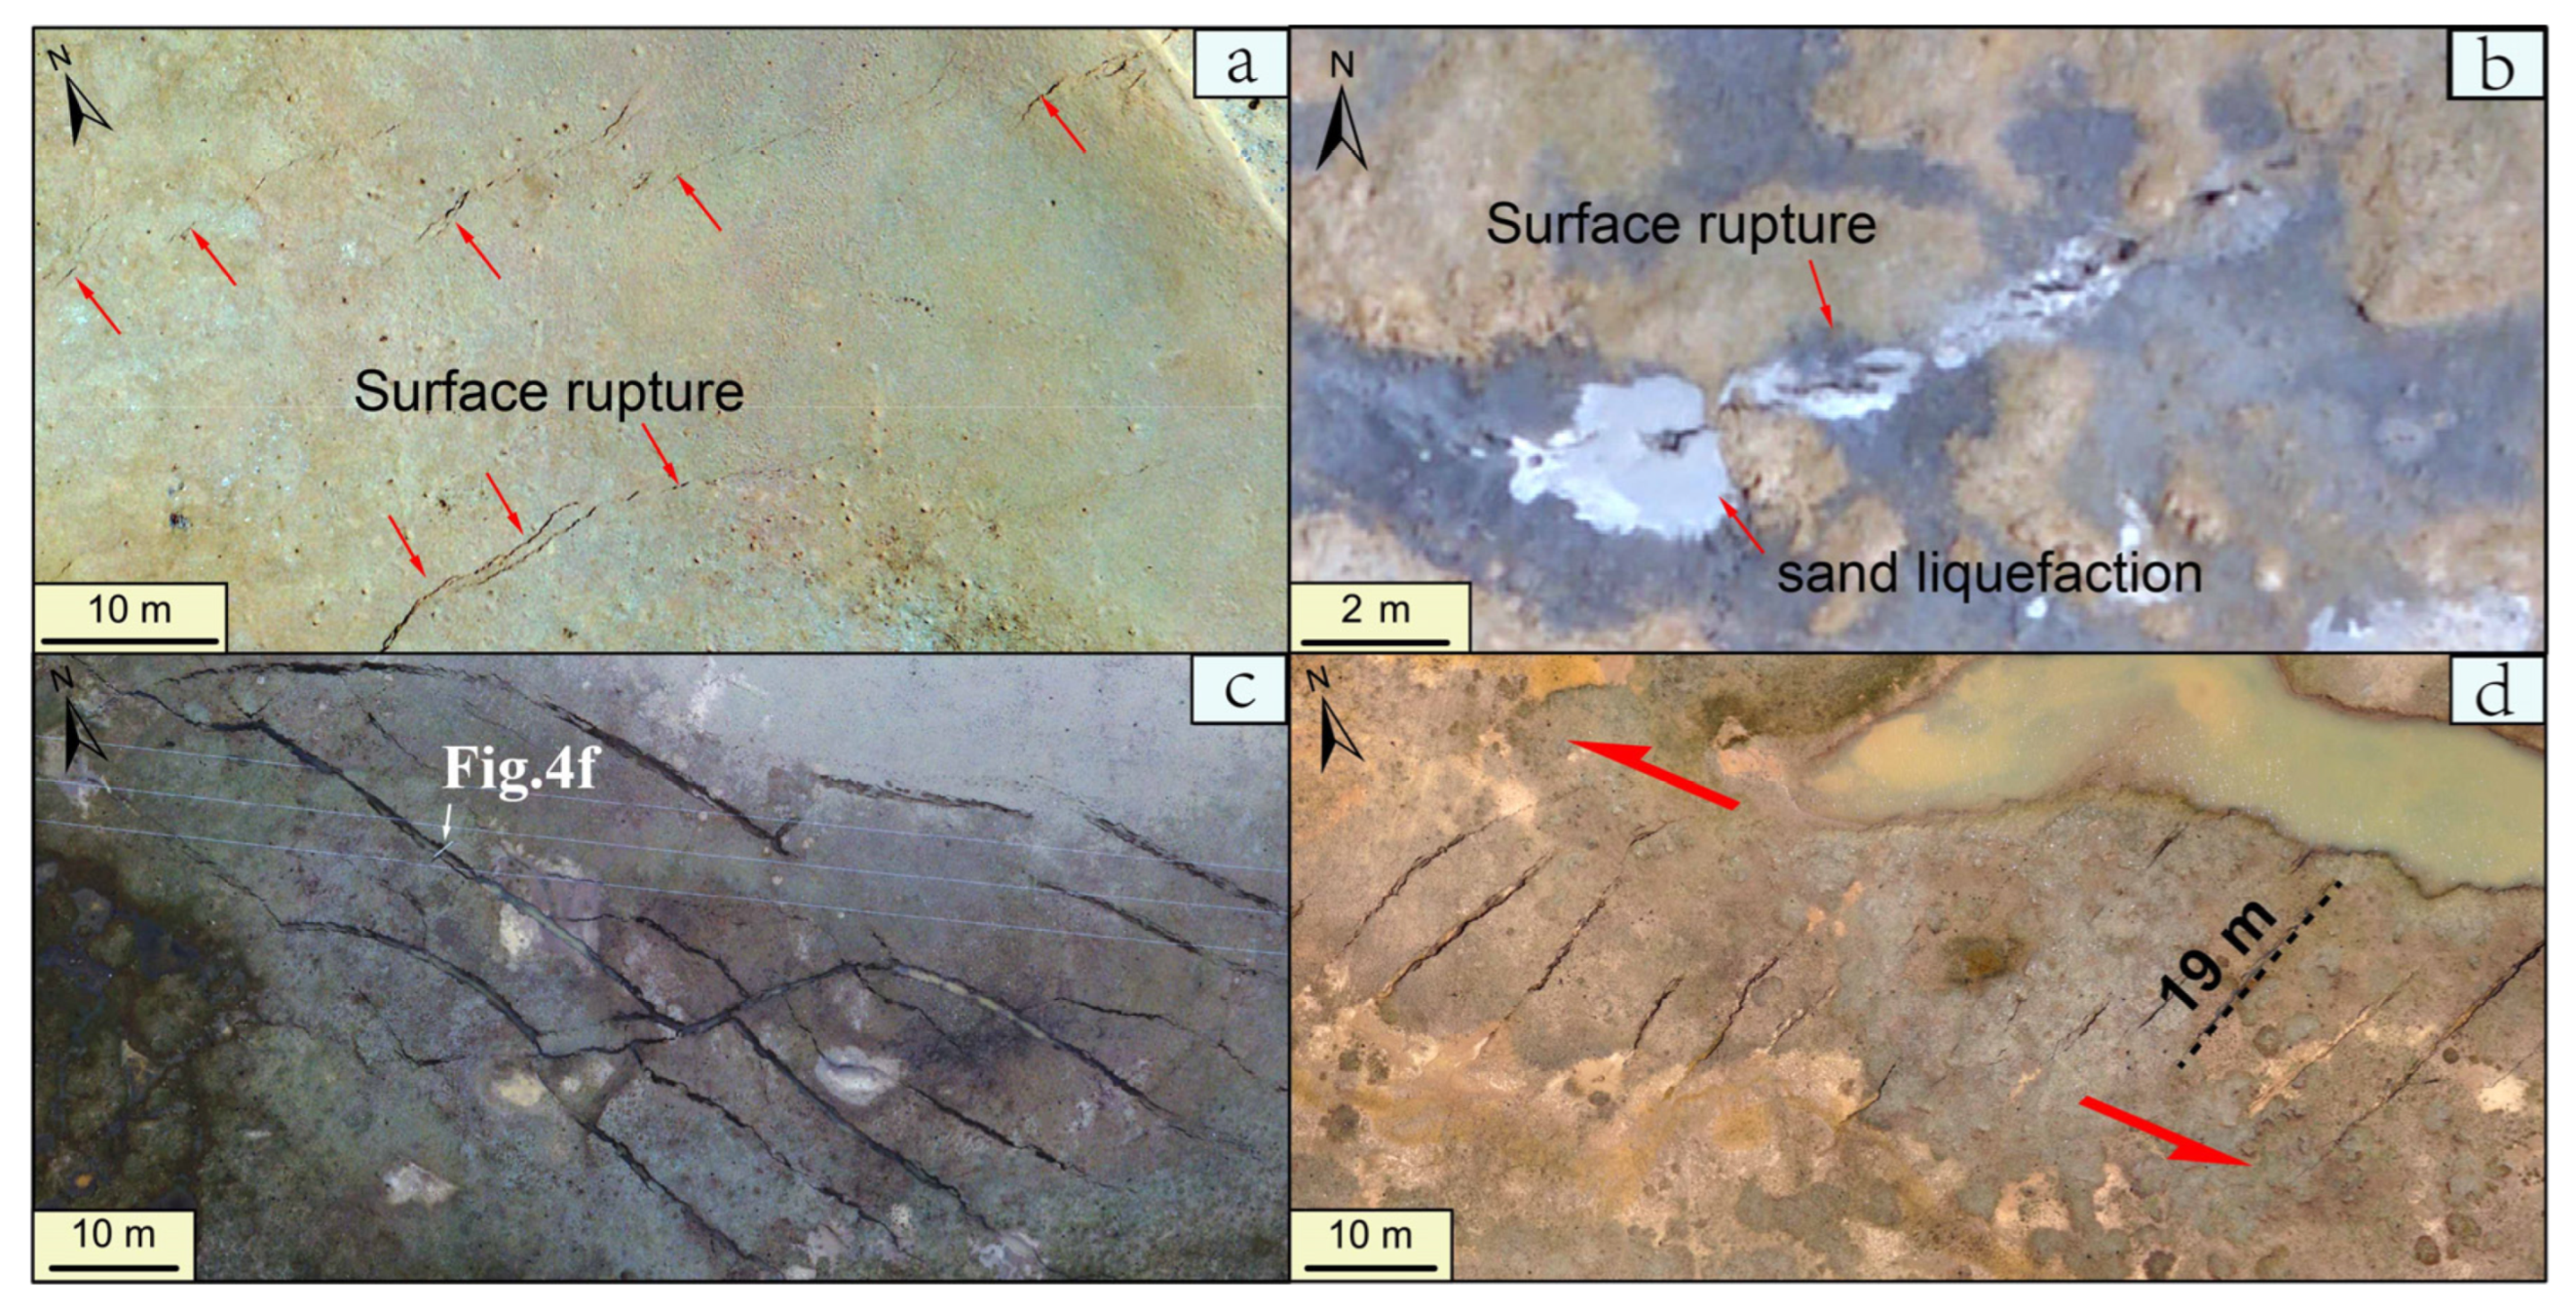
In segment S1, the main ruptures deviated from the primary fault, striking 98° to the north side (Figure 2b). Numerous lateral spreadings were distributed along the primary fault in a wide zone, with some fractures striking 110° and displaying left-lateral offset, categorized as secondary fractures due to their mix with lateral spreadings (Figure 2b). Additionally, main ruptures reappeared west of 33 km W, showing large-scale en echelon features (Figure 6d).
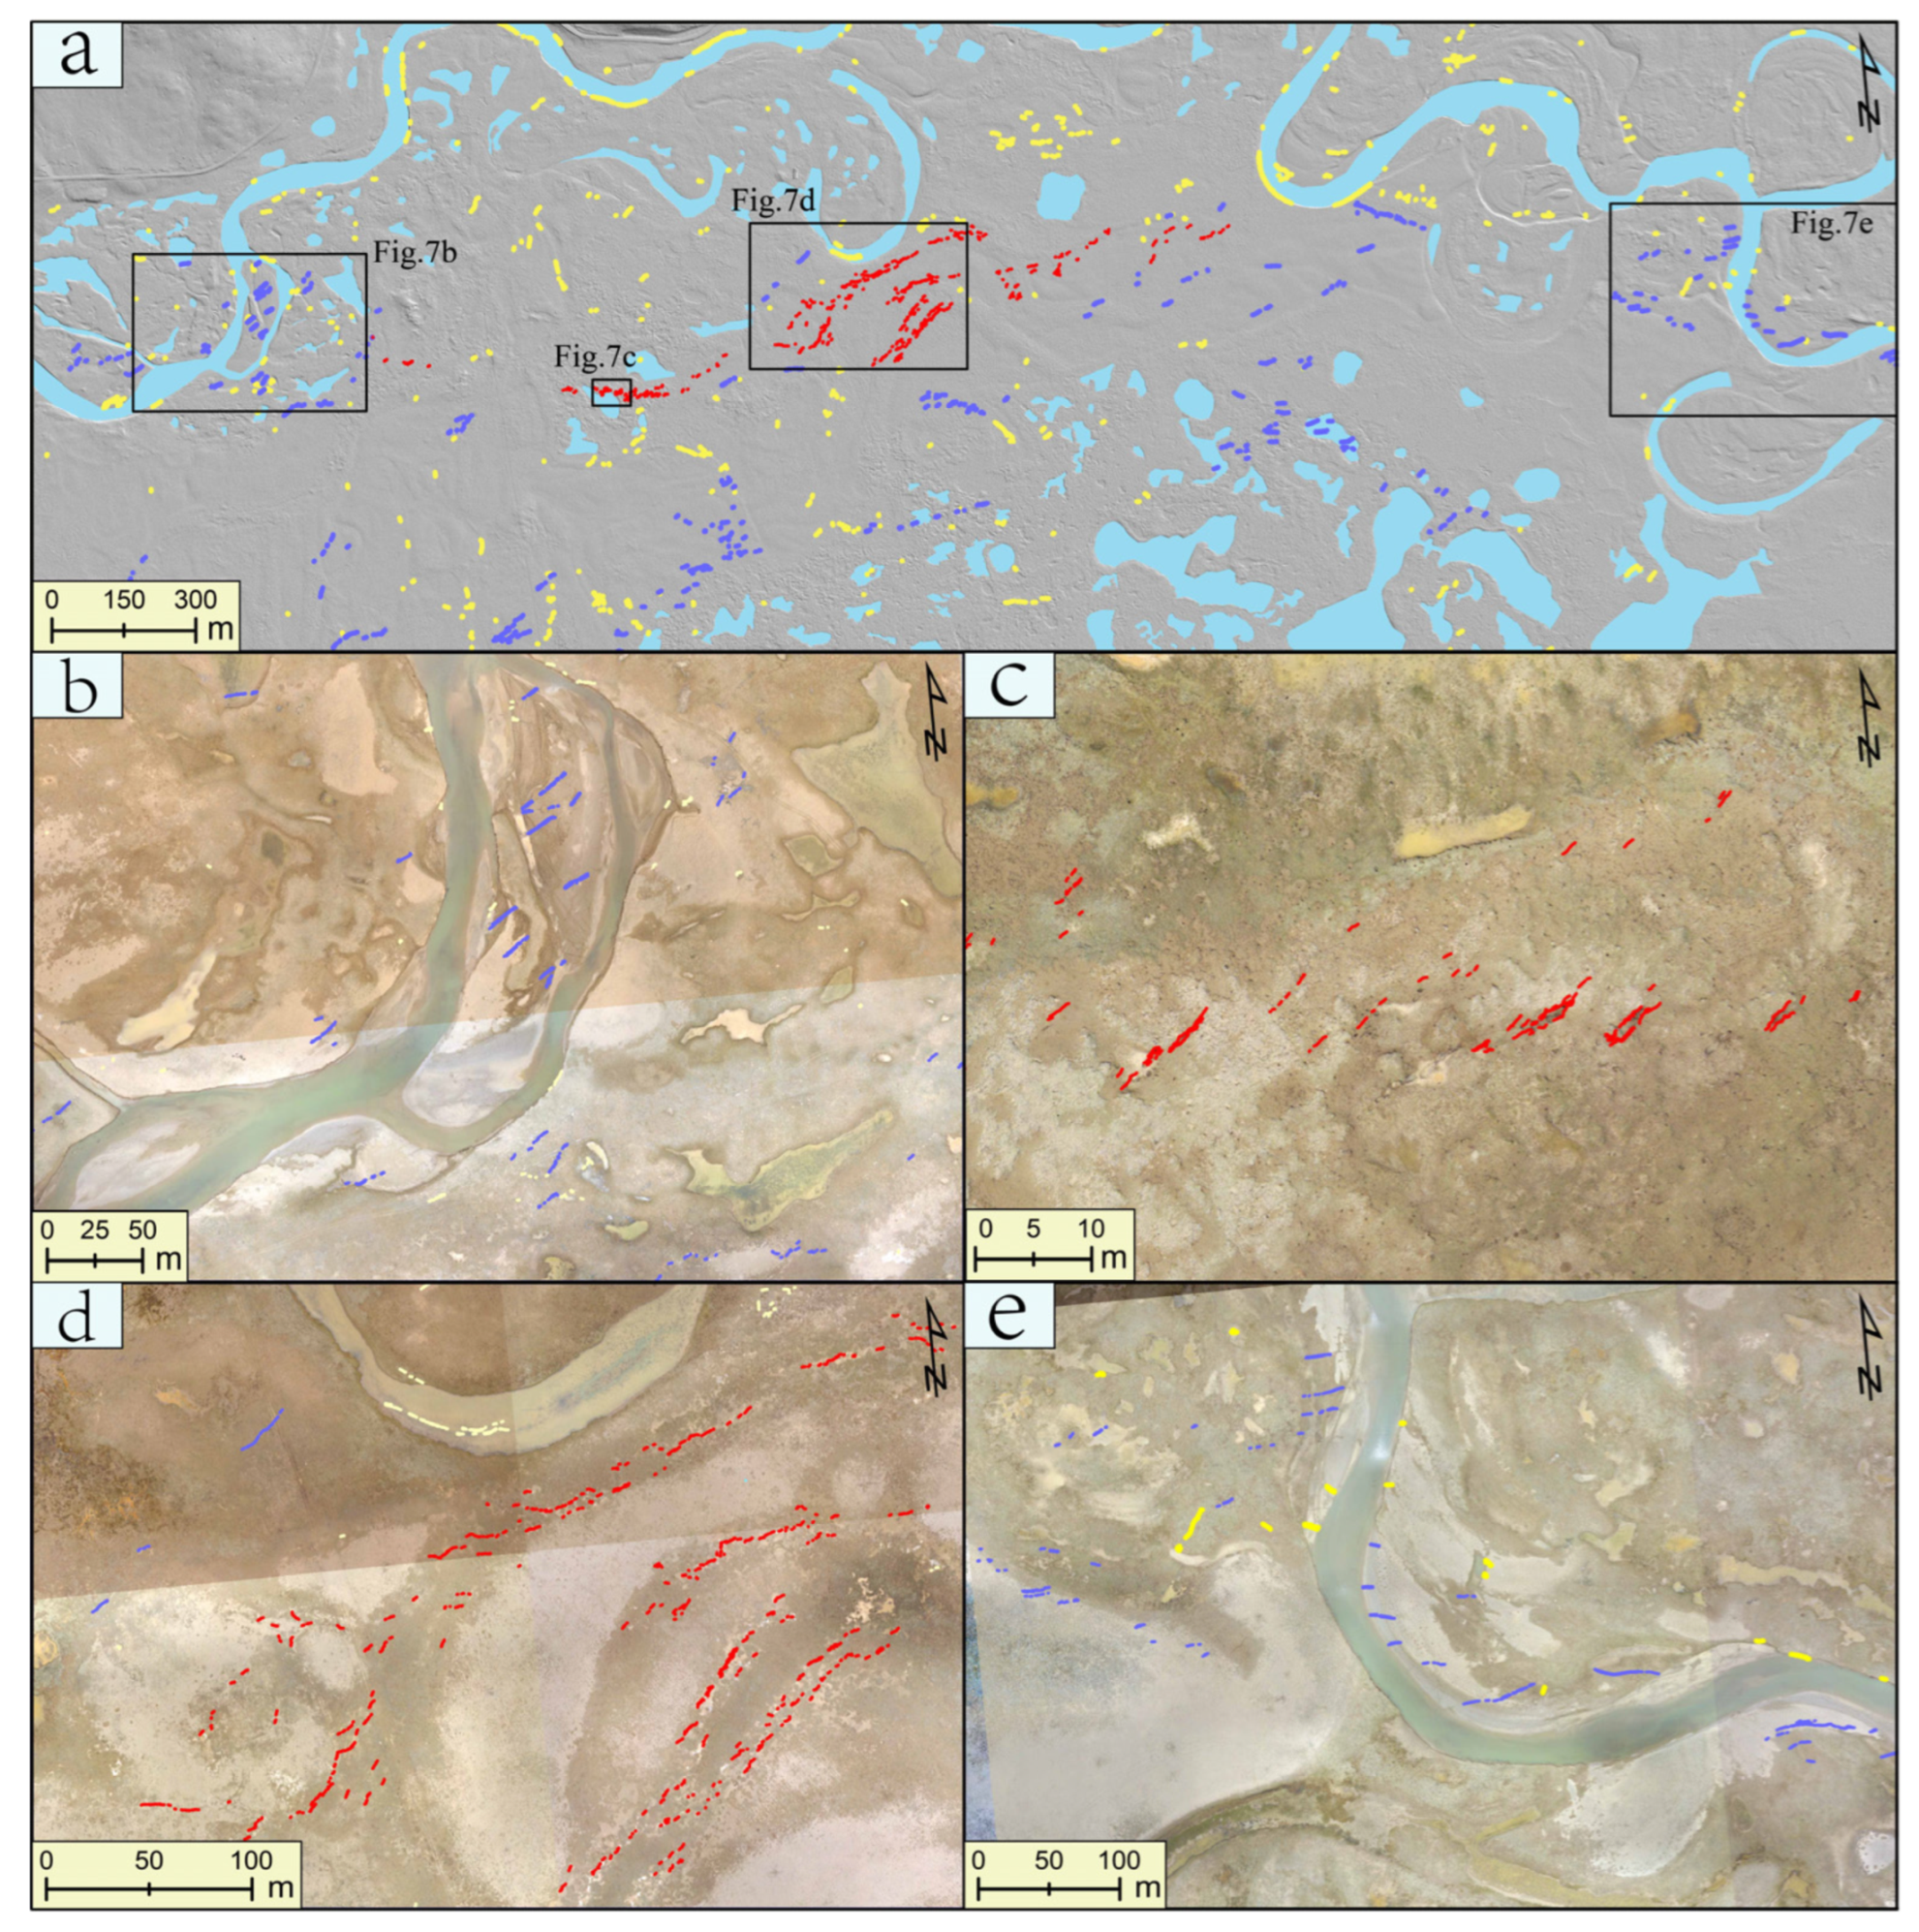
In segment S2, the surface ruptures were distributed within a 3.6 km long and 1.8 km wide releasing stepover, including the main ruptures, the secondary ruptures, and lateral spreadings (Figure 7). These ruptures helped to define the stepover, which was not mapped before the earthquake because of the flat topography. The fault trace depicted from the optical image correlation map strikes 92°, short-cutting the stepover (Figure 5). The main rupture exhibited en echelon patterns with a general striking of 55 ± 15°, which shows a counter-clockwise rotation angle compared to the fault strike (Figure 3 and Figure 7c,d). Secondary ruptures had the same orientation as the main ruptures and were widely distributed in the stepover (Figure 7b,e).
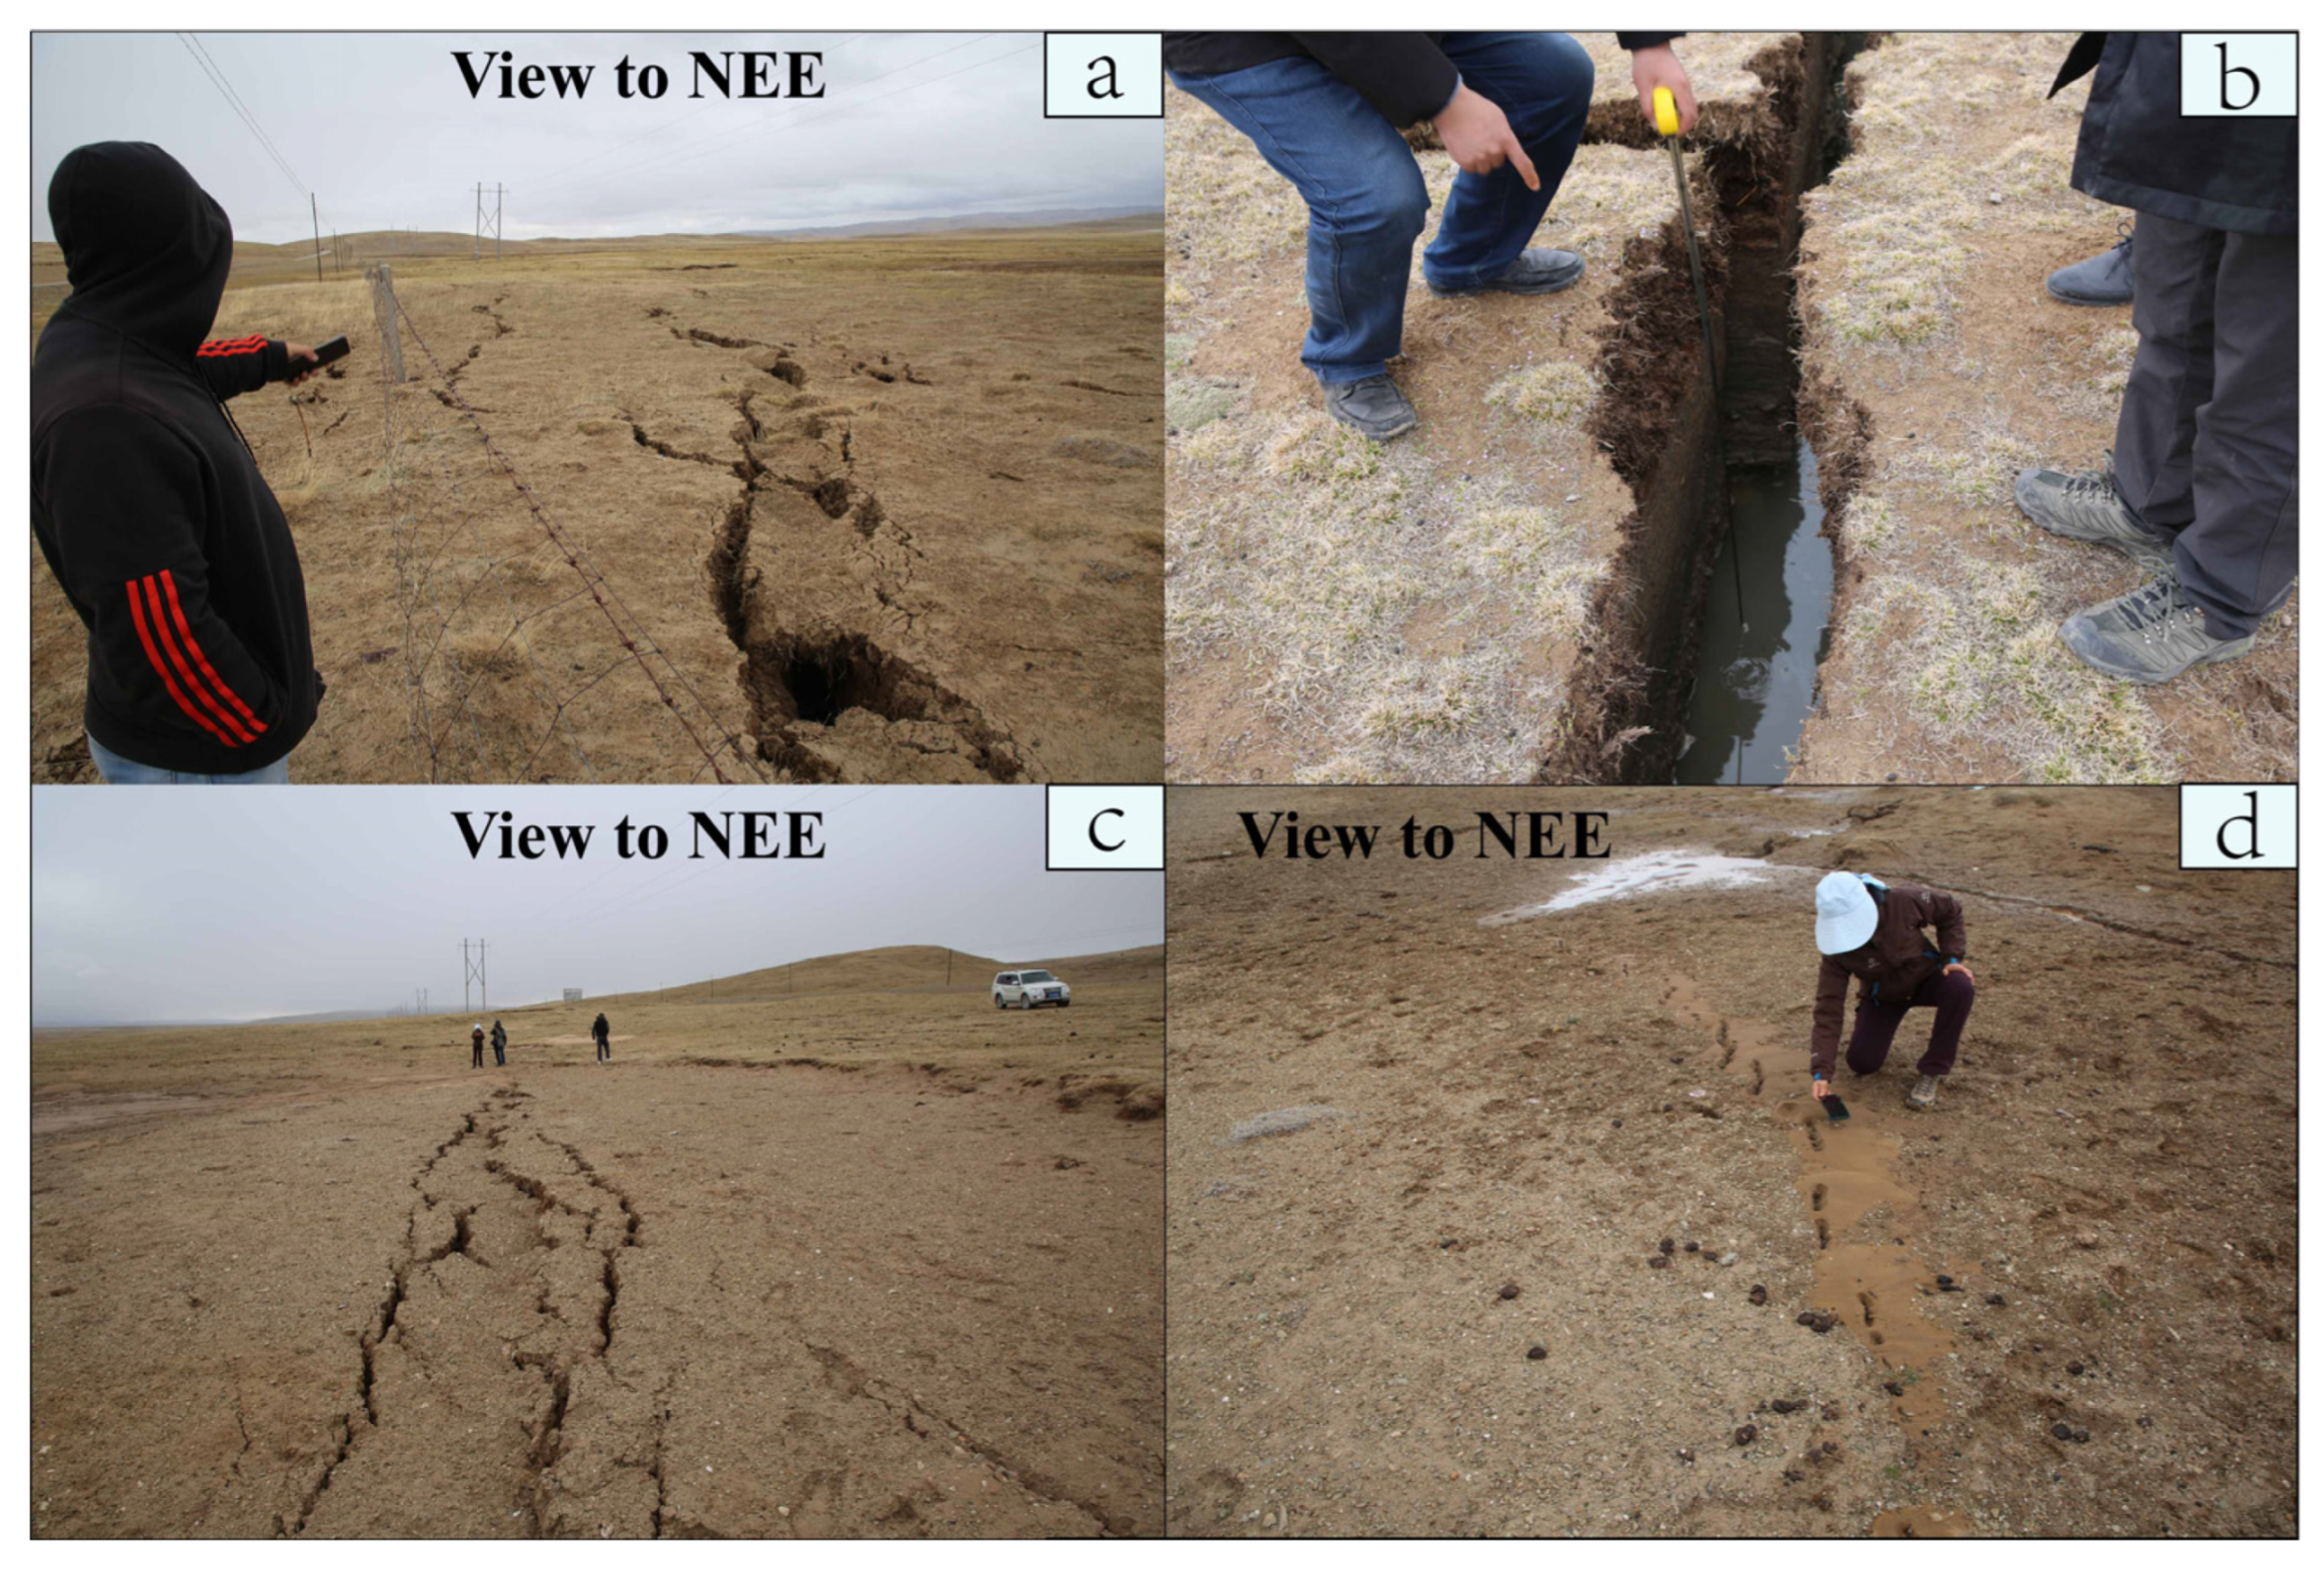
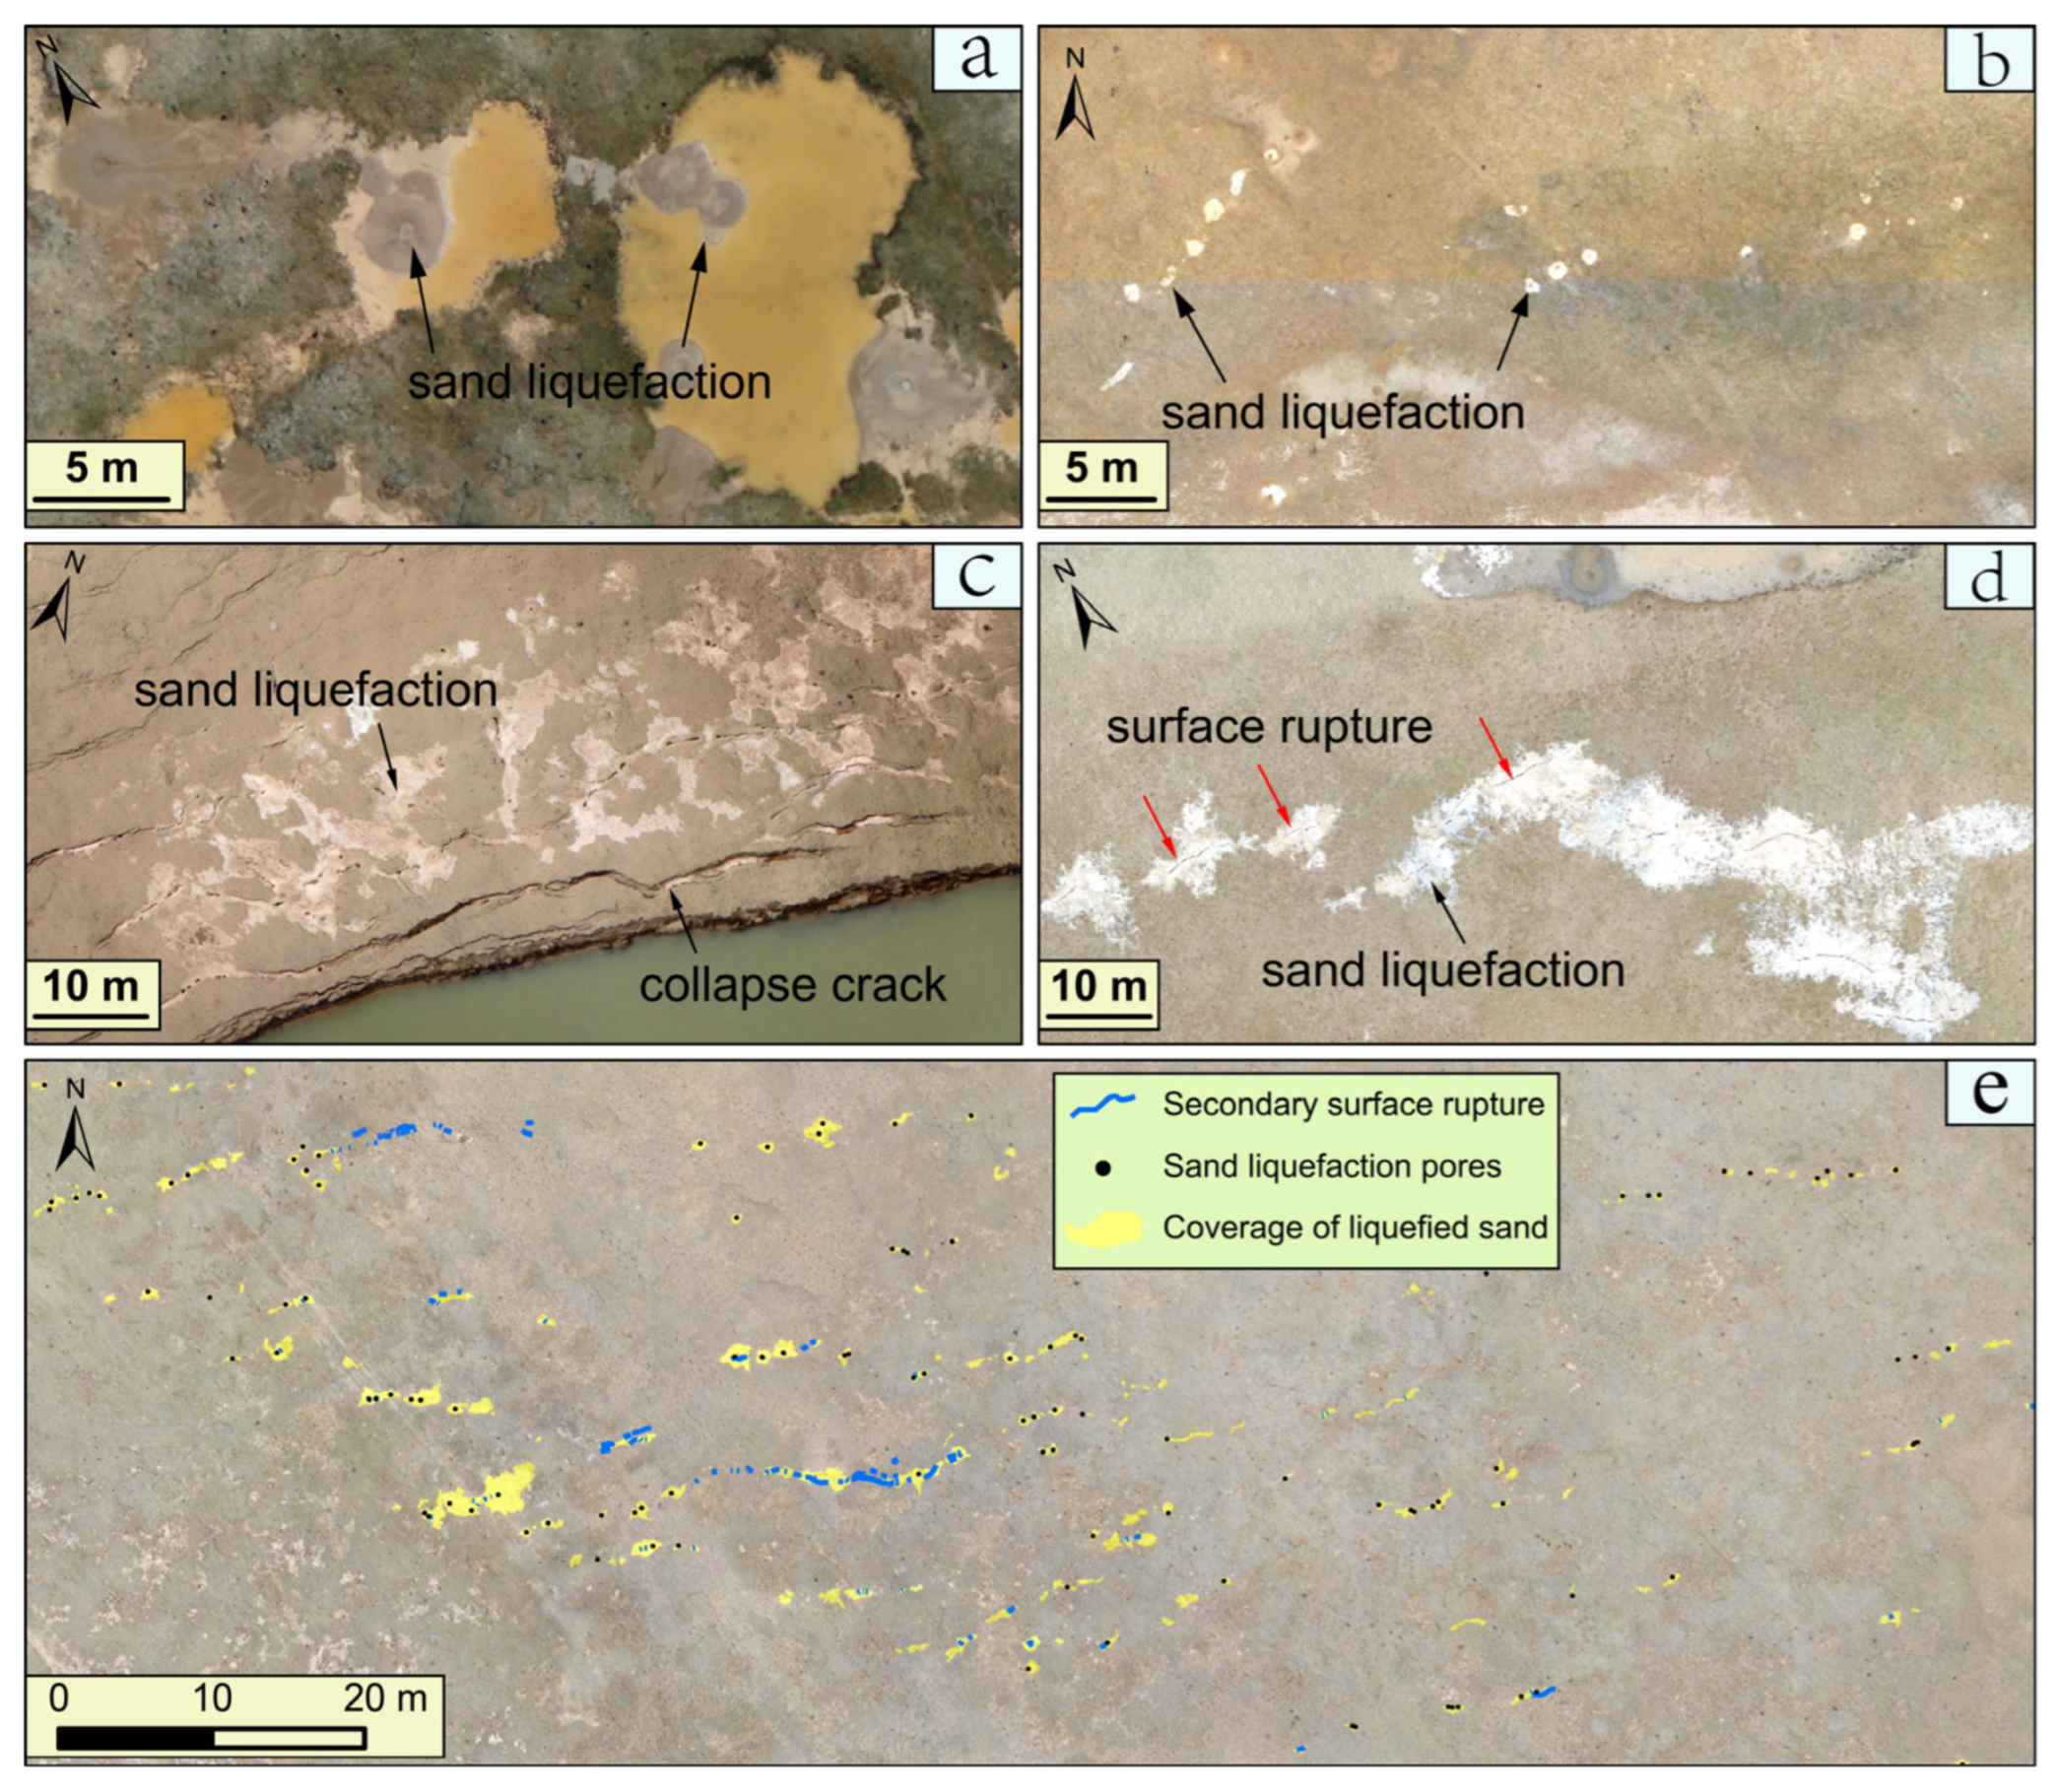
We divided segment S3 into three portions depending on the different rupture characteristics: secondary ruptures in the western part, tensile-shear ruptures in the middle part, and sporadic lateral spreadings in the eastern part (Figure 2b). The western part (S3a) presents secondary ruptures with multiple branches, pure shear, tension, and submeter-scale en echelon ruptures (Figure 8). In addition, there were different types of sand liquefaction: sand blows occurring in isolated circular vents or aligning with tensional or trans-tensional fractures (Figure 9). In particular, the liquefied sand was sequenced in lines at some points, which are highly consistent with the location and strike of surface ruptures. These linear fractures with liquefaction probably indicated the distribution and orientations of the earthquake rupture (Figure 9e). In the middle part (S3b), surface ruptures are distributed discontinuously with 5 km length and 20–40 m width. Multiple branches of fractures strike nearly parallel to the main fault, interconnected by secondary fractures (Figure 2b and Figure 6c). Although there was no surface rupture in the east part (S3c), several displaced channels with hundreds of meters offset were distributed along the main fault, which indicates repeat earthquakes (Figure 2b and Figure S6). The optical image correlation map also indicated a ~1.5 m coseismic left-lateral offset in this section (Figure S6).
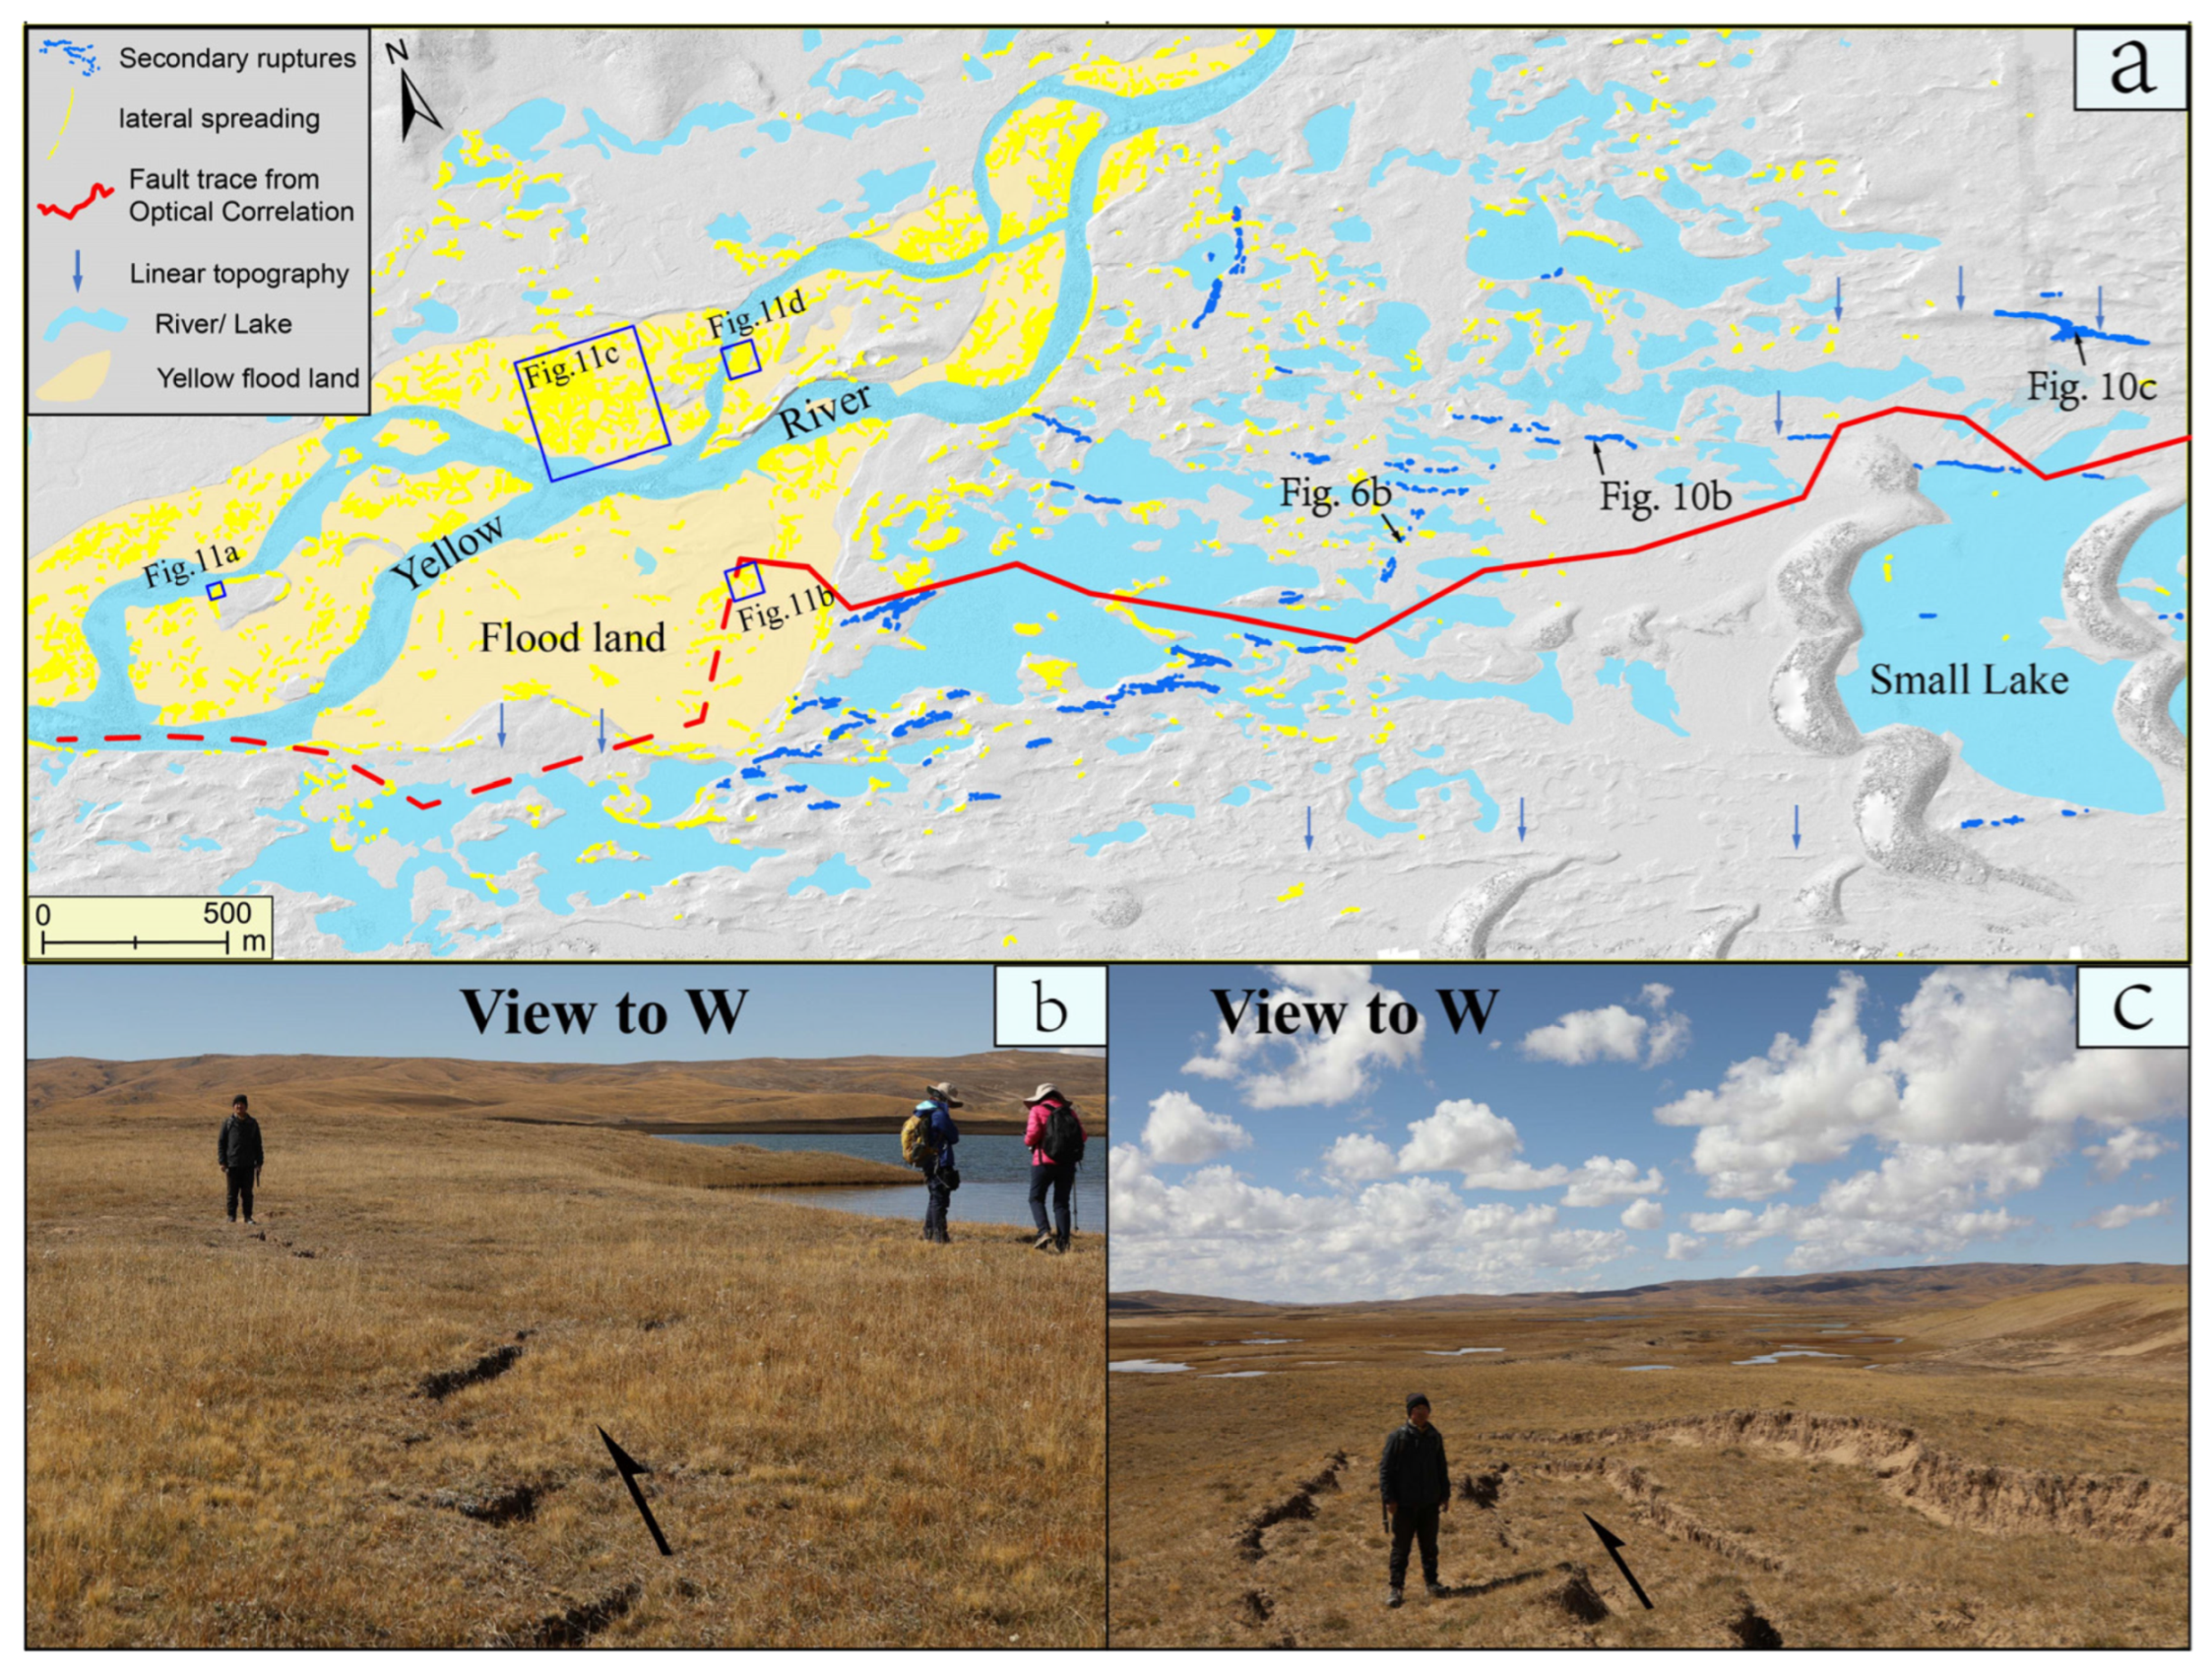
The surface ruptures in the MaLong stepover (S4) were complex, consisting of a few earthquake-induced ruptures mixed with abundant lateral spreadings (Figure 2 and Figure 10a). Due to the absence of prominent main faults in this section, we recognized the secondary ruptures that present local en echelon feature patterns (Figure 6b and Figure 10b) and distribute along the linear geomorphology (Figure 10c). Lateral spreadings were widespread along the banks of the Yellow River and lakes in this section with complex directions (Figure 10a and Figure 11).
Furthermore, 7 km east of the epicenter along the linear fault valley, in S5, the dominant orientation of these surface ruptures is 67 ± 13°, counter-clockwise rotated ~50° compared to the main fault strike (Figure 3 and Figure 12). These ruptures exhibit small-scale en echelon patterns, the widths of which vary from 10 m to ~140 m (Figure 12). Lateral spreadings were observed along the channel bank, approximately perpendicular to the strike of the main fault. Several displaced drainages were detected with tens of meters of offset (Figure 12).

4.2. Coseismic Slip Distributions in the Epicentral Region

The widths of the deformation zones were mostly larger than 1 km in the epicentral region, with a part exceeding 2 km from W19 to E8 km (Figure 13a). Meanwhile, the north–south deformation zone was narrower in the two stepovers, suggesting that the fault trace strikes more east–westerly than outside the stepovers (Figure 13a). Figure 13b shows that the left-lateral coseismic displacement (parallel component) steadily increases from the vicinity of the epicenter to the eastern side, while it varies on the western side. The minimum left-lateral coseismic displacement of ~1 m is located 5.5 km west of the epicenter, corresponding to the western endpoint of the ML stepover. After the west-propagating rupture broke through the large stepover, the left-lateral coseismic slip increased rapidly and then decreased as the rupture approached and passed through a 1.8 km wide JiangNing releasing stepover. To the west of the JiangNing stepover, the slip increases and falls again locally westward (Figure 13b). The shortening/extension displacement (perpendicular component) varied along the fault and almost shows extension displacement, especially in S2 and S3 (Figure 13b). The integrated displacements are slightly larger than the left-lateral coseismic displacements (Figure 13a,b).
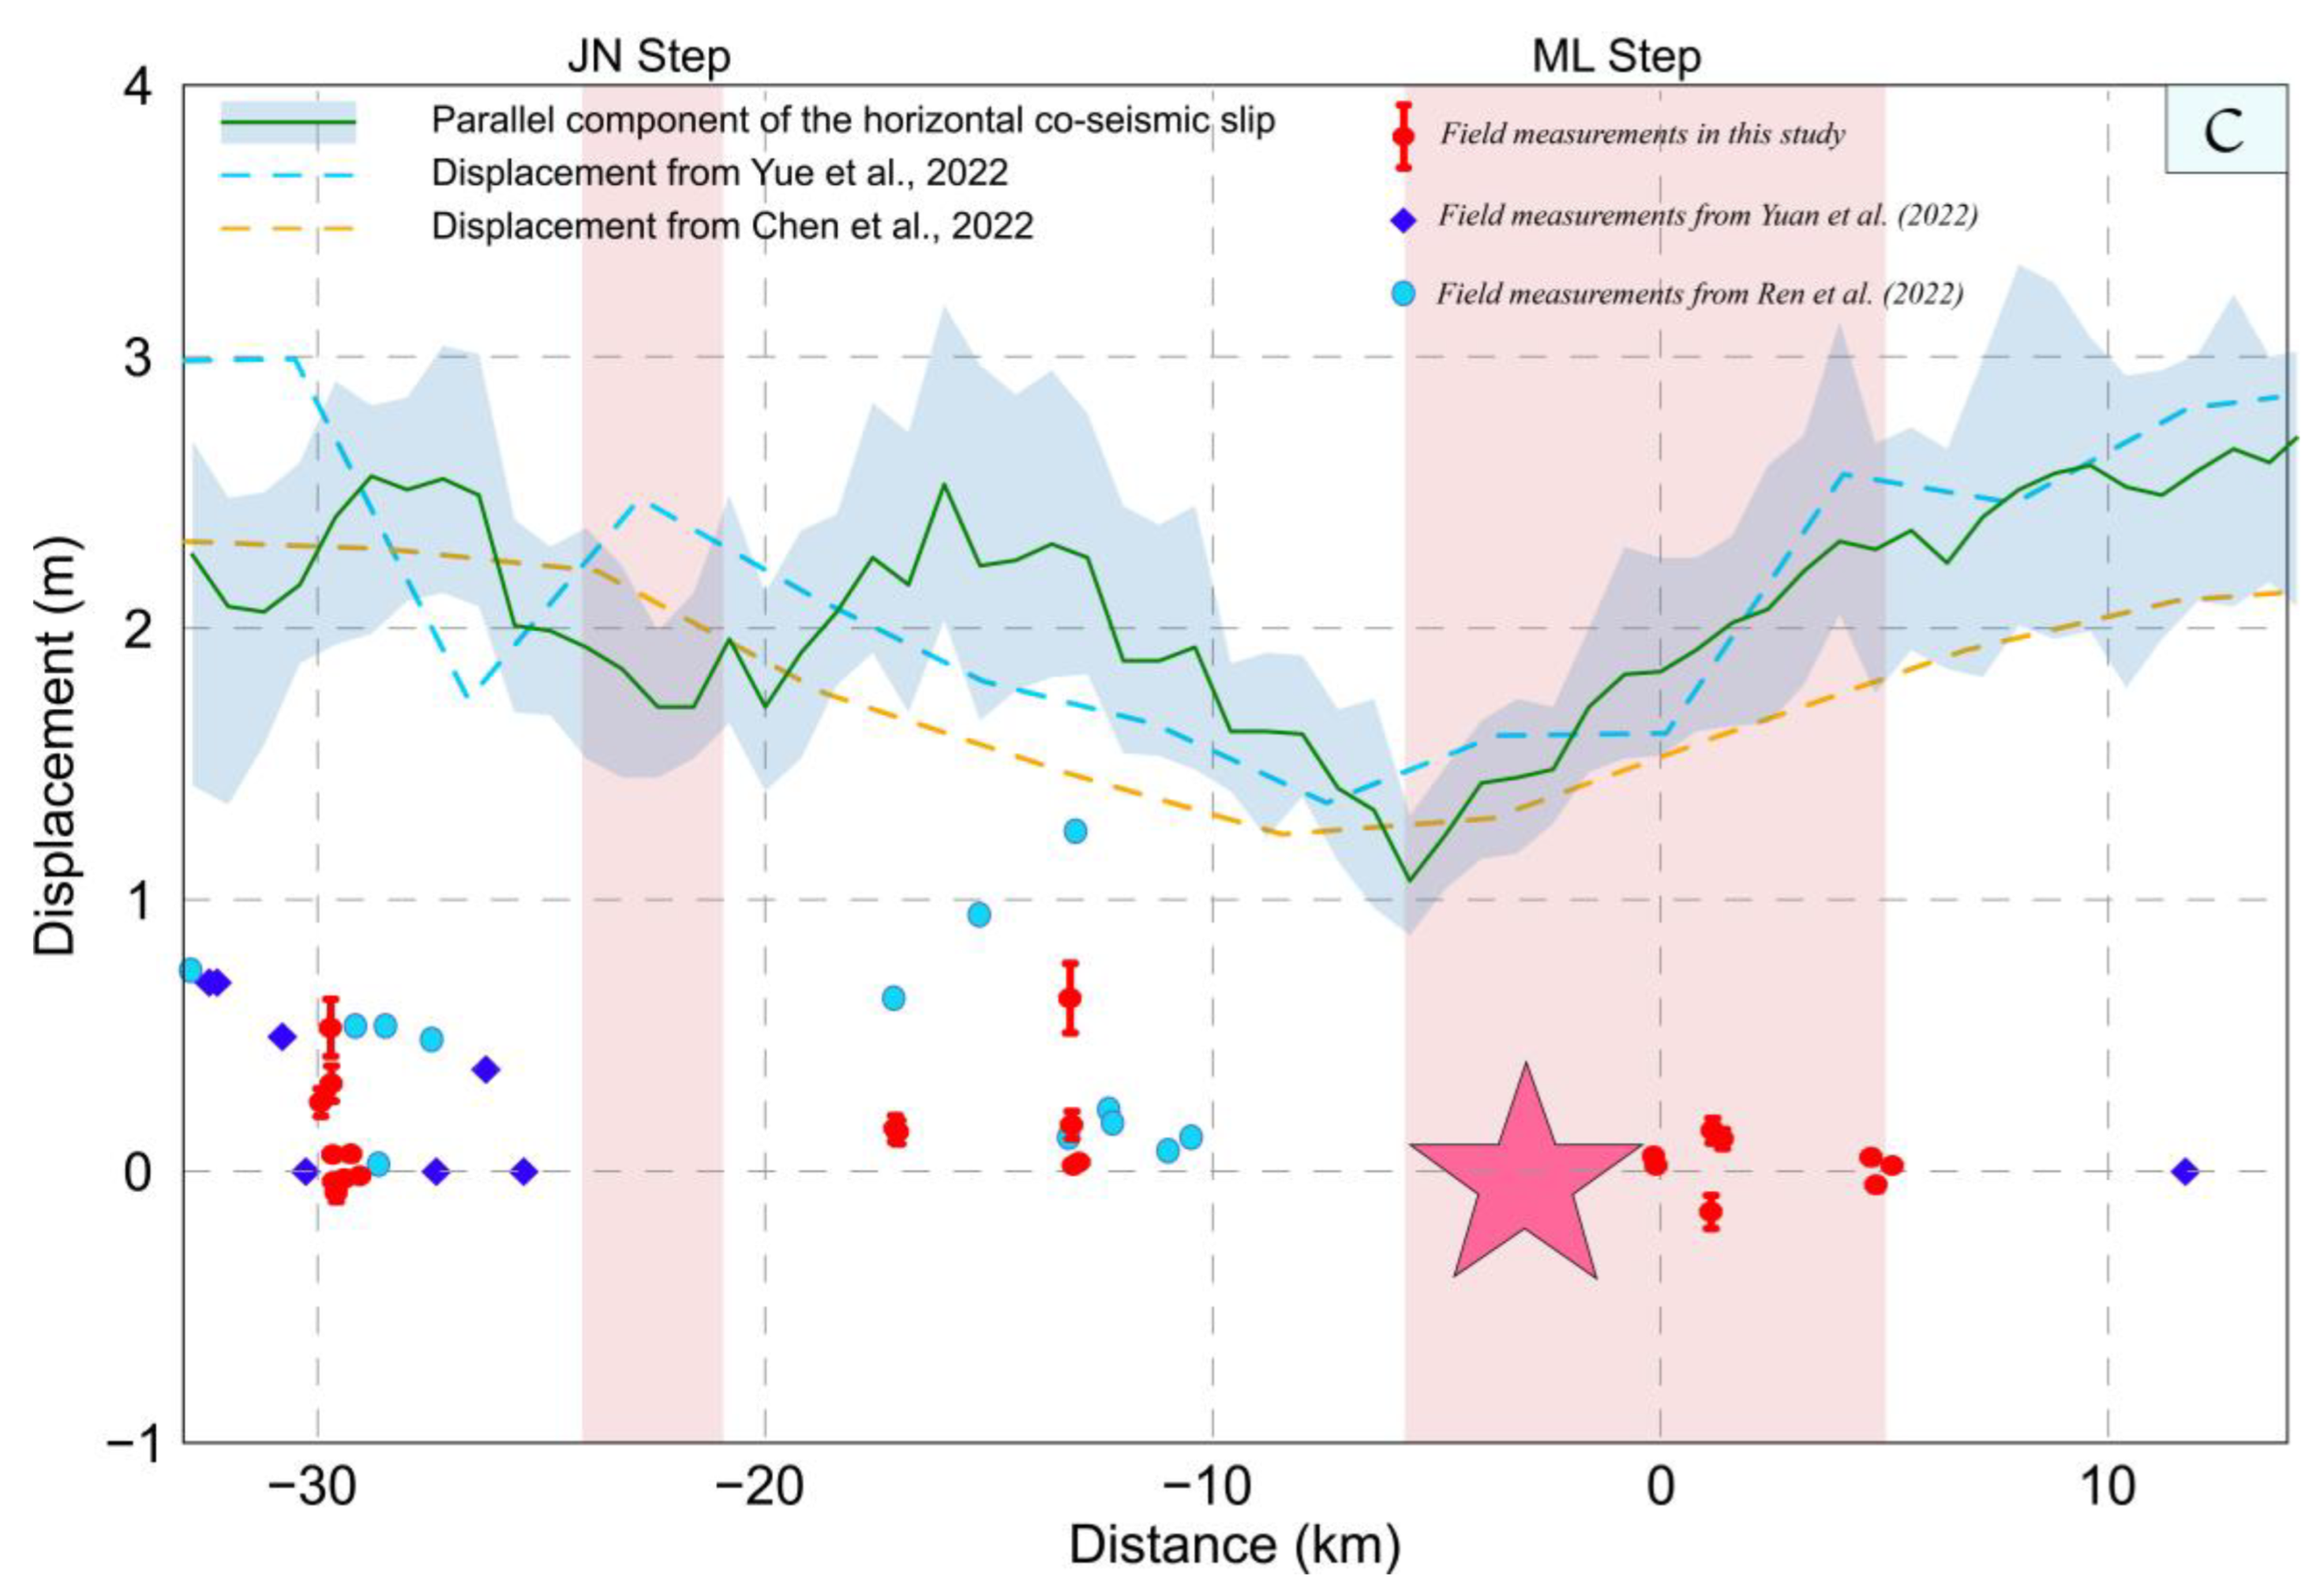
Our findings also indicate that the left-lateral horizontal coseismic displacements derived from field measurements are typically ≤0.6 m, much lower than the 1–2.7 m measured from optical image correlation (Figure 13c). The InSAR-based finite fault solutions also suggest a similar slip pattern in magnitude and spatial variation [64,69] (Figure 13c). The ratio of off-fault deformation along the discontinuous ruptures in the epicentral area is high, almost above 80%. The minimum ratio of off-fault deformation is only 72% at 13 km west of the epicenter, where the maximum on-fault offset value is 0.6 m.
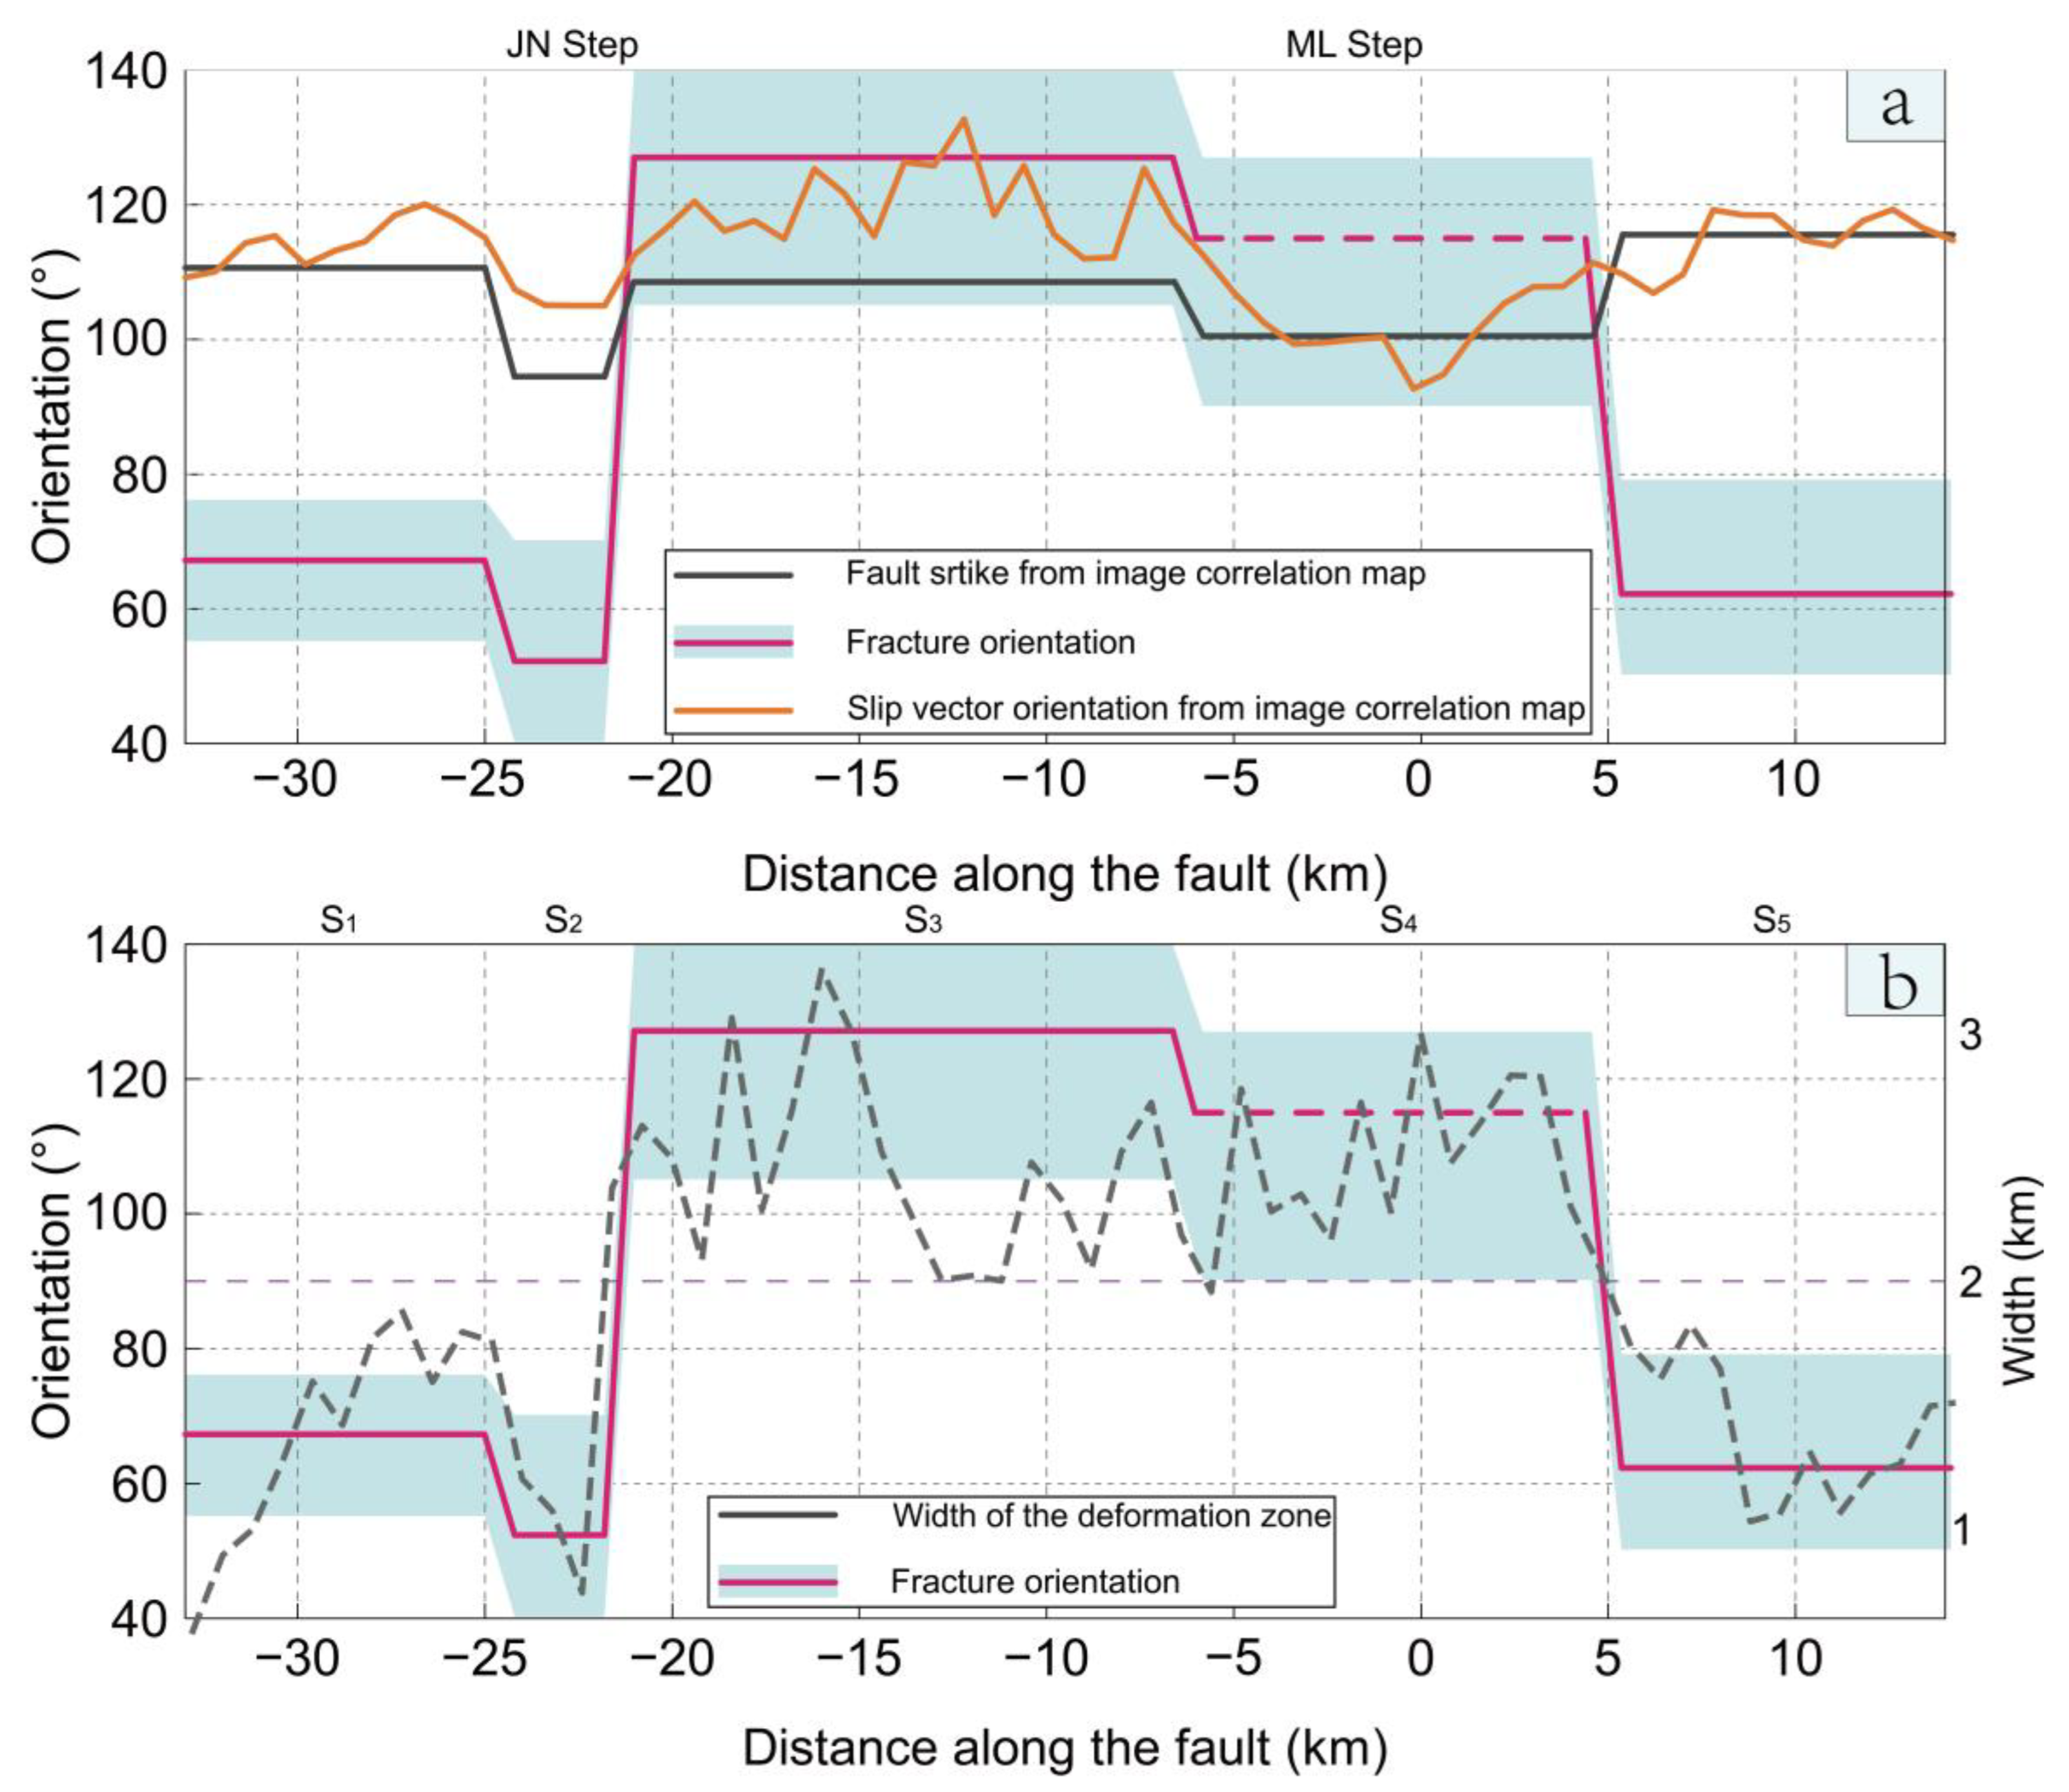
The variation in the local fault strike, main rupture orientation, and slip vector presents a similar pattern (Figure 14). In S2, the fault strike and the dominant main rupture orientations contrarotate obviously. The variation in the orientation of the slip vector generally corresponds to the fault strike (Figure 14a). The width of the fault zone in S3 and S4 is large, where the main ruptures strike 110°. Conversely, the width of the fault zone in S1, S2, and S5 is small, with the main ruptures striking in a direction that exhibits a counter-clockwise rotation compared to the main fault, forming right-stepping echelon rupture (Figure 14b).

5. Discussion

Our results present the discontinuous surface ruptures and extensive lateral spreading distributed in the epicentral region of the 2021 Maduo earthquake rupture based on detailed mapping and classification. We also investigated the coseismic slip variation along the fault by combining the field investigation and optical image correlation. These surface rupture patterns and slip distribution are often attributed to the fault geometry and the earthquake rupture propagation process. In this section, we will discuss factors controlling these complex surface ruptures and slip variations.

5.1. Discontinuous Surface Ruptures

It is common that rupture fails to reach the surface within stepovers. Historical earthquake records have revealed discontinuous surface ruptures in regions characterized by geometrical complexity, such as stepovers, bends, and branches, which may be attributed to the stress state, fault interaction, and some geological structural inheritance [12,17,70,71]. For instance, the 3 km long gap in the dextral surface rupture of the 1992 Landers earthquake, which occurred at the north end of a major fault stepover, is interpreted as resulting from a discontinuity north of the stepover. This discontinuity indicated an incomplete connection in the stepover that prevented dynamic propagating rupture from breaking through the crust [71]. The transtensional MaLong stepover of the 2021 Maduo earthquake is a 10 km long and 3 km wide diamond-shaped structure bounded by inherited geologic faults. However, no prominent inherited geologic fault reflects repeated earthquakes in the basin, possibly related to the high sedimentation rate (Figure 2b).
The rupture at depth may have stopped at some shallow depth and not reached the surface directly, or the rupture may have diffused within a wide deformation zone at the surface in the epicentral region. Unlike the prominent large-scale en echelon surface rupture in other sections of the Maduo earthquake, the main fault in S1–S3 comprises only a 110° striking shear-extension rupture segment and two small-scale en echelon rupture segments. However, the optical image correlation map in this section reveals continuous deformation and a maximal left-lateral offset of 2.5 m, but over a 0.5–2 km wide zone. A similar phenomenon was observed in the 2010 Mw6.9 Yushu earthquake along the southern boundary of the Bayan Har block, where the rupture did not reach the surface in the epicentral region [72]. The 2010 Yushu earthquake resulted in a ~31 km surface rupture south of the epicenter [72,73]. Along the main fault, the surface rupture did not show up until it was 17 km away in the southeast direction from the epicenter. Within the surface rupture gap, however, significant displacement components in the east–west direction, reaching approximately 40 cm, were observed [74]. This phenomenon may be similar to the 2021 Maduo earthquake, suggesting that the earthquake rupture while propagated at depth did not reach the surface directly or that the rupture diffused within a wide deformation zone at the surface.
The widespread lateral spreadings in the epicentral area, predominantly occurring in S1, S2, and S4, probably highlight the impacts of the high seismic ground motion and extensive presence of river and lake environments. The peak ground acceleration (PGA) reflects the ground motion intensity, an essential driver of lateral spreadings during an earthquake [75]. The PGA exceeds 0.5 g in almost all the epicentral areas and even reaches values above 0.7 in S1 [76], where the Yematan Highway bridge was severely damaged. Additionally, the intense seismic shaking can induce collapses and notable fractures along the steep banks of the Yellow River and lakes. However, the highest density of lateral spreading was not inside the highest PGA area but in a moderate–high area (0.50–0.60 g), such as the Yellow River floodplain in S4, implying that the depositional environment plays a crucial role in the development of lateral spreadings. For example, the depositional environment in the Yellow River floodplain has a shallow groundwater level and sediments primarily consisting of fine sand and clay, making it more favorable for lateral spreadings [77]. Consequently, the complex fractures with “trellis” and “radial” patterns are more likely to be induced by higher and more complex radiated waves during the initiation phase of the earthquake rupture.

5.2. Variation Coseismic Slip

We found that the left-lateral offsets from field measurements are typically ≤0.6 m, significantly lower than the 1–2.7 m measured from optical image correlation. On the other hand, as shown in Figure 13c, the total displacement from the image correlation technique is almost identical to that in geophysical finite fault inversions (of the shallowest depth) [64,69]. The significant difference between the slip measurements obtained in the field and those acquired from the optical image correlation map suggests a large ratio of off-fault deformation (OFD), ~60–80%, in the epicenter region, which is the highest along the entire rupture [78]. The diffuse deformation could also represent a certain contribution of shallow slip deficit, which is the effect of the rupture stopped at a shallow depth, linked to low initial stress in the low rigidity of thick sedimentary cover [79]. In detail, it can be attributed to various factors: (1) the presence of a limited number of displaced markers available for on-fault displacement measurements in the field; (2) the lack of displaced markers that span the whole main rupture zone; and (3) the diffused deformation in a wide deformation zone [42,43].
Understanding the variability in coseismic slip behavior associated with geometric complexities can provide available insights into fault mechanics and the dynamic process of rupture propagation [6,12,28,29]. The factors affecting the variability of coseismic slip from optical image correlation over shorter distances include (1) the limited resolution (80 m resolution) and occasional data noise inherent to the optical image correlation; (2) the width of the swath profiles employed for displacement measurement; (3) the uncertainty in slip measurement; (4) the defined main fault strike; and (5) the composition of surface material within the fault zone [43]. In contrast, the variation in coseismic slip over long distances reflects the role of fault geometry in the mechanism of fault rupture propagation [14,15,43].
Geometric complexities often act as barriers to rupture propagation, reducing the coseismic displacement in the epicentral area. The local decrease in left-lateral coseismic displacement (W5.5 km and W23 km) coincides with two stepovers, indicating that geometric complexities serve as barriers to earthquake rupture propagation. These systematic restraints of geometric complexities on earthquake rupture propagation are also observed in many strike-slip earthquake cases, such as the 1920 Haiyuan earthquake [36], the 1992 Landers earthquake [80], and the 2001 Kunlun earthquake [15,30]. The local minima in the slip-curve of the slip-parallel component from the 2001 Kunlun earthquake usually correspond to geometric barriers such as push-ups, fault branching, or changes in fault azimuth identified along the fault [15].

5.3. Geomorphic Expression of Faults and Large Cumulative Offsets

Using satellite imagery and detailed surface rupture maps, we have identified numerous displaced geomorphic markers exhibiting offsets of 100- to 1000-m scale along the geological fault near the epicentral region (Figure S2). Firstly, the north boundary fault of the MaLong stepover (fault 1) is characterized by a linear fault trough, along which several channels have been displaced with an offset of tens of meters (Figure 4). Secondly, the fault south of the MaLong stepover (fault 2) defines the boundary of the pull-apart basin and extends continuously toward the east. A series of offset channels and rivers are distributed with different magnitudes of displacements, with several significant displacements around 3.3 km (Figures S3–S5). Thirdly, displaced channels with kilometer-scale offsets are distributed along the fault (fault 3) west of the Yellow River (Figure S6). Fourth, the fault with two displaced channels of ~200 m offset defined the northwestern boundary (fault 4) of the pull-apart basin (Figure S7). Furthermore, distinct linear geomorphic features are observed on the eastern side of the MaLong stepover (fault 5).
It is worth noting the contrast between the discontinuous surface rupture, i.e., en echelon minor fissures in this 2021 Mw 7.4 Maduo earthquake, and the large displacements evident from the geomorphic features. The contrast suggests that the repetition of 2021 Maduo-type earthquakes is not enough to account for offset landforms in the epicentral region. It needs another type of event with a considerably larger slip than the Maduo earthquake to complement. This has implications for paleoseismology that events exposed in a trench can be non-characteristic, and variable in magnitude or slip [73,81,82]. The documentation of prominent fault-related landforms and lateral offset drainages with an offset of ~3.3 km suggests that the fault south of the stepover has experienced many earthquakes that can offset the landform. We propose that the Jiangcuo fault is a system in which some branches did not break during the 2021 Maduo earthquake. These strands in the Jiangcuo fault system can rupture individually or connect with specific stress conditions to generate cascading ruptures.

5.4. Rupture Initiation in the Epicentral Region

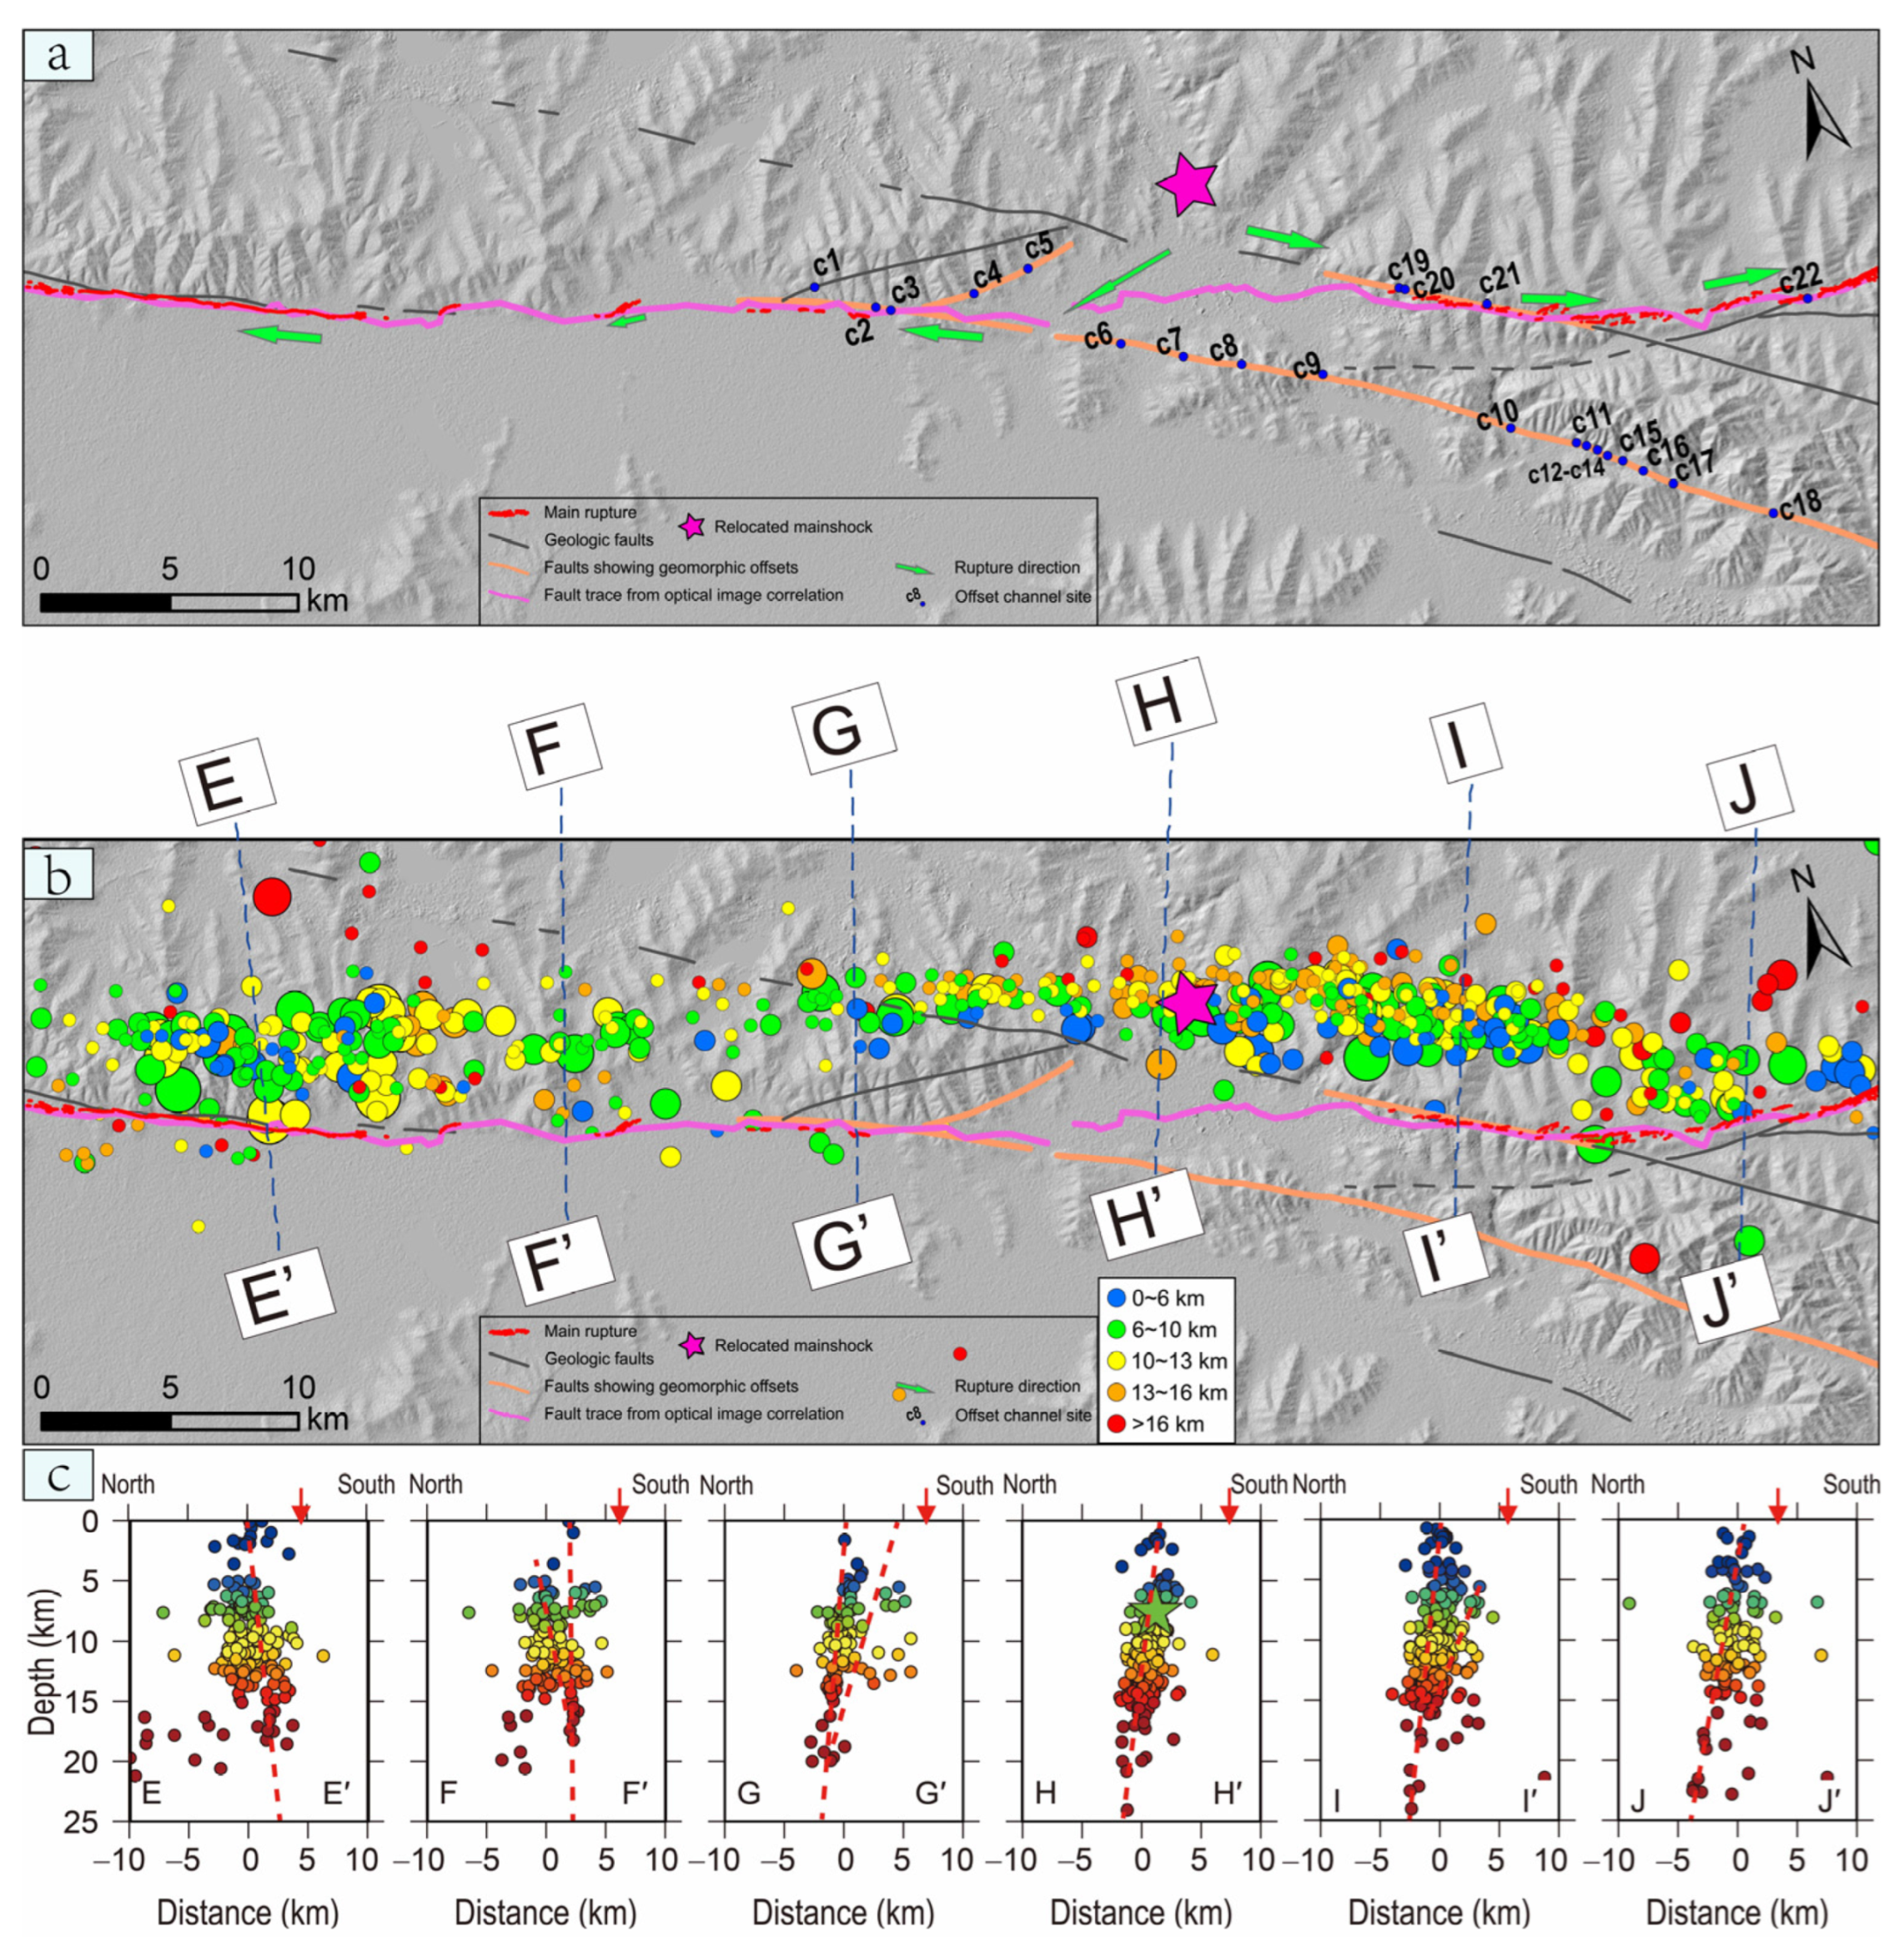
In the epicenter region, the fault geometry is complex in three dimensions. The 2021 Maduo rupture may have been initiated on the northern boundary fault of the MaLong stepover at depth and then jumped to a fault within the stepover (Figure 15). Within the stepover, the deformation zone revealed by the image correlation technique indicates that a fault may cut diagonally across the pull-apart basin at depth. The relocated aftershocks north of the stepover strike 110° and aftershocks at greater depths are farther away from the surface rupture, indicating that the fault plane dips to the northeast [32] (Figure 15b). Additionally, a series of aftershocks strike 120° to the northwest, aligning with the north boundary fault of the stepover, indicating minor triggered slip or reactivation of the northern boundary fault [32] (Figure 2b). The relatively straight alignment of aftershocks also indicates that the fault at depth might be more simple. This is in contrast with the more complex fault geometry at the surface in and around the stepover, suggesting possibly new development of the fault system shortcutting the geometric irregularities.
The complex fault network in the epicenter region may affect the rupture propagation at the onset. The fault network west and south of the epicenter suggests a possible complex path at the initial phase of rupture growth. Seismological back-projection studies suggest an abnormally slow rupture velocity in the first 2 s of westward propagation, before the rupture took off at ~4.4 km/s, i.e., possibly reaching super-shear [24,83]. In comparison, the eastward propagation was at a steady speed. Fault geometry in the epicenter area provides structural evidence in support of the results of seismological inversion. If the hypocenter is at the western end of the northern bounding fault, the well-developed fault is conducive to a smooth eastward propagation. In contrast, the westward propagation of the rupture apparently chose a path along the ill-developed fault within the stepover and at a distance from the hypocenter, indicating a complex multi-fault interaction. This would retard the propagation process, consistent with the seismological inversions [24,83], exemplifying the impact of geometrical complexities on the initiation and propagation of earthquake ruptures [4,6,7,9].

6. Conclusions

By combining high-resolution UAV images with field investigation, we conducted detailed mapping and classification of the surface fractures of the 2021 Mw7.4 Maduo earthquake. The surface fractures in the epicentral region are discontinuous, consisting of a few main ruptures and numerous lateral spreadings, which indicate that the earthquake rupture propagated deep and did not reach the surface directly or the rupture diffused within a wide deformation zone at the surface.
We also obtained two sets of coseismic slip data from field investigation and the optical correlation map, revealing a high off-fault deformation ratio in the epicentral region. Such a high ratio, together with widespread lateral spreading and distributed secondary fractures in the epicentral region, suggests a strong motion or the possibility that the rupture stopped at a shallow depth during its initiation phase instead of extending to the surface. The low coseismic slip values and high slip gradients at the two stepovers indicate that the geometric complexities serve as barriers during the earthquake rupture propagation.
Furthermore, we mapped several geomorphic faults near the epicentral region, along which a series of displaced channels with tens to hundreds of offsets was distributed, which indicates there is high potential for an earthquake, and the 2021 Mw7.4 Maduo earthquake was not at a scale that could cause significant changes in landforms in the epicentral region. The complex fault system in the surface converges at depth on the northern side, along which the 2021 Mw7.4 Maduo earthquake ruptured.

Supplementary Materials

The following supporting information can be downloaded at https://www.mdpi.com/article/10.3390/rs16071250/s1, Table S1, 25 offset measurements acquired in the field. Table S2, 22 offset measurements of the large displaced channels along the geomorphic fault in the epicentral region acquired from the satellite image. Table S3, Coseismic slip and the width acquired from the optical image correlation field map. Figure S1. The sketch map demonstrates the procedure to calculate the slip vector of displacement from the optical correlation image; Figure S2. Displaced channels are distributed along the geomorphic fault; Figure S3. Three displaced channels with the same offset of 52.8 m along the fault section extended from the southern boundary fault; Figure S4 shows that the lake along the south boundary fault is displaced ~3 km; Figure S5 shows that the channel along the fault section extended from the southern boundary fault is displaced ~3 km; Figure S6. Offset drainages, slip gap and displacement profiles in S3. (a) Discontinuous surface ruptures and slip gaps in S3. The long-term topography is consistent with the maximal slope of the deformation curves. The slip of the profiles from optical correlation can be ~1.5 m (b–d) offset drainages in S3; Figure S7 shows that the channel is displaced ~285 m along the northwest boundary fault of the large stepover.

Author Contributions

Conceptualization, L.H. and J.L.-Z.; methodology, L.H. and Y.S.; software, Y.S. and Y.G.; validation, X.Z. and H.T.; formal analysis, L.H. and X.L.; investigation, L.H., J.L.-Z., W.Y., W.W. and X.L.; resources, J.L.-Z.; data curation, L.H., W.W. and H.T.; writing—original draft preparation, L.H.; writing—review and editing, L.H., W.Y. and J.L.-Z.; visualization, Y.S. and Y.G.; supervision, J.L.-Z.; project administration, J.L.-Z.; funding acquisition, J.L.-Z. All authors have read and agreed to the published version of the manuscript.

Funding

This research was supported jointly by the National Natural Science Foundation of China (42030305, 42202232), Central Public-Interest Scientific Institution Basal Research Fund (IGCEA1812), and the State Key Laboratory of Earthquake Dynamic of China (LED2020B03).

Data Availability Statement

Data used in this study can be found in the Supplementary Materials, including offset measurements in the field, offset measurements of the large channels along the geomorphic fault in the epicentral region and coseismic slip and the width from the optical image correlation.

Acknowledgments

We thank Chris Milliner for providing the optical image correlation data, and we thank Yann Klinger and Jin Choi for the helpful manuscript revisions and suggestions.

Conflicts of Interest

The authors declare no conflicts of interest.

References

  1. Barka, A.A.; Kadinsky-Cade, K. Strike-slip fault geometry in Turkey and its influence on earthquake activity. Tectonics 1988, 7, 663–684. [Google Scholar] [CrossRef]
  2. Wesnousky, S.G. Seismological and structural evolution of strike-slip faults. Nature 1988, 335, 340–343. [Google Scholar] [CrossRef]
  3. Klinger, Y. Relation between continental strike-slip earthquake segmentation and thickness of the crust. J. Geophys. Res. Solid Earth 2010, 115, B07306. [Google Scholar] [CrossRef]
  4. King, G.; Nabelek, J. Role of fault bends in the initiation and termination of earthquake rupture. Science 1985, 228, 984–987. [Google Scholar] [CrossRef] [PubMed]
  5. Sibson, R.H. Stopping of earthquake ruptures at dilational fault jogs. Nature 1985, 316, 248–251. [Google Scholar] [CrossRef]
  6. Wesnousky, S.G. Predicting the endpoints of earthquake ruptures. Nature 2006, 444, 358–360. [Google Scholar] [CrossRef]
  7. Mildon, Z.K.; Toda, S.; Faure Walker, J.P.; Roberts, G.P. Evaluating models of Coulomb stress transfer: Is variable fault geometry important? Geophys. Res. Lett. 2016, 43, 12407–12414. [Google Scholar] [CrossRef]
  8. Sboras, S.; Pavlides, S.; Kilias, A.; Galanakis, D.; Chatziioannou, A.; Chatzipetros, A. The Geological Structure and Tectonic Complexity of Northern Thessaly That Hosted the March 2021 Seismic Crisis. Geotechnics 2022, 2, 935–960. [Google Scholar] [CrossRef]
  9. Han, L.; Liu-Zeng, J.; Yao, W.; Shao, Y.; Yuan, Z.; Wang, Y. Coseismic slip gradient at the western terminus of the 1920 Haiyuan Mw 7.9 earthquake. J. Struct. Geol. 2021, 152, 104442. [Google Scholar] [CrossRef]
  10. Schwartz, D.P.; Coppersmith, K.J. Fault behavior and characteristic earthquakes: Examples from the Wasatch and San Andreas Fault Zones. J. Geophys. Res. Solid Earth 1984, 89, 5681–5698. [Google Scholar] [CrossRef]
  11. Kase, Y.; Day, S.M. Spontaneous rupture processes on a bending fault. Geophys. Res. Lett. 2006, 33, L10302. [Google Scholar] [CrossRef]
  12. Wesnousky, S.G. Displacement and Geometrical Characteristics of Earthquake Surface Ruptures: Issues and Implications for Seismic-Hazard Analysis and the Process of Earthquake Rupture. Bull. Seismol. Soc. Amer. 2008, 98, 1609–1632. [Google Scholar] [CrossRef]
  13. Toda, S.; Enescu, B. Rate/state Coulomb stress transfer model for the CSEP Japan seismicity forecast. Earth Planets Space 2011, 63, 171–185. [Google Scholar] [CrossRef]
  14. Gold, P.O.; Oskin, M.E.; Elliott, A.J.; Hinojosa-Corona, A.; Taylor, M.H.; Kreylos, O.; Cowgill, E. Coseismic slip variation assessed from terrestrial lidar scans of the El Mayor–Cucapah surface rupture. Earth Planet. Sci. Lett. 2013, 366, 151–162. [Google Scholar] [CrossRef]
  15. Klinger, Y.; Michel, R.; King, G.C.P. Evidence for an earthquake barrier model from Mw∼7.8 Kokoxili (Tibet) earthquake slip-distribution. Earth Planet. Sci. Lett. 2006, 242, 354–364. [Google Scholar] [CrossRef]
  16. McGill, S.F.; Rubin, C.M. Surficial slip distribution on the central Emerson fault during the June 28, 1992, Landers earthquake, California. J. Geophys. Res. Solid Earth 1999, 104, 4811–4833. [Google Scholar] [CrossRef]
  17. Zachariasen, J.; Sieh, K. The transfer of slip between two en echelon strike-slip faults: A case study from the 1992 Landers earthquake, southern California. J. Geophys. Res. Solid Earth 1995, 100, 15281–15301. [Google Scholar] [CrossRef]
  18. Ansari, S. Role of fault structural heterogeneity in nucleation location of the Mw ≥ 7 Earthquakes in Iran. Environ. Earth Sci. 2021, 80, 730. [Google Scholar] [CrossRef]
  19. Barka, A. Slip distribution along the North Anatolian fault associated with the large earthquakes of the period 1939 to 1967. Bull. Seismol. Soc. Amer. 1996, 86, 1238–1254. [Google Scholar] [CrossRef]
  20. King, G.C.P. Speculations on the geometry of the initiation and termination processes of earthquake rupture and its relation to morphology and geological structure. Pure Appl. Geophys. 1986, 124, 567–585. [Google Scholar] [CrossRef]
  21. Liu-Zeng, J.; Yao, W.; Liu, X.; Shao, Y.; Wang, W.; Han, L.; Wang, Y.; Zeng, X.; Li, J.; Wang, Z.; et al. High-resolution Structure-from-Motion models covering 160 km-long surface ruptures of the 2021 Mw 7.4 Madoi earthquake in northern Tibet. Earthq. Res. Adv. 2022, 2, 100140. [Google Scholar] [CrossRef]
  22. Pan, J.; Li, H.; Chevalier, M.-L.; Tapponnier, P.; Bai, M.; Li, C.; Liu, F.; Liu, D.; Wu, K.; Wang, P.; et al. Coseismic rupture of the 2021, Mw7.4 Maduo earthquake (northern Tibet): Short-cutting of the Kunlun fault big bend. Earth Planet. Sci. Lett. 2022, 594, 117703. [Google Scholar] [CrossRef]
  23. Ren, J.; Xu, X.; Zhang, G.; Wang, Q.; Zhang, Z.; Gai, H.; Kang, W. Coseismic surface ruptures, slip distribution, and 3D seismogenic fault for the 2021 Mw 7.3 Maduo earthquake, central Tibetan Plateau, and its tectonic implications. Tectonophysics 2022, 827, 229275. [Google Scholar] [CrossRef]
  24. Wei, S.; Zeng, H.; Shi, Q.; Liu, J.; Luo, H.; Hu, W.-L.; Li, Y.; Wang, W.; Ma, Z.; Liu-Zeng, J. Simultaneous rupture propagation through fault bifurcation of the 2021 Mw7. 4 Maduo earthquake. Earth Space Sci. Open Arch. 2022, 49, e2022GL100283. [Google Scholar]
  25. Yao, W.; Wang, Z.; Liu, J.; Liu, X.; Han, L.; Shao, Y.; Wang, W.; Xu, J.; Qin, K.; Gao, Y.; et al. Discussion on coseismic surface rupture length of the 2021 Mw7.4 Maduo earthquake, Qinghai, China. Seismol. Geol. 2022, 44, 541–559. (In Chinese) [Google Scholar] [CrossRef]
  26. Yuan, Z.; Li, T.; Su, P.; Sun, H.; Ha, G.; Guo, P.; Chen, G.; Thompson Jobe, J. Large Surface-Rupture Gaps and Low Surface Fault Slip of the 2021 Mw 7.4 Maduo Earthquake Along a Low-Activity Strike-Slip Fault, Tibetan Plateau. Geophys. Res. Lett. 2022, 49, e2021GL096874. [Google Scholar] [CrossRef]
  27. Han, L.; Liu, J.; Yao, W.; Wang, W.; Liu, X.; Gao, Y.; Shao, Y.; Li, J. Detailed mapping of the surface near the epicenter segment of the 1021 Maduo Mw7.4 earthquake and discussion on distributed rupture in the stepover. Seismol. Geol. 2022, 44, 484–505. (In Chinese) [Google Scholar] [CrossRef]
  28. Elliott, A.J.; Dolan, J.F.; Oglesby, D.D. Evidence from coseismic slip gradients for dynamic control on rupture propagation and arrest through stepovers. J. Geophys. Res. Solid Earth 2009, 114, B02313. [Google Scholar] [CrossRef]
  29. Rockwell, T.K.; Klinger, Y. Surface Rupture and Slip Distribution of the 1940 Imperial Valley Earthquake, Imperial Fault, Southern California: Implications for Rupture Segmentation and Dynamics. Bull. Seismol. Soc. Amer. 2013, 103, 629–640. [Google Scholar] [CrossRef]
  30. Xu, X.; Yu, G.; Klinger, Y.; Tapponnier, P.; Van Der Woerd, J. Reevaluation of surface rupture parameters and faulting segmentation of the 2001 Kunlunshan earthquake (Mw7.8), northern Tibetan Plateau, China. J. Geophys. Res. Solid Earth 2006, 111, B05316. [Google Scholar] [CrossRef]
  31. Tapponnier, P.; Xu, Z.; Roger, F.; Meyer, B.; Arnaud, N.; Wittlinger, G.; Yang, J. Oblique Stepwise Rise and Growth of the Tibet Plateau. Science 2001, 294, 1671–1677. [Google Scholar] [CrossRef]
  32. Wang, W.; Fang, L.; Wu, J.; Tu, H.; Chen, L.; Lai, G.; Zhang, L. Aftershock sequence relocation of the 2021 MS7.4 Maduo Earthquake, Qinghai, China. Sci. China Earth Sci. 2021, 51, 1193–1202. [Google Scholar] [CrossRef]
  33. Deng, Q.; Chen, S.; Song, F.; Zhu, S.; Wang, Y.; Zhang, W.; Jiao, D.; Burchfiel, B.C.; Molnar, P.; Royden, L.; et al. Variations in the Geometry and Amount of Slip on the Haiyuan (Nanxihaushan) Fault Zone, China and the Surface Rupture of the 1920 Haiyuan Earthquake. Earthq. Source Mech. 1986, 37, 169–182. [Google Scholar]
  34. Li, H.; Pan, J.; Lin, A.; Sun, Z.; Liu, D.; Zhang, J.; Li, C.; Liu, K.; Chevalier, M.L.; Yun, K.; et al. Coseismic Surface Ruptures Associated with the 2014 Mw 6.9 Yutian Earthquake on the Altyn Tagh Fault, Tibetan Plateau. Bull. Seismol. Soc. Amer. 2016, 106, 595–608. [Google Scholar] [CrossRef]
  35. Liu-Zeng, J.; Zhang, Z.; Wen, L.; Tapponnier, P.; Sun, J.; Xing, X.; Hu, G.; Xu, Q.; Zeng, L.; Ding, L.; et al. Coseismic ruptures of the 12 May 2008, Ms 8.0 Wenchuan earthquake, Sichuan: East–west crustal shortening on oblique, parallel thrusts along the eastern edge of Tibet. Earth Planet. Sci. Lett. 2009, 286, 355–370. [Google Scholar] [CrossRef]
  36. IGCEA; NBCEA. Active Haiyuan Fault Zone Monograph; Seismological Publishing House: Beijing, China, 1990. [Google Scholar]
  37. Klinger, Y.; Xu, X.W.; Tapponnier, P.; Van der Woerd, J.; Lasserre, C.; King, G. High-resolution satellite imagery mapping of the surface rupture and slip distribution of the M-W similar to 7.8, 14 November 2001 Kokoxili Earthquake, Kunlun Fault, northern Tibet, China. Bull. Seismol. Soc. Amer. 2005, 95, 1970–1987. [Google Scholar] [CrossRef]
  38. Ren, Z.; Zhang, Z. Structural analysis of the 1997 Mw 7.5 Manyi earthquake and the kinematics of the Manyi fault, central Tibetan Plateau. J. Asian Earth Sci. 2019, 179, 149–164. [Google Scholar] [CrossRef]
  39. Pierce, I.; Williams, A.; Koehler, R.D.; Chupik, C. High-Resolution Structure-From-Motion Models and Orthophotos of the Southern Sections of the 2019 Mw 7.1 and 6.4 Ridgecrest Earthquakes Surface Ruptures. Seismol. Res. Lett. 2020, 91, 2124–2126. [Google Scholar] [CrossRef]
  40. Rodriguez Padilla, A.M.; Quintana, M.A.; Prado, R.M.; Aguilar, B.J.; Shea, T.A.; Oskin, M.E.; Garcia, L. Near-Field High-Resolution Maps of the Ridgecrest Earthquakes from Aerial Imagery. Seismol. Res. Lett. 2021, 93, 494–499. [Google Scholar] [CrossRef]
  41. Westoby, M.J.; Brasington, J.; Glasser, N.F.; Hambrey, M.J.; Reynolds, J.M. ‘Structure-from-Motion’ photogrammetry: A low-cost, effective tool for geoscience applications. Geomorphology 2012, 179, 300–314. [Google Scholar] [CrossRef]
  42. Antoine, S.L.; Klinger, Y.; Delorme, A.; Wang, K.; Bürgmann, R.; Gold, R.D. Diffuse Deformation and Surface Faulting Distribution from Submetric Image Correlation along the 2019 Ridgecrest, California, Ruptures. Bull. Seismol. Soc. Amer. 2021, 111, 2275–2302. [Google Scholar] [CrossRef]
  43. Milliner, C.W.D.; Dolan, J.F.; Hollingsworth, J.; Leprince, S.; Ayoub, F.; Sammis, C.G. Quantifying near-field and off-fault deformation patterns of the 1992 Mw 7.3 Landers earthquake. Geochem. Geophys. Geosystems 2015, 16, 1577–1598. [Google Scholar] [CrossRef]
  44. Vallage, A.; Klinger, Y.; Lacassin, R.; Delorme, A.; Pierrot-Deseilligny, M. Geological structures control on earthquake ruptures: The Mw7.7, 2013, Balochistan earthquake, Pakistan. Geophys. Res. Lett. 2016, 43, 10155–110163. [Google Scholar] [CrossRef]
  45. Peltzer, G.; Saucier, F. Present-day kinematics of Asia derived from geologic fault rates. J. Geophys. Res. Solid Earth 1996, 101, 27943–27956. [Google Scholar] [CrossRef]
  46. Molnar, P.; Tapponnier, P. Cenozoic Tectonics of Asia: Effects of a Continental Collision: Features of recent continental tectonics in Asia can be interpreted as results of the India-Eurasia collision. Science 1975, 189, 419–426. [Google Scholar] [CrossRef]
  47. Tapponnier, P.; Molnar, P. Active faulting and tectonics in China. J. Geophys. Res. 1977, 82, 2905–2930. [Google Scholar] [CrossRef]
  48. Zhang, P.-Z.; Shen, Z.; Wang, M.; Gan, W.; Bürgmann, R.; Molnar, P.; Wang, Q.; Niu, Z.; Sun, J.; Wu, J.; et al. Continuous deformation of the Tibetan Plateau from global positioning system data. Geology 2004, 32, 809–812. [Google Scholar] [CrossRef]
  49. Haibing, L.; Van der Woerd, J.; Tapponnier, P.; Klinger, Y.; Xuexiang, Q.; Jingsui, Y.; Yintang, Z. Slip rate on the Kunlun fault at Hongshui Gou, and recurrence time of great events comparable to the 14/11/2001, Mw ∼ 7.9 Kokoxili earthquake. Earth Planet. Sci. Lett. 2005, 237, 285–299. [Google Scholar] [CrossRef]
  50. Bai, M.; Chevalier, M.-L.; Pan, J.; Replumaz, A.; Leloup, P.H.; Métois, M.; Li, H. Southeastward increase of the late Quaternary slip-rate of the Xianshuihe fault, eastern Tibet. Geodynamic and seismic hazard implications. Earth Planet. Sci. Lett. 2018, 485, 19–31. [Google Scholar] [CrossRef]
  51. Chevalier, M.-L.; Leloup, P.H.; Replumaz, A.; Pan, J.; Métois, M.; Li, H. Temporally constant slip rate along the Ganzi fault, NW Xianshuihe fault system, eastern Tibet. GSA Bull. 2017, 130, 396–410. [Google Scholar] [CrossRef]
  52. Deng, Q.; Zhang, P.; Ran, Y.; Yang, X.; Min, W.; Chu, Q. Basic characteristics of tectonics in China. Sci. China Earth Sci. 2002, 1020–1030+1057. (In Chinese) [Google Scholar]
  53. Zhang, P.; Deng, Q.; Zhang, G.; Ma, J.; Gan, W.; Min, W.; Mao, F.; Wang, Q. Seismic activities and tectonic blocks in mainland China. Sci. China Earth Sci. 2003, 12–20. (In Chinese) [Google Scholar]
  54. Wang, H.; Xu, C.; Ge, L. Coseismic deformation and slip distribution of the 1997 Mw7.5 Manyi, Tibet, earthquake from InSAR measurements. J. Geodyn. 2007, 44, 200–212. [Google Scholar] [CrossRef]
  55. Peltzer, G.; Crampé, F.; King, G. Evidence of Nonlinear Elasticity of the Crust from the Mw7.6 Manyi (Tibet) Earthquake. Science 1999, 286, 272–276. [Google Scholar] [CrossRef] [PubMed]
  56. Yuan, Z.; Liu-Zeng, J.; Li, X.; Xu, J.; Yao, W.; Han, L.; Li, T. Detailed mapping of the surface rupture of the 12 February 2014 Yutian Ms7.3 earthquake, Altyn Tagh fault, Xinjiang, China. Sci. China Earth Sci. 2021, 64, 127–147. [Google Scholar] [CrossRef]
  57. Li, X.; Xu, W.; Jónsson, S.; Klinger, Y.; Zhang, G. Source Model of the 2014 Mw 6.9 Yutian Earthquake at the Southwestern End of the Altyn Tagh Fault in Tibet Estimated from Satellite Images. Seismol. Res. Lett. 2020, 91, 3161–3170. [Google Scholar] [CrossRef]
  58. Liu-Zeng, J.; Wang, P.; Zhang, Z.; Li, Z.; Cao, Z.; Zhang, J.; Yuan, X.; Wang, W.; Xing, X. Liquefaction in western Sichuan Basin during the 2008 Mw 7.9 Wenchuan earthquake, China. Tectonophysics 2017, 694, 214–238. [Google Scholar] [CrossRef]
  59. Liu-Zeng, J.; Sun, J.; Wang, P.; Hudnut, K.W.; Ji, C.; Zhang, Z.; Xu, Q.; Wen, L. Surface ruptures on the transverse Xiaoyudong fault: A significant segment boundary breached during the 2008 Wenchuan earthquake, China. Tectonophysics 2012, 580, 218–241. [Google Scholar] [CrossRef]
  60. Liu-Zeng, J.; Wen, L.; Sun, J.; Zhang, Z.; Hu, G.; Xing, X.; Zeng, L.; Xu, Q. Surficial Slip and Rupture Geometry on the Beichuan Fault near Hongkou during the Mw 7.9 Wenchuan Earthquake, China. Bull. Seismol. Soc. Amer. 2010, 100, 2615–2650. [Google Scholar] [CrossRef]
  61. Klinger, Y.; Ji, C.; Shen, Z.-K.; Bakun, W.H. Introduction to the Special Issue on the 2008 Wenchuan, China, Earthquake. Bull. Seismol. Soc. Amer. 2010, 100, 2353–2356. [Google Scholar] [CrossRef]
  62. Xu, X.; Wen, X.; Yu, G.; Chen, G.; Klinger, Y.; Hubbard, J.; Shaw, J. Coseismic reverse- and oblique-slip surface faulting generated by the 2008 Mw 7.9 Wenchuan earthquake, China. Geology 2009, 37, 515–518. [Google Scholar] [CrossRef]
  63. Xu, X.; Chen, W.; Ma, W.; Yu, G.; Chen, G. Surface Rupture of the Kunlunshan Earthquake (Ms 8.1), Northern Tibetan Plateau, China. Seismol. Res. Lett. 2002, 73, 884–892. [Google Scholar] [CrossRef]
  64. Yue, H.; Shen, Z.-K.; Zhao, Z.; Wang, T.; Cao, B.; Li, Z.; Bao, X.; Zhao, L.; Song, X.; Ge, Z.; et al. Rupture process of the 2021 M7.4 Maduo earthquake and implication for deformation mode of the Songpan-Ganzi terrane in Tibetan Plateau. Proc. Natl. Acad. Sci. USA 2022, 119, e2116445119. [Google Scholar] [CrossRef] [PubMed]
  65. Liang, M.; Yang, Y.; Du, F.; Gong, Y.; Wei, W.; Zhao, M.; He, Q. Late quaternary activity of the central segment of the dari fault and restudy of the surface rupture zone of the 1947 m73/4 dari earthquake, qinghai province. Seismol. Geol. 2020, 42, 703–714. (In Chinese) [Google Scholar] [CrossRef]
  66. Ren, J.; Xu, X.; Zhang, S.; Yeats, R.S.; Chen, J.; Zhu, A.; Liu, S. Surface rupture of the 1933 M 7.5 Diexi earthquake in eastern Tibet: Implications for seismogenic tectonics. Geophys. J. Int. 2018, 212, 1627–1644. [Google Scholar] [CrossRef]
  67. Brown, M.; Lowe, D.G. Unsupervised 3D object recognition and reconstruction in unordered datasets. In Proceedings of the Fifth International Conference on 3-D Digital Imaging and Modeling (3DIM’05), Ottawa, ON, Canada, 13–16 June 2005; pp. 56–63. [Google Scholar]
  68. Fonstad, M.A.; Dietrich, J.T.; Courville, B.C.; Jensen, J.L.; Carbonneau, P.E. Topographic structure from motion: A new development in photogrammetric measurement. Earth Surf. Process. Landf. 2013, 38, 421–430. [Google Scholar] [CrossRef]
  69. Chen, K.; Avouac, J.-P.; Geng, J.; Liang, C.; Zhang, Z.; Li, Z.; Zhang, S. The 2021 Mw 7.4 Madoi Earthquake: An Archetype Bilateral Slip-Pulse Rupture Arrested at a Splay Fault. Geophys. Res. Lett. 2022, 49, e2021GL095243. [Google Scholar] [CrossRef]
  70. Choi, J.-H.; Klinger, Y.; Ferry, M.; Ritz, J.-F.; Kurtz, R.; Rizza, M.; Bollinger, L.; Davaasambuu, B.; Tsend-Ayush, N.; Demberel, S. Geologic Inheritance and Earthquake Rupture Processes: The 1905 M ≥ 8 Tsetserleg-Bulnay Strike-Slip Earthquake Sequence, Mongolia. J. Geophys. Res. Solid Earth 2018, 123, 1925–1953. [Google Scholar] [CrossRef]
  71. Spotila, J.A.; Sieh, K. Geologic investigations of a “slip gap” in the surficial ruptures of the 1992 Landers earthquake, southern California. J. Geophys. Res. Solid Earth 1995, 100, 543–559. [Google Scholar] [CrossRef]
  72. Pan, J.; Li, H.; Wu, F.; Li, N.; Guo, R.; Zhang, W. Surface rupture characteristics, rupture mechanics, and rupture process of the Yushu earthquake (Ms7. 1), 14/04/2010. Acta Petrol. Sin. 2011, 27, 3449–3459. [Google Scholar]
  73. Li, C.; Lv, L.; Wang, X.; Li, X. Late quaternary slip behavior of the Yushu fault and the 2010 Ms 7.1 Yushu earthquake, eastern Tibetan Plateau. J. Struct. Geol. 2019, 118, 284–298. [Google Scholar] [CrossRef]
  74. Tobita, M.; Nishimura, T.; Kobayashi, T.; Hao, K.X.; Shindo, Y. Estimation of coseismic deformation and a fault model of the 2010 Yushu earthquake using PALSAR interferometry data. Earth Planet. Sci. Lett. 2011, 307, 430–438. [Google Scholar] [CrossRef]
  75. Quigley, M.C.; Bastin, S.; Bradley, B.A. Recurrent liquefaction in Christchurch, New Zealand, during the Canterbury earthquake sequence. Geology 2013, 41, 419–422. [Google Scholar] [CrossRef]
  76. Chen, W.; Wang, D.; Zhang, C.; Yao, Q.; Si, H. Estimating Seismic Intensity Maps of the 2021 Mw 7.3 Madoi, Qinghai and Mw 6.1 Yangbi, Yunnan, China Earthquakes. J. Earth Sci. 2022, 33, 839–846. [Google Scholar] [CrossRef]
  77. Wang, W.; Liu-Zeng, J.; Shao, Y.; Wang, Z.; Han, L.; Shen, X.; Qin, K.; Gao, Y.; Yao, W.; Hu, G.; et al. Mapping of Soil Liquefaction Associated with the 2021 Mw 7.4 Maduo (Madoi) Earthquake Based on the UAV Photogrammetry Technology. Remote Sens. 2023, 15, 1032. [Google Scholar] [CrossRef]
  78. Liu-Zeng, J.; Liu, Z.; Liu, X.; Milliner, C.; Rodriguez Padilla, A.M.; Xu, S.; Avouac, J.-P.; Yao, W.; Klinger, Y.; Han, L.; et al. Fault orientation trumps fault maturity in controlling coseismic rupture characteristics of the 2021 Maduo earthquake. AGU Adv. 2024, 5, e2023AV001134. [Google Scholar] [CrossRef]
  79. Scholz, C.H. Earthquakes and friction laws. Nature 1998, 391, 37–42. [Google Scholar] [CrossRef]
  80. Sieh, K.; Jones, L.; Hauksson, E.; Hudnut, K.; Eberhart-Phillips, D.; Heaton, T.; Hough, S.; Hutton, K.; Kanamori, H.; Lilje, A.; et al. Near-Field Investigations of the Landers Earthquake Sequence, April to July 1992. Science 1993, 260, 171–176. [Google Scholar] [CrossRef]
  81. Liu-Zeng, J.; Klinger, Y.; Xu, X.; Lasserre, C.; Chen, G.; Chen, W.; Tapponnier, P.; Zhang, B. Millennial recurrence of large earthquakes on the Haiyuan fault near Songshan, Gansu Province, China. Bull. Seismol. Soc. Amer. 2007, 97, 14–34. [Google Scholar] [CrossRef]
  82. Liu-Zeng, J.; Shao, Y.; Klinger, Y.; Xie, K.; Yuan, D.; Lei, Z. Variability in magnitude of paleoearthquakes revealed by trenching and historical records, along the Haiyuan Fault, China. J. Geophys. Res. Solid Earth 2015, 120, 8304–8333. [Google Scholar] [CrossRef]
  83. Cheng, C.; Wang, D.; Yao, Q.; Fang, L.; Xu, S.; Huang, Z.; Liu, T.; Wang, Z.; Huang, X. The 2021 Mw 7.3 Madoi, China Earthquake: Transient Supershear Ruptures on a Presumed Immature Strike-Slip Fault. J. Geophys. Res. Solid Earth 2023, 128, e2022JB024641. [Google Scholar] [CrossRef]
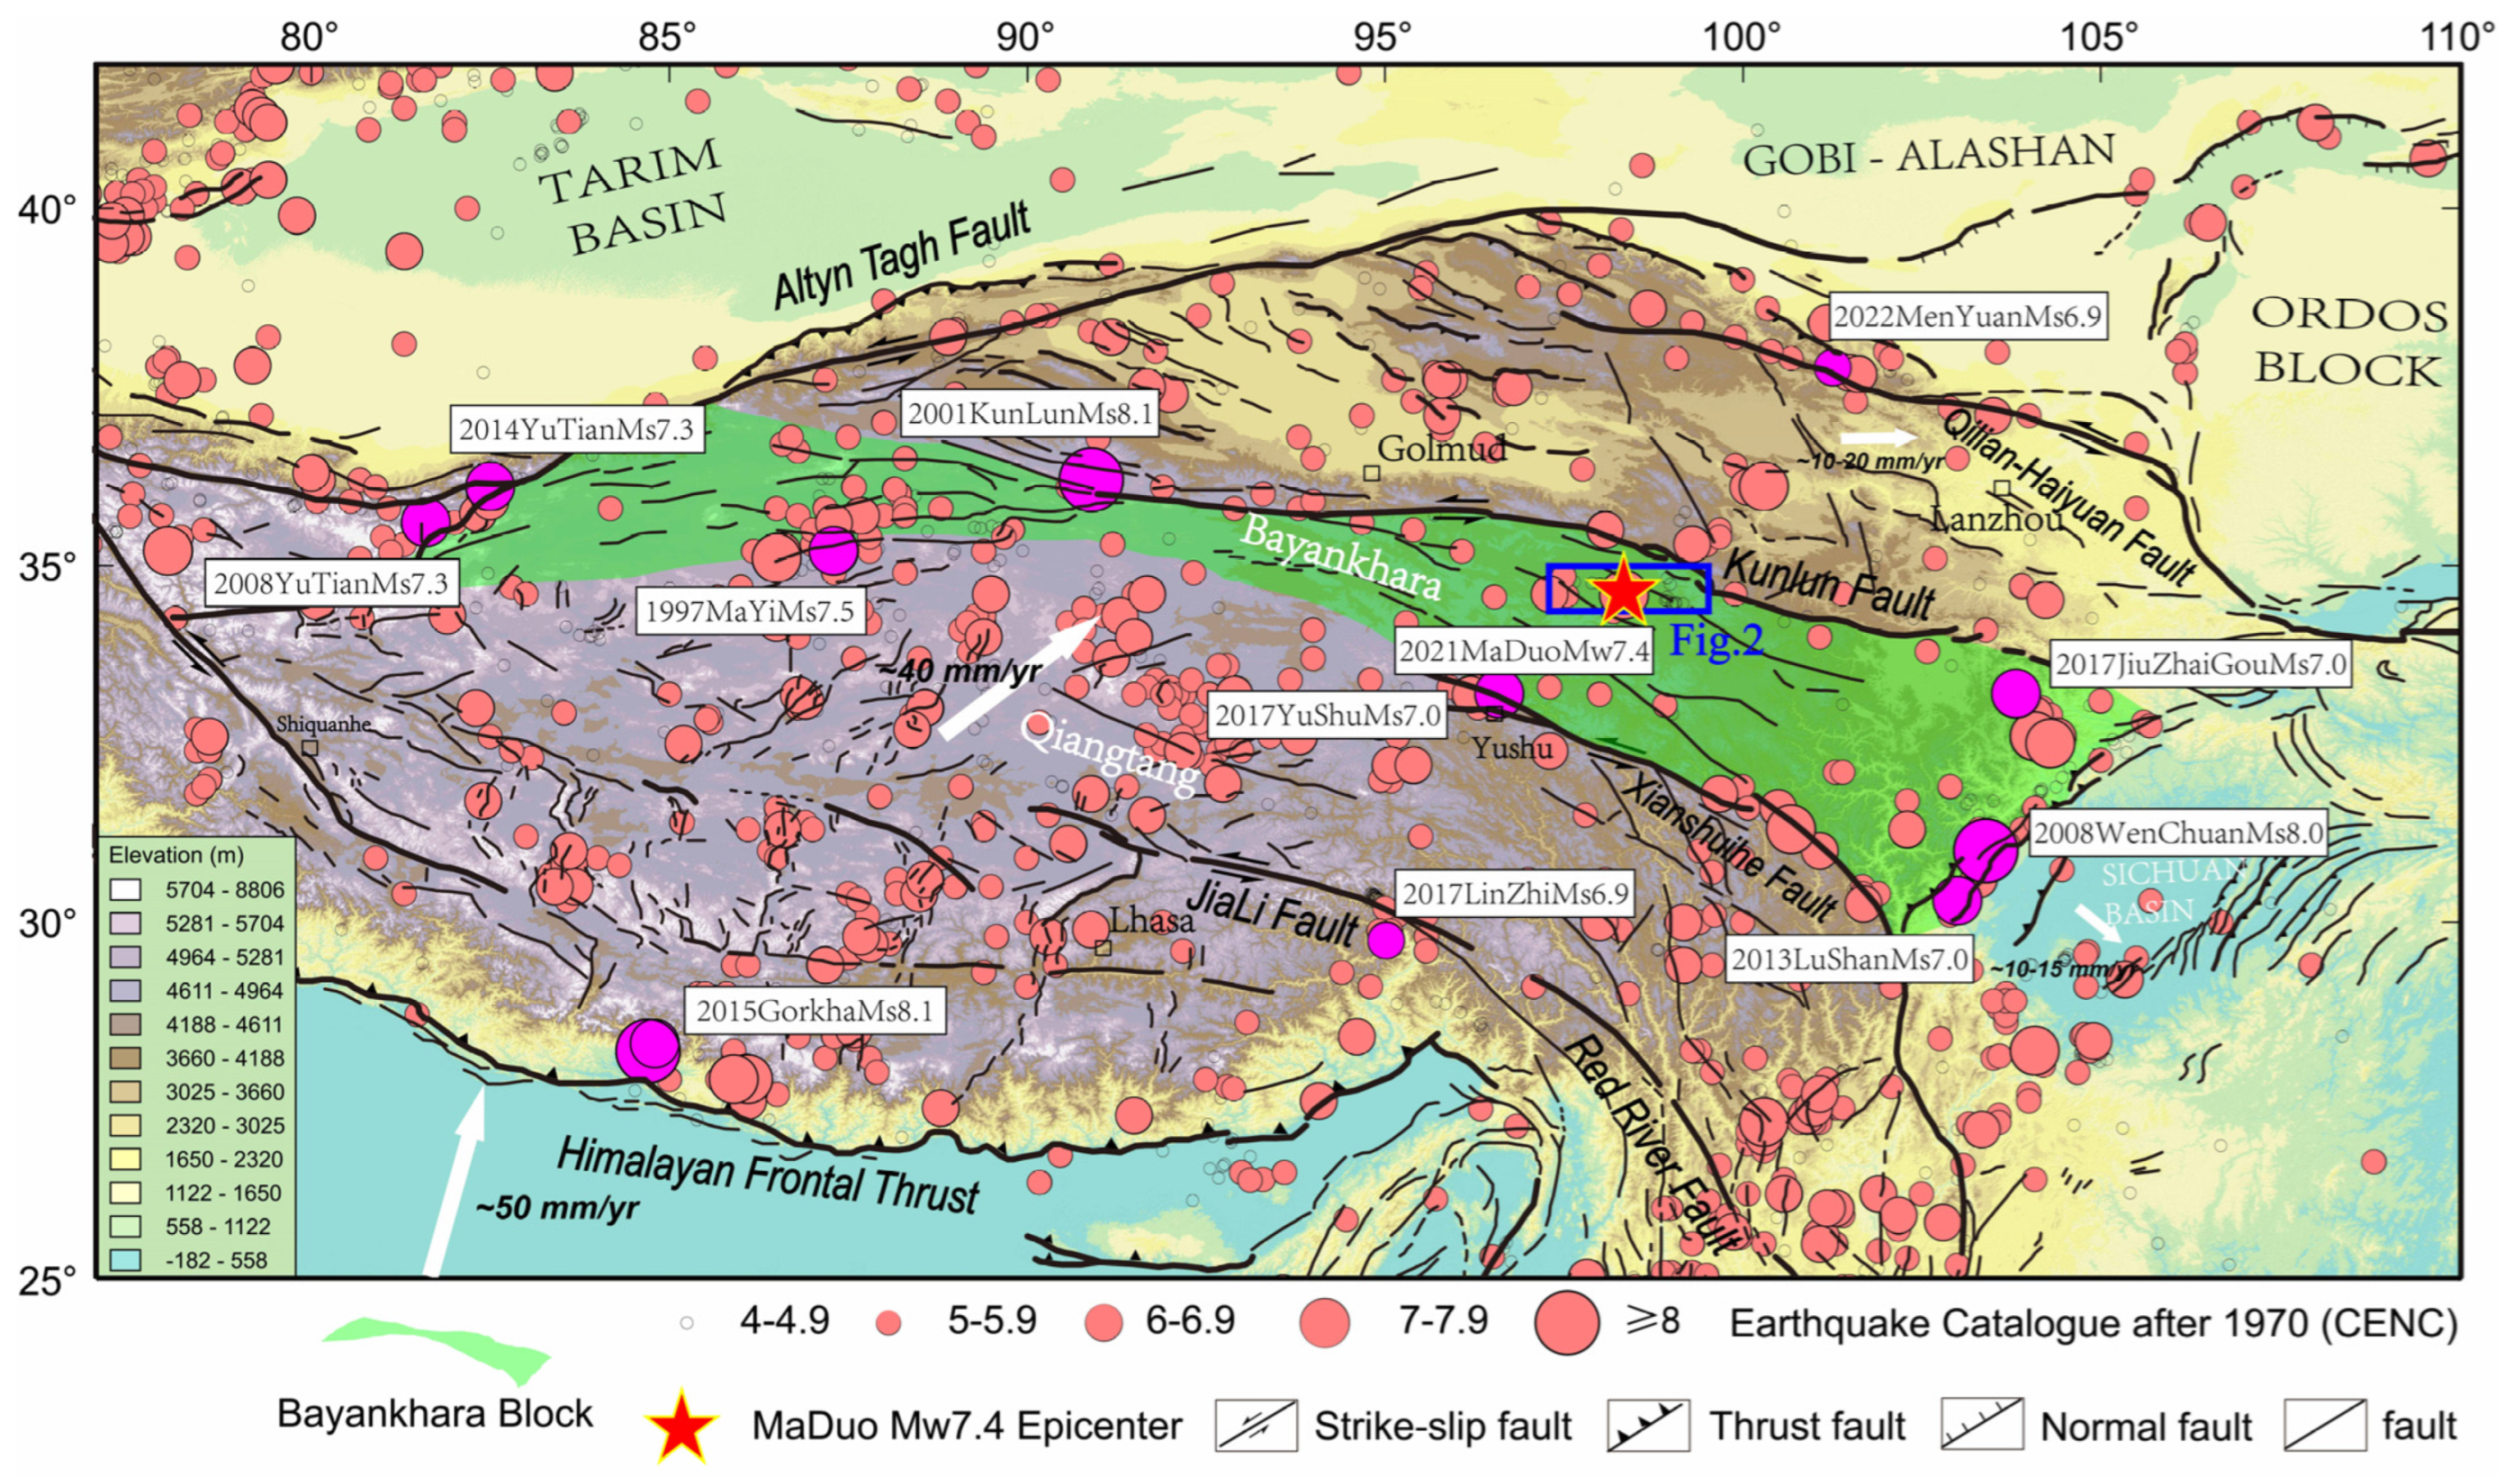
Figure 1. Tectonic setting [31] and historical earthquakes in and around the Qinghai-Xizang (Tibet) Plateau, superimposed on the 90 m resolution SRTM DEM. The black lines represent active faults, while solid circles mark historical earthquakes with magnitude >4 since 1970 (http://www.cenc.ac.cn, accessed on 1 May 2022), with the purple circles denoting earthquakes with magnitudes of ≥6.9. The red star indicates the 2021 Mw7.4 Maduo earthquake.
Remotesensing 16 01250 g001
Figure 2. Maps depicting the tectonic setting and detailed surface ruptures of the 2021 Mw7.4 Maduo earthquake. (a) The geological and structural map is adapted from the 1:250,000 scale geologic map and overlaid on the 12.5 m resolution ALOS_PALSAR DEM. The detailed mapping and classification of the Mw7.4 Maduo earthquake surface ruptures are shown in different colors, with the coseismic surface ruptures associated with the Maduo earthquake displayed in red. Relocated mainshock and aftershocks within eight days of the mainshock are indicated by solid purple and orange circles, respectively [32]. Fault plane solutions are collected from the USGS and CENC (China Earthquake Network Center) (http://www.cenc.ac.cn, accessed on 22 May 2021; https://earthquake.usgs.gov/earthquakes, accessed on 22 May 2021). The Jiangcuo fault is divided into seven sections from west to east: (1) Eling Lake (ELL), (2) Yematan West (YMTW), (3) Yematan East (YMTE), (4) Huanghexiang (HHX), (5) Dong’O (D’O), (6) Changma he (CMH), (7) Xuema West (XMW), and (8) Xuema East (XME). (b) Categorized surface rupture maps of the 2021 Mw7.4 Maduo earthquake in the central Maduo earthquake segment are shown, with surface ruptures divided into main rupture strands, secondary rupture strands, and lateral spreading, denoted in red, blue and yellow, respectively. The fault in the epicentral region is defined as five segments (S1–S5), in which S2 and S4 indicate releasing stepovers. JN step: JiangNing stepover; ML step: MaLong stepover.
Remotesensing 16 01250 g002
Figure 3. Rose diagrams depict the orientation distributions for the main rupture, secondary rupture, lateral spreading in each segment, and their relationships with the local fault strike. The main ruptures in S1, S2, and S5 exhibit a counter-clockwise rotation compared with the fault’s orientation, whereas the main rupture in S3 shows a clockwise rotation compared with the fault.
Remotesensing 16 01250 g003
Figure 4. Offset measurements conducted in the field. (ac) The small pull-apart features on individual branches, measurements of the left-lateral slip obtained by matching corresponding parts of the pull-apart. (d) A small piece of turf was horizontally displaced by 11 cm. (e) Displaced bank edge with an offset of 25 cm. (f) A pillar intersects the fault perpendicular to fracture, providing a clear piercing line for measuring the offset, with the left-lateral slip being 22 cm.
Remotesensing 16 01250 g004
Figure 5. (a) East–west displacement map and slip measurement profiles. The black dots indicate the boundary of the fault deformation zone. The optical image correlation map is processed from COSI-Corr (Co-registration of Optically Sensed Images and Correlation, http://www.tectonics.caltech.edu/slip_history/spot_coseis/download_software.html) software based on a pre- and post-earthquake sentinel-2 Satellite Image dataset, with a ground resolution of 80 m. (b) Profiles displaying east–west slip measurements. Each profile is 200 m wide, and the width of the deformation zone is marked in blue.
Remotesensing 16 01250 g005
Figure 6. High-resolution Digital Orthophoto Maps (DOMs) display various surface ruptures in each segment. (a) Small-scale right-stepping en echelon fractures in S5. (b) Small-scale en echelon fractures accompanied by sand liquefaction in S4. (c) Tensile shear ruptures observed in S3. (d) Large-scale en echelon rupture observed in S1.
Remotesensing 16 01250 g006
Figure 7. Diffused surface ruptures observed in the 1.8 km wide JN releasing stepover in S2. (a) The extent of the main ruptures (in red) situated in the middle and secondary ruptures (in blue) diffused with the stepover, superimposed on a high-resolution hillshaded image. (c,d) Local small-scale main en echelon ruptures. (b,e) Secondary ruptures with the same strike as the main rupture.
Remotesensing 16 01250 g007
Figure 8. Photographs illustrating examples of coseismic surface ruptures in S3. (a,b) Surface ruptures with multiple branches exhibiting predominantly pure shear and tension. (c,d) Submeter-scale en echelon ruptures accompanied by sand liquefaction.
Remotesensing 16 01250 g008
Figure 9. Various types of lateral spreading sand liquefaction in S3. Sand blows occurred in isolated circular vents (a) or aligned with and accompanying tensional or trans-tensional fractures (b,c). Particularly at some sites, the shape of the liquefied sand closely corresponds to the location and strike of surface ruptures (d,e).
Remotesensing 16 01250 g009
Figure 10. Various types of surface fractures in the Yellow River flood land in S4. (a) The secondary ruptures fractures in S4, with the fault trace location depicted from optical correlation superimposed on a high-resolution hillshade image. (b) The field photograph captures local small-scale en echelon ruptures along the secondary rupture. (c) Another field photo shows a linear fault scarp with a strike of 110°.
Remotesensing 16 01250 g010
Figure 11. Lateral spreadings occur along the banks of the Yellow River, with most of them situated close to the banks and lakeshore, such as collapse cracks (a), Grid fracture (b,c) and Explosive crack (d).
Remotesensing 16 01250 g011
Figure 12. Trough valley and laterally offset drainage areas in S5 along the fault. (a) Surface ruptures are observed along the fault trough valley. (b,c) Several tens of meters of offset gullies are visible, consistent with the main ruptures, as seen in high-resolution DEM and UAV images.
Remotesensing 16 01250 g012
Figure 13. (a) The amplitude of the horizontal displacement of the north–south, and east–west components, and the width of the east–west deformation zone are derived from optical correlation in the epicentral region (from W30 km to E17 km). The pink shaded areas indicate the JiangNing (JN) stepover and MaLong (ML) stepover, respectively. (b) Parallel (left-lateral strike-slip displacement) and perpendicular (shortening/extension displacement) components of the horizontal coseismic slip along the fault, as determined from optical correlation. The above figure displays the detailed surface ruptures and fault geometry. (c) Comparison between the displacement measurements obtained from field investigations [23,26], optical correlation, and geophysical finite fault inversions [64,69].
Remotesensing 16 01250 g013aRemotesensing 16 01250 g013b
Figure 14. Variations in the fault strike from image correlation map, fractures orientations, slip vector from image correlation map (a), and fault zone width from image correlation map (b) along the fault in the epicentral region.
Remotesensing 16 01250 g014
Figure 15. Rupture propagation pattern of the 2021 Maduo earthquake and the deep fault structure indicated by aftershocks. (a) The earthquake rupture originated at the northern boundary of the MaLong stepover and propagated bilaterally. A series of displaced channels, with offsets ranging from tens to thousands of meters, are distributed along the geological fault, suggesting the potential for generating seismic events along the fault that did not rupture during the 2021 Maduo earthquake. (b) A section of the 2021 aftershock distribution and the profile lines of the aftershocks perpendicular to the Jiangcuo fault. (c) Depth distribution of the 2021 aftershocks in fault-perpendicular cross-section at various locations along the strike, suggesting the general north-dipping fault plane [32]. Red arrows indicate the positions of surface rupture, and dashed lines represent the dips of aftershock alignments.
Remotesensing 16 01250 g015
Disclaimer/Publisher’s Note: The statements, opinions and data contained in all publications are solely those of the individual author(s) and contributor(s) and not of MDPI and/or the editor(s). MDPI and/or the editor(s) disclaim responsibility for any injury to people or property resulting from any ideas, methods, instructions or products referred to in the content.