
Validating Digital Earth Australia NBART for the Landsat 9 Underfly of Landsat 8

 , , , , , , , , ,
Abstract
1. Introduction
- We present the results of the Australian field’s validation campaign in support of the Landsat 8 and 9 underfly and demonstrate the level of agreement between the two sensors.
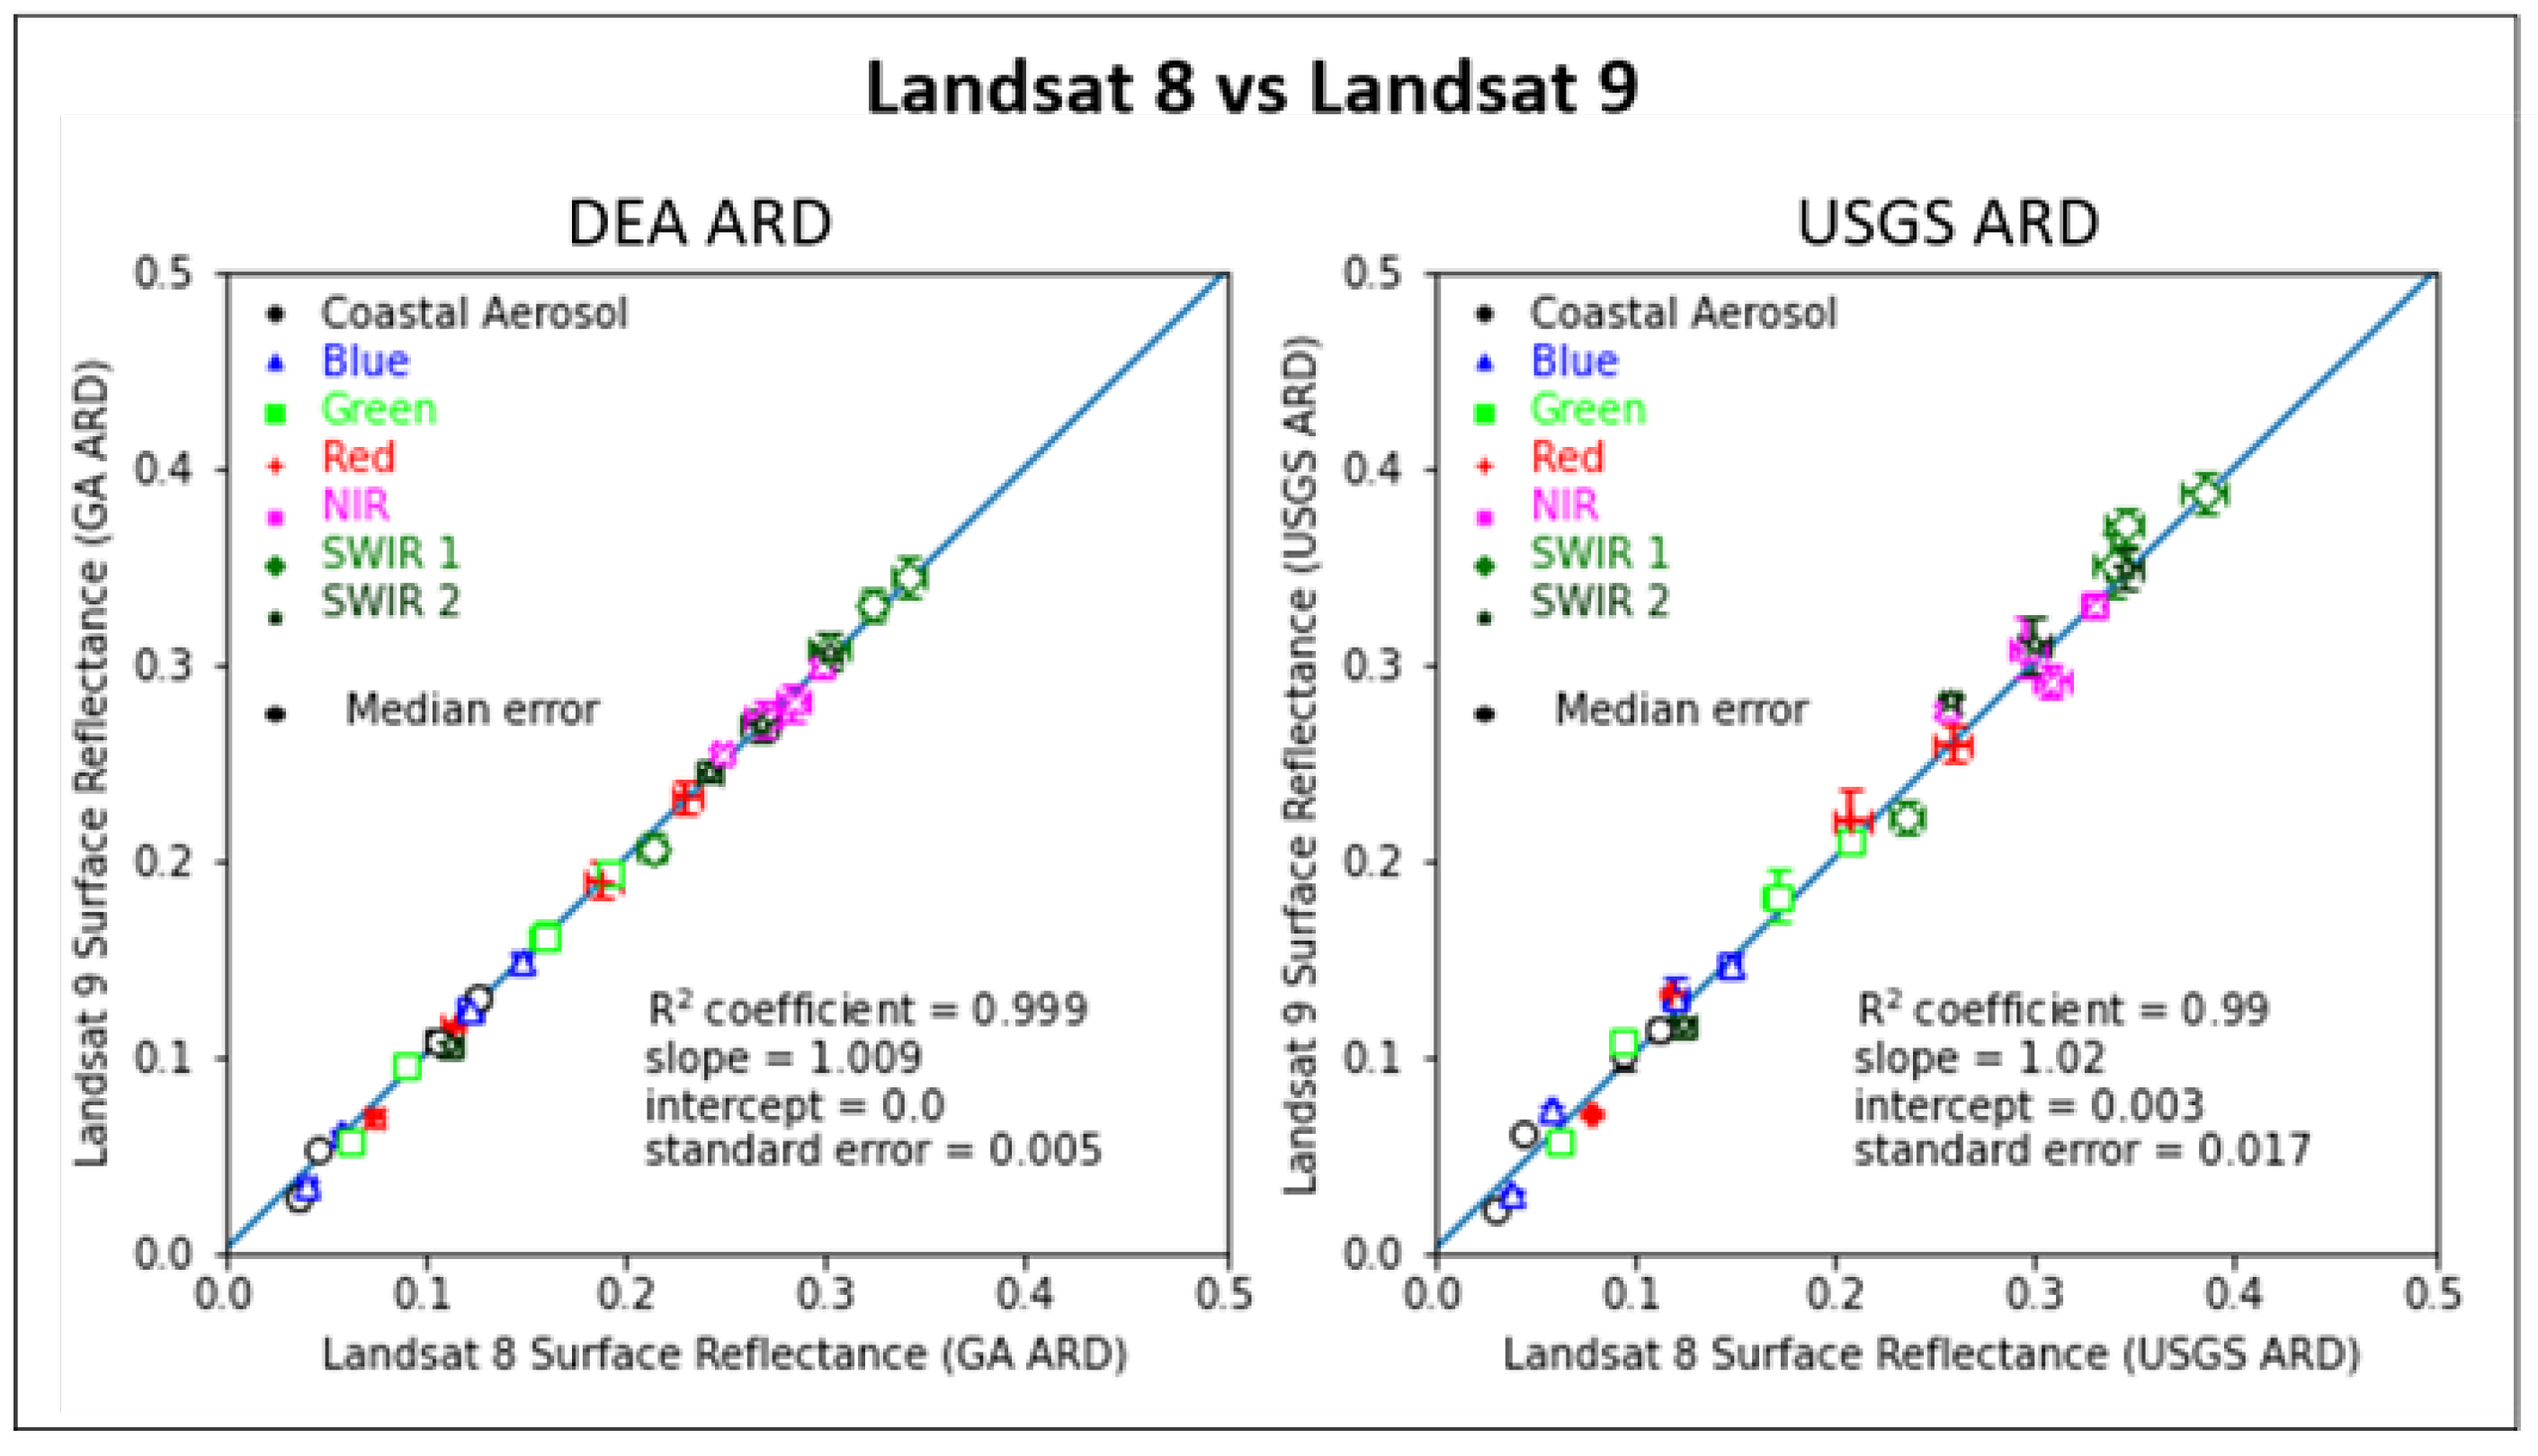
- We compare and contrast the results presented by two differing analysis-ready data (ARD) processing models: Geoscience Australia (GA) and the United States Geological Survey (USGS).
- We use underfly validation to prove the efficacy and comparative reliability of a satellite surface reflectance (SR) validation measurement model refined and proven by Digital Earth Australia (DEA).
1.1. A History of Underfly Validations
1.2. Surface Reflectance ARD
1.3. Vicarious Field Validation
2. Materials and Methods
2.1. Digital Earth Australia Terrestrial Analysis Ready Data
- Atmospheric corrections;
- BRDF;
- Topographic effects.
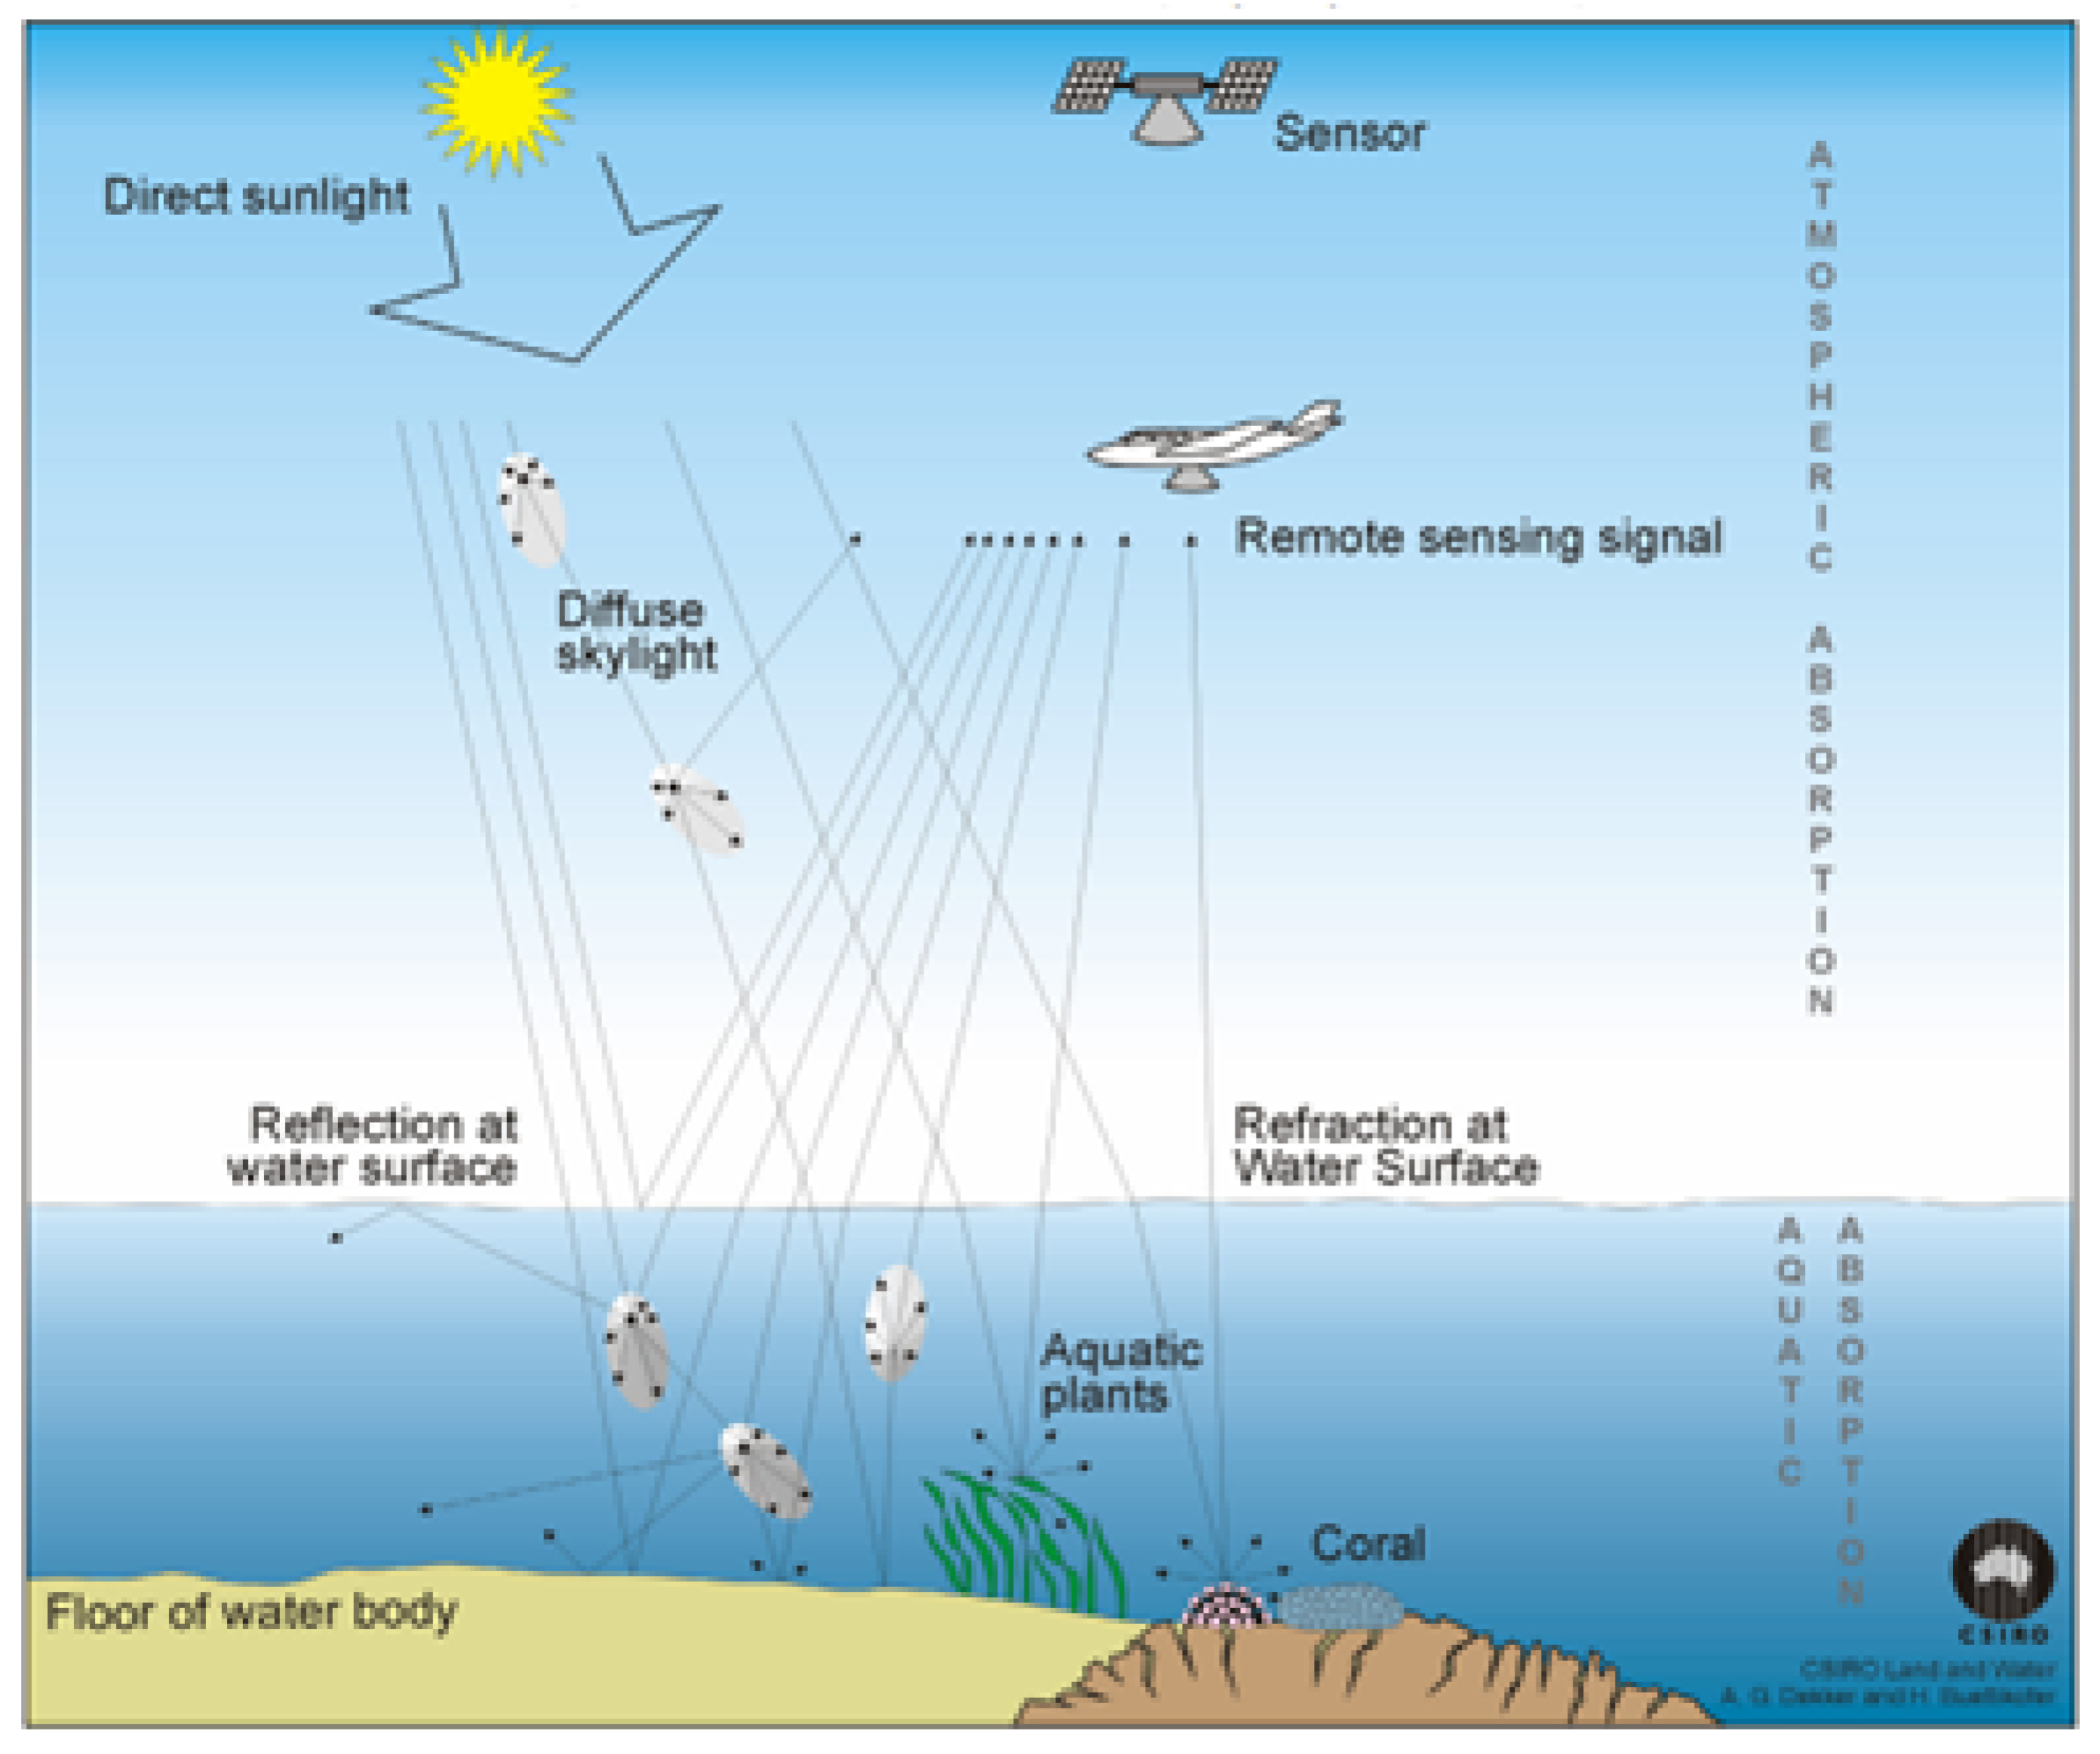
2.2. DEA Aquatic A-ARD
2.3. USGS ARD and USGS Aquatic ARD
2.4. DEA ARD Validation Protocol (ARD_VP)
2.5. Field Spectral Data: Radiance Not Reflectance
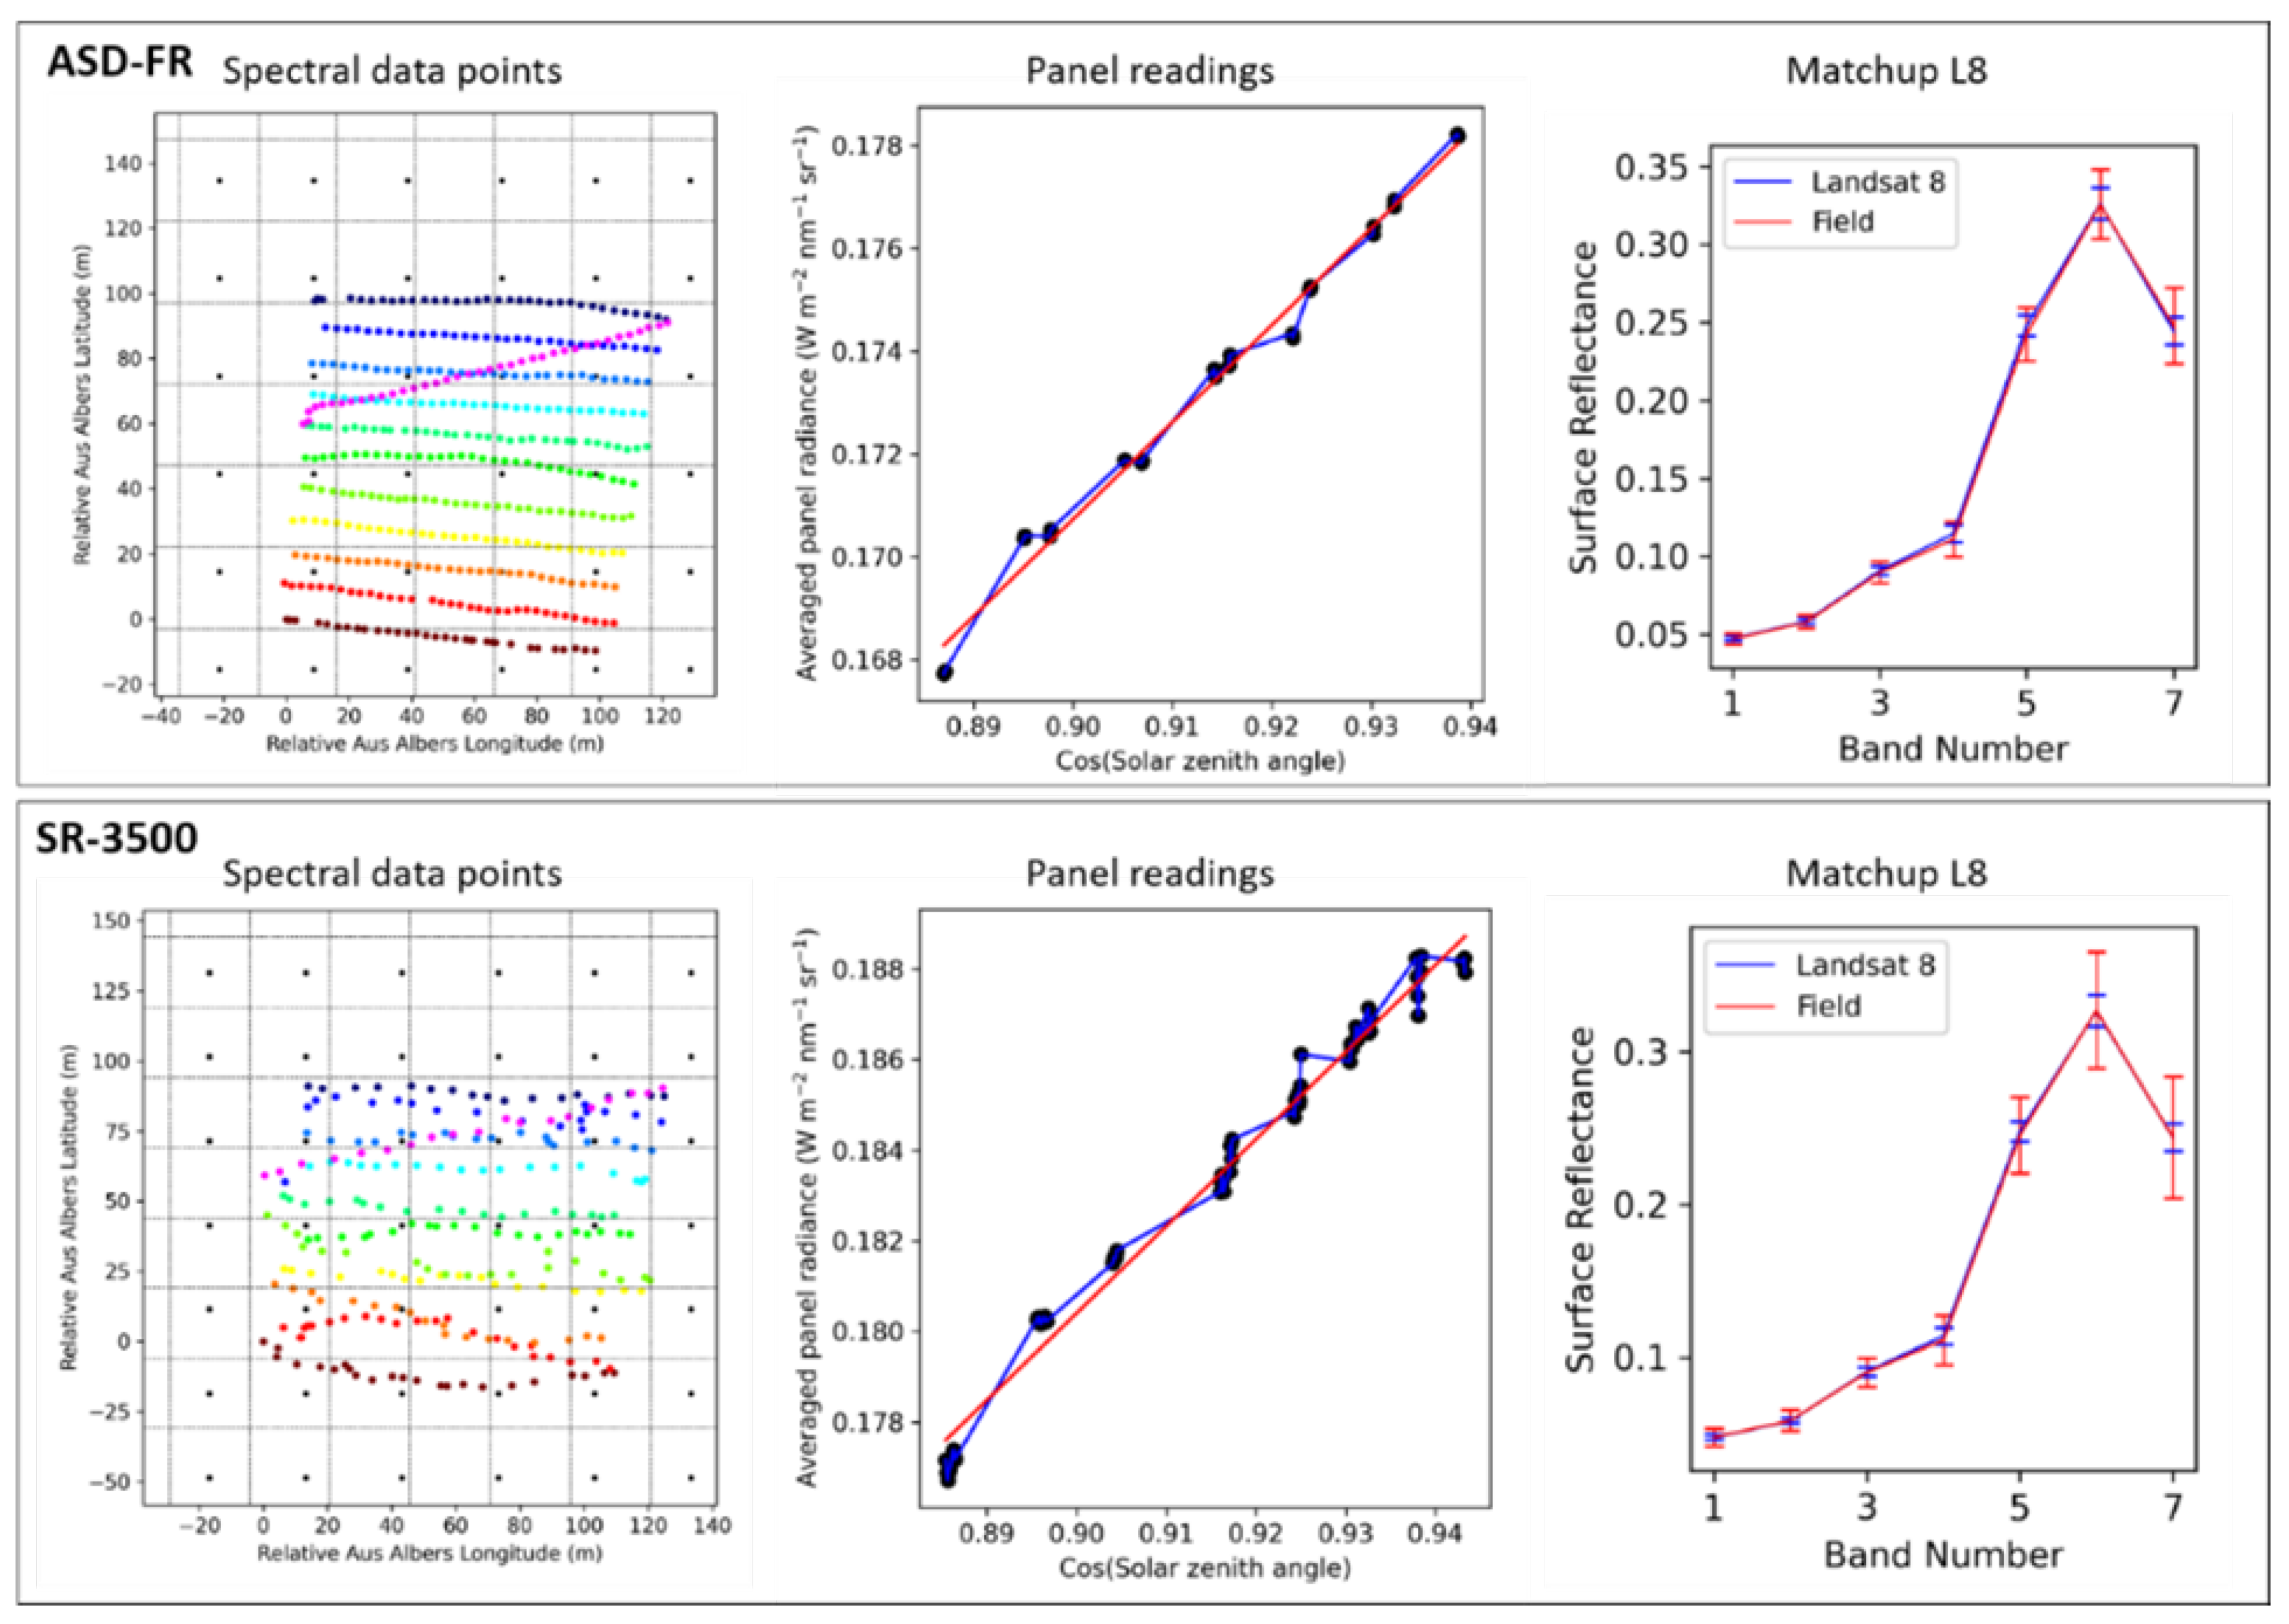
2.6. Field Spectrometers
2.7. Field Site Characterisation and Data Processing
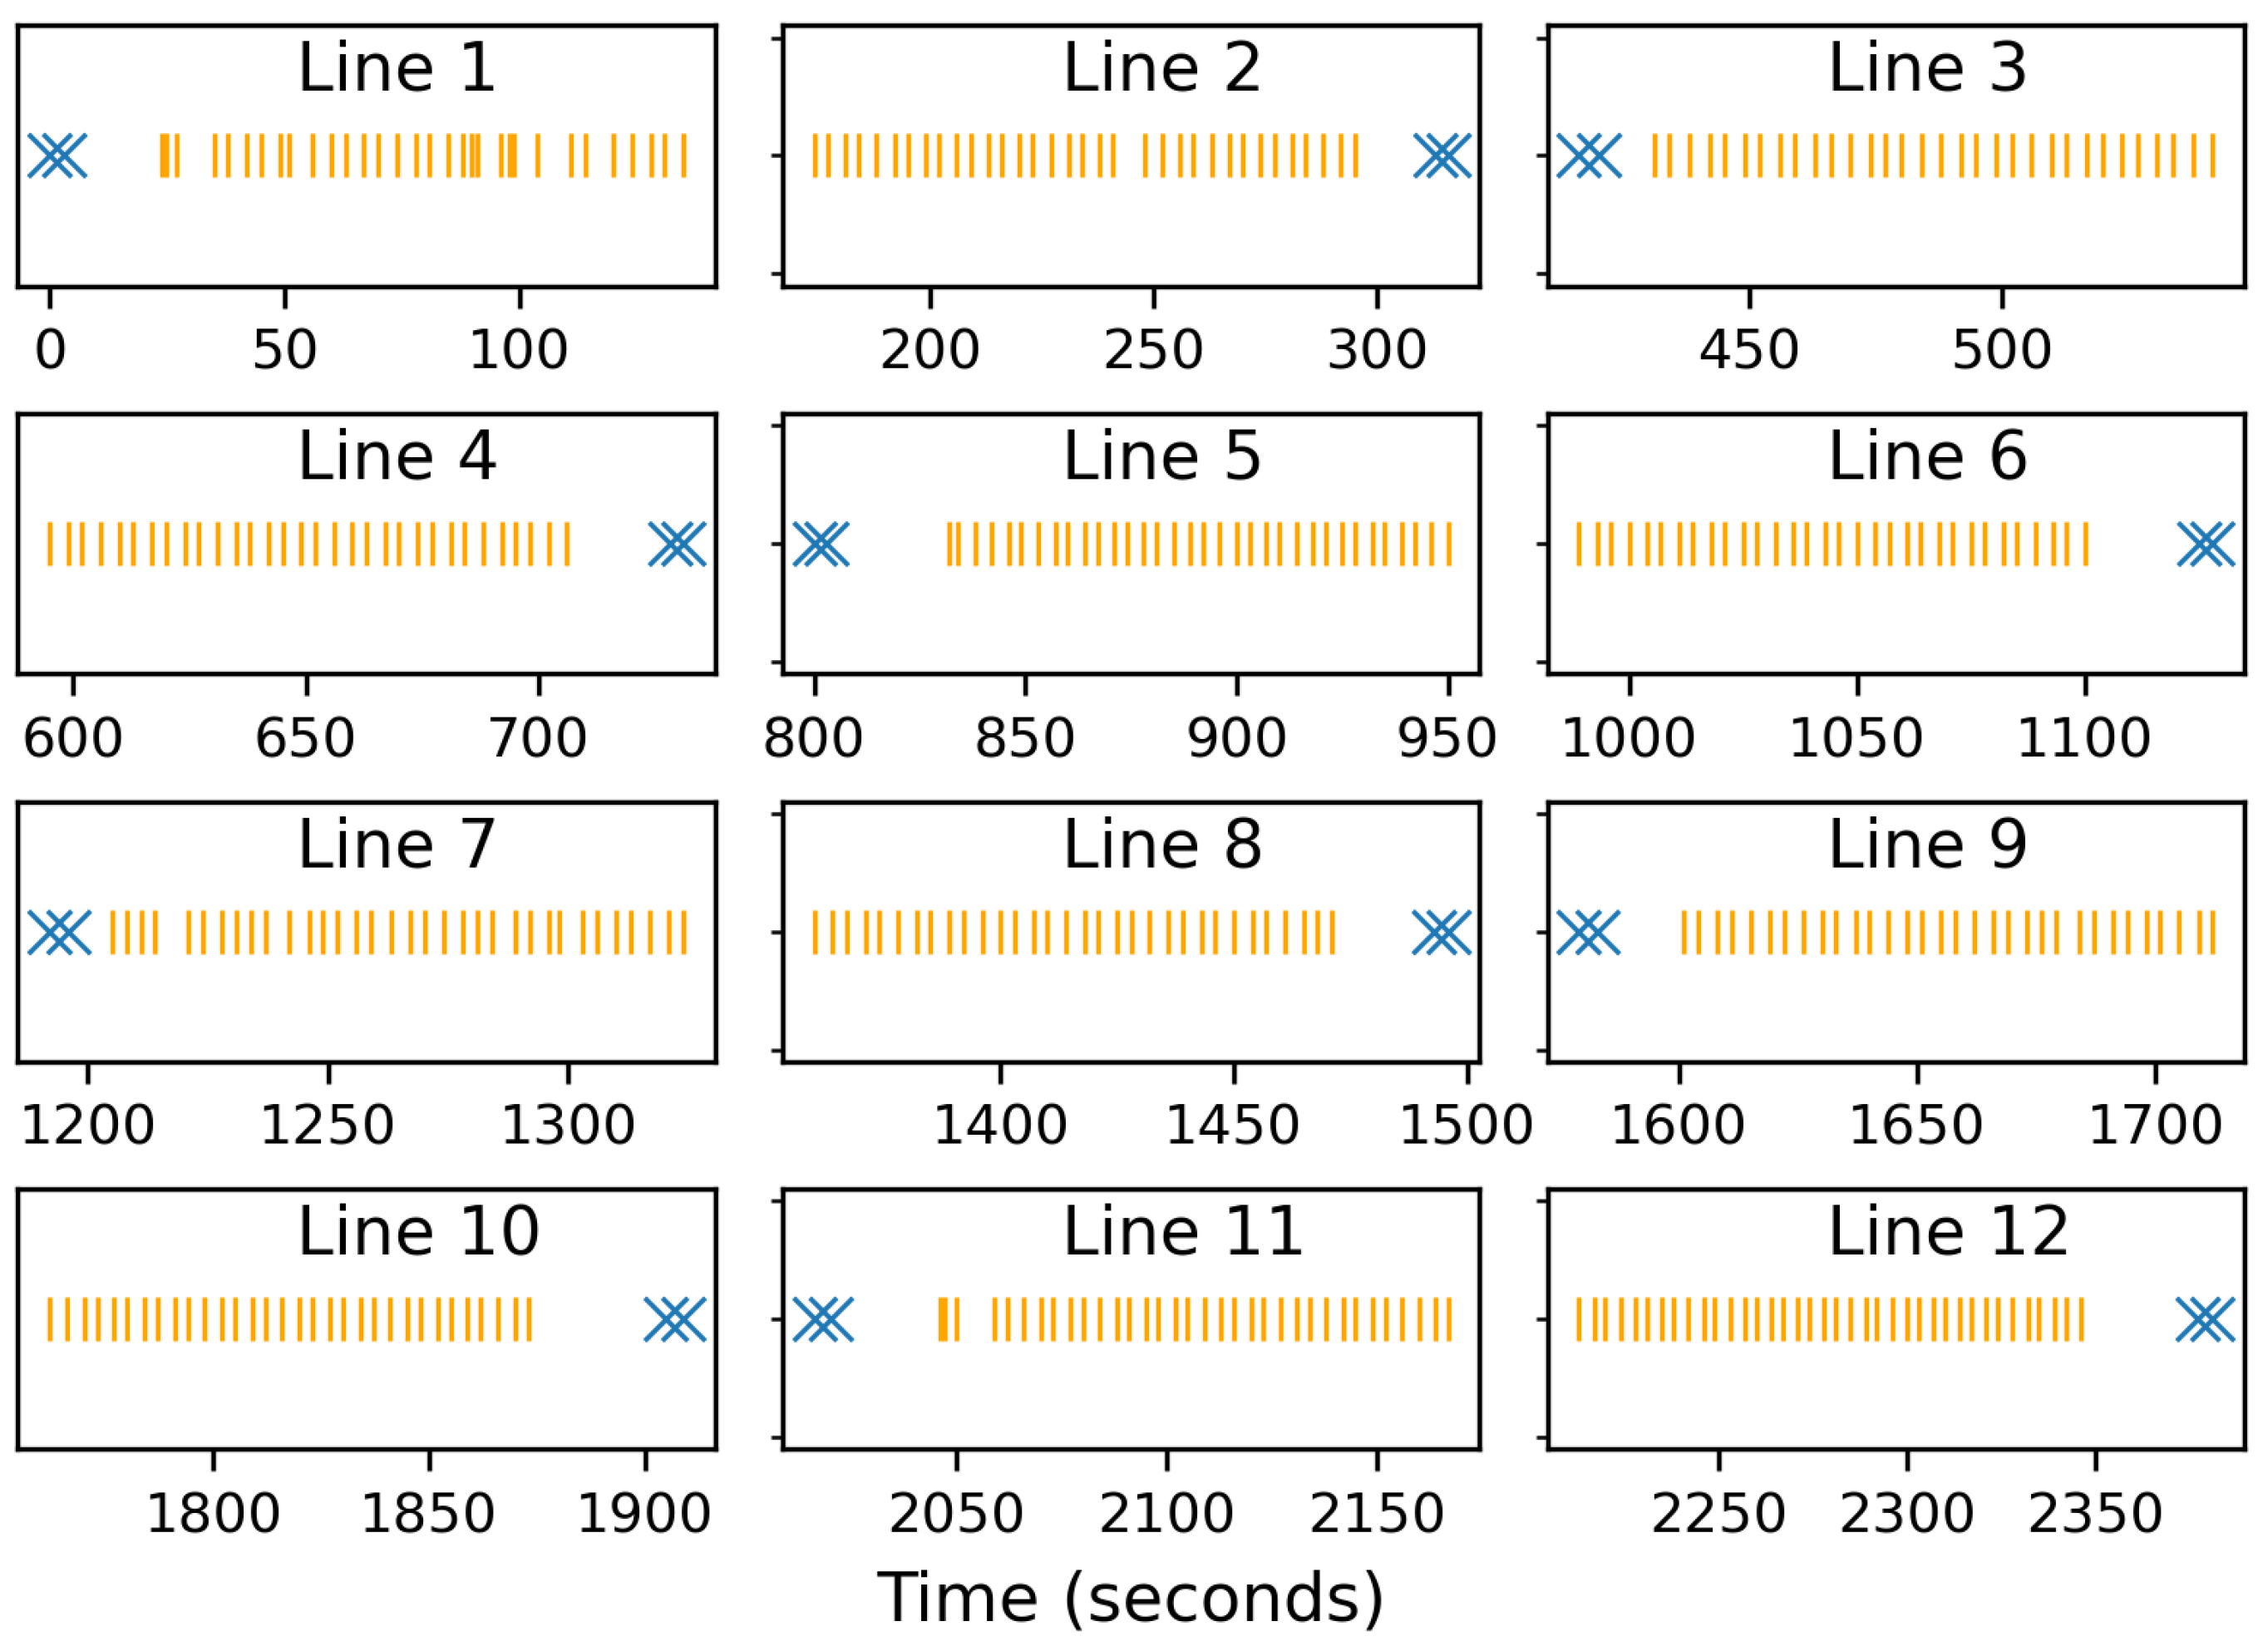
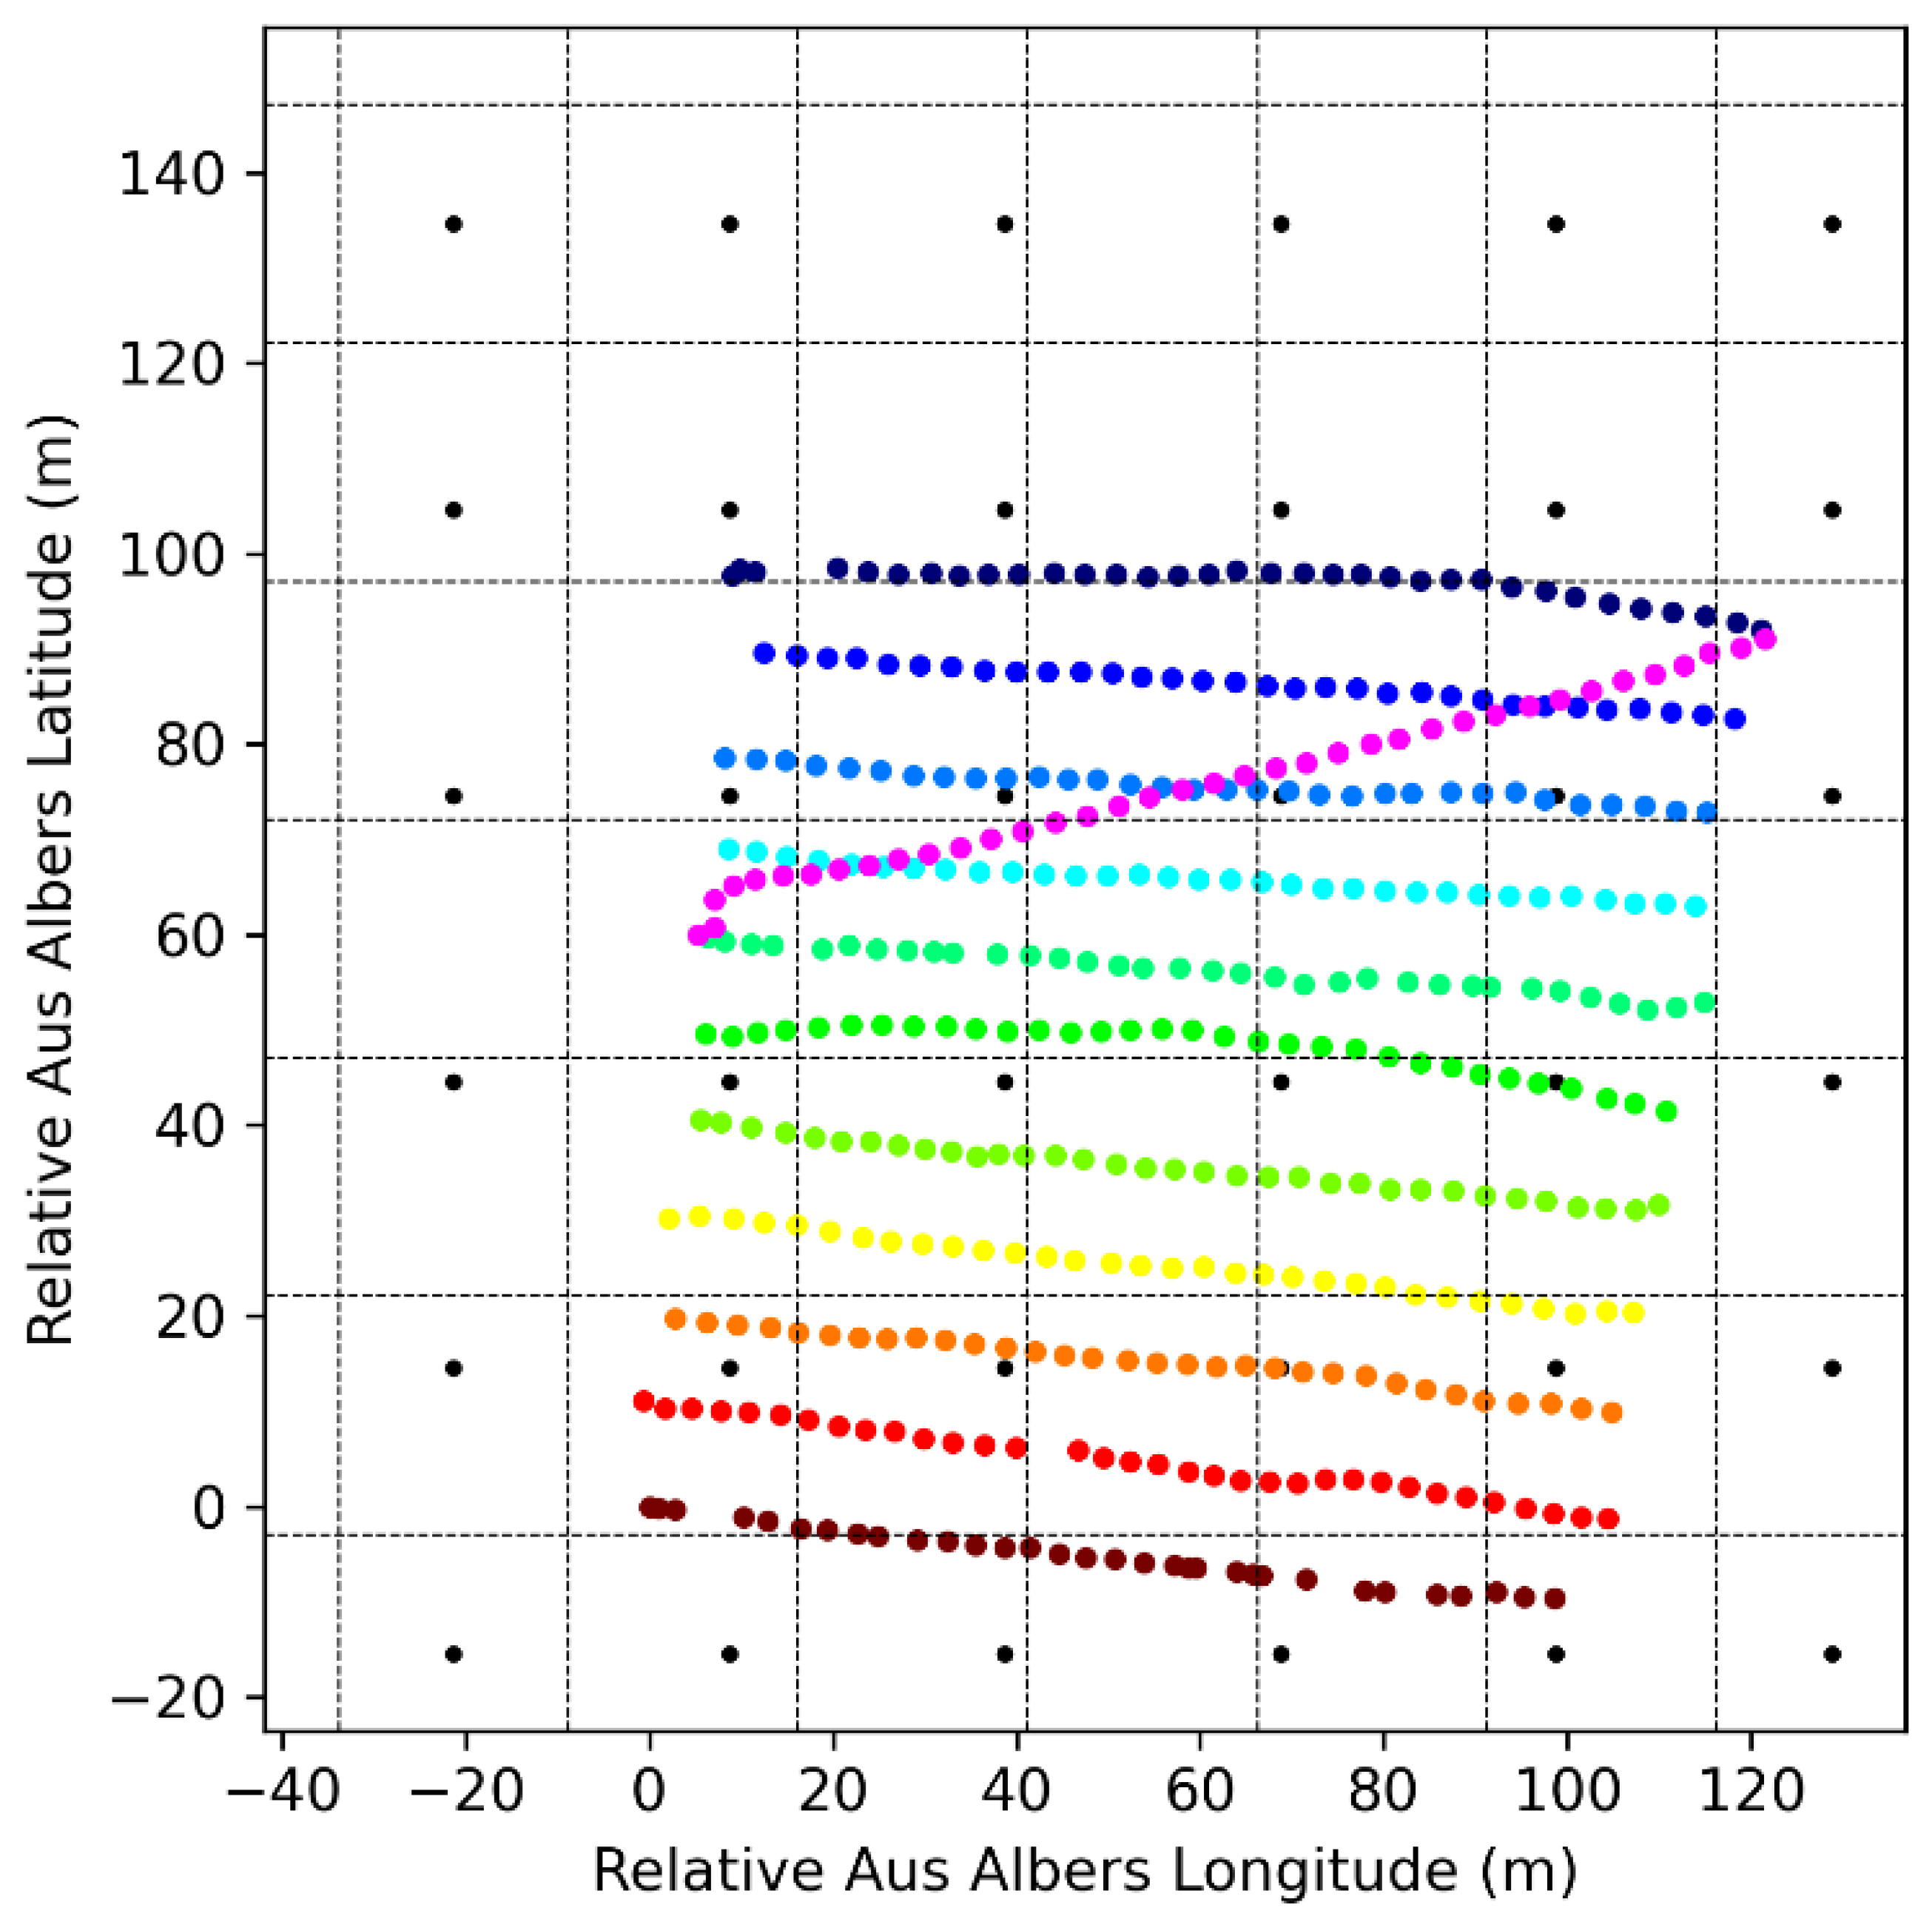
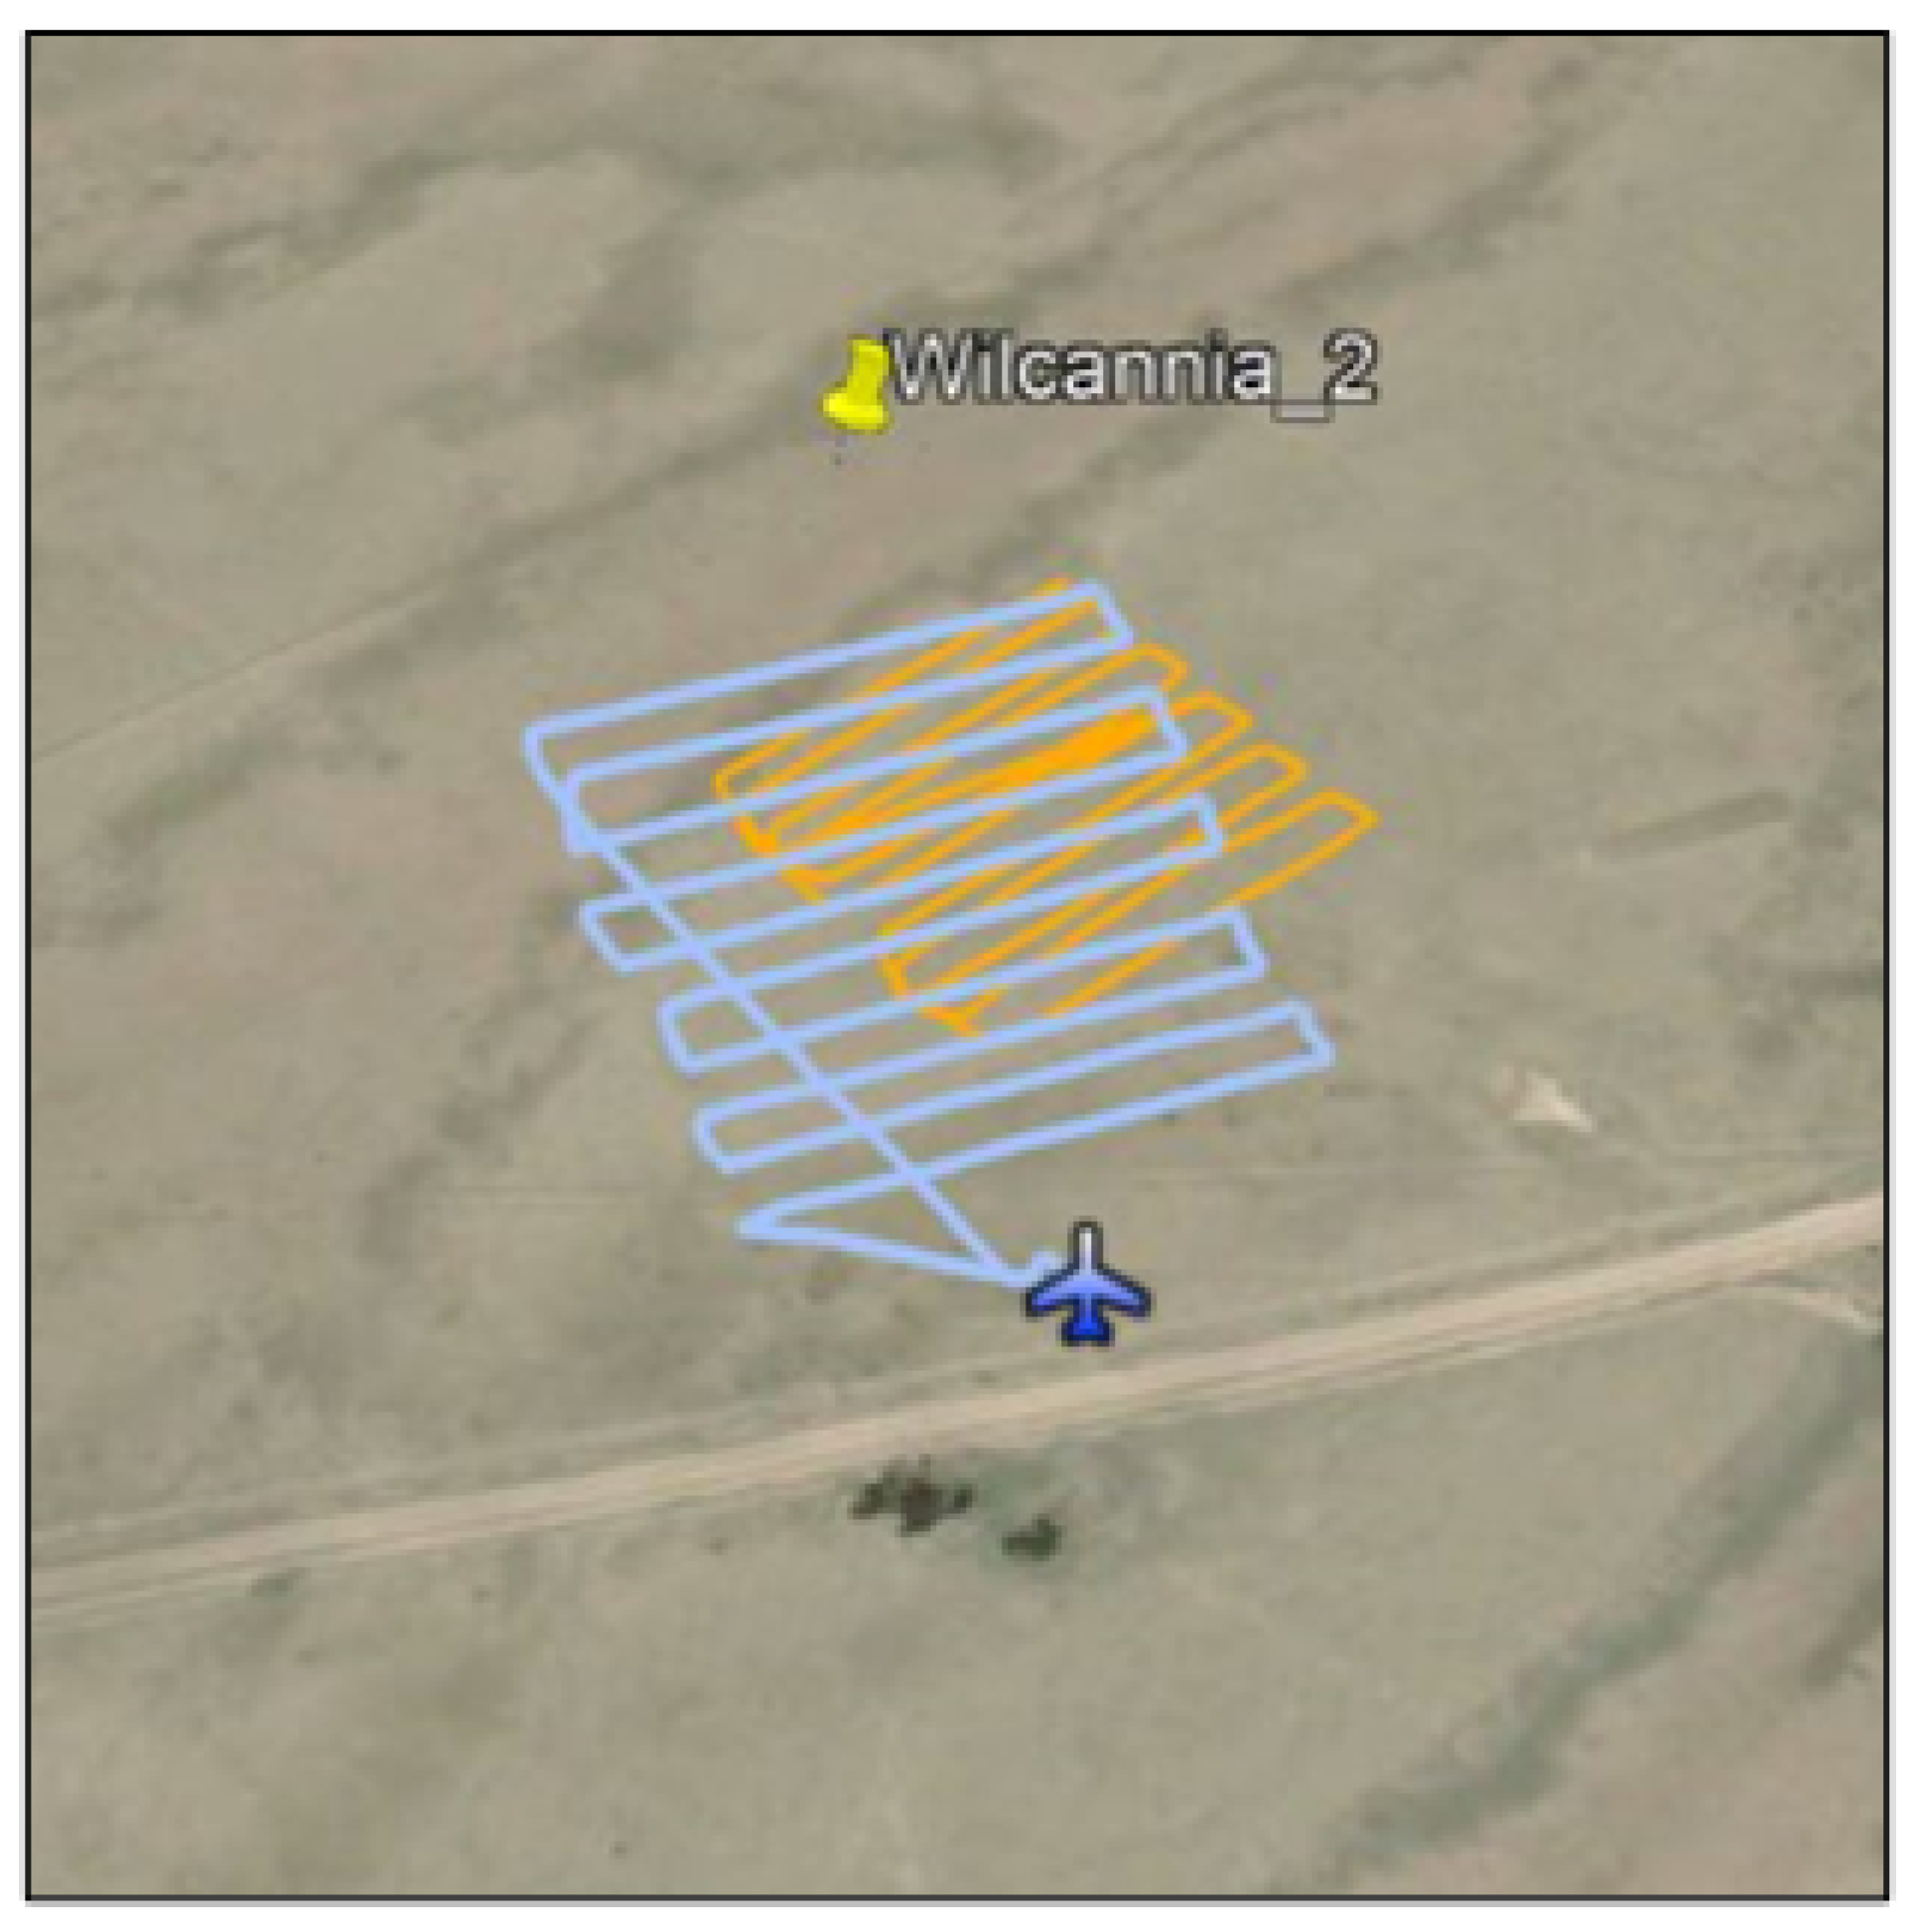
2.8. Unmanned Aerial Vehicle (UAV) Flight at Wilcannia
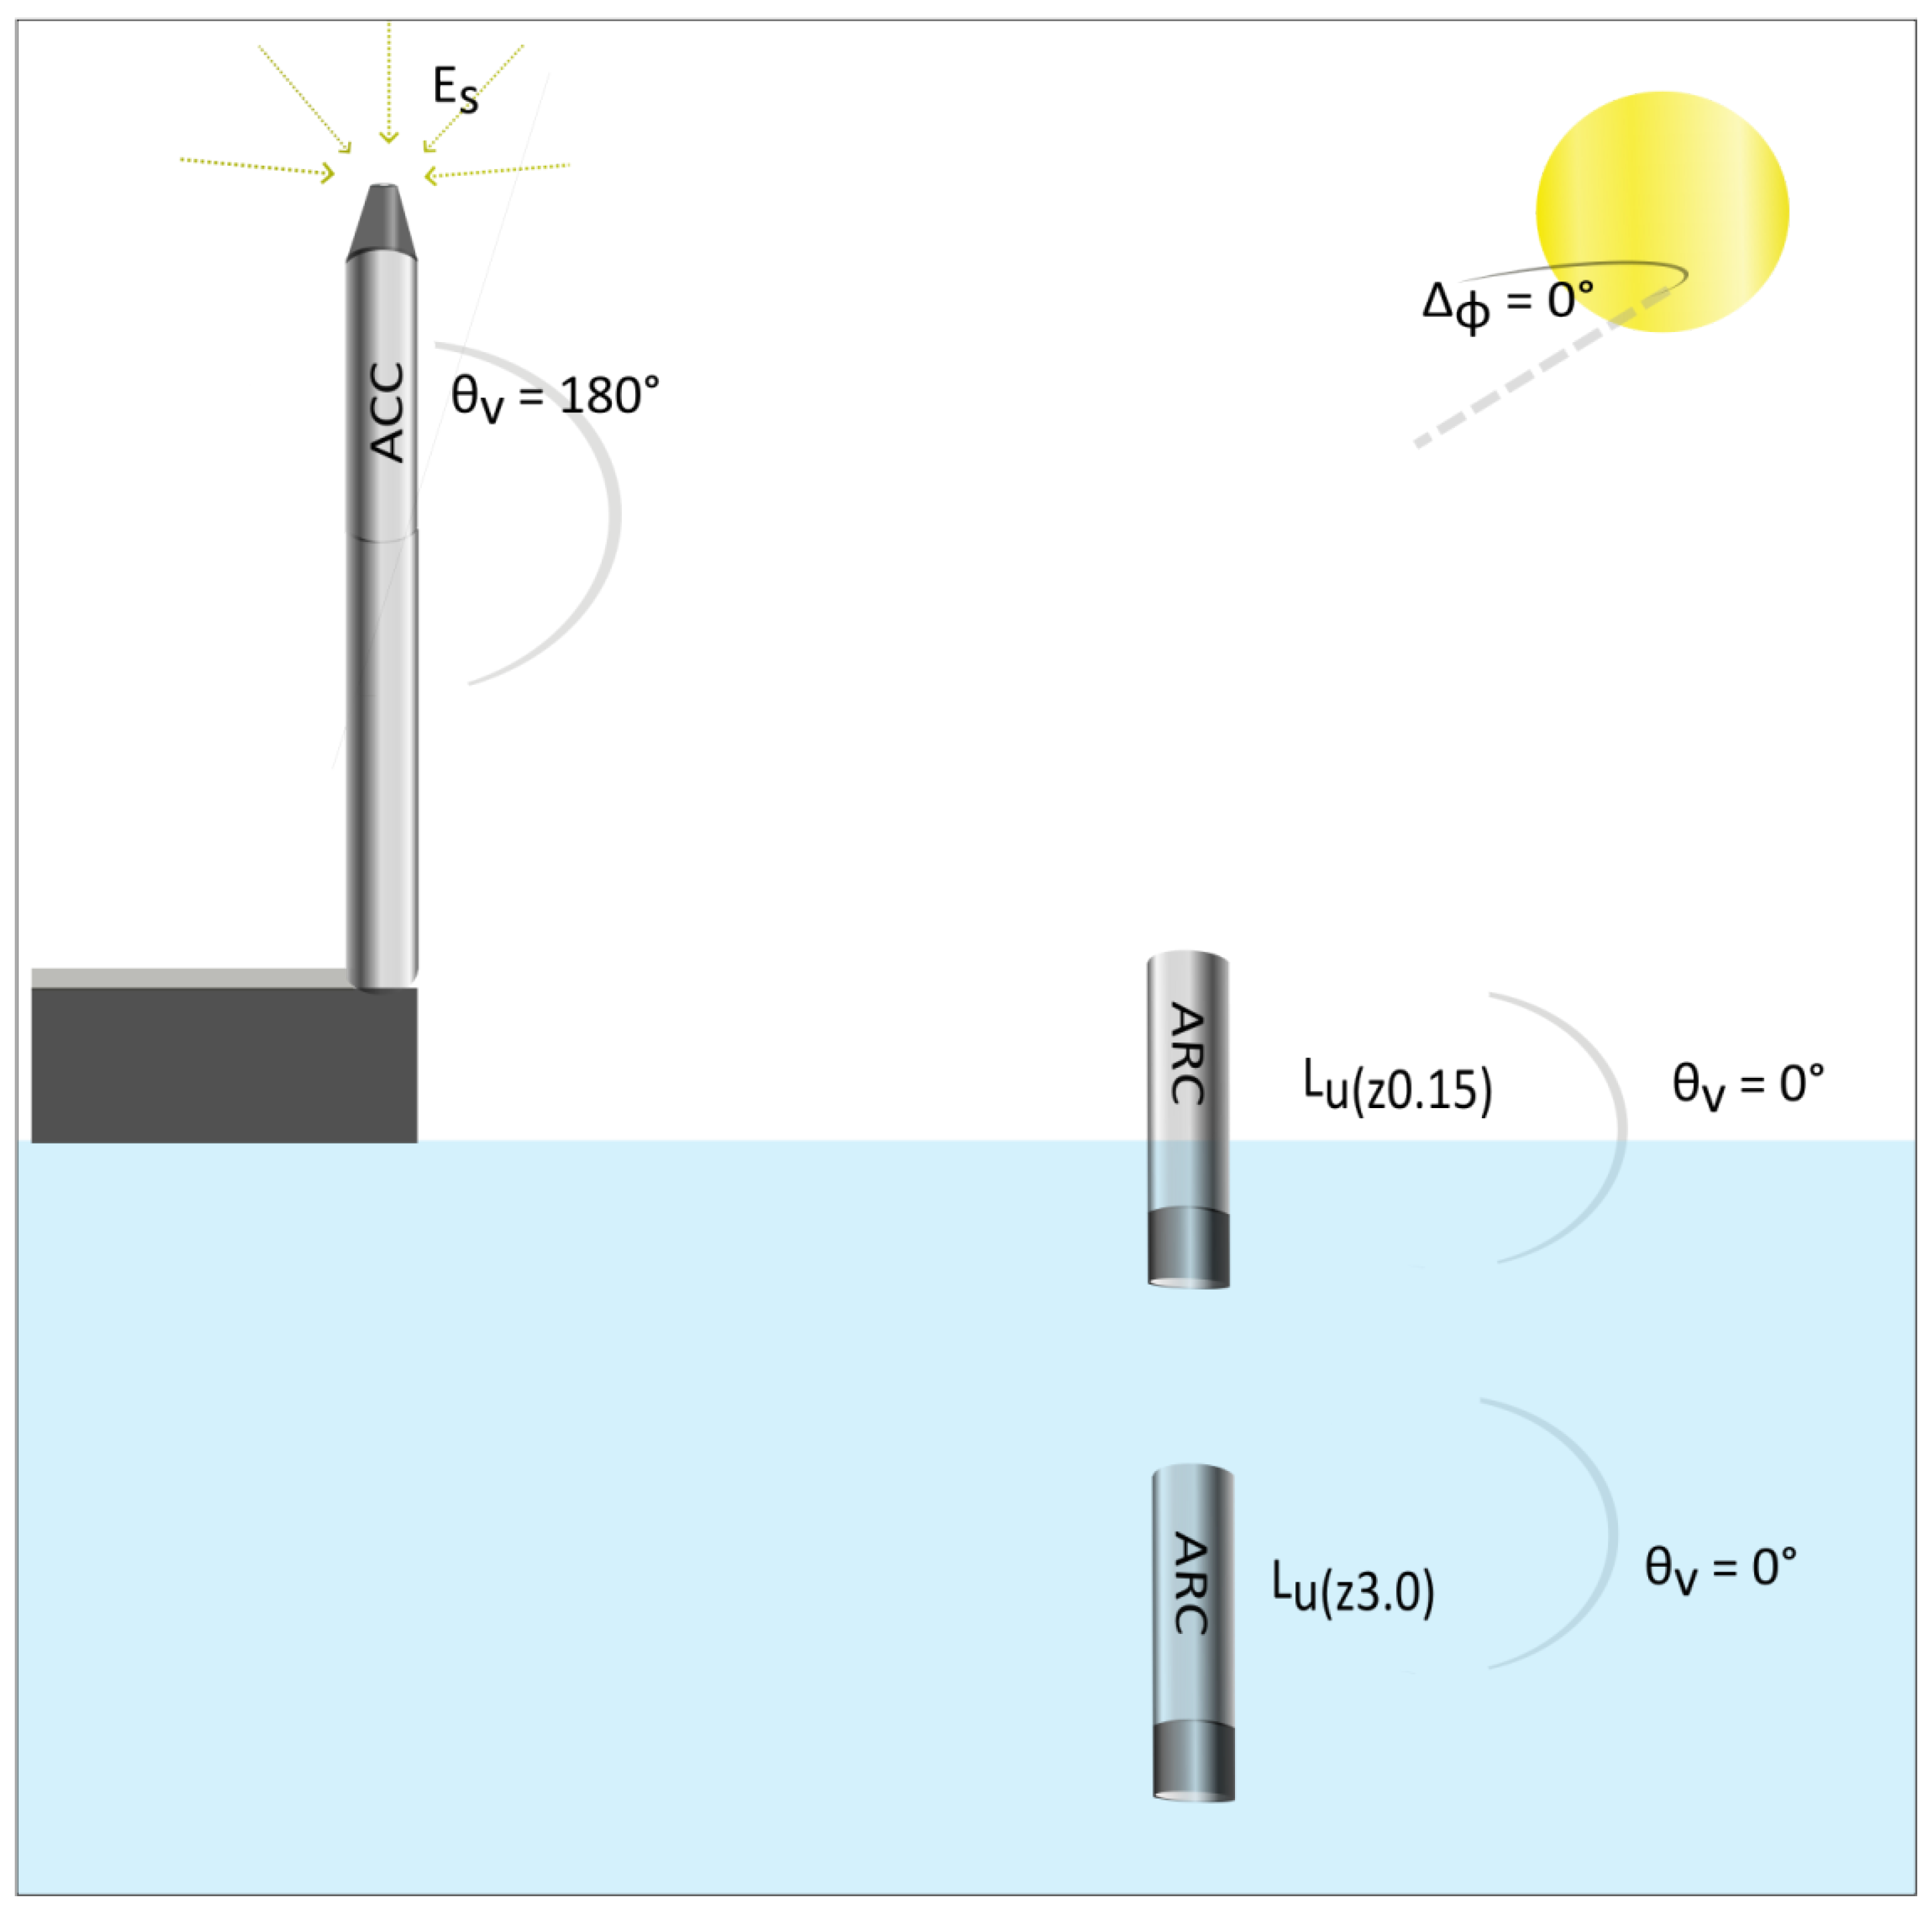
2.9. Aquatic Validation—Lake Hume
3. Results
3.1. Perth
3.2. Cunnamulla
3.3. Wilcannia
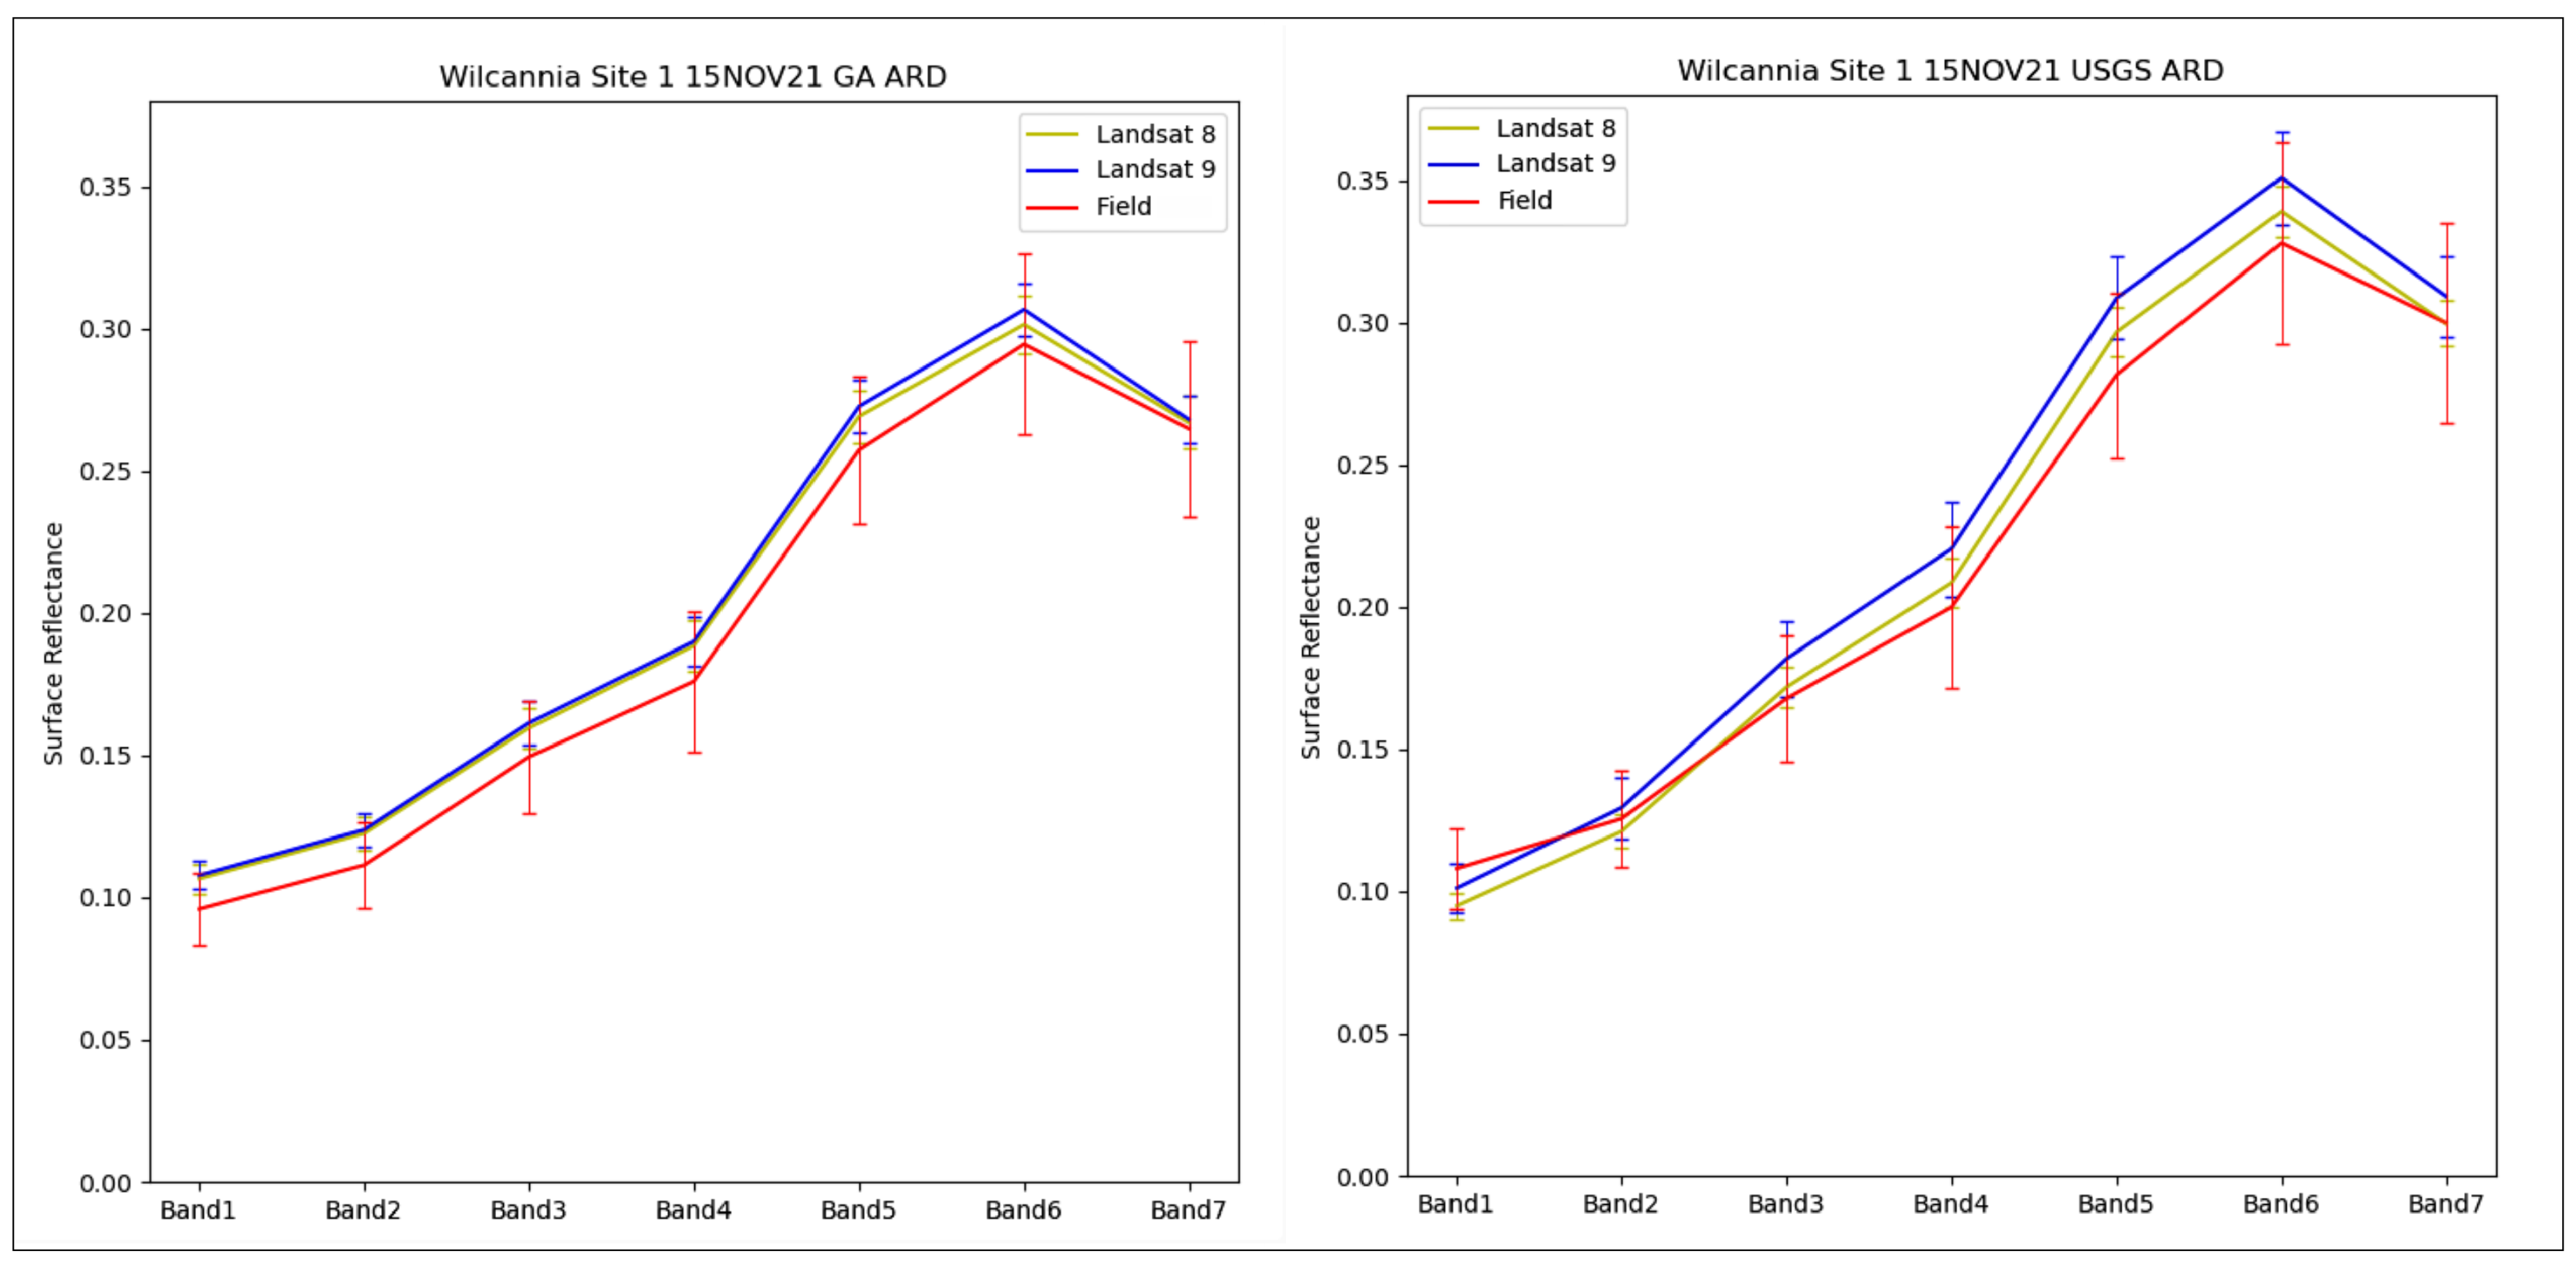
3.3.1. Wilcannia Site 1
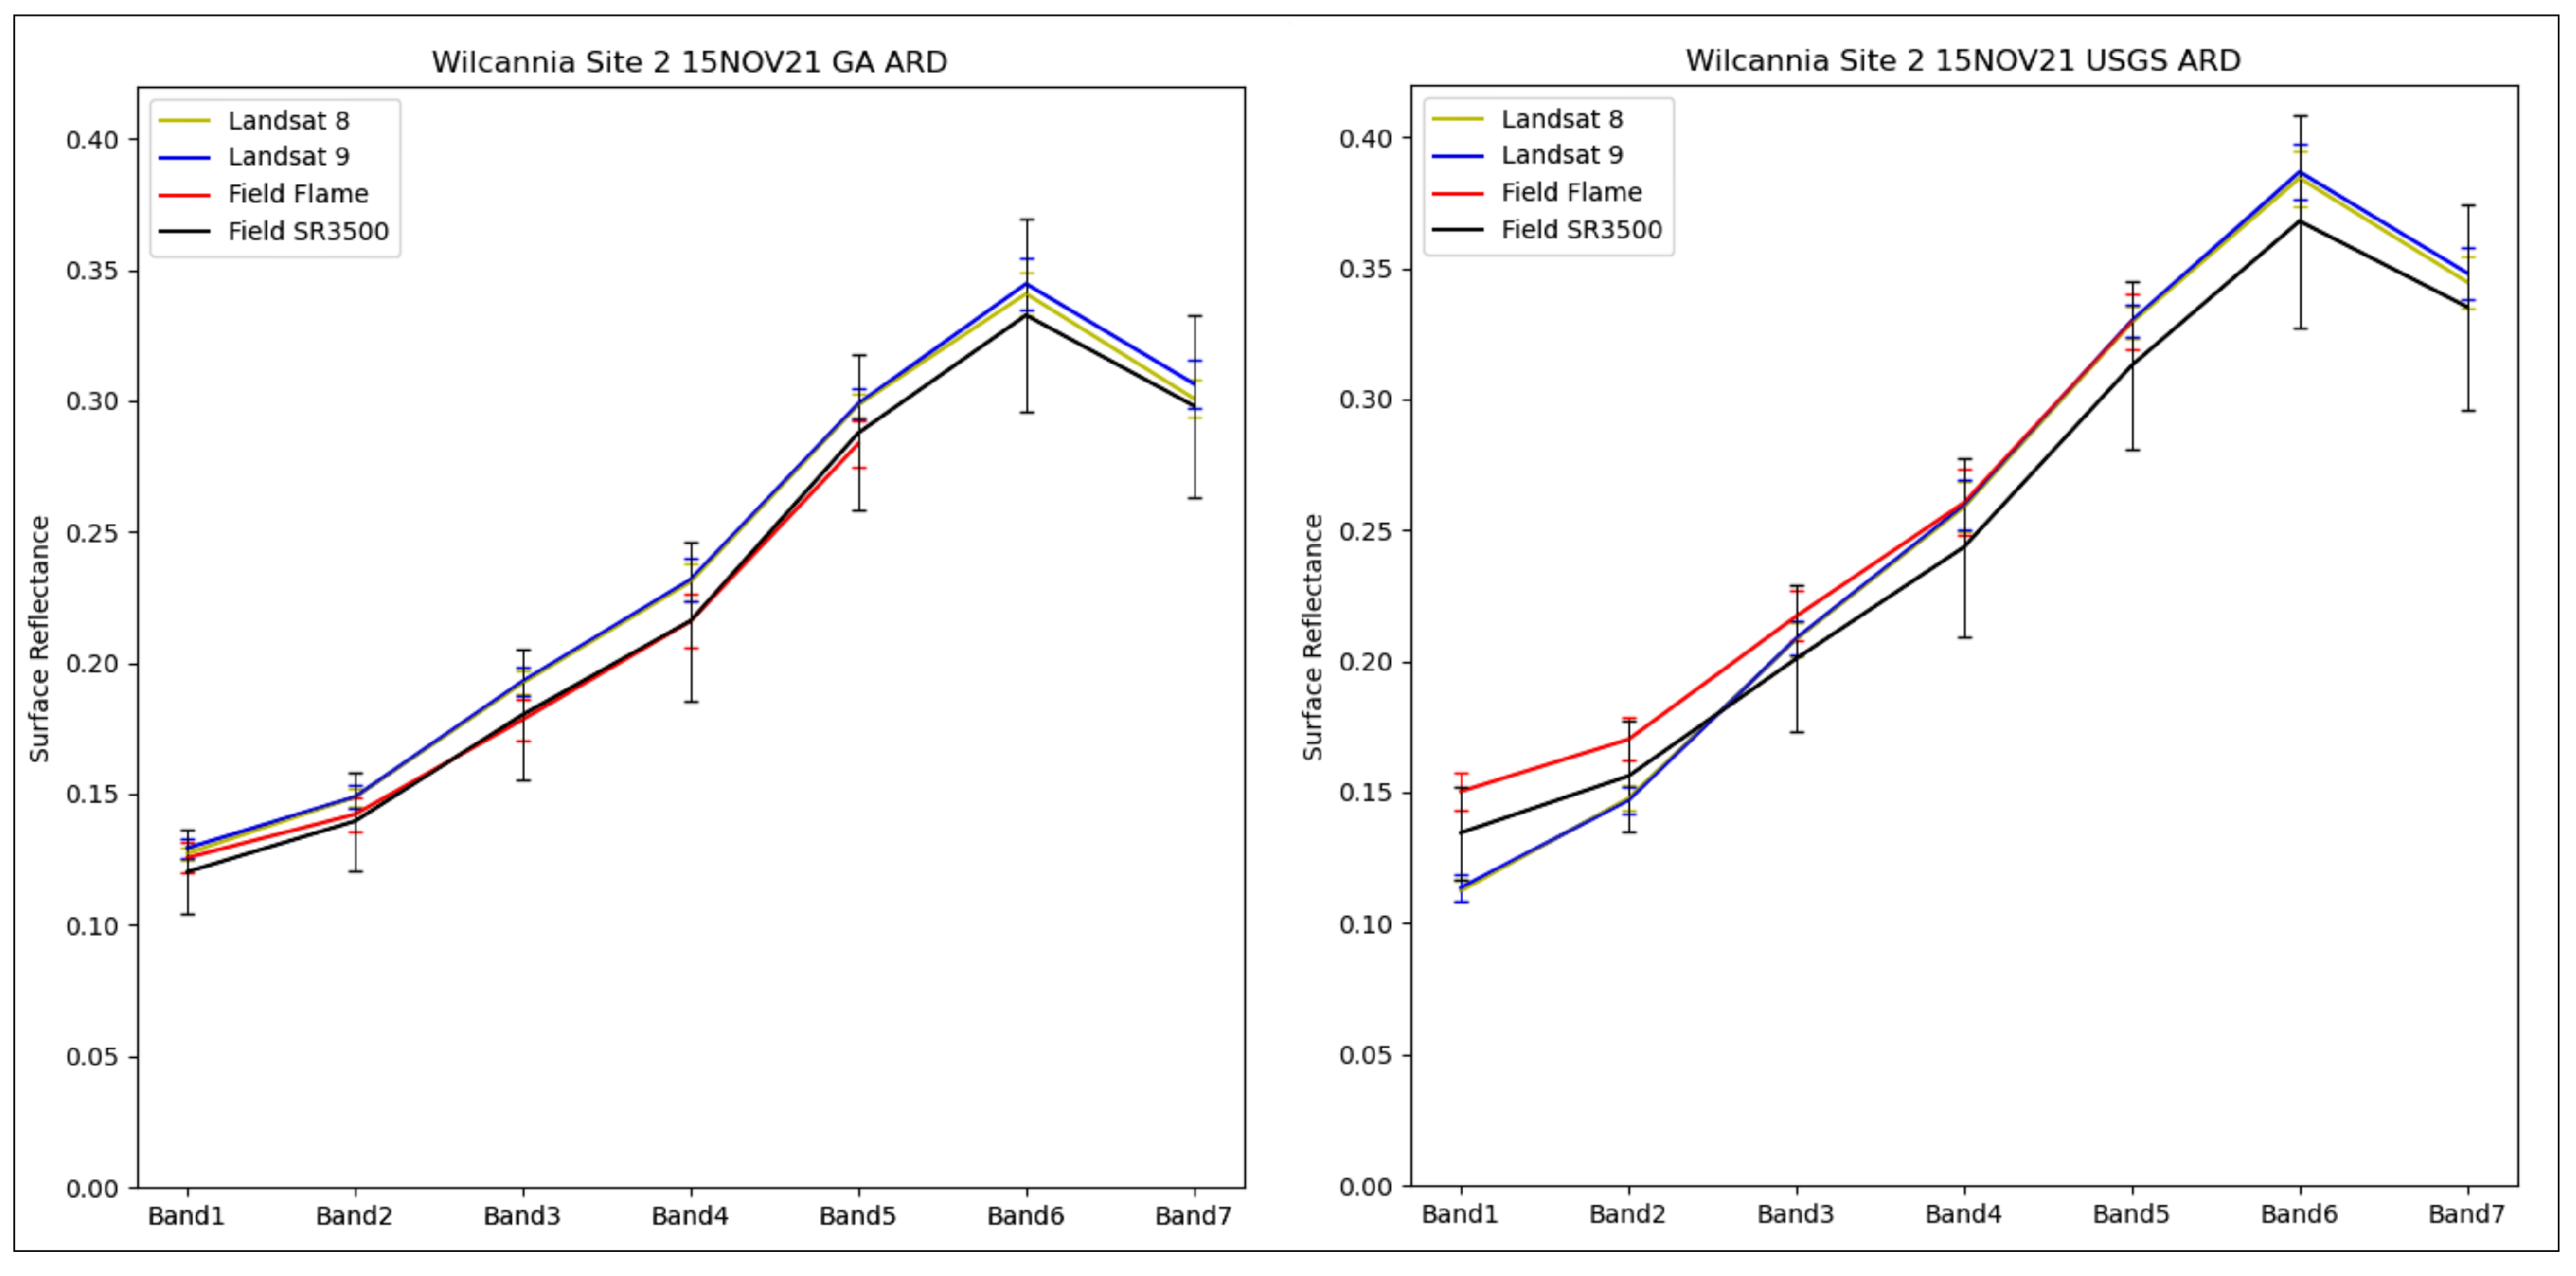
3.3.2. Wilcannia Site 2
3.4. Narromine
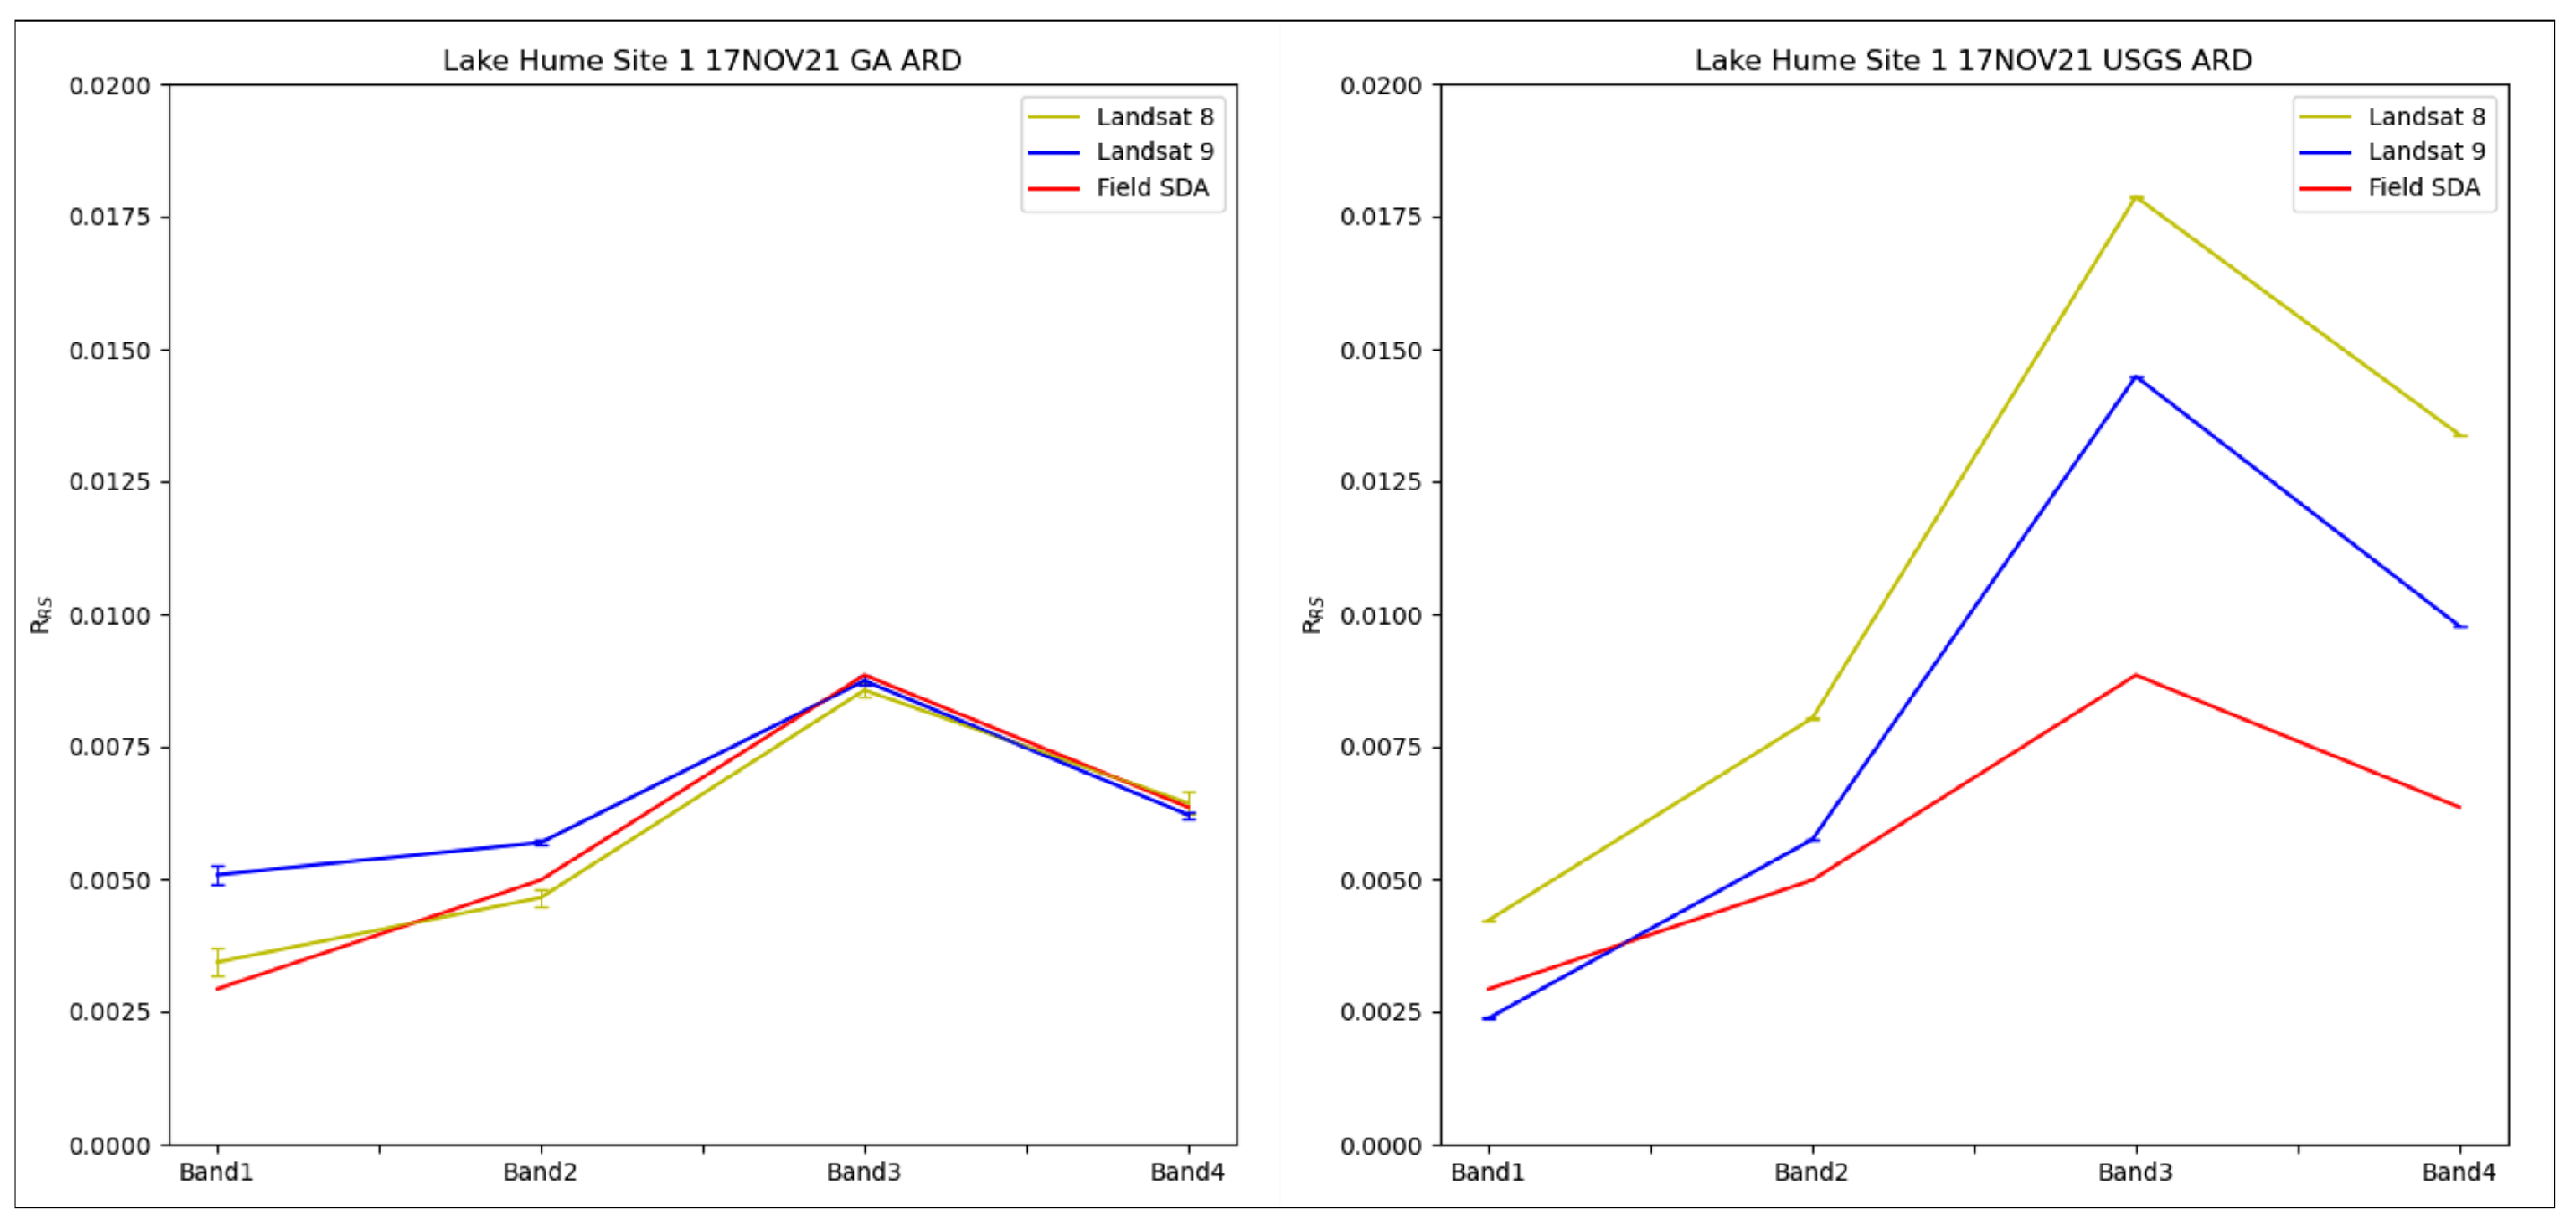
3.5. Lake Hume
3.6. Summary of Results
4. Conclusions
Author Contributions
Funding
Data Availability Statement
Acknowledgments
Conflicts of Interest
References
- Loew, A.; Bell, W.; Brocca, L.; Bulgin, C.E.; Burdanowitz, J.; Calbet, X.; Donner, R.V.; Ghent, D.; Gruber, A.; Kaminski, T.; et al. Validation Practices for Satellite-Based Earth Observation Data across Communities. Rev. Geophys. 2017, 55, 779–817. [Google Scholar] [CrossRef]
- A Quality Assurance Framework for Earth Observation: Implementation Strategy and Work Plan. Available online: https://www.qa4eo.org/docs/QA4EO_Principles_v4.0.pdf (accessed on 18 February 2024).
- A Guide to Comparisons—Organisation, Operation and Analysis to Establish Measurement Equivalence to Underpin the Quality Assurance Requirements of GEO. Available online: https://www.qa4eo.org/docs/QA4EO-QAEO-GEN-DQK-004_v4.0.pdf (accessed on 18 February 2024).
- Wulder, M.A.; Roy, D.P.; Radeloff, V.C.; Loveland, T.R.; Anderson, M.C.; Johnson, D.M.; Healey, S.; Zhu, Z.; Scambos, T.A.; Pahlevan, N.; et al. Fifty Years of Landsat Science and Impacts. Remote Sens. Environ. 2001, 280, 113195. [Google Scholar] [CrossRef]
- Lovel, T.; Dwyer, J. Landsat: Building a Strong Future. Remote Sens. Environ. 2012, 122, 22–29. [Google Scholar] [CrossRef]
- Lewis, A.; Oliver, S.; Lymburner, L.; Evans, B.; Wyborn, L.; Mueller, N.; Raevksi, G.; Hooke, J.; Woodcock, R.; Sixsmith, J.; et al. The Australian Geoscience Data Cube—Foundations and lessons learned. Remote Sens. Environ. 2017, 202, 276–292. [Google Scholar] [CrossRef]
- Kiata, E.; Markham, B.; Haque, M.O.; Dichmann, D.; Gerace, A.; Leigh, L.; Good, S.; Scmidt, M.; Crawford, C.J. Landsat 9 Cross-Calibration Under-Fly of Landsat 8: Planning and Execution. Remote Sens. 2022, 14, 5414. [Google Scholar] [CrossRef]
- Gross, G.; Helder, D.; Begeman, C.; Leigh, L.; Kaewmanee, M.; Shah, R. Initial Cross-Calibration of Landsat 8 and Landsat 9 Using the Simultaneous Underfly Event. Remote Sens. 2022, 14, 2418. [Google Scholar] [CrossRef]
- Holden, C.E.; Woodcock, C.E. An analysis of Landsat 7 and Landsat 8 underflight data and the implications for time series investigations. Remote Sens. Environ. 2016, 185, 16–36. [Google Scholar] [CrossRef]
- Flood, N. Continuity of Reflectance Data between Landsat-7 ETM+ and Landsat-8 OLI, for Both Top-of-Atmosphere and Surface Reflectance: A Study in the Australian Landscape. Remote Sens. 2014, 6, 7952–7970. [Google Scholar] [CrossRef]
- Li, F.; Jupp, D.; Reddy, S.; Lymburner, L.; Muller, N.; Tan, P.; Islam, A. An Evaluation of the Use of Atmospheric and BRDF Corrections to Standardize Landsat Data. IEEE J. Sel. Top. Appl. Earth Obs. Remote Sens. 2010, 3, 257–270. [Google Scholar] [CrossRef]
- Li, F.; Jupp, D.; Thankappan, M.; Lymburner, L.; Lewis, A.; Held, A. A physics-based atmospheric and BRDF correction for Landsat data over mountainous terrain. Remote Sens. Environ. 2012, 124, 756–770. [Google Scholar] [CrossRef]
- Li, F.; Jupp, D.; Thankappan, M. Using high resolution DSM data to correct the terrain illumination effect in Landsat data. In Proceedings of the 19th International Congress on Modelling and Simulation, Perth, WA, Australia, 12–16 December 2011. [Google Scholar]
- Li, F.; Jupp, D.; Schroeder, T.; Sagar, S.; Sixsmith, J.; Dorji, P. Assessing an Atmospheric Correction Algorithm for Time Series of Satellite-Based Water-Leaving Reflectance Using Match-Up Sites in Australian Coastal Waters. Remote Sens. 2021, 13, 1927. [Google Scholar] [CrossRef]
- Campbell, S.; Lovell, J.; Jupp, D.L.B.; Graetz, R.D.; Byrne, G. The Lake Frome field campaign in support of Hyperion instrument calibration and validation. In Proceedings of the IEEE 2001 International Geoscience and Remote Sensing Symposium, Sydney, NSW, Australia, 9–13 July 2001; pp. 2593–2595. [Google Scholar] [CrossRef]
- Doelling, D.; Helder, D.; Schott, J.; Stone, T.; Pinto, C. Vicarious Calibration and Validation. In Reference Module in Earth Systems and Environmental Sciences; Elsevier: Amsterdam, The Netherlands, 2017; pp. 475–518. [Google Scholar] [CrossRef]
- Hueni, A.; Damm, A.; Kneubuler, M.; Schlapfer, D.; Schaepman, M. Field Airborne Spectroscopy Cross Validation: Some Considerations. IEEE J. Sel. Top. Appl. Earth Obs. Remote Sens. 2017, 10, 1117–1135. [Google Scholar] [CrossRef]
- Teillet, P.M.; Barker, J.L.; Markham, B.L.; Irish, R.R.; Fedosejevs, G.; Storey, J.C. Radiometric cross-calibration of the Landsat-7 ETM+ and Landsat-5 TM sensors based on tandem data sets. Remote Sens. Environ. 2001, 78, 39–54. [Google Scholar] [CrossRef]
- Malthus, T.; Ong, C.; Lau, I.; Fearns, P.; Byrne, G.; Thankappan, M.; Chisholm, L. A Community Approach to Standardised Validation of Surface Reflectance Data; CSIRO: Canberra, ACT, Australia, 2019. [Google Scholar]
- Milton, E.; Schaepman, M.; Anderson, K.; Kneubuhler, M.; Fox, N. Progress in Field Spectroscopy. Remote Sens. Environ. 2009, 113, 92–109. [Google Scholar] [CrossRef]
- Schaepman-Strub, G.; Schaepman, M.; Painter, T.; Dangel, S.; Martonchik, J. Reflectance quantities in optical remote sensing–definitions and case studies. Remote Sens. Environ. 2006, 103, 27–42. [Google Scholar] [CrossRef]
- Anderson, J.; Dugan, K.; MacArthur, A. On the Reproducibility of Field-Measured Reflectance Factors in the Context of Vegetation Studies. Remote Sens. Environ. 2011, 115, 1893–1905. [Google Scholar] [CrossRef]
- Helder, D.; Thome, K.; Aaron, D.; Leigh, L.; Czapla-Myers, J.; Leisso, N.; Biggar, S.; Anderson, N. Recent Surface Reflectance Measurement Campaigns with Emphasis on Best Practices, SI Traceability and Uncertainty Estimation. Metrologia 2021, 49, S21–S28. [Google Scholar] [CrossRef]
- Earth Observation from Space Roadmap 2021–2030. Available online: https://www.industry.gov.au/publications/earth-observation-space-roadmap-2021-2030 (accessed on 1 April 2023).
- Working Group on Calibration & Validation. Available online: https://www.ceos.org/ourwork/workinggroups/wgcv/ (accessed on 12 February 2023).
- Harrison, B.A.; Jupp, D.L.B.; Lewis, M.M.; Forster, B.C.; Coppa, I.; Mueller, N.; Hudson, D.; Phinn, S.; Smith, C.; Anstee, J.; et al. Earth Observation: Data, Processing and Applications, Volume 1B: Data—Image Interpretation; CRCSI: Melbourne, VIC, Australia, 2017. [Google Scholar]
- Harrison, B.A.; Anstee, J.M.; Dekker, A.G.; King, E.A.; Griffin, D.A.; Mueller, N.; Phinn, S.R.; Kovacs, E.; Byrne, G. Earth Observation: Data, Processing and Applications. Volume 3B: Applications—Surface Waters; CRCSI: Melbourne, VIC, Australia, 2020. [Google Scholar]
- Pahlevan, N.; Schott, J.; Franz, B.; Zibordi, G.; Markham, B.; Bailey, S.; Schaaf, C.; Ondrusek, M.; Greb, S.; Strait, C. Landsat 8 Remote Sensing Reflectance (Rrs) Products: Evaluations, Intercomparisons, and Enhancements. Remote Sens. Environ. 2017, 190, 289–301. [Google Scholar] [CrossRef]
- Dekker, A.G.; Brando, V.E.; Anstee, J.M.; Pinnel, N.; Kutser, T.; Hoogenboom, E.J.; Peters, S.; Pasterkamp, R.; Vos, R.; Olbert, C.; et al. Imaging Spectrometry of Water. In Imaging Spectrometry; van der Meer, F.D., De Jong, S.M., Eds.; Springer: Dordrecht, The Netherlands, 2002; pp. 307–359. [Google Scholar] [CrossRef]
- Zibordi, G.; Talone, M. On the equivalence of near-surface methods to determine the water-leaving radiance. Opt. Express 2020, 28, 3200–3214. [Google Scholar] [CrossRef]
- Brando, V.; Lovell, J.; King, E.; Boadle, D.; Scott, R.; Schroeder, T. The Potential of Autonomous Ship-Borne Hyperspectral Radiometers for the Validation of Ocean Color Radiometry Data. Remote Sens. 2016, 8, 150. [Google Scholar] [CrossRef]
- Vermote, E.; Justice, C.; Claverie, M.; Franch, B. Preliminary analysis of the performance of the Landsat 8/OLI land surface reflectance product. Remote Sens. Environ. 2016, 185, 46–56. [Google Scholar] [CrossRef] [PubMed]
- Franz, B.A.; Bailey, S.W.; Kuring, N.; Werdell, P.J. Ocean color measurements with the Operational Land Imager on Landsat-8: Implementation and evaluation in SeaDAS. J. Appl. Remote Sens. 2015, 9, 096070. [Google Scholar] [CrossRef]
- Barry, P.; Jarecke, P.; Pearlman, J.; Jupp, D.; Lovell, J.; Campbell, S. Radiometric Calibration Validation of the Hyperion Instrument Using Ground Truth at a Site in Lake Frome, Australia. In Proceedings of the International Symposium on Optical Science and Technology, San Diego, CA, USA, 9 July–3 August 2001. [Google Scholar] [CrossRef]
- Byrne, G.; Walsh, G.; Thankappan, A.; Broomhall, M.; Hay, M.E. DEA Analysis Ready Data Phase 1 Validation Project: Data Summary; Geoscience Australia: Canberra, ACT, Australia, 2021. [Google Scholar] [CrossRef]
- Walsh, A.; Byrne, G.; Broomhall, M. A case Study of Measurement Uncertainty in Field Spectroscopy. IEEE J. Sel. Top. Appl. Earth Obs. Remote Sens. 2022, 15, 6248–6258. [Google Scholar] [CrossRef]
- ASD FieldSpec 4 Standard-Res Spectroradiometer. Available online: https://www.malvernpanalytical.com/en/products/product-range/asd-range/fieldspec-range/fieldspec-4-standard-res-spectroradiometer (accessed on 5 January 2023).
- SR3500 Full Range Spectroradiometer. Available online: https://www.spectralevolution.com/products/hardware/compact-lab-spectroradiometers/SR3500/ (accessed on 5 January 2023).
- MacArthur, A.; MacLellan, C.; Malthus, T. The Fields of View and Directional Response Functions of Two Field Spectroradiometers. IEEE Trans. Geosci. Remote Sens. 2012, 50, 3892–3907. [Google Scholar] [CrossRef]
- Hueni, A.; Bialek, A. Cause, Effect, and Correction of Field Spectroradiometer Interchannel Radiometric Steps. IEEE J. Sel. Top. Appl. Earth Obs. Remote Sens. 2017, 10, 1542–1551. [Google Scholar] [CrossRef]
- Flame Series General Purpose Spectrometers. Available online: https://www.oceaninsight.com/blog/flame-series-general-purpose-spectrometers/ (accessed on 7 September 2023).
- Hueni, A.; Chisholm, L.; Ong, C.; Malthus, T.; Wyatt, M.; Trim, S.; Schaepman, M.; Thankappan, M. The SPECCHIO Spectral Information System. IEEE J. Sel. Top. Appl. Earth Obs. Remote Sens. 2020, 13, 5789–5799. [Google Scholar] [CrossRef]
- Jupp, D.; Li, F.; Byrne, G.; Ong, C.; Lau, I.; Malthus, T.; Thankappan, M.; Fearns, P. Using Irr_Inv, Modtran and Spectral Irradiance Data to Estimate Atmospheric Parameters. In CSIRO Land and Water Technical Report EP2022-3491; CSIRO: Canberra, ACT, Australia, 2022; 124p. [Google Scholar] [CrossRef]
- Roy, D.; Zhang, H.; Ju, J.; Gomez-Dans, J.; Lewis, P.; Schaaf, C.; Sun, Q.; Kovalskyy, V. A general method to normalize Landsat reflectance data to Nadir BRDF-Adjusted Reflectance. Remote Sens. Environ. 2016, 176, 255–271. [Google Scholar] [CrossRef]
- Ruddick, K.; Voss, K.; Boss, E.; Castagna, A.; Frouin, R.; Gilerson, A.; Heironymi, M.; Johnson, B.C.; Kuusk, J.; Lee, Z.; et al. Review of Protocols for Fiducial Reference Measurements of Water-Leaving Radiance for Validation of Satellite Remote-Sensing Data over Water. Remote Sens. 2019, 11, 2198. [Google Scholar] [CrossRef]
- Voss, K.; Flora, S. Spectral dependance of the seawater-air radiance transmission coefficient. J. Atmos. Ocean. Technol. 2017, 34, 1203–1205. [Google Scholar] [CrossRef]
- Quan, X.; Fry, S. Empirical equation for the index of refraction of seawater. Appl. Opt. 1995, 34, 3477–3480. [Google Scholar] [CrossRef]
- Shang, Z.; Lee, Z.; Dong, Q.; Wei, J. Self-shading associated with skylight-blocked approach system for the measurement of water-leaving radiance and its correction. Appl. Opt. 2017, 56, 7033–7044. [Google Scholar] [CrossRef]
- Jupp, D.; (CSIRO, Canberra, ACT, Australia). Personal communication, 2023.
- Aasen, H.; Bolten, A. Multi-Temporal High-Resolution Imaging Spectroscopy with Hyperspectral 2D Imagers—From Theory to Application. Remote Sens. Environ. 2018, 205, 374–389. [Google Scholar] [CrossRef]
- Aasen, H.; Honkavaara, E.; Lucieer, A.; Zarco-Tejada, P. Quantitative Remote Sensing at Ultra-High Resolution with UAV Spectroscopy: A Review of Sensor Technology, Measurement Procedures, and Data Correction Workflows. Remote Sens. 2018, 10, 1091. [Google Scholar] [CrossRef]
- Turner, D.; Malenovsky, Z.; Lucieer, A.; Turnbull, J.; Robinson, S. Optimizing Spectral and Spatial Resolutions of Unmanned Aerial System Imaging Sensors for Monitoring Antarctic Vegetation. IEEE J. Sel. Top. Appl. Earth Obs. Remote Sens. 2019, 12, 3813–3825. [Google Scholar] [CrossRef]
- Gautam, D.; Lucieer, A.; Bendig, J.; Malenovsky, Z. Footprint Determination of a Spectroradiometer Mounted on an Unmanned Aircraft System. IEEE Trans. Geosci. Remote Sens. 2020, 58, 3085–3096. [Google Scholar] [CrossRef]
- Tmušić, G.; Manfreda, S.; Aasen, H.; James, M.R.; Gonçalves, G.; Ben-Dor, E.; Brook, A.; Polinova, M.; Arranz, J.J.; Mészáros, J.; et al. Current Practices in UAV-Based Environmental Monitoring. Remote Sens. 2020, 12, 1001. [Google Scholar] [CrossRef]
- Hakanson, L.; Peters, R. Predictive Limnology—Methods for Predictive Modeling; SPB Academic Publishing: Amsterdam, The Netherlands, 1995; 464p. [Google Scholar]
- Botha, E.; Vittorio, B.; Dekker, A. Effects of Per-Pixel Variability on Uncertainties in Bathymetric Retrievals from High-Resolution Satellite Images. Remote Sens. 2016, 8, 459. [Google Scholar] [CrossRef]
- Pahlevan, N.; Lee, Z.; Wei, J.; Schaaf, C.B.; Schott, J.R.; Berk, A. On-orbit radiometric characterization of OLI (Landsat-8) for applications in aquatic remote sensing. Remote Sens. Environ. 2014, 154, 272–284. [Google Scholar] [CrossRef]
- Kabir, S.; Pahlevan, N.; O’Shea, R.E.; Barnes, B.B. Leveraging Landsat-8/-9 underfly observations to evaluate consistency in reflectance products over aquatic environments. Remote Sens. Environ. 2023, 296, 113755. [Google Scholar] [CrossRef]


| Site | ASD-FR | SR3500 | Flame | Ramses |
|---|---|---|---|---|
| Perth | Y | - | - | - |
| Wilcannia 1 | Y | - | - | - |
| Wilcannia 2 | - | Y | Y | - |
| Cunnamulla | Y | - | - | - |
| Narromine | Y | Y | - | - |
| Lake Hume | - | - | - | Y |
| Satellite | Path | Row | UTC | AEDT |
|---|---|---|---|---|
| Landsat 8 | 92 | 85 | 00:03 | 11:03 |
| Landsat 9 | 91 | 85 | 23:56 | 10:56 |
| SiteID | Method | Latitude | Longitude | Time (UTC) | Time (AEDT) |
|---|---|---|---|---|---|
| 06-21-11-1 | SDA | 147.0798 | 16-11-2021 02:45 | 16-11-2021 13:45 | |
| DAMWALL-21-11-1 | SDA | 147.0338 | 16-11-2021 04:33 | 16-11-2021 15:33 | |
| 01-21-11-1 | SDA | 147.052 | 16-11-2021 21:20 | 17-11-2021 08:20 | |
| 10-21-11-2 | SBM | 147.0925 | 16-11-2021 23:52 | 17-11-2021 10:52 | |
| 10-21-11-2 | 147.0925 | 16-11-2021 00:04 | 17-11-2021 11:04 | ||
| 10-21-11-2 | SDA | 147.0925 | 16-11-2021 23:55 | 17-11-2021 10:55 | |
| 10-21-11-1 | SDA | 147.0925 | 17-11-2021 00:19 | 17-11-2021 11:19 |
| Satellite | Path | Row | Time(UTC) | AWST |
|---|---|---|---|---|
| Landsat 8 | 112 | 082 | 02:05.49 | 10:05 |
| Landsat 9 | 113 | 082 | 02:11.21 | 10:11 |
| Satellite | Path | Row | Time (UTC) | AEDT |
|---|---|---|---|---|
| Landsat 8 | 094 | 082 | 00:14:34 | 11:14:34 |
| Landsat 9 | 094 | 082 | 00:13.57 | 11:13:57 |
| Site | % Overlap | Field Validation |
|---|---|---|
| Perth | 15 | 1 |
| Wilcannia | 100 | 2 |
| Cunnamulla | 100 | 1 |
| Narromine | 100 | 2 |
| Lake Hume | 100 | 1 (six sites) |
| Total | 6 |
Disclaimer/Publisher’s Note: The statements, opinions and data contained in all publications are solely those of the individual author(s) and contributor(s) and not of MDPI and/or the editor(s). MDPI and/or the editor(s) disclaim responsibility for any injury to people or property resulting from any ideas, methods, instructions or products referred to in the content. |
© 2024 by the authors. Licensee MDPI, Basel, Switzerland. This article is an open access article distributed under the terms and conditions of the Creative Commons Attribution (CC BY) license (https://creativecommons.org/licenses/by/4.0/).
Share and Cite
Byrne, G.; Broomhall, M.; Walsh, A.J.; Thankappan, M.; Hay, E.; Li, F.; McAtee, B.; Garcia, R.; Anstee, J.; Kerrisk, G.; et al. Validating Digital Earth Australia NBART for the Landsat 9 Underfly of Landsat 8. Remote Sens. 2024, 16, 1233. https://doi.org/10.3390/rs16071233
Byrne G, Broomhall M, Walsh AJ, Thankappan M, Hay E, Li F, McAtee B, Garcia R, Anstee J, Kerrisk G, et al. Validating Digital Earth Australia NBART for the Landsat 9 Underfly of Landsat 8. Remote Sensing. 2024; 16(7):1233. https://doi.org/10.3390/rs16071233
Chicago/Turabian StyleByrne, Guy, Mark Broomhall, Andrew J. Walsh, Medhavy Thankappan, Eric Hay, Fuqin Li, Brendon McAtee, Rodrigo Garcia, Janet Anstee, Gemma Kerrisk, and et al. 2024. "Validating Digital Earth Australia NBART for the Landsat 9 Underfly of Landsat 8" Remote Sensing 16, no. 7: 1233. https://doi.org/10.3390/rs16071233
APA StyleByrne, G., Broomhall, M., Walsh, A. J., Thankappan, M., Hay, E., Li, F., McAtee, B., Garcia, R., Anstee, J., Kerrisk, G., Drayson, N., Barnetson, J., Samford, I., & Denham, R. (2024). Validating Digital Earth Australia NBART for the Landsat 9 Underfly of Landsat 8. Remote Sensing, 16(7), 1233. https://doi.org/10.3390/rs16071233