Technical Note

3-D Changes of Tropospheric O3 in Central and Eastern China Induced by Tropical Cyclones over the Northwest Pacific: Recent-Year Characterization with Multi-Source Observations

1
Collaborative Innovation Center on Forecast and Evaluation of Meteorological Disasters, Key Laboratory for Aerosol-Cloud-Precipitation of China Meteorological Administration, Nanjing University of Information Science and Technology, Nanjing 210044, China
2
Xiamen Key Laboratory of Strait Meteorology, Xiamen Meteorological Bureau, Xiamen 361012, China
3
Key Laboratory of Meteorology and Ecological Environment of Hebei Province, Hebei Provincial Institute of Meteorological Sciences, Shijiazhuang 050021, China
4
School of Geographical Sciences, Fujian Normal University, Fuzhou 350007, China
*
Author to whom correspondence should be addressed.
Remote Sens. 2024, 16(7), 1178; https://doi.org/10.3390/rs16071178
Submission received: 26 February 2024 / Revised: 22 March 2024 / Accepted: 26 March 2024 / Published: 28 March 2024

Abstract

:
In this study, the multi-year data of meteorology and O3 from remote sensing and ground observations are applied to characterize the 3-D changes of O3 in the troposphere over central and eastern China (CEC) induced by the tropical cyclones (TCs) in the tropical and subtropical ocean regions over Northwest Pacific. The CEC-regional average of near-surface O3 levels is significantly elevated with 6.0 ppb in the large coverage by the TCs in the subtropical ocean, while the TCs in the tropical ocean alter near-surface O3 weakly, indicating the latitudinal-located TCs in the subtropical offshore ocean could largely influence the O3 variations over CEC. The sub-seasonal change with the positive and negative anomalies of near-surface O3 is induced by the tropical TCs from June to July and from August to October. The peripheral circulation of TCs in the subtropical offshore ocean persistently enhances the O3 concentrations over CEC during the season of East Asian summer monsoons. The positive O3 anomalies maintain from the entire troposphere to the lower stratosphere over CEC in the peripheries of subtropical TCs, while the tropical TCs cause the positive O3 anomalies merely in the lower troposphere. The O3 transport and accumulation, photochemical production and stratospheric intrusion are climatologically confirmed as the major meteorological mechanisms of TCs affecting the O3 variations. This study reveals that the downward transport of stratospheric O3 of TCs in the subtropical ocean exerts a large impact on the atmospheric environment over CEC, while the regional O3 transport and photochemical productions dominate the lower troposphere over CEC with less impact of stratospheric intrusion from the TCs in the tropical ocean region. These results present the climatology of tropospheric O3 anomalies in China induced by the TCs over the Northwest Pacific with enhancing our comprehension of the meteorological impact on O3 variations over the East Asian monsoon region.

Graphical Abstract

1. Introduction

Excessive tropospheric O3 can cause adverse effects on the air environment [1]. Tropospheric O3 is mainly produced through photochemical reactions of the precursors such as carbon monoxide (CO), nitrogen oxides (NOx = NO + NO2) and volatile organic compounds (VOCs) [2,3], and also originates from stratospheric O3 intrusions by stratosphere-to-troposphere exchange [4]. With regulating the photochemical production, transport, deposition and stratospheric intrusions, meteorological conditions play an important role in ambient O3 pollution [5,6,7,8,9].
The tropical cyclone (TC) is a synoptic scale system with the horizontal scale from 100 km to 2000 km, which can cause the exchange of energy and water vapor between land and ocean [10], and the TC circulation alters the atmospheric composition budget from the surface layer to the upper troposphere and lower stratosphere (UTLS). In central and eastern China (CEC), many O3 pollution events in summer and autumn were related to TC activities from the Northwest Pacific, and elevated concentrations of O3 lasted a day or two before TCs’ landing on CEC and offshore turning [11,12,13]. In Hong Kong, the O3 concentrations increased 10–15 μg m−3 on TC days [14], and O3 pollution events induced by TCs accounted for one third of the total events [15]. A wide area of downdrafts over the TC periphery, as the redeeming flows for updrafts in TC center, can form relatively high pressure near the surface [10]. As TCs located in the Northwest Pacific, the downdrafts occurred over Southeast China, with strong sunlight, xerothermic and calm air in the boundary layer [16]. These provide favorable situations for the photochemical formation and accumulation of near-surface O3 over the areas of the TC periphery. In addition, the synoptic-scale deep convective circulation of TC with downdrafts and updrafts over the TC periphery and center driving the strong vertical transport of trace could cause significant perturbations to the distribution of chemical compositions in the UTLS [17,18]. Aircraft experiments and satellite observations confirmed that O3 in the lower troposphere was transported horizontally over a long distance into TC circulation, and then shifted up to UTLS by eyewall convection, finally outflowing with the top divergence of the TC [19]. Roux et al. [20] emphasized that as the structure and intensity of TCs vary with time, the O3 perturbations have produced contrary anomalies. High O3 concentrations were anti-correlated with CO during downdraft periods of the TC periphery, along with dry and high potential vorticity (PV) air in troposphere, which suggested the vertical transport of high O3 air mass from UTLS to the lower troposphere [21,22,23], even to the boundary layer in several cases [11,13]. Lightning activities produce NOx in the eyewall and outer rain bands of TCs, inducing the elevation of O3 concentrations in the mid-troposphere [24,25].
Affected by the variation of atmospheric circulation, the scale, intensity and moving path of TCs have significant individual differences. Tu et al. [26] focused on inter-decadal variation of TC tracks in the Northwest Pacific and found that the increase in occurrence of TCs’ northward movement has been considered to the most possible TC track in the Western Pacific for leading near-surface O3 ascending over CEC [27]. Chow et al. [14] reported the physical mechanism of O3 pollution in Hong Kong related with TC locations, especially the track passing near the east of Taiwan which could bring northerly wind, sinking motion and relatively low precipitation over Hong Kong. The advection of O3 and its precursor near the surface has resulted from the common change in prevailing wind and boundary layer circulation. The studies [15,28,29,30,31] revealed that O3 precursors are diffused from industrial regions to the Pearl River Delta in southeast China by TC peripheral weak northerly winds before TC landing with the TC-related dynamic flows of polluted air in urban agglomerations.
As the variations in prevailing wind, cloud fraction, solar radiation, air temperature and humidity over CEC are largely modulated by East Asian monsoons, CEC is the area frequently affected by TCs over the Northwest Pacific. The TC exerts an impact on atmospheric composition distribution [8,12,32]. O3 and its precursors can be driven to deteriorate the air quality by the TC-related atmospheric circulation and boundary layer conditions, although the complex photochemical formation of O3 and the change in atmospheric oxidation remain uncertain. The anomalies of O3 concentrations have been confirmed to be related with TC activities in the Northwest Pacific by several case studies. The locations of TCs showed a particularly important factor in local variation in O3 with different meteorological conditions [14]. As TCs move over the Northwest Pacific, the TC could variously alter peripheral atmospheric motion and photochemical conditions for O3 distribution in the CEC region [14]. In this study, with the multi-source observations of O3 and atmospheric circulations over recent years, we aim at multi-year characterization of the horizontal and vertical distribution of tropospheric O3 over CEC with the different TCs’ locations over the Northwest Pacific.
This study presents the following highlights: (1) The multi-year climatology of the TCs’ effects on the 3-D distribution of tropospheric O3 concentrations. (2) The meteorological mechanisms on TC locations changing regional transport and photochemical production of O3 over the air pollution area in CEC. (3) The effect of stratospheric invasion on tropospheric O3 redistribution driven by vertical circulations of the regional TCs of the Northwest Pacific. Following the introduction in this section, we describe the observational data and analysis methods in Section 2. In Section 3.1, we present the temporal and spatial distribution of near-surface O3 during the TC days in the TC season of 2010–2019. Section 3.2 investigates the horizontal and vertical distribution of O3 over CEC induced by the TCs based on satellite observation. Section 3.3 discusses the meteorological mechanism on the TC-driven horizontal transport and photochemical production of O3 anomalies. Section 3.4 reveals the mechanism of vertical transport from the stratosphere to the troposphere over the TCs’ peripheral circulation. Finally, a conclusion is presented in Section 4.

2. Data and Methods

2.1. ERA-5 Reanalysis

ERA-5 is the fifth generation of the European Centre for Medium-Range Weather Forecasts (ECMWF) atmospheric reanalysis for the global climate and weather with improved spatial resolution, better physics and data assimilation compared to the previous ERA-Interim reanalysis [33]. The ERA-5 data (https://cds.climate.copernicus.eu/ accessed on 20 February 2024) with horizontal 0.5° × 0.5° and vertical 37 pressure levels. ERA5′s surface or single-level data are also available for regional climate and weather analysis [34]. Data containing the daily average 850 hPa wind, 500 hPa geopotential height, total cloud cover and surface solar radiation downward of 10 years (2010–2019) are applied in this study.

2.2. Remote-Sensing O3 Monitoring Data

The O3 monitoring instrument (OMI) is a nadir-viewing near-UV/Visible spectrometer aboard NASA’s Aura satellite, moving according to the sun-synchronous polar orbit with a local equator crossing time of 13.45 (https://aura.gsfc.nasa.gov/omi.html, accessed on 11 December 2023). OMI has a sufficiently fine spectral resolution to allow the direct retrieval of tropospheric O3, although the sensitivity decreases strongly toward the surface because of Rayleigh scattering [35]. OMI can estimate the multiyear means in the summer afternoon surface O3 with a precision of 8 ppb in China [36]. The retrieved O3 profile is contained in the dataset of OMO3PR (https://daac.gsfc.nasa.gov/datasets/, accessed on 20 February 2024) and is given in terms of the layer-columns of O3 in DU for an 18-layer atmosphere. In this study, the observed layer-column concentration (DU) of O3 was converted to an average volume mixing ratio (ppb) per layer using the following:
Vi = 1.2672 × 10³ Ni/DPi
with Ni being the layer-column in DU, DPi the pressure difference between the top and bottom of the layer in hPa and Vi the average volume mixing ratio in ppb.

2.3. Near-Surface O3 Observational Data

Here, we obtain the 5-year (2015–2019) data of near-surface O3 from China’s Ministry of Ecology and Environment network (http://www.mee.gov.cn, accessed on 20 February 2024) of 154 cities (Figure 1a) over CEC. Observed mean values of the maximum daily 8 h average (MDA8) O3 of all sites in the TC season from June to October (JJASO) are applied in this study. The anomalous surface O3 of MDA8 is the difference between the daily value and mean value of 5 years on the same day. The daytime O3 concentration is the hourly average from 7:00 to 19:00, and the nighttime is from 20:00 to 6:00 on the next day. The unit conversion from μg m−3 to ppb is as follows:
Cv = Cm × 22.4/M(O3)
with Cv being the average volume mixing ratio of O3 in ppb, Cv the mass mixing ratio of O3 in μg m−3, 22.4 L mol−1 the molar volume of gas under standard conditions and M(O3) the molar mass of O3.

2.4. Northwest Pacific TC Datasets

The statistics of the Northwest Pacific TCs are from the Northwest Pacific TC best path datasets created by the China Meteorological Administration (CMA-BST, http://tcdata.typhoon.org.cn, accessed on 25 January 2023) from June to October in 2010–2019. The CMA-BST dataset provides the location and intensity of TCs in the Northwest Pacific (including the South China Sea, north of the equator and west of 180°E) every 6 h since 1949 (http://tcdata.typhoon.org.cn, accessed on 25 January 2023) [37,38].

2.5. Division of Northwest Pacific Regions

For comprehensive characterization of the spatial and temporal distribution of surface O3 over the CEC region, O3 measurements at 154 cities are extracted for investigating the TC-related effect on near-surface O3 concentrations (Figure 1a). The Northwest Pacific is divided into three regions: Region 1 (R1) is over the South China Sea (108–123°E, 10–21°N), where most TCs move from east to west latitudinally influencing southern CEC; Region 2 (R2) is located in the region (123–139°E, 25–38°N) over the subtropical region in the Northwest Pacific, where most TCs move meridionally influencing the eastern region of CEC; and Region 3 (R3) is relatively far from CEC over the east of the Philippines (123–139°E, 13–25°N) in the tropical region of the Northwest Pacific, where most TCs shift to the regions R1 and R2 over the Northwest Pacific (Figure 1a,b).
There are a total of 200 Northwest Pacific TCs from June to October over 2010–2019, and all the tracks of TCs are shown in Figure 1b. In total, only 36 of 200 TCs are beyond the 3 sea regions R1, R2 and R3, and around 82% of the Northwest Pacific TCs have passed through the 3 regions R1, R2 and R3 in the past 10 years. Thus, the divided regions R1, R2 and R3 are the key regions for CEC affected by the offshore Northwest Pacific TCs’ circulation, to discuss the meteorological effect by different locations of the Northwest Pacific TCs.
Over the last 10 years, 73, 87 and 124 TCs have existed over the regions R1, R2 and R3, respectively, where the minimum sea level pressures at the TC centers were averaged with 987.1, 976.8, 974.3 hPa, and the average of maximum wind speeds with 23.7, 29.3, 31.2 m s−1; the TC intensity in R3 is stronger, followed by R2 and R1. As CEC has become the major periphery of TCs located in the 3 regions R1, R2 and R3, the TC day in this study is defined with the TCs centered in the regions R1, R2 and R3 over the Northwest Pacific.
In addition, the TC activities exhibit the distinct monthly variations over three oceanic regions in the Northwest Pacific. The peak months of TCs in the ocean regions R1, R2 and R3 are July, August and September, respectively (Figure 1c). It is implied that the influence of TCs in the regions R1, R2 and R3 on near-surface O3 over CEC could be mostly in midsummer, late summer and early autumn.

3. Results and Discussion

3.1. Near-Surface O3 Variations during TC Season

The 5-year average (2015–2019) O3 values of MDA8 during the TC season of the Northwest Pacific from June to October (JJASO) is obtained from the measurement data of 154 cities over CEC within the monitoring network operated by the China Ministry of Ecology and Environment. The CEC-regional average of MDA8-O3 concentrations during the TC season (JJASO) is 52.3 ppb over the recent years. Regionally, the average O3 level in TC days of the subtropical region R2 is significantly elevated by 6.0 ppb to the CEC-average MDA8 value at 58.3 ppb in JJASO (Figure 2b), while slight O3 changes in TCs are observed in the tropical regions R1 and R3 with anomalies of −1.2 and +0.8 ppb (Figure 2a,c). The monthly anomalies of MDA8-O3 are all positive with +11.8, +2.6, +3.8, +7.0 and +12.5 ppb, respectively, in the months of JJASO in TC days over the subtropical ocean region R2 (Figure 2b).
In the R1′s TC days, a distinct pattern of sub-seasonal change is found with positive and negative anomalies of O3 from June to July and from August to October (Figure 2a). Comparing with the minor impact of TCs in R1 and R3 on regional O3 levels over CEC, the peripheral circulation of TCs in R2 can elevate the O3 concentrations from June to October during the TC season over CEC (Figure 2), indicating the latitudinal-located TCs in the subtropical offshore ocean largely influencing the coastal and inland air quality.
The distributions of anomalous O3 concentrations over CEC are shown in Figure 3. In R1′s TC days, the region of southeastern China presents the negative anomalies of −2–−10 ppb, and the positive anomalies of 0–+5 ppb covering the inland area of CEC (Figure 3a). In R2′s TC days, the weak negative anomalies occur in the northeastern coastal regions of China, which is close to the TCs. The significantly positive O3 anomalies of +5–+15 ppb cover the most CEC regions for TCs-elevating concentrations in the region R2 (Figure 3b). In R3′s TC days, the −3–+3 ppb anomalies over CEC are distributed with weak negative values on the eastern coast and positive inland (Figure 3c). For TCs in all three regions R1, R2 and R3 in the Northwest Pacific (Figure 1a), the anomalies of O3 are negative in the coast areas and positive in inland areas over CEC, revealing the distinct contributions to near-surface O3 with clearing and accumulating effects by the distances from the TC circulation to the continental regions. Comparing two tropical regions R1 and R3, the TCs in the subtropical region R2 induce latitudinally strong positive anomalies of near-surface O3 over the large inland of CEC. Thus, the orientation of TCs plays an important role in influencing O3 variations over CEC.
The daytime (from 7:00 to 19:00) and nighttime (from 20:00 to 6:00 in next day) anomalies of O3 concentrations are averaged in the TC days of the regions R1, R2 and R3. The R2′s average daytime concentration of near-surface O3 over CEC is 44.9 ppb, higher than R1 (40.0 ppb) and R3 (41.2 ppb). Similar differences are also reflected at nighttime with 24.9, 26.3 and 24.3 ppb, respectively, in the Northwest Pacific regions R1, R2 and R3. Anomalies of O3 are positive at nighttime in all three regions, with +0.4, +1.8 and +0.3 ppb, respectively. In the daytime, the TCs in R2 and R3 can apparently elevate O3 levels with anomalies of +4.1 and +1.4 ppb, while R1 presents slight negative anomalies. The TC’s locations and orientations in the Northwest Pacific alter the O3 diurnal variations in CEC.
Significantly, the northward TCs in the Northwest Pacific almost trail through the sea region of R2 (Figure 1b). A recent study in Hong Kong emphasized the northward movement of a TC deteriorated air quality remarkably, with an increase of 32% in the O3 concentrations [14]. Similarly, 60–90 ppb O3 in the boundary layer had been reported in Eastern China with Typhoon Utor traveling in the Northwest Pacific [39].

3.2. Vertical O3 Variations in the Troposphere

In order to clarify how the impact of the TCs’ location on vertical and horizontal O3 distributions in the troposphere over CEC, the high resolution OMI OMO3PR data are interpolated to 0.75° × 0.75° grids for characterizing the vertical O3 anomalous variations induced by the Northwest Pacific TCs in the three regions R1, R2 and R3 (Figure 4). To vertically compare the relative deviation of O3 in the troposphere, the anomalous percentage of O3 during TC days from the monthly mean value is adopted in this section. The horizontal distributions of O3 anomalous percentages are averaged within 500–700 hPa (the lower and middle troposphere, LMT), 300–500 hPa (middle and upper troposphere, MUT) and 200–300 hPa (upper troposphere and lower stratosphere, UTLS), respectively, in the TC regions R1, R2 and R3 during JJASO, 2015–2019 (Figure 4). Tropospheric O3 presents distinctly vertical changes over CEC in association with the TC locations in the Northwest Pacific (Figure 4).
During the TCs in the region R1 over the South China Sea, the positive anomalous O3 percentages are concentrated over the inland regions with higher than +4% over central CEC in the LMT between 500 and 700 hPa, while the coastal areas in southern and eastern CEC inversely present O3 negative anomalies up to −5% in the LMT (Figure 4a), similarly to the spatial distribution of near-surface O3 anomalies over CEC in the TCs over the tropical region R1 (Figure 3a). By contrast with the LMT, the negative O3 anomalies dominate the MUT and the UTLS with the vertically extending O3 anomalous coverage over CEC (Figure 4b,c).
It is unique for the TCs in the subtropical region R2 over the Northwest Pacific that the tropospheric O3 anomalies show consistently positive values in all the LMT, MUT and UTLS over CEC with high anomalies exceeding +8% in LMT over the northern CEC region (Figure 4d–f). The O3 anomalous pattern in the LMT is generally similar with the near-surface O3 anomalous pattern with the TCs located over the subtropical Northwest Pacific (Figure 3b and Figure 4d). The positive anomalies dominate the tropospheric O3 over CEC, indicating the significant O3 enhancements from the free troposphere to the lower stratosphere in the TC’s peripheries of the subtropical region R2′s TCs. As the O3 concentrations in the UTLS are 102–103 times higher than those in the MUT and LMT, the +2–+4% anomalous percentages in the UTLS over CEC could present significant O3 intrusions in the UTLS, which is further investigated (Section 3.4) to confirm the importance of vertical O3 transport in stratosphere–troposphere exchanges (STE) in the change of atmospheric environment with increasing tropospheric O3 driven by the TCs in the subtropical regions.
With the TCs in R3 over the east of the Philippines in the tropical region of the Northwest Pacific, the positive anomalies of O3 in the LMT are centered over the eastern coast of CEC, while the slightly positive O3 anomalies by +1% in the LMT distribute the inland CEC areas (Figure 4g), inconsistently with the near-surface O3 anomalous pattern over CEC for the TCs in the remote ocean region R3 (Figure 3c). Similar to the impact patterns in the MUT and UTLS of TCs in R1 (Figure 4b,c), the O3 anomalies are weakly negative and even nearly close to the mean values in the MUT and the UTLS over CEC (Figure 4h,i), which can be connected with less impact on the CEC atmosphere from the relative far ocean region. The distinct differences in vertical O3 distribution from the lower stratosphere to the lower troposphere over CEC are observed for the TCs located in tropical and subtropical ocean regions (Figure 4). The tropospheric–stratospheric temperature in the tropical atmosphere exhibits long-range power-law persistence, which becomes stronger as the altitude increases, affecting the vertical ozone distribution over CEC [40].
The significant impacts on 3-D structure of O3 from near-shore TCs in the different Pacific regions are confirmed by the anomalous distributions of O3 from surface and remote-sensing observations (Figure 3 and Figure 4). Focusing on the impacts of TCs on the ambient O3 changes over CEC, the dominance of vertical O3 transport of STE in the change of atmospheric environment can be reflected with the consistent O3 enhancements from the lower, middle and upper troposphere to the lower stratosphere in the peripheries of TCs over the subtropical region R2 in the zonal direction to CEC. The TCs in the tropical Pacific regions R1 and R3 induce positive O3 anomalies in the lower troposphere in company with the slightly negative or unchanged O3 anomalies from the middle and upper troposphere to the lower stratosphere, indicating an importance of local O3 accumulations and production in the lower troposphere with less impact of STE in the UTLS on the atmospheric environment over CEC from the TCs in the tropical ocean regions.

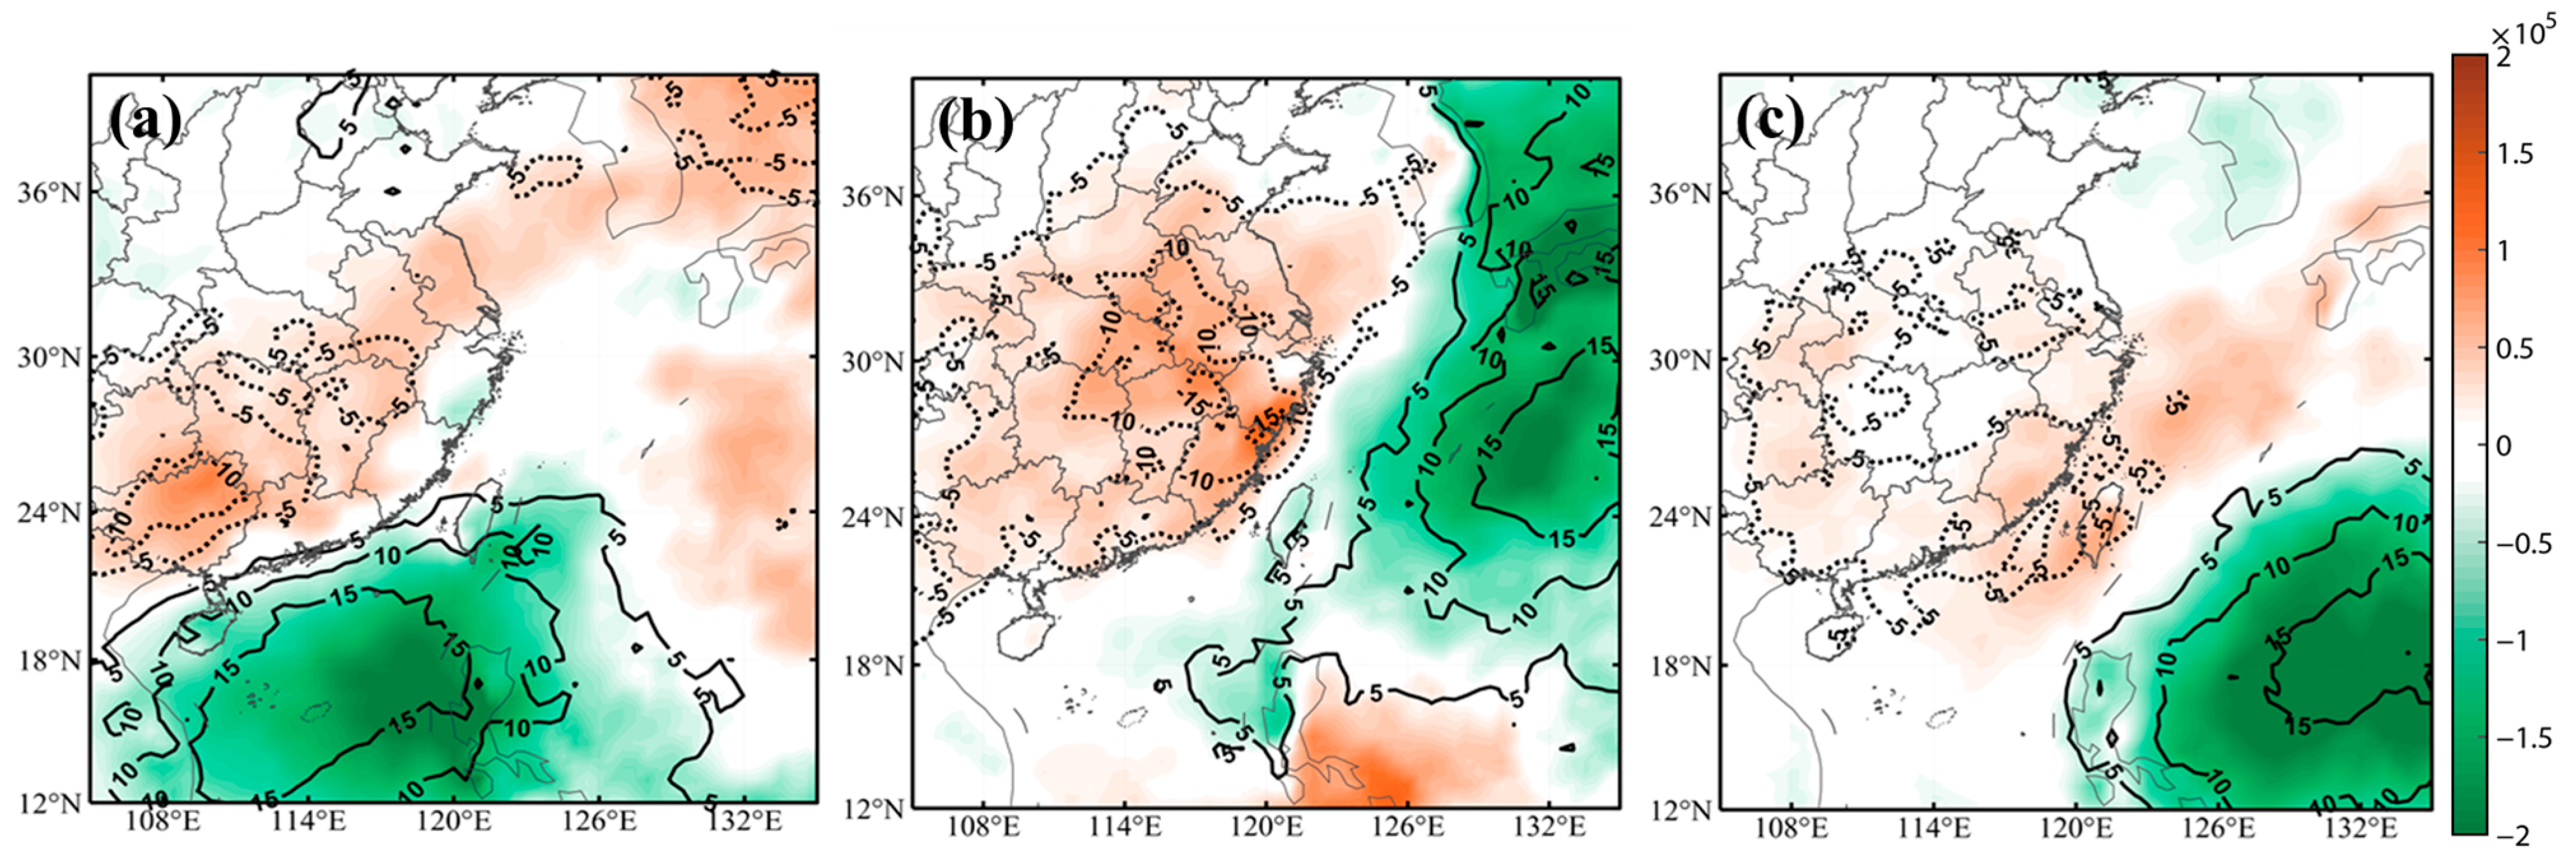
3.3. Meteorological Anomalies for Horizontal Transport and Photochemical O3 Production

In this section, the low-level wind (LLW), surface solar radiation (SSRD) and total cloud cover (TCC) are used to understand the meteorological factors driving the horizontal transport and photochemical production of near-surface O3 in CEC during TC days. The composite anomalies (based on the monthly mean, same hereinafter) of LLW at 850 hPa, SSRD and TCC in the regions R1, R2 and R3 are shown in Figure 5 and Figure 6 by using the meteorological datasets of the ERA-5. The anomalous values are calculated by subtracting the 10-year averages over TC days from the daily values.
Over the 10-year average of R1’s TC days, the southern and eastern coast of CEC is dominated by strong anomalous east winds reaching up to +4 m s−1. The eastern wind brings clean air from the ocean to the coast to dilute the surface O3 concentration in the southern and eastern coasts of CEC (Figure 5a). The positive anomalies of TCC (+3–+5%) and negative anomalies of SSRD (−0.3–−0.5 × 10⁵ J m−2) cover the southern and eastern coasts (Figure 6a). Less sunlight inhibits O3 photochemical production and clean air advection for the negative O3 anomalies (−4–−8 ppb) over the southern and eastern coast of CEC (Figure 3a). In the inland area of CEC, the anomalous east and northeast winds and more SSRD (+ 0.5–+1.0 × 10⁵ J m−2) and less TCC (−5–−10%) cover the areas with positive O3 anomalies (+2–+5 ppb) by intensifying the efficiency of photochemical reaction for O3 production (Figure 3a and Figure 6a), and transported from the region of the Yangtze River Delta in East China to the accumulations over inland CEC.
In R2′s TC days, CEC is significantly dominated by strong solar radiation with +1.0–+2.0 × 10⁵ J m−2 of anomalous SSRD and (−10)–(−15%) of anomalous TCC (Figure 6b). Such a photochemical condition is sufficient over CEC with the largest positive anomalies of near-surface O3 in the subtropical Northwest Pacific TC days (Figure 2). The anomalous northeast winds cover the most areas of CEC in the R2′s TC days (Figure 5b). The significantly anomalous northeast wind establishes the O3 horizontal transport from the north to the south of the CEC region. It is a matter of wide concern that the near-surface O3 concentrations are extremely high in the north of CEC (especially in the North China Plain). The high O3 advection with anomalous northeast winds in the peripheral region of the R2′s TC could cause the significant O3 increases over CEC, especially in the inland of CEC (Figure 3b). The stronger anomalous wind of larger than +3 m/s brings the clean air from the ocean leading to the negative anomalies of near-surface O3 (−1–−4 ppb) over the northeastern coast of CEC (Figure 3b and Figure 5b).
In R3′s TC days, the impacts of remote TC on the SSRD and TCC of CEC are relatively weak with slightly positive anomalies of the SSRD and negative anomalies of the TCC (Figure 6c). The anomalous wind is also weak, which indicates the remote R3′s TC does not drive O3 advection directly over CEC (Figure 5c).
The meteorological condition in the TC’s peripheral circulation was recognized with TC’s locations and the TC-related region [14,27]. We also find a distinct relation between the meteorological conditions of CEC and the distance to TCs, for the O3 variations over CEC. The coast areas of CEC are near the TC centers with the strong and clean advection reducing the coastal O3 concentration significantly. The inland area of CEC is 1000–2000 km away from the TC circulation. The stable and cloudless conditions lead to more solar radiation for O3 production in the inland areas of CEC (Figure 3 and Figure 5). However, the lower TCC and greater SSRD for O3 photochemical production cannot completely match the horizontal distribution of O3 anomalies over the inland area of CEC (Figure 3 and Figure 6), implying the other meteorological drivers influencing the near-surface O3 changes. As the distinct vertical O3 structures are found in the TCs over the Northwest Pacific regions R1, R2 and R3 (Figure 4), the vertical O3 transport driven by the TC circulations in association with the STE can be another important mechanism for tropospheric O3 change, which is discussed in Section 3.4.

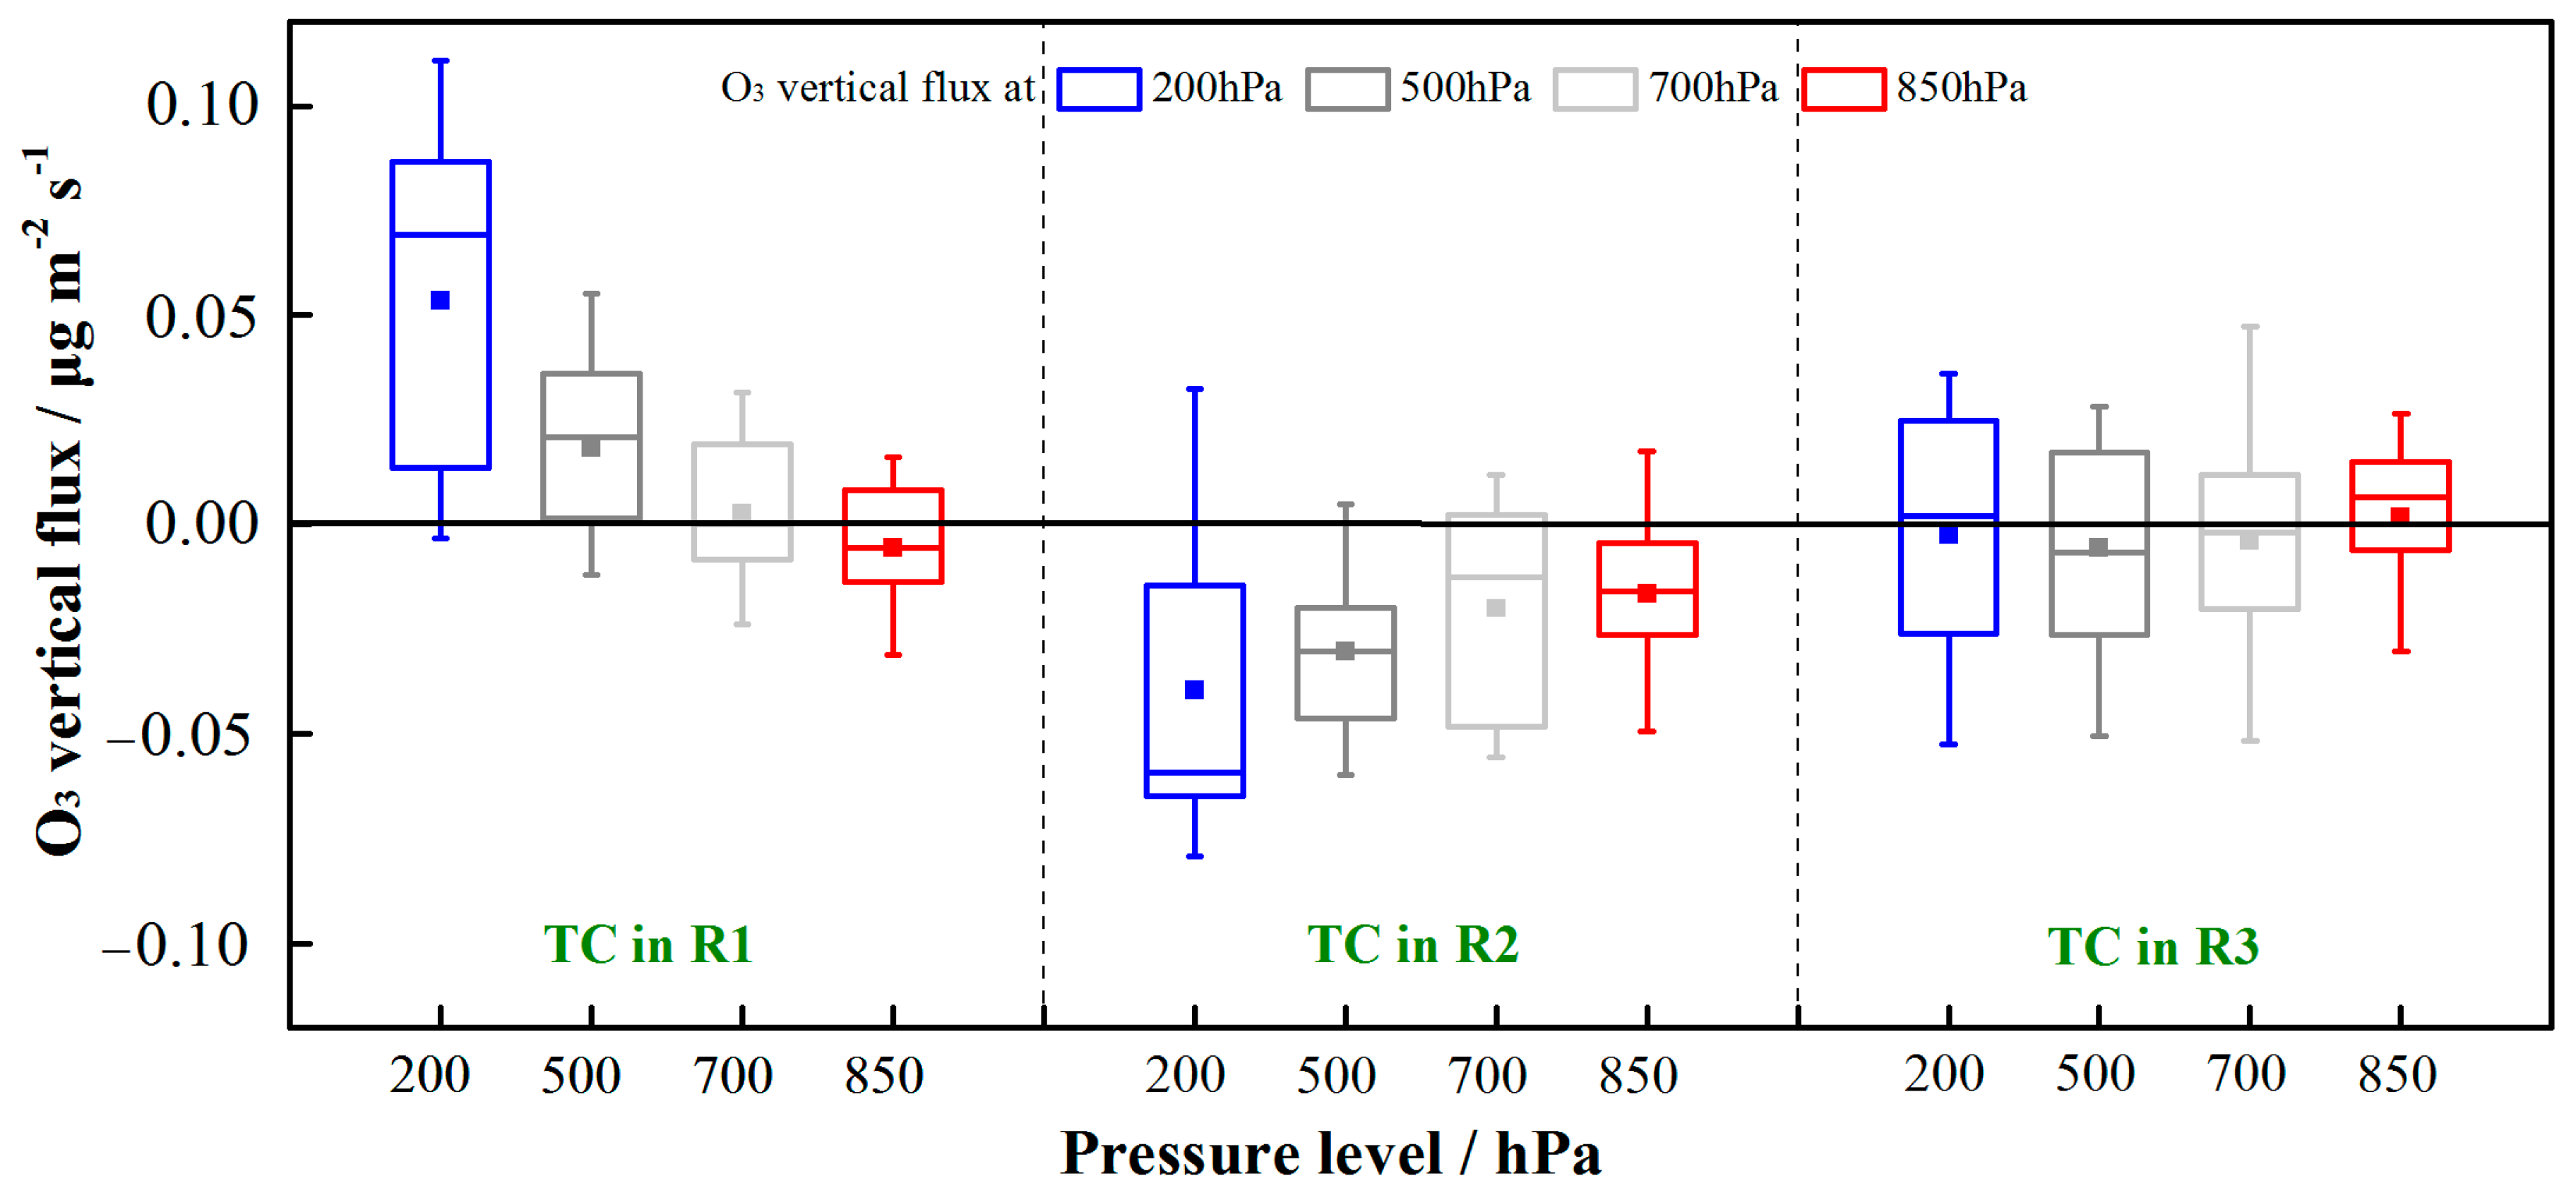
3.4. Vertical Transport of O3 Driven by TC Circulations
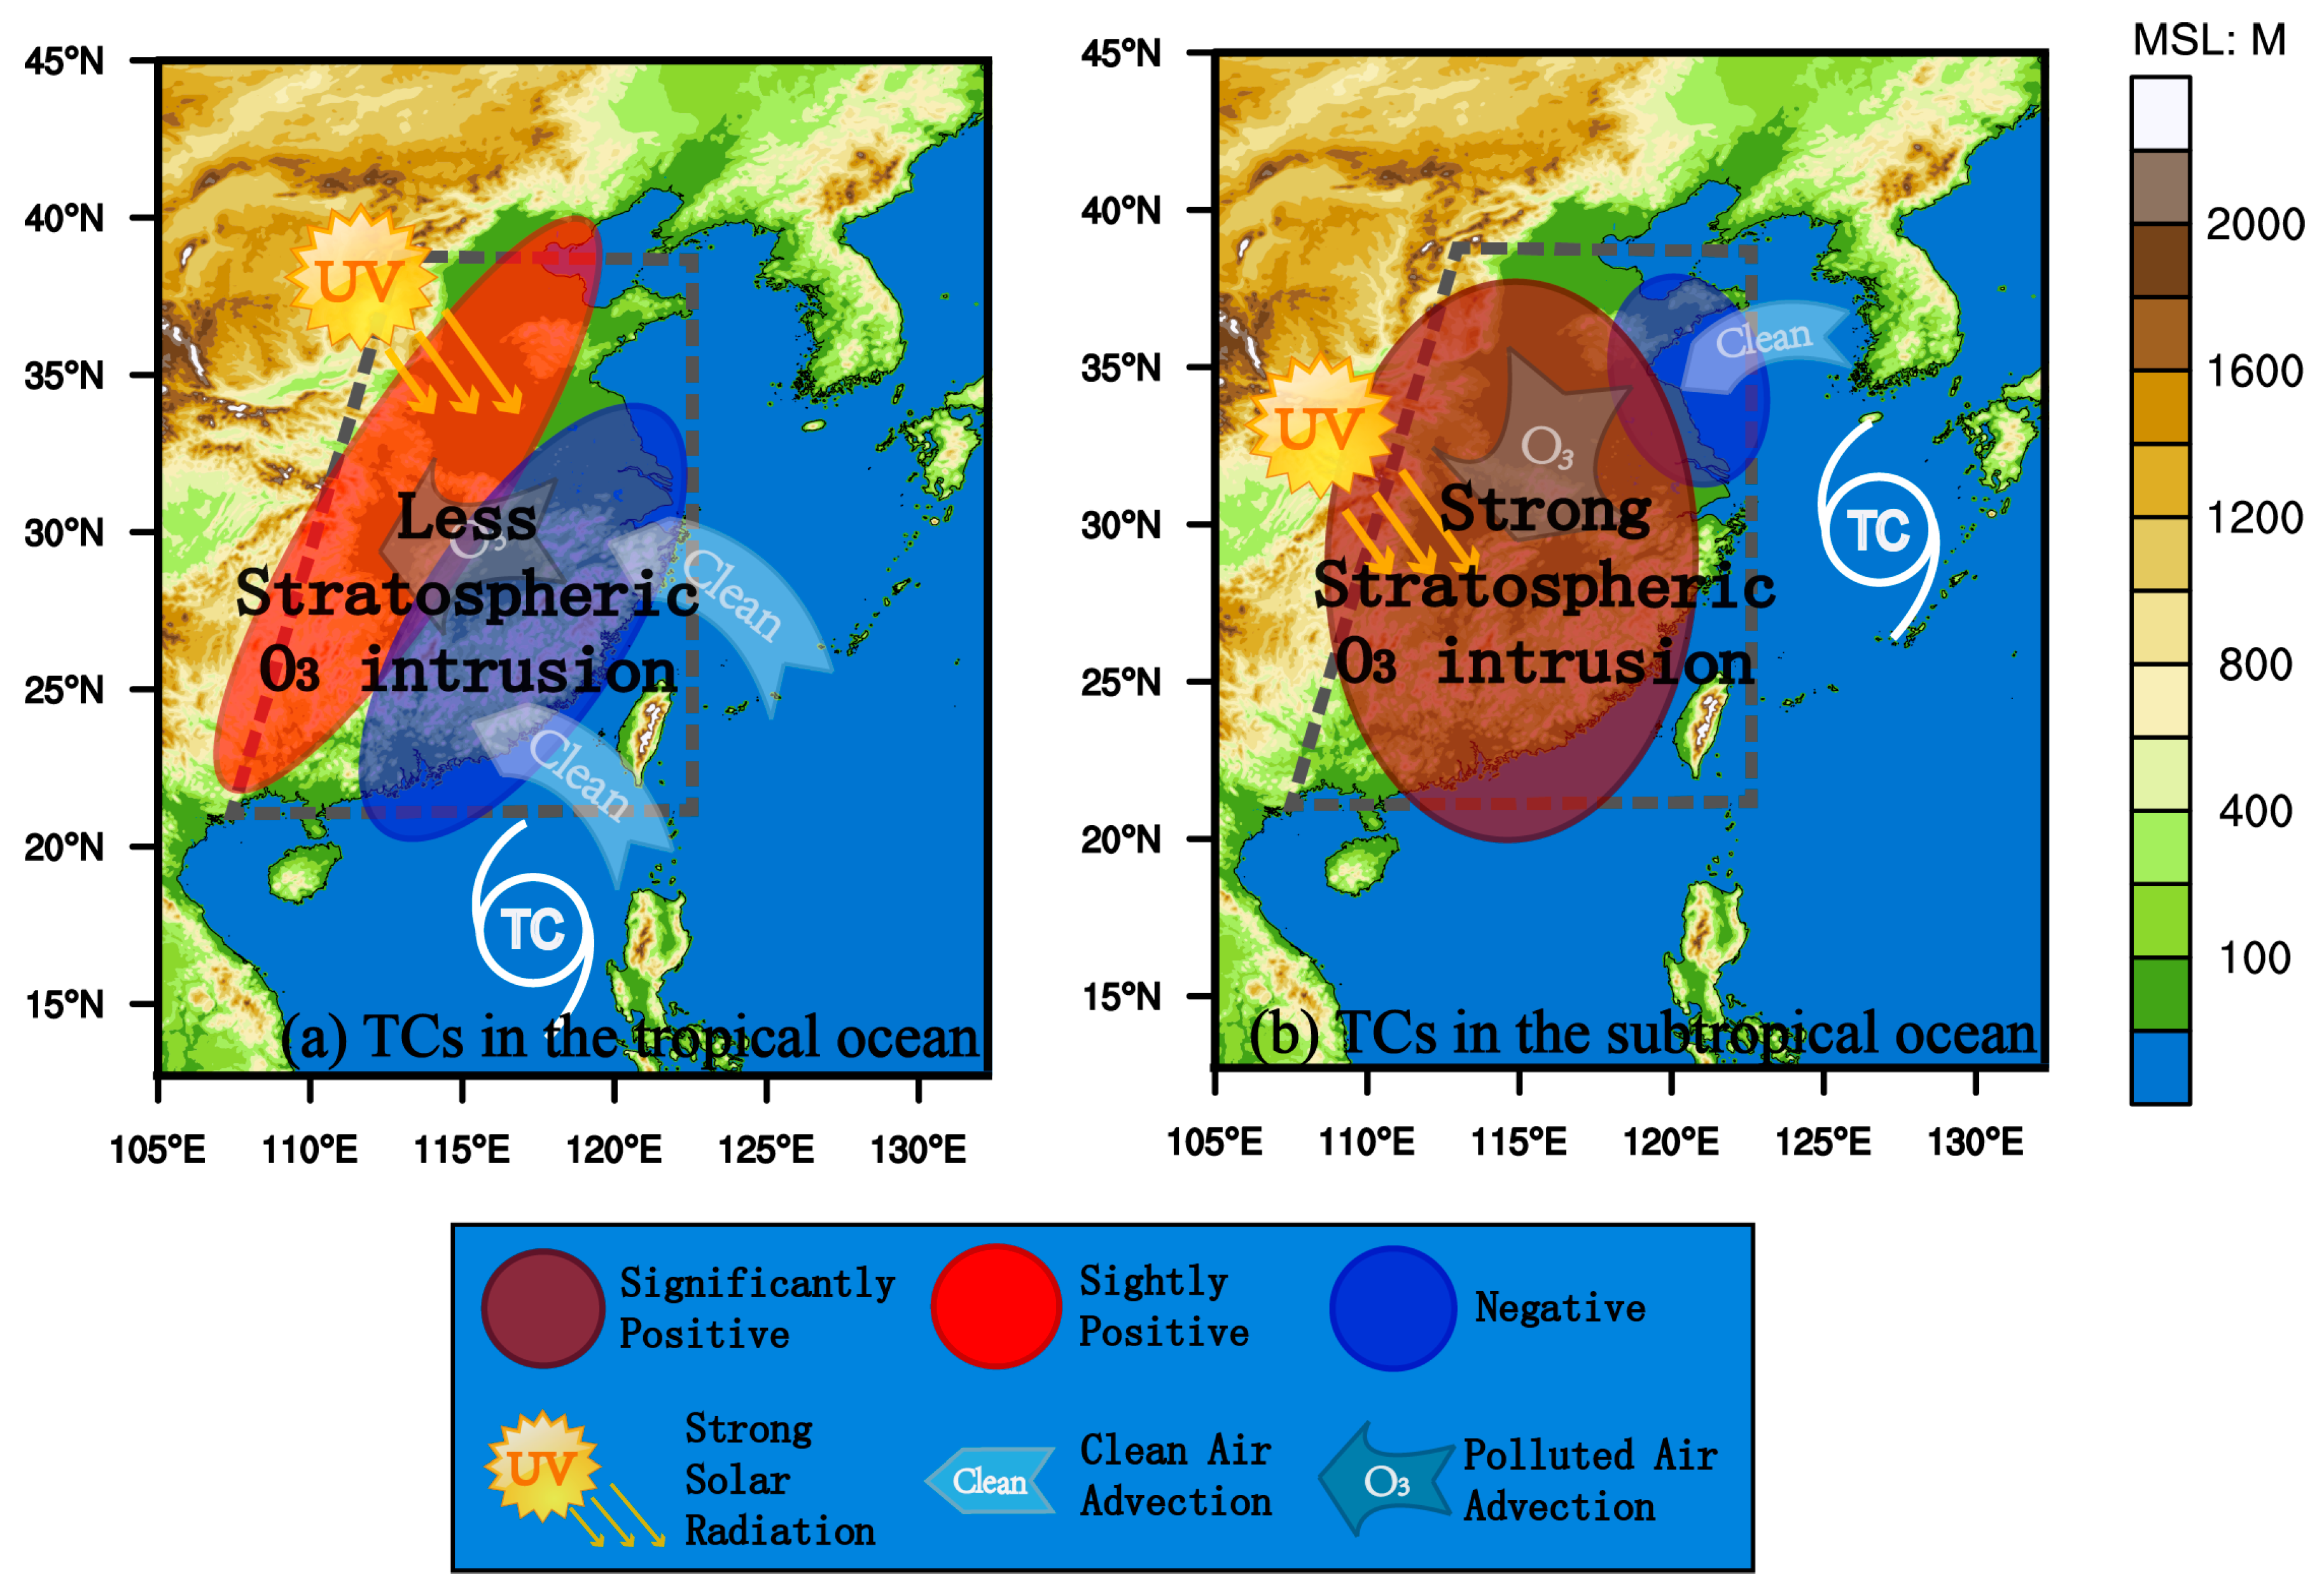
In order to identify the effects of TCs over three different regions in the Northwest Pacific on the vertical transport of O3 over the CEC regions, the O3 vertical transport flux over CEC is obtained by multiplying the O3 concentrations (from the OMO3PR, converting the units to μg m−3) by the vertical velocity (from the ERA5, convert units to m s−1) with the positive and negative values indicating upward and downward transport, respectively (Figure 7). The vertical O3 transport from the lower stratosphere to the lower troposphere presents the distinct structures induced by the TCs in the three Northwest Pacific regions R1, R2 and R3.
With the TCs in the tropical ocean R1, the O3 vertical transport fluxes over CEC present the upward transport (−0.07–−0.02 μg m−2 s−1) at 200 and 500 hPa in the lower stratosphere to the middle troposphere with the weak vertical mixing at around 0 μg m−2 s−1 at 700 hPa and 850 hPa in the lower troposphere (Figure 7), indicating less stratospheric O3 invasion downwards to the troposphere and large accumulations of O3 in the lower troposphere over CEC induced by the TCs in the tropical region R1. The peripheral vertical motion of the R1′s TCs cannot drive stratospheric O3 transport down to the troposphere efficiently. The positive anomalies of O3 in the LMT over the inland of CEC (Figure 4a) might result from the accumulations of O3 in the lower troposphere, which are formed by the horizontal transport with stronger winds (Figure 5a) and photochemical production by strong solar radiation (Figure 6a). The weak vertical transport fluxes of O3 over CEC exist at all levels from the lower stratosphere to the lower troposphere in R3′s TC days (Figure 7); the TCs in the remote region R3 over the tropical Pacific could not drive the STE over CEC with a negligible influence on tropospheric O3.
It is remarkable for the subtropical Pacific region R2 that there is a significant O3 downdraft from the lower stratosphere with −0.05 μg m−2 s−1 of O3 flux at 200 hPa (Figure 7) reaching deep to the lower troposphere with the negative O3 vertical transport of (−0.02–−0.05) μg m−2 s−1 in the troposphere over CEC. The strong stratospheric O3 invasions could influence the ambient atmosphere over CEC by the deep STE of TCs in the subtropical region R2 located in the zonal direction of CEC (Figure 3b, Figure 4b and Figure 7). The deep downdrafts of O3 connect the lower stratosphere and the lower troposphere with the TC’s peripheral compensation sinking motion over CEC elevating the near-surface O3 levels (Figure 3b), although the stratospheric O3 transported into the PBL with the near-surface existing O3 together could be consumed by NO titration over CEC.

4. Conclusions

The existing studies are mostly concentrated on the Northwest Pacific TC events with the influences on ambient O3, especially over CEC, the densest human activity zone with O3 pollution in China. By using multi-year data of remote sensing and ground observations over recent years, this study characterized the 3-D tropospheric O3 anomalies over CEC induced by the TCs in the tropical and subtropical Northwest Pacific to present a climatology of TCs altering ambient O3 levels in the continental human activity region with quantitative assessments of the effect degree and identification of the underlying change mechanism in atmospheric environment change.
It is assessed from the multi-year observations that the regional average of near-surface O3 levels is significantly elevated with 6.0 ppb over CEC by the TCs over the subtropical Northwest Pacific, but the TCs located in the tropical ocean weakly altered the near-surface monthly O3 with slight regional anomalies of −1.2 and +0.8 ppb over CEC. The TC-induced near-surface O3 changes in positive and negative anomalies are spatially distributed in the inland and coastal regions over CEC, and discrepant patterns of the spatial distributions exist between the TCs in the subtropical ocean with the enormous inland and minimal coastal areas of positive and negative O3 anomalies, and the TCs in the tropical ocean with almost equal areas of positive and negative anomalies over CEC. The distinct pattern of sub-seasonal change with the positive and negative anomalies of near-surface O3 is induced by TCs in the tropical ocean from June to July and from August to October. The peripheral circulation of TCs in the subtropical offshore ocean persistently enhanced the O3 concentrations over the CEC region during the season of East Asian summer monsoons. The latitudinal-located TCs in the subtropical offshore ocean could largely influence regional O3 variations over CEC, indicating an important role of TC location and orientation in changing air quality over the TCs’ peripheral regions.
The positive O3 anomalies persisted from the lower, middle and upper troposphere to the lower stratosphere over CEC in the peripheries of TCs over the subtropical region, while the TCs in the tropical Pacific regions induced positive O3 anomalies in the lower troposphere with slightly negative or unchanged O3 anomalies from middle and upper troposphere to the lower stratosphere, revealing the relative importance of the vertical O3 transport of STE in the change of atmospheric environment caused by TCs in subtropical and tropical oceans. The meteorological mechanisms with O3 transport and accumulation, photochemical production and stratospheric invasion are climatologically confirmed by the anomalies of lower-tropospheric winds, surface solar radiation and O3 vertical transport fluxes from the multi-year observation of TCs over the Northwest Pacific. It is most remarkable that the downward transport of stratospheric O3 is driven by the vertical circulation of TCs in the subtropical ocean, exerting a large impact on the atmospheric environment over CEC, while the regional O3 transport, accumulation and photochemical production control the lower troposphere over CEC with less impact of stratospheric invasion from the TCs in the tropical ocean region (Figure 8).
Based on the multi-year data of remote sensing and ground observations, the multi-year change of the 3-D tropospheric O3 anomalies over CEC induced by the TCs in the tropical and subtropical Northwest Pacific are characterized in this study with the effect degree and the dominant mechanism in atmospheric environment change (Figure 8), providing the climatology of TCs’ effect on the atmospheric environment. Further research could be desired with a longer observation period and comprehensive simulation of meteorology and O3 in the stratospheric and tropospheric atmosphere to improve our understanding of TCs’ effect on tropospheric O3 change and to generalize the meteorological mechanisms with the relative contribution of physical and chemical processes in TCs’ effect on the atmospheric environment.

Author Contributions

Conceptualization, Y.J. and T.Z.; Methodology, Y.J. and K.M.; Software, X.C.; Formal analysis, X.C.; Investigation, Y.J. and K.M.; Resources, T.Z., K.M. and Q.L.; Writing—original draft, Y.J.; Writing—review & editing, Y.J. and T.Z.; Visualization, X.C. and Q.L.; Supervision, T.Z.; Funding acquisition, Y.J. and T.Z. All authors have read and agreed to the published version of the manuscript.

Funding

This research was funded by the National Natural Science Foundation of China (42005139), the National Key Research and Development Program of China (2022YFC3701204), the Major scientific and technological special projects of Fujian Key Laboratory of Severe Weather (2020TF12), the Natural Science Foundation of Fujian Province (2022J011082, 2021J01453, 2022J01446), the Open Research Foundation of Fujian Meteorological Bureau (2020KX04) and the Special Project of Meteorological Science and Technology for Regional Coordinated Development in Southwest Fujian (2019MXN06).

Data Availability Statement

No new data were created or analyzed in this study. Data sharing is not applicable to this article.

Conflicts of Interest

The authors declare no conflicts of interest.

References

  1. Yue, X.; Unger, N. Ozone vegetation damage effects on gross primary productivity in the United States. Atmos. Chem. Phys. 2014, 14, 9137–9153. [Google Scholar] [CrossRef]
  2. Ramanathan, V.; Callis, L.; Cess, R.; Hansen, J.; Isaksen, I.; Kuhn, W.; Lacis, A.; Luther, F.; Mahlman, J.; Reck, R.; et al. Climate-chemical interactions and effects of changing atmospheric trace gases. Rev. Geophys. 1987, 25, 1441–1482. [Google Scholar] [CrossRef]
  3. De Forster, P.M.F.; Shine, K.P. Radiative forcing and temperature trends from stratospheric ozone changes. J. Geophys. Res. 1997, 102, 10841–10855. [Google Scholar] [CrossRef]
  4. Pan, L.L.; Homeyer, C.R.; Honomochi, S.; Ridley, B.A.; Weisman, M.; Barth, M.C.; Hair, J.W.; Fenn, M.A.; Butler, C.; Diskin, G.S.; et al. Thunderstorms enhance tropospheric ozone by wrapping and shedding stratospheric air. Geophys. Res. Lett. 2014, 41, 7785–7790. [Google Scholar] [CrossRef]
  5. Hidy, G.M. Ozone process insights from field experiments—Part I: Overview. Atmos. Environ. 2000, 34, 2001–2022. [Google Scholar] [CrossRef]
  6. Jenkin, M.E.; Clemitshaw, K.C. Ozone and other secondary photochemical pollutants: Chemical processes governing their formation in the planetary boundary layer. Atmos. Environ. 2000, 34, 2499–2527. [Google Scholar] [CrossRef]
  7. Schnell, J.L.; Prather, M.J. Co-occurrence of extremes in surface ozone, particulate matter, and temperature over eastern North America. Proc. Natl. Acad. Sci. USA 2017, 114, 2854–2859. [Google Scholar] [CrossRef] [PubMed]
  8. Wang, T.; Xue, L.; Brimblecombe, P.; Lam, Y.F.; Li, L.; Zhang, L. Ozone pollution in China: A review of concentrations, meteorological influences, chemical precursors, and effects. Sci. Total Environ. 2017, 575, 1582–1596. [Google Scholar] [CrossRef] [PubMed]
  9. Ni, Z.Z.; Luo, K.; Gao, Y.; Jiang, F.; Huang, C.; Fan, J.R.; Fu, J.S.; Chen, C.H. Spatial–temporal variations and process analysis of O3 pollution in Hangzhou during the G20 summit. Atmos. Chem. Phys. 2020, 20, 5963–5976. [Google Scholar] [CrossRef]
  10. Emanuel, K. Tropical cyclones. Annu. Rev. Earth Planet. Sci. 2003, 31, 75–104. [Google Scholar] [CrossRef]
  11. Jiang, Y.C.; Zhao, T.L.; Liu, J.; Xu, X.D.; Tan, C.H.; Cheng, X.H.; Bi, X.Y.; Gan, J.B.; You, J.F.; Zhao, S.Z. Why does surface ozone peak before a typhoon landing in southeast China? Atmos. Chem. Phys. 2015, 15, 13331–13338. [Google Scholar] [CrossRef]
  12. Wang, H.; Lyu, X.; Guo, H.; Wang, Y.; Zou, S.; Ling, Z.; Wang, X.; Jiang, F.; Zeren, Y.; Pan, W.; et al. Ozone pollution around a coastal region of South China Sea: Interaction between marine and continental air. Atmos. Chem. Phys. 2018, 18, 4277–4295. [Google Scholar] [CrossRef]
  13. Chen, Z.; Liu, J.; Cheng, X.; Yang, M.; Wang, H. Positive and negative influences of typhoons on tropospheric ozone over southern China. Atmos. Chem. Phys. 2021, 21, 16911–16923. [Google Scholar] [CrossRef]
  14. Chow, E.; Li, R.; Zhou, W. Influence of Tropical Cyclones on Hong Kong Air Quality. Adv. Atmos. Sci. 2018, 35, 1177–1188. [Google Scholar] [CrossRef]
  15. Huang, J.-P.; Fung, J.C.H.; Lau, A.K.H.; Qin, Y. Numerical simulation and process analysis of typhoon-related ozone episodes in Hong Kong. J. Geophys. Res. 2005, 110, D05301. [Google Scholar] [CrossRef]
  16. Hung, C.-H.; Lo, K.-C. Relationship between ambient ozone concentration changes in southwestern Taiwan and invasion tracks of tropical typhoons. Adv. Meteorol. 2015, 402976. [Google Scholar] [CrossRef]
  17. Romps, D.M.; Kuang, Z.M. Overshooting convection in tropical cyclones. Geophys. Res. Lett. 2009, 36, L09804. [Google Scholar] [CrossRef]
  18. Zhan, R.; Wang, Y. Contribution of tropical cyclones to stratosphere-troposphere exchange over the northwest Pacific: Estimation based on AIRS satellite retrievals and ERA-Interim data. J. Geophys. Res. 2012, 117, D12112. [Google Scholar] [CrossRef]
  19. Preston, A.; Fuelberg, H.; Berth, M. Simulation of chemical transport by Typhoon Mireille (1991). J. Geophys. Res. 2019, 124, 11614–11639. [Google Scholar]
  20. Roux, F.; Clark, H.; Wang, K. The influence of typhoons on atmospheric composition deduced from IAGOS measurements over Taipei. Atmos. Chem. Phys. 2020, 20, 3945–3963. [Google Scholar] [CrossRef]
  21. Bellevue, J.; Baray, J.L.; Baldy, S.; Ancellet, G.; Diab, R.D.; Ravetta, F. Simulations of stratospheric to tropospheric transport during the tropical cyclone Marlene event. Atmos. Environ. 2017, 41, 6510–6526. [Google Scholar] [CrossRef]
  22. Das, S. A new perspective on MST radar observation of stratospheric intrusions into troposphere associated with tropical cyclone. Geophys. Res. Lett. 2009, 36, L15821. [Google Scholar] [CrossRef]
  23. Das, S.; Sijikumar, S.; Uma, K. Further investigation on stratospheric air intrusion into the troposphere during the episode of tropical cyclone: Numerical simulation and MST radar observations. Atmos. Res. 2011, 101, 928–937. [Google Scholar] [CrossRef]
  24. Jenkins, G.J.; Robjhon, M.L.; Reyes, A.; Valentine, A.; Neves, L. Elevated middle and upper troposphere ozone observed downstream of Atlantic tropical cyclones. Atmos. Environ. 2015, 118, 78–86. [Google Scholar] [CrossRef]
  25. Xu, W.; Rutledge, S.A.; Zhang, W. Relationships between total lightning, deep convection, and tropical cyclone intensity change. J. Geophys. Res. 2017, 122, 7047–7063. [Google Scholar] [CrossRef]
  26. Tu, J.; Chou, C.; Chu, P. The abrupt shift of typhoon activity in the vicinity of Taiwan and its association with western North Pacific–east Asian climate change. J. Clim. 2009, 22, 3617–3628. [Google Scholar] [CrossRef]
  27. Lam, Y.F.; Cheung, H.M.; Ying, C.C. Impact of tropical cyclone track change on regional air quality. Sci. Total Environ. 2018, 610–611, 1347–1355. [Google Scholar] [CrossRef]
  28. Lee, Y.C.; Calori, G.; Hills, P.; Carmichael, G.R. Ozone episodes in urban Hong Kong 1994–1999. Atmos. Environ. 2002, 36, 1957–1968. [Google Scholar] [CrossRef]
  29. Huang, J.-P.; Fung, J.C.H.; Lau, A.K.H. Integrated processes analysis and systematic meteorological classification of ozone episodes in Hong Kong. J. Geophys. Res. 2006, 111, D20309. [Google Scholar] [CrossRef]
  30. Yang, J.X.; Lau, A.K.H.; Fung, J.C.H.; Zhou, W.; Wenig, M. An air pollution episode and its formation mechanism during the tropical cyclone Nuris’s landfall in a coastal city of south China. Atmos. Environ. 2012, 54, 746–753. [Google Scholar] [CrossRef]
  31. Wei, X.; Lam, K.-S.; Cao, C.; Li, H.; He, J. Dynamics of the Typhoon Haitang related high ozone episode over Hong Kong. Adv. Meteorol. 2016, 2016, 6089154. [Google Scholar] [CrossRef]
  32. Feng, Y.; Wang, A.; Wu, D.; Xu, X. The influence of tropical cyclone Melor on PM10 concentrations during an aerosol episode over the Pearl River Delta region of China: Numerical modeling versus observational analysis. Atmos. Environ. 2007, 41, 4349–4365. [Google Scholar] [CrossRef]
  33. Dee, D.P.; Uppala, S.M.; Simmons, A.J.; Berrisford, P.; Poli, P.; Kobayashi, S.; Andrae, U.; Balmasede, M.A.; Balsamo, G.; Bauer, P.; et al. The ERA-Interim Reanalysis: Configuration and Performance of the Data Assimilation System. Q. J. Royal Meteorol. Soc. 2011, 137, 553–597. [Google Scholar] [CrossRef]
  34. Hersbach, H.; Dee, D.P. ERA-5 reanalysis is in production. ECMWF Newsl. 2016, 147, 7. [Google Scholar]
  35. Liu, X.; Bhartia, P.K.; Chance, K.; Spurr, R.J.D.; Kurosu, T.P. Ozone profile retrievals from the Ozone Monitoring Instrument. Atmos. Chem. Phys. 2010, 10, 2521–2537. [Google Scholar] [CrossRef]
  36. Shen, L.; Jacob, D.J.; Liu, X.; Huang, G.-Y.; Li, K.; Liao, H.; Wang, T. An evaluation of the ability of the Ozone Monitoring Instrument (OMI) to observe boundary layer ozone pollution across China: Application to 2005–2017 ozone trends. Atmos. Chem. Phys. 2019, 19, 6551–6560. [Google Scholar] [CrossRef]
  37. Ying, M.; Zhang, W.; Yu, H.; Lu, X.; Feng, J.; Fan, Y.; Zhu, Y.; Chen, D. An overview of the China Meteorological Administration tropical cyclone database. J. Atmos. Oceanic Technol. 2014, 31, 287–301. [Google Scholar] [CrossRef]
  38. Lu, X.Q.; Yu, H.; Ying, M.; Zhao, B.K.; Zhang, S.; Lin, L.M.; Bai, L.N.; Wan, R.J. Western North Pacific tropical cyclone database created by the China Meteorological Administration. Adv. Atmos. Sci. 2021, 38, 690–699. [Google Scholar] [CrossRef]
  39. Shu, L.; Xie, M.; Wang, T.; Gao, D.; Chen, P.; Han, Y.; Li, S.; Zhuang, B.; Li, M. Integrated studies of a regional ozone pollution synthetically affected by subtropical high and typhoon system in the Yangtze River Delta region, China. Atmos. Chem. Phys. 2016, 16, 15801–15819. [Google Scholar] [CrossRef]
  40. Varotsos, C.A.; Efstathiou, M.N.; Cracknell, A.P. On the temporal evolution of the tropical stratospheric ozone. J. Atmos. Sol.-Terr. Phys. 2017, 157–158, 1–5. [Google Scholar] [CrossRef]
Figure 1. (a) Locations of 154 cities with observational sites (black dots) over the CEC region (the red dashed box), the terrain heights (MSL, m, a.s.l.) in CEC and the surrounding East Asian area, and the three regions R1 (108–123°E, 10–21°N), R2 (123–139°E, 25–38°N) and R3 (123–139°E, 13–25°N) over the Northwest Pacific denoted with black solid boxes. The TC circulation is sketched in a white color; (b) the Northwest Pacific TC’s tracks are represented as grey lines, along with every 12 h location of TCs (round dots), where the size and color of dot represent the intensity of TCs; (c) the TC numbers over the Pacific regions R1, R2 and R3.
Remotesensing 16 01178 g001
Figure 2. The monthly averages of MDA8-O3 concentrations (ppb) from June to October during the days with TCs in the Northwestern Pacific regions (a) R1, (b) R2, and (c) R3 (orange columns) and all days in the TC season (green column), which are averaged in 2015–2019 over the CEC region.
Remotesensing 16 01178 g002
Figure 3. Spatial distribution of surface O3 MDA8 (ppb) anomalies at 154 cities over CEC during TCs over the Northwest Pacific regions R1 (a), R2 (b) and R3 (c) in JJASO over 2015–2019.
Remotesensing 16 01178 g003
Figure 4. The anomalous percentages (%) of O3 horizontal distribution at (a,d,g) 500–700 hPa, (b,e,h) 300–500 hPa, (c,f,i) 200–300 hPa, for the TCs in (ac) R1, (df) R2 and (gi) R3, based on JJASO mean in 2015–2019. The daily O3 concentrations of the OMI L2 global dataset (OMO3PR) were interpolated as horizontal 0.75° × 0.75° grids within 105–135°E and 13–40°N for calculating the TC days mean and monthly mean. The observed column concentration (DU) of O3 at each layer from the OMO3PR data was converted to the average volume concentration (ppb) with Formula (1) in Section 2.2 for this study.
Remotesensing 16 01178 g004
Figure 5. The anomalous wind vectors (arrows) and wind speed (shaded colors) at 850 hPa and mean 500 hPa geopotential height (blue isolines in unit of gpkm) over CEC and Northwest Pacific region during the TC days of (a) R1, (b) R2 and (c) R3 in JJASO, 2010–2019.
Remotesensing 16 01178 g005
Figure 6. The distribution of anomalous total cloud cover (TCC, unit: % in contour lines) and surface solar radiation (SSRD, unit: J m−2, presented by shaded colors) over CEC and the Northwest Pacific during the TC days of (a) R1, (b) R2 and (c) R3 in JJASO (June–October), 2010–2019.
Remotesensing 16 01178 g006
Figure 7. O3 vertical transport fluxes (μg m−2 s−1) are averaged over the CEC regions at 200 hPa (blue boxes), 500 hPa (dark grey boxes), 700 hPa (grey boxes) and 850 hPa (red boxes) with TCs in the Northwest Pacific regions R1, R2 and R3 during 2010–2019. The range of the boxes represents the range of 25–75th percentiles, and the top and bottom of the lines out of boxes represent range of the 10th and 90th percentiles. The horizontal lines and square points inside the boxes are the median and mean values of vertical O3 transport flux.
Remotesensing 16 01178 g007
Figure 8. A diagram of the TCs in (a) the tropical and (b) subtropical Northwest Pacific affecting the near-surface O3 significantly positive (brown circle), slightly positive (red circle) and negative anomalies (blue circle) over CEC, and the meteorological mechanisms identified with vertical transport of stratospheric O3 intrusion, strong solar radiation for photochemical O3 production and clean (polluted) air advection for O3 horizontal transport in the lower troposphere.
Remotesensing 16 01178 g008
Disclaimer/Publisher’s Note: The statements, opinions and data contained in all publications are solely those of the individual author(s) and contributor(s) and not of MDPI and/or the editor(s). MDPI and/or the editor(s) disclaim responsibility for any injury to people or property resulting from any ideas, methods, instructions or products referred to in the content.

