


A Texture Enhancement Method for Oceanic Internal Wave Synthetic Aperture Radar Images Based on Non-Local Mean Filtering and Texture Layer Enhancement


Abstract
1. Introduction
- (1)
- The proposed method still employs the NLM filtering for speckle noise suppression. However, this paper effectively verifies the excellent performance of the NLM filtering in denoising and preserving texture features through richer comparative experiments. This fully demonstrates the suitability of using the NLM filtering for denoising internal wave SAR images.
- (2)
- The TLE algorithm is proposed in this paper to enhance the textures of internal waves. The TLE algorithm has stronger specificity for the texture features of oceanic internal waves in SAR images compared to the MSR algorithm. As a result, it has a more significant enhancement effect on internal wave textures.
- (3)
- The MSR algorithm alters the zero-frequency component of the image, which in turn affects the overall brightness of the image and distorts image information to some extent. In contrast, the TLE algorithm has minimal impact on the overall brightness of the image, preserving its real brightness and effectively addressing the main shortcomings of the MSR algorithm.
2. Materials and Methods
2.1. Characteristics of Oceanic Internal Wave SAR Images
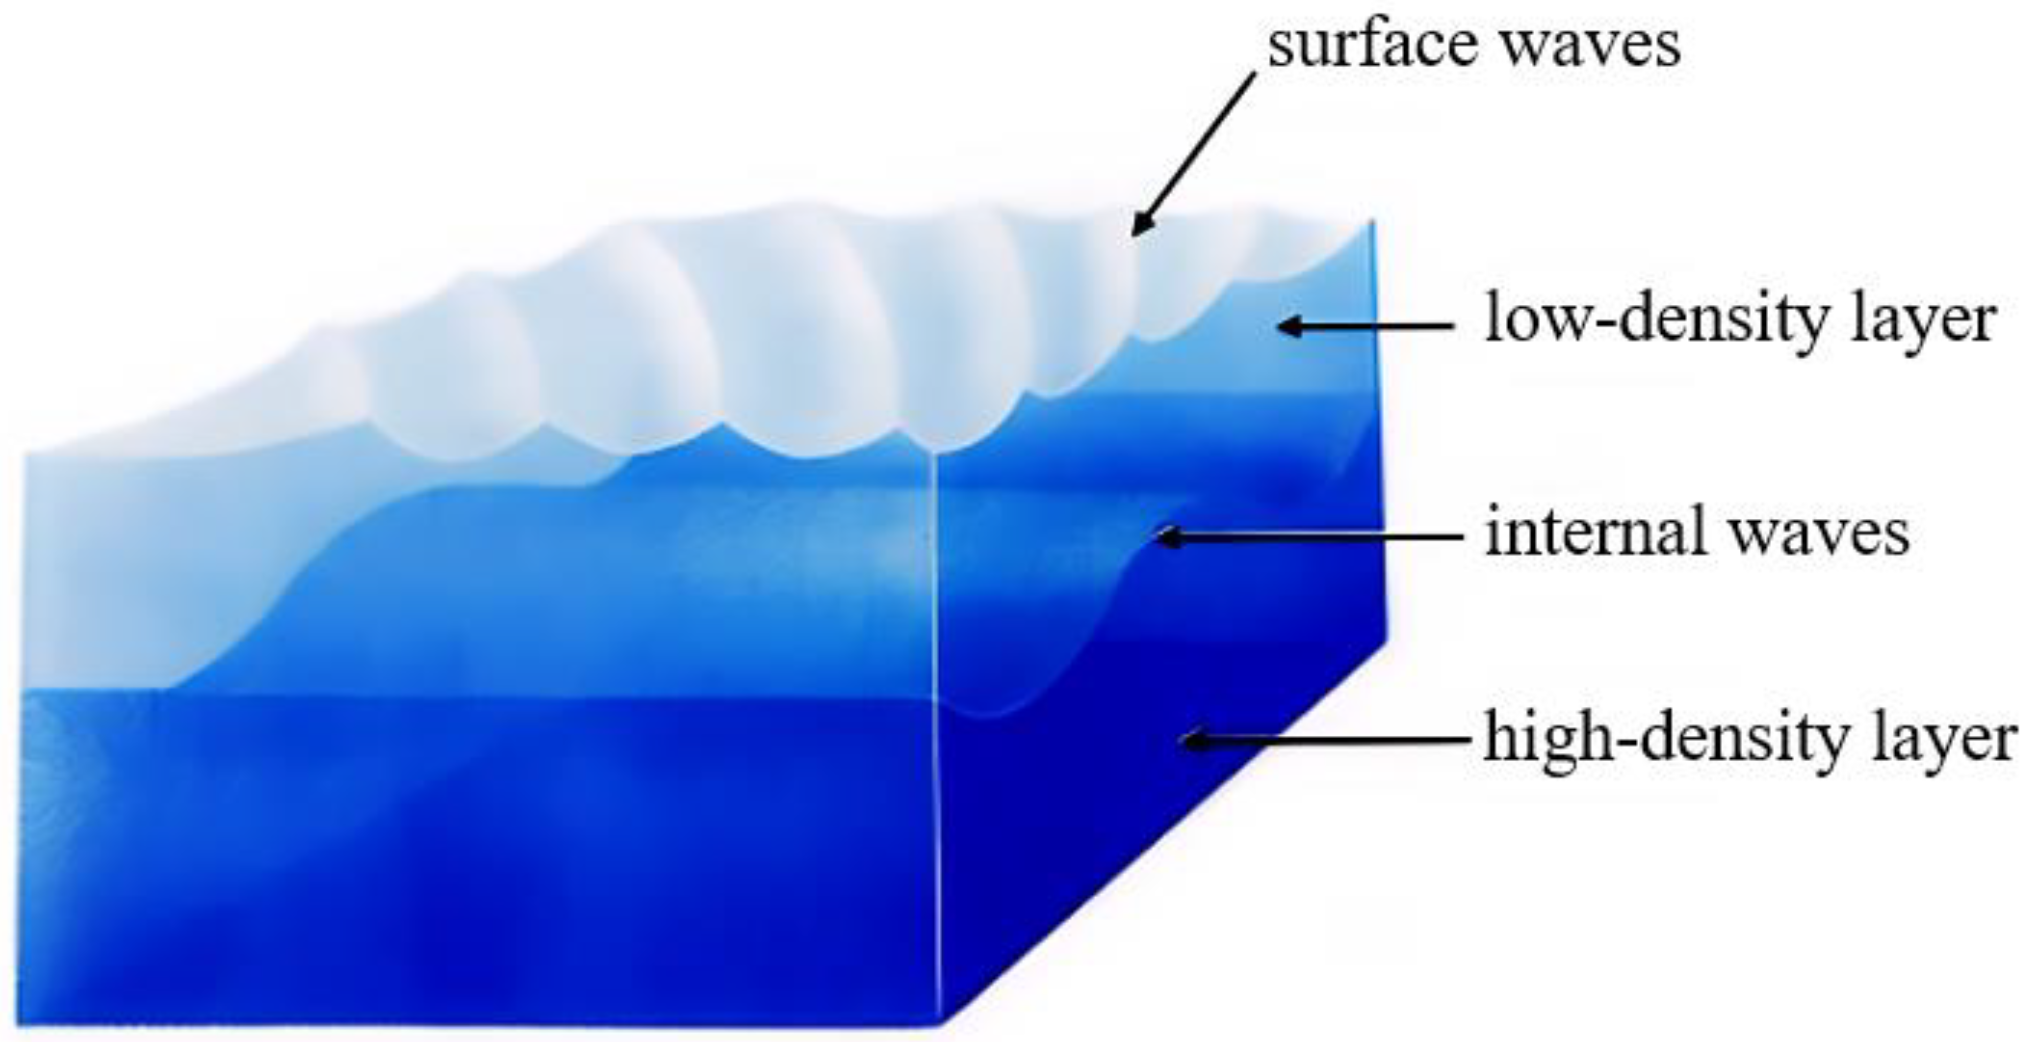
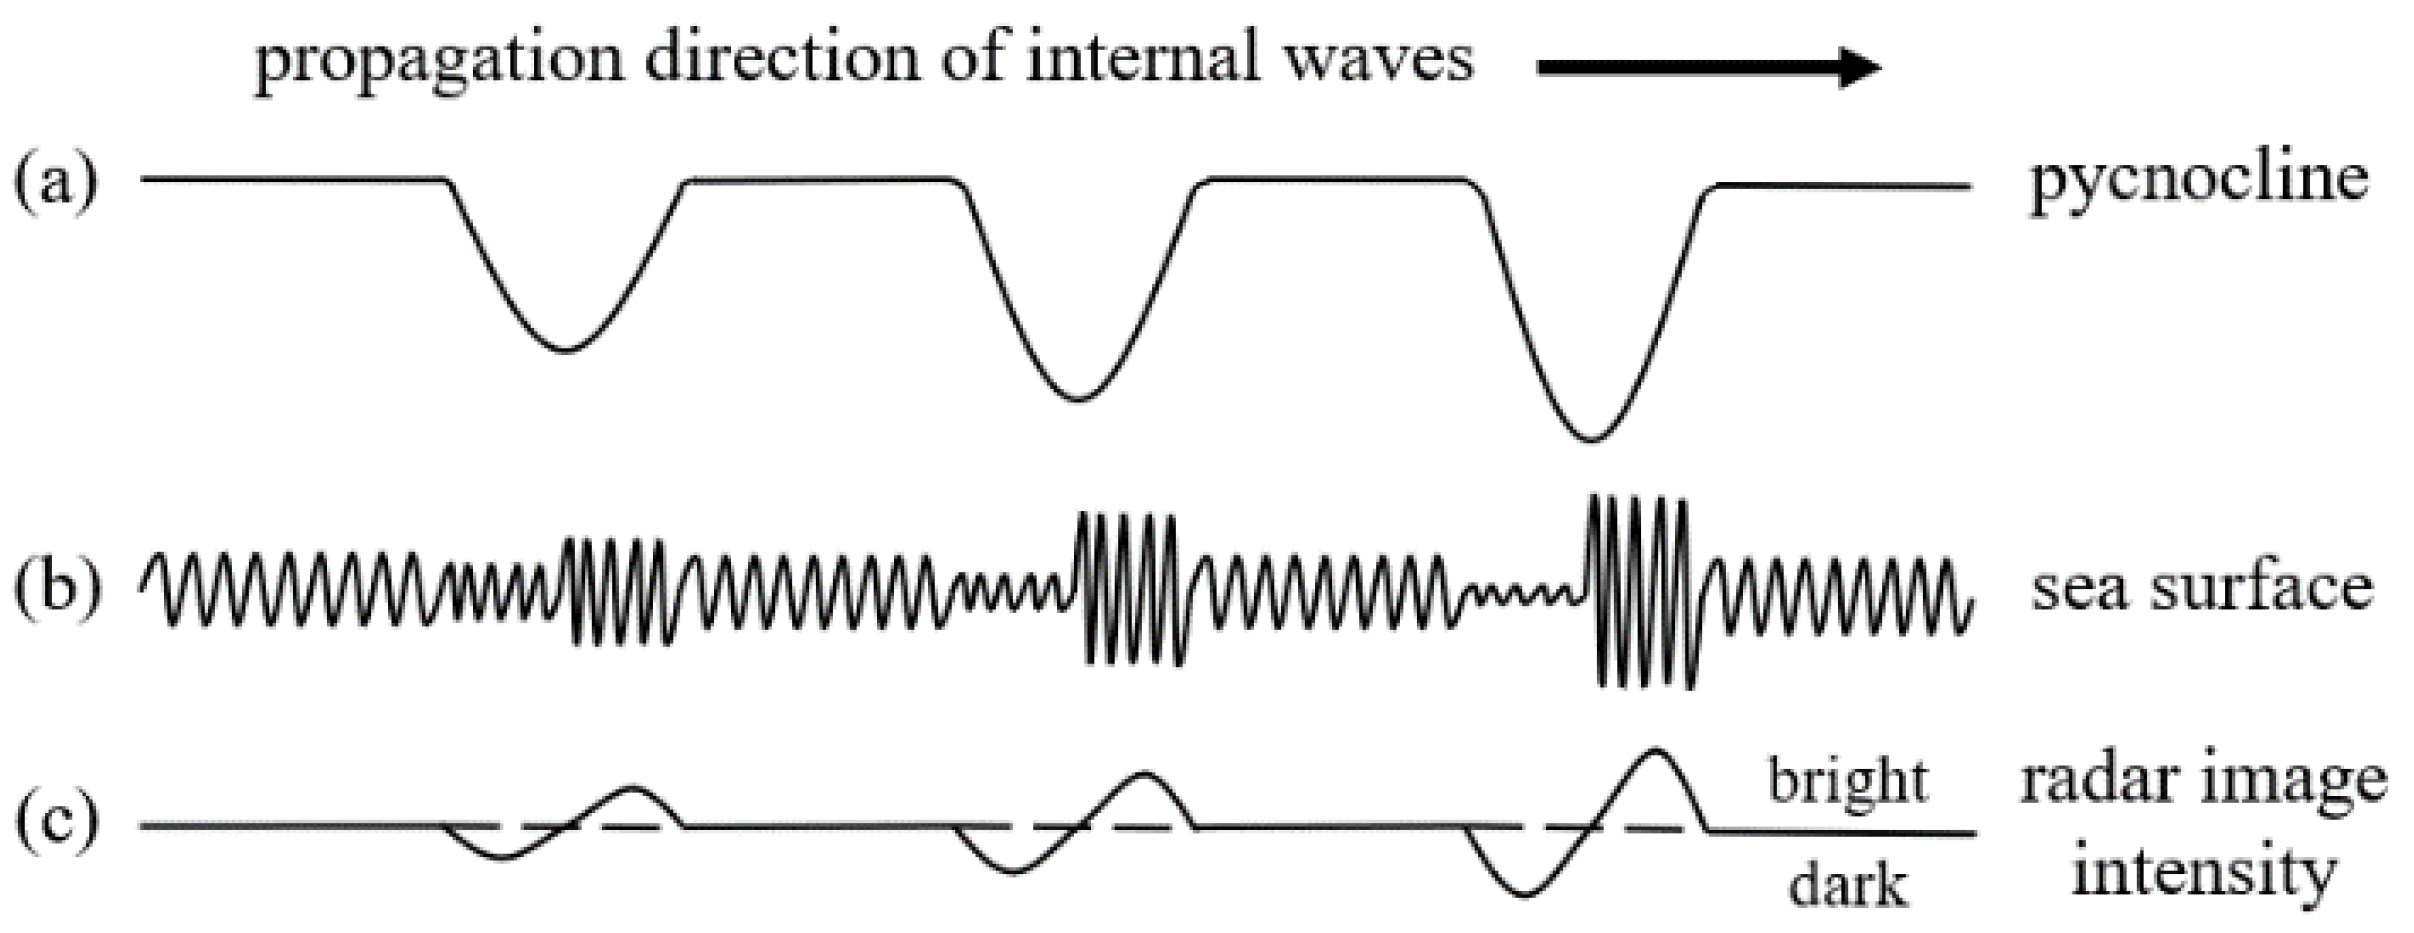
2.1.1. Formation Mechanism of Oceanic Internal Waves
2.1.2. Characteristics of Oceanic Internal Wave SAR Images
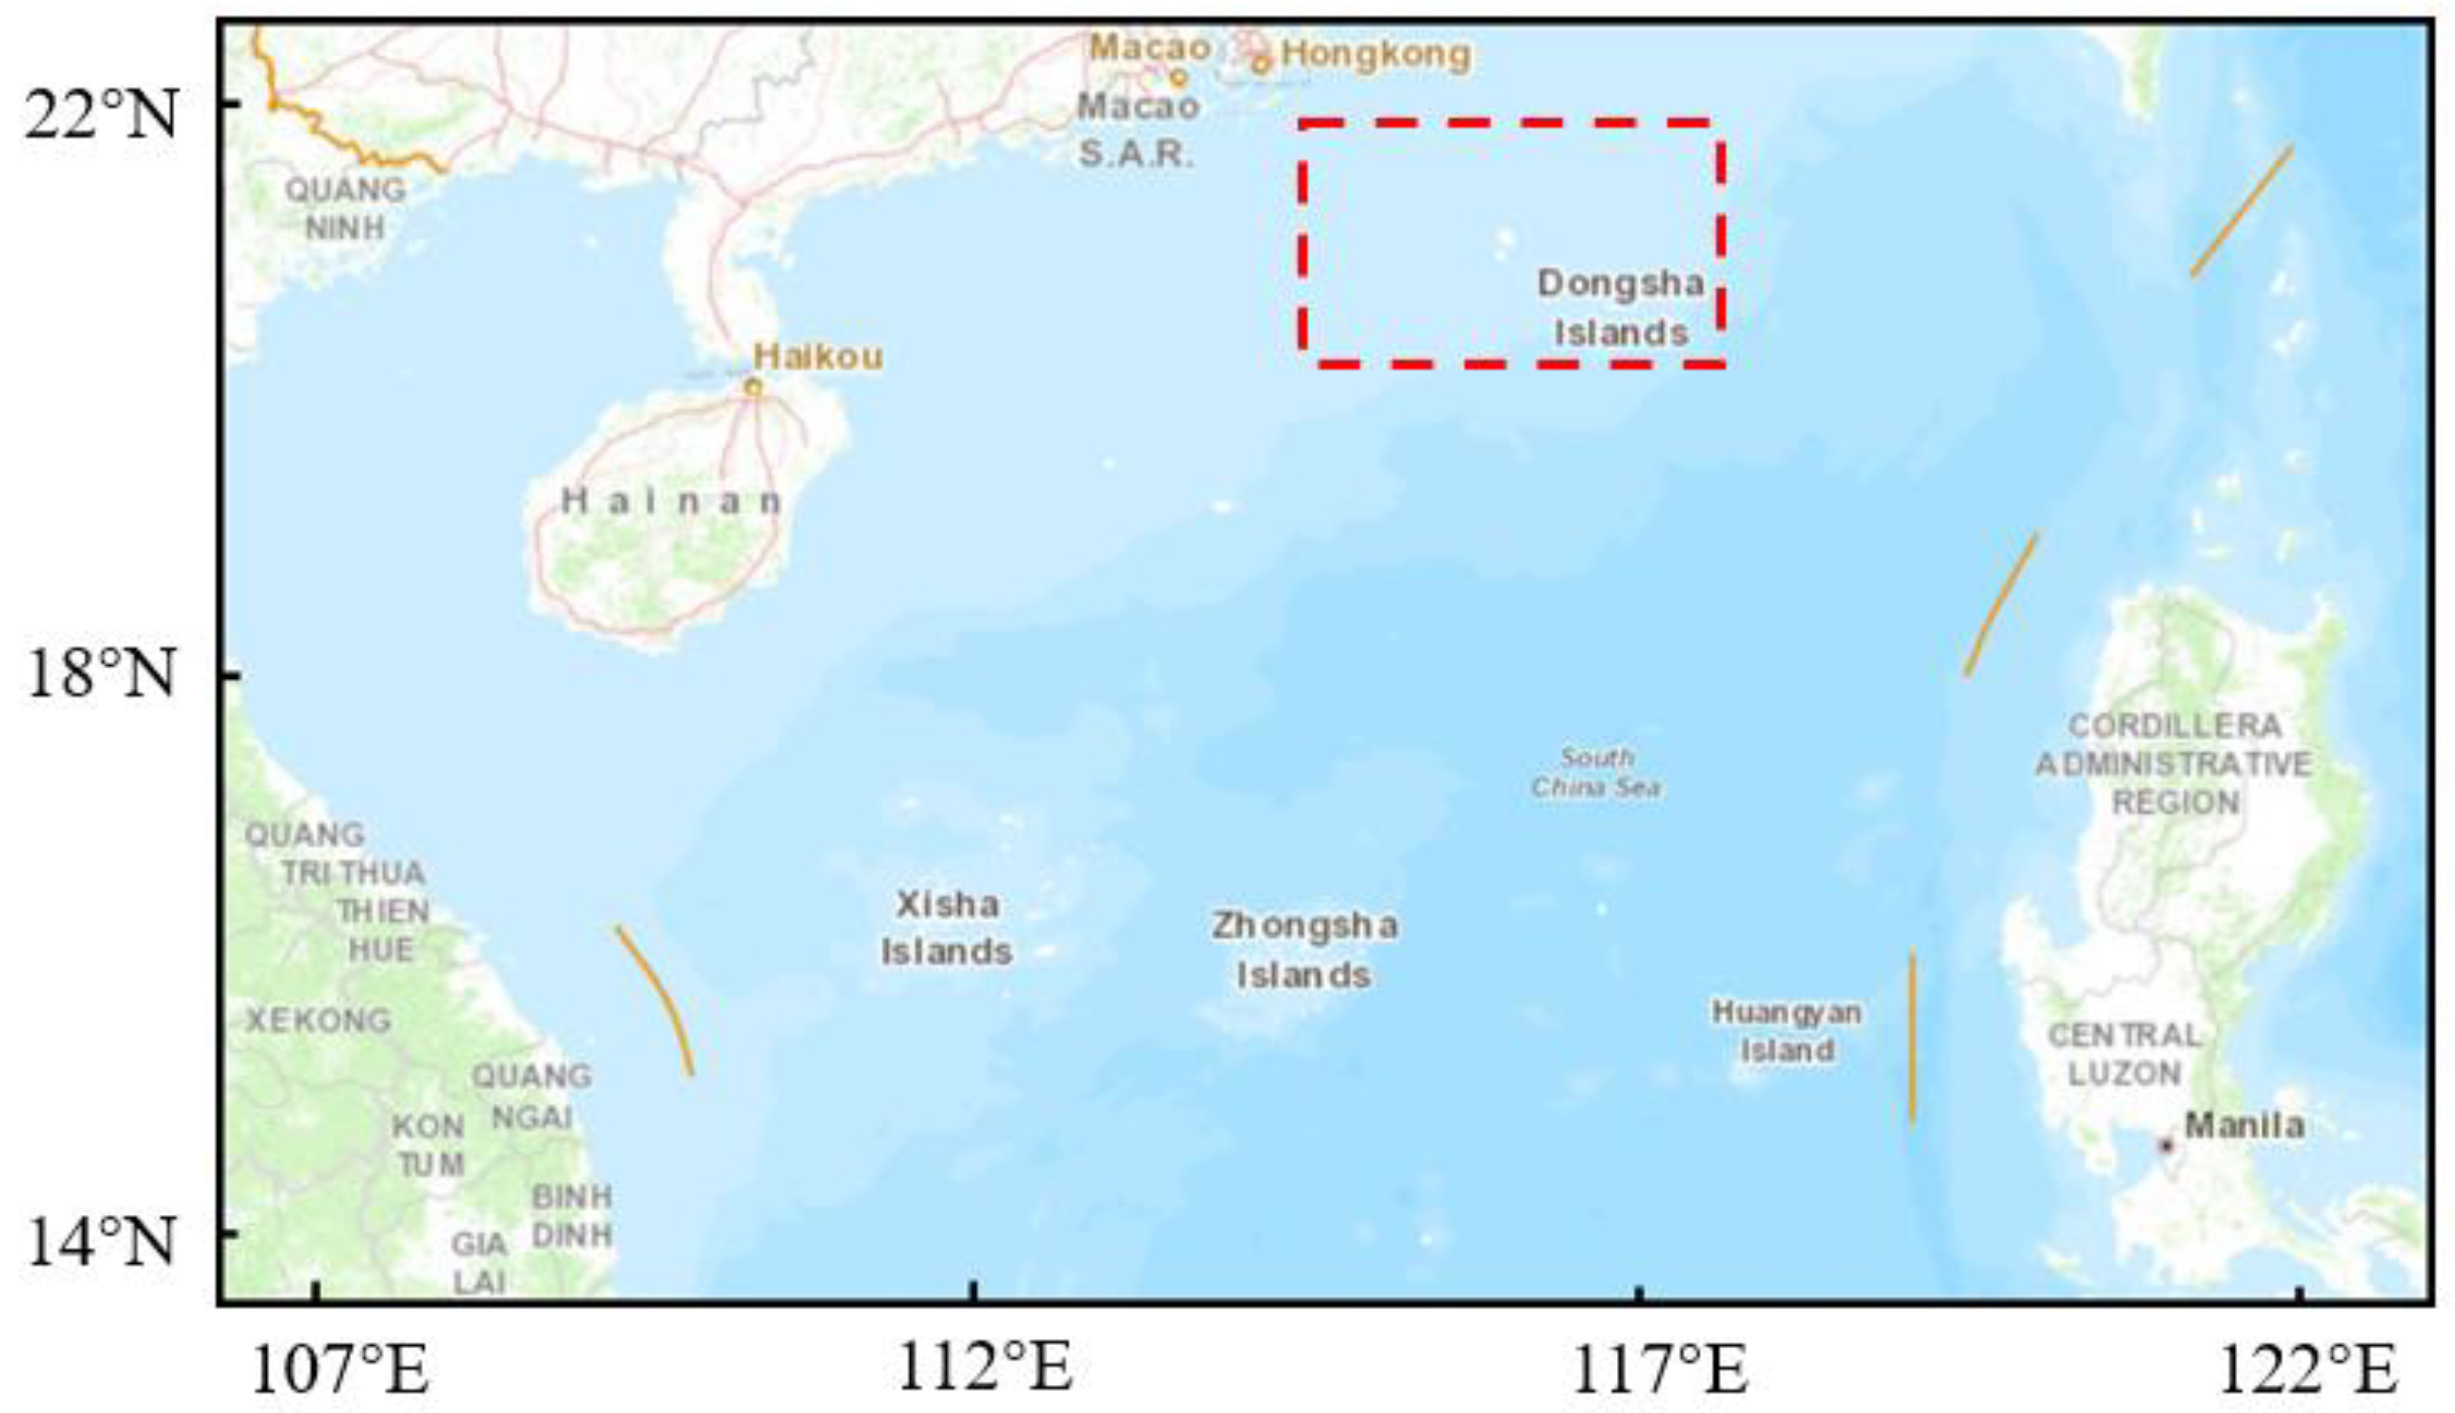
2.2. Data Introduction
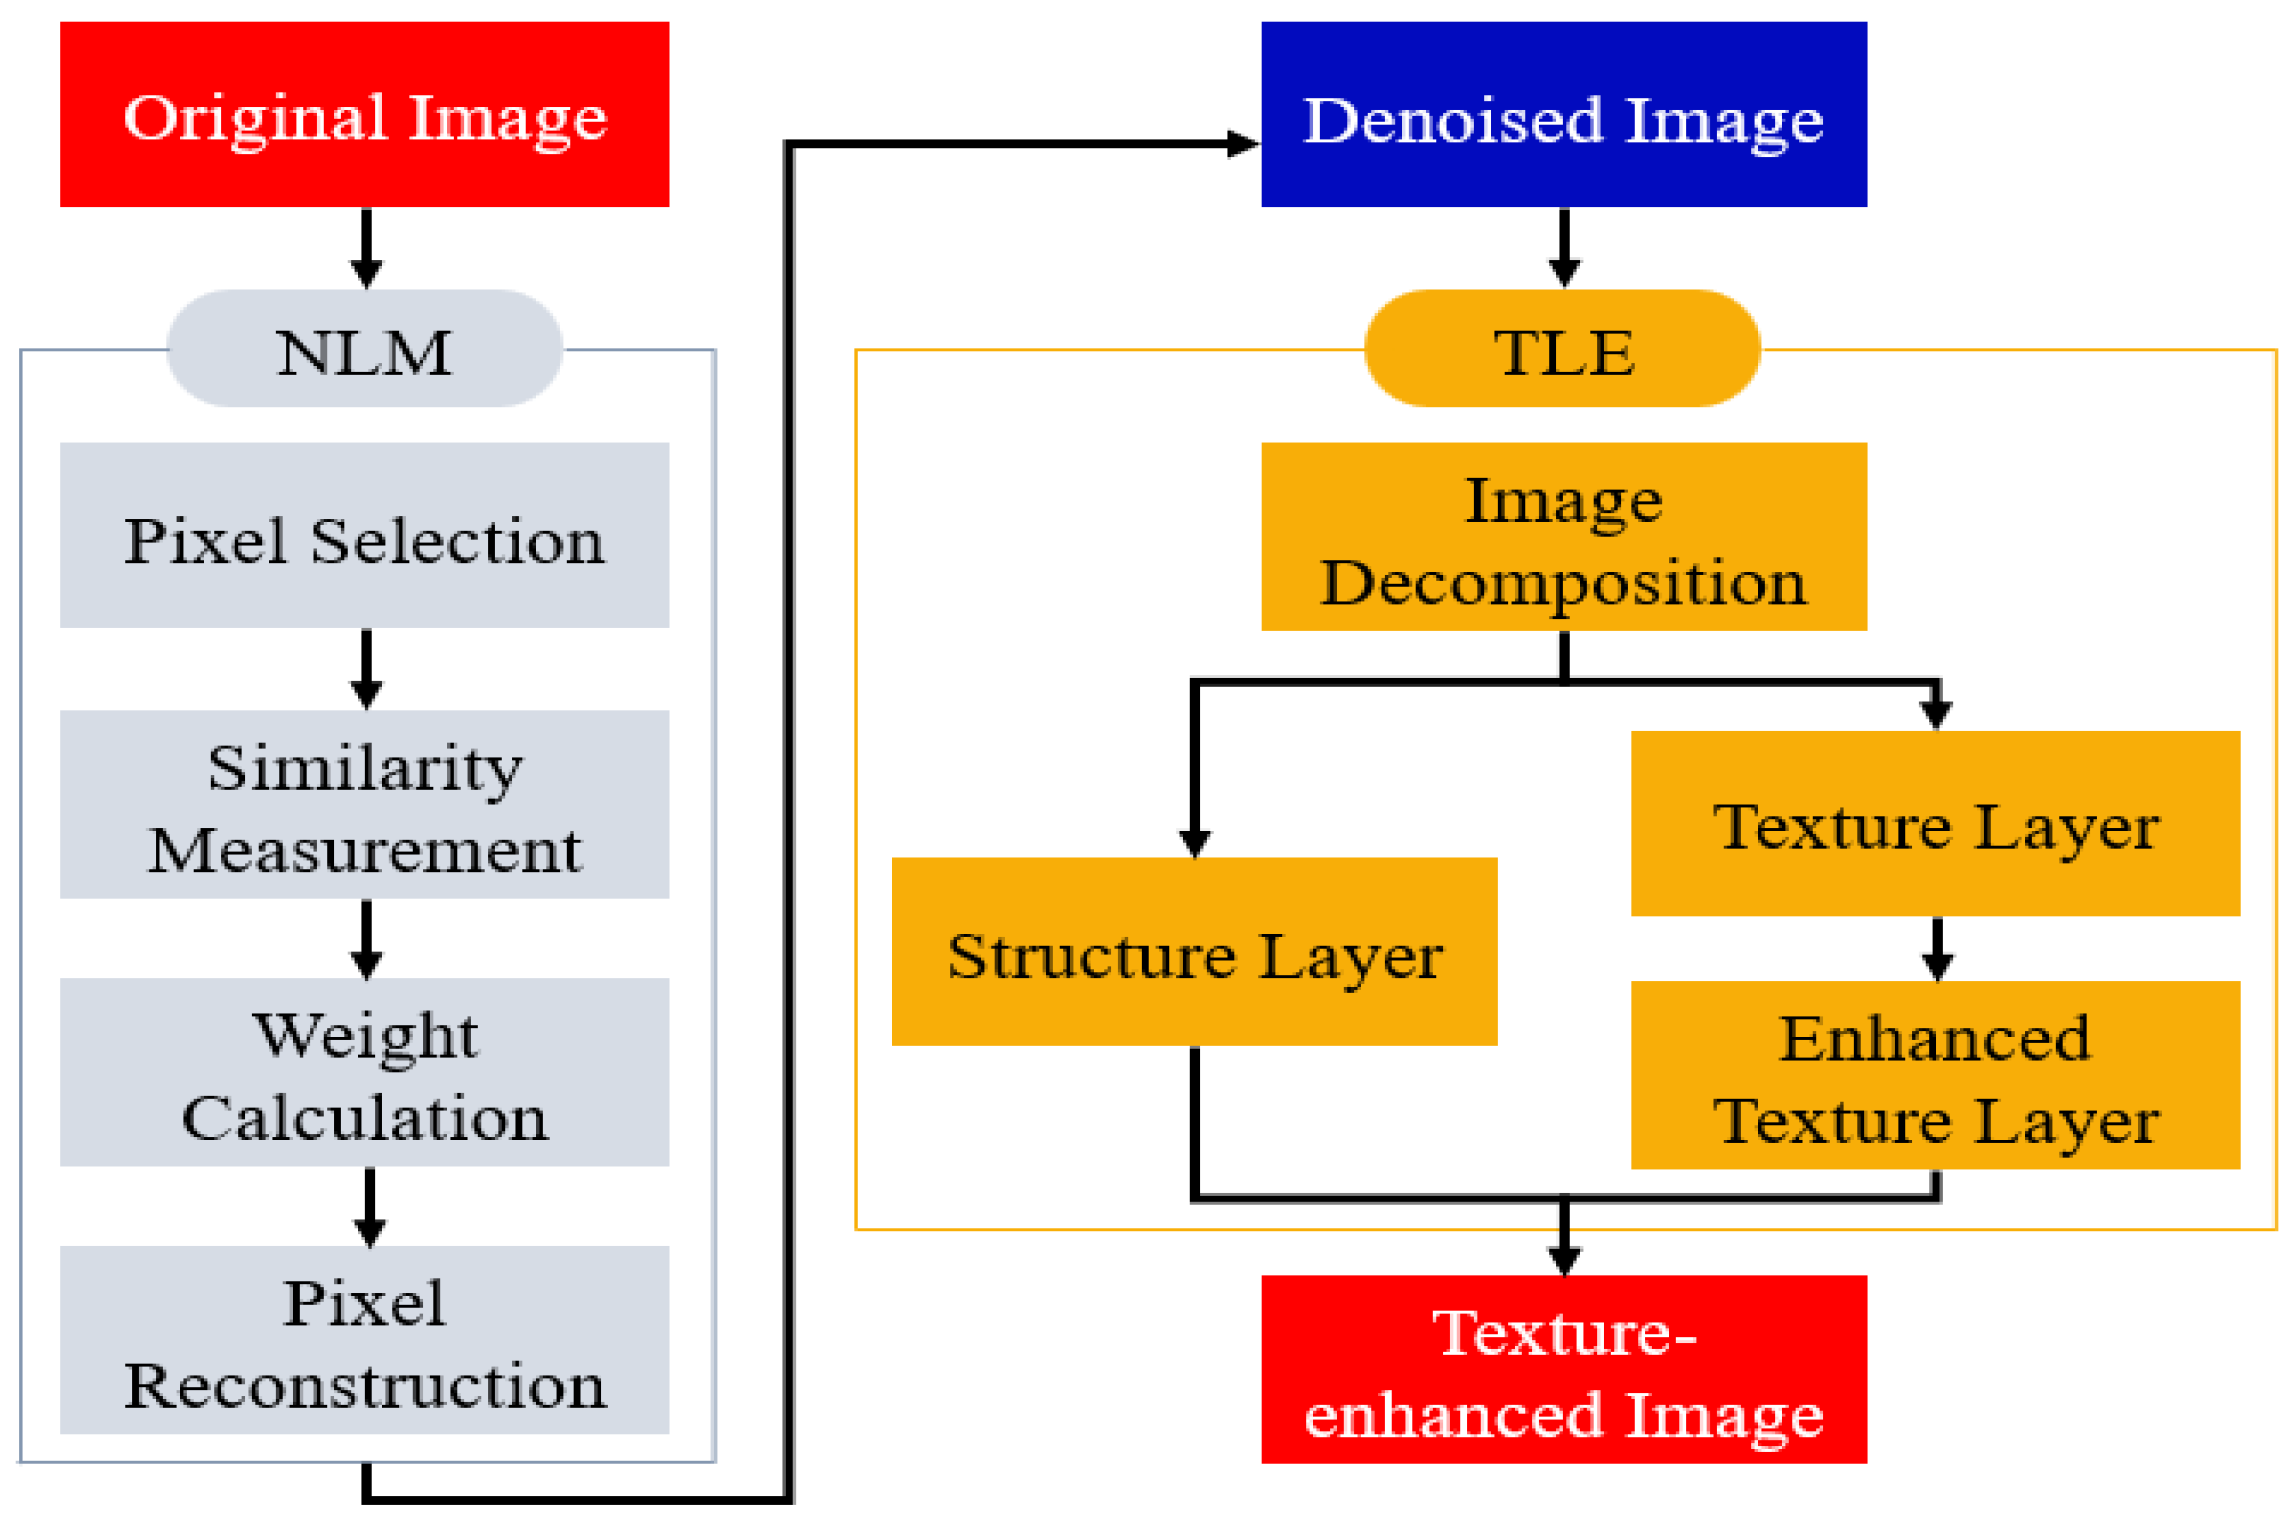
2.3. Texture Enhancement Method
2.3.1. Non-Local Mean Filtering
2.3.2. Texture Layer Enhancement
- Separation of Structure Layer and Texture Layer
- 2.
- Texture Layer Enhancement
2.4. Image Quality Evaluation
3. Results
3.1. Texture Layer Enhancement Experiments
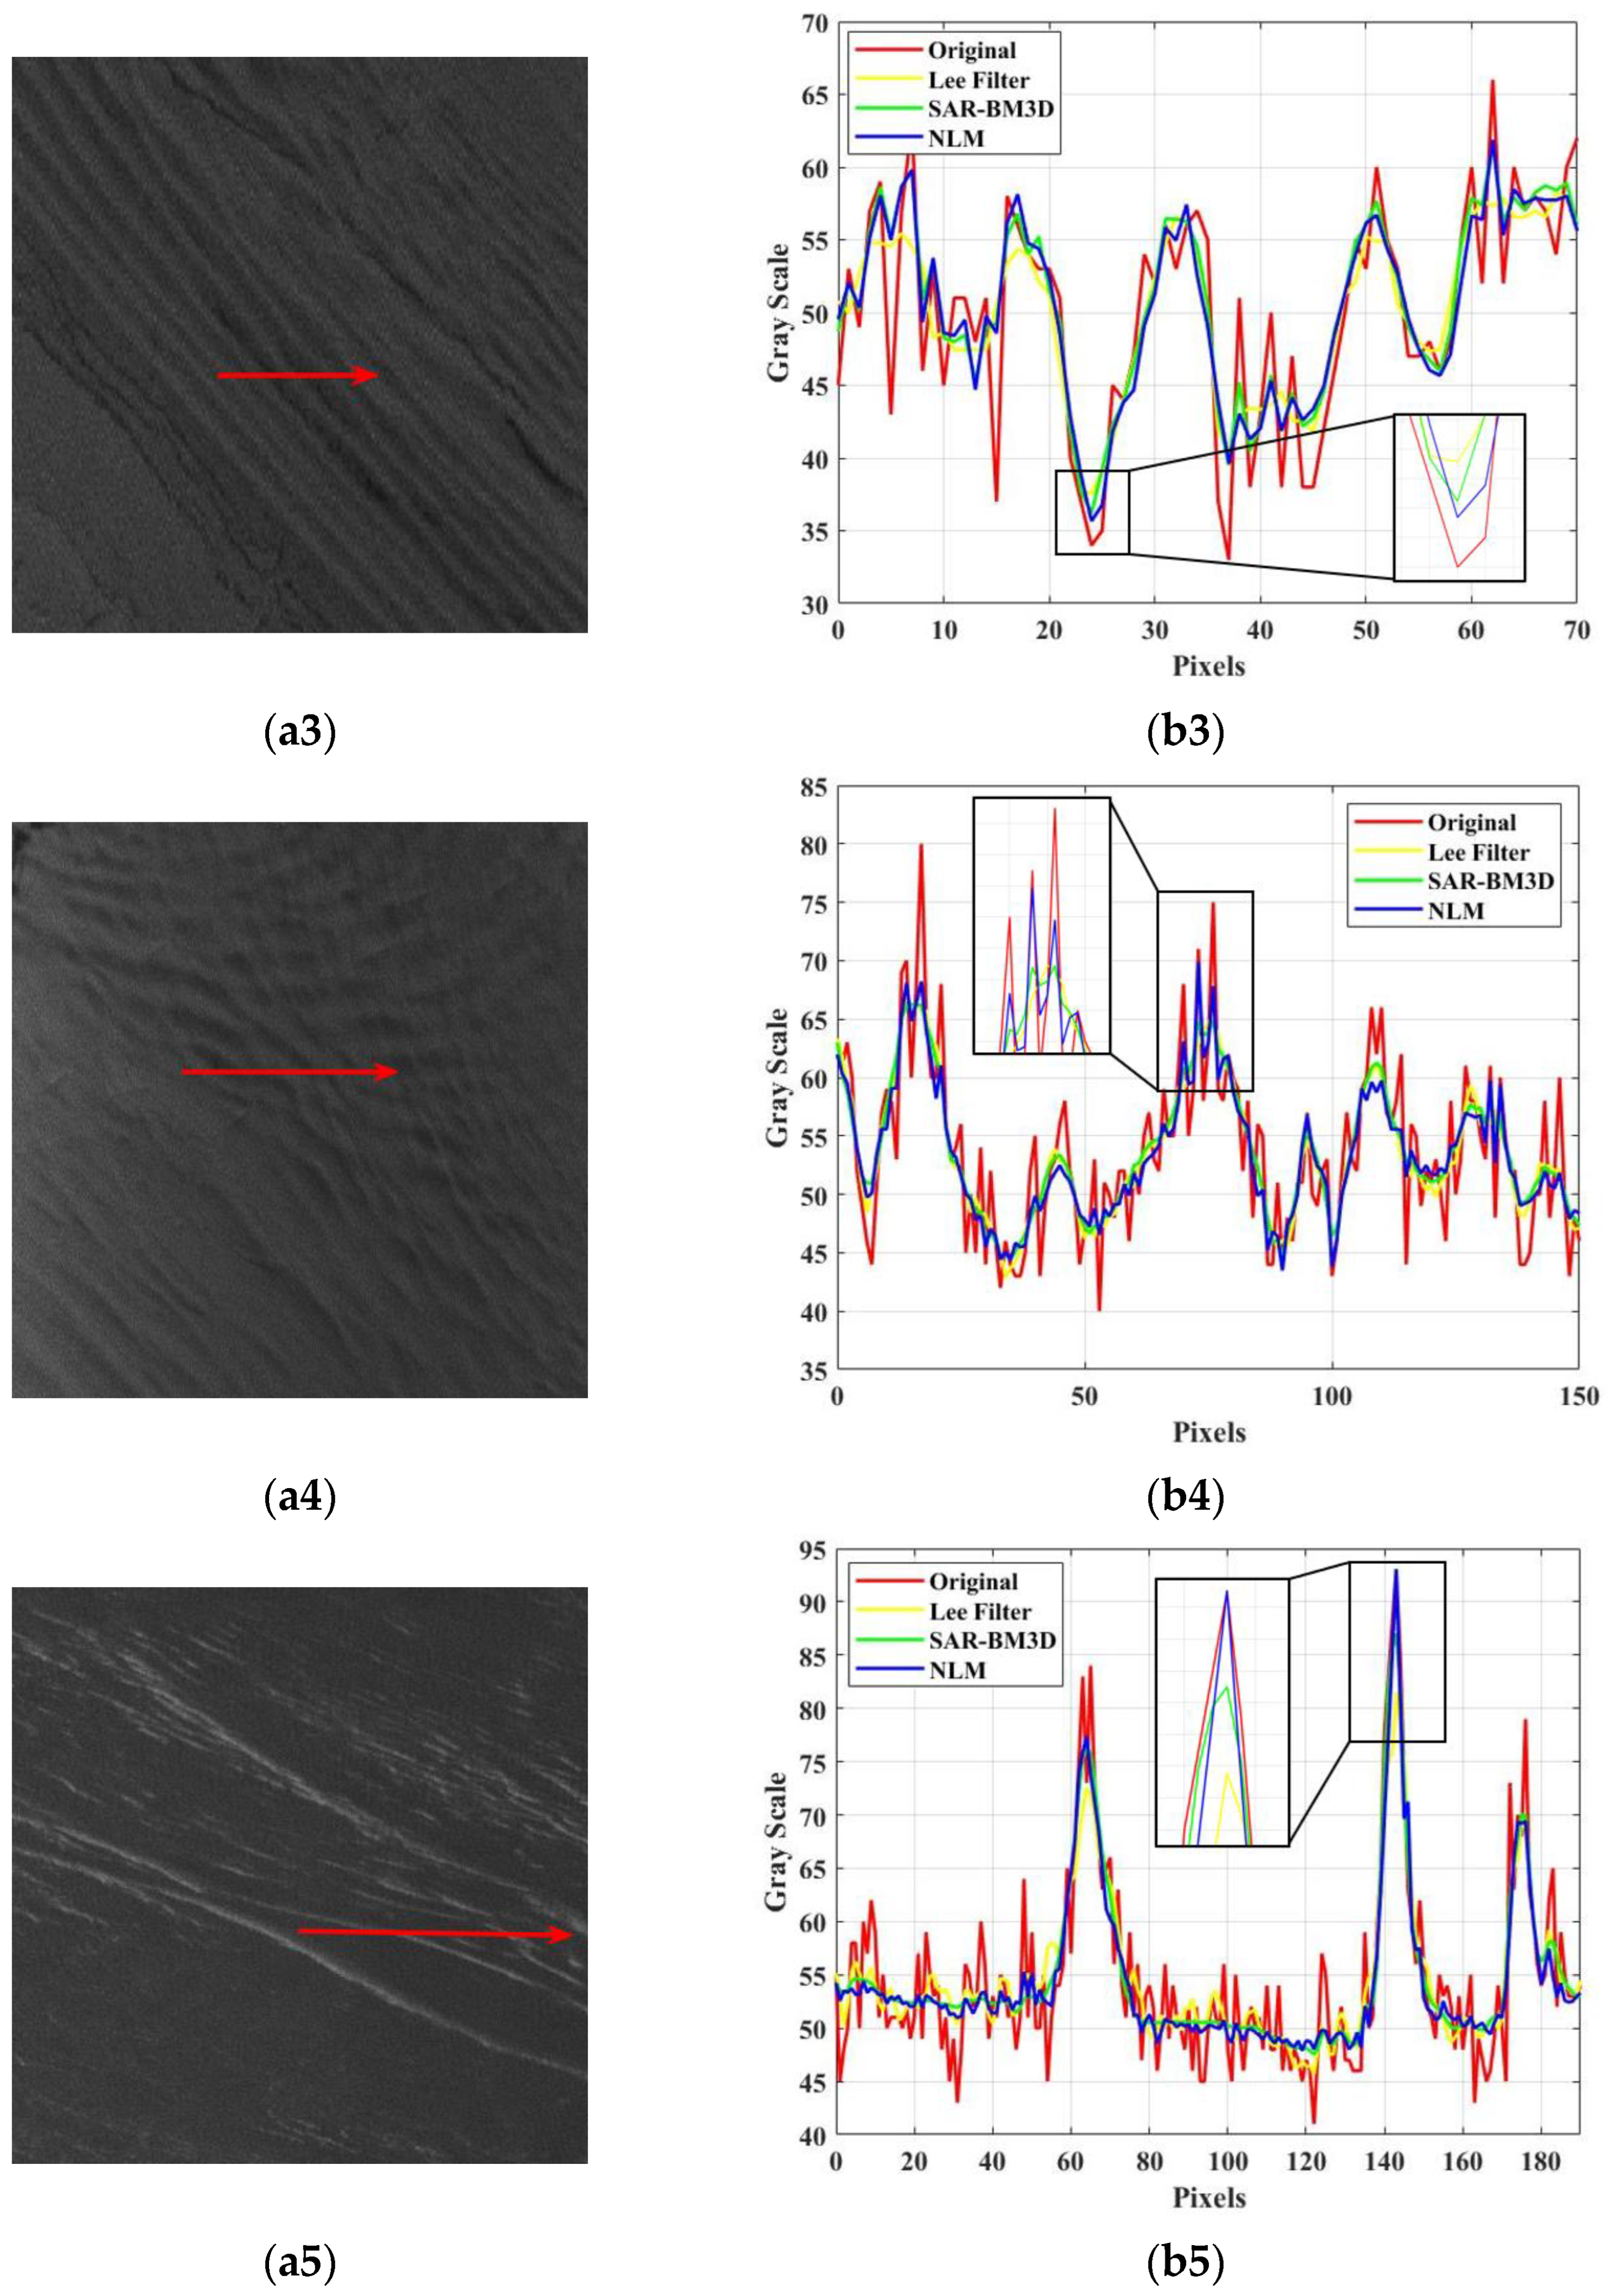
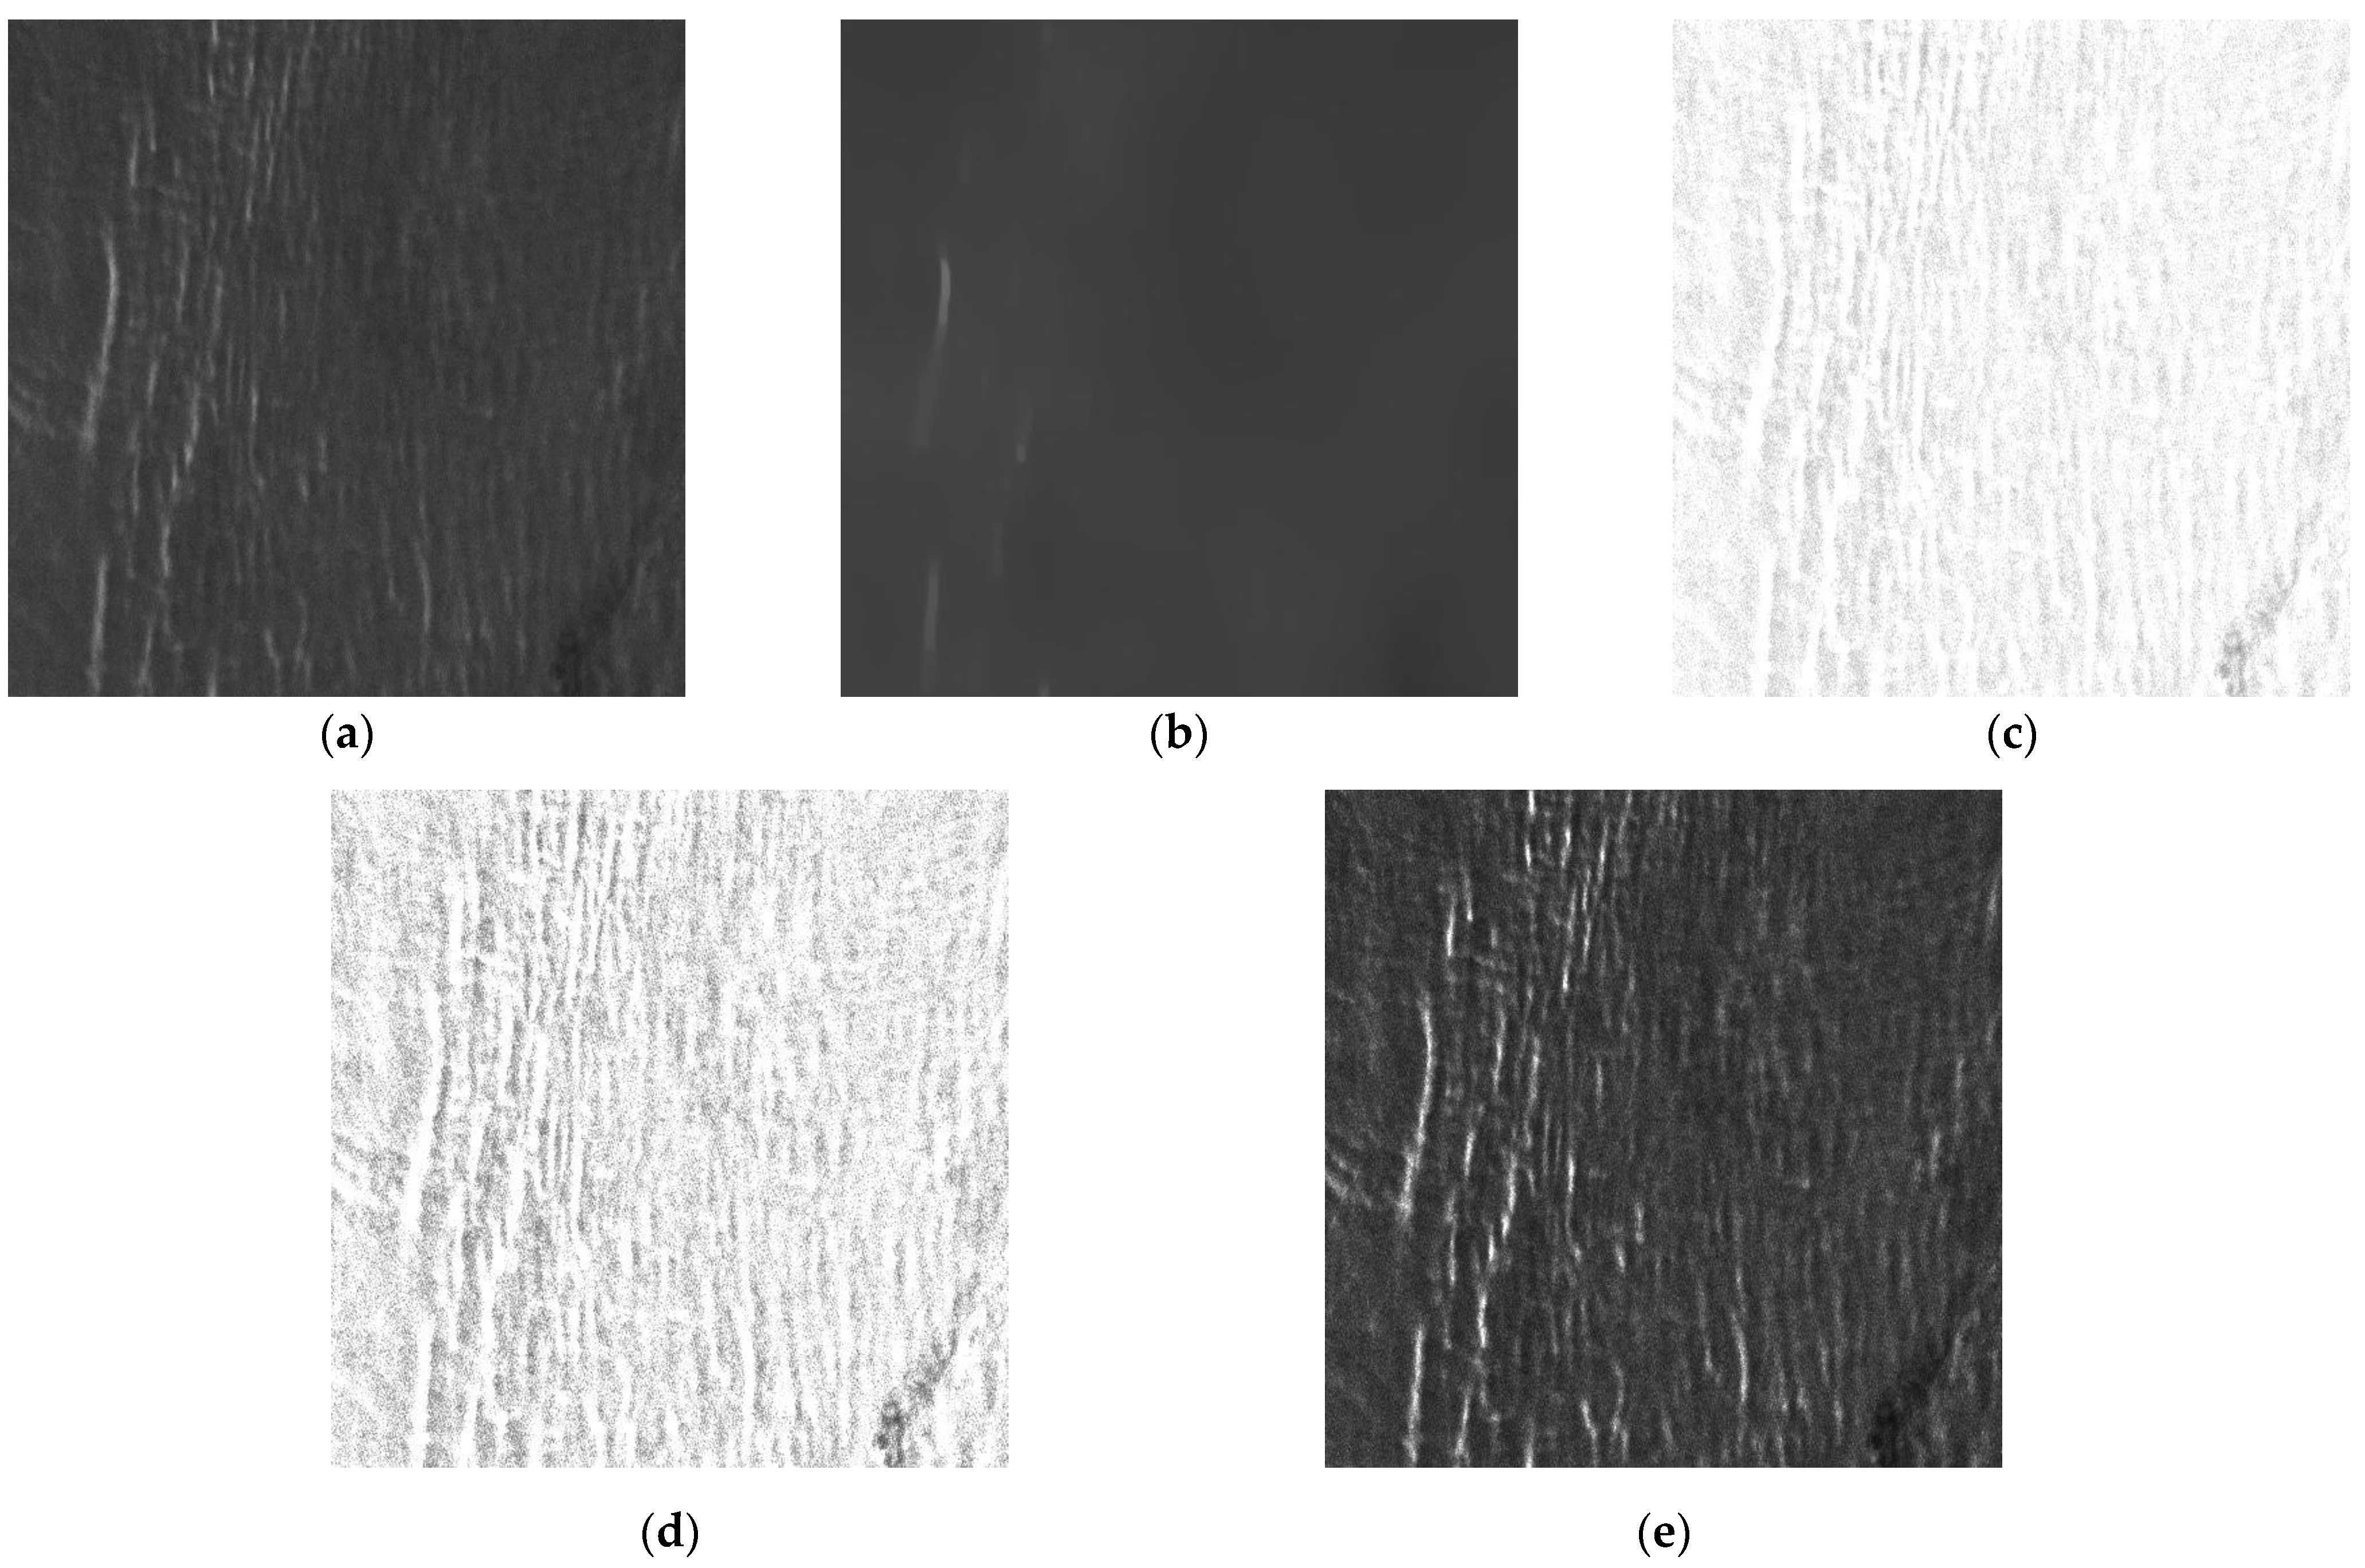
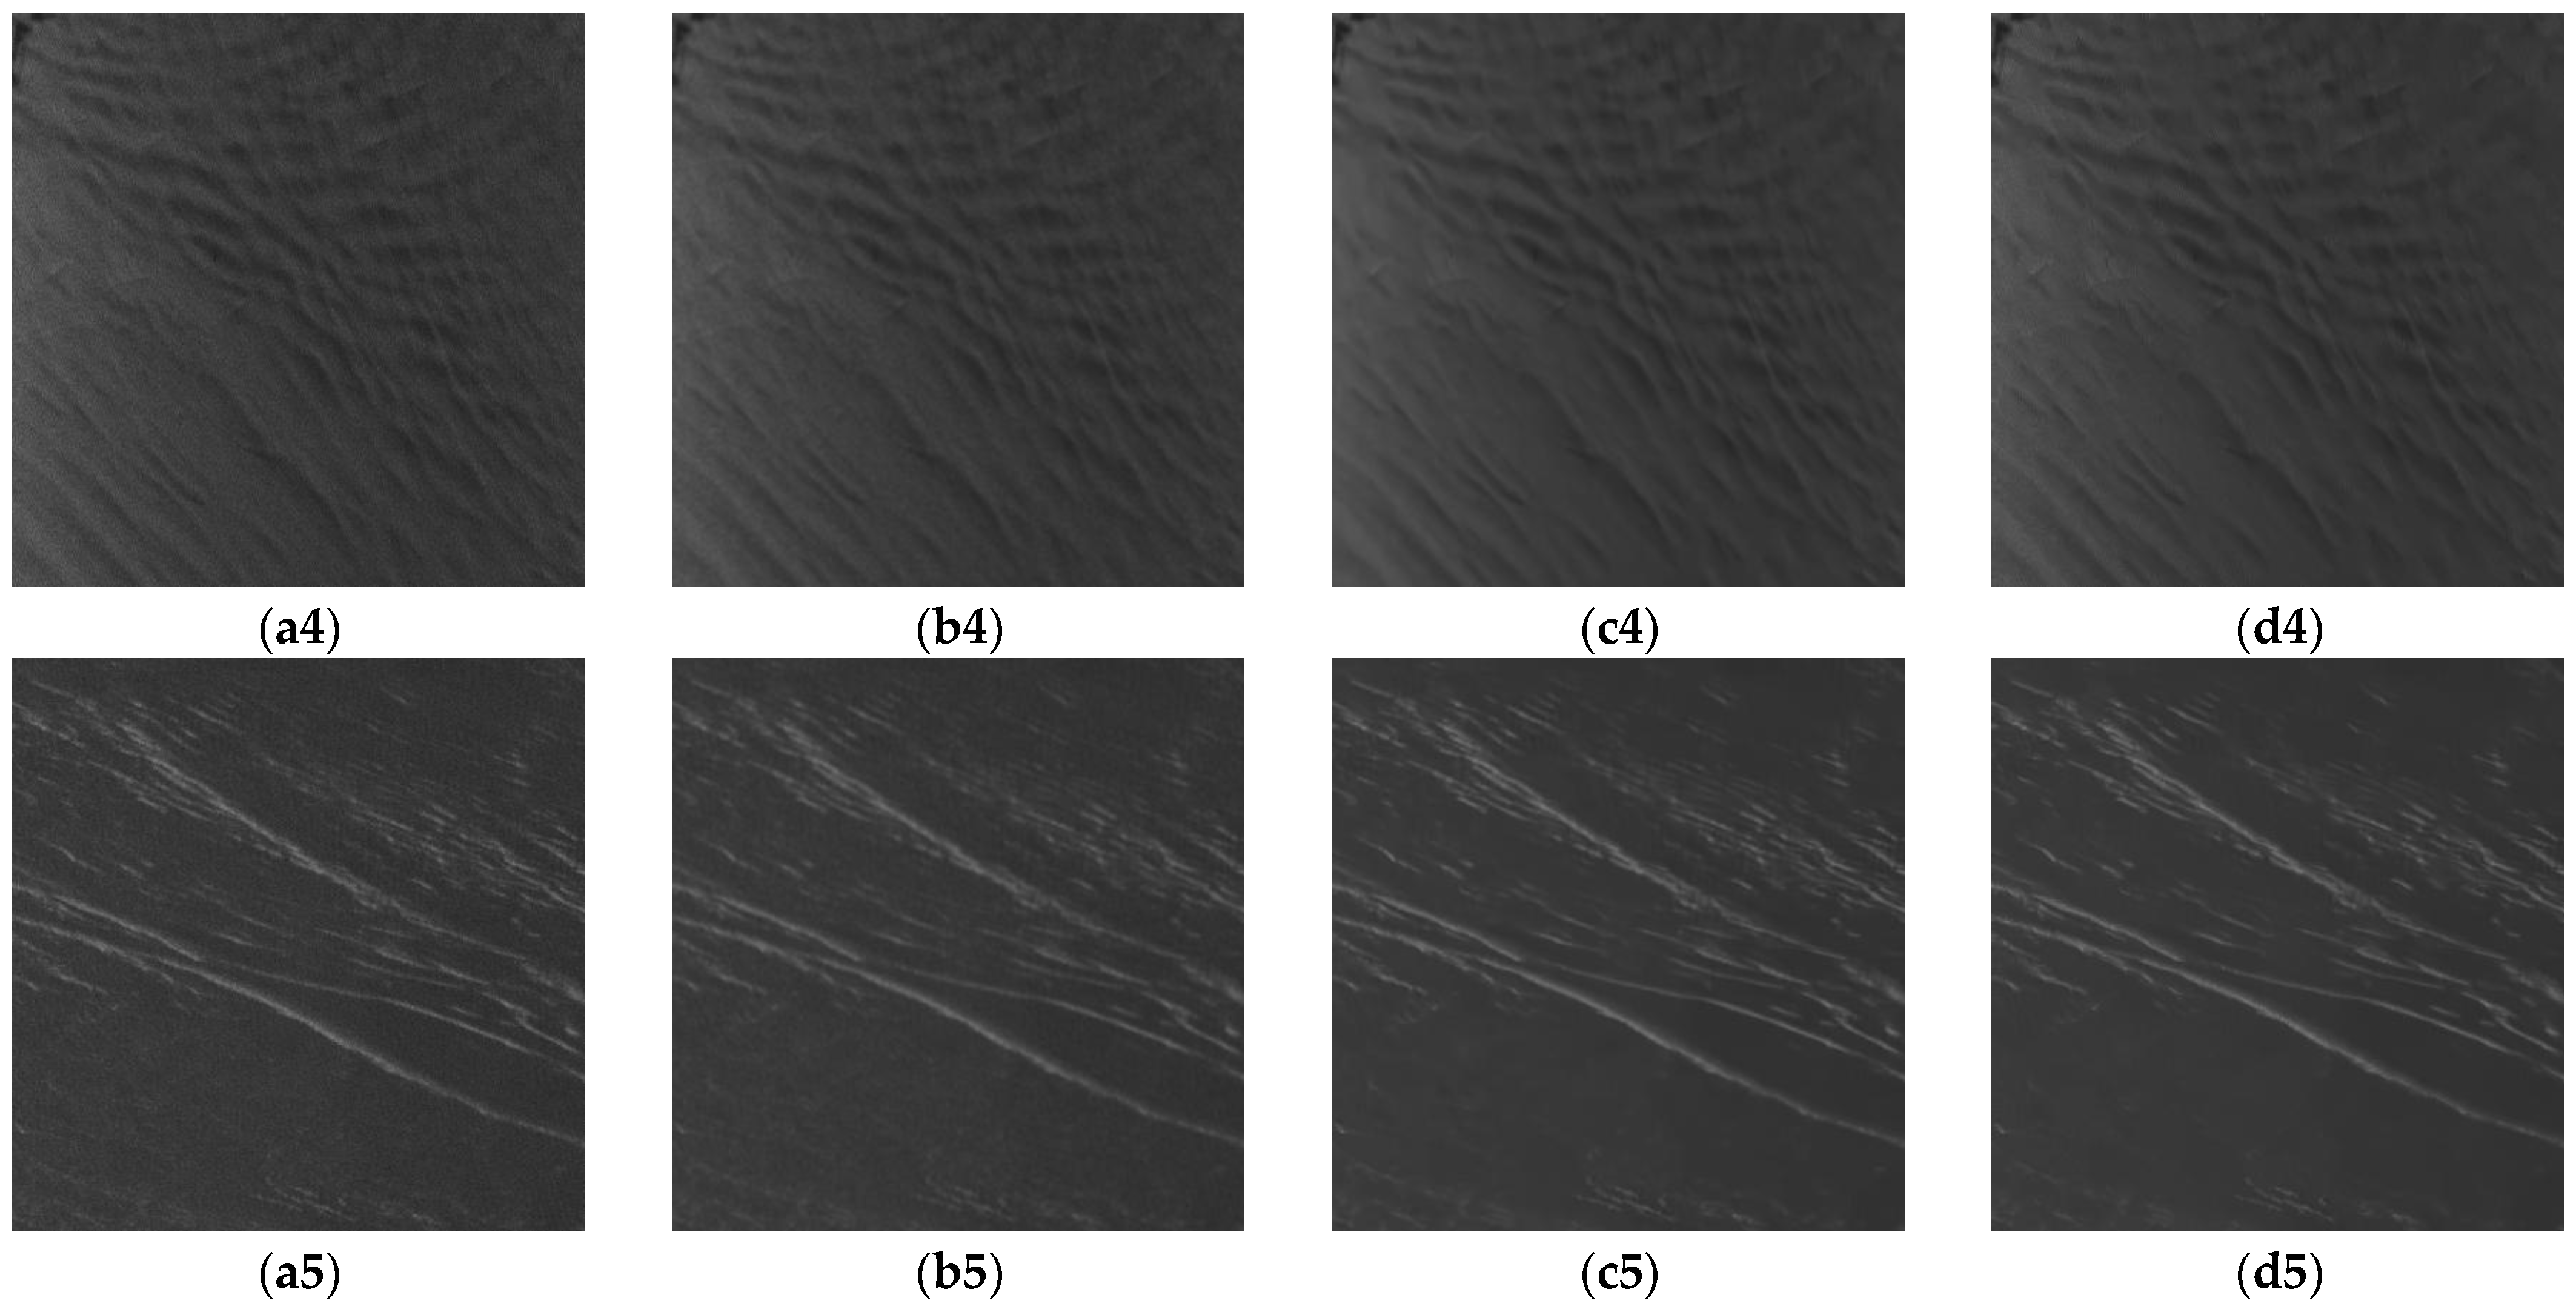
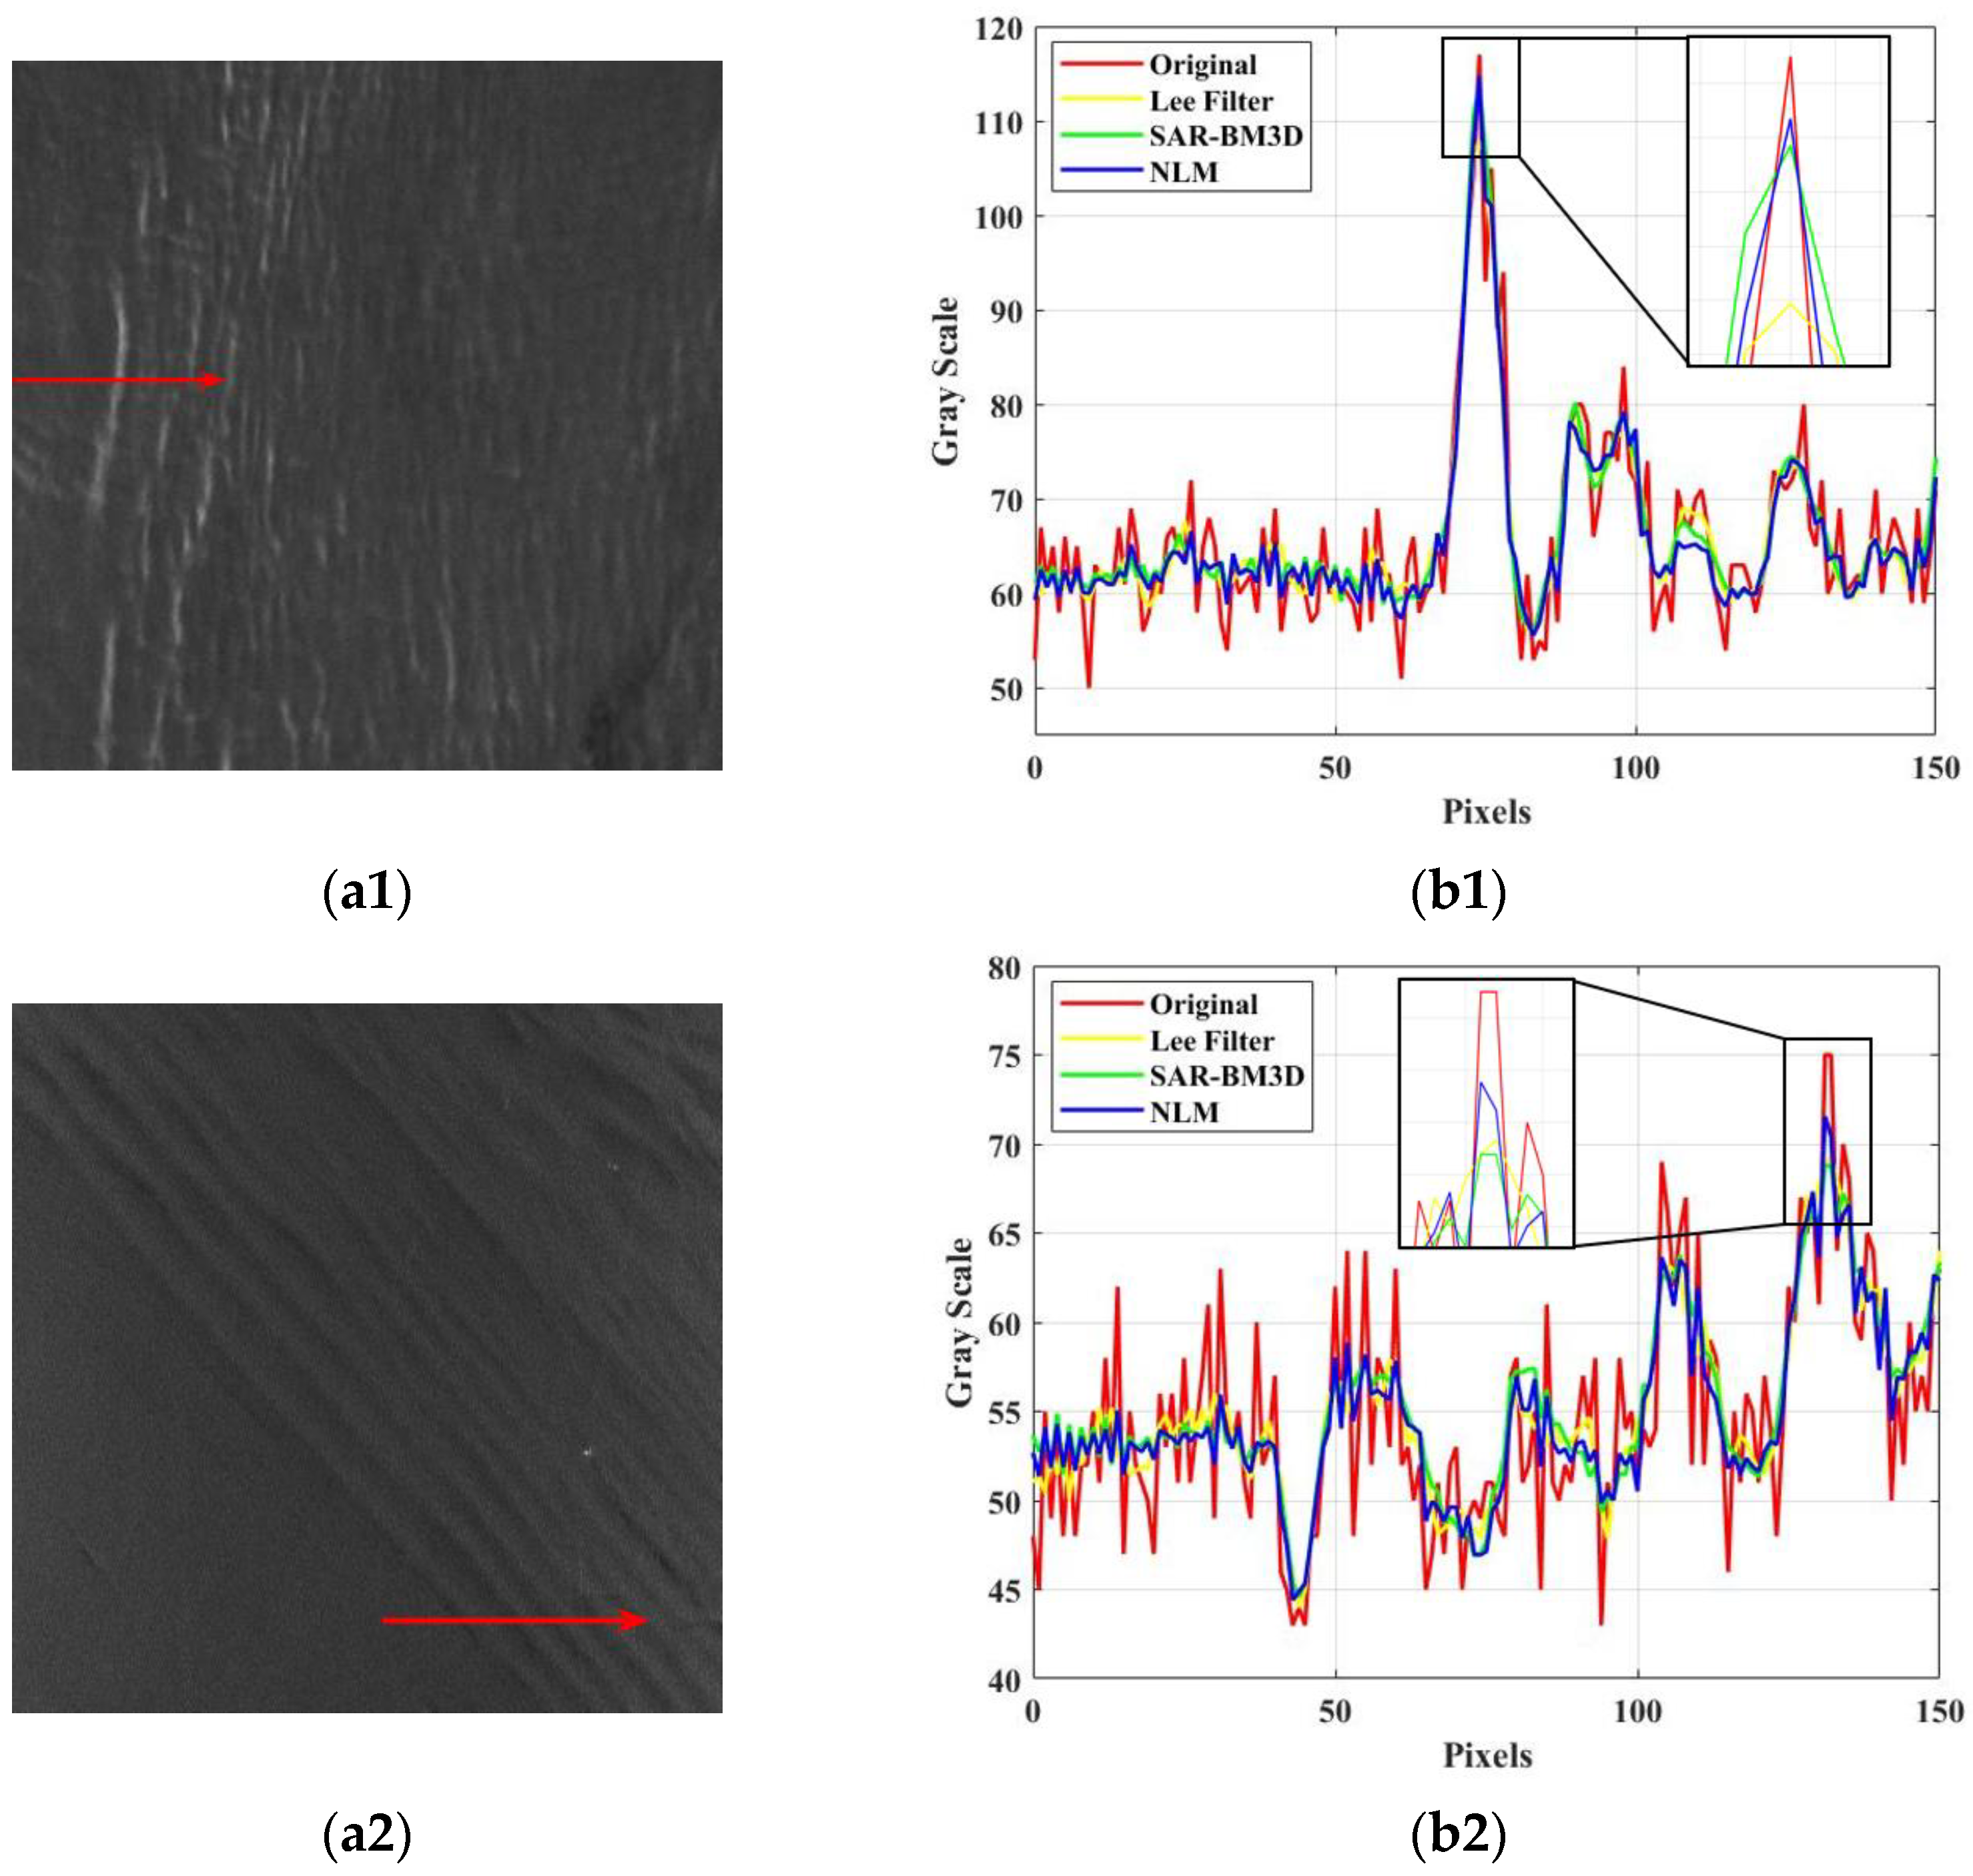
3.2. Comparison of Different Denoising Methods
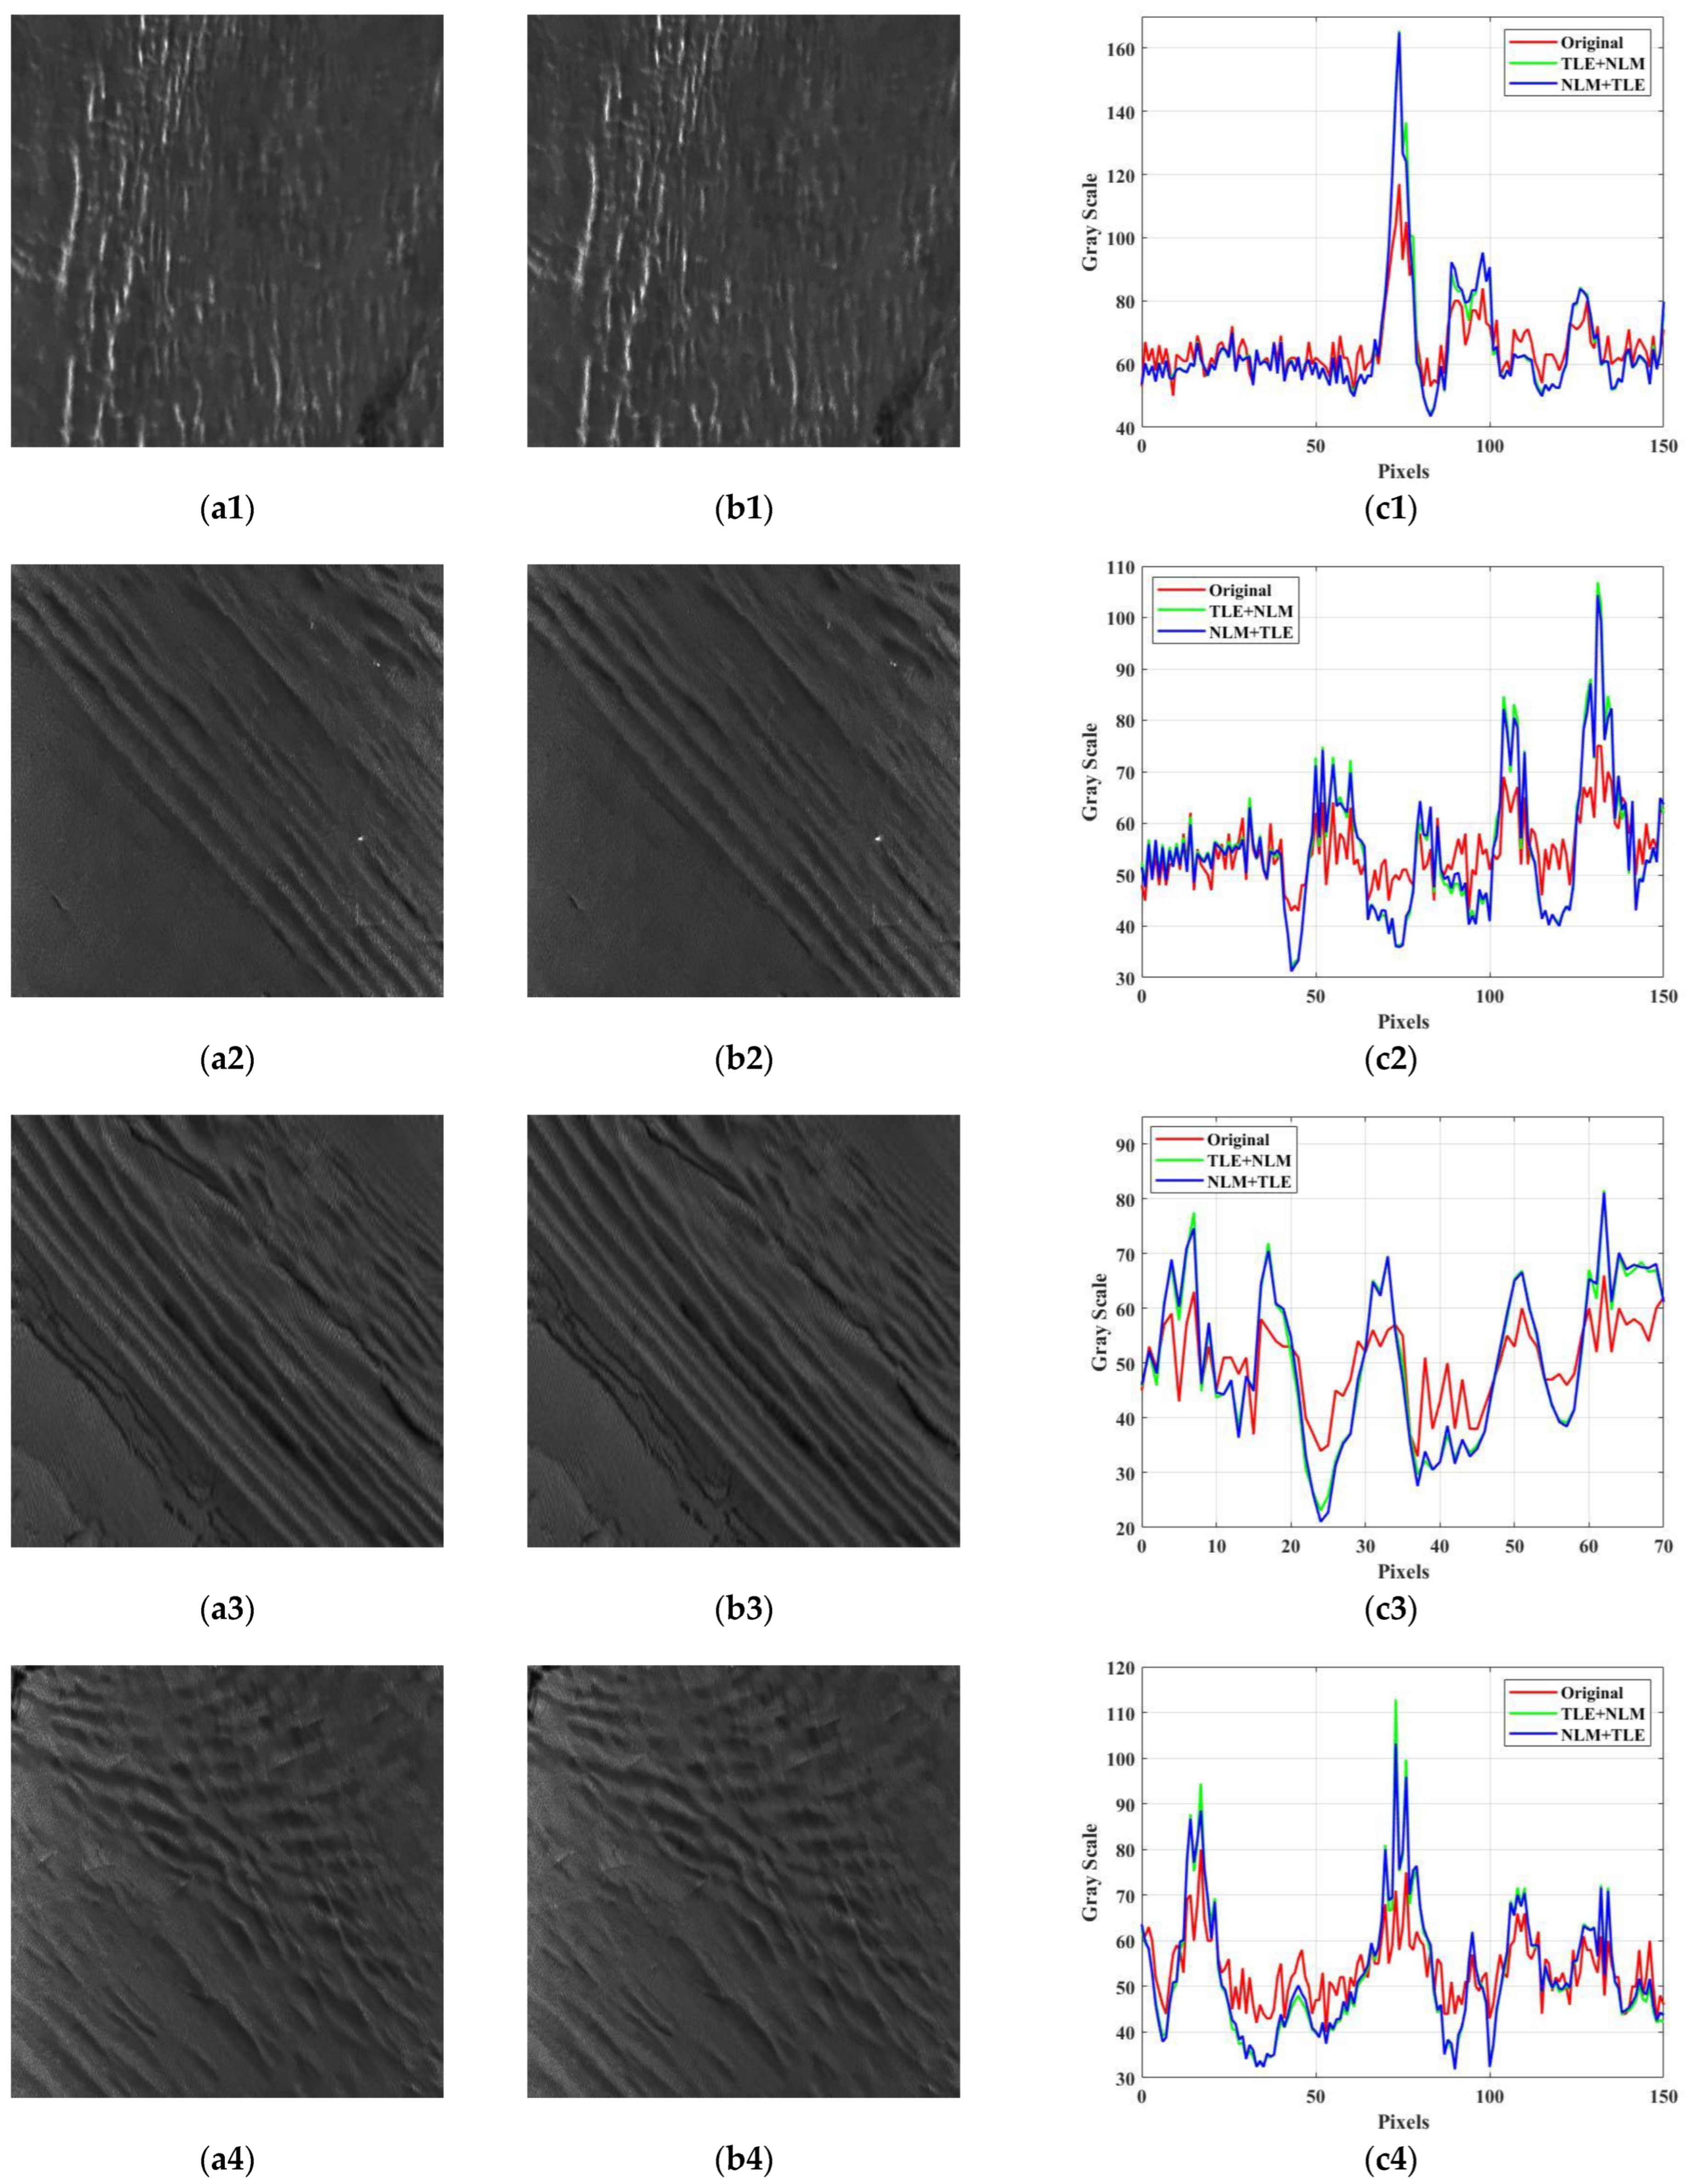
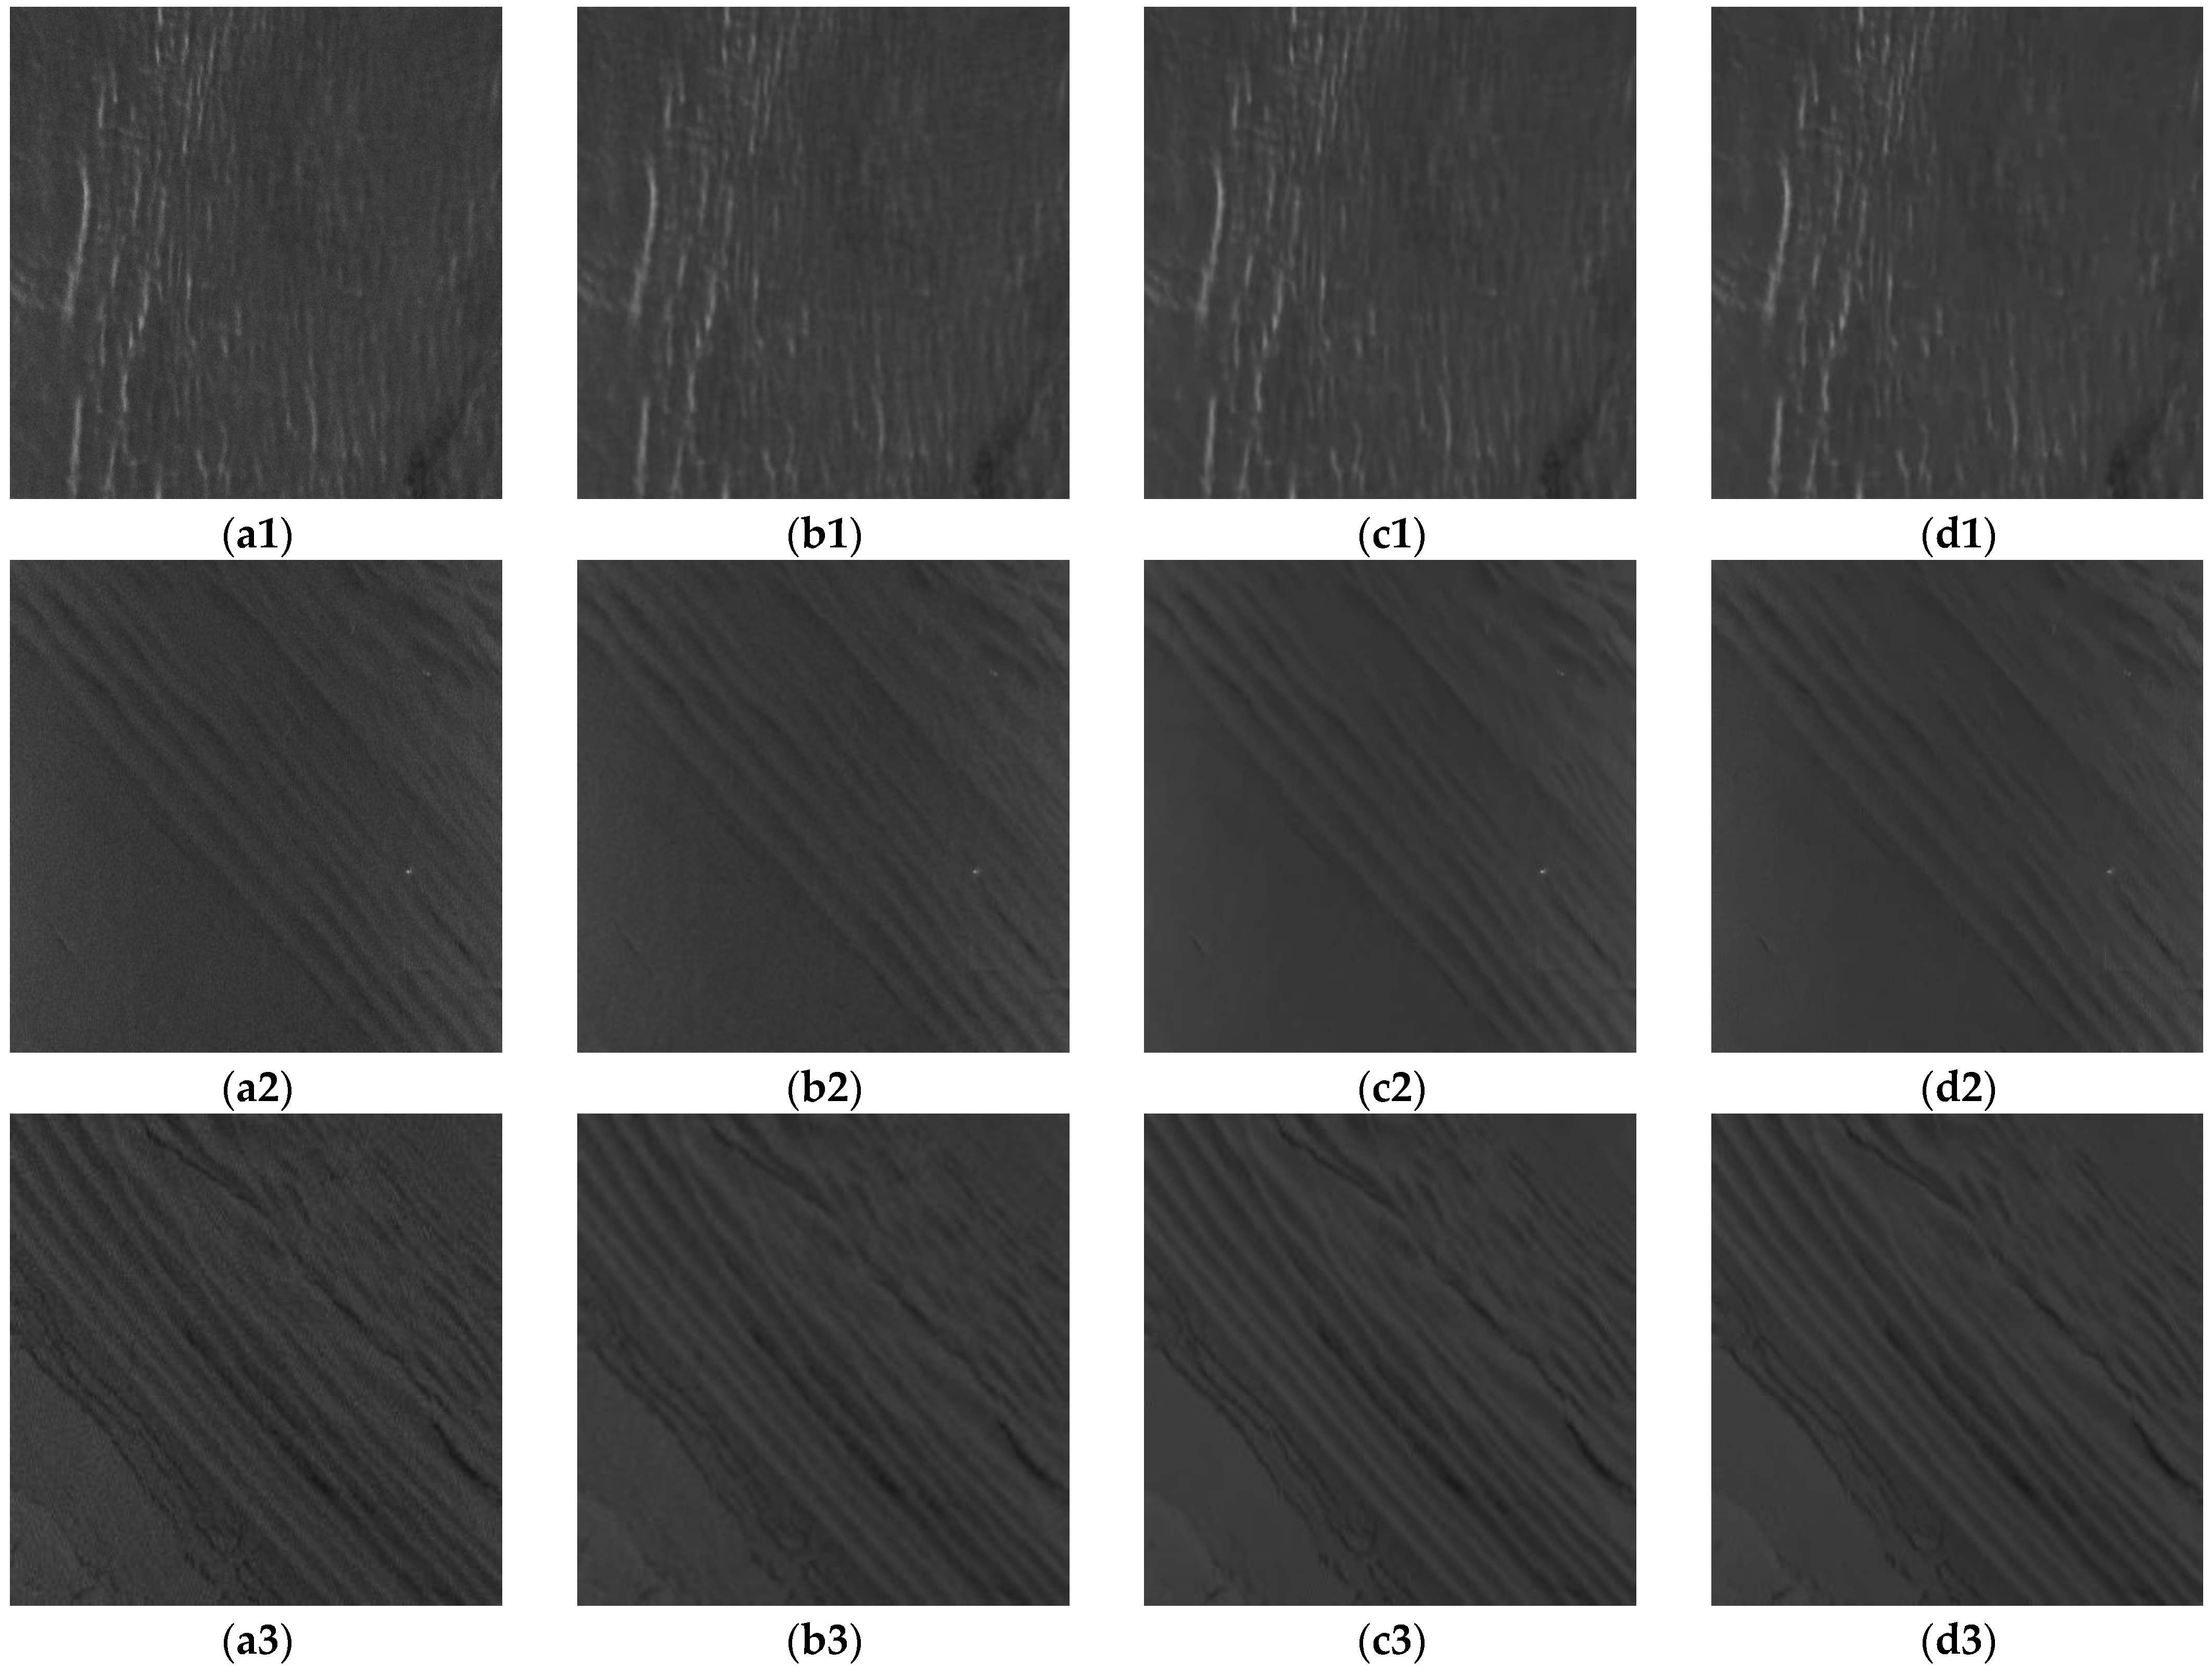
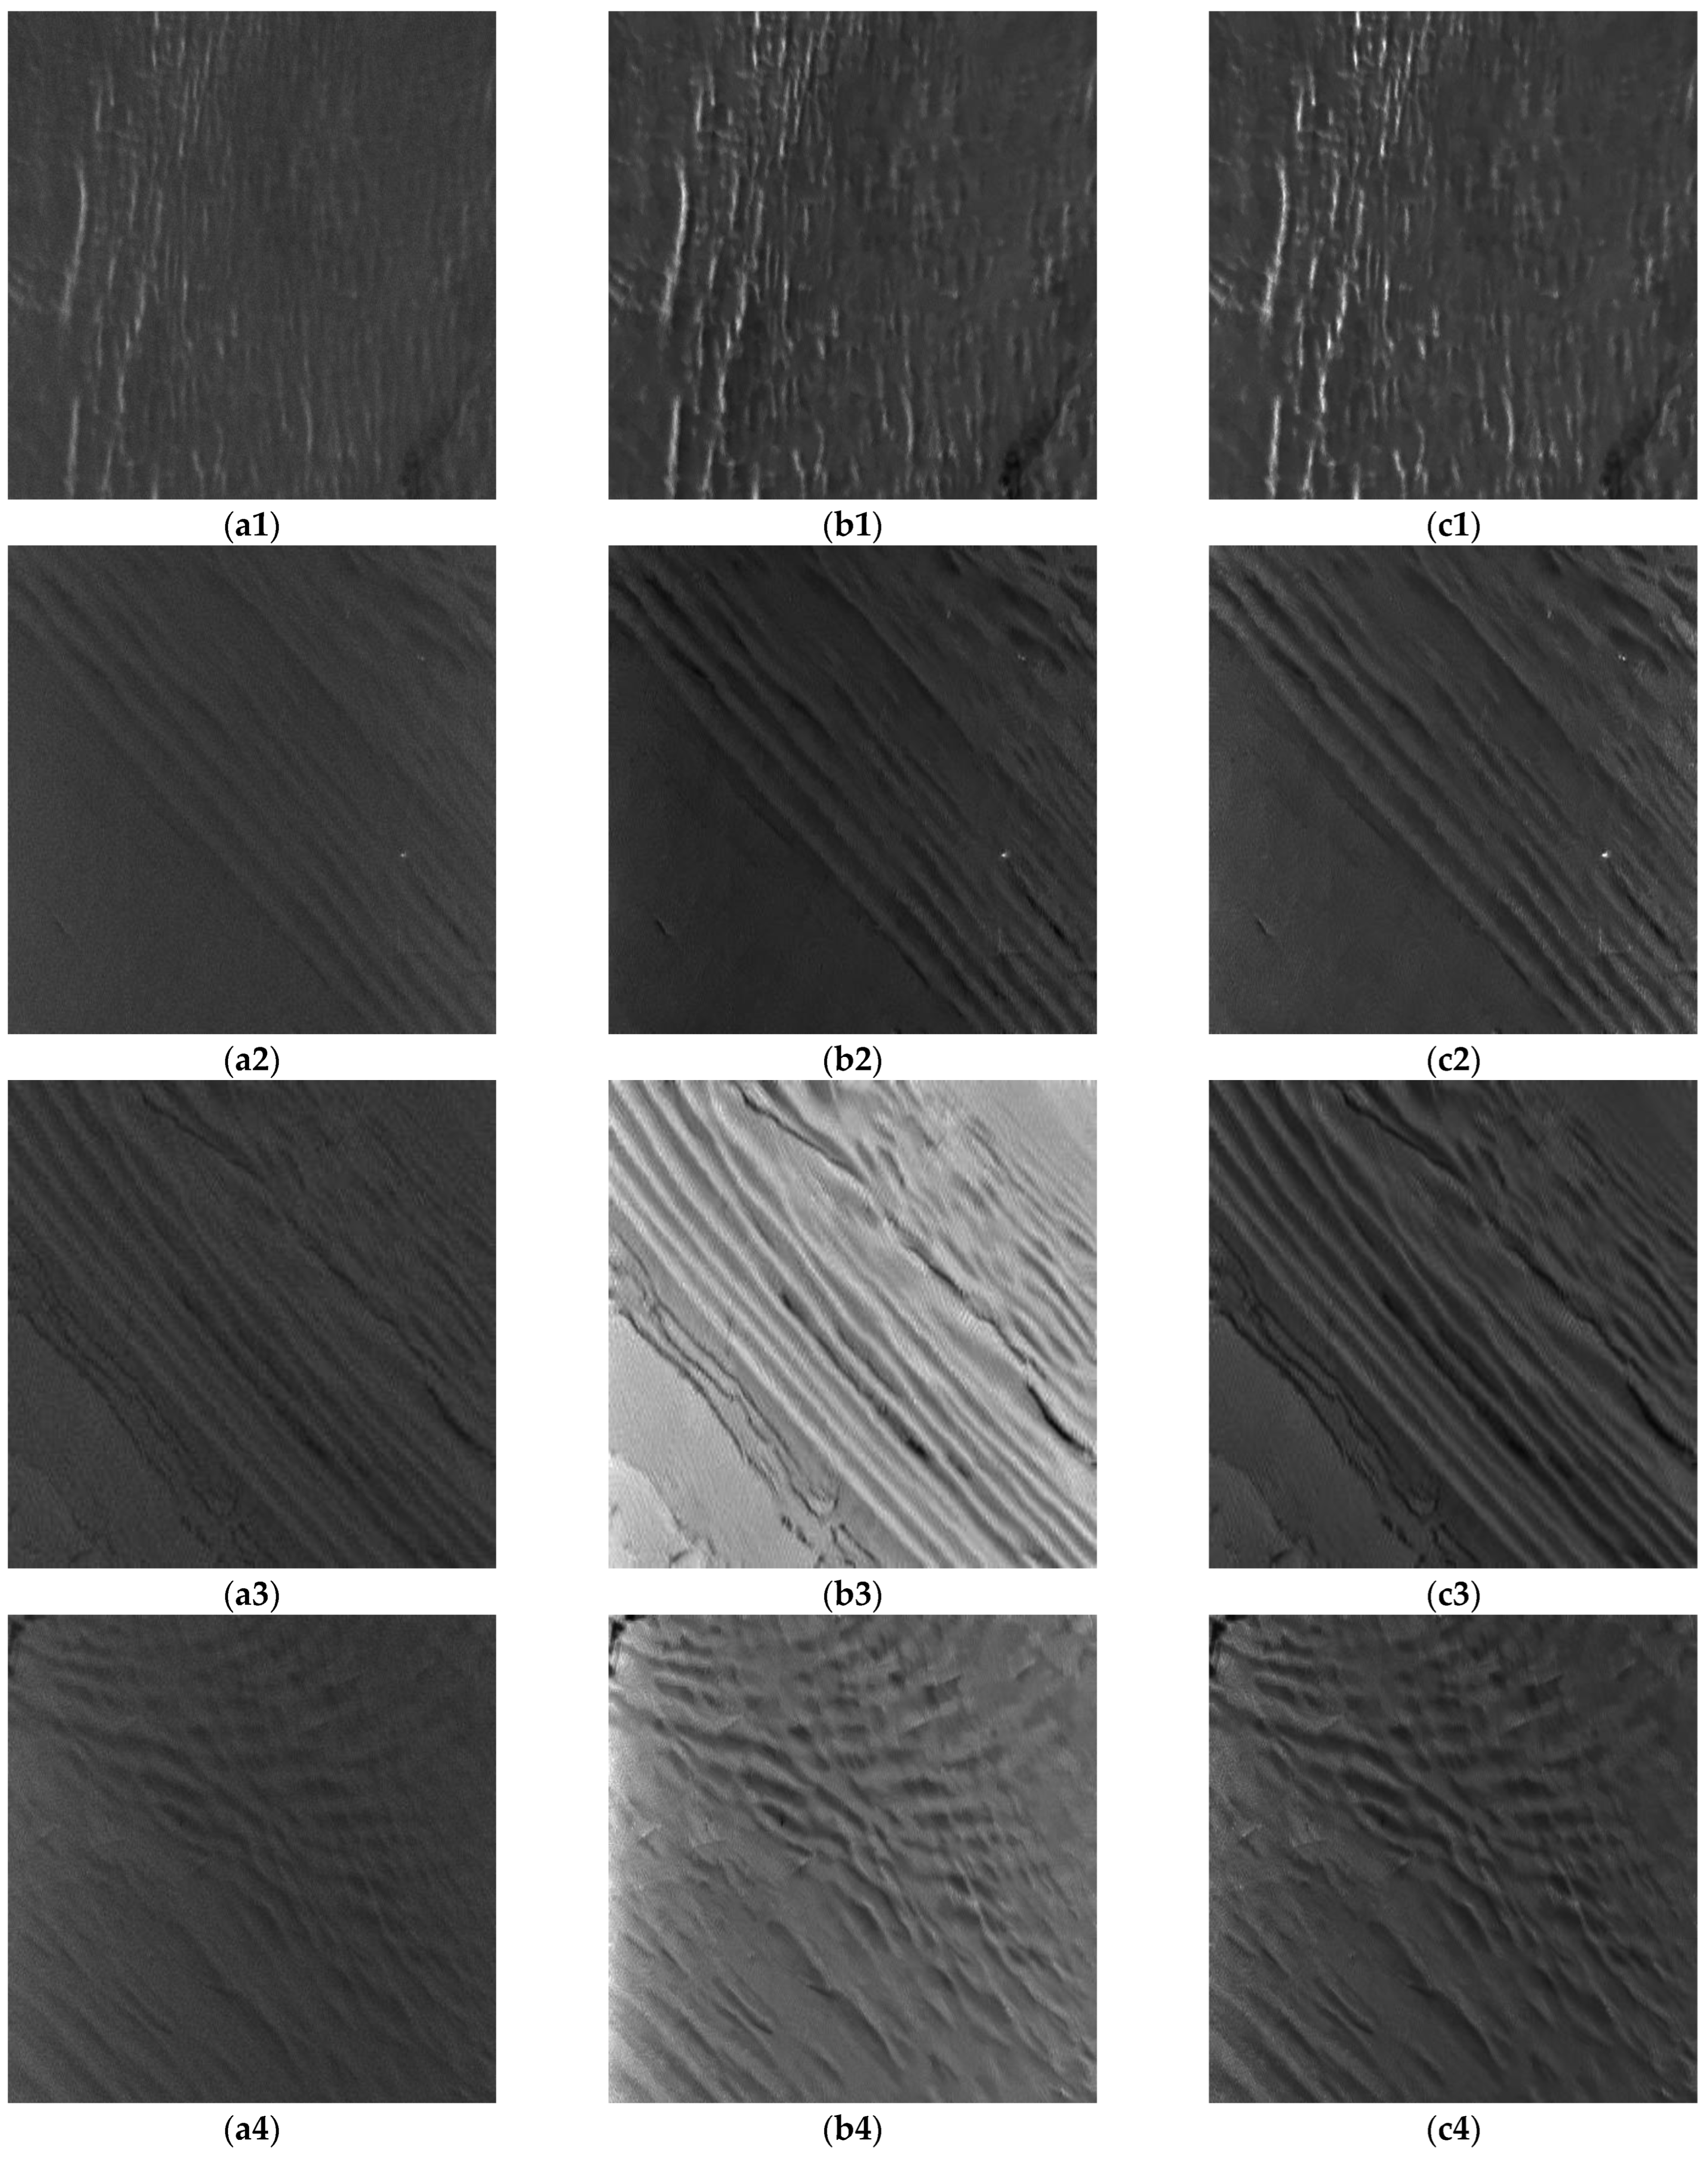
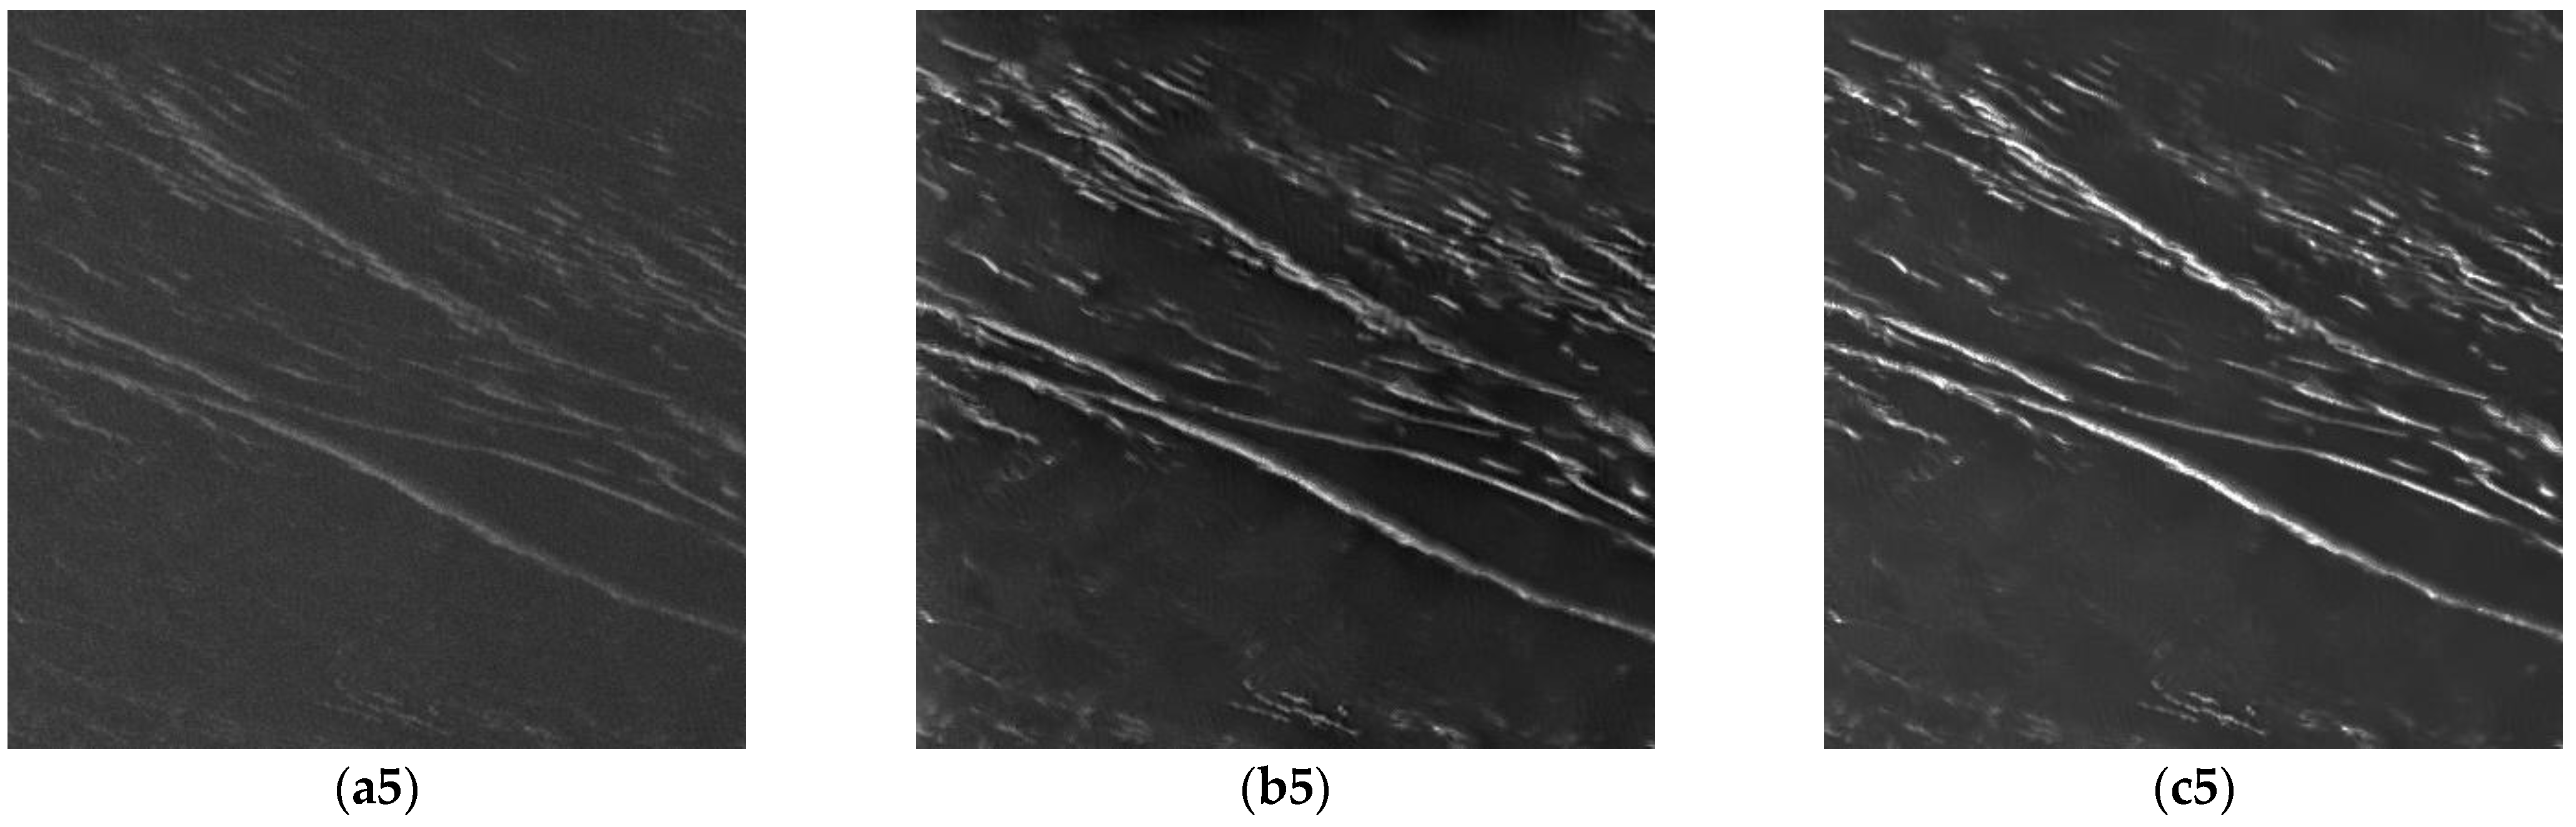
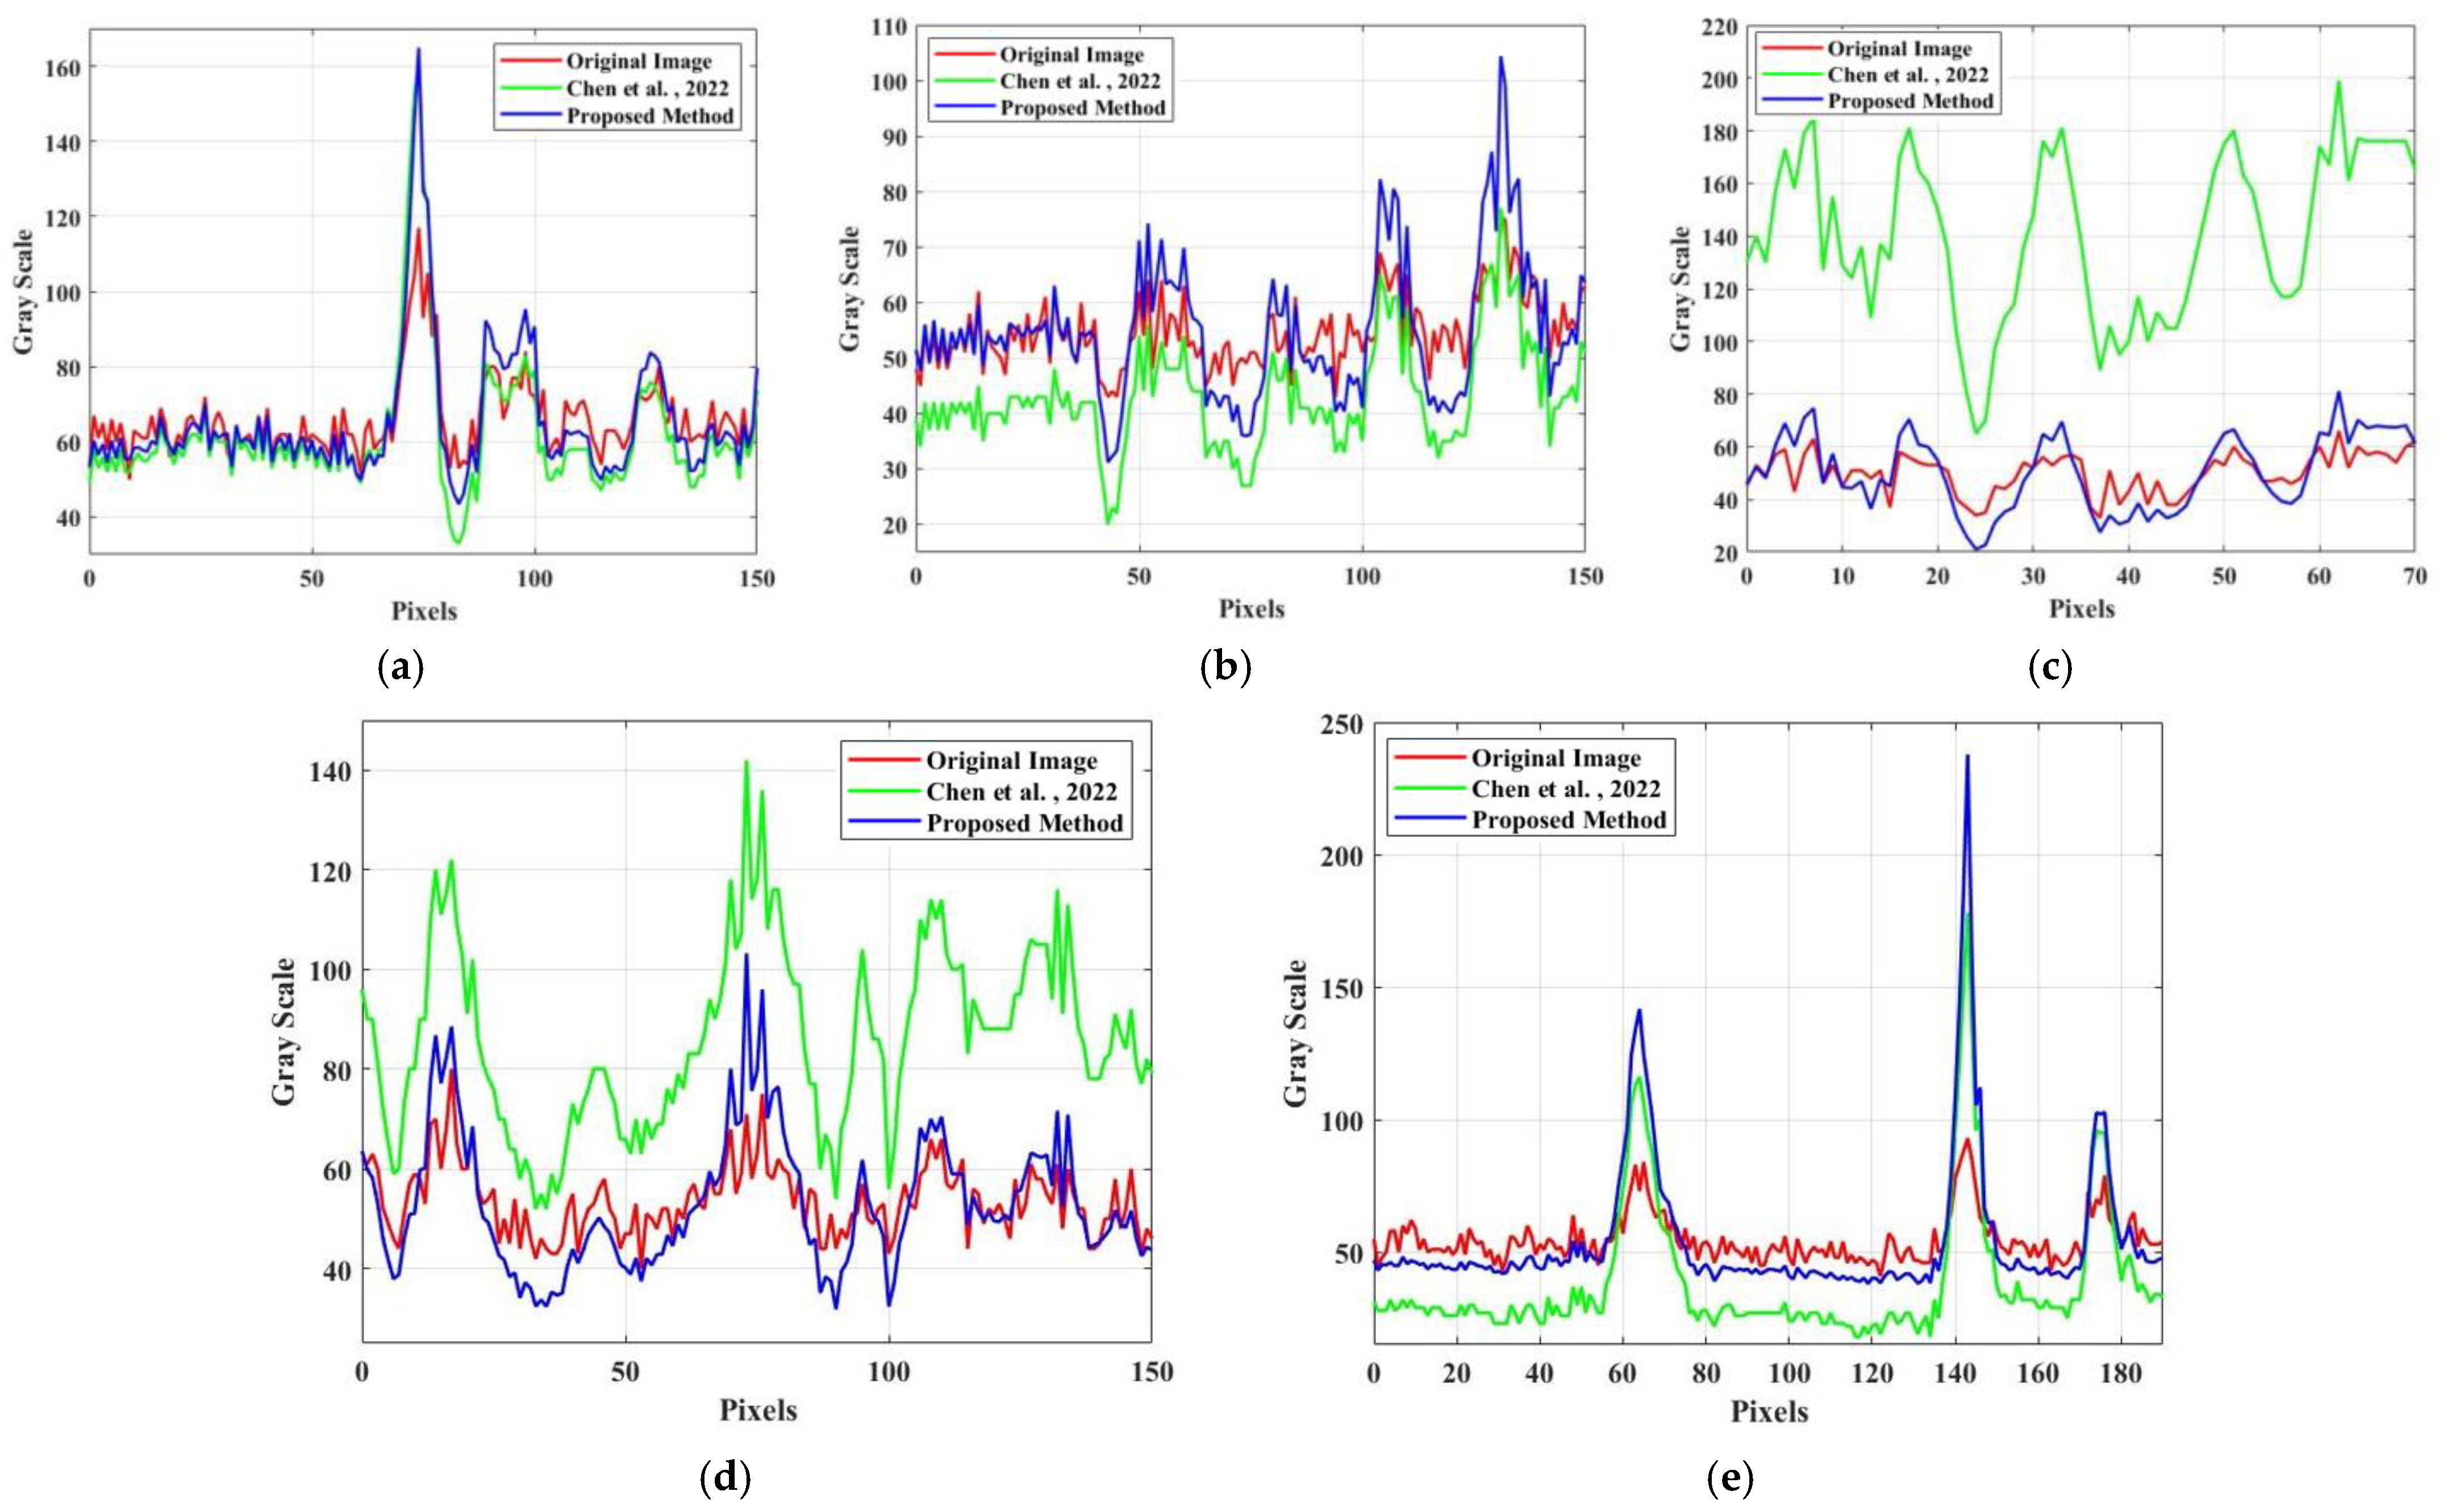
3.3. Experimental Results of Texture Enhancement by the Proposed Method
4. Discussion
5. Conclusions
Author Contributions
Funding
Data Availability Statement
Conflicts of Interest
References
- Chong, J.; Ouyang, Y.; Li, F.; Zhu, M. Synthetic Aperture Radar Image for Oceanic Internal Wave Detection; China Ocean Press: Beijing, China, 2010; pp. 1–5. [Google Scholar]
- Wang, T.; Huang, X.; Zhao, W.; Zheng, S.; Yang, Y.; Tian, J. Internal Solitary Wave Activities near the Indonesian Submarine Wreck Site Inferred from Satellite Images. J. Mar. Sci. Eng. 2022, 10, 197. [Google Scholar] [CrossRef]
- An, J. Research on Near Field High Resolution SAR Image Enhancement Method. Master’s Thesis, University of Electronic Science and Technology of China, Chengdu, China, 2017. [Google Scholar]
- Wang, H.; Zhang, Y.; Shen, H.; Zhang, J. Review of Image Enhancement Algorithms. Chin. Opt. 2017, 10, 438–448. [Google Scholar] [CrossRef]
- Tu, K. Research on Improvement of High Resolution SAR Image Quality. Master’s Thesis, National University of Defense Technology, Changsha, China, 2013. [Google Scholar]
- Cho, D.W.; Bui, T.D. Fast Image Enhancement in Compressed Wavelet Domain. Signal Proc. 2014, 98, 295–307. [Google Scholar] [CrossRef]
- Carlson, G.E. Wavelet Processing of SAR Ocean Wave Images. In Proceedings of the Geoscience Remote Sensing Symposium, Firenze, Italy, 10–14 July 1995. [Google Scholar]
- Fan, S.; Kudryavtsev, V.; Zhang, B.; Perrie, W.; Chapron, B.; Mouche, A. On C-Band Quad-Polarized Synthetic Aperture Radar Properties of Ocean Surface Currents. Remote Sens. 2019, 11, 2321. [Google Scholar] [CrossRef]
- Bai, H.; Wang, X.; Chen, Y. A New Curvelet-Based Method for SAR Image Feature Enhancement. J. Univ. Chin. Acad. Sci. 2011, 28, 228–234. [Google Scholar]
- Chen, Z.; Zeng, H.; Yang, W.; Chen, J. Texture Enhancement Method of Oceanic Internal Waves in SAR Images Based on Non-Local Mean Filtering and Multi-Scale Retinex. In Proceedings of the 2022 3rd China International SAR Symposium (CISS), Shanghai, China, 2–4 November 2022. [Google Scholar]
- Alpers, W.R. Theory of Radar Imaging of Internal Waves. Nature 1985, 314, 245–247. [Google Scholar] [CrossRef]
- Thompson, D.R.; Gasparovic, R.F. Intensity Modulation in SAR Images of Internal Waves. Nature 1986, 320, 345–348. [Google Scholar] [CrossRef]
- Ouchi, K. On the SAR Imaging Mechanisms of Oceanic Internal Waves. In Proceedings of the IGARSS’93-IEEE International Geoscience and Remote Sensing Symposium, Tokyo, Japan, 18–21 August 1993. [Google Scholar]
- Alpers, W.; Huang, W. On the Discrimination of Radar Signatures of Atmospheric Gravity Waves and Oceanic Internal Waves on Synthetic Aperture Radar Images of the Sea Surface. IEEE Trans. Geosci. Remote Sens. 2011, 49, 1114–1126. [Google Scholar] [CrossRef]
- Fan, K.; Chen, P.; Gu, Y.; Li, X.; Meng, L.; Zhou, W. Marine Remote Sensing and Image Interpretation of Spaceborne Synthetic Aperture Radar; China Ocean Press: Beijing, China, 2017; pp. 25–26. [Google Scholar]
- Lund, B.; Graber, H.C.; Xue, J.; Romeiser, R. Analysis of Internal Wave Signatures in Marine Radar Data. IEEE Trans. Geosci. Remote Sens. 2013, 51, 4840–4852. [Google Scholar] [CrossRef]
- Buades, A.; Coll, B.; Morel, J.M. A Non-Local Algorithm for Image Denoising. In Proceedings of the 2005 IEEE Computer Society Conference on Computer Vision and Pattern Recognition (CVPR’05), San Diego, CA, USA, 20–26 June 2005. [Google Scholar]
- Xu, L.; Yan, Q.; Xia, Y.; Jia, J. Structure Extraction from Texture via Relative Total Variation. ACM Trans. Graph. 2012, 31, 139. [Google Scholar] [CrossRef]
- Cai, Y.; Chong, J. Parameter Assessment for Texture Feature Quality Evaluation in SAR Ocean Image. In Proceedings of the 2009 2nd Asian-Pacific Conference on Synthetic Aperture Radar, Xian, China, 26–30 October 2009. [Google Scholar]
- Lee, J.S. A Simple Speckle Smoothing Algorithm for Synthetic Aperture Radar Images. IEEE Trans. Syst. Man Cybern. 1983, 13, 85–89. [Google Scholar] [CrossRef]
- Parrilli, S.; Poderico, M.; Angelino, C.V.; Verdoliva, L. A Nonlocal SAR Image Denoising Algorithm Based on LLMMSE Wavelet Shrinkage. IEEE Trans. Geosci. Remote Sens. 2012, 50, 606–616. [Google Scholar] [CrossRef]
- Dabov, K.; Foi, A.; Katkovnik, V.; Egiazarian, K. Image Denoising by Sparse 3-D Transform-Domain Collaborative Filtering. IEEE Trans. Image Process. 2007, 16, 2080–2095. [Google Scholar] [CrossRef] [PubMed]


| Number | Scene Center Position | Data Acquisition Date [UTC] | Imaging Mode | Polarization |
|---|---|---|---|---|
| Data1 | (116.2°E, 20.9°N) | 26 July 2019 | UFS 1 | HH |
| Data2 | (114.9°E, 21.2°N) | 3 March 2018 | UFS | HH |
| Data3 | (115.0°E, 20.9°N) | 3 March 2018 | UFS | HH |
| Data4 | (116.3°E, 21.4°N) | 20 July 2021 | UFS | HH |
| Data5 | (115.1°E, 20.7°N) | 5 September 2018 | UFS | HH |
| ENL | m | Var | C | SBD (dB) | (dB) | |
|---|---|---|---|---|---|---|
| Original | 35.67 | 58.45 | 109.92 | 0.35 | 1.00 | 0.54 |
| TLE | 5.35 | 58.38 | 1009.66 | 1.35 | 2.40 | 3.42 |
| ENL | SSIM | m | Var | C | SBD (dB) | (dB) | ||
|---|---|---|---|---|---|---|---|---|
| Data1 | Original | 35.67 | / | 58.45 | 109.92 | 0.35 | 1.00 | 0.54 |
| Lee Filter | 127.58 | 0.56 | 58.45 | 73.31 | 0.29 | 0.82 | 0.37 | |
| SAR-BM3D | 205.28 | 0.62 | 58.61 | 84.68 | 0.31 | 0.85 | 0.41 | |
| NLM | 277.17 | 0.73 | 58.44 | 87.91 | 0.32 | 0.86 | 0.41 | |
| Data2 | Original | 41.60 | / | 54.37 | 36.25 | 0.23 | 0.79 | 0.14 |
| Lee Filter | 266.52 | 0.31 | 54.39 | 18.20 | 0.16 | 0.60 | 0.07 | |
| SAR-BM3D | 1408.56 | 0.44 | 54.60 | 17.55 | 0.16 | 0.59 | 0.07 | |
| NLM | 829.10 | 0.60 | 54.43 | 18.30 | 0.16 | 0.59 | 0.07 | |
| Data3 | Original | 29.11 | / | 60.03 | 58.12 | 0.30 | 1.10 | 0.24 |
| Lee Filter | 226.20 | 0.53 | 60.00 | 32.42 | 0.22 | 0.85 | 0.13 | |
| SAR-BM3D | 320.21 | 0.74 | 60.02 | 38.08 | 0.24 | 0.91 | 0.16 | |
| NLM | 288.23 | 0.72 | 59.91 | 35.77 | 0.24 | 0.88 | 0.15 | |
| Data4 | Original | 42.21 | / | 60.65 | 44.51 | 0.25 | 0.89 | 0.18 |
| Lee Filter | 227.03 | 0.42 | 60.60 | 26.17 | 0.19 | 0.71 | 0.11 | |
| SAR-BM3D | 489.91 | 0.47 | 60.63 | 25.71 | 0.19 | 0.71 | 0.11 | |
| NLM | 399.06 | 0.61 | 60.39 | 25.84 | 0.19 | 0.71 | 0.11 | |
| Data5 | Original | 31.82 | / | 55.47 | 99.97 | 0.37 | 1.09 | 0.38 |
| Lee Filter | 211.83 | 0.60 | 55.48 | 56.23 | 0.27 | 0.83 | 0.22 | |
| SAR-BM3D | 1789.24 | 0.70 | 55.45 | 74.16 | 0.32 | 0.93 | 0.28 | |
| NLM | 1257.28 | 0.70 | 55.01 | 68.64 | 0.31 | 0.92 | 0.25 |
| ENL | m | Var | C | SBD (dB) | (dB) | ||
|---|---|---|---|---|---|---|---|
| Data1 | Original Image | 35.67 | 58.45 | 109.92 | 0.35 | 1.00 | 0.54 |
| Method in [10] | 54.69 | 57.96 | 384.35 | 0.74 | 1.74 | 1.42 | |
| Proposed Method | 58.95 | 57.94 | 583.83 | 1.02 | 1.83 | 2.00 | |
| Data2 | Original Image | 41.60 | 54.37 | 36.25 | 0.23 | 0.79 | 0.14 |
| Method in [10] | 73.19 | 38.57 | 96.98 | 0.48 | 1.73 | 0.37 | |
| Proposed Method | 95.54 | 53.79 | 172.87 | 0.52 | 1.76 | 0.60 | |
| Data3 | Original Image | 29.11 | 60.03 | 58.12 | 0.30 | 1.10 | 0.24 |
| Method in [10] | 83.57 | 169.65 | 934.29 | 0.42 | 1.72 | 0.51 | |
| Proposed Method | 35.88 | 64.01 | 190.74 | 0.54 | 2.17 | 0.78 | |
| Data4 | Original Image | 42.21 | 60.65 | 44.51 | 0.25 | 0.89 | 0.18 |
| Method in [10] | 112.17 | 94.30 | 295.79 | 0.39 | 1.54 | 2.25 | |
| Proposed Method | 79.81 | 62.72 | 154.90 | 0.46 | 1.77 | 0.62 | |
| Data5 | Original Image | 31.82 | 55.47 | 99.97 | 0.37 | 1.09 | 0.38 |
| Method in [10] | 46.31 | 39.94 | 806.54 | 1.25 | 3.10 | 1.88 | |
| Proposed Method | 162.29 | 54.83 | 967.30 | 1.30 | 2.53 | 2.31 |
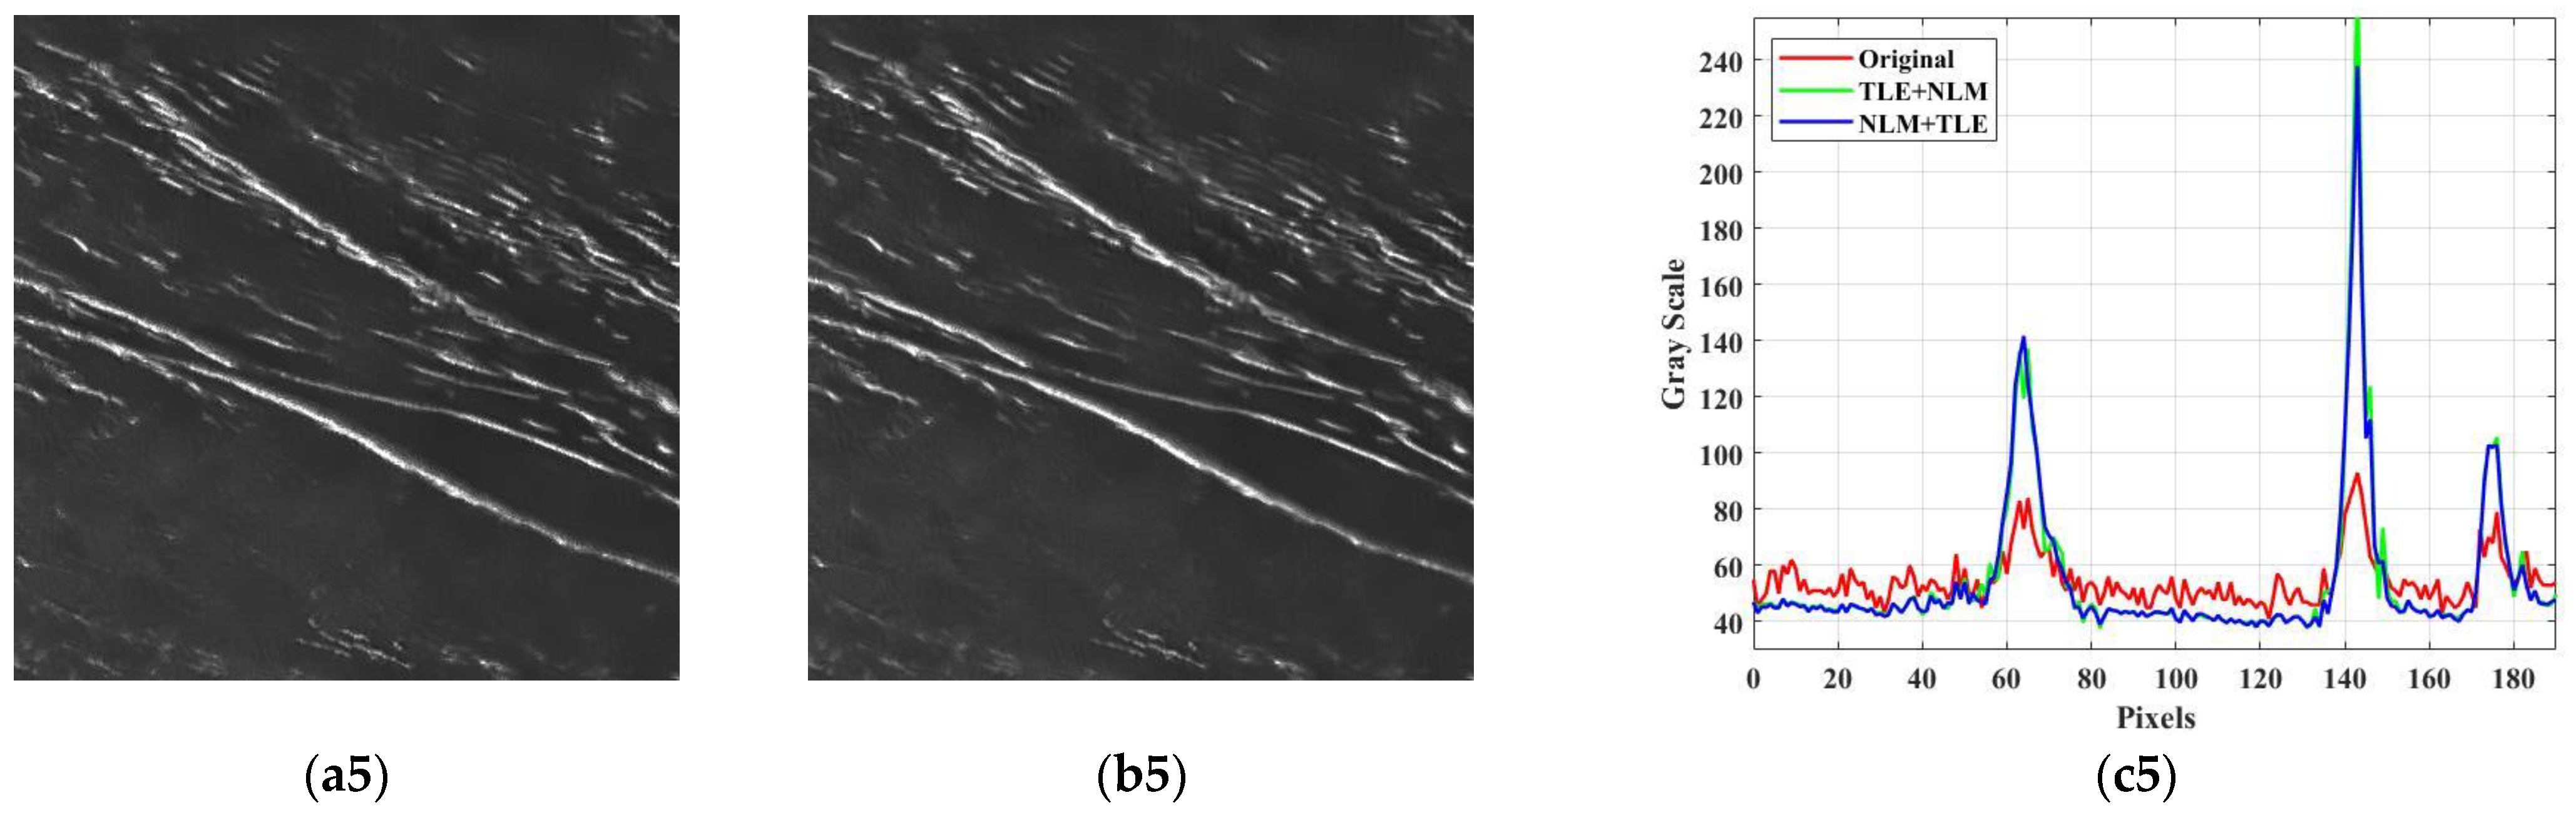
| ENL | m | Var | C | SBD (dB) | (dB) | ||
|---|---|---|---|---|---|---|---|
| Data1 | Original | 35.67 | 58.45 | 109.92 | 0.35 | 1.00 | 0.54 |
| TLE + NLM | 57.66 | 57.94 | 581.01 | 1.02 | 1.83 | 1.96 | |
| NLM + TLE | 58.95 | 57.94 | 583.83 | 1.02 | 1.83 | 2.00 | |
| Data2 | Original | 41.60 | 54.37 | 36.25 | 0.23 | 0.79 | 0.14 |
| TLE + NLM | 93.38 | 54.29 | 182.45 | 0.55 | 1.75 | 0.59 | |
| NLM + TLE | 95.54 | 53.79 | 172.87 | 0.52 | 1.76 | 0.60 | |
| Data3 | Original | 29.11 | 60.03 | 58.12 | 0.30 | 1.10 | 0.24 |
| TLE + NLM | 25.55 | 64.49 | 191.09 | 0.56 | 2.13 | 0.74 | |
| NLM + TLE | 35.88 | 64.01 | 190.74 | 0.54 | 2.17 | 0.78 | |
| Data4 | Original | 42.21 | 60.65 | 44.51 | 0.25 | 0.89 | 0.18 |
| TLE + NLM | 62.77 | 63.16 | 156.43 | 0.48 | 1.76 | 0.59 | |
| NLM + TLE | 79.81 | 62.72 | 154.90 | 0.46 | 1.77 | 0.62 | |
| Data5 | Original | 31.82 | 55.47 | 99.97 | 0.37 | 1.09 | 0.38 |
| TLE + NLM | 147.76 | 55.01 | 1019.43 | 1.38 | 2.56 | 2.31 | |
| NLM + TLE | 162.29 | 54.83 | 967.30 | 1.30 | 2.53 | 2.31 |
Disclaimer/Publisher’s Note: The statements, opinions and data contained in all publications are solely those of the individual author(s) and contributor(s) and not of MDPI and/or the editor(s). MDPI and/or the editor(s) disclaim responsibility for any injury to people or property resulting from any ideas, methods, instructions or products referred to in the content. |
© 2024 by the authors. Licensee MDPI, Basel, Switzerland. This article is an open access article distributed under the terms and conditions of the Creative Commons Attribution (CC BY) license (https://creativecommons.org/licenses/by/4.0/).
Share and Cite
Chen, Z.; Zeng, H.; Wang, Y.; Yang, W.; Guan, Y.; Liu, W. A Texture Enhancement Method for Oceanic Internal Wave Synthetic Aperture Radar Images Based on Non-Local Mean Filtering and Texture Layer Enhancement. Remote Sens. 2024, 16, 1172. https://doi.org/10.3390/rs16071172
Chen Z, Zeng H, Wang Y, Yang W, Guan Y, Liu W. A Texture Enhancement Method for Oceanic Internal Wave Synthetic Aperture Radar Images Based on Non-Local Mean Filtering and Texture Layer Enhancement. Remote Sensing. 2024; 16(7):1172. https://doi.org/10.3390/rs16071172
Chicago/Turabian StyleChen, Zhenghua, Hongcheng Zeng, Yamin Wang, Wei Yang, Yanan Guan, and Wei Liu. 2024. "A Texture Enhancement Method for Oceanic Internal Wave Synthetic Aperture Radar Images Based on Non-Local Mean Filtering and Texture Layer Enhancement" Remote Sensing 16, no. 7: 1172. https://doi.org/10.3390/rs16071172
APA StyleChen, Z., Zeng, H., Wang, Y., Yang, W., Guan, Y., & Liu, W. (2024). A Texture Enhancement Method for Oceanic Internal Wave Synthetic Aperture Radar Images Based on Non-Local Mean Filtering and Texture Layer Enhancement. Remote Sensing, 16(7), 1172. https://doi.org/10.3390/rs16071172