Article

An Up-View Visual-Based Indoor Positioning Method via Deep Learning

1
Department of Remote Sensing and Photogrammetry, Finnish Geospatial Research Institute, FI-02150 Espoo, Finland
2
School of Automation, Nanjing University of Science and Technology, Nanjing 210094, China
3
Flight Control Institute, Nanjing University of Aeronautics and Astronautics, Nanjing 210095, China
*
Author to whom correspondence should be addressed.
Remote Sens. 2024, 16(6), 1024; https://doi.org/10.3390/rs16061024
Submission received: 6 January 2024 / Revised: 1 March 2024 / Accepted: 11 March 2024 / Published: 14 March 2024
(This article belongs to the Section Engineering Remote Sensing)

Abstract

:
Indoor positioning plays a crucial role in various domains. It is employed in various applications, such as navigation, asset tracking, and location-based services (LBS), in Global Navigation Satellite System (GNSS) denied or degraded areas. The visual-based positioning technique is a promising solution for high-accuracy indoor positioning. However, most visual positioning research uses the side-view perspective, which is susceptible to interferences and may cause concerns about privacy and public security. Therefore, this paper innovatively proposes an up-view visual-based indoor positioning algorithm. It uses the up-view images to realize indoor positioning. Firstly, we utilize a well-trained YOLO V7 model to realize landmark detection and gross extraction. Then, we use edge detection operators to realize the precision landmark extraction, obtaining the landmark pixel size. The target position is calculated based on the landmark detection and extraction results and the pre-labeled landmark sequence via the Similar Triangle Principle. Additionally, we also propose an inertial navigation system (INS)-based landmark matching method to match the landmark within an up-view image with a landmark in the pre-labeled landmark sequence. This is necessary for kinematic indoor positioning. Finally, we conduct static and kinematic experiments to verify the feasibility and performance of the up-view-based indoor positioning method. The results demonstrate that the up-view visual-based positioning is prospective and worthy of research.

1. Introduction

Location-based services (LBS) play a crucial role in modern life [1,2]. Positioning is a fundamental technology utilized for LBS, as well as various applications within the Internet of Things (IoT) and artificial intelligence (AI) [1]. Meanwhile, indoor areas (e.g., shopping malls, libraries, and subway stations) are the major activity areas of our daily life [3]. Indoor positioning is extensively utilized in different kinds of applications, such as emergency rescue, tracking in smart factories, mobile health services, and so on. Thus, high-accuracy indoor positioning techniques are important for navigation in GNSS-denied areas [4]. The increasing demands for indoor positioning-based services (IPS) contribute to the development of indoor positioning techniques, which provide reliable location information in areas with inadequate GPS coverage [5].
With the rapid development of micro-electromechanical systems (MEMS), different kinds of sensors including accelerometers, gyroscopes, magnetometers, and so on are integrated into an intelligent platform (e.g., smartphones) to realize the positioning [3,6,7]. Meanwhile, there are plenty of algorithms utilized for indoor positioning based on various sensors as well as their fusions [8,9]. These methods include Wi-Fi-based positioning [10], UWB-based positioning [11], blue-tooth-based positioning [12], inertial navigation system (INS) [13] and so on.
A visual positioning system (VPS) is also a promising solution for indoor positioning [14,15,16]. The VPS utilizes cameras to capture and analyze visual data (e.g., images and videos). Based on features extracted from this visual data, the system can realize the high-accuracy localization in indoor areas [17,18]. Scientists have already dedicated a lot of effort to this topic. Ref. [19] constructs a positioning system for the remote utilization of a drone in the laboratory. The positioning method consists of a parallel tracking and mapping algorithm, a monocular simultaneous localization and mapping algorithm (SLAM), and a homography transform-based estimation method. Both quantitative and qualitative experimental results demonstrate the robustness of the proposed method. A visual-based indoor positioning method utilizing stereo visual odometry and Inertial Measurement Unit (IMU) is proposed in [20]. This method utilizes the Unscented Kalman Filter (UKF) algorithm to realize the nonlinear data coupling, which is utilized to fuse the IMU data and the stereo-visual odometry. The experimental results indicate that the accuracy and robustness of the mobile robot localization are significantly improved. Ref. [21] proposed a visual positioning system for real-time pose estimation. It uses the IMU and an RGB-D camera to estimate the pose. The VPS uses the camera’s depth data extracts the geometric feature and integrates its measurement residuals with that of the visual features and the inertial data in a graph optimization framework to realize the pose estimation. The experimental results demonstrate the usefulness of this VPS.
Although there exists a variety of research on visual-based indoor positioning, most visual-based positioning techniques utilize the side-view visual data to realize high-accuracy positioning [22,23]. However, the side-view visual data are easily disturbed by surrounding environments. In our daily lives, there exist different kinds of obstacles within urban areas, including dynamic obstacles (e.g., surrounding pedestrians, pets, and other moving objects) and static obstacles (e.g., advertising signs and posters) [24]. Additionally, even in the same area, the environments within the side-view perspective vary during different periods due to the decoration and layout changes. Therefore, the complexity and variability of real-world scenes enhance the difficulty of image processing, thereby decreasing positioning accuracy. On the other hand, the side-view visual data captured in urban areas usually contains surrounding pedestrians and places, which may cause troubles related to privacy and security. The pedestrians captured in side-view data may be related to personal privacy (e.g., portrait rights). Some special places in side-view data may be confidential and should not be disclosed to the public or captured.
To avoid these problems, we present the concept of up-view visual-based positioning. It is noted that up-view means the vertical perspective from bottom to top. Firstly, the scenes within up-view visual data are much simpler than those in side-view visual data. Secondly, the layout of the up-view scenes (e.g., lights installed on the ceilings) do not change as frequently as the side-view scenes. Also, the up-view scenes seldom raise concerns about privacy and security. Moreover, the up-view visual data can be captured by the smartphone’s front camera, which is more in line with the natural state of a pedestrian during positioning with a handheld smartphone.
In this paper, we innovatively propose an up-view visual-based indoor positioning algorithm using YOLO V7. This method is composed of the following modules: (1) A deep-learning-based up-view landmark detection and extraction module, which is used for landmark detection and edge accurate extraction; (2) an up-view visual-based position calculation module, which is utilized to realize the single-point position calculation; (3) and an INS-based landmark matching module, which is utilized to realize the matching between the detected landmarks within up-view data and the real-world landmarks. In our strategy, we utilize images as the visual data and the lights installed on the ceilings as the up-view landmarks. Firstly we utilize the front camera of a smartphone and a self-developed application to automatically capture up-view images. Subsequently, the deep-learning-based up-view landmark detection and extraction module is utilized to realize the light detection and edge accurate extraction. During this step, we utilize YOLO V7 to detect the light within an up-view image. Based on the detection results, we obtain the gross region of the specific light and pixel coordinates of the light centroid. Then, we compensate for the exposure of the gross region. The edge operators are employed to realize the accurate edge extraction based on the compensated image, outputting the accurate pixel size of the light. Next, we need to calculate the location of the smartphone based on the light detection and extraction results and the pre-labeled light sequence. Utilizing the light’s real size and the pixel size, we figure out the scale ratio K between the pixel world and the real world. Then, we calculate the smartphone’s location based on the scale ratio K, the light’s pixel coordinates within the image, and the light’s real-world size via the principle of Similar Triangle. Besides the single point up-view-based position calculation, it is also necessary to realize the landmark matching during the kinematic positioning. This means we need to find the light that matches the specific up-view image from the pre-labeled light sequence. Therefore, we propose an INS-based landmark matching method. Assuming that we successfully capture and extract the lights from the up-view images at T k 1 and T k epoch. We also figured out the smartphone’s position at T k 1 epoch based on the up-view visual-based positioning method. Then, the smartphone’s position at T k epoch can be estimated based on the accelerometer and gyroscope data. We can find the light closest to the estimated position at T k epoch from the pre-labeled light sequence. This light is the one that matches the up-view image captured at T k epoch and that was utilized to realize the up-view-based positioning at T k epoch.
The main contributions of this work are as follows.
(1)
We innovatively propose an up-view visual-based indoor positioning algorithm, avoiding the shortcomings of the side-view visual-based positioning.
(2)
We propose a deep-learning-based up-view landmark detection and extraction method. This method combines the YOLO V7 model with the edge detection operators, realizing the high-accuracy up-view landmark detection and precision landmark extraction.
(3)
We propose an INS-based landmark matching method. This method uses IMU data to estimate the smartphone’s position and find the closest point from the pre-labeled light sequence, realizing the matching between up-view images and the light sequence.
(4)
To verify the feasibility of the up-view-based positioning concept, we conducted static experiments in a shopping mall near Aalto University and the laboratory at Finish Geospatial Research Institute (FGI). We also conduct kinematic experiments in FGI’s laboratory to further verify the performance of the proposed positioning algorithm.
The rest of this paper is organized as follows. Section 2 introduces the proposed up-view visual-based indoor positioning algorithm. Section 2.1 illustrates the positioning mechanism. Section 2.2 explains the deep-learning-based landmark detection and extraction method. In Section 2.3, we introduce the up-view visual-based position calculation method. Section 2.4 describes the INS-based landmark matching method. Section 3 gives the experimental design and the results. Finally, the conclusion is given in Section 4.

2. Up-View Visual-Based Indoor Positioning Algorithm

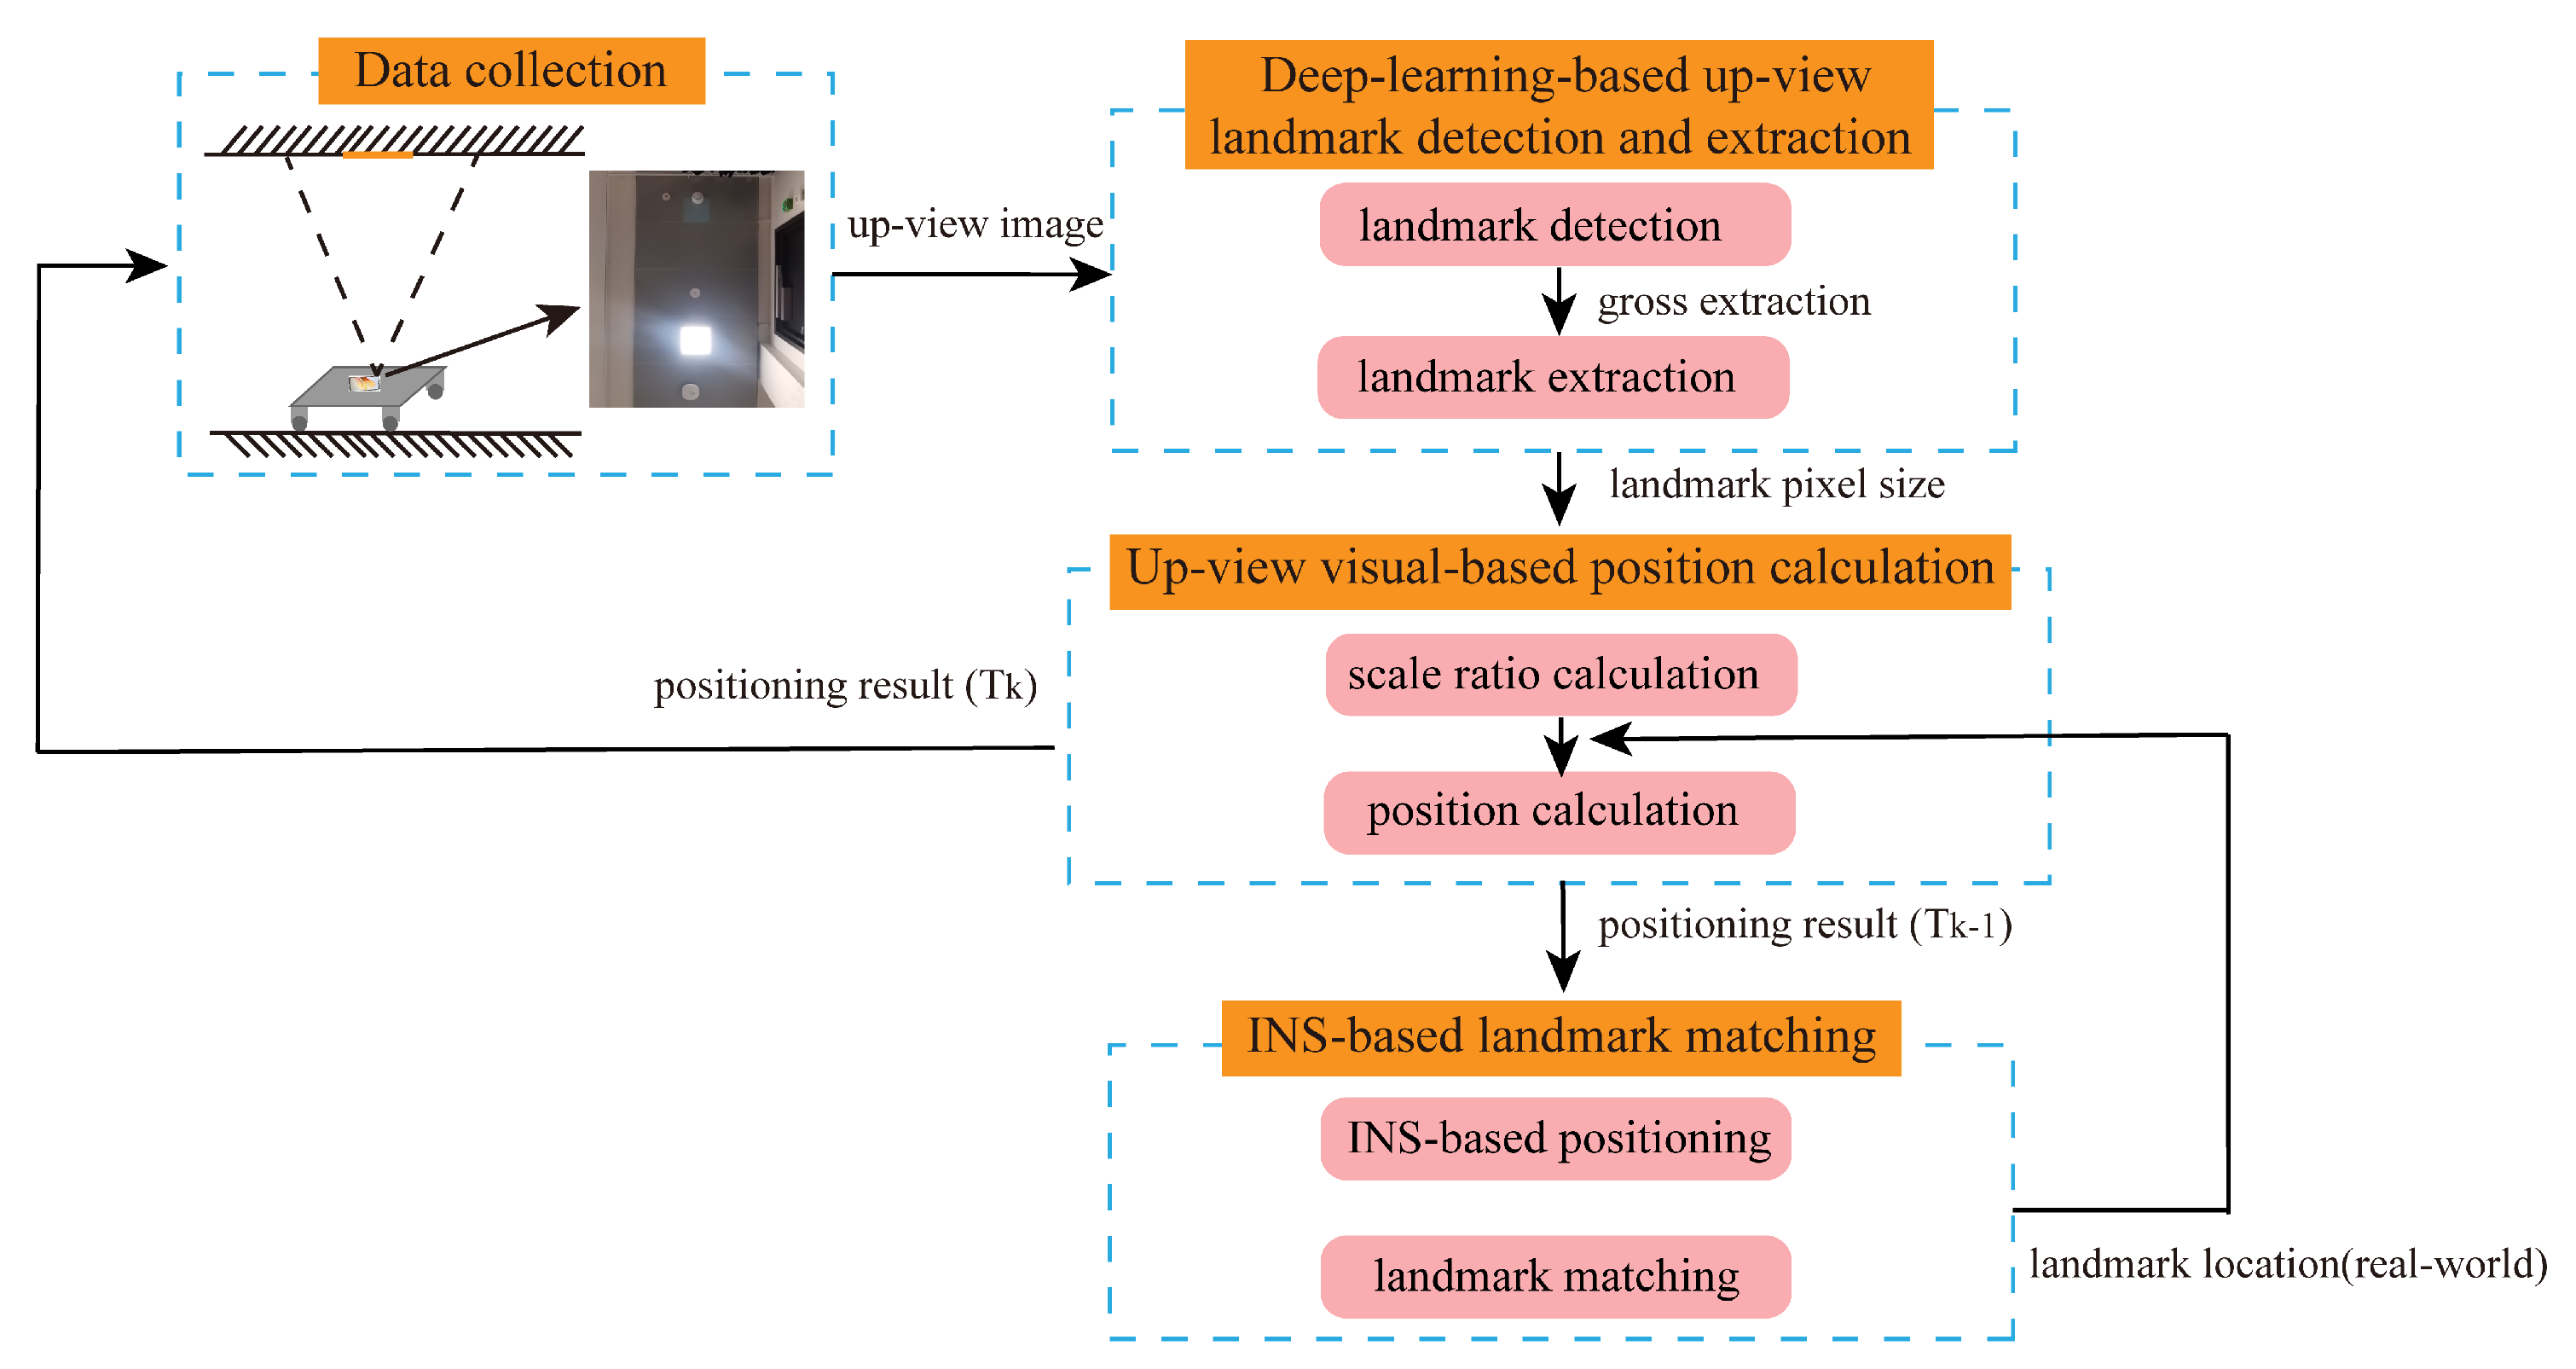
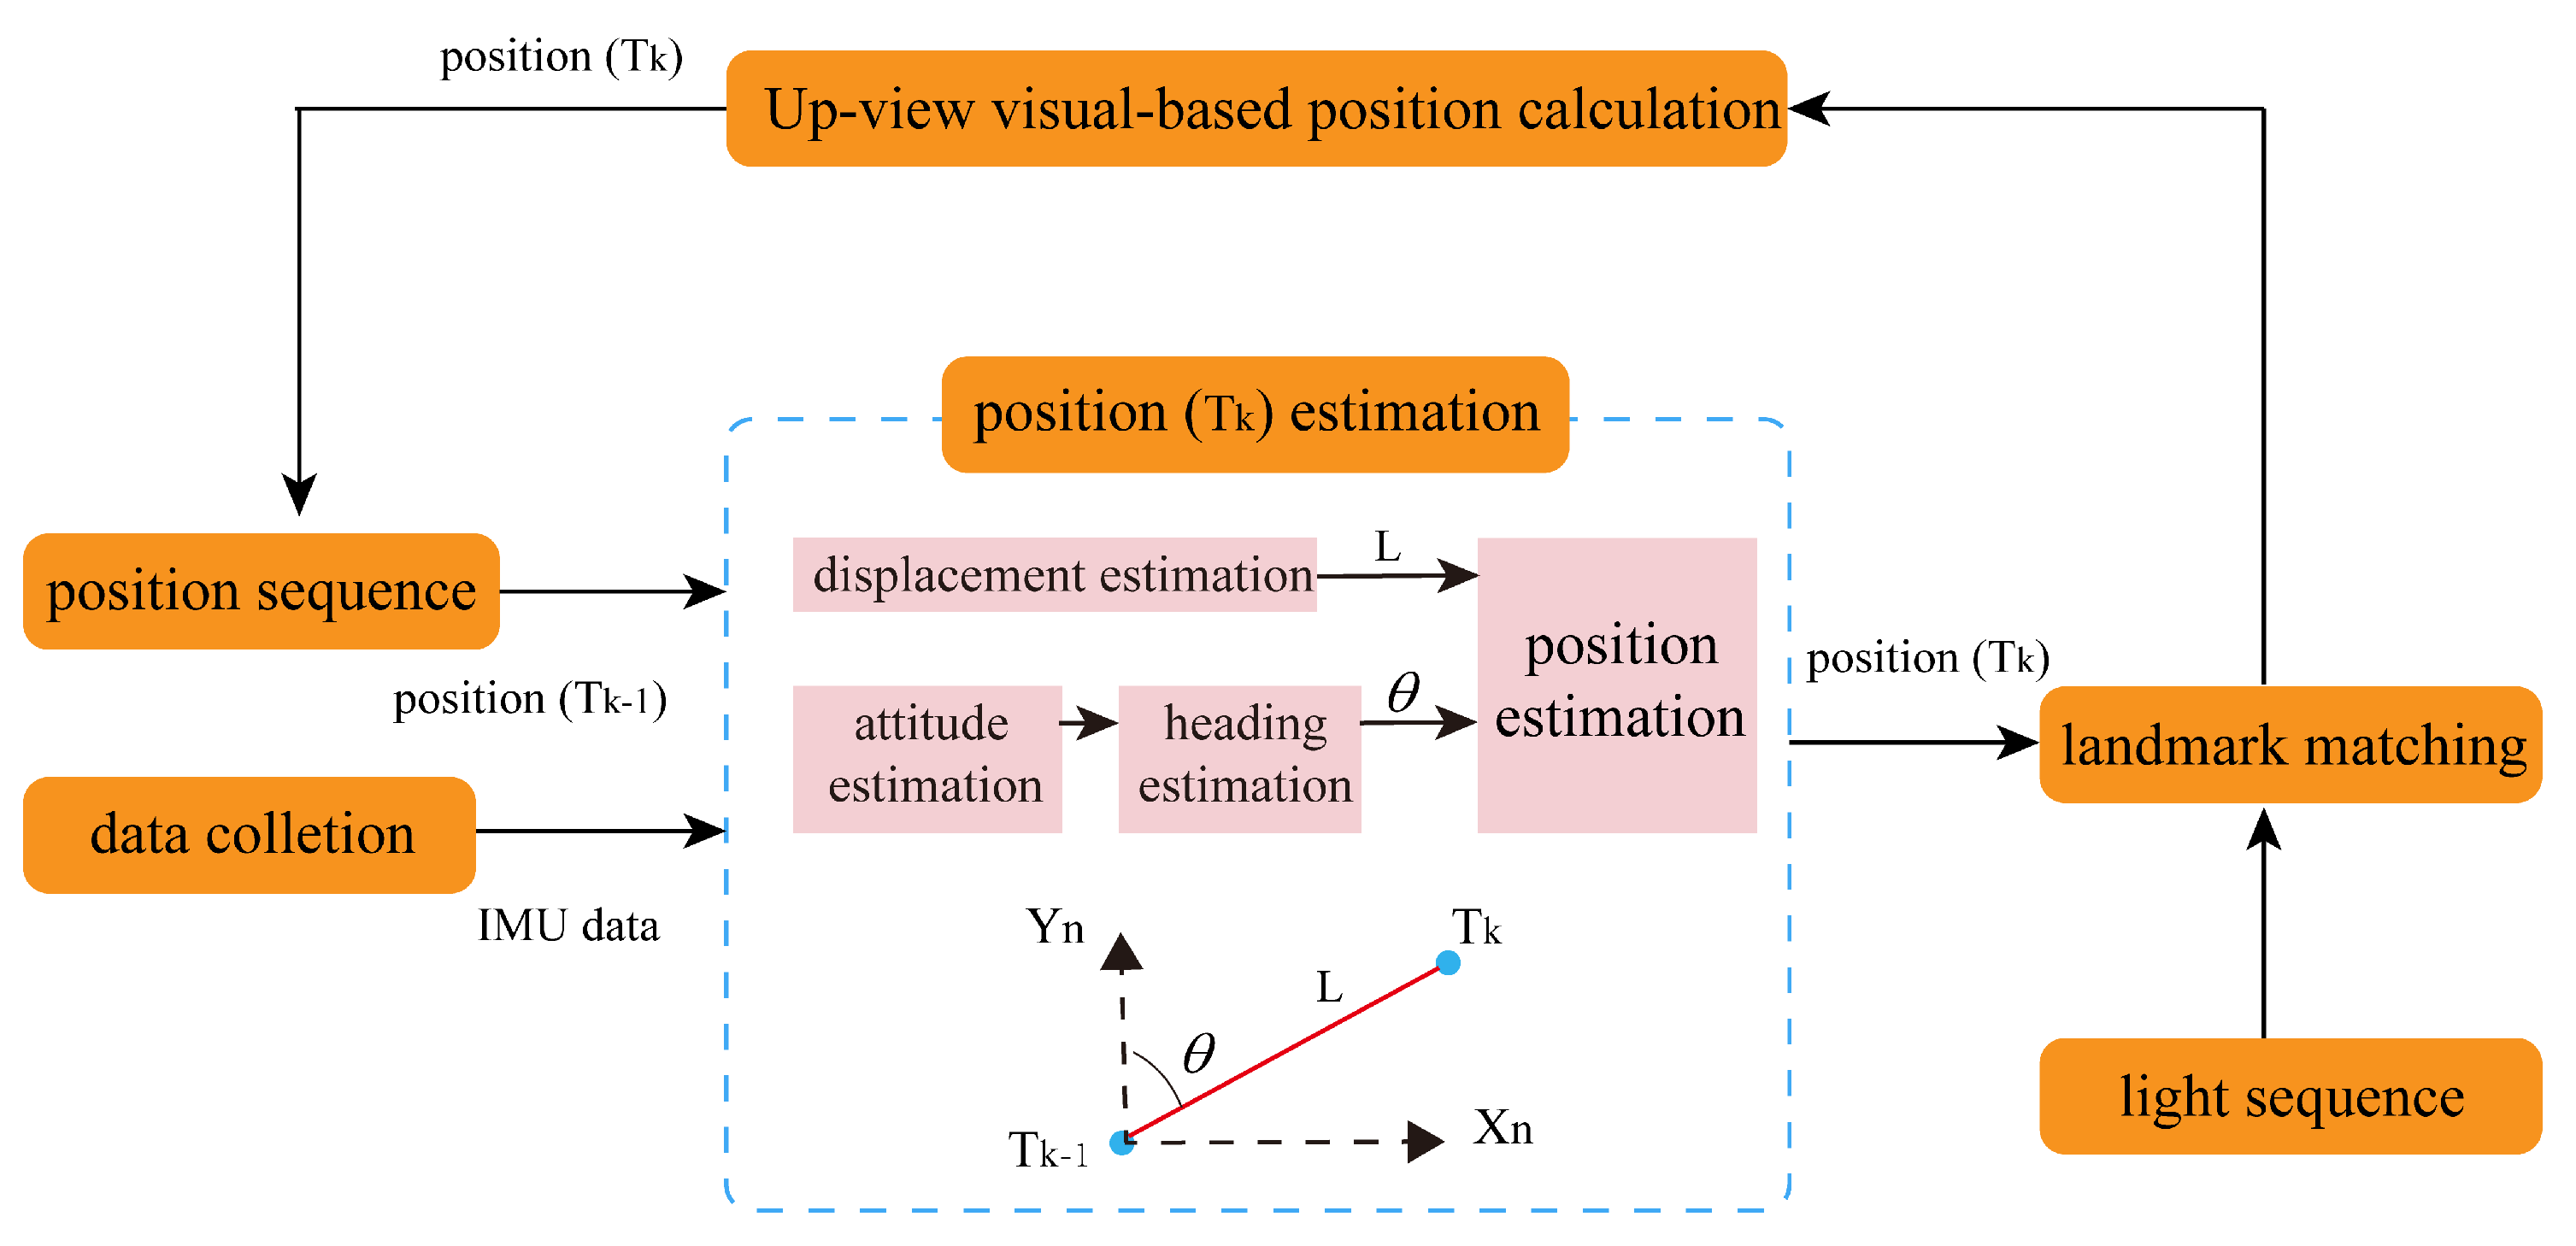
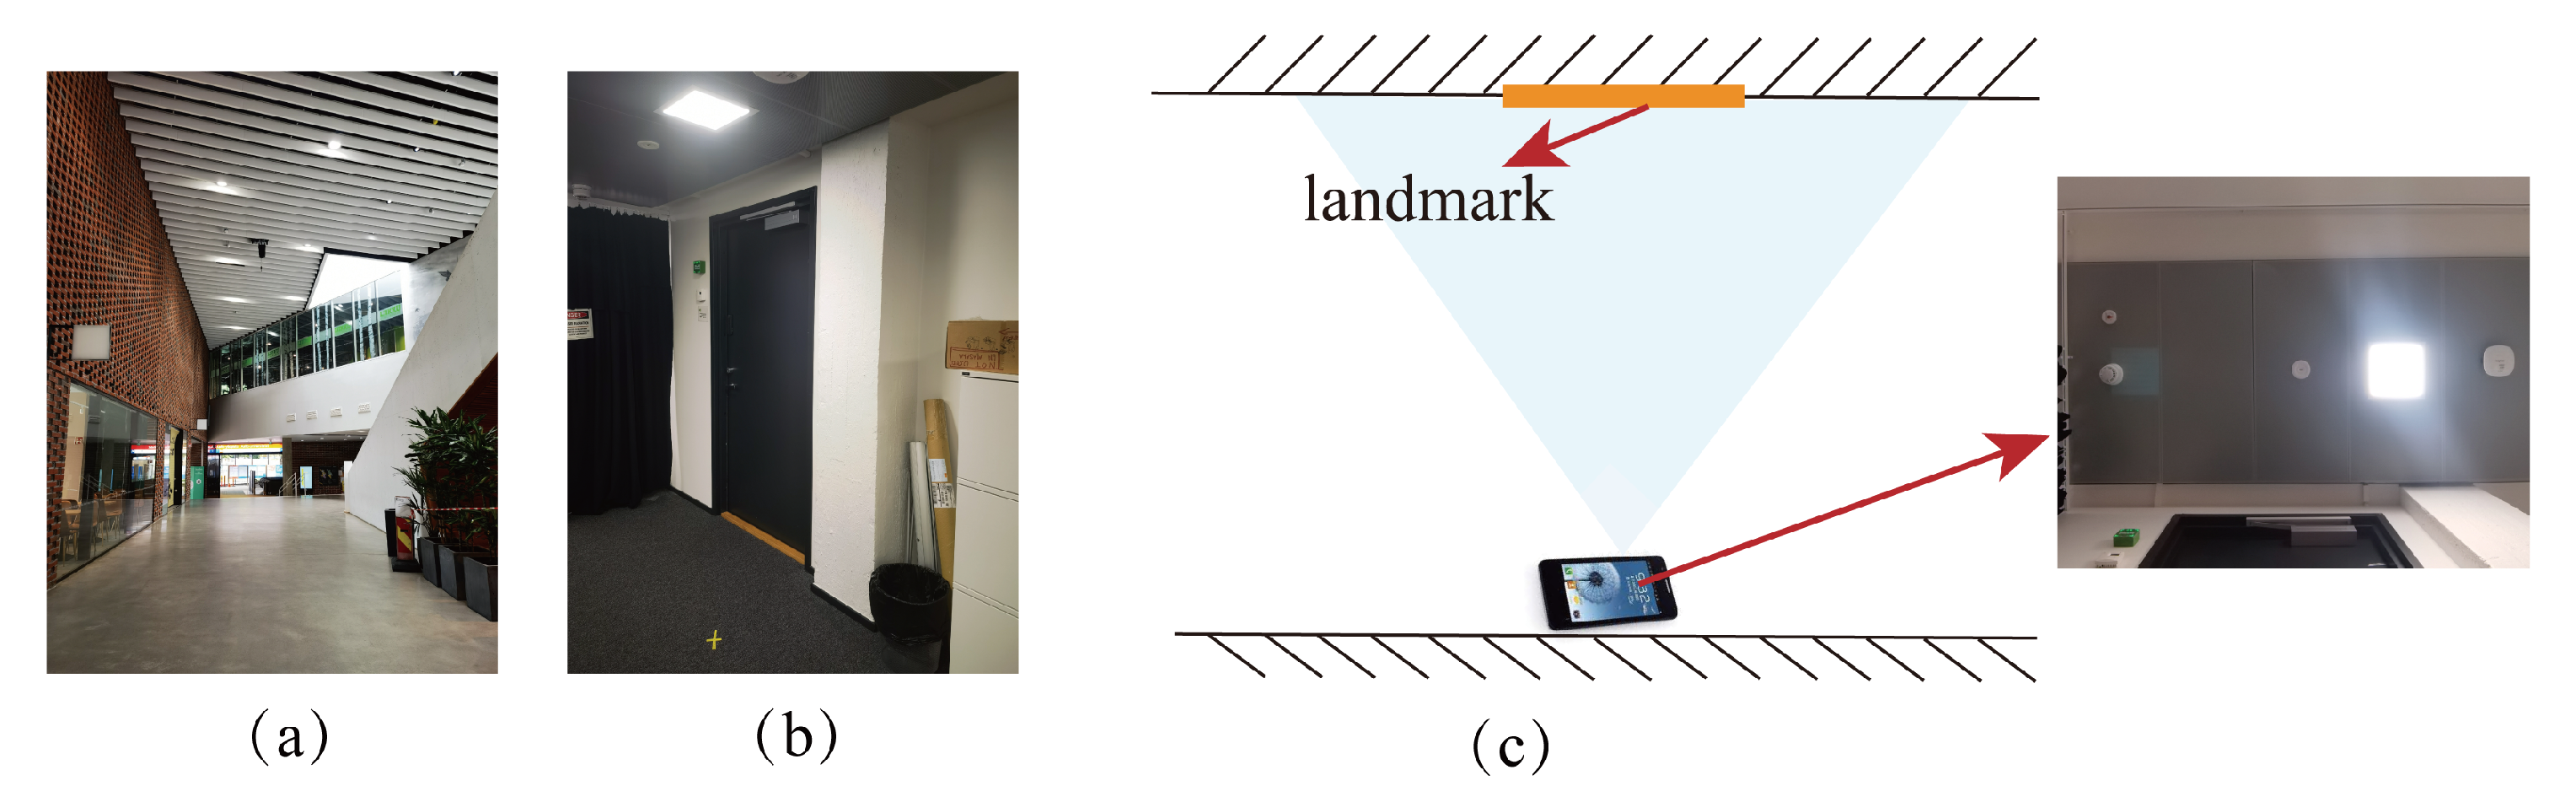
2.1. Up-View Visual-Based Indoor Positioning Mechanism

The up-view visual-based indoor positioning mechanism is shown in Figure 1. This method consists of four modules:
(1)
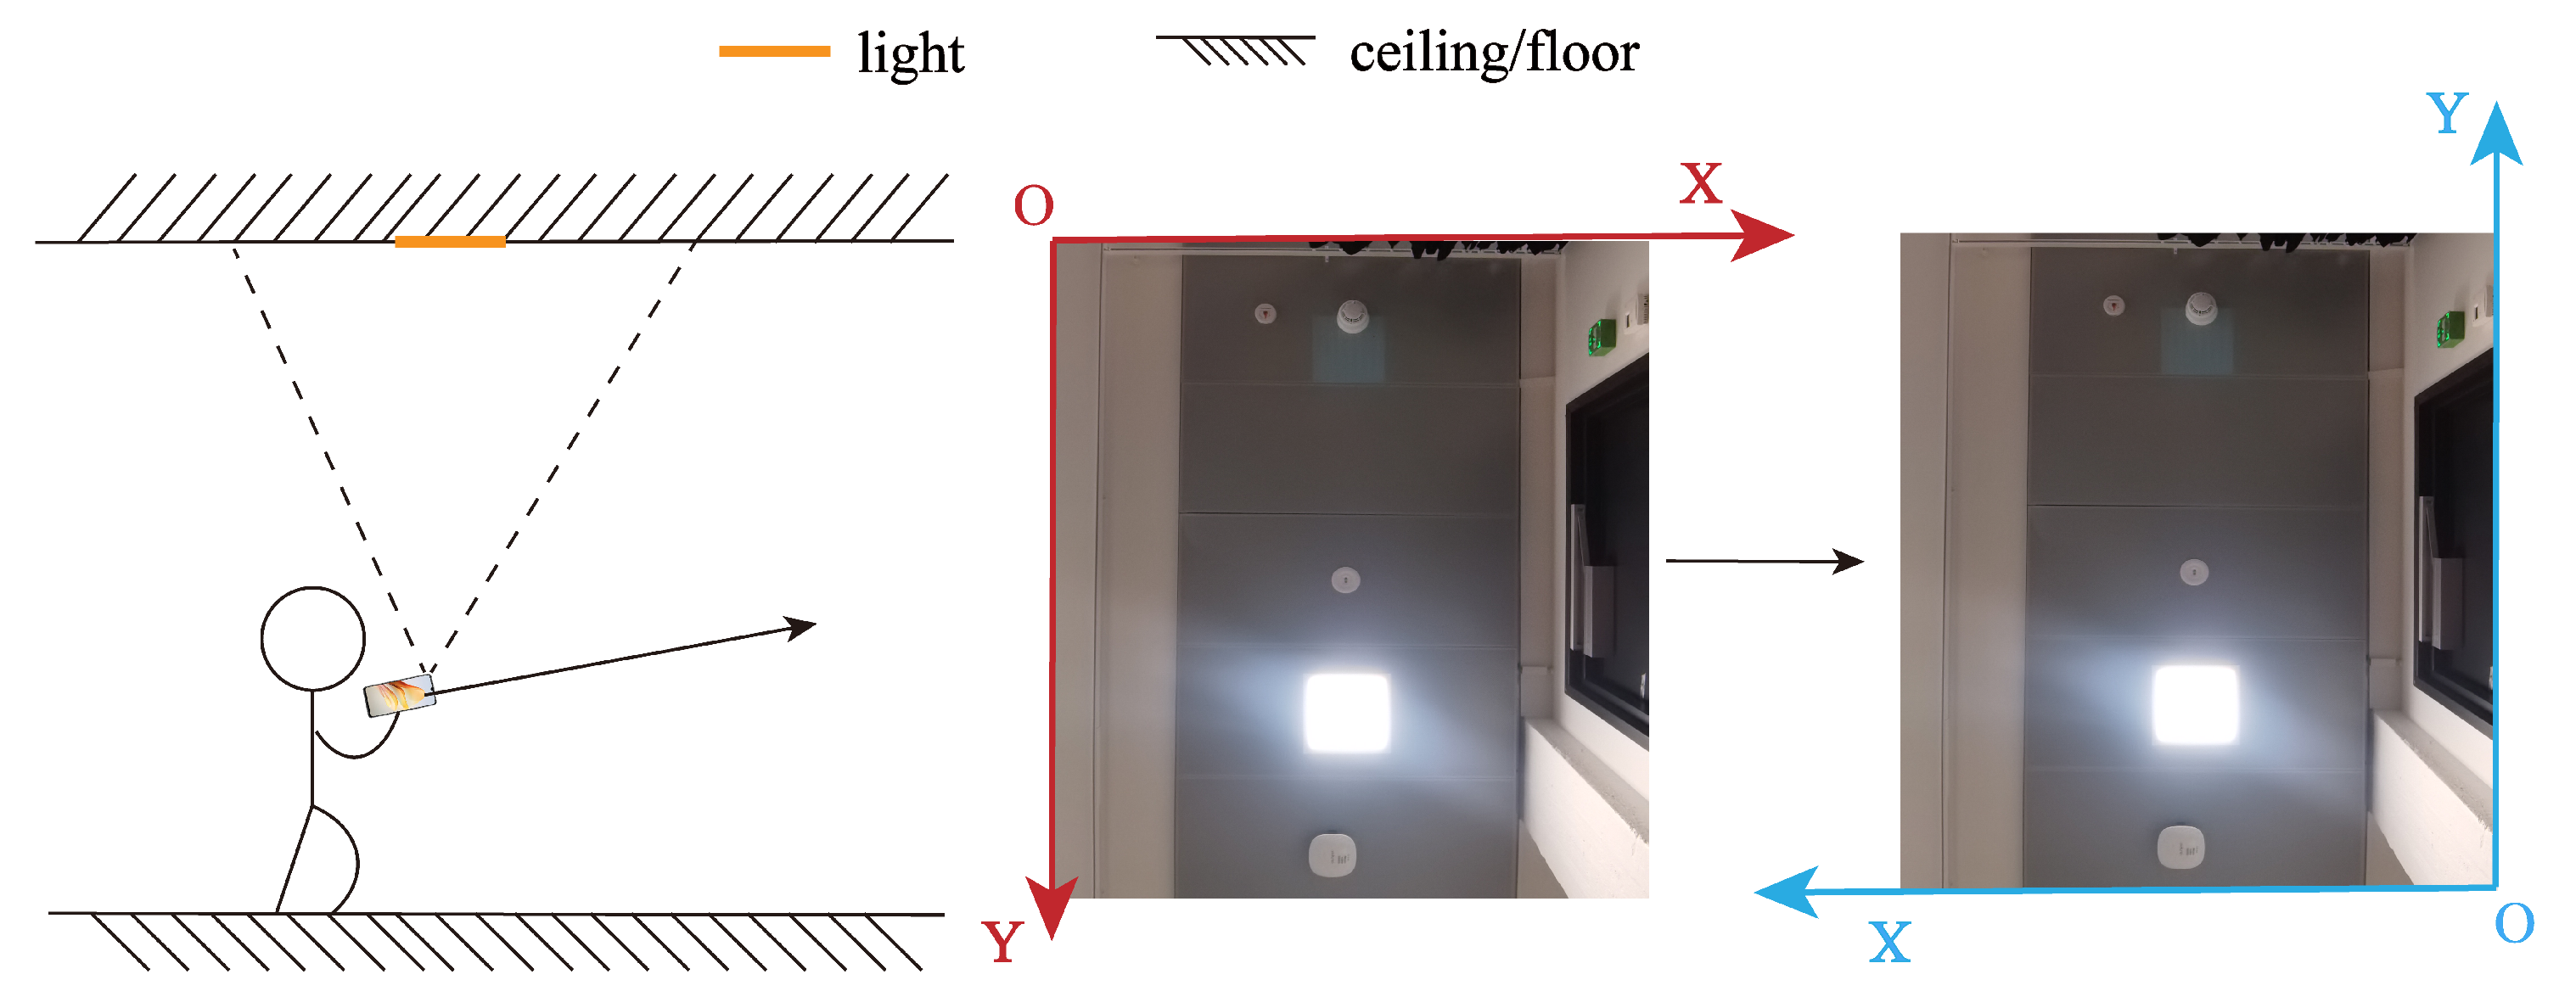
Data collection: This module uses the camera to capture the up-view images via self-developed software. Additionally, the smartphone’s self-contained sensor data is also collected.
(2)
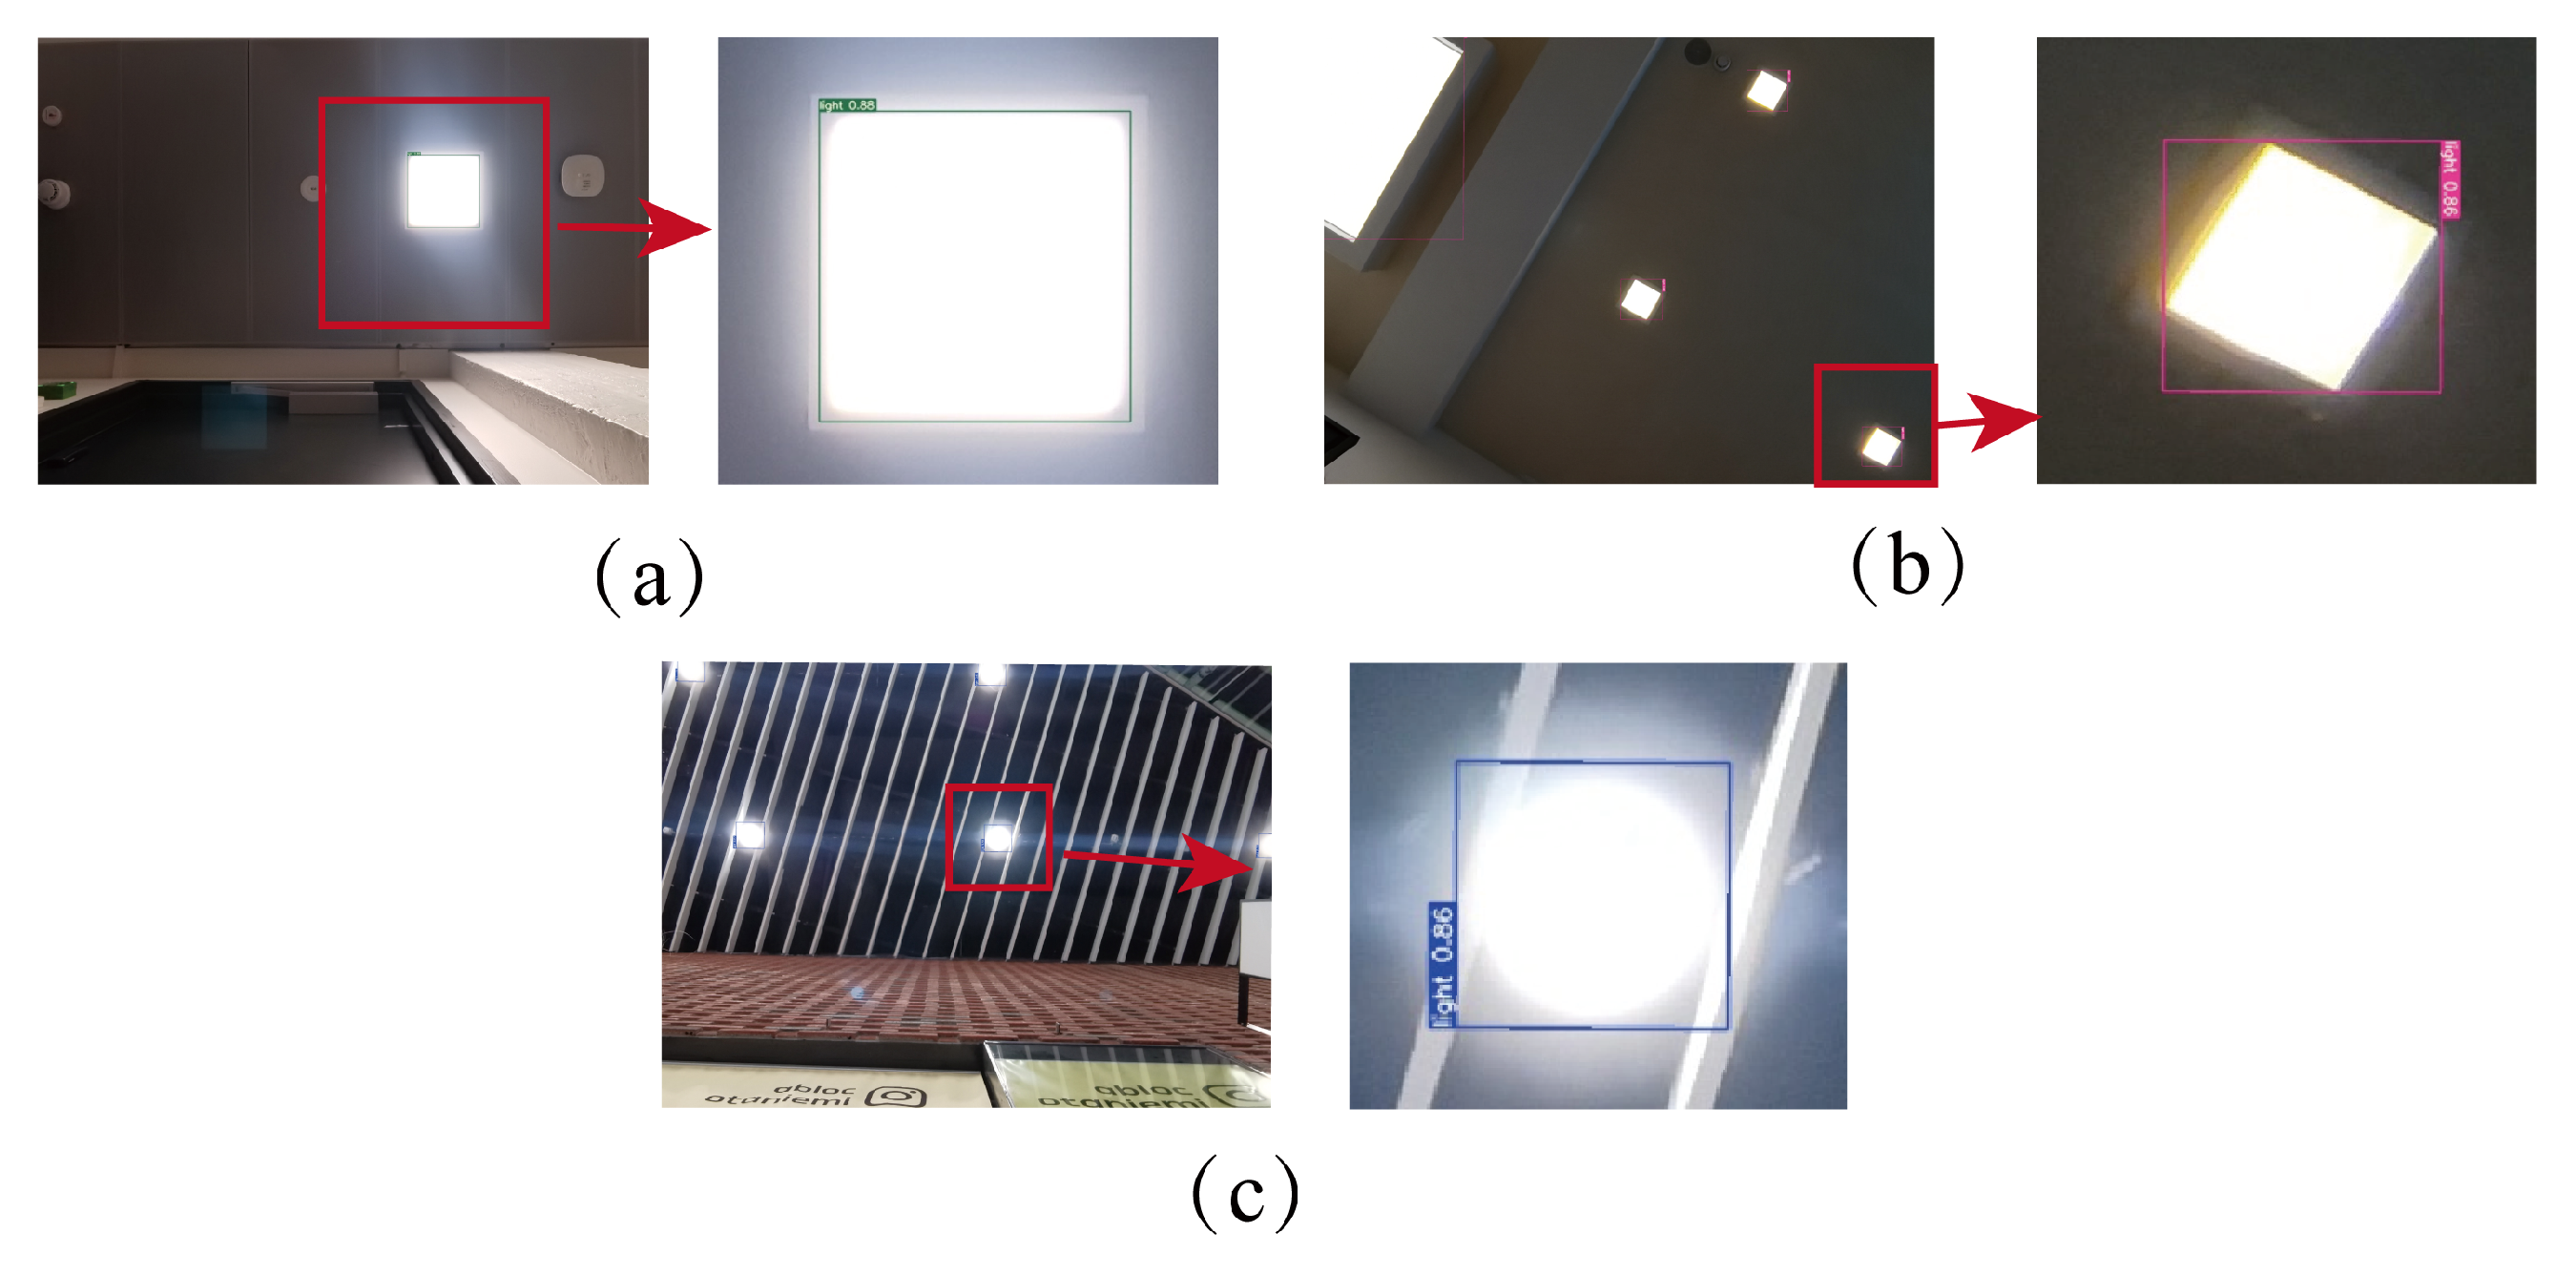
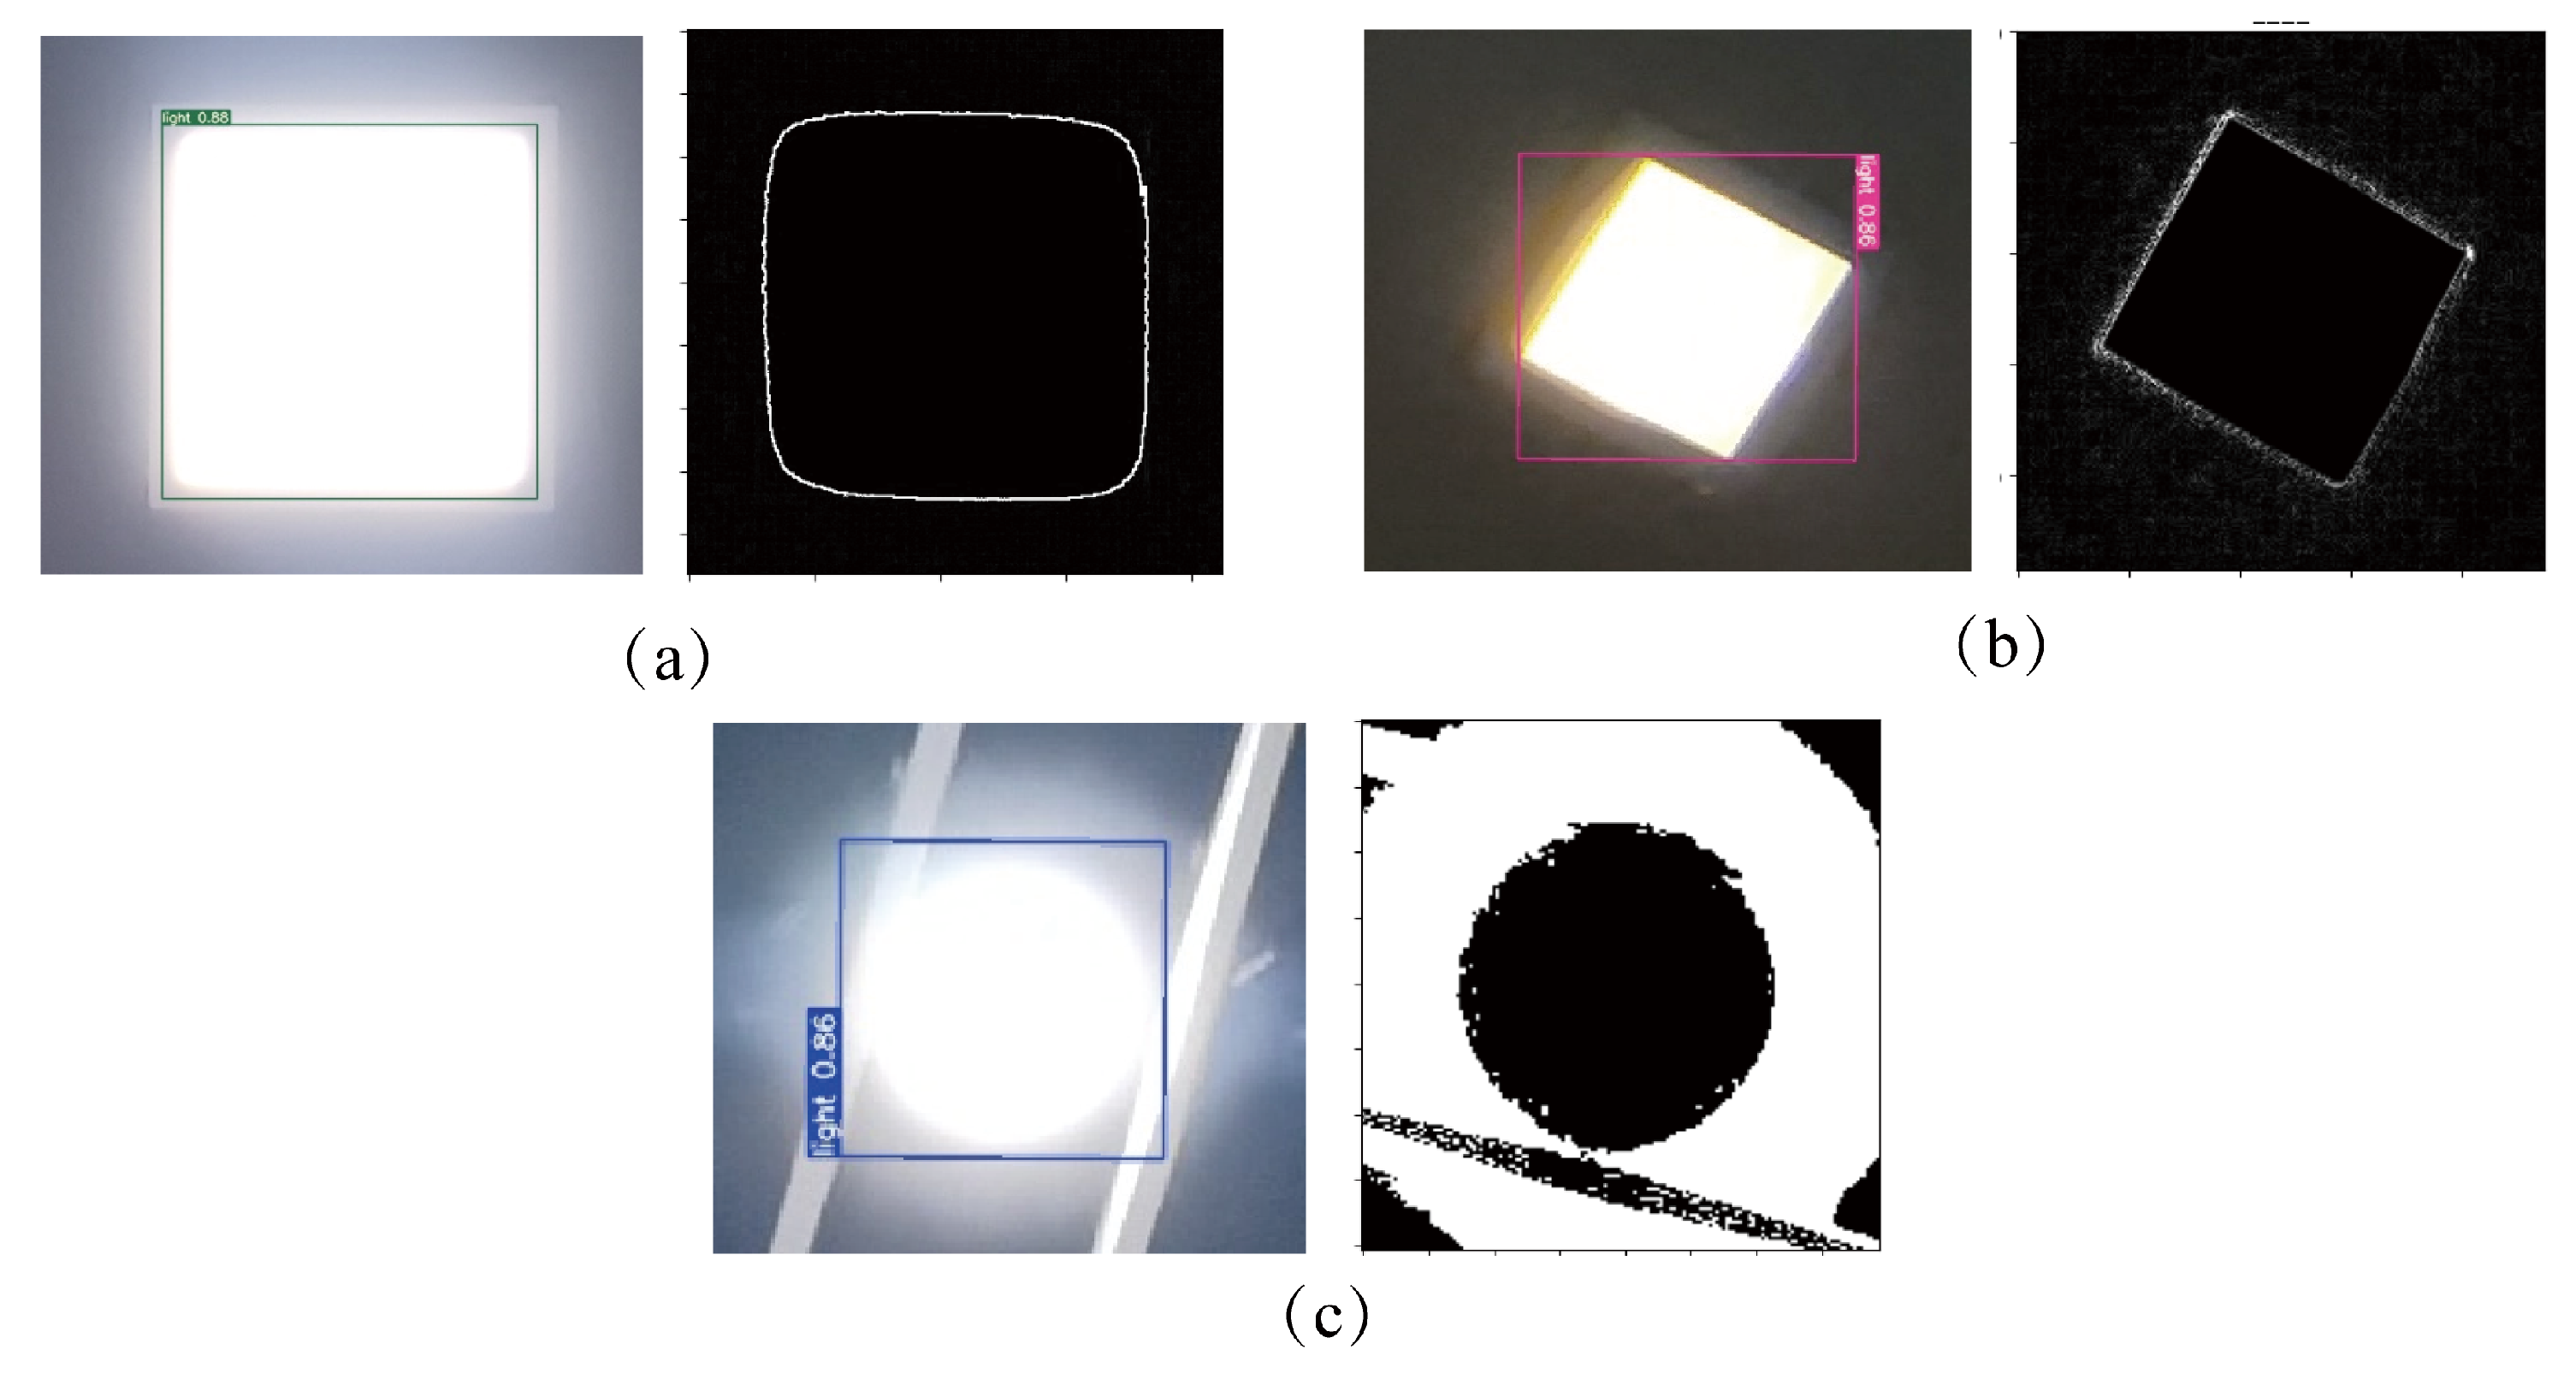
Deep-learning-based landmark detection and extraction module: This module uses YOLO V7 to realize landmark detection and gross extraction. Then, we compensate for the exposure of the extracted region. Finally, an edge detection operator is employed to realize landmark precise extraction, obtaining the landmark pixel size.
(3)
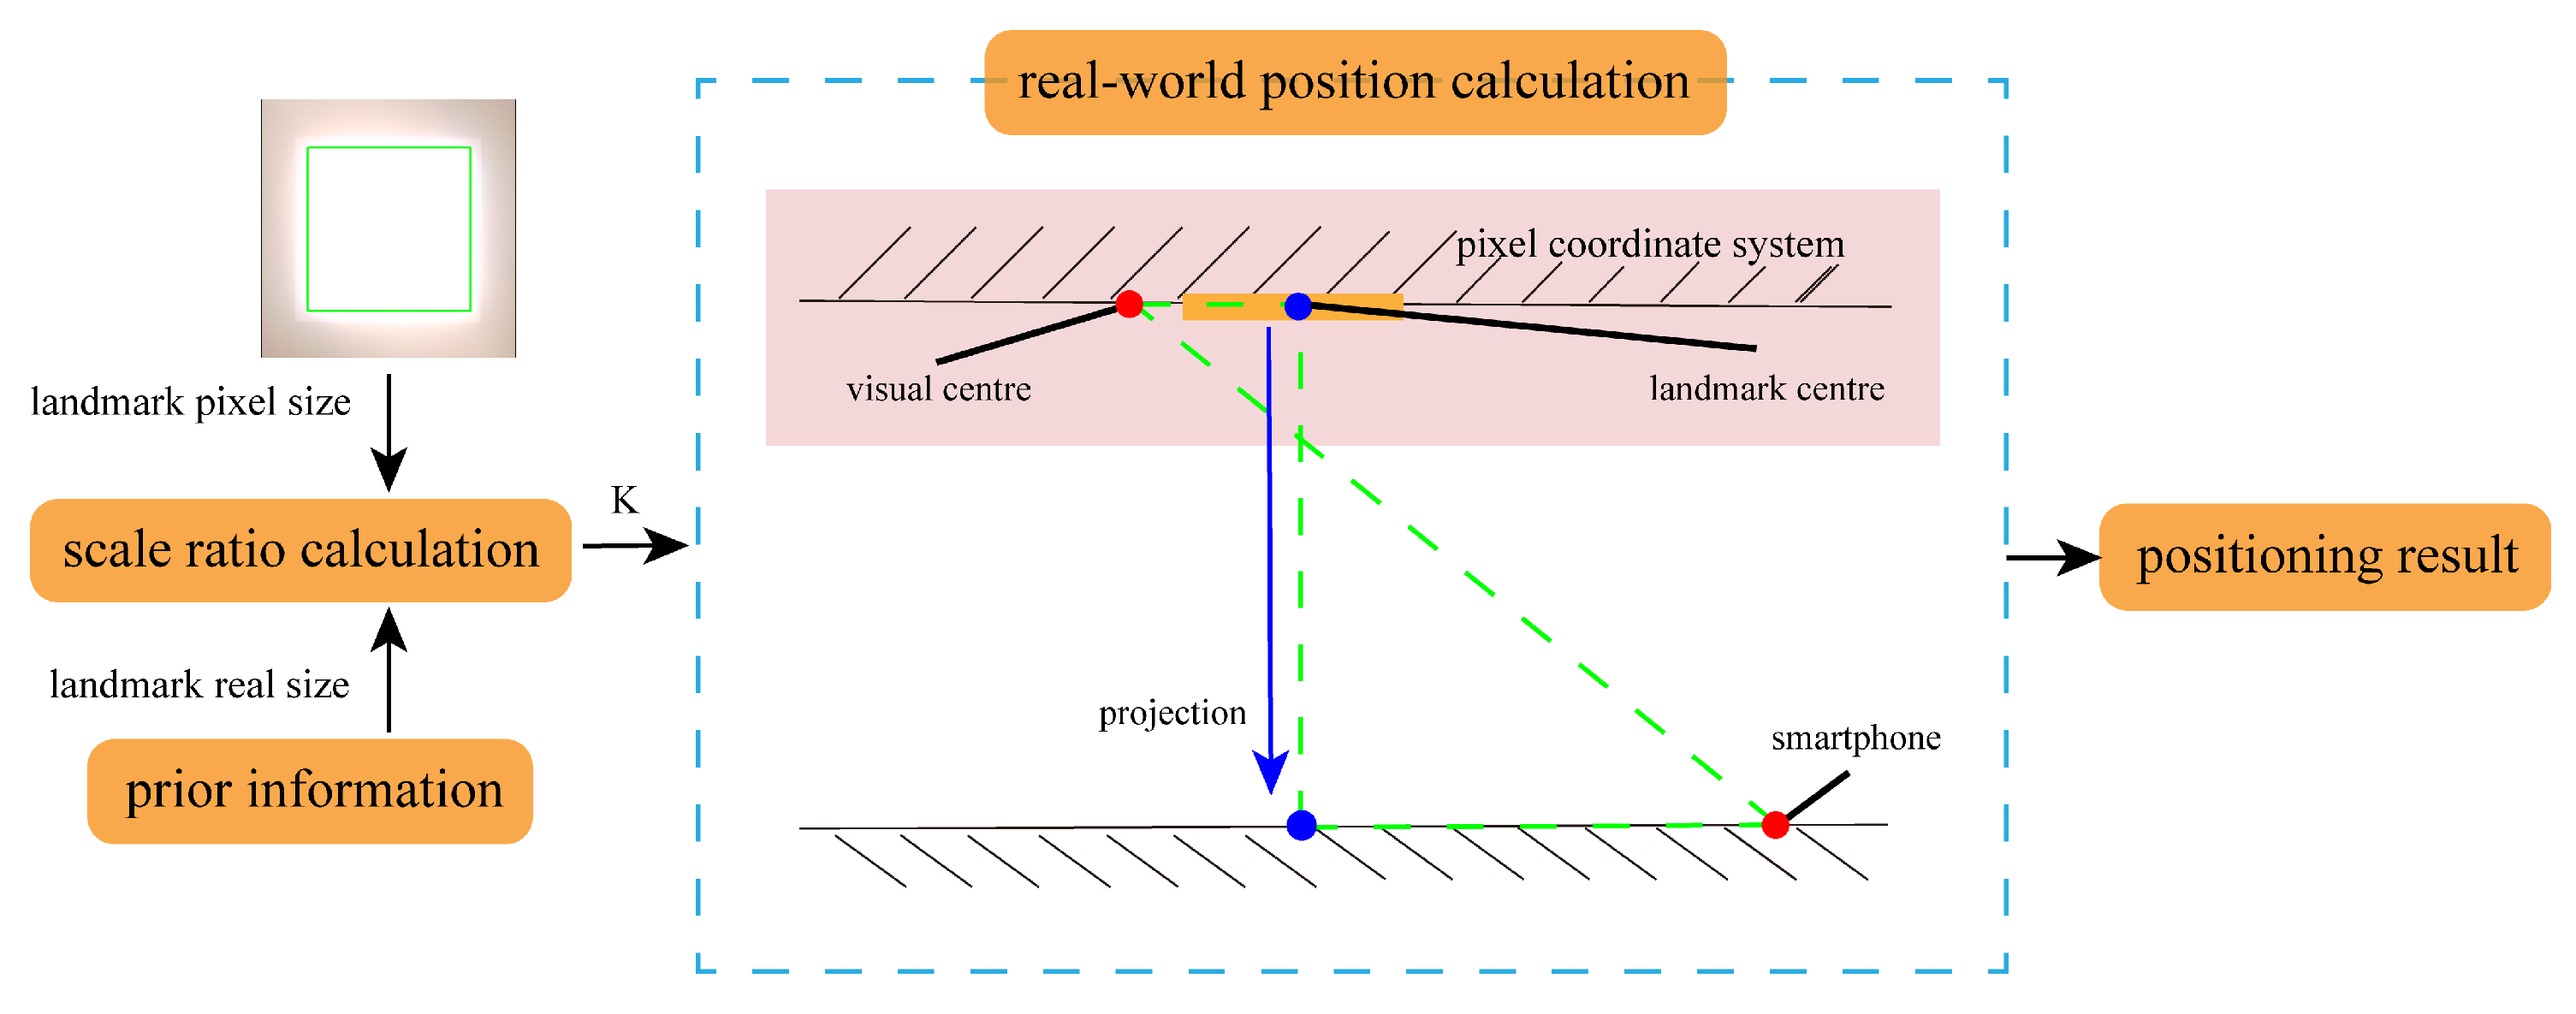
Up-view visual-based position calculation module: This module uses light’s pixel size and real size to figure the scale ratio between the pixel world and the real world. Then, it uses the Similar Triangle Principle to calculate the smartphone’s position based on the light’s pixel coordinates and real-world coordinates.
(4)
INS-based landmark matching module: This module utilizes the inertial sensors’ data to estimate the target’s position at the current epoch based on the target’s position at the previous epoch. Then, we match the up-view image and the real-world light based on the comparison between the estimated target’s position and the pre-labeled light sequence.
As shown in Figure 1, we use a smartphone to automatically capture the up-view images as the input of the deep-learning-based landmark detection and extraction module during the kinematic positioning. A well-trained YOLO V7 model is used to detect and extract the up-view landmark’s gross region. Subsequently, we utilize an edge detection algorithm to realize the precision landmark extraction and obtain the landmark pixel size. Based on the landmark pixel size and pre-measured real size, we figure out the scale ratio between the pixel world and the real world. The position is calculated based on the landmark pixel coordinate, landmark real-world coordinate, and the scale ratio, using the Similar Triangle Principle. Additionally, the INS-based landmark matching module plays an important role in obtaining the landmark real-world coordinate from the pre-labeled landmark sequence. We use inertial sensor data to estimate the smartphone’s position at the current epoch based on the smartphone’s position at the previous epoch. Then, comparing the estimated position and the pre-labeled landmark sequence, we choose the closest point as the landmark we want.

2.2. Deep-Learning-Based Landmark Detection and Extraction Method

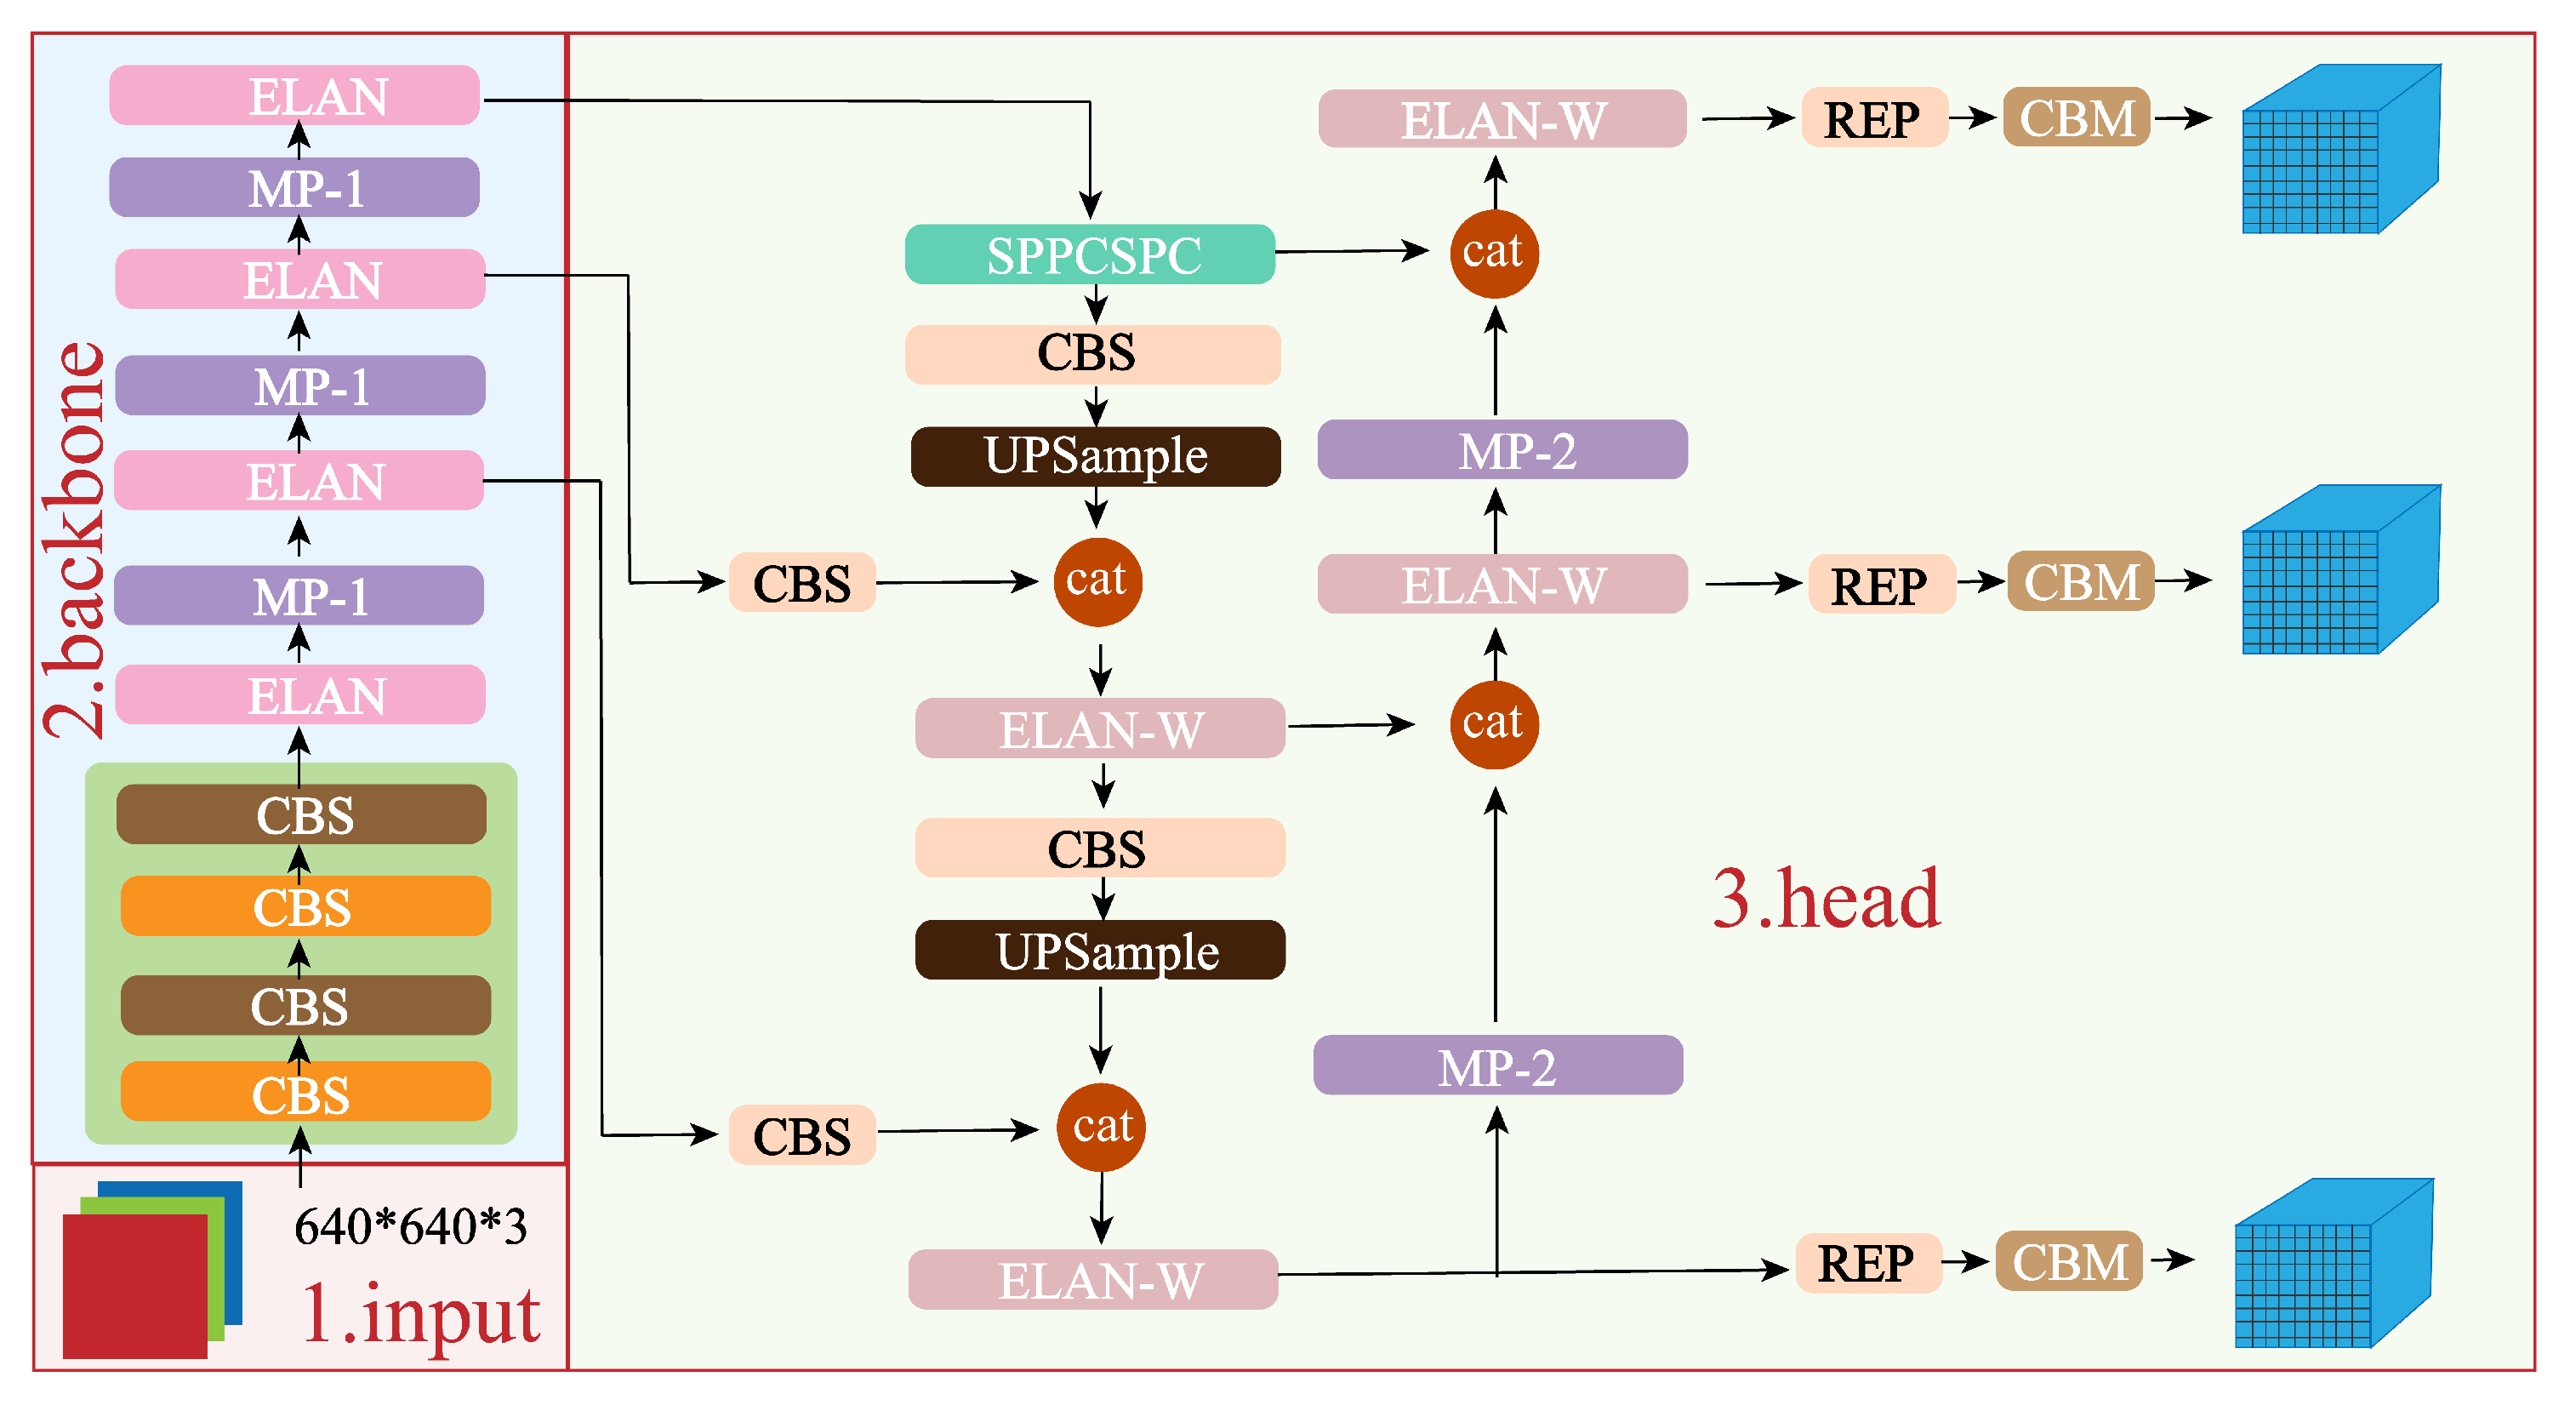
2.2.1. YOLO V7 Module

YOLO (You Only Look Once) is a groundbreaking object detection framework that revolutionized computer vision. It was first proposed in [25]. The YOLO series has evolved in recent years, each version refining and enhancing the framework’s performance. It began with YOLO V1 in 2016, followed by YOLO V2 in 2016 and YOLO V3 in 2018. The subsequent versions, including YOLO V4 and YOLO V5 in 2020, introduced architectural innovations and optimizations that further improved accuracy and speed. Recently, the YOLO series expanded with the introduction of YOLO V6 and YOLO V7, which have quickly gained prominence for their advancements in object detection. These improvements continue to push the boundaries of real-time detection capabilities, making YOLO a cornerstone in the field of computer vision and an excellent choice for various applications such as autonomous driving, surveillance, and more.
In our strategy, we utilize YOLO V7 to realize landmark detection. Aiming to increase accuracy while maintaining high detection speeds, YOLO V7 introduces several architectural reforms. In terms of architectural reforms, YOLO V7 introduces the extended efficient layer aggregation network (E-ELAN) into its backbone. The development of E-ELAN was guided by the analysis of factors influencing accuracy and speed, such as memory access cost, input/output channel ratio, and gradient path. Compound model scaling is another significant architectural reform presented in YOLO V7. This method satisfies different kinds of requirements for various applications. In some specific situations, it prioritizes precision, while highlighting the importance of speed in alternate situations. YOLO V7 extensively caters to real-world applications due to its flexibility, especially for accurate and efficient object detection.
Figure 2 illustrates the framework of the Yolo v7 model [26]. The input image is initially re-sized to 640 × 640 pixels and then fed into the backbone network. Subsequently, YOLO v7 typically employs the CSPDarknet53 architecture as its backbone, which is an efficient convolutional neural network structure. It is responsible for extracting features from the input image. Finally, the head layer network generates three feature map layers of different sizes. Rep and conv operations are utilized to produce predicted outcomes.

2.2.2. Edge Detection Algorithm

Objects’ edges within an image often correspond to abrupt changes in color, intensity, texture, or depth. Detecting edges is a crucial step in various image analysis tasks, such as object detection, image segmentation, and feature extraction. Edge detection is a fundamental technique in image processing that identifies boundaries and transitions between objects or different regions within an image, enabling machines to understand and interpret the visual information. Edge detection is not only a crucial preprocessing step for more advanced computer vision tasks but also serves as a way to reduce the amount of data in an image while preserving its significant features. It allows algorithms to focus on the most relevant information, making it a key tool in the analysis and interpretation of visual data. Numerous methods for edge detection exist, with popular edge detection operators including Sobel, Canny, Laplacian, Prewitt, and Roberts. Table 1 gives the introduction of several common operators.
In our strategy, considering the impact of environmental noise and the landmark features, we choose the Canny operator and Laplace operator to realize the edge detection.
The Laplacian operator serves as a second-order discrete differential operator. It detects edges by applying the Laplacian transform, distinguishing itself from first-order differential operators by capturing edges through the image’s second-order differential.
For two-dimensional images, the expression of the second-order Laplacian operator is expressed as follows:
2 f = d 2 f d x 2 + d 2 f d y 2
Meanwhile, the second-order differential is defined in Equation (2).
2 f = x ( f ( x + 1 , y ) f ( x , y ) ) + y ( f ( x , y + 1 ) f ( x , y ) )
which can be further expressed as Equation (3).
d 2 f d x 2 = f ( x + 1 , y ) + f ( x 1 , y ) 2 f ( x , y ) d 2 f d y 2 = f ( x , y + 1 ) + f ( x , y 1 ) 2 f ( x , y )
Then, Equation (1) can be expressed as follows:
2 f ( x , y ) = f ( x + 1 , y ) + f ( x 1 , y ) + f ( x , y + 1 ) + f ( x , y 1 ) 4 f ( x , y )
Therefore, the discrete Laplacian operator can be expressed as a 3 × 3 convolution kernel.
L = 0 1 0 1 4 1 0 1 0
The image is converted into grayscale. Subsequently, the Laplacian convolution kernel is employed to derive the Laplacian transform. Edges are identified at the zero crossing points in this transform. The pixel associated with the zero crossing point is designated as an edge.
The Canny operator identifies edges through the computation of the first-order differential. It subsequently employs the non-maximum suppression and double threshold method to enhance the accuracy and connectivity of edge detection.
Step 1: Using a Gaussian filter to reduce the noise.
G ( x , y ) = ( 1 2 π σ ) · e ( x 2 + y 2 2 σ 2 )
Step 2: Calculate the gradient of the image via the first-order differential operator. Then, calculate the gradient strength and direction using Equation (7).
G = x 2 + y 2 θ = a r c t a n ( G x G y )
Step 3: Conduct non-maximum suppression on the gradient image. Examine the gradient strength of neighboring pixels in alignment with the pixel’s gradient direction. If the current pixel’s gradient intensity is not the highest value within its vicinity along the gradient direction, reset the pixel’s gradient intensity to zero.
Step 4: Establish high and low thresholds to convert the gradient image into a binary form after the non-maximum suppression. Pixels with a gradient intensity surpassing the high threshold are classified as strong edges, while those falling below the low threshold are deemed non-edges. Pixels within the range of the two thresholds are identified as weak edges.
Step 5: Establish a complete edge by linking weak edges with strong edges. A weak edge pixel is designated as an edge only if it shares adjacency with a strong edge.

2.2.3. Deep-Learning-Based Up-View Landmark Detection and Extraction Mechanism

YOLO V7 is a remarkable object detection method with superior real-time performance and accuracy. YOLO V7 generates a bounding box and the predicted class for each detected object aiming to realize the object detection and highlight within an image. The bounding boxes can effectively outline the detected objects, that is, the gross edge extraction.
Although YOLO V7 can briefly detect and localize specific objects, it is specially designed for high-precision object detection and recognition rather than edge detection. Based on the YOLO V7 method, we can only obtain the gross region of specific objects. However, both landmark detection and high-precision edge extraction are necessary for the up-view visual-based positioning method. To realize the accurate edge extraction, it is necessary to introduce another edge detection method, like the Canny edge detector or the Laplacian operator. These methodologies are specially designed for edge extraction, promising to provide more precise results for edge-related tasks. Thus, we combine the YOLO V7 and the edge detection operators to realize high-precision landmark detection and extraction.
Figure 3 shows the framework of the proposed deep-learning-based up-view landmark detection and extraction method. Firstly, we utilize a smartphone to capture the up-view visual images. The visual data is used as the input of a well-trained YOLO V7 model. The YOLO V7 model generates bounding boxes to outline the detected objects, which indicates a region of interest. Since YOLO V7 cannot provide accurate edge detection, the bounding box might not accurately fit the landmark edge. Therefore, it is necessary to enlarge the region highlighted by the bounding box as the output of the gross extraction, which ensures the whole landmark extraction. This output is utilized for further processing in the next step. The gross extraction significantly reduces the computation cost and improves the efficiency.
Based on the gross extraction results, we further realize the accurate landmark extraction. Generally, the up-view visual data captured by the smartphone always along with different degrees of overexposure. To implement accurate edge detection, firstly, we conducted exposure compensation. Then, we utilized the edge detection operators to process the compensated visual data. Finally, we realized the accurate landmark extraction.
Based on the deep-learning-based landmark detection and extraction method, we obtained the accurate landmark pixel size, e.g., the edge length, the diameter, and so on. The landmark pixel size plays an important role in the following positioning algorithm.

2.3. Up-View Visual-Based Position Calculation Method

Visual-based positioning has been extensively applied in various fields, e.g., virtual reality, robotics, autonomous vehicles, and indoor positioning. With the development of deep learning and artificial intelligence algorithms, visual positioning technology has made significant advancements in recent years. In our strategy, we propose an up-view-based visual positioning method. This method innovatively utilizes the up-view visual data, which has crucial significance for indoor positioning.
Figure 4 demonstrates the up-view-based visual position calculation. Firstly, based on the pre-labeled landmark real size and the landmark pixel size, the scale ratio K can be calculated, indicating the scale ratio between the pixel size and the real-world size. The scale ratio K can be calculated using Equation (8).
K = L r e L p i x
where L r e is the real-world size of the landmark. L p i x means the pixel size of the landmark obtained by the deep-learning-based up-view landmark detection and extraction.
Subsequently, the smartphone position ( x s , y s ) can be calculated based on scale ratio K and the landmark position utilizing the principle of Similar Triangles. Firstly, the coordinate of light figured out by YOLO V7 can be transferred from the pixel frame to the pseudo-body frame according to Equation (9). As shown in Figure 5, the pseudo-body frame means that the axis direction is right-front, the same as the body frame. The lower right corner of the image is the origin.
( x p l , y p l ) = ( W i m g x p l 0 , H i m g y p l 0 ) ( x p c , y p c ) = ( W i m g 2 , H i m g 2 , )
where ( x p l 0 , y p l 0 ) indicates the pixel coordinate of the landmark centroid detection by YOLO V7. ( x p l , y p l ) indicates the coordinate of the landmark centroid in the pseudo-body frame. ( x p c , y p c ) is the visual center of the up-view visual data, that is, the center coordinate of an image in the pseudo-body frame. W i m g means the width of the image. H i m g means the height of the image. Then, the smartphone position can be derived using Equation (10).
( x s , y s ) = ( x l , y l ) + K · ( ( x p c , y p c ) ( x p l , y p l ) )
where ( x l , y l ) is the projection of the landmark centroid on the ground, which can be pre-labeled.

2.4. INS-Based Landmark Matching Method

As mentioned above, the object position is calculated based on the projection of the light centroid on the ground, which is pre-labeled. For the kinematic up-view-based positioning, it is necessary to realize the accurate matching of light sequences. That is, when we capture an up-view image and successfully detect and extract the light, we need to figure out which light it is in the light sequence. Therefore, in this section, we present an INS-based landmark matching method. The mechanism of the proposed method is shown in Figure 6. The yellow squares/rectangles indicate the lights. The red circles indicate that this light is “Missing”. “Missing” includes the following situations: (1) we do not capture the light due to the sampling frequency; (2) we fail to extract the light due to the poor image quality; (3) the up-view image does not contain the entire light. The green circles indicate that this light is “Matching”. “Matching” means that we successfully captured and extracted the entire light from the image. Additionally, we also successfully figured out which light it is in the light sequences and obtained the real-world coordinate of the light.
We pre-labeled the coordinates of lights and constructed the light sequence { L 1 , L 2 , L 3 , . . . , L k 1 , L k } . The cooresponding coordinates are { ( x l 1 , y l 1 ) , ( x l 2 , y l 2 ) , ( x l 3 , y l 3 ) , . . . ( x l k 1 , y l k 1 ) , ( x l k , y l k ) } . { T 1 , T 2 , T 3 , . . . , T k 1 , T k } means the time sequence. As shown in Figure 6. Assuming that we successfully capture and extract the lights at T k 1 and T k epoch, the light L k 1 matches the image captured at T k 1 epoch. We calculated the smartphone’s position using the up-view visual-based position calculation method mentioned above. Then, the smartphone’s position at T k epoch was estimated based on the inertial sensors’ data, including the accelerometer and gyroscope. Compared to the light sequence, we found the light closest to the estimated position at T k epoch. This light is considered as the one that matches the up-view image captured at T k epoch.
The framework of the INS-based landmark matching method is shown in Figure 7. Firstly, the smartphone’s position in the navigation coordinate system at T k 1 epoch is ( x T k 1 n , y T k 1 n ) . Ignoring error compensations like the earth’s rotation, figured out the smartphone’s attitudes based on the gyroscope’s data via Equation (11).
C ˙ b ( k 1 ) n = C b ( k 2 ) n · ( ω k 2 b b g ) θ k 1 = a r c t a n C b ( 21 ) n ( k 1 ) C b ( 11 ) n ( k 1 )
where C b ( k 1 ) n means the rotation matrix from the body frame to the navigation frame. ω b is the gyroscope’s data. b g is the gyroscope’s zero offset. C b ( i j ) n represents the item in row i and column j of rotation matrix. Then, the velocity and the displacement in the navigation coordinate system can be expressed as:
v k n = v k 1 n + C b ( k 1 ) n k 1 k C b ( t ) n · f ( t ) b d t + v k 1 G / C o r L k 1 , k = k 1 k v t n d t
where v k 1 G / C o r means compensations for Coriolis error and gravity.
v k 1 G / C o r = k 1 k g n ( 2 ω i e n + ω e n n ) v t n d t g n = [ 0 , 0 , g ] T
where g is the gravity. ω i e n is the earth’s rotation angular velocity in the navigation coordinate system. ω e n n is the angular velocity of the navigation coordinate system to the ECEF (Earth-Centered Earth-Fixed Coordinate System) coordinate system.
( x T k 1 n , y T k 1 n ) can be estimated based on L k 1 , k and θ k 1 , as shown in Equation (14).
x T k n = ( x T k n + L k 1 , k · s i n ( θ k 1 ) y T k n = ( y T k n + L k 1 , k · c o s ( θ k 1 )
Comparing ( x T k n , y T k n ) and the pre-labeled light sequence, we found the light closest to the estimated position at T k epoch. This light is considered as the one that matches the up-view image captured at T k epoch. Then, we utilized the up-view visual-based position calculation method mentioned above to update the smartphone’s position at the T k epoch. The updated ( x T k n , y T k n ) was introduced into the position sequence and utilized during the following positioning.

3. Experiments and Results

The experiments can be categorized into three groups: landmark detection and extraction, static single-point experiment, and kinematic positioning experiments.
To verify the feasibility and the performance of the proposed up-view visual-based indoor positioning algorithm, we conducted static and kinematic experiments. In our strategy, we chose the lights installed on the ceilings as the up-view landmark due to their common and extensive distribution in indoor areas. The projection points of the light centroid on the ground and the lights’ size were pre-labeled. Additionally, we chose the image as the up-view visual data. We used the Huawei Mate40 Pro for the static experiments and the Huawei Mate40 Pro, OnePlus Nord CE, and Xiaomi Redmi Note 11 for kinematic experiments, released by Huawei (China), OnePlus (China) and Xiaomi (China), respectively.

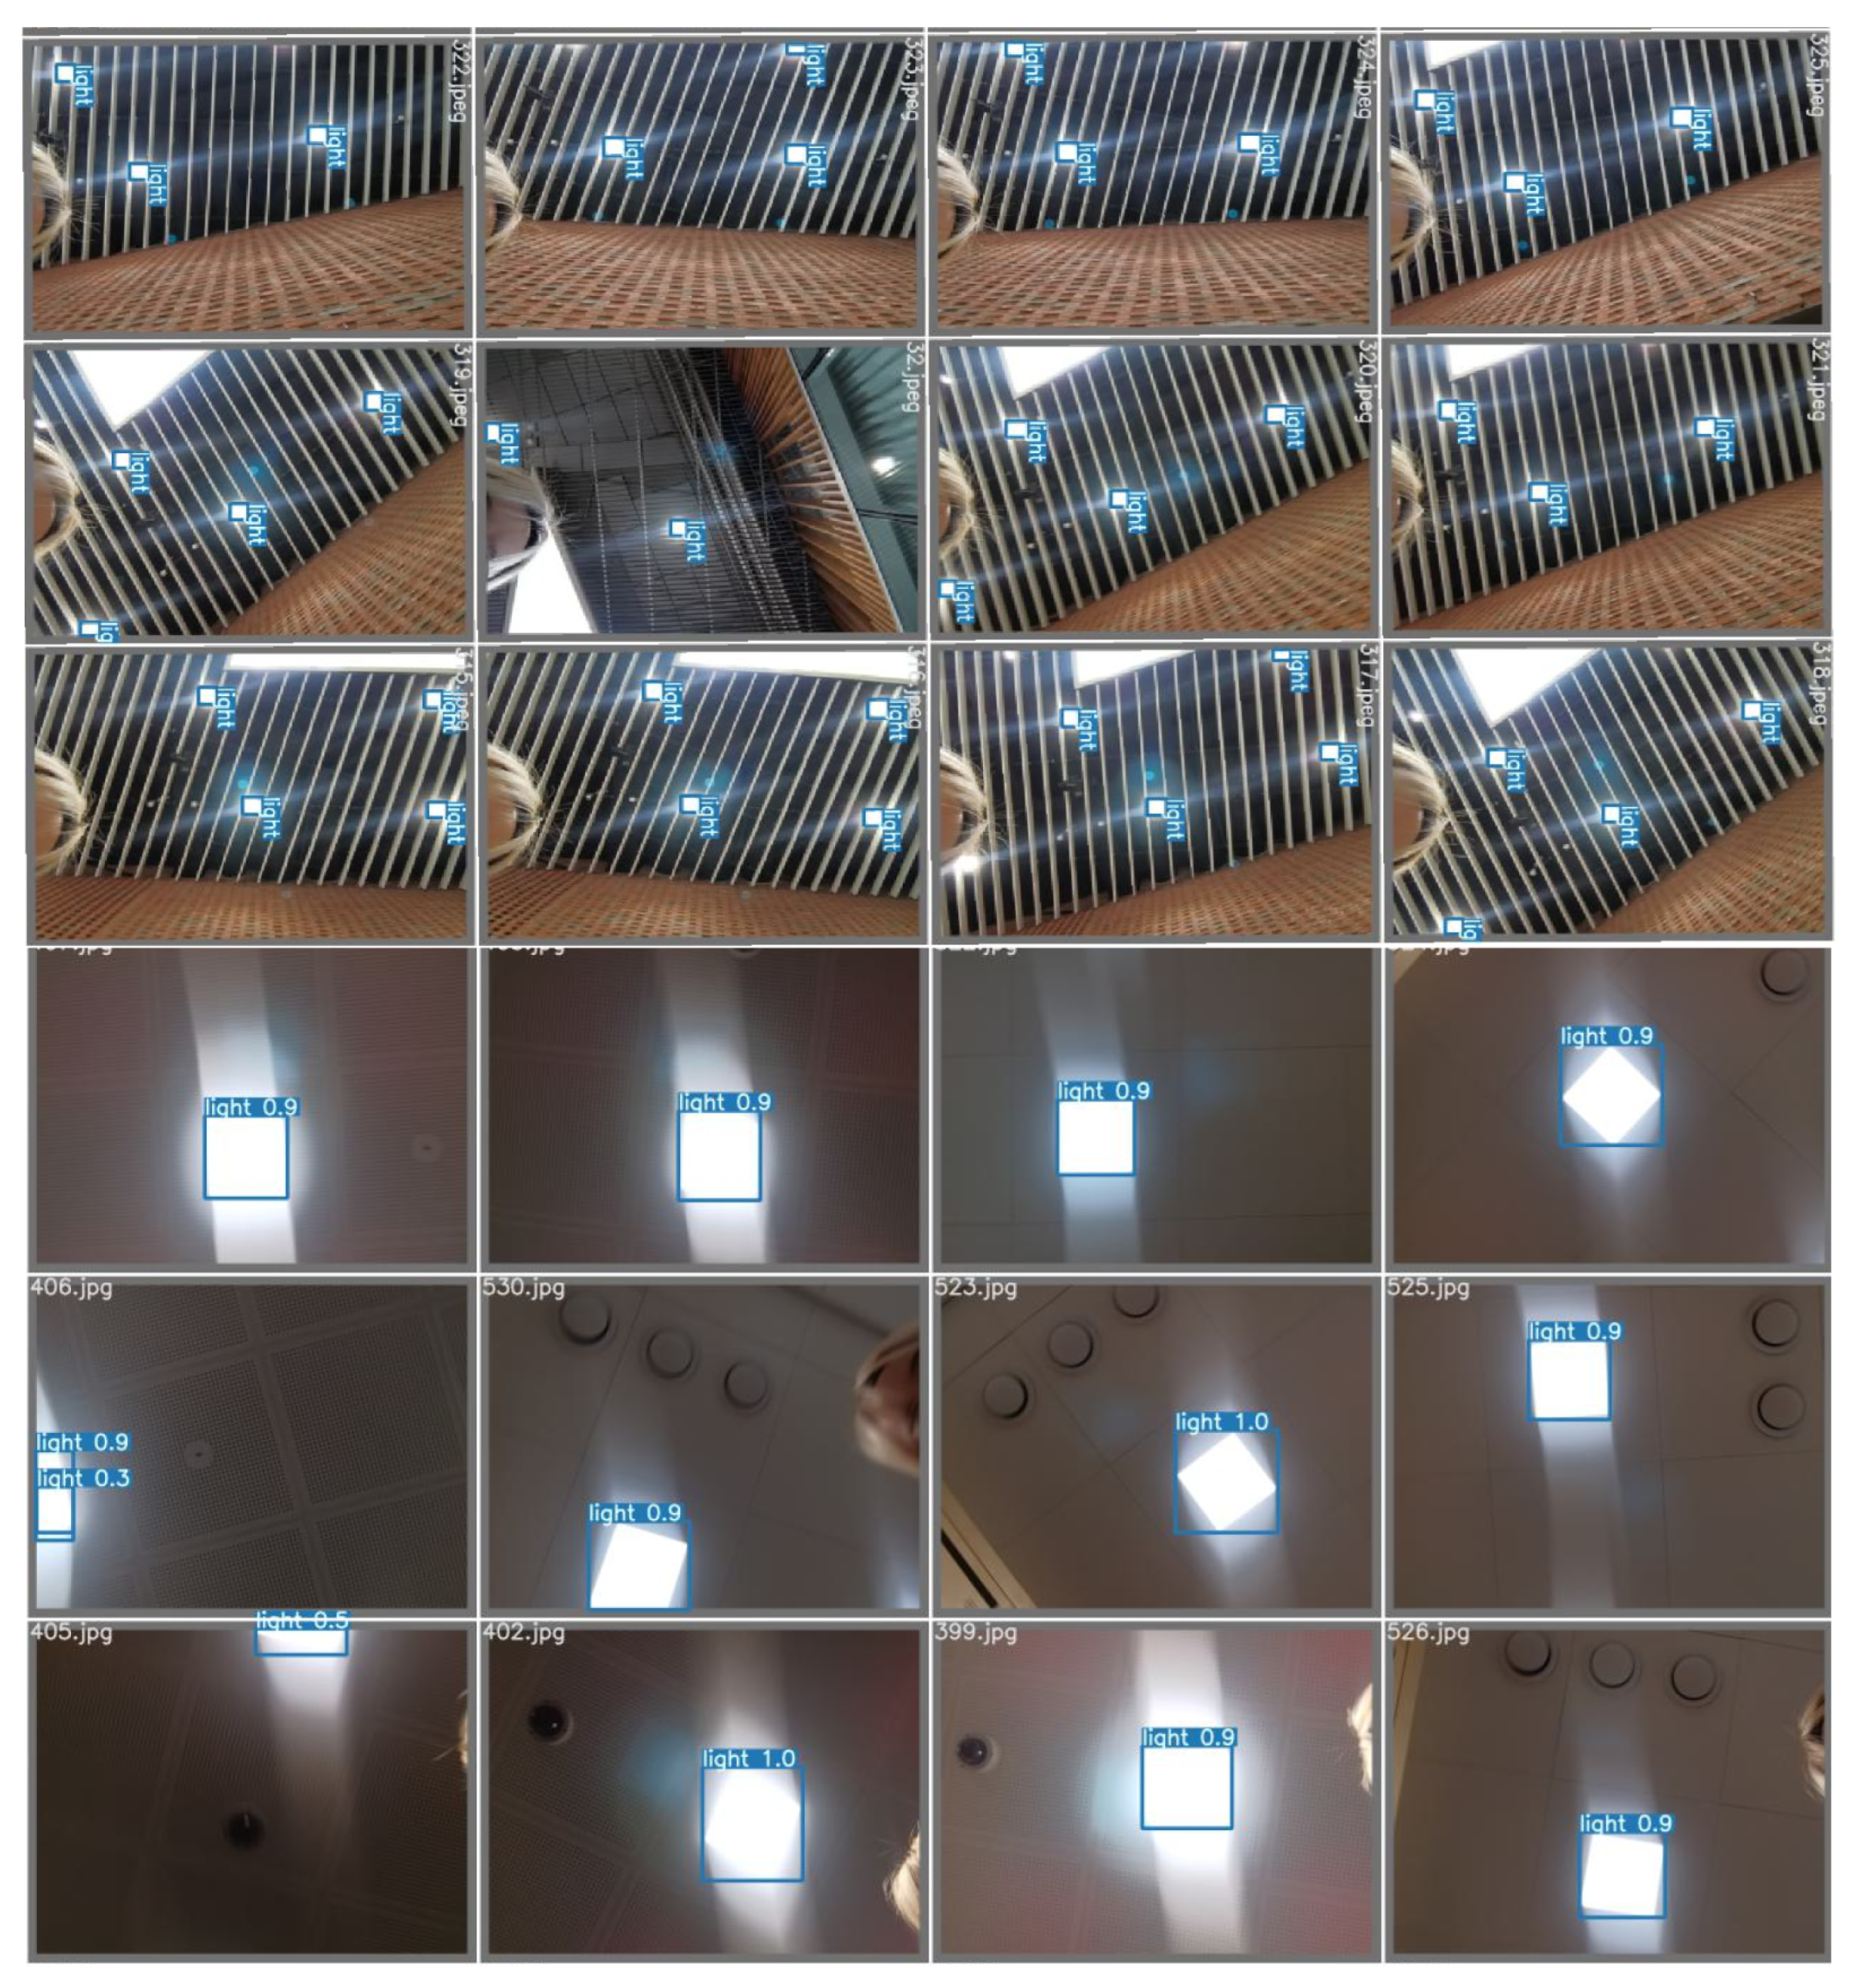
3.1. Landmark Detection and Extraction

3.1.1. Training of YOLO V7 Model

YOLO V7 is a powerful object detection method utilized to classify and locate objects within images or videos. Before the detection of a specific object, it is necessary to train the YOLO V7 model. Therefore, we collected a large amount of images containing or without different kinds of lights. We annotated each object of interest utilizing a bounding box and corresponding class label. We labeled 2500 images with the tag ’light’, including light with different shapes. An online tool named ’Make Sense’ was utilized to realize the labeling. The generated annotations were utilized to train the YOLO V7 model, which can be utilized in the following up-light detection and gross extraction in different scenarios.

3.1.2. Indicators of YOLO V7 Model

To verify the performance of the trained YOLO V7 model, we introduce the following evaluation criteria, including Precision, Recall, F1-Score, and Mean Average Precision (mAP). Firstly, we give the following definitions.
(1)
TP (True Positive): Means the number of the detected instances that are real positive samples, which indicates the correct prediction.
(2)
FP (False Positive): Means the number of the detected instances that are real negative samples, which indicates the wrong prediction.
(3)
FN (False Negative): Means the number of targets that are real positive samples but not detected, which indicates the wrong prediction.
(4)
TN (True Negative): Means the number of targets that are real negative samples and not detected, which indicates the correct prediction.
The Precision is expressed as follows:
P r e c i s i o n = T P T P + F P
Recall can be used to evaluate whether the algorithm can comprehensively detect the target. The Recall is expressed in Equation (16).
R e c a l l = T P T P + F N
F1-Score is an evaluation indicator that combines precision and recall. The closer the F1-Score is to 1, the better the performance of the model. The F1-Score is expressed in Equation (17).
F 1 S c o r e = 2 · P r e c i s i o n · R e c a l l P r e c i s i o n + R e c a l l
By using recall as the horizontal axis and precision as the vertical axis, a coordinate system can be constructed to obtain the Precision-Recall (PR) curve. Precision and recall are a pair of contradictory performance metrics, where higher values indicate better model performance. Meanwhile, the area under the PR curve is known as the Average Precision (AP). The larger the area under the PR curve, the better the model performance.
Intersection over Union (IoU) represents the overlap between the predicted bounding box and the actual bounding box, serving as an indicator of the predicted bounding accuracy. A higher IoU indicates more accurate predictions of bounding boxes. Mean Average Precision (mAP) represents the mathematical expectation of AP values under IoU threshold conditions.
m A P = 1 N A P i = 1 N A P A P i
N A P represents the number of detected targets based on the specific IoU threshold. For example, m A P 0.5 means the average of predicted targets’ AP values when IoU is greater than 0.5. m A P comprehensively considers the precision and the recall, while evaluating the accuracy of the bounding box.

3.1.3. Landmark Detection and Extraction Results

Figure 8 shows examples of the light detection results of a well-trained YOLO V7 model. Table 2 presents the numerical evaluation results for light prediction based on YOLO V7. A total of 1500 images were utilized for testing, encompassing 4255 instances of lights. The well-trained YOLO V7 model achieved a remarkable prediction accuracy of 99.4%, an F1-Score of 98.9%, and an impressive m A P 0.5 of 99.8%. However, the recall was slightly lower at 98.5%. This can be attributed to the inherent complexity of real-world scenes, featuring instances that closely resemble lights, such as skylights, lights reflected in mirrors, and reflective areas on metal surfaces. To decrease the influence of these detection errors, we remove the detection results near the edge of an image and choose the detected light closest to the image center as the landmark.
The m A P 0.5 : 0.95 is 83.3%, significantly lower than the m A P 0.5 . This arises from the variable exposure levels of lights in real-world scenarios, making accurate detection challenging under severe exposure conditions. Consequently, we need to make exposure compensations and further edge detection to refine the extraction of edge information of lights.
Examples of the light detection and gross extraction results based on YOLO V7 are shown in Figure 9. Figure 9a represents the example in scenario A, while Figure 9b and Figure 9c, respectively, correspond to B and C. The detection accuracy of lights can almost reach 100% by utilizing a trained YOLO V7 model, which indicates that all the lights within the up-view images can be efficiently detected. The YOLO V7 model provides a bounding box, which roughly highlights the light. Based on the detection results and the generated bounding box, we extract the gross region of interest. However, according to Figure 9a,b, the bounding box may not contain the whole light. Therefore, we enlarge the bounding box to ensure the extraction region contains the whole light, which will be further processed in the following steps.
Then, we implement the edge detection with the Canny operator for round lights and the Laplace operator for square lights to realize further processing. Figure 10 gives examples of accurate light extraction results. The gross extraction based on the YOLO V7 model effectively reduces the computation of edge detection. It only investigates a specific part rather than the whole image. Figure 10a is the accurate light extraction result corresponding to Figure 9a. Figure 10b is the result corresponding to Figure 9b. Figure 10c is the result corresponding to Figure 9c. The results prove that the proposed landmark detection and extraction method accurately contour the lights in different shapes.

3.2. Static Experiments

3.2.1. Static Experiment Design

To verify the feasibility of the up-view concept, we conduct the single-point static experiments in the FGI’s laboratory and a shopping mall near Aalto University. We chose scenarios with different baselines to conduct the static experiment. The baseline means the height between the ceiling and the ground. It can be measured by a laser range finder. Additionally, in these scenarios, the shapes of the lights are different
Figure 11 shows the examples of the experimental scenes and the illustration of the up-view image collection. Figure 11a shows the scenes in the shopping mall, where the baseline is over 5 m. The shape of the light is a circle. Figure 11b shows the scenes in the laboratory, where the baseline is less than 5 m. The shape of the light is square. Figure 11c illustrates the way of up-view visual data collection and gives an example of the up-view image. During the static single-point experiments, we put the smartphone on the ground. The smartphone automatically captures up-view images with a frequency of 1 Hz utilizing self-developed software. We captured around 10 images for each location.
Table 3 shows the baselines of different scenarios. Scenario A’s baseline is 2.25 m. Scenario B’s baseline is 3.22 m. Scenario C’s baseline is 7.99 m.

3.2.2. Static Single-Point Positioning Results

By utilizing the combination of YOLO V7 and edge detection, we realize the accurate extraction of lights, obtaining the lights’ pixel size. Then, we figure out the smartphone’s position, which is the basis of the kinematic positioning. The positioning results of the static single-point experiments are shown in Table 4. It can be seen that the mean errors are 0.0441 m, 0.0446 m, and 0.0698 m, respectively, corresponding to scenarios A, B, and C, while the standard deviations (STD) are 0.0228 m, 0.0261 m, and 0.0285 m. Meanwhile, the max positioning errors are 0.0783 m, 0.0763 m, and 0.0979 m for scenarios A, B, and C. The results demonstrate that the proposed up-view-based method can almost reach the centimeter level for single-point positioning. The results prove the feasibility of the proposed up-view-based indoor positioning concept.

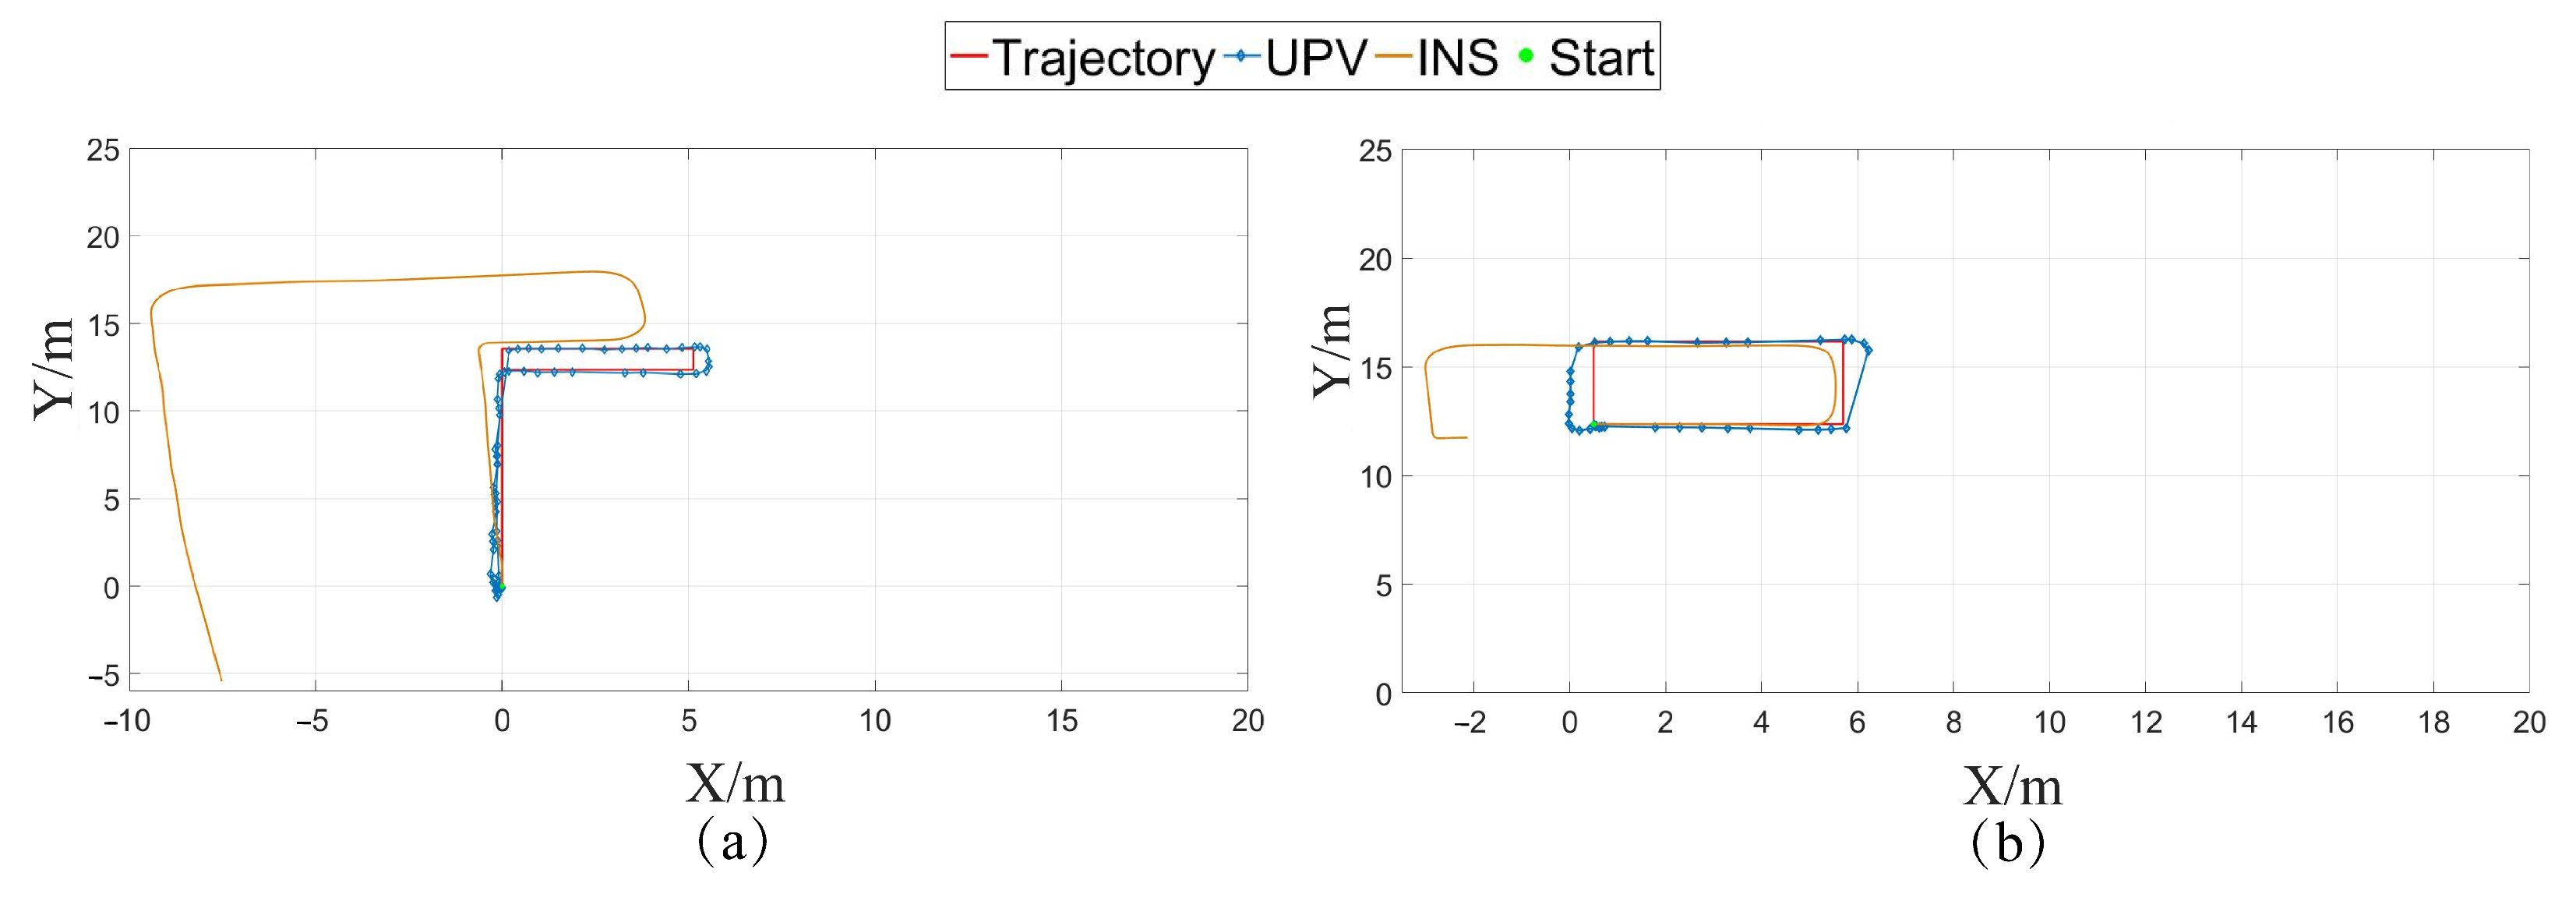
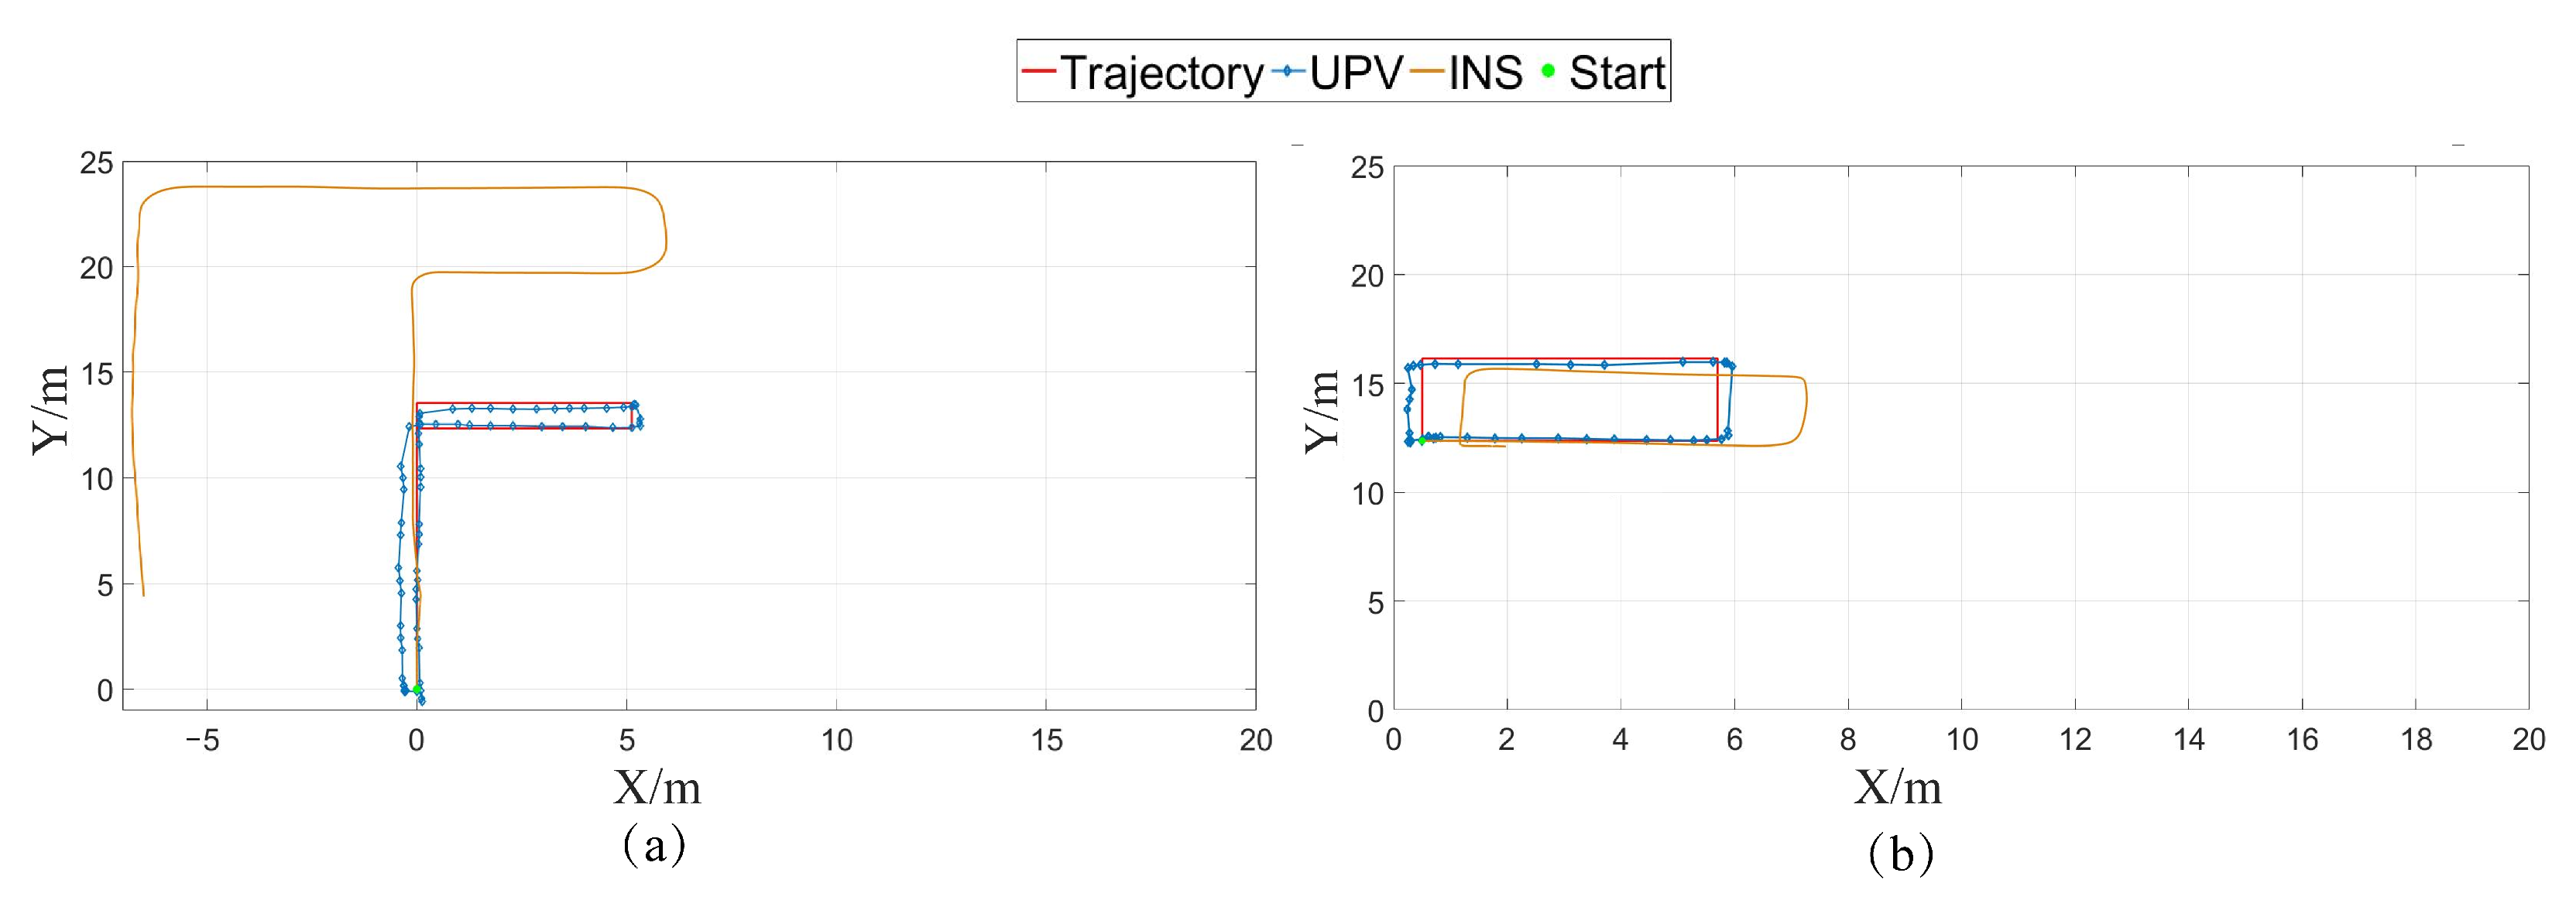
3.3. Kinematic Experiments

3.3.1. Kinematic Experiment Design

To further verify the performance of the proposed up-view visual-based positioning algorithm, we conducted the kinematic experiments in the FGI’s laboratory. Firstly, we pre-label the lights in the laboratory. The up-lights distribution is shown in Figure 12. The blue circle indicates the lights. The grey rectangle and the black line are the wall. The yellow rectangle means the door. Additionally, Figure 12 also demonstrates the trajectories of the kinematic experiments. The red and yellow lines indicate the trajectory 1 and trajectory 2, respectively. The green circles are the start points of the trajectories. During the kinematic experiment, we placed these three smartphones horizontally on a hand-pushed mobile platform. Then, we used self-developed software to collect the smartphones’ self-contained sensor data. Additionally, to better and comprehensively explore the adaptability and positioning performance of the proposed algorithm, we utilized different kinds of smartphones to realize the kinematic experiment. During the kinematic positioning experiments, we randomly chose the Huawei Mate40 Pro, OnePlus Nord CE, and Xiaomi Redmi Note 11 to verify the feasibility of the proposed method.

3.3.2. Kinematic Positioning Results

Figure 13, Figure 14 and Figure 15 intuitively show the positioning results based on different smartphones, respectively. Figure 13, Figure 14 and Figure 15a,b are the positioning results corresponding to the trajectories shown in Figure 12. The red line is the approximate reference trajectory. The blue line indicates the positioning results based on the up-view visual-based indoor positioning method. The yellow line means the results based on INS. The green circle is the starting point. According to Figure 13, Figure 14 and Figure 15, the blue lines extremely fit the red lines, which indicates the superior positioning performance of the proposed up-view visual-based positioning method. Additionally, it can be seen that the accuracy of the INS-based positioning via a smartphone is unsatisfying due to the poor qualities of the smartphone’s self-contained low-cost IMU. It also demonstrates the necessity of the innovatively up-view visual-based indoor positioning method.
Table 5 gives matching results of the lights and up view images. The results format is ‘A/B’. ‘A’ means the correctly matched lights within up-view images. ‘B’ means the number of lights within up-view images detected by YOLO V7 and utilized for positioning. It can be seen that the proposed INS-based landmark matching method can efficiently realize the matching between the light sequence and the up-view image in the short-term cases.
Table 6 gives the closed-loop errors in different cases. The closed-loop errors of Huawei Mate40 Pro are 0.5842 m and 0.2227 m, respectively, in trajectory 1 and trajectory 2. The closed-loop errors of OnePlus Nord CE are 0.5436 and 0.1984 m, respectively, in trajectory 1 and trajectory 2. The closed loop errors of Ximi Redmi note 1 are 0.5891 m and 0.2665 m, respectively, in trajectory 1 and trajectory 2. Generally, the closed loop accuracy of the up-view-based positioning method reaches the sub-meter. Meanwhile, It differs due to the hardware quality, including the IMU and camera.

4. Conclusions

Indoor positioning is a technology that determines the precise location of objects or individuals within a building. Visual-based indoor positioning techniques provide another solution for high-precision indoor positioning. The rapid advancements in computer vision and deep learning have greatly empowered this field, offering significant potential for various applications. However, most research uses side-view visual data to realize the positioning, and the side-view visual data are easily disturbed by different kinds of obstacles in our daily lives. The side-view environments are variable thereby increasing the image processing difficulties. Additionally, the side-view visual data may cause troubles related to privacy and public security. To overcome the problems of the side-view visual positioning and realize high-accuracy indoor positioning, this paper innovatively proposes an up-view visual-based indoor positioning algorithm. This algorithm utilizes the up-view visual data to realize the positioning. This mainly consists of three modules: (1) a deep-learning-based up-view landmark detection and extraction module used for high-accuracy landmark detection and high-precision extraction; (2) an up-view visual-based position calculation module utilized to figure out the smartphone’s position based on the up-view landmark; (3) an INS-based landmark matching module utilized to match the detected landmarks and the real-world landmarks. To verify the feasibility of the up-view-visual-based positioning concept and the performance of sub-modules, we conducted static and kinematic experiments in different scenarios. The results demonstrate that the up-view visual-based indoor positioning algorithm effectively realizes high-accuracy indoor positioning, providing an alternative possibility for visual-based indoor positioning. However, there are still some limitations that need to be developed and further investigated.
(1)
The up-view visual-based positioning method is proven to be a potential solution for indoor positioning. However, the matching module’s performance decays over time. Because the matching module is based on the IMU data. The IMU’s bias grows over time. Therefore, the matching module will probably miss the correct light in long-term cases, which significantly decreases the positioning accuracy.
(2)
The positioning accuracy of the proposed method is influenced by the image qualities and the landmark detection error. The robustness of this positioning method needed to be further improved.
(3)
The light distribution is often uneven in reality. The positioning performance of the proposed method is limited in areas where lights are sparsely distributed.
To overcome this problem and extend the application of the proposed algorithm, we will focus on the following topics in our future work:
(1)
We will integrate this method with other indoor positioning approaches (e.g., pedestrian dead reckoning), using data fusion algorithms such as the Kalman Filter and Factor Graph Optimization. So that, we can potentially solve the problem above and further improve the accuracy and robustness of the up-view visual-based indoor positioning system, extending this work to more complex scenarios.
(2)
We will further apply this method to pedestrian indoor positioning. In this case, we will take the human features such as the holding pose into account. Thus, we will consider more about the modification of the bias caused by human walking.
(3)
In this paper, we initially consider the positioning on the same floor. The change between different floors is also a topic worthy of research. We plan to extend this work to different floors utilizing the data of the smartphone’s self-contained pressure meter and IMU in our future work.

Author Contributions

C.C. designed the experiments, processed the data, and wrote the paper; Y.C., J.Z. and C.J. proposed and discussed the idea, guided the paper writing and revised the paper; X.L. and H.D. made contributions to the data collection. Y.B. supervised the research; J.J. reviewed the paper; E.P. and J.H. reviewed the paper before submission and provided valuable revisions for this paper. All authors have read and agreed to the published version of the manuscript.

Funding

This research was financially supported by Academy of Finland projects “Ultrafast Data Production with Broadband Photodetectors for Active Hyperspectral Space Imaging” (Grant No. 336145); “Bright- Biotic Damage Mapping with Ultrawide Spectral Range LiDARs for Sustainable Forest Growth” (Grant No. 353363); “Forest-Human–Machine Interplay—Building Resilience, Redefining Value Networks and Enabling Meaningful Experiences (UNITE)”, (Grant No. 337656); Strategic Research Council project “Competence-Based Growth Through Integrated Disruptive Technologies of 3D Digitalization, Robotics, Geospatial Information and Image Processing/Computing—Point Cloud Ecosystem” (Grant No. 314312); Academy of Finland (Grant No. 343678); Chinese Academy of Science (Grant No. 181811KYSB20160040, Grant No. XDA22030202); ‘Nanjing University of Aeronautics and Astronautics Startup Funding for Yong Talents.’(Grant No. 1003-YQR23046).

Data Availability Statement

Data available on request due to restrictions.

Acknowledgments

The authors are grateful to Jianliang Zhu, Yuwei Chen, and Changhui Jiang for the guidance of this research, as well as additional support and manuscript comments from Yuming Bo, Jianxin Jia, Eetu and Juha.

Conflicts of Interest

The authors declare no conflicts of interest.

References

  1. Werner, M.; Kessel, M.; Marouane, C. Indoor positioning using smartphone camera. In Proceedings of the 2011 International Conference on Indoor Positioning and Indoor Navigation, Guimaraes, Portugal, 21–23 September 2011; pp. 1–6. [Google Scholar]
  2. Rudić, B.; Klaffenböck, M.A.; Pichler-Scheder, M.; Efrosinin, D.; Kastl, C. Geometry-aided ble-based smartphone positioning for indoor location-based services. In Proceedings of the 2020 IEEE MTT-S International Conference on Microwaves for Intelligent Mobility (ICMIM), Linz, Austria, 23 November 2020; pp. 1–4. [Google Scholar]
  3. Davidson, P.; Piché, R. A survey of selected indoor positioning methods for smartphones. IEEE Commun. Surv. Tutor. 2016, 19, 1347–1370. [Google Scholar] [CrossRef]
  4. Quezada-Gaibor, D.; Torres-Sospedra, J.; Nurmi, J.; Koucheryavy, Y.; Huerta, J. Cloud platforms for context-adaptive positioning and localisation in GNSS-denied scenarios—A systematic review. Sensors 2021, 22, 110. [Google Scholar] [CrossRef] [PubMed]
  5. Jang, B.; Kim, H.; Wook Kim, J. Survey of landmark-based indoor positioning technologies. Inf. Fusion 2023, 89, 166–188. [Google Scholar] [CrossRef]
  6. El-Sheimy, N.; Li, Y. Indoor navigation: State of the art and future trends. Satell. Navig. 2021, 2, 7. [Google Scholar] [CrossRef]
  7. He, S.; Chan, S.H.G. Wi-Fi fingerprint-based indoor positioning: Recent advances and comparisons. IEEE Commun. Surv. Tutor. 2015, 18, 466–490. [Google Scholar] [CrossRef]
  8. Li, X.; Zhang, P.; Huang, G.; Zhang, Q.; Guo, J.; Zhao, Y.; Zhao, Q. Performance analysis of indoor pseudolite positioning based on the unscented Kalman filter. GPS Solut. 2019, 23, 79. [Google Scholar] [CrossRef]
  9. Maheepala, M.; Kouzani, A.Z.; Joordens, M.A. Light-based indoor positioning systems: A review. IEEE Sens. J. 2020, 20, 3971–3995. [Google Scholar] [CrossRef]
  10. Ren, J.; Wang, Y.; Niu, C.; Song, W.; Huang, S. A novel clustering algorithm for Wi-Fi indoor positioning. IEEE Access 2019, 7, 122428–122434. [Google Scholar] [CrossRef]
  11. Cheng, Y.; Zhou, T. UWB indoor positioning algorithm based on TDOA technology. In Proceedings of the 2019 10th International Conference on Information Technology in Medicine and Education (ITME), Qingdao, China, 23–25 August 2019; pp. 777–782. [Google Scholar]
  12. Phutcharoen, K.; Chamchoy, M.; Supanakoon, P. Accuracy study of indoor positioning with bluetooth low energy beacons. In Proceedings of the 2020 Joint International Conference on Digital Arts, Media and Technology with ECTI Northern Section Conference on Electrical, Electronics, Computer and Telecommunications Engineering (ECTI DAMT & NCON), Pattaya, Thailand, 11–14 March 2020; pp. 24–27. [Google Scholar]
  13. Yao, L.; Wu, Y.W.A.; Yao, L.; Liao, Z.Z. An integrated IMU and UWB sensor based indoor positioning system. In Proceedings of the 2017 International Conference on Indoor Positioning and Indoor Navigation (IPIN), Sapporo, Japan, 18–21 September 2017; pp. 1–8. [Google Scholar]
  14. Cioffi, G.; Scaramuzza, D. Tightly-coupled fusion of global positional measurements in optimization-based visual-inertial odometry. In Proceedings of the 2020 IEEE/RSJ International Conference on Intelligent Robots and Systems (IROS), Las Vegas, NV, USA, 24 October 2020–24 January 2021; pp. 5089–5095. [Google Scholar]
  15. Zou, Q.; Sun, Q.; Chen, L.; Nie, B.; Li, Q. A comparative analysis of LiDAR SLAM-based indoor navigation for autonomous vehicles. IEEE Trans. Intell. Transp. Syst. 2021, 23, 6907–6921. [Google Scholar] [CrossRef]
  16. Li, M.; Chen, R.; Liao, X.; Guo, B.; Zhang, W.; Guo, G. A precise indoor visual positioning approach using a built image feature database and single user image from smartphone cameras. Remote Sens. 2020, 12, 869. [Google Scholar] [CrossRef]
  17. Naseer, T.; Burgard, W.; Stachniss, C. Robust visual localization across seasons. IEEE Trans. Robot. 2018, 34, 289–302. [Google Scholar] [CrossRef]
  18. Couturier, A.; Akhloufi, M.A. A review on absolute visual localization for UAV. Robot. Auton. Syst. 2021, 135, 103666. [Google Scholar] [CrossRef]
  19. Khattar, F.; Luthon, F.; Larroque, B.; Dornaika, F. Visual localization and servoing for drone use in indoor remote laboratory environment. Mach. Vis. Appl. 2021, 32, 32. [Google Scholar] [CrossRef]
  20. Lei, X.; Zhang, F.; Zhou, J.; Shang, W. Visual Localization Strategy for Indoor Mobile Robots in the Complex Environment. In Proceedings of the 2022 IEEE International Conference on Mechatronics and Automation (ICMA), Guilin, China, 7–10 August 2022; pp. 1135–1140. [Google Scholar]
  21. Zhang, H.; Ye, C. A visual positioning system for indoor blind navigation. In Proceedings of the 2020 IEEE International Conference on Robotics and Automation (ICRA), Paris, France, 31 May–31 August 2020; pp. 9079–9085. [Google Scholar]
  22. Himawan, R.W.; Baylon, P.B.A.; Sembiring, J.; Jenie, Y.I. Development of an Indoor Visual-Based Monocular Positioning System for Multirotor UAV. In Proceedings of the 2023 IEEE International Conference on Aerospace Electronics and Remote Sensing Technology (ICARES), Bali, Indonesia, 26–27 October 2023; pp. 1–7. [Google Scholar]
  23. Chi, P.; Wang, Z.; Liao, H.; Li, T.; Zhan, J.; Wu, X.; Tian, J.; Zhang, Q. Low-latency Visual-based High-Quality 3D Reconstruction using Point Cloud Optimization. IEEE Sens. J. 2023, 23, 20055–20065. [Google Scholar] [CrossRef]
  24. Bai, X.; Zhang, B.; Wen, W.; Hsu, L.T.; Li, H. Perception-aided visual-inertial integrated positioning in dynamic urban areas. In Proceedings of the 2020 IEEE/ION Position, Location and Navigation Symposium (PLANS), Portland, OR, USA, 20–23 April 2020; pp. 1563–1571. [Google Scholar]
  25. Redmon, J.; Divvala, S.; Girshick, R.; Farhadi, A. You only look once: Unified, real-time object detection. In Proceedings of the IEEE Conference on Computer Vision and Pattern Recognition, Las Vegas, NV, USA, 27–30 June 2016; pp. 779–788. [Google Scholar]
  26. Cao, L.; Zheng, X.; Fang, L. The Semantic Segmentation of Standing Tree Images Based on the Yolo V7 Deep Learning Algorithm. Electronics 2023, 12, 929. [Google Scholar] [CrossRef]
Figure 1. Up-view visual-based indoor positioning mechanism.
Remotesensing 16 01024 g001
Figure 2. The YOLO V7 model.
Remotesensing 16 01024 g002
Figure 3. The framework of deep-learning-based up-view landmark detection and extraction.
Remotesensing 16 01024 g003
Figure 4. Up-view visual position calculation.
Remotesensing 16 01024 g004
Figure 5. The illustrator of transformation from pixel frame to pseudo-body frame.
Remotesensing 16 01024 g005
Figure 6. INS-based landmark matching mechanism.
Remotesensing 16 01024 g006
Figure 7. The framework of the INS-based landmark matching method.
Remotesensing 16 01024 g007
Figure 8. Examples of the light detection results based on YOLO V7 model.
Remotesensing 16 01024 g008
Figure 9. Examples of the light gross extraction results based on YOLO V7 model. (a) represents the example in scenario A. (b) represents the example in scenario B. (c) represents the example in scenario C.
Remotesensing 16 01024 g009
Figure 10. Examples of the accurate light extraction results based on edge detection. (a) represents the example in scenario A. (b) represents the example in scenario B. (c) represents the example in scenario C.
Remotesensing 16 01024 g010
Figure 11. Examples of static experiment scenarios and illustrators of up-view image collection. (a) is an example of the scenes in the shopping mall. (b) is an example of the scenes in the laboratory. (c) is an illustrator of the up-view visual data collection.
Remotesensing 16 01024 g011
Figure 12. The lights’ distribution in FGI.
Remotesensing 16 01024 g012
Figure 13. The experiment results based on Huawei mate40 pro. (a) is the result of Trajectory 1. (b) is the result of Trajectory 2.
Remotesensing 16 01024 g013
Figure 14. The experiment results based on OnePlus Nord CE. (a) is the result of Trajectory 1. (b) is the result of Trajectory 2.
Remotesensing 16 01024 g014
Figure 15. The experiment results based on Xiaomi Redmi note 11. (a) is the result of Trajectory 1. (b) is the result of Trajectory 2.
Remotesensing 16 01024 g015
Table 1. Introductions of common edge detection operators.
OperatorIntroductionAdvantages/Disadvantages
SobelDetects edges by computing the horizontal and vertical gradients of each pixel in the image.Robustness to noise; High computational efficiency; Bad performance for edges with large slopes.
CannyA multi-stage edge detection method, including the steps of filtering, enhancement, non-maximum suppression, and dual thresholding.High accuracy; High computational complexity; Complex implementation.
LaplaceDetect edges by computing the Laplacian transform of an image.Can detect the position and direction of the edge; Sensitive to noise; High computational complexity.
PrewittSimilar to the Sobel operator, it is also an edge detection method based on local gradients utilizing a different mask.Low computational complexity; Easy implementation; Sensitive to noise.
RobertsA diagonal gradient-based edge detection method.Low computational complexity; Easy implementation; Sensitive to noise.
Table 2. Performance of the trained-YOLO V7 model.
IndicatorPrecisionRecallF1-Score mAP 0.5 mAP 0.5 : 0.95
Result0.9940.9850.9890.9880.833
Table 3. Baselines of different scenarios.
ScenarioBaseline (m)
A2.25
B3.22
C7.99
Table 4. Static single-point positioning results.
ScenarioMean Error (m)STD (m)Max Error (m)
A0.04410.02280.0783
B0.04460.02610.0763
C0.06980.02850.0979
Table 5. The results of the INS-based landmark matching method.
Trajectory 1Trajectory 2
Huawei mate40 pro91/9150/50
OnePlus Nord CE96/9652/52
Xiaomi Redmi note 11101/10154/54
Table 6. The results of closed-loop error/m.
Trajectory 1Trajectory 2
Huawei mate40 pro0.58420.2227
OnePlus Nord CE0.54360.1984
Xiaomi Redmi note 110.58910.2665
Disclaimer/Publisher’s Note: The statements, opinions and data contained in all publications are solely those of the individual author(s) and contributor(s) and not of MDPI and/or the editor(s). MDPI and/or the editor(s) disclaim responsibility for any injury to people or property resulting from any ideas, methods, instructions or products referred to in the content.

