Abstract
Existing research indicates that detecting near-surface methane point sources using Sentinel-2 satellite imagery can offer crucial data support for mitigating climate change. However, current retrieval methods necessitate the identification of reference images unaffected by methane, which presents certain limitations. This study introduces the use of a matched filter, developing a novel methane detection algorithm for Sentinel-2 imagery. Compared to existing algorithms, this algorithm does not require selecting methane-free images from historical imagery in methane-sensitive bands, but estimates the background spectral information across the entire scene to extract methane gas signals. We tested the algorithm using simulated Sentinel-2 datasets. The results indicated that the newly proposed algorithm effectively reduced artifacts and noise. It was then validated in a known methane emission point source event and a controlled release experiment for its ability to quantify point source emission rates. The average estimated difference between the new algorithm and other algorithms was about 34%. Compared to the actual measured values in the controlled release experiment, the average estimated values ranged from −48% to 42% of the measurements. These estimates had a detection limit ranging from approximately 1.4 to 1.7 t/h and an average error percentage of 19%, with no instances of false positives reported. Finally, in a real case scenario, we demonstrated the algorithm’s ability to precisely locate the source position and identify, as well as quantify, methane point source emissions.
1. Introduction
Methane is the second-largest greenhouse gas emitted by human activities, following carbon dioxide [1]. Since the Industrial Revolution, anthropogenic emissions have rapidly increased, contributing to about 20% of global warming [2]. Methane’s atmospheric lifetime is about one-tenth that of carbon dioxide. Still, its 20-year global warming potential is 86 times greater [3], making monitoring and limiting human methane emissions highly beneficial for addressing the climate crisis (marginal utility/revenue). Human emissions are diverse and primarily linked to livestock, agriculture, landfills, and the fossil fuel industry [3,4]. Measurement surveys of methane emission facilities have shown that a few powerful point sources account for a large portion of the total emissions [5,6,7]. A study also found that, due to a lack of monitoring mechanisms, source-based inventories (bottom–up approaches) have consistently underestimated the emissions from these methane super-emitters [8].
Hence, there is significant interest in monitoring these point sources from the top down using aerial and satellite remote sensing imagery. The Jet Propulsion Laboratory (JPL), NASA, has conducted thousands of aerial survey missions over the past decade, collecting data using the Airborne Visible InfraRed Imaging Spectrometer-Next Generation (AVIRIS-NG) airborne sensor [9,10,11,12]. However, due to flight plan limitations, this monitoring is mainly concentrated in southern California, making it impossible to conduct the high-frequency detection of point sources on a global scale. In recent years, satellite-based methane monitoring technologies have shown potential for rapidly identifying large methane emissions globally, with numerous remote sensing instruments widely used for monitoring methane emissions [13,14,15,16,17,18,19].
However, to monitor these point source emissions, it is necessary to use sensors with a spatial resolution of less than 100 m [20]. Furthermore, satellites should have short revisit cycles, good global coverage, and spectral bands covering the shortwave infrared windows of 1600 and 2300 nm (strong methane absorption). Some studies have suggested that the current high-spectral sensors in orbit, like PRISMA, GHGSat-D, and EnMAP [21,22,23], can provide accurate concentration retrieval. However, limitations due to orbital height and the number of satellites limit data availability, impeding effective global monitoring.
Another method involves using multispectral instruments with shortwave infrared (SWIR) bands, such as Sentinel-2 [24] and Landsat-8/9 [25], which have relatively quick revisit times (about 5 days for Sentinel-2 and 16 days for Landsat) and a higher spatial resolution (20–30 m). However, these sensors were not designed to detect methane, so their spectral resolution in the SWIR bands is low, limiting their sensitivity to methane absorption and making methane emission monitoring challenging.
Varon et al. [26] first demonstrated the effectiveness of the Sentinel-2 mission in monitoring point source emissions at the Hassi Messaoud oil field in Algeria and the Korpezhe oil and gas field in Turkmenistan. They developed three methods based on the deviation in Sentinel-2 bands 11 and 12 during times of high and low atmospheric methane concentrations, creating a ratio model to mine methane absorption signals and constructing a fractional absorption model for enhanced methane column concentration (XCH4) retrieval. Most methane plume detections and quantifications from Sentinel-2 images also use a multiband-multipass (MBMP) method similar to Varon et al. Zhang et al. used data from controlled release tests to calibrate and improve the algorithm, enhancing its quantification accuracy [16]. Ehret et al. used images from the six months before the detection date as a time series for background estimation, using a two-stage linear regression and manual verification steps to reduce errors [15]. The core of these methods requires obtaining a reference unaffected by methane; however, this requirement is challenged by two primary issues:
- (1)
- The variability and duration of methane emissions complicate the process of identifying a completely unaffected reference, particularly for sites characterized by long-term emissions.
- (2)
- The albedo of an image can be significantly influenced by various factors, including surface changes, seasonal variations, lighting conditions, clouds, and aerosols. In addition, some artificial objects display spectral features similar to methane in the Sentinel-2 bands 11/12, making it challenging to identify methane plumes using simple band ratio models.
In this study, we focus on retrieving methane enhancements (plumes generated by point source emissions) that are above the background concentrations, rather than retrieving the concentrations of the scene. We introduce the Matched Filter [11], which is extensively utilized in the retrieval of methane using airborne and satellite-borne hyperspectral data. To refine the background estimation process, we incorporate additional processing steps, in which an Adaptive Clustering Algorithm [27] is applied to categorize a two-month time series of cloud-free Sentinel-2 imagery over the computational area.
The paper is organized as follows: Section 2 offers a comprehensive description of the algorithm’s theoretical foundation and procedures. Section 3 showcases the algorithm’s performance via simulation results and validates its capability to quantify the emission rates in both a known emission event and a single-blind controlled release experiment. This section also includes an example of methane plume retrieval in a real scenario using Sentinel-2 data. Section 4 summarizes the study’s primary findings and discusses key issues.
2. Methods
Sentinel-2 is a mission for wide-swath, high-resolution, multispectral imaging. It provides 13 spectral bands at resolutions of 10 m, 20 m, and 60 m, with a revisit frequency of 2–3 days in mid-latitude regions [24]. The primary objective of the task was to monitor alterations in surface conditions. Nevertheless, it has emerged that certain spectral bands are especially sensitive to methane, enabling the detection and quantification of significant methane emissions. The fundamental principle of using Sentinel-2 for XCH4 retrieval lies in the fact that methane in the atmosphere absorbs solar radiation, with significant absorption spectra concentrated around the wavelengths of 1600 and 2300 nm, aligning with Sentinel-2 bands 11/12. Figure 1 illustrates methane spectral transmittance based on the high-resolution transmission molecular absorption HITRAN2020 database [28], along with the spectral response functions of Sentinel-2A/B. The MultiSpectral Instruments (MSI) aboard Sentinel-2A and Sentinel-2B have slightly different spectral transmission window positions and widths. Band 11 includes a set of weak methane absorption lines near 1650 nm. Band 12 encompasses stronger absorption lines within the 2200–2300 nm range. The average methane transmittance in band 12 is 2–3 times lower than that in band 11.
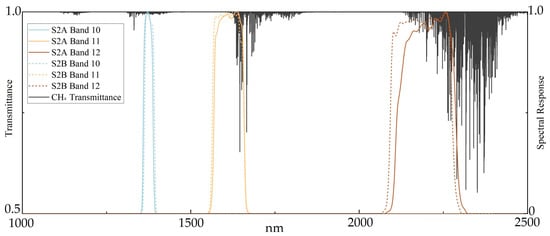
Figure 1.
Methane transmittance spectrum based on the HITRAN2020 and the spectral response functions of Sentinel-2A/B.
For anthropogenic methane point source emissions, the resulting plumes only affect the near-surface atmosphere in the local area surrounding the source. Therefore, the MBMP utilizes the optical attenuation properties of methane in Sentinel-2 bands 11/12, combined with past non-plume reference observations of the same scene, to detect and derive the column concentration of the methane plumes. However, in reality, these point sources of methane emissions are often the result of accidental events, such as leaks, equipment failures, or other abnormal operational processes. Their number, occurrence duration, and location are uncertain, making it extremely difficult to determine a non-plume reference observation. Moreover, changes in surface conditions, lighting, clouds, and aerosols over time may exhibit spectral characteristics similar to methane, resulting in a mass of artifacts and noise in the results. Therefore, in this work, we introduce a matched filter algorithm to avoid the selection of non-plume references. This algorithm has been applied to instruments such as PRISMA, EMIT, GF-5, and AVIRIS-NG [13,29,30,31,32]. The principle is based on the ‘Sparsity’ of these emissions in space and time, meaning that the pixels exceeding the background methane concentration make up only a limited part. Using this characteristic, we estimate the mean and covariance of the background radiation intensities observed for the twelve bands of the satellite, across the entire scene, using the matched filter function to whiten the observed radiation, thereby quantifying methane enhancement signals outside the background as concentrations. Additionally, the algorithm operates under the assumption that the background radiation conforms to a Gaussian distribution, a condition met, to some extent, by some hyperspectral sensors [21,29,33]. However, for the Sentinel-2 sensor, which has fewer and broader bands, the estimated background radiation exhibits larger covariance, risking the submergence of the methane signals in noise. To address this, we segment the image by columns (for some pushbroom sensors) or clusters [11,12], ensuring that each class has a uniform distribution and smaller covariance. We also incorporate time series, land cover, and spatial information into the background estimation process to mitigate noise due to the fewer bands and lower spectral resolution. This process is detailed in Figure 2.
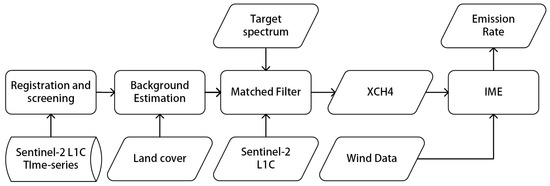
Figure 2.
Illustrates the workflow of the algorithm. IME stands for Integrated Mass Enhancement, which is used to quantify emission rates.
Furthermore, water vapor and carbon dioxide also absorb in these bands, potentially causing interference. However, in the case of point source emissions, water vapor and carbon dioxide are typically not co-emitted with methane, allowing for the assumption that their concentrations remain uniform across the scene. This was validated by the study conducted by Varon et al. [26].
2.1. Matched Filter
Assuming that the radiation received by the sensor in the scene follows a normal distribution on a uniform surface, when there are no methane concentrations higher than the background in the scene, we can model the n-dimensional radiance ( represents the number of sensor bands) received by the sensor as a multivariate Gaussian distribution with a mean of and a covariance matrix :
When methane concentrations higher than the background are present in the scene, the irradiance measured by the sensor can be modeled as a function of the methane concentration and the target spectrum , based on the methane absorption spectral characteristics . According to the Beer–Lambert Law, the radiance affected by the enhanced methane concentration can be expressed as:
By employing a first-order Taylor series expansion for linearization, we obtain:
The target spectrum related to the concentration can be created through the methane’s absorption spectrum and radiative transfer simulations of radiance changes with methane concentration. We use the average radiance of the radiation sensor to approximate , which is the sensor brightness for non-enhanced background radiation. To minimize the residual between the observed spectrum and the modeled target spectrum , we impose the condition of:
Given and , the least squares solution can be represented by the following likelihood ratio function:
This forms the basic framework for the retrieval of methane using a matched filter. Furthermore, to avoid underestimation and negative values, we adopt the improved form suggested by Pei et al. [34] (Equation (6)), which replaces the spectral background model with a log-normal distribution. This can reduce the underestimation caused by nonlinear absorption when the gas concentration increases significantly, as well as avoid negative values in the results.
The strategy for estimating is discussed in Section 2.2. The process of creating the target spectrum is outlined in Section 2.3.
2.2. Background Estimation
The model’s parameters (), essential for constructing a background that is unaffected by methane emissions, play a pivotal role in the accuracy of the matched filter algorithm, particularly for multispectral sensors with a limited spectral resolution. To mitigate methane’s impact, adopting suitable methods for estimating the background is imperative. The typical approach involves utilizing the similarity in spectral characteristics among pixels of the same land cover type and calculating the mean and covariance separately for each category using data-driven clustering algorithms [11]. These algorithms compute the mean and covariance for each category independently, but necessitate initially selecting an appropriate spatial range. This selection ensures that, within each category, pixels with methane concentrations exceeding the background constitute only a minor fraction. Additionally, clustering algorithms typically require predefined category numbers. However, identifying the exact number of land cover types within an image is challenging. Setting a high number of categories might isolate pixels with elevated methane levels into separate categories, while a low number could increase inter-category variance, amplify noise, and decrease precision.
For Sentinel-2 imagery, our initial step is to ensure that the influence of methane plumes on the background mean–covariance matrix is negligible. The computational area considered is approximately 10 km × 10 km. We collected a two-month time series of Sentinel-2 L1C imagery corresponding to the computational area. All images were aligned at the pixel level and resampled to a resolution of 20 m. The algorithm of the matched filter is applied to each of the categories based on these pixels with a 20 m resolution. Additionally, we utilize cloud masks from the L1C product to refine the image collection, eliminating pixels obscured by clouds. Subsequently, land cover and locational information are added for each temporal phase, creating a background database. Subsequently, the database is input into an adaptive clustering algorithm [27]. This algorithm searches for all clusters that conform to a normal distribution in order to meet the background assumption and adaptively determines the number of clusters and the clustering results. Finally, the mean and covariance are calculated separately for each category using the derived classification information. This approach ensures that each category has a sufficient number of pixels without expanding the scope of the scene, thereby minimizing the impacts of methane and surface changes on the background estimation in the images. This process is illustrated in Figure 3.
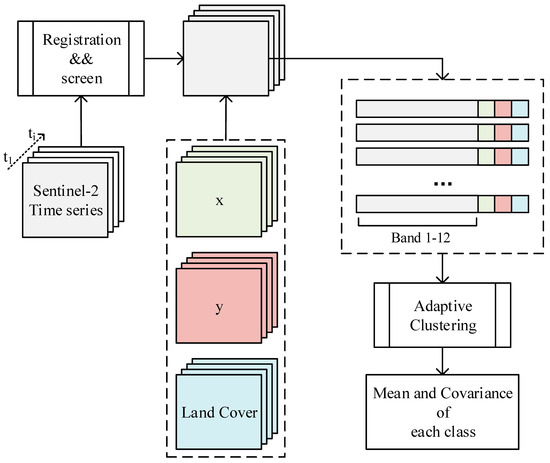
Figure 3.
Background estimation process. Sentinel-2 time series will undergo registration and cloud screen, and location (latitude and longitude) and surface coverage will be added for each pixel before being input into an adaptive classifier for clustering. Finally, the mean and covariance matrix for each category will be calculated based on the results. The variables x and y represent the latitude and longitude of the resampled pixel, respectively.
2.3. Calculation Procedure of Methane Target Spectrum
The target spectrum is analogous to the spectrum representing the unit change of the methane absorption coefficient, determined by the widths of the satellite bands, path length, and methane absorption cross-section. It represents the increment in optical thickness caused by a methane plume in a specific environmental setting.
Initially, we employed the Line-By-Line Radiative Transfer Model (LBLRTM) [35] to compute the high-resolution radiances for various methane concentrations. The solar inputs for LBLRTM were provided by a solar-source function on the AER RT website [36]. The absorption line strengths of methane came from HITRAN2020. The atmospheric model employed was the 1976 U.S. Standard Atmosphere [37], where water vapor and aerosols were supplied by the corresponding Sentinel-2 L2A product metadata. We obtained the solar zenith angle (SZA) and viewing zenith angle (VZA) for each scene from the metadata. The surface elevation was acquired from © Google Earth elevation data. The air column was divided into 100 layers, with two-way transmittance assumed for all layers. These radiances were then conformed to a given satellite using the spectral response functions of Sentinel-2A/B. Subsequently, we calculated the transmittance at different concentrations based on these radiances, followed by the computation of the incremental optical thickness. The final step involved correlating the increments in methane concentration with the corresponding increments in optical thickness. The slope derived from this correlation is defined as the target spectrum .
2.4. Methods for Quantifying Point Source Emission Rate
After separating the plume from the background using a masking technique, we further employed the Integrated Mass Enhancement (IME) method [38,39], identical to that used by Varon et al. [26], to calculate the emission rate as:
In this equation, IME represents the integrated mass enhancement (kg). The effective wind speed is the function of the local 10 m wind speed derived by Varon et al. [26]. The data we use are from the ECMWF-ERA5 datasets [40]. L is the size of the plume (m).
3. Results
Methane point source monitoring necessitates the precise validation of retrieval algorithms under various conditions. However, due to the impracticality of accurately mapping methane concentrations close to the surface, these validations are typically based on controlled emission experiments or simulation analyses. The former method offers the most accurate benchmarks and real-world conditions, but is limited to a small number of data points due to its high costs and negative atmospheric impacts [41], and it only provides source rates. Although the latter method presents challenges in replicating real scenario conditions, it provides an accurate distribution of concentrations.
In Section 3.1, we use simulated data to validate the algorithm’s performance in retrieving concentrations. In Section 3.2, we conduct comparisons with existing methods in real emission scenarios. In Section 3.3, we utilize controlled release experiments to evaluate the source quantification capabilities of the algorithm. In Section 3.4, we illustrate an application of the algorithm developed in this study to the retrieval of methane plumes.
3.1. Result from Simulation
We used a simulated Sentinel-2 dataset generated by Gorroño et al. [42], which overlays concentration maps produced by Weather Research and Forecasting—Large Eddy Simulation (WRF-LES) simulations onto original Sentinel-2 TOA radiance images. This dataset includes five types of methane point source plumes, with emission rates ranging from 0 to 50,000 kg/h. The dataset was created for scenes in three oil and gas basins (Hassi Messaoud, Algeria; Korpeje, Turkmenistan; and Permian Basin, USA). This simulation dataset provides images of 75 × 75 pixels with a pixel size of 20 m.
We first evaluated the performance of the Matched Filter algorithm in identifying whether pixels contained methane plumes and compared it with the MBMP algorithm. The MBMP method derives methane column enhancements by obtaining the fractional change in TOA radiance for bands 12 and 11 relative to a reference image. We used the original image from the simulation dataset without added methane plumes as the reference to ensure that the MBMP method operated under ideal conditions and adopted the same fractional absorption model as Varon et al. [26]. Subsequently, to ensure the consistency of the results and avoid human bias, both the Matched Filter and MBMP employed the same unsupervised masking strategy. This method involved selecting methane columns in the scene that were above the 95% threshold and smoothing them using a 3 × 3 median filter and a 3 × 3 Gaussian filter. This unsupervised masking strategy aided in reducing the significant noise levels present in Sentinel-2 methane detection, effectively extracting plume shapes. Moreover, median and Gaussian filtering (or other high-frequency filtering processes) were expected to have minimal impact on the plume signal, as the plume signal was distributed in the atmosphere as a low-frequency signal.
We employed three evaluation metrics to assess the algorithm’s performance, focusing on distinct aspects. The metrics used were Accuracy, Recall, and Precision (Equations (8)–(10)).
In the formula, TP, TN, FP, and FN represent True Positive, True Negative, False Positive, and False Negative, respectively. Furthermore, we also calculated the F1 score based on Precision and Recall. The F1 score can be considered as a harmonic mean of Precision and Recall, with a maximum value of 1 and a minimum value of 0.
As listed in Table 1, the performance outcomes from the simulation experiments across the entire dataset reveal that, in comparison to the MBMP model, the Matched Filter approach exhibited a superior performance on various indices. This advantage was particularly evident in the Permian Basin area, where the F1 score improved from 0.3905 to 0.7118, demonstrating a significant improvement in the performance of the matching filter method in this region.

Table 1.
Scene-level metrics in simulated experiments.
Figure 4 presents several examples, including the Korpeje and Permian Basin locations, with an emission flux rate = 20,000 kg/h. We compared the retrieval results of the Matched Filter and MBMP algorithms under five different methane plume images. From the figure, it is observable that, at the Korpeje site, methane plumes retrieved by both Matched Filter and MBMP are visible, yet the MBMP results exhibit more background interference, with the primary visible structures being dunes stretching from northwest to southeast. Similarly, at the Permian Basin location, the enhancement map produced by the Matched Filter shows a more distinct methane plume, while the MBMP results are cluttered with numerous anomalies, almost obscuring the plume’s shape. We used the standard deviation (σ values) of XCH4 derived from the no-methane-plume areas as the XCH4 enhancement retrieval 1-σ (random) error to evaluate the noise levels of the two algorithms. At Korpeje, Hassi Messaoud, and the Permian Basin, the random errors for the matched filter algorithm were 0.397, 0.113, and 0.871 ppm, respectively, while for the MBMP algorithm, the errors were 0.626, 0.244, and 1.587 ppm, respectively. Overall, Matched Filter effectively reduced anomalies, accurately reflecting the morphology of plumes, even in locations with high surface heterogeneity. In contrast, the MBMP algorithm produced more anomalies in the Permian Basin area, demonstrating increased background noise and less plume coherence.
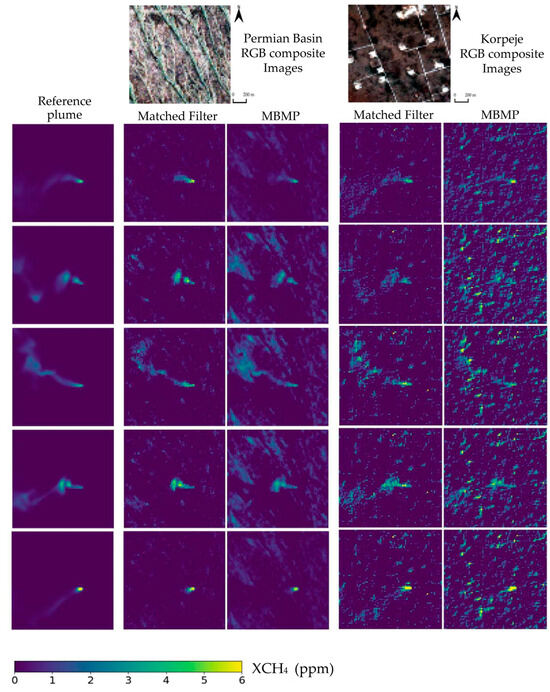
Figure 4.
Examples of XCH4 retrieval at Korpeje and Permian Basin locations in simulated experiments. (Line 1) The RGB composite image of two locations. (Column 1) The first row is simulated images of XCH4 for five plumes. (Column 2–3) XCH4 retrieval at the Korpeje site using Matched Filter and MBMP methods. (Column 4–5) XCH4 retrieval at the Permian Basin site using Matched Filter and MBMP methods. (From (top) to (bottom), from (left) to (right)).
In addition to assessing scene-level detection capabilities, this study also examines the precision of individual pixel concentration estimations. Figure 5 illustrates scatter plots that juxtapose the actual concentration enhancements against those retrieved for a randomly chosen set of 2000 enhanced pixels. Both linear regression and reference lines are depicted in conjunction with the scatter points. While the scatter plots for both methodologies demonstrate a commendable alignment with the reference enhancement values, the Matched Filter method is noted to have a lower R2 and a higher RMSE. The reason for this discrepancy is that the simulation dataset was created using a fractional absorption model similar to the MBMP method. This involved creating methane transmittance maps for each band based on simulated methane concentration maps, which were then directly multiplied by the original Sentinel-2 TOA radiance maps to obtain the Sentinel-2 TOA radiance maps under that concentration distribution. Additionally, the original Sentinel-2 TOA radiance maps were used as the reference for scenarios without methane plumes. These factors ensured that the MBMP method operated in an ideal environment for retrieving methane enhancements, resulting in scatter plots with a more concentrated distribution and a smaller RMSE.
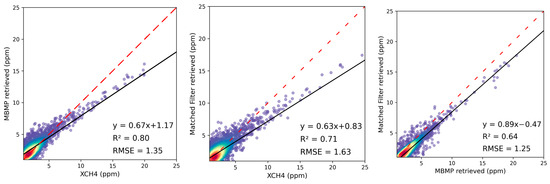
Figure 5.
Comparison of scatter plots of true XCH4 versus retrieved XCH4, with points colored according to density (red to purple indicates high to low). The black solid line represents the linear regression of these scatter points. The red dashed line indicates a line with a slope of 1.
3.2. Result from Real Data
We first applied the method described in Section 2 to a known methane point source emission event located at the Permian Basin (latitude and longitude of the source: 31.7335, −102.0421). According to the study by Ehret et al. [15], emissions from this source began to increase significantly from 9 July 2020 and ceased after 29 September 2020, lasting for approximately two months. Within the entire detection range, we identified nine recognizable methane plumes and determined plume masks, as shown in Figure 6. Subsequently, we employed the method outlined in Section 2.4, using corresponding wind data from the ECMWF-ERA5 reanalysis product from the Copernicus Climate Change Service [43] to quantify the methane point source emission flux rates. Figure 7 displays the emission rates of the nine detected methane plumes. Compared to the method used by Ehret et al., the average estimated difference in emission rates was about 34%.
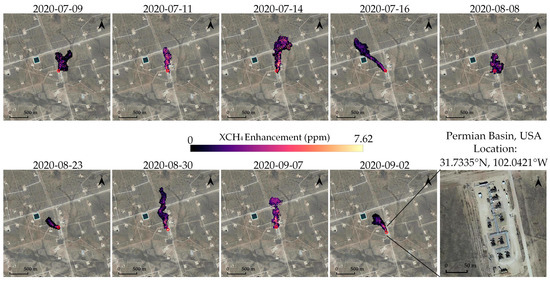
Figure 6.
The methane plume masks detected in the methane point source emission events located in the Permian Basin. The source of the emission is symbolized by the red circle. The fifth column of the second row is the located emission source. Source map from © Google Earth.
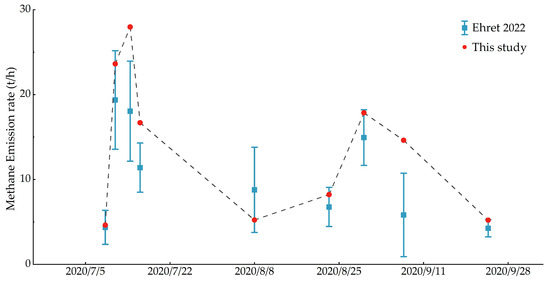
Figure 7.
The observed emission rate of nine methane plumes is compared with that of Ehret et al. [15].
3.3. Controlled Release Experiment
The enhanced images and emission rates presented in Section 3.2 indicate that the algorithm can detect methane and provide quantitative estimates within the expected range. However, due to the unavailability of actual point source emission flux rates, this evaluation of the algorithm’s performance can be considered only qualitative. Therefore, in this section, we compare data from a large-scale controlled release test conducted in Ehrenberg, Arizona, during the fall of 2021, to understand the level of flux rate errors and validate the algorithm’s improvements. During the controlled release experiment, Sentinel-2 passed over the site eight times, but two transits were cloud-covered. Table 2 shows the controlled release experiment scenarios. In six observations, we successfully detected plumes four times and failed to detect them twice, where no methane was released on 10/17 and 11/3 was a missed detection. The detection limit of the algorithm was approximately 1.4–1.7 t/h, with average estimated values ranging from −48% to 42% of the measured values, and an average error percentage of 19%.

Table 2.
Controlled release test scenarios.
3.4. Application Cases
In Figure 8, we demonstrate the application of the algorithm proposed in this study to retrieve methane plumes and locate emission sources. Figure 8b presents the methane plume masks retrieved by Sentinel-2 on 23 August 2022, where we can clearly see the feather-like features produced by methane emissions and identify their sources on a high-resolution map, one of which is located at a natural gas mine in Mary, Turkmenistan (32.2050, 61.4887). The Earth Surface Mineral Dust Source Investigation (EMIT) [33] detected the emissions from this point source about an hour after the Sentinel-2 overpass, and half an hour later, the TROPOMI sensor onboard Sentinel-5P also detected a faint methane plume on a regional scale. The diffusion direction of the plumes observed by the three satellites was generally consistent with the local wind direction estimated at the time of the satellite overpass, and Sentinel-2 and EMIT showed close agreement in the spatial distribution of the morphological features and column concentration gradients of the methane plumes. We quantified the source emission rate of the Sentinel-2 plume as 17.31 t/h, the EMIT plume as 24.12 t/h, and the TROPOMI plume as 46.18 t/h using the method described in Section 2.4. The higher source rate of the TROPOMI plume may have been due to its lower spatial resolution, resulting in an overestimated plume area that included emissions near the source and from the main leak points.
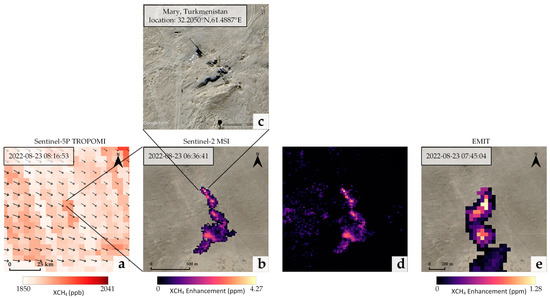
Figure 8.
Examples of the location and shape of detected plumes. Panel a shows the methane concentration observed by Sentinel-5P TROPOMI, with black arrows representing wind vectors (ECMWF-ERA5 10 m wind). Panel (b,d) display methane enhancements and plume masks retrieved by Sentinel-2, Panel (c) shows the located emission source, and Panel (e) presents the methane plume mask retrieved by EMIT. The time of satellite overpass is shown in the Panel (a,b,e) top left corner (UTC). Source map from © Google Earth.
4. Discussion
This study addresses the limitations of existing multispectral methane retrieval methods and proposes a Matched Filter methane retrieval algorithm based on Sentinel-2 satellite imagery. It overcomes the need for selecting reference images inherent in existing algorithms and effectively reduces artifacts and noise. We conducted tests on a simulated dataset, four known methane emission point sources, and controlled release experiments. The simulated scene-level experiments showed that, while the XCH4 plume images retrieved by the Matched Filter and MBMP were visually similar, the Matched Filter method significantly reduced the generation of artifacts, especially in areas with high surface heterogeneity like the Permian Basin.
The performances of the Matched Filter and MBMP were evaluated at known methane emission point sources, with flux rate estimates differing by 34%. The results from controlled release experiments indicated that the algorithm’s detection limit is approximately 1.4–1.7 t/h, with average estimated values ranging from −30% to 91% of the measured values and an average error percentage of 19%. The absence of false positives in these tests validates the algorithm’s reliability. We also present an example of using global monitoring satellites such as TROPOMI in conjunction with locating the point source facilities responsible for abnormally large emissions.
It is noteworthy that the MBMP method used in the experiments employed an ideal reference completely unaffected by methane, yet it still produced many false positives. In practical applications, the use of influenced reference images would introduce additional errors. Moreover, in post-plume mask generation, more work is required to eliminate these false positives, such as filtering out anomalies and manually verifying true plumes with wind speed and direction data. The Matched Filter method reduces such false reporting and does not require the selection of reference images, enabling the use of simple automatic methods for anomaly filtering and plume definition. However, it remains a challenge that the accuracy of the retrieval affects the mask size, and consequently, the mask size affects the emission rate estimation. The underestimation caused by missing plume edges and the overestimation due to the presence of artifacts continue to be issues. In the future, we hope to apply artificial intelligence methods based on computer vision to filter out plume masks unlikely to be produced by gas diffusion, developing an effective method to remove false detections.
Furthermore, our demonstration of the Sentinel-2 methane matched filter algorithm can be easily extended to other multispectral satellite instruments with similar SWIR spectral bands. In the future, it can complement high-precision methane-monitoring satellites like GHGSat and be used in conjunction with global monitoring satellites like TROPOMI to locate and quantify unusually large emissions from point source facilities. This will enable rapid corrective action.
Author Contributions
Contributions: H.W. and F.Y. conceived the manuscript, H.W. performed the experiments, interpreted the results and drafted the manuscript. H.W., X.F. and H.J. contributed to the discussion of the results. All authors conceived the study, and reviewed and approved the manuscript. All authors have read and agreed to the published version of the manuscript.
Funding
This research was funded by the National Key Research and Development Program of China, grant number 2022YFC330160207.
Data Availability Statement
(1) Sentinel-2 and Sentinel-5P were derived from the following resources available in the public domain: [https://dataspace.copernicus.eu/, accessed on 13 March 2024]. (2) EMIT were derived from the following resources available in the public domain: [https://earth.jpl.nasa.gov/emit/data/, accessed on 13 March 2024]. (3) ECMWF-ERA5 were derived from the following resources available in the public domain: [https://cds.climate.copernicus.eu/, accessed on 13 March 2024]. (4) Simulated Sentinel-2 dataset were derived from the following resources available in the public domain: https://doi.org/10.7910/DVN/KRNPEH, accessed on 13 March 2024.
Acknowledgments
The authors sincerely thank the organizations and individuals who generously provided the free datasets used in this research.
Conflicts of Interest
The authors declare no conflicts of interest.
References
- Shukla, P.R.; Skea, J.; Calvo Buendia, E.; Masson-Delmotte, V.; Pörtner, H.O.; Roberts, D.; Zhai, P.; Slade, R.; Connors, S.; Van Diemen, R.; et al. IPCC, 2019: Climate Change and Land: An IPCC Special Report on Climate Change, Desertification, Land Degradation, Sustainable Land Management, Food Security, and Greenhouse Gas Fluxes in Terrestrial Ecosystems; IPCC: Geneva, Switzerland, 2019. [Google Scholar]
- Kirschke, S.; Bousquet, P.; Ciais, P.; Saunois, M.; Canadell, J.G.; Dlugokencky, E.J.; Bergamaschi, P.; Bergmann, D.; Blake, D.R.; Bruhwiler, L.; et al. Three Decades of Global Methane Sources and Sinks. Nat. Geosci. 2013, 6, 813–823. [Google Scholar] [CrossRef]
- Shindell, D.; Kuylenstierna, J.C.I.; Vignati, E.; van Dingenen, R.; Amann, M.; Klimont, Z.; Anenberg, S.C.; Muller, N.; Janssens-Maenhout, G.; Raes, F.; et al. Simultaneously Mitigating Near-Term Climate Change and Improving Human Health and Food Security. Science 2012, 335, 183–189. [Google Scholar] [CrossRef]
- Fletcher, S.E.M.; Schaefer, H. Rising Methane: A New Climate Challenge. Science 2019, 364, 932–933. [Google Scholar] [CrossRef]
- Brandt, A.R.; Heath, G.A.; Cooley, D. Methane Leaks from Natural Gas Systems Follow Extreme Distributions. Environ. Sci. Technol. 2016, 50, 12512–12520. [Google Scholar] [CrossRef]
- Saunois, M.; Stavert, A.R.; Poulter, B.; Bousquet, P.; Canadell, J.G.; Jackson, R.B.; Raymond, P.A.; Dlugokencky, E.J.; Houweling, S.; Patra, P.K.; et al. The Global Methane Budget 2000–2017. Earth Syst. Sci. Data 2020, 12, 1561–1623. [Google Scholar] [CrossRef]
- Alvarez, R.A.; Zavala-Araiza, D.; Lyon, D.R.; Allen, D.T.; Barkley, Z.R.; Brandt, A.R.; Davis, K.J.; Herndon, S.C.; Jacob, D.J.; Karion, A.; et al. Assessment of Methane Emissions from the U.S. Oil and Gas Supply Chain. Science 2018, 361, 186–188. [Google Scholar] [CrossRef] [PubMed]
- Zavala-Araiza, D.; Lyon, D.R.; Alvarez, R.A.; Davis, K.J.; Harriss, R.; Herndon, S.C.; Karion, A.; Kort, E.A.; Lamb, B.K.; Lan, X.; et al. Reconciling Divergent Estimates of Oil and Gas Methane Emissions. Proc. Natl. Acad. Sci. USA 2015, 112, 15597–15602. [Google Scholar] [CrossRef] [PubMed]
- Hamlin, L.; Green, R.O.; Mouroulis, P.; Eastwood, M.; Wilson, D.; Dudik, M.; Paine, C. Imaging Spectrometer Science Measurements for Terrestrial Ecology: AVIRIS and New Developments. In Proceedings of the 2011 Aerospace Conference, Big Sky, MT, USA, 5–12 March 2011; pp. 1–7. [Google Scholar]
- Roberts, D.A.; Bradley, E.S.; Cheung, R.; Leifer, I.; Dennison, P.E.; Margolis, J.S. Mapping Methane Emissions from a Marine Geological Seep Source Using Imaging Spectrometry. Remote Sens. Environ. 2010, 114, 592–606. [Google Scholar] [CrossRef]
- Thorpe, A.K.; Roberts, D.A.; Bradley, E.S.; Funk, C.C.; Dennison, P.E.; Leifer, I. High Resolution Mapping of Methane Emissions from Marine and Terrestrial Sources Using a Cluster-Tuned Matched Filter Technique and Imaging Spectrometry. Remote Sens. Environ. 2013, 134, 305–318. [Google Scholar] [CrossRef]
- Thompson, D.R.; Leifer, I.; Bovensmann, H.; Eastwood, M.; Fladeland, M.; Frankenberg, C.; Gerilowski, K.; Green, R.O.; Kratwurst, S.; Krings, T.; et al. Real-Time Remote Detection and Measurement for Airborne Imaging Spectroscopy: A Case Study with Methane. Atmos. Meas. Tech. 2015, 8, 4383–4397. [Google Scholar] [CrossRef]
- Irakulis-Loitxate, I.; Guanter, L.; Maasakkers, J.D.; Zavala-Araiza, D.; Aben, I. Satellites Detect Abatable Super-Emissions in One of the World’s Largest Methane Hotspot Regions. Environ. Sci. Technol. 2022, 56, 2143–2152. [Google Scholar] [CrossRef] [PubMed]
- Sánchez-García, E.; Gorroño, J.; Irakulis-Loitxate, I.; Varon, D.J.; Guanter, L. Mapping Methane Plumes at Very High Spatial Resolution with the WorldView-3 Satellite. Atmos. Meas. Tech. 2022, 15, 1657–1674. [Google Scholar] [CrossRef]
- Ehret, T.; De Truchis, A.; Mazzolini, M.; Morel, J.-M.; d’Aspremont, A.; Lauvaux, T.; Duren, R.; Cusworth, D.; Facciolo, G. Global Tracking and Quantification of Oil and Gas Methane Emissions from Recurrent Sentinel-2 Imagery. Environ. Sci. Technol. 2022, 56, 10517–10529. [Google Scholar] [CrossRef] [PubMed]
- Zhang, Z.; Sherwin, E.D.; Varon, D.J.; Brandt, A.R. Detecting and Quantifying Methane Emissions from Oil and Gas Production: Algorithm Development with Ground-Truth Calibration Based on Sentinel-2 Satellite Imagery. Atmos. Meas. Tech. 2022, 15, 7155–7169. [Google Scholar] [CrossRef]
- Alexe, M.; Bergamaschi, P.; Segers, A.; Detmers, R.; Butz, A.; Hasekamp, O.; Guerlet, S.; Parker, R.; Boesch, H.; Frankenberg, C.; et al. Inverse Modelling of CH4 Emissions for 2010–2011 Using Different Satellite Retrieval Products from GOSAT and SCIAMACHY. Atmos. Chem. Phys. 2015, 15, 113–133. [Google Scholar] [CrossRef]
- Bergamaschi, P.; Houweling, S.; Segers, A.; Krol, M.; Frankenberg, C.; Scheepmaker, R.A.; Dlugokencky, E.; Wofsy, S.C.; Kort, E.A.; Sweeney, C.; et al. Atmospheric CH4 in the First Decade of the 21st Century: Inverse Modeling Analysis Using SCIAMACHY Satellite Retrievals and NOAA Surface Measurements. J. Geophys. Res. Atmos. 2013, 118, 7350–7369. [Google Scholar] [CrossRef]
- Butz, A.; Galli, A.; Hasekamp, O.; Landgraf, J.; Tol, P.; Aben, I. TROPOMI Aboard Sentinel-5 Precursor: Prospective Performance of CH4 Retrievals for Aerosol and Cirrus Loaded Atmospheres. Remote Sens. Environ. 2012, 120, 267–276. [Google Scholar] [CrossRef]
- Jacob, D.J.; Varon, D.J.; Cusworth, D.H.; Dennison, P.E.; Frankenberg, C.; Gautam, R.; Guanter, L.; Kelley, J.; McKeever, J.; Ott, L.E.; et al. Quantifying Methane Emissions from the Global Scale down to Point Sources Using Satellite Observations of Atmospheric Methane. Atmos. Chem. Phys. 2022, 22, 9617–9646. [Google Scholar] [CrossRef]
- Guanter, L.; Irakulis-Loitxate, I.; Gorroño, J.; Sánchez-García, E.; Cusworth, D.H.; Varon, D.J.; Cogliati, S.; Colombo, R. Mapping Methane Point Emissions with the PRISMA Spaceborne Imaging Spectrometer. Remote Sens. Environ. 2021, 265, 112671. [Google Scholar] [CrossRef]
- Guanter, L.; Kaufmann, H.; Segl, K.; Foerster, S.; Rogass, C.; Chabrillat, S.; Kuester, T.; Hollstein, A.; Rossner, G.; Chlebek, C.; et al. The EnMAP Spaceborne Imaging Spectroscopy Mission for Earth Observation. Remote Sens. 2015, 7, 8830–8857. [Google Scholar] [CrossRef]
- Jervis, D.; McKeever, J.; Durak, B.O.A.; Sloan, J.J.; Gains, D.; Varon, D.J.; Ramier, A.; Strupler, M.; Tarrant, E. The GHGSat-D Imaging Spectrometer. Atmos. Meas. Tech. 2021, 14, 2127–2140. [Google Scholar] [CrossRef]
- Drusch, M.; Del Bello, U.; Carlier, S.; Colin, O.; Fernandez, V.; Gascon, F.; Hoersch, B.; Isola, C.; Laberinti, P.; Martimort, P.; et al. Sentinel-2: ESA’s Optical High-Resolution Mission for GMES Operational Services. Remote Sens. Environ. 2012, 120, 25–36. [Google Scholar] [CrossRef]
- Roy, D.P.; Wulder, M.A.; Loveland, T.R.; Woodcock, C.E.; Allen, R.G.; Anderson, M.C.; Helder, D.; Irons, J.R.; Johnson, D.M.; Kennedy, R.; et al. Landsat-8: Science and Product Vision for Terrestrial Global Change Research. Remote Sens. Environ. 2014, 145, 154–172. [Google Scholar] [CrossRef]
- Varon, D.J.; Jervis, D.; McKeever, J.; Spence, I.; Gains, D.; Jacob, D.J. High-Frequency Monitoring of Anomalous Methane Point Sources with Multispectral Sentinel-2 Satellite Observations. Atmos. Meas. Tech. 2021, 14, 2771–2785. [Google Scholar] [CrossRef]
- Mok, P.Y.; Huang, H.Q.; Kwok, Y.L.; Au, J.S. A Robust Adaptive Clustering Analysis Method for Automatic Identification of Clusters. Pattern Recognit. 2012, 45, 3017–3033. [Google Scholar] [CrossRef]
- Gordon, I.E.; Rothman, L.S.; Hargreaves, R.J.; Hashemi, R.; Karlovets, E.V.; Skinner, F.M.; Conway, E.K.; Hill, C.; Kochanov, R.V.; Tan, Y.; et al. The HITRAN2020 Molecular Spectroscopic Database. J. Quant. Spectrosc. Radiat. Transf. 2022, 277, 107949. [Google Scholar] [CrossRef]
- Roger, J.; Irakulis-Loitxate, I.; Valverde, A.; Gorroño, J.; Chabrillat, S.; Brell, M.; Guanter, L. High-Resolution Methane Mapping with the EnMAP Satellite Imaging Spectroscopy Mission. IEEE Trans. Geosci. Remote Sens. 2024, 62, 4102012. [Google Scholar] [CrossRef]
- Ayasse, A.K.; Dennison, P.E.; Foote, M.; Thorpe, A.K.; Joshi, S.; Green, R.O.; Duren, R.M.; Thompson, D.R.; Roberts, D.A. Methane Mapping with Future Satellite Imaging Spectrometers. Remote Sens. 2019, 11, 3054. [Google Scholar] [CrossRef]
- Fei, L.I.; Shiwei, S.U.N.; Yongguang, Z.; Chenxi, F.; Cuihong, C.; Huiqin, M.A.O.; Yinnian, L.I.U. Mapping Methane Super-Emitters in China and United States with GF5-02 Hyperspectral Imaging Spectrometer. Natl. Remote Sens. Bull. 2023, 1–15. [Google Scholar] [CrossRef]
- Thompson, D.R.; Thorpe, A.K.; Frankenberg, C.; Green, R.O.; Duren, R.; Guanter, L.; Hollstein, A.; Middleton, E.; Ong, L.; Ungar, S. Space-Based Remote Imaging Spectroscopy of the Aliso Canyon CH4 Superemitter. Geophys. Res. Lett. 2016, 43, 6571–6578. [Google Scholar] [CrossRef]
- Thorpe, A.K.; Green, R.O.; Thompson, D.R.; Brodrick, P.G.; Chapman, J.W.; Elder, C.D.; Irakulis-Loitxate, I.; Cusworth, D.H.; Ayasse, A.K.; Duren, R.M.; et al. Attribution of Individual Methane and Carbon Dioxide Emission Sources Using EMIT Observations from Space. Sci. Adv. 2023, 9, eadh2391. [Google Scholar] [CrossRef] [PubMed]
- Pei, Z.; Han, G.; Mao, H.; Chen, C.; Shi, T.; Yang, K.; Ma, X.; Gong, W. Improving Quantification of Methane Point Source Emissions from Imaging Spectroscopy. Remote Sens. Environ. 2023, 295, 113652. [Google Scholar] [CrossRef]
- Clough, S.A.; Shephard, M.W.; Mlawer, E.J.; Delamere, J.S.; Iacono, M.J.; Cady-Pereira, K.; Boukabara, S.; Brown, P.D. Atmospheric Radiative Transfer Modeling: A Summary of the AER Codes. J. Quant. Spectrosc. Radiat. Transf. 2005, 91, 233–244. [Google Scholar] [CrossRef]
- Atmospheric & Environmental Research (AER) Radiative Transfer Working Group Website. Available online: http://rtweb.aer.com/coverpg.html (accessed on 13 March 2024).
- Anderson, G.; Clough, S.; Kneizys, F.; Chetwynd, J.; Shettle, E. AFGL Atmospheric Constituent Profiles. Environ. Res. Pap. 1986, 954, 1–46. [Google Scholar]
- Cusworth, D.H.; Duren, R.M.; Thorpe, A.K.; Tseng, E.; Thompson, D.; Guha, A.; Newman, S.; Foster, K.T.; Miller, C.E. Using Remote Sensing to Detect, Validate, and Quantify Methane Emissions from California Solid Waste Operations. Environ. Res. Lett. 2020, 15, 054012. [Google Scholar] [CrossRef]
- Frankenberg, C.; Thorpe, A.K.; Thompson, D.R.; Hulley, G.; Kort, E.A.; Vance, N.; Borchardt, J.; Krings, T.; Gerilowski, K.; Sweeney, C.; et al. Airborne Methane Remote Measurements Reveal Heavy-Tail Flux Distribution in Four Corners Region. Proc. Natl. Acad. Sci. USA 2016, 113, 9734–9739. [Google Scholar] [CrossRef]
- Hersbach, H.; Bell, B.; Berrisford, P.; Biavati, G.; Horányi, A.; Muñoz Sabater, J.; Nicolas, J.; Peubey, C.; Radu, R.; Rozum, I.; et al. ERA5 Hourly Data on Pressure Levels from 1940 to Present. Copernicus Climate Change Service (C3S) Climate Data Store (CDS). Available online: https://cds.climate.copernicus.eu/cdsapp#!/dataset/10.24381/cds.bd0915c6?tab=overview (accessed on 2 February 2024).
- Sherwin, E.D.; Rutherford, J.S.; Chen, Y.; Aminfard, S.; Kort, E.A.; Jackson, R.B.; Brandt, A.R. Single-Blind Validation of Space-Based Point-Source Detection and Quantification of Onshore Methane Emissions. Sci. Rep. 2023, 13, 3836. [Google Scholar] [CrossRef]
- Gorroño, J.; Varon, D.J.; Irakulis-Loitxate, I.; Guanter, L. Understanding the Potential of Sentinel-2 for Monitoring Methane Point Emissions. Atmos. Meas. Tech. 2023, 16, 89–107. [Google Scholar] [CrossRef]
- Bell, B.; Hersbach, H.; Simmons, A.; Berrisford, P.; Dahlgren, P.; Horányi, A.; Muñoz-Sabater, J.; Nicolas, J.; Radu, R.; Schepers, D.; et al. The ERA5 Global Reanalysis: Preliminary Extension to 1950. Q. J. R. Meteorol. Soc. 2021, 147, 4186–4227. [Google Scholar] [CrossRef]
Disclaimer/Publisher’s Note: The statements, opinions and data contained in all publications are solely those of the individual author(s) and contributor(s) and not of MDPI and/or the editor(s). MDPI and/or the editor(s) disclaim responsibility for any injury to people or property resulting from any ideas, methods, instructions or products referred to in the content. |
© 2024 by the authors. Licensee MDPI, Basel, Switzerland. This article is an open access article distributed under the terms and conditions of the Creative Commons Attribution (CC BY) license (https://creativecommons.org/licenses/by/4.0/).