Abstract
Water leakages can affect the safety and durability of shield tunnels, so rapid and accurate identification and diagnosis are urgently needed. However, current leakage detection methods are mostly based on mobile LiDAR data, making it challenging to detect leakage damage in both mobile and terrestrial LiDAR data simultaneously, and the detection results are not intuitive. Therefore, an integrated cylindrical voxel and Mask R-CNN method for water leakage inspection is presented in this paper. This method includes the following three steps: (1) a 3D cylindrical-voxel data organization structure is constructed to transform the tunnel point cloud from disordered to ordered and achieve the projection of a 3D point cloud to a 2D image; (2) automated leakage segmentation and localization is carried out via Mask R-CNN; (3) the segmentation results of water leakage are mapped back to the 3D point cloud based on a cylindrical-voxel structure of shield tunnel point cloud, achieving the expression of water leakage disease in 3D space. The proposed approach can efficiently detect water leakage and leakage not only in mobile laser point cloud data but also in ground laser point cloud data, especially in processing its curved parts. Additionally, it achieves the visualization of water leakage in shield tunnels in 3D space, making the water leakage results more intuitive. Experimental validation is conducted based on the MLS and TLS point cloud data collected in Nanjing and Suzhou, respectively. Compared with the current commonly used detection method, which combines cylindrical projection and Mask R-CNN, the proposed method can achieve water leakage detection and 3D visualization in different tunnel scenarios, and the accuracy of water leakage detection of the method in this paper has improved by nearly 10%.
1. Introduction
The development of rail transit is crucial for easing urban traffic congestion and solving commuting difficulties. Therefore, China has vigorously promoted the construction of urban metros. By the end of 2022, more than 50 cities in China will have or be under urban rail transit construction [1]. Safety concerns have received increasing attention as subway tunnel construction progresses [2]. Currently, most subway tunnels under construction or already built are shield tunnels. As the service life of shield tunnels increases, various structural defects, such as cracks, water leakage, convergence, and deformation, appear in different sections of the tunnel lining to varying degrees. The most common issue among them is water leakage. Relevant studies have shown that water leakage damage is a pervasive issue in operational tunnels, accounting for approximately 70% of damage [3]. Since the construction of subway systems, several serious incidents have been caused by water leakage worldwide; for example, the operation of Line 1 of St. Petersburg in Russia was suspended due to the tunnel structure caused by water leakage [4]. A subway tunnel lining was severely damaged in a Shanghai metro line by water leakage caused by soil accumulation [5]. The metro shield tunnel linings of the Foshan subway in Guangdong province have caused many casualties because of water leakage accidents [6]. These accidents have had immeasurable socio-economic impacts. Therefore, it is essential to regularly identify and diagnose water leakage in subway tunnels.
Traditional tunnel leakage detection relies mainly on manual visual inspections conducted late at night for less than three hours each day. This method is time-consuming, inefficient, and cannot meet the rapid inspection needs of numerous operational subway tunnels; moreover, the inspection results are subjective [7,8,9]. In recent years, there has been a series of studies on automated tunnel disease detection technologies to improve detection efficiency and avoid subjectivity, with laser scanning being a commonly used method [10,11,12]. Laser scanning technology uses laser ranging and optical technology to scan the tunnel surfaces with high precision, obtain the spatial location of the tunnels and the laser reflection intensity, and construct high-precision, dense point cloud information, which provides rich data support for tunnel structural health monitoring and assessment [13]. These advantages make it possible to digitize tunnel structural diseases quickly and in near real time. Currently, laser scanning technology is widely used in tunnel dislocation detection [14,15,16], cross-section mapping [17], defect detection [18,19], tunnel modeling [20,21], and other applications. The methods based on laser scanning technology for water leakage detection can be divided into two main categories: image processing methods and deep learning methods.
The image processing method first converts a 3D tunnel point cloud projection into a 2D intensity image, and then tunnel leakage is detected according to different image processing algorithms [22,23,24]. Feng [23] first proposed the idea of detecting and locating water leakage based on laser point cloud intensity and 3D coordinates in 2006, tested it by manual control in TBM and blasting tunnels, and successfully detected water leakage in different types of tunnel linings, but the method was only applicable to the locations where the lining surfaces were uniform, and the laser incidence angle did not have any major changes. Höfle [25] then introduced point cloud intensity correction and proposed two distinct methods to calibrate the intensity data of laser-scanned point clouds. This notably reduced the variations in intensity, providing a valuable reference for the application of laser scanning technology in the detection of tunnel water leakage. Gonalves et al. [24] developed an algorithm for the automatic unfolding of cylindrical surfaces, which utilizes the point cloud intensity data to achieve the conversion of point cloud to image, thereby validating the suitability of laser scanners for tunnel defect detection. Wu et al. [26] used laser scanning to unfold 3D point clouds; corrected intensity; used image processing to identify and extract tunnel leaks; and applied connected domain analysis to count, locate, and measure leak areas, achieving 92% accuracy for digital tunnel defect management. Zhu et al. [27] projected 3D point clouds to 2D grayscale images and proposed pseudo-color enhancement with multi-channel, multi-threshold image detection, meeting second-level waterproofing standards for underground engineering. However, the aforementioned methods have certain disadvantages in terms of data acquisition efficiency, requirements for on-site acquisition environments, and the degree of automation in detection. In addition, the method can only detect water leakage areas in 2D intensity images in a real 3D subway tunnel lining model and cannot provide information about the spatial location of water leakage lesions. To solve these problems, it is necessary to further investigate an automated method for water leakage detection, localization, and 3D visualization while reducing the influence of internal tunnel appurtenances on water leakage detection.
In recent years, deep learning models have demonstrated notable prowess in extracting features at the pixel level [28]. Deep learning can automatically learn non-human-designed features and incorporate this feature learning into building deep networks, thus reducing the incompleteness caused by human-designed features [29], which offers fresh opportunities for the automatic identification and extraction of water leakage in tunnels. For example, Protopapadakis et al. [30] utilized 17 low-level features extracted from origin tunnel lining images based on a convolutional neural network (CNN) for tunnel lining disease recognition, outperforming traditional algorithms such as KNN and SVM. Still, it only detects the leaking water distribution and cannot provide a quantitative description. Huang et al. [31] employed a full convolutional network (FCN) to extract the feature hierarchy and achieve semantic segmentation of water leakage in shield tunnels, which significantly improved the accuracy and efficiency compared with the detection method based on image processing. Xiong et al. [32] classified leakage water into six categories and proposed an improved FCN-based image recognition algorithm for leakage water in shield tunnels, effectively avoiding the influence of interfering objects (e.g., pipelines, bolt holes, etc.) on water leakage recognition with great robustness. Nonetheless, Huang [31] and Xiong [32] can solely identify the distribution and shape characteristics of water leakage, lacking the capability to furnish details regarding the precise location and quantity. Cheng et al. [33] devised an improved full convolutional network (FCN) based on VGG-19 for pixel-level water leakage segmentation, while this approach lacks a quantitative description of the water leakages. Considering the demands of practical application, the location information of water leakage areas, as well as the specific segmentation of each area, are required. Mask R-CNN [18,34] integrates semantic segmentation and object detection, which could simultaneously fulfill the requirements above. For example, Zhao et al. [18] implemented instance segmentation of water leakage in shield tunnels by applying Mask R-CNN, which localizes the leakage area and generates high-quality masks simultaneously. Xue et al. [35] employed model compression methods to improve the detection speed of Mask R-CNN and further applied the optimization methods of data augmentation, transfer learning, and cascading strategy to enhance the model accuracy. Liu et al. [36] suggested an improved Mask R-CNN deep learning model based on MLS point cloud intensity images, which combines Res2Net with a cascade structure and grades the residual seams of a single residual block for extracting multi-scale features of water leakage.
The above methods involve the process of transforming a 3D point cloud into a 2D intensity image, which can effectively reflect the water leakage information of the tunnel lining and is a key step in current water leakage disease detection. The commonly used conversion method, which is called the cylindrical projection method, involves projecting 3D point cloud data onto a standard cylinder using cylindrical projection, then unfolding it along the top of the cylinder onto a 2D plane, and finally converting the 2D point cloud into an image format based on point cloud intensity information [19,22,26]. However, this method typically performs better when handling mobile laser point cloud data because the scanning of tunnel data by mobile laser point clouds follows a linear pattern [24]. In contrast, processing terrestrial laser point cloud data is usually more complex and prone to deformation because these types of data better reflect the real shape of the tunnel, including both straight and curved segments. When using the cylindrical projection method to process point cloud data from curved segments of tunnels, deformation is highly likely to occur. Qiu et al. [37] suggested using the standard design cross-section as a reference for unfolding point clouds. However, due to deformation occurring during the tunnel’s operational phase, directly unfolding according to the standard cross-section may result in distorted images of the tunnel’s interior surface, with less effective results compared to the cylindrical projection method. Currently, there is a lack of a unified process for converting tunnel point clouds into two-dimensional intensity images for these two types of point cloud data.
To address the above problems, an integrated method combining cylindrical voxels and mask region-based convolutional neural network (Mask R-CNN) for water leakage inspection in shield tunnels is proposed. This method efficiently accomplishes the segmentation, localization, and three-dimensional visualization of leaks. Compared to commonly used cylindrical projection methods and Mask R-CNN automatic leak detection methods, this approach excels in detecting water leakages in shield tunnel point cloud data, particularly when processing the curved part of the terrestrial laser tunnel point clouds. Figure 1 shows the workflow of the proposed method. The primary contributions of this study can be outlined as follows:
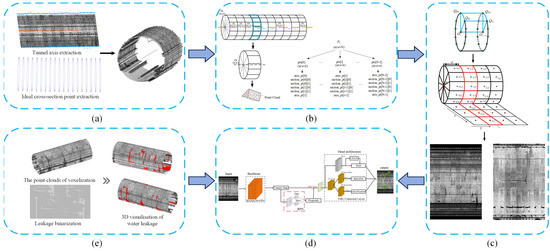
Figure 1.
Workflow of the proposed method: (a) extracted central axis and ideal section points in the shield tunnel point cloud; (b) constructing cylindrical voxel structure in shield tunnel point cloud; (c) generation of 2D intensity images based on the cylindrical voxel structure of the tunnel point cloud, where the red points are the axis points and the blue points and green points are the ideal (design) cross-section points; (d) segmentation and localization of water leakages by Mask R-CNN; (e) 3D visualization of water leakages.
- (1)
- A data organization method of cylindrical-voxel structure is proposed to convert the point cloud from disordered to ordered and realize the projection conversion of the 3D point cloud to 2D intensity images. Compared with the traditional cylindrical projection method, this method can generate higher quality 2D intensity images, which is not only applicable to mobile laser point cloud data but also to terrestrial laser point cloud data.
- (2)
- Based on the 2D intensity images generated by the cylindrical voxel projection and the Mask R-CNN algorithm, leakage detection is realized, and the Mask R-CNN demonstrates higher accuracy and efficiency than the semantic segmentation algorithms (U-net and DeepLabV3+) in the leakage segmentation task.
- (3)
- The representation of water leakage in 3D space is achieved based on the cylindrical-voxel structure of shield tunnel point clouds, which could help the inspectors locate the water leakage area quickly.
2. Materials
This section introduces the materials we used in this study, which can be divided into two parts: the experimental data and hardware configuration.
2.1. Experimental Data
The point clouds of the shield tunnel in this paper were collected from various cities via two distinct acquisition methods, i.e., a mobile tunnel detection system developed by Capital Normal University [36] and a Faro S350 ground laser scanner. The point cloud of a section of 90 m long Tianjin Metro Line 5 was captured by the mobile tunnel detection system [38] (Figure 2a), which we called the MLS point cloud. The point cloud of a section of an approximately 86 m long partially curved shield tunnel of Suzhou Metro was collected by the Faro S350 ground laser scanner (Figure 2b). This point cloud exhibited a slight curvature with an average curvature of 0.003 and was subsequently referred to as the TLS point cloud. The design internal radius R of the above shield tunnels is 2.75 m. The ring widths of the shield tunnels at different locations vary due to the geological conditions and construction requirements of different regions. The ring width of the shield tunnel in Tianjin is 1.5 m, while the ring width of the shield tunnel in Suzhou is 1.2 m.

Figure 2.
The experimental data: (a) MLS point cloud of the shield tunnel in Tianjin; (b) TLS point cloud of the partially cured shield tunnel in Suzhou.
2.2. Hardware Configuration
The tunnel lining images input to the deep learning model were annotated by the open-source software LabelMe 3.16. The annotated images were converted to Microsoft COCO dataset format [39] as required for the Mask R-CNN training process. The experiments were conducted on a cloud server with the Ubuntu operating system. Here, the shield tunnel part of the point cloud was converted into 2D intensity images was implemented based on C++, and the leakage detection, segmentation, and 3D visualization were implemented in Python.
3. Methods
A new method for water leakage in shield tunnel detection is presented in this section, which integrates the cylindrical-voxel structure and the instance segmentation network Mask R-CNN, which can realize the segmentation, localization, and 3D visualization of water leakage in shield tunnel point clouds with different line type, especially for the shield tunnel point clouds with curved. The overall method can be divided into two parts as follows:
3.1. Converting 3D Point Clouds to 2D Intensity Images
3.1.1. Extracting the 3D Axial Points and Section Points of Shield Tunnel
To extract the tunnel axis, the problem of expressing the 3D spatial axis is transformed into a common expression problem of two 2D projection planes [40]. First, the point clouds of the shield tunnel are projected onto the XOY plane and then vertically sliced along the X-axis at intervals of a given threshold until the maximum value of abscissa of the point clouds of the shield tunnel is reached. Next, within each slice, the maximum value and the minimum value of the point cloud’s ordinate are searched for, and their midpoint coordinates are calculated. To improve the accuracy of the projected axis, the random sample consensus (RANSAC) algorithm was used to fit the axis. By using the same method, the axial equations of the XOZ plane can be found. The 3D spatial axis L of the shield tunnel is described as follows:
Based on a specified point on the axis, tunnel cross-sections perpendicular to the tunnel axis can be extracted. This paper adopts the method proposed by Kang et al. to extract the cross-section [41]. Firstly, the axes extracted from the shield tunnel are subdivided as required. Since some axes of the shield tunnel are curved, and straight lines are a special case of zero curvature, they are uniformly treated as curves. As shown in Figure 3, given the tunnel intercept section interval and the location of the first intercept section (axis point O0), the exact location of each intercept section (axis points O1, O2, O3, etc.) can be determined by using the formula for calculating the arc length.
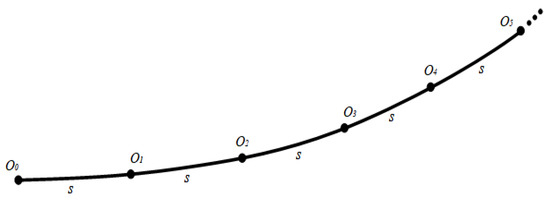
Figure 3.
Tunnel axis in the isometric diagram.
Subsequently, the shield tunnel section is extracted from the starting axis point O0, and the section at axis point O0 is labeled as section O0. First, the section is divided into a series of rays in the normal plane at a given interval . Then, the section is first divided according to the given interval , and a series of rays in the normal plane is obtained; then, the section point is obtained in the section with the axis point O0 as the starting point at a fixed angle , and , where , located in the section, is generated by taking the point in the section; next, another vector , where , is taken in the section, (“×” is the cross-multiplication symbol). Finally, the arbitrary vector in the section with O0 as the starting point and every can be linearly represented by the normalized and (as shown in Figure 4).
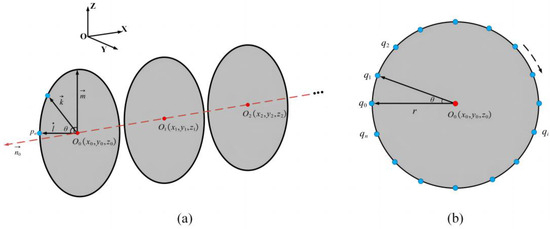
Figure 4.
Diagram of the calculation of section points: (a) determination of cross-sections; (b) extraction of cross-section points, the black dotted arrow indicates the direction for calculating section points.
The ray equation Lk can be uniquely determined by and O0:
where , and .
Continuing, after obtaining each ray Lk in the normal plane, a point on each ray can be taken, such that:
where is the center coordinate of the circle, is the unit vector of , and is the unit vector of .
As shown in Figure 4b, qi is one of the section points at the desired point, and all the trajectories of qi form a section circle with O0 as the center and r as the radius (usually equal to the radius of the shield tunnel design); all the section points in the section can be obtained by processing each ray one by one. By analogy, the extraction of all the section points of shield tunnel point clouds is completed axis by axis.
3.1.2. Cylindrical Voxelization
To construct a cylindrical voxel, it is first necessary to select two adjacent section points, Q00 and Q01, based on the initial section O0 and the corresponding section points Q10 and Q11 in the adjacent section O1. Then, a cylindrical voxel based on the constraints of section center O0 (i.e., the axial point), section points Q00 and Q01 of section O0, section center O1, and section points Q10 and Q11 of section O1 can be constructed (Figure 5c). Additionally, the point cloud data within this range are grouped into this voxel based on the KD tree for storage. With the above method, we can realize cylindrical voxelization of the shield tunnel point cloud and construct a cylindrical-voxel structure inside the data. Let the total length of the shield tunnel be L and the section radius be r; the centroid angle of two neighboring sections within the same section is , and the distance between neighboring sections be d1. The number of cylindrical voxels in the two neighboring sections is , and the total number of cylindrical voxels in the shield tunnel is .
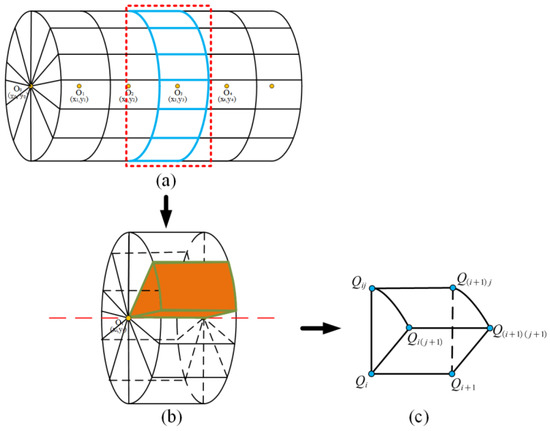
Figure 5.
The structure of cylindrical voxel in shield tunnel: (a) cylindrical voxel structure within a shield tunnel’s point cloud; (b) cylindrical voxel structure between two cross-sectional circles, highlighting the voxel block in red; (c) composition of a single cylindrical voxel.
3.1.3. Generating the 2D Intensity Image
The intensity image consists of m × n intensity values as pixels. To convert the 3D point cloud into an intensity image, we first need to calculate the average reflected intensity value of all the point clouds within the cylindrical surface voxel as the value of that cylindrical surface voxel, via the following formula:
where N represents the total number of point clouds in the cylindrical voxel, and i and j represent the positions of points within the cylindrical voxel.
Subsequently, based on the number of cylindrical voxels normal and transverse to the shield tunnel, the values of m and n that constitute the intensity image are determined, and according to Section 3.1.2, the value of m is , and the value of n is . In general, the smaller the m and h are, the greater the image resolution; however, if m and h are too small, the amount of computation will increase, and the null value of the cylindrical voxels will also increase, affecting the image quality, and the size of m, n is related to the parameters θ and d1. For the determination of θ and d1, taking the MLS point cloud data as an example, we set four sets of parameters (Table 1) for generating the 2D intensity images of the tunnel (these parameters are the representative ones selected from a large number of tests). The 2D intensity images generated by these parameters are shown in Figure 6. Among them, θ represents the height of the 2D unfolded images, and d1 represents the width of the unfolded images.

Table 1.
Four sets of preset parameters for generating 2D intensity images.
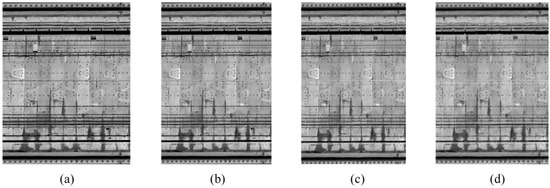
Figure 6.
The 2D intensity images with different parameters: (a) the 2D intensity image generated by the first group parameters; (b) the 2D intensity image generated by the second group parameters; (c) the 2D intensity image generated by the third group parameters; (d) the 2D intensity image generated by the fourth group parameters.
The first set of parameters constitutes the initial configuration of the experiment, aiming to obtain a 2D unfolded diagram that closely resembles the true form of the point cloud. We chose a point cloud data density of 0.006 m for d1 and set θ to 0.12° to maintain a good image proportion. The unfolded results are shown in Figure 6a, where the unfolded image is very clear, and the characteristics of water leakages are evident. However, due to the relatively small values of θ and d1, a larger computational workload is required, resulting in lower efficiency.
Considering the above limitations, in the second set of parameters, we doubled the value of θ to 0.24° and correspondingly increased d1 to 0.015 m. The resulting 2D intensity map of the tunnel (Figure 6b) showed little difference compared to the first set of parameters (Figure 6a), with the characteristic leakage water feature still evident. However, there is a significant reduction in computational workload.
To improve computational efficiency, we adjusted θ to 0.6° in the third set of parameters and correspondingly increased d1 to 0.05 m to ensure the proper scale of the expanded map. The resulting two-dimensional tunnel intensity map is shown in Figure 6c. Compared to Figure 6b, the image quality of Figure 6c slightly decreased.
To further accelerate the calculation, in the fourth set of parameters, we increased θ to 1.2° while increasing d1 to 0.8 m. The resulting 2D intensity image is shown in Figure 6d, and the quality of the image significantly decreases, with water leakage features gradually becoming blurred. However, the application of this parameter is faster to calculate and is suitable for emergency detection in shield tunnels with large areas of water leakage and low accuracy requirements.
Therefore, in this paper, we take θ to be 0.24° and d1 to be 0.015 m in the MLS point cloud to generate the 2D intensity image according to the process described in Figure 7; the area of each voxel after unrolling can be calculated as 0.0001727 m2. In the same way, we can obtain the same θ and d1 values as in the MLS point cloud when applying them to the TLS point cloud.

Figure 7.
Diagram of converting a 3D tunnel point cloud to a 2D intensity image: (a) the cylindrical-voxel structure between two cross-sectional circles, the part highlighted with red lines represents a single cylindrical voxel.; (b) the process of the generation of unrolling the shield point clouds, the red lines on the point cloud of the shield tunnel represent the cylindrical voxelization structure, while and the blue lines, blue points and the numbers highlight the point-to-point mapping relationship from the 3D point cloud to the 2D plane; (c) the result of 2D intensity images.
3.2. Mask R-CNN Architecture
The Mask R-CNN is a popular two-stage instance segmentation framework typically employed in the detection of water leakage [42,43,44,45]. This study applies the Mask R-CNN to automatically detect water leakage in 2D images. The overall architecture of Mask R-CNN consists of three parts, namely, the leading backbone network (ResNet-50 + FPN), the region proposal network (RPN), and the head structure, as shown in Figure 8.
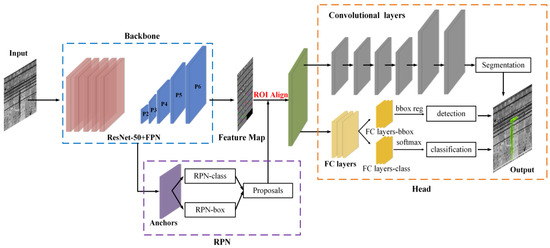
Figure 8.
Overall structure of the Mask R-CNN.
3.2.1. Backbone Structure
The extraction of water leakage features relies on a CNN model. In this paper, ResNet-50, proposed by Kaiming He et al. in 2016 [46] and characterized by the introduction of residual connections and residual blocks, is chosen as the feature extraction network. The network structure can be divided into seven parts. The Feature Pyramid Network (FPN) effectively combines deep and shallow information, which could achieve predicting multi-scale targets. The Mask R-CNN model utilizes the FPN and Resnet-50, a convolutional neural network, to enhance the instance segmentation performance. This combination proves to be a successful approach for detecting multi-scale targets in an image and is a distinguishing feature of the Mask R-CNN network. In Figure 9b, the ResNet-50 network is integrated with FPN to extract deep features from multiple scales, leading to better performance.
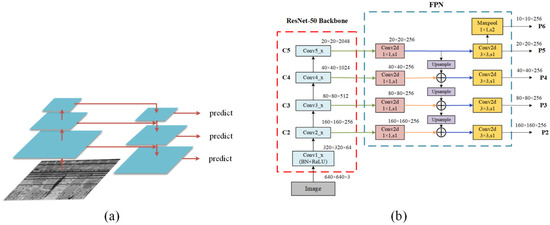
Figure 9.
Schematic diagram of the FPN/ResNet-50, where the arrows represent the forward direction of the algorithm: (a) structure of the FPN; (b) structure of the ResNet-50_FPN.
3.2.2. Generation of Water Leakage Proposals
The region proposal network (RPN) is a crucial component of object detection algorithms and is capable of rapidly generating candidate target boxes for detecting and classifying water leakage features. It utilizes a sliding window operation on the feature map of the input image to generate anchors of various sizes and aspect ratios, covering targets of different sizes and shapes to enhance the model’s adaptability. Typically, three different sizes and three different aspect ratios of anchor boxes are set, totaling nine anchor boxes (Figure 10b). For each generated anchor box, the RPN performs predictions for two tasks: first, it classifies targets within the anchor box using a sigmoid activation function to determine whether it contains a water leakage target. Second, it predicts the offset of the anchor box relative to the real target box to adjust the position of the candidate box precisely. After the predictions are completed, a threshold is set based on the classification scores of the anchor boxes, retaining only candidate boxes with scores above the threshold (Figure 10a, where ‘k’ represents the number of anchors generated per pixel, resulting in 2 k scores generated for each pixel, and each candidate box includes four corresponding offset values (x, y, w, h), yielding a total of 4 k coordinates [47]). Next, candidate boxes with higher confidence levels are filtered. In overlapping candidate boxes, non-maximum suppression (NMS) is applied to retain a specified number of foreground proposals and the highest-scoring suggestions, ultimately generating region proposals for water leakage.
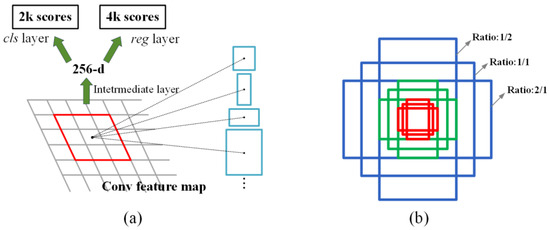
Figure 10.
Diagram of the RPN: (a) the process of RPN, the blue boxes represent the anchors of different sizes; (b) generate anchors, the blue, red and green boxes represent the anchors of various sizes and aspect ratios.
3.2.3. Head Structure
The head structure of Mask R-CNN consists of two branches: an object detection (detection head) part, which is used to classify and regress the bounding box for each candidate target frame, and an instance segmentation part (mask head), which generates pixel-level masks to segment the water leakage objects from the background. In object detection, first, candidate frames are generated using a region proposal network (RPN) and then resized into 7 × 7 fixed-size feature maps using the ROI Align layer. Then, the ROI features undergo a series of convolution and deconvolution operations to output masks matching the size of the ROIs. This represents the semantic segmentation results of the target instances at the pixel level. Finally, these features are classified and regressed to obtain the final detection results. In the Mask branch, each ROI was adjusted to a fixed-size feature map of 14 × 14 × 256 through the ROI Align layer to ensure the retention of more detailed information and then perform convolution and deconvolution operations to output masks for semantic segmentation. The head structure of the Mask R-CNN fully combines the advantages of target detection and semantic segmentation through the synergistic work of the two branches. This provides an efficient and accurate solution for target recognition and segmentation of water leakage.
3.3. Accuracy Evaluation Metrics
Common Objects in Context (COCO) metrics [39] are adopted in this study to evaluate the performance of water leakage detection and segmentation; these metrics include average precision (AP), AP50, and AP75. Here, AP represents the average precision of a model across various confidence thresholds in the intersection over union (IOU) range from 0.5 to 0.95 at an interval of 0.05, AP50 is the average precision value with the IOU value set to 0.5, and AP75 refers to the average precision with the IOU value set to 0.75.
Furthermore, as shown in Figure 11, the IOU is the ratio of the intersection to the union of the predicted bounding box and the ground truth bounding box; this metric can be used to measure the localization accuracy of the predicted target bounding box effectively. For each target, the area of overlap is the intersection of the ground truth and predicted boxes, and the area of union is the total spanned region.
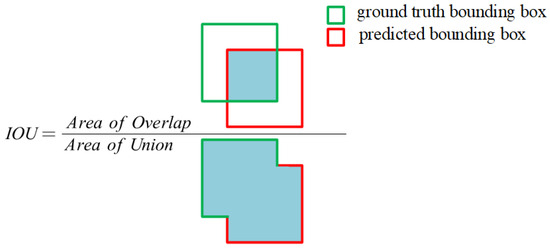
Figure 11.
Formula for calculating the IOU, the blue areas represent the overlapping and union areas between the ground truth bounding box and the predicted bounding box respectively.
4. Results and Discussion
In this section, we employed cylindrical voxels and Mask R-CNN for water leakage detection. The experiment is divided into three parts: the conversion of 3D tunnel point clouds into 2D intensity images based on cylindrical voxels, segmentation and localization of water leakage in 2D intensity images based on Mask R-CNN, and 3D visualization of water leakage based on cylindrical-voxel structures. Furthermore, we conducted evaluations from three perspectives to assess the effectiveness of the proposed method: the quality of generated 2D images, the accuracy of leakage detection, and the precision of leakage segmentation.
4.1. Data Preprocessing
To validate the effectiveness of the proposed method for water leakage detection, the dataset was divided into five parts. To verify that the 2D intensity images generated by the proposed projection method were better than those generated by the traditional cylindrical projection method in water leakage detection task, the MLS and TLS point clouds were converted into 2D intensity images based on the above two projection methods, and four datasets were generated, as shown in Table 2. To validate that the Mask R-CNN model for water leakage detection in this paper is satisfactory compared with the traditional semantic segmentation algorithm, the MLS point cloud was mixed with the TLS point cloud to form Data_5. Due to the hardware limitation, before being input into the deep learning network, the tunnel lining images were cropped into sub-images of 1000 × 1000 pixels and divided into a training set and a test set in a ratio of 4:1. More details are provided in Table 2.

Table 2.
Overview of the datasets.
4.2. Cylindrical Voxel-Based Transformation of 3D Point Clouds into 2D Intensity Images
4.2.1. Two-Dimensional Intensity Images Generated by a Cylindrical Voxel
We selected MLS point cloud and slightly curved TLS point cloud as the experimental data for this article and converted them into 2D intensity images according to the method described in Section 3.1, forming Data_1 and Data_3 in Section 4.1. The generated representative 2D intensity images selected from Data_1 and Data_3 are presented in Figure 12; Figure 12a,b show the 2D intensity images of the shield tunnel generated from the MLS point cloud, and Figure 12c,d show the 2D intensity images generated from the TLS point cloud. There is no obvious deformation in the images, and the details of water leakage inside the shield tunnel can be clearly observed in the image.
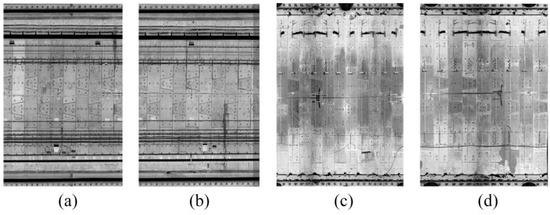
Figure 12.
Two-dimensional intensity images from different point clouds data: (a,b) images generated by MLS point cloud; (c,d) images generated by TLS point cloud.
4.2.2. Comparison with the Cylindrical Projection Method
The process of generating a 2D intensity image by cylindrical projection involves three steps: (1) the raw point cloud data are projected onto a standard cylindrical surface, (2) the point cloud plane on the cylindrical surface is unfolded to the top plane of the cylinder, and (3) the 2D point cloud is converted to a 2D intensity image using the intensity data of the point cloud [26,48]. Among them, the cylindrical surface projection refers to projecting the measured point cloud onto a standard design cross-section. Figure 13 illustrates the unfolding of the tunnel point cloud onto a cylindrical surface.
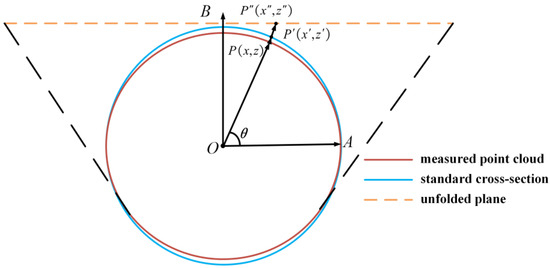
Figure 13.
Diagram of point cloud plane in shield tunnel unfolding.
First, the tunnel point cloud is projected to the standard design cross section centered on the cylindrical fitting center point , as shown by the blue line in Figure 13, where is the positive unit vector of the X axis, is any point in the point cloud, is the point vector after projection of , , and is positive when it is rotated positively counterclockwise around the X-axis. Therefore, the projected can be obtained based on Equation (6).
Then, considering the positive unit vector of the Z axis as , represents the point obtained after unfolding . The angle is the angle between and . The coordinates of the unfolded point can be determined by Equation (7).
Finally, the 2D intensity image of the tunnel can be obtained by using the 2D point cloud intensity data as the pixel values of the constructed 2D image of the tunnel.
To further verify the feasibility of generating 2D intensity images based on cylindrical voxel projection, we compared the results generated by the cylindrical voxel projection method (Figure 14b,d) with those of the currently commonly used cylindrical projection method (Figure 14a,c). The cylindrical projection method is usually based on the cylindrical surface equation to expand the 3D shield tunnel point clouds into a 2D point cloud, which is then converted into a 2D image and assigned in-tensity values to generate 2D intensity images. However, due to the disordered nature of the 3D point clouds, the 2D intensity images generated based on the cylindrical projection method are prone to deformation, especially when dealing with curvilinear shield tunnel point clouds (Figure 14c). Therefore, in this paper, 2D intensity images generated from linear MLS point clouds and slightly curved TLS point clouds are used as experimental data to evaluate the 2D intensity images generated by the above two methods from both quantitative and qualitative perspectives. Several indicators, such as image deformation, contrast, and textural features, are used.
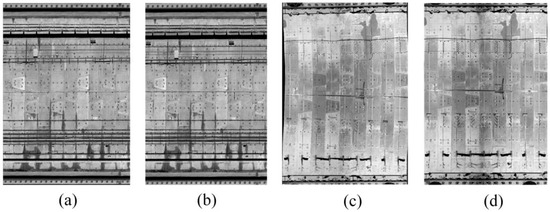
Figure 14.
Two-dimensional intensity images selected from Data_1, Data_2, Data_3, and Data_4: (a) generated by the MLS point cloud based on the cylindrical projection method; (b) images generated by the MLS point cloud based on the cylindrical voxel projection method; (c) images generated by the slightly curved TLS point cloud based on the cylindrical projection method; (d) images generated by the slightly curved TLS point cloud based on the cylindrical voxel projection method.
Qualitative evaluation: Image deformation and texture differences are used as qualitative evaluation metrics. To highlight these features, the circumferential seams of the above four images were plotted based on the ArcGIS 10.2 mapping software; the seams are theoretically straight and are curved when the image deformation occurs (Figure 15a). Additionally, areas with differences in image texture features are highlighted in Figure 15b. Figure 15a shows that for the straight-line MLS point cloud, there is no significant difference between the 2D intensity images generated by cylindrical projection and cylindrical voxel projections. For the curved TLS point cloud, the 2D intensity image generated by the cylindrical projection method exhibits noticeable deformation, while the cylindrical voxel projection method better maintains the overall shape of the unfolded tunnel image, indicating that the cylindrical projection method has greater stability and accuracy when handling complex geometric shapes.
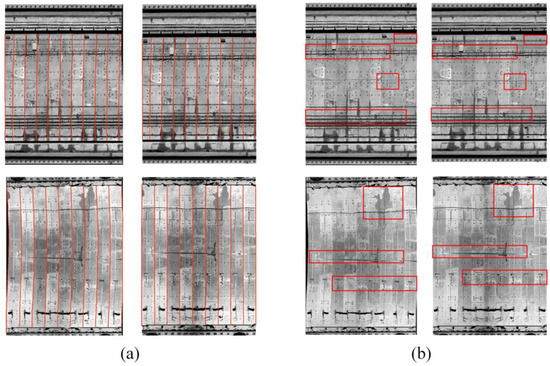
Figure 15.
Qualitative image comparison: (a) deformation differences, the red lines represent the circumferential seam lines in the shield tunnel unfolded image; (b) texture differences, the red boxes highlight textural features with significant variations in the unfolded view of the tunnel.
Quantitative evaluation: deformation quantification, contrast, and texture features serve as quantitative evaluation metrics for assessing the performance of 2D intensity images generated by two methods based on cylindrical voxel projection and cylindrical projection. Regarding the deformation quantification metric, two circumferential seams, namely Line 1 and Line 2, were extracted at the same positions in each image in Figure 16a. Simultaneously, nine points were selected along each circumferential seam for least squares linear fitting. The dispersion of points along the circumferential seams is utilized to indicate the extent of image deformation. The root mean square errors (RMSEs) between the points on the line and the fitted points are presented in Table 3.
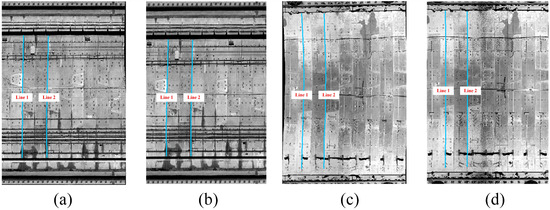
Figure 16.
Circumferential seams selected on the chosen images: (a) Line 1 and Line 2 in tunnel lining images generated by cylindrical projection from MLS point cloud; (b) Line 1 and Line 2 in tunnel lining images generated by cylindrical voxel projection from MLS point cloud; (c) Line 1 and Line 2 in tunnel lining images generated by cylindrical projection from TLS point cloud; (d) Line 1 and Line 2 in tunnel lining images generated by cylindrical voxel projection from TLS point cloud.

Table 3.
RMSEs for the circumferential seam lines and their linear fits.
Table 3 reveals that the RMSEs for points on the seam line and fitted points in tunnel images generated using the cylindrical projection method are lower than those produced by the standard cylindrical projection method. These findings suggest that the points on the seam line in images created by the cylindrical projection method are more concentrated, indicating a smaller degree of deformation in 2D images generated using this method. However, for the curved shield tunnel’s point cloud, the RMSEs for points on the seam line and fitted points in the image produced by the cylindrical projection method are significantly higher. This suggests that the 2D intensity image of the tunnel created using this method experiences more significant deformation. In conclusion, the method based on cylindrical voxel projection outperforms the standard cylindrical projection method in terms of deformation quantification, especially for curved shield tunnel point clouds.
To gain a deeper understanding of the image quality and detail performance depicted in Figure 15b, we calculated the contrast of the 2D intensity images based on the contrast metric. Contrast is a key measure of the brightness differences within an image. A higher contrast typically indicates significant variations in light and dark and richer detail, while a lower contrast suggests a more uniform image with fewer highlighted details. By comparing the contrast of images generated by two methods—cylindrical voxel projection and cylindrical projection—we can more comprehensively assess their differences in detail performance and overall image quality. The results of these contrast calculations are summarized in Table 4.

Table 4.
Contrast of the tunnel intensity images.
Table 4 shows that the method based on cylindrical voxel projection exhibits greater contrast than the method based on cylindrical projection, highlighting its significant advantage in preserving image details.
For texture feature metrics, the method of local binary pattern (LBP) texture feature extraction was employed to compare the texture consistency of images generated by two different approaches. Variance, mean, and histogram consistency were used to quantify the texture consistency of LBP features. The computational results are shown in Table 5. Variance measures the dispersion of LBP values within the image region; a smaller variance indicates relatively concentrated LBP values that correspond to relatively consistent textures. Each mean represents the average level of LBP values within the image region; a larger mean indicates relatively complex textures in the region. Histogram consistency (entropy) measures the uncertainty and diversity of the LBP value distribution; larger entropy values indicate greater uncertainty in LBP values corresponding to complex textures.

Table 5.
Texture consistency indicators for 2D intensity images.
According to the results in Table 5, the images generated based on the cylindrical voxel generation exhibit lower LBP feature variance than the images generated based on the cylindrical projection method, which shows greater variance. In addition, the images generated based on the cylindrical projection method are not as significant as the images generated based on the cylindrical voxel projection method in terms of both LBP feature mean and histogram entropy. This indicates that the method based on cylindrical voxel projection yields richer textures.
After the above analysis, we conclude that the 2D intensity image generated by the cylindrical voxel projection method proposed in this paper outperforms traditional cylindrical projection methods in multiple ways. This method not only improves image quality but also more accurately reveals the water leakage inside the tunnel, providing us with richer and more accurate information.
4.3. Leakage Segmentation and Localization with Cylindrical Voxel Projection and Mask R-CNN
4.3.1. Automatic Detection of Water Leakage
For water leakage detection, a mixed dataset, Data_5, comprising tunnel lining images generated from curved TLS point clouds and straight MLS point clouds based on cylindrical voxels, was utilized. Prior to experimentation, the dataset was preprocessed and uniformly transformed into COCO format [39], ensuring standardized input for subsequent model training.
During the model training phase, the initial learning rate was set to 0.001, with a training period of 100 epochs, a batch size of 4, and a momentum of 0.9. Additionally, the learning rate decayed by a factor of ten every 30 epochs, for a total of three decays. Figure 17 shows the curves depicting the changes in training loss and mAP values over the training process: when the number of epochs is greater than 80, the loss value of the training set tends to stabilize, and at the same time, the AP value tends to stabilize after 80 iterations. The water leakage detection accuracy can reach 0.756, while the segmentation accuracy can reach 0.787.
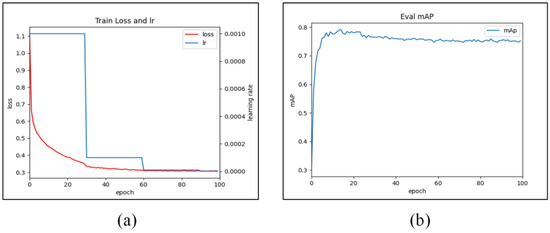
Figure 17.
Variation curves of the learning rate, loss value, and mAP: (a) change in the learning rate and loss value; (b) change in the water leakage segmentation accuracy mAP.
Subsequently, an evaluation and tests were conducted on a randomly selected subset of 160 tunnel-lining images containing leaks from the established dataset. These images contained a total of 453 water leakage areas. In total, our method detected 463 water leakage areas, 435 of which were correctly detected, 10 were misdiagnosed, and 18 were missed. After comprehensively comparing the detection results, the combined cylindrical voxel and Mask R-CNN leakage detection method employed in this study achieved a precision of 96%. Figure 18 shows some water leakage disease detection results based on the output of Mask R-CNN, including common water leakage cases such as longitudinal seam leakage, circumferential seam leakage, bolt-hole leakage, and cross-seam leakage. The first three images are tunnel-lining images generated from the TLS point cloud, while the others are generated from the curved MLS point cloud. By comparing these results with the actual leakage occurrences in the images, it is evident that our proposed method performs well in extracting various types of leakage damage in tunnel lining images generated from both the straight MLS point cloud and the curved TLS point cloud.
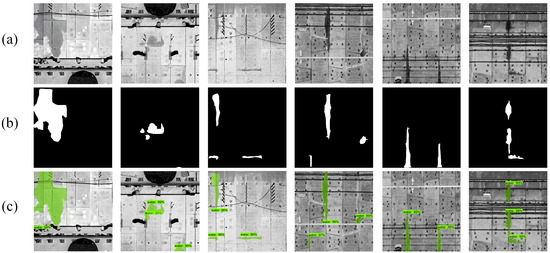
Figure 18.
Results of the segmentation of water leakages: (a) the original tunnel lining images with water leakages; (b) the ground truth corresponding to the water leakages; (c) the results of the water leakages segmentation output by the Mask R-CNN.
4.3.2. Calculation of Leakage Area and Position
The location and area of leakage areas are vital in safety assessments of tunnel structures, where the location aids in rapid disease localization, and the size of the area allows for assessing the severity of the issue [49]. The area of water leakage can be calculated based on the segmented image of water leakage output from Mask R-CNN, and the projection relationship between the 3D tunnel point cloud and the 2D image can be used to obtain the spatial location of the water leakage. In Mask R-CNN, the mask branch generates a binary mask image for each instance through an FCN. Here, the pixel values of the leakage area are 255 (white), while those of non-leakage areas are 0 (black). The relationship between the pixel count and leakage area is shown by Equation (8).
where pi denotes the number of pixels in the water leakage area, and Sp is the actual area of each pixel. The calculation results of the water leakage areas and corresponding locations of the MLS point cloud and TLS point cloud in the shield tunnel are presented in Table 6 and Table 7, respectively.

Table 6.
Statistical table of statistical information on water leakage area of MLS point cloud.

Table 7.
Statistical table of statistical information on water leakage area of TLS point cloud.
4.3.3. Comparison with Water Leakage Detection Methods with Cylindrical Projection and Mask R-CNN
To validate the effectiveness of the proposed method, we conducted a comparison experiment to compare it with the commonly used water leakage detection method combining cylindrical projection and Mask R-CNN [18,19,36,44]. In the experiments, we used two datasets, Data_1 and Data_2, to compare the performance of the cylindrical voxel projection method and the cylindrical projection method combined with Mask R-CNN in the water leakage detection task. First, Data_1 and Data_2 were cropped and labeled to obtain the corresponding COCO datasets. Then, the COCO dataset was input into the Mask R-CNN network, and leakage water extraction was performed. The experimental results reveal that the proposed water leakage detection method, which combines cylindrical voxels and Mask R-CNN, achieves a mean average precision (mAP) of water leakage detection is 0.737 and a mean average precision (mAP) of water leakage segmentation is 0.764, while the mean average precision (mAP) of water leakage detection based on the cylindrical projection method is 0.629 and the mean average precision (mAP) of water leakage segmentation is 0.656 (as shown in Figure 19). The mean average precision of detection and mean average precision of segmentation of the proposed water leakage detection method are both improved by approximately 10%.
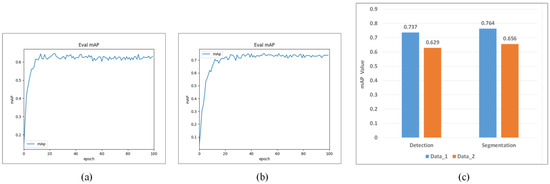
Figure 19.
The mAP curves of leakage segmentation: (a) the method combined with cylindrical projection and Mask R-CNN; (b) the method combined with cylindrical voxel and Mask R-CNN; (c) comparison of leakage detection and segmentation mAP values for Data_1 and Data_2.
From the experimental results, even for linear MLS point cloud data where the quality of the generated 2D intensity images is comparable to that of traditional cylindrical projection images, the combination of the cylindrical voxel projection and Mask R-CNN proposed in this paper for water leakage detection still outperforms the combined cylindrical projection and Mask R-CNN methods. This further illustrates the effectiveness and applicability of the combined cylindrical projection and Mask R-CNN for water leakage detection.
4.3.4. Comparison with Water Leakage Detection Methods with Cylindrical Voxel Projection and Semantic Segmentation Algorithms
To assess the effectiveness of the Mask R-CNN model in comparison to traditional semantic segmentation algorithms for tunnel leakage detection, the Data_6 dataset was converted to the VOC format [50]. Subsequently, the Mask R-CNN was used in combination with the semantic segmentation algorithms U-net and DeepLabV3+ for leakage segmentation. The mean pixel accuracy (MPA), mean interconnection over union (MIOU), and average inference time (AIT) are used in this paper to assess the performance of the above models, where MPA and MIOU can be calculated by Equations (9) and (10), respectively.
where k + 1 denotes the number of categories (including background), pij denotes the number of pixels belonging to category i in category j, and similarly, pii denotes the number of correctly predicted pixels. Four tunnel lining images are selected from the generated dataset for water leakage area prediction based on the training effect of the above model; these images include four common types of water leakage, i.e., ring seam leakage, bolt hole leakage, longitudinal seam leakage, and grout hole leakage. After the processing of the above three algorithms, the water leakage segmentation results are shown in Figure 20, and the related index parameters are shown in Table 8.
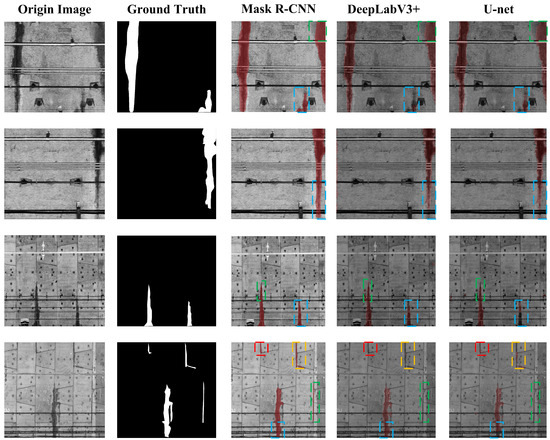
Figure 20.
Diagram of the water leakage segmentation results of the three models, where the dotted boxes with different color in the same image represent different water leakage areas, while the dotted boxes with the same color in different images represent the same water leakage areas.

Table 8.
Evaluation indices for water leakage segmentation evaluation for three different algorithms.
According to the segmentation results and relevant metric parameters, a comprehensive comparison of three different segmentation models for water infiltration area segmentation was conducted, considering both qualitative and quantitative aspects. In qualitative terms, greater attention is given to the segmentation performance of the models in detecting water infiltration areas. As indicated in Figure 20, DeepLabv3+ outperforms U-net in segmenting large-scale water infiltration areas, whereas U-net performs better in segmenting small-scale water infiltration areas. The Mask R-CNN used in this study demonstrated good performance across different scales of water infiltration area segmentation tasks. From a quantitative perspective, metrics such as the mean pixel accuracy (MPA), mean intersection over union (MIoU), and average inference time (AIT) per image were employed for a comprehensive evaluation of the models’ performance in water segmentation tasks. Table 8 reveals that U-net has the lowest MPA and MIoU, while Mask R-CNN achieves the highest, indicating that Mask R-CNN attains higher detection accuracy for different types of water leakage. Furthermore, Mask R-CNN has the shortest average inference time (AIT), highlighting its efficiency compared to U-net and DeepLabv3+. In conclusion, the instance segmentation network Mask R-CNN demonstrates higher accuracy and efficiency in leakage segmentation tasks than the traditional semantic segmentation networks U-net and DeepLabv3+.
4.4. Three-Dimensional Visualization of Water Leakage Segmentation Results
The 3D visualization process of the water leakage segmentation results is as follows: we first carried out preliminary localization of the relevant block locations based on the point clouds of the shield tunnel processed by cylindrical voxel. Subsequently, the water leakage segmentation results were remapped to the corresponding locations in the 3D tunnel point clouds to visualize the leakage segmentation in 3D space. We extracted a section containing water leakage from the MLS point cloud data and the TLS point cloud data in Section 2.1, respectively, as the experimental data for the visualization. The overall process of the above 3D visualization method is shown in Figure 21. This visualization method is simple and fast and can provide tunnel inspectors with a quick overview of the size and distribution of water leakage damage inside shield tunnels. Meanwhile, combining the spatial center coordinates and corresponding area sizes of leakage regions facilitates rapid identification of leakage diseases in key blocks and timely prevention. Importantly, the method is not only applicable to the MLS point cloud of shield tunnels but also to the TLS point cloud, especially for the treatment of curve indistinguishability in the point cloud of TLS tunnels, which reflects its versatility.
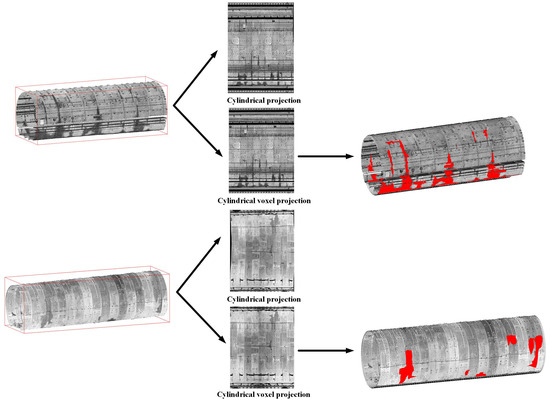
Figure 21.
Process of 3D visualization of the water leakage segmentation results, where the red area indicates the water leakages in shield tunnel.
5. Conclusions
This paper describes a new water leakage detection method that combines cylinder elements and Mask R-CNN, which can achieve the detection and 3D spatial visualization of shield tunnel point cloud data acquired by different acquisition methods, especially the curved shield tunnel point cloud water leakage. This method helps inspectors to understand the spatial distribution of water leakage damage in shield tunnels so that they can quickly locate the damage and solve the problem of serious water leakage and leakage areas in time. Compared with the currently popular leakage detection method that combines cylinder projection and Mask R-CNN, our proposed method not only improves the accuracy of leakage detection and segmentation by nearly 10% but also applies to curved shield tunnels. To verify that the selected Mask R-CNN model outperforms traditional semantic segmentation models such as U-net and DeepLabV3+ in terms of leakage water segmentation performance, we conducted experiments on leakage water segmentation based on these three models. Additionally, we utilized the shield tunnel point clouds by voxelization of the cylinder and the results of leakage water segmentation to achieve rapid 3D spatial visualization of leakage water. This visualization helps inspectors visually understand the distribution of leakage water diseases in shield tunnels. By combining the calculated area of leakage water and 3D spatial coordinates, we can quickly locate and prevent severe leakage areas. Our experiments were conducted on two sections of shield tunnel point clouds and corresponding five datasets, fully demonstrating the effectiveness and feasibility of the proposed method.
In future works, more detailed work will be conducted based on the dataset, network model, and expression of leakage information. In terms of the dataset, our focus is on constructing a more diverse and representative dataset. From the network model viewpoint, we intend to enhance the deep feature extraction capability by improving the internal convolutional structure of the Mask R-CNN network. With respect to the leakage information, a 3D tunnel lining model for the entire shield tunnel will be established based on cylindrical voxelization; simultaneously, the attribute information of each water leakage area will be visualized in the model. In addition, the proposed method draws on the idea of deformation monitoring of the tunnel point cloud, laying the foundation for the integrated detection of deformation and water leakage issues in shield tunnels, which will also serve as our future direction of effort.
Author Contributions
Conceptualization, Z.K. and Z.C.; methodology, Z.C., Q.C., B.G. and X.X.; formal analysis, Q.C., Z.C. and B.G.; data curation, data processing, and experimental results analysis, Q.C.; investigation, Y.P.; resources, Z.K. and J.C.; writing—original draft preparation, Q.C.; writing—review and editing, Z.K., Q.C. and X.X.; visualization, Q.C.; supervision, Z.K., J.C. and Y.P.; project administration and funding acquisition, Z.K. All authors have read and agreed to the published version of the manuscript.
Funding
This research was funded by the National Natural Science Foundation of China, grant number 4237011403.
Data Availability Statement
The authors do not have permission to share data.
Acknowledgments
The authors would like to thank the Capital Normal University (Beijing) for providing the Tianjin metro tunnel dataset for the experiment and the China Railway Construction Corporation 17th Bureau Group Shanghai Urban Rail Transit Engineering for providing the collection site for the shield tunnel of Suzhou metro.
Conflicts of Interest
The authors declare no conflicts of interest. Author Yuxi Pan is employed by the company Piesat Information Technology Co., Ltd.; Jia Chang is employed by the company China Railway Construction Corporation 17th Bureau Group Shanghai Urban Rail Transit Engineering Co., Ltd. The remaining authors declare that the research was conducted in the absence of any commercial or financial relationships that could be construed as a potential conflict of interest.
References
- China Urban Rail Transit Association. Urban Rail Transit 2022 Annual Statistical and Analytical Report. Urban Rail Transit 2023, 4, 13–15. [Google Scholar] [CrossRef]
- Ko, B.; Son, Y.-K.; Shin, D.; Han, C.-S. Development of an inspection system for cracks on the lining of concrete tunnels. In Proceedings of the 20th International Symposium on Automation and Robotics in Construction, Eindhoven, The Netherlands, 21–24 September 2003; pp. 457–463. [Google Scholar]
- Shi, Z.; Chen, X. Leakage Water Position Recognition of Railway Tunnel Wall Based on Terrestrial Laser-Scanning Tech-nology. J. Shanghai Univ. Eng. Sci. 2015, 29, 103–109. [Google Scholar]
- Hu, X.; Bai, N.; Li, H. Analysis on tunnel accident on line 1 of Saint Petersburg Metro. Tunnel Constr 2008, 28, 418–422. [Google Scholar]
- Shao, H.; Huang, H.; Zhang, D.; Wang, R. Case study on repair work for excessively deformed shield tunnel under accidental surface surcharge in soft clay. Chin. J. Geotech. Eng. 2016, 38, 1036–1043. [Google Scholar]
- Zhang, Y.; Zhu, W.; Zhao, C.; Han, B. Moniting and inversion of Foshan metro collapse with multi-temporal Insar and field investigation. J. Eng. Geol. 2021, 29, 1167–1177. [Google Scholar]
- Yuan, Y.; Jiang, X.; Liu, X. Predictive maintenance of shield tunnels. Tunn. Undergr. Space Technol. 2013, 38, 69–86. [Google Scholar] [CrossRef]
- Man, K.; Liu, R.; Liu, X.; Song, Z.; Liu, Z.; Cao, Z.; Wu, L. Water leakage and crack identification in tunnels based on transfer-learning and convolutional neural networks. Water 2022, 14, 1462. [Google Scholar] [CrossRef]
- Attard, L.; Debono, C.J.; Valentino, G.; Di Castro, M. Tunnel inspection using photogrammetric techniques and image processing: A re-view. ISPRS J. Photogramm. Remote Sens. 2018, 144, 180–188. [Google Scholar] [CrossRef]
- Huang, H.; Sun, Y.; Xue, Y.; Wang, F. Inspection equipment study for subway tunnel defects by grey-scale image processing. Adv. Eng. Inform. 2017, 32, 188–201. [Google Scholar] [CrossRef]
- Ai, Q.; Yuan, Y.; Bi, X. Acquiring sectional profile of metro tunnels using charge-coupled device cameras. Struct. Infrastruct. Eng. 2016, 12, 1065–1075. [Google Scholar] [CrossRef]
- Zhang, W.; Zhang, Z.; Qi, D.; Liu, Y. Automatic crack detection and classification method for subway tunnel safety monitoring. Sensors 2014, 14, 19307–19328. [Google Scholar] [CrossRef] [PubMed]
- Kashani, A.G.; Olsen, M.J.; Parrish, C.E.; Wilson, N. A review of LiDAR radiometric processing: From ad hoc intensity correction to rigorous radiometric calibration. Sensors 2015, 15, 28099–28128. [Google Scholar] [CrossRef] [PubMed]
- Yue, Z.; Sun, H.; Zhong, R.; Du, L. Method for Tunnel Displacements Calculation Based on Mobile Tunnel Monitoring System. Sensors 2021, 21, 4407. [Google Scholar] [CrossRef]
- He, G.Z.; Yang, J. Deformation monitoring for subway tunnels based on TLS. Adv. Mater. Res. 2014, 864, 2744–2749. [Google Scholar] [CrossRef]
- Cui, H.; Ren, X.; Mao, Q.; Hu, Q.; Wang, W. Shield subway tunnel deformation detection based on mobile laser scanning. Autom. Constr. 2019, 106, 102889. [Google Scholar] [CrossRef]
- Cao, X.G.; Yang, J.L.; Meng, X.L.; Zhang, W.C. Subway tunnel cross-section surveying based on ground 3D laser scanning data. Adv. Mater. Res. 2015, 1079, 296–299. [Google Scholar] [CrossRef]
- Zhao, S.; Zhang, D.M.; Huang, H.W. Deep learning–based image instance segmentation for moisture marks of shield tunnel lining. Tunn. Undergr. Space Technol. 2020, 95, 103156. [Google Scholar] [CrossRef]
- Huang, H.; Cheng, W.; Zhou, M.; Chen, J.; Zhao, S. Towards automated 3D inspection of water leakages in shield tunnel linings using mobile laser scanning data. Sensors 2020, 20, 6669. [Google Scholar] [CrossRef]
- Yi, C.; Lu, D.; Xie, Q.; Liu, S.; Li, H.; Wei, M.; Wang, J. Hierarchical tunnel modeling from 3D raw LiDAR point cloud. Comput. Des. 2019, 114, 143–154. [Google Scholar] [CrossRef]
- Duan, D.Y.; Qiu, W.G.; Cheng, Y.J.; Zheng, Y.C.; Lu, F. Reconstruction of shield tunnel lining using point cloud. Autom. Constr. 2021, 130, 103860. [Google Scholar] [CrossRef]
- Tan, K.; Cheng, X.; Ju, Q.; Wu, S. Correction of mobile TLS intensity data for water leakage spots detection in metro tunnels. IEEE Geosci. Remote. Sens. Lett. 2016, 13, 1711–1715. [Google Scholar] [CrossRef]
- Feng, Q.; Wang, G.; Röshoff, K. Detection of water leakage using laser images from 3D laser scanning data. In Proceedings of the 10th IAEG Congress, Nottingham, UK, 6–10 September 2006; Volume 87. [Google Scholar]
- Gonçalves, J.A.; Mendes, R.; Araújo, E.; Oliveira, A.; Boavida, J. Planar projection of mobile laser scanning data in tunnels. Int. Arch. Photogramm. Remote Sens. Spat. Inf. Sci. 2012, 39, 109–113. [Google Scholar] [CrossRef]
- Höfle, B.; Pfeifer, N. Correction of laser scanning intensity data: Data and model-driven approaches. ISPRS J. Photogramm. Remote. Sens. 2007, 62, 415–433. [Google Scholar] [CrossRef]
- Wu, C.; Huang, H. Laser scanning detection method and application of water leakage in subway tunnels. J. Nat. Hazards 2018, 27, 59–66. [Google Scholar] [CrossRef]
- Zhu, L.; Huang, S.; Zhang, S.; Li, G.; Wang, X. A point cloud based leakage detection method for tunnels. Surv. Mapp. Bull. 2021, S2, 140–144. [Google Scholar] [CrossRef]
- LeCun, Y.; Bengio, Y.; Hinton, G. Deep learning. Nature 2015, 521, 436–444. [Google Scholar] [CrossRef]
- Litjens, G.; Kooi, T.; Bejnordi, B.E.; Setio, A.A.A.; Ciompi, F.; Ghafoorian, M.; van der Laak, J.A.W.M.; van Ginneken, B.; Sánchez, C.I. A survey on deep learning in medical image analysis. Med. Image Anal. 2017, 42, 60–88. [Google Scholar] [CrossRef]
- Protopapadakis, E.; Doulamis, N. Image based approaches for tunnels’ defects recognition via robotic inspectors. In Proceedings of the Advances in Visual Computing: 11th International Symposium, ISVC 2015, Las Vegas, NV, USA, 14–16 December 2015; Proceedings, Part I 11. Springer International Publishing: Cham, Switzerland, 2015; pp. 706–716. [Google Scholar]
- Huang, H.-W.; Li, Q.-T.; Zhang, D.-M. Deep learning based image recognition for crack and leakage defects of metro shield tunnel. Tunn. Undergr. Space Technol. 2018, 77, 166–176. [Google Scholar] [CrossRef]
- Xiong, L.; Zhang, D.; Zhang, Y. Water leakage image recognition of shield tunnel via learning deep feature representation. J. Vis. Commun. Image Represent. 2020, 71, 102708. [Google Scholar] [CrossRef]
- Cheng, X.; Hu, X.; Tan, K.; Wang, L.; Yang, L. Automatic detection of shield tunnel leakages based on terrestrial mobile LiDAR intensity imag-es using deep learning. IEEE Acces 2021, 9, 55300–55310. [Google Scholar] [CrossRef]
- He, K.; Gkioxari, G.; Dollár, P.; Girshick, R. Mask r-cnn. In Proceedings of the IEEE International Conference on Computer Vision, Venice, Italy, 22–29 October 2017; pp. 2961–2969. [Google Scholar]
- Xue, Y.; Jia, F.; Cai, X.; Shadabfar, M.; Huang, H. An optimization strategy to improve the deep learning-based recognition model of leakage in shield tunnels. Comput. Civ. Infrastruct. Eng. 2022, 37, 386–402. [Google Scholar] [CrossRef]
- Liu, S.; Sun, H.; Zhang, Z.; Li, Y.; Zhong, R.; Li, J.; Chen, S. A multiscale deep feature for the instance segmentation of water leakages in tunnel using MLS point cloud intensity images. IEEE Trans. Geosci. Remote. Sens. 2022, 60, 1–16. [Google Scholar] [CrossRef]
- Qiu, W.; Cheng, Y.J. High-resolution DEM generation of railway tunnel surface using terrestrial laser scanning data for clear-ance inspection. J. Comput. Civ. Eng. 2017, 31, 04016045. [Google Scholar] [CrossRef]
- Sun, H.; Xu, Z.; Yao, L.; Zhong, R.; Du, L.; Wu, H. Tunnel monitoring and measuring system using mobile laser scanning: Design and deployment. Remote Sens. 2020, 12, 730. [Google Scholar] [CrossRef]
- Lin, T.Y.; Maire, M.; Belongie, S.; Hays, J.; Perona, P.; Ramanan, D.; Dollár, P.; Zitnick, C.L. Microsoft coco: Common objects in context. In Proceedings of the Computer Vision–ECCV 2014: 13th Euro-pean Conference, Zurich, Switzerland, 6–12 September 2014; Proceedings, Part V 13. Springer International Publishing: Cham, Switzerland, 2014; pp. 740–755. [Google Scholar]
- Cao, Z.; Chen, D.; Shi, Y.; Zhang, Z.; Jin, F.; Yun, T.; Xu, S.; Kang, Z.; Zhang, L. A flexible architecture for extracting metro tunnel cross sections from terrestrial laser scanning point clouds. Remote. Sens. 2019, 11, 297. [Google Scholar] [CrossRef]
- Kang, Z.; Zhang, L.; Tuo, L.; Wang, B.; Chen, J. Continuous extraction of subway tunnel cross sections based on terrestrial point clouds. Remote. Sens. 2014, 6, 857–879. [Google Scholar] [CrossRef]
- Hafiz, A.M.; Bhat, G.M. A survey on instance segmentation: State of the art. Int. J. Multimed. Inf. Retr. 2020, 9, 171–189. [Google Scholar] [CrossRef]
- Huang, Z.; Huang, L.; Gong, Y.; Huang, C.; Wang, X. Mask scoring r-cnn. In Proceedings of the IEEE/CVF Conference on Computer Vision and Pattern Recognition, Long Beach, CA, USA, 15–20 June 2019; pp. 6409–6418. [Google Scholar]
- Wu, Y.; Hu, M.; Xu, G.; Zhou, X.; Li, Z. Detecting leakage water of shield tunnel segments based on mask R-CNN. In Proceedings of the 2019 IEEE International Conference on Architecture, Construction, Environment and Hydraulics (ICACEH), Xiamen, China, 20–22 December 2019; pp. 25–28. [Google Scholar]
- Xue, Y.; Cai, X.; Shadabfar, M.; Shao, H.; Zhang, S. Deep learning-based automatic recognition of water leakage area in shield tunnel lining. Tunn. Undergr. Space Technol. 2020, 104, 103524. [Google Scholar] [CrossRef]
- He, K.; Zhang, X.; Ren, S.; Sun, J. Deep residual learning for image recognition. In Proceedings of the IEEE Conference on Comput-er Vision and Pattern Recognition, Las Vegas, NV, USA, 26 June–1 July 2016; pp. 770–778. [Google Scholar]
- Ren, S.; He, K.; Girshick, R.; Sun, J. Faster R-CNN: Towards real-time object detection with region proposal networks. In Proceedings of the Advances in Neural Information Processing Systems 28 (NIPS 2015), Montreal, QC, Canada, 7–12 December 2015; Volume 28, pp. 91–99. [Google Scholar]
- Puente, I.; Akinci, B.; González-Jorge, H.; Díaz-Vilariño, L.; Arias, P. A semi-automated method for extracting vertical clearance and cross sections in tunnels using mobile LiDAR data. Tunn. Undergr. Space Technol. 2016, 59, 48–54. [Google Scholar] [CrossRef]
- Liu, Y.; Zhong, R.; Chen, W.; Sun, H.; Ren, Y.; Lei, N. Study of Tunnel Surface Parameterization of 3-D Laser Point Cloud Based on Harmonic Map. IEEE Geosci. Remote. Sens. Lett. 2019, 17, 1623–1627. [Google Scholar] [CrossRef]
- Everingham, M.; Van Gool, L.; Williams, C.K.; Winn, J.; Zisserman, A. The pascal visual object classes (voc) challenge. Int. J. Comput. Vis. 2010, 88, 303–338. [Google Scholar] [CrossRef]
Disclaimer/Publisher’s Note: The statements, opinions and data contained in all publications are solely those of the individual author(s) and contributor(s) and not of MDPI and/or the editor(s). MDPI and/or the editor(s) disclaim responsibility for any injury to people or property resulting from any ideas, methods, instructions or products referred to in the content. |
© 2024 by the authors. Licensee MDPI, Basel, Switzerland. This article is an open access article distributed under the terms and conditions of the Creative Commons Attribution (CC BY) license (https://creativecommons.org/licenses/by/4.0/).