Abstract
Building Information Modeling (BIM) has recently been widely applied in the Architecture, Engineering, and Construction Industry (AEC). BIM graphical information can provide a more intuitive display of the building and its contents. However, during the Operation and Maintenance (O&M) stage of the building lifecycle, changes may occur in the building’s contents and cause inaccuracies in the BIM model, which could lead to inappropriate decisions. This study aims to address this issue by proposing a novel approach to creating 3D point clouds for updating as-built BIM models. The proposed approach is based on Pedestrian Dead Reckoning (PDR) for an Inertial Measurement Unit (IMU) integrated with a Mobile Laser Scanner (MLS) to create room-based 3D point clouds. Unlike conventional methods previously undertaken where a Terrestrial Laser Scanner (TLS) is used, the proposed approach utilizes low-cost MLS in combination with IMU to replace the TLS for indoor scanning. The approach eliminates the process of selecting scanning points and leveling of the TLS, enabling a more efficient and cost-effective creation of the point clouds. Scanning of three buildings with varying sizes and shapes was conducted. The results indicated that the proposed approach created room-based 3D point clouds with centimeter-level accuracy; it also proved to be more efficient than the TLS in updating the BIM models.
1. Introduction
BIM has proved its efficiency and effectiveness in a building’s lifecycle, particularly in the O&M phase [1,2]. However, during the operation stage of a building, changes may occur in the building’s contents and cause inaccuracies in the BIM model. Regular updates of the BIM models could provide up-to-date information and support the O&M of the building. To this end, several data acquisition technologies, such as photogrammetry, Simultaneous Localization and Mapping (SLAM), and Laser Scanning (LS), can be used to create and update the BIM models [3,4,5,6,7,8].
Photogrammetry uses cameras to take photographs of a complete object, followed by measuring the object from the photographs [9]. In the literature, photogrammetry has been used to create building point clouds. For example, Koch et al. [10] used photogrammetry to create the three-dimensional (3D) point cloud of a building and performed 3D line segmentation; however, the cloud was noisy and contained empty parts. Tsai et al. [11] used a depth map and Bayesian filter to create an indoor point cloud of a building with approximately 92% accuracy; however, it was reported in this study that poor lighting influenced the cloud creation. Li et al. [12] used Red Green Blue-Depth (RGB-D) cameras to create the point cloud of a room and proposed an algorithm to create a 3D model from the point cloud data automatically; however, outlier noises and distortions were found in the resulting model. Hence, it may be concluded that while photogrammetry can create indoor 3D point clouds, errors in the point clouds could provide incorrect information and, therefore, influence the accuracy of the BIM model.
SLAM can be categorized into visual- or LiDAR-based methods to create point clouds, in which LiDAR-based SLAM generally provides higher accuracy [13]. Visual-based SLAM uses inexpensive visual sensors to collect data on the areas of interest first, followed by applying feature or image tracking algorithms to estimate pixel or image movement and create the map. This method has been applied in indoor point cloud creation; e.g., Chen et al. [14] created indoor point clouds using a visual-based SLAM system. In his approach, a camera was placed on top of a tripod, and photos were taken by the camera at different locations in the indoor area to create the clouds. Although indoor clouds can be created, manual filtering out of the mismatching points between images is required. Zhang and Ye [15] proposed a visual-based SLAM system, in which 3D cameras were used to create indoor maps for navigation for the blind. They generated the point cloud at the ground level of a corridor, implying no shadowing effects exist in the study site. Graven et al. [16] proposed an approach using an automatic robot for visual-based SLAM. Despite the approach being deemed economic and efficient, the resulting cloud exhibited distortion. Debunne and Vivet [17] reviewed the visual-based SLAM technique, and concluded that visual-based SLAM was prone to error because of its sensitivity to lighting conditions and texture differences.
LiDAR-based SLAM normally uses LiDAR to collect data first, and applies a scan-matching process to create 3D maps or point clouds of the area of interest [17,18]. LiDAR-based SLAM has been widely used to create 3D models of indoor areas. For example, Chen et al. [14] generated 3D point clouds of three indoor sites using a LiDAR-based SLAM and tested the performance of the system. While the accuracy of the resulting clouds was high (centimeter-level), the cost associated with the two 3D scanners was significant. Karam et al. [19] designed a LiDAR-based SLAM with three LiDAR sensors. They tested the system in an office building, and the resulting cloud was in centimeter-level accuracy. However, shadowing effects were not considered because the building was nearly empty. In the literature focusing on LiDAR-based SLAM, problems associated with insufficient features, which may lead to misalignment between points, thus reducing the overall point cloud accuracy, have also been reported [20]. In summary, using either visual- or LiDAR-based SLAM to create indoor point clouds has respective limitations.
LS can be categorized into Airborne Laser Scanning (ALS), Terrestrial Laser Scanning (TLS), and Mobile Laser Scanning (MLS); these techniques have been applied in various domains, including surveying, quality control, geospatial engineering, and heritage reconstruction [21]. ALS uses airplanes or unmanned aerial vehicles to carry scanners, and the scanners capture point cloud data along their flight paths. However, when using drones in indoor environments, many practical and technical challenges do exist, which limits the use of the technique [22,23,24]. TLS involves stationing a laser scanner at a fixed position and scanning its surrounding environment in 3D space; it has been used to create indoor 3D point clouds/models [3,25,26,27,28,29,30]. However, certain limitations were identified in the literature. For instance, Lehtola et al. [31] highlighted the need for careful planning in TLS data collection in indoor environments because the presence of walls and objects can induce shadowing effects and thus increase the number of scan points. Cui et al. [32] mentioned that registration procedures of TLS clouds reduced the mapping efficiency. Another limitation lies in the cost [33,34], as TLS is generally expensive. MLS can be mounted on LiDAR/2D scanners carried by a vehicle or person and generates point clouds along the carrier’s moving trajectory. Because MLS is unable to self-navigate, additional positioning systems should be used together with MLS. In applying MLS to indoor point cloud creation, Lau et al. [35] investigated the application of the Ultra-Wideband (UWB) system for MLS indoor positioning, with a focus on the positioning of MLS. Chao et al. [36] developed an integrated system that combined UWB and Inertial Measurement Unit (IMU) for MLS navigation in an indoor environment. They reported that the system was low-cost when compared to TLS, and sub-decimeter level accuracy was achieved in their 3D point cloud. Nevertheless, their study site was an atrium, which limited the error sources of the UWB system and made the site an ideal one for creating point clouds. In addition, a UWB system requires pre-installation, which may incur additional costs.
Even though MLS is not as accurate as compared to TLS, MLS has distinct advantages due to its cost-effective and efficient attributes and exhibits great potential for indoor 3D point cloud generation. Given the importance of regularly updating BIM models and the widespread use of 3D point clouds for this purpose, this research proposes a novel low-cost approach of using IMU and MLS to generate room-based 3D point clouds to regularly update as-built BIM models. IMU is a widely used positioning technique; it is capable of self-navigating and is infrastructure-free. By combining the IMU trajectory data and MLS 2D coordinates simultaneously, indoor 3D point clouds can be created. As compared with the TLS approach that is conventionally used, the proposed approach can create 3D point clouds in a faster and cost-effective way. In addition, the number of features and the lighting conditions in the scanning area will not influence the completeness and accuracy of the point clouds created by the proposed approach, making it competitive as compared to the photogrammetry and SLAM.
To improve the accuracy of MLS clouds, the proposed approach involves scanning the room in multiple straight lines. By using this scanning sequence, the IMU-accumulated error would be reduced, and therefore the accuracy of each scanned cloud can be increased as compared to scanning the area continuously. Because many clouds may be scanned in the area of interest, this study also introduces a novel approach that uses as-built BIM models as references to register multiple point clouds. This method achieves higher accuracy in merging 3D point clouds as compared to conventional methods that rely on common points among the clouds. The accuracy and effectiveness of the approaches are tested by comparing the data from two distinct sites with those from TLS, particularly the assets in the rooms. Time duration analysis of both the proposed approach and TLS is also conducted. Compared with TLS, the approach is shown to create room-based 3D point clouds more efficiently, and the accuracy can be up to the centimeter-level. The proposed approach can be used to regularly update BIM models, especially for the contents inside the building.
2. Materials and Methods
2.1. Proposed System
The proposed system consists of an MLS, an IMU, a trolley, a laptop, and a battery, and is shown in Figure 1a. The principle behind the proposed approach is that, by moving a trolley inside a room, 2D coordinates of the interior area can be collected by MLS, and the movement trajectory of the MLS be estimated by the IMU. By merging the 2D coordinates from the MLS and the movement trajectory provided by the IMU simultaneously, indoor 3D point clouds can be created. Figure 1b shows the actual setup of the system.
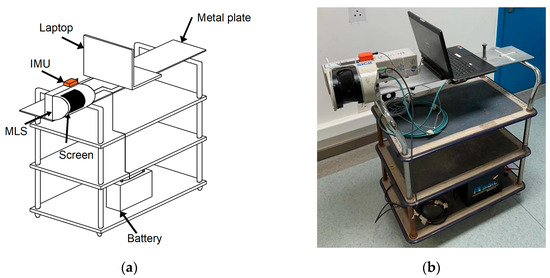
Figure 1.
The proposed system: (a) test setup; (b) a photo of the actual setup.
The MLS used in the system is a SICK LMS 5XX LiDAR sensor [37], which uses a 905 nm light source to collect 2D coordinates of the scanned area. The scanner has an 80 m operation range with a −5 to 185 degree (190 degrees in total) operation angle. Figure 2a shows a schematic drawing of the axes of the MLS and IMU, while Figure 2b shows the SICK MLS with an attached IMU (the orange box). The shaded area shown in Figure 1a is the screen of the MLS; it emits laser light during the scanning process and collects 2D coordinate information of multiple strips of points along the movement of the MLS. To support the MLS, a metal plate placed on the handles of the trolley is used, as shown in Figure 1b. The MLS is placed horizontally near the edge of the metal plate, with the center of the screen facing the wall to ensure coverage of one single scan.
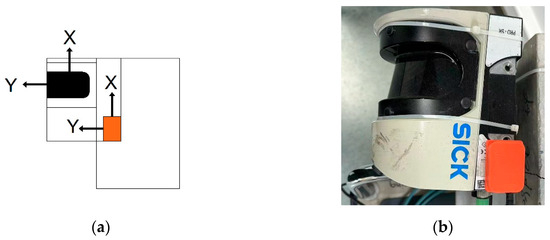
Figure 2.
(a) Drawing of the axes of the MLS and IMU; (b) a photo of the system.
The IMU used in the system is Xsens MTi-100 [38]; it has a tri-axial accelerometer and a tri-axial gyroscope that collects acceleration and angular rate, respectively. It should be noted that the z-axis of the IMU is set perpendicular to the ground, and the x-axis of the IMU is the same as the direction of movement of the trolley and normal to the scanning surface of the MLS. The controlling unit of the system is a Dell Latitude laptop with an i5-3320 CPU and 8 GB memory; it synchronizes time for the MLS and IMU and records the data from both devices. A 12 V battery is provided to supply power for the MLS.
2.2. Experimental Sites and Data Collection
2.2.1. Study Area
In this study, experiment served as a primary approach to assess the effectiveness of the proposed system. Since in real-world environments, rooms varied in size and shape, the proposed system was applied in two sites, including a classroom within a teaching building and five rooms in a small office building.
A rectangular classroom with dimensions 17.5 × 13.5 × 3.5 m in length, width, and height, respectively, and a total area of 236.25 m2, is first used as the test site. Multiple chairs, desks, and monitors are placed neatly in the room, making the room an ideal place for the experiment. Moreover, the room is one of the largest inside the building, presenting a challenging test for the proposed system as IMU errors accumulate with increasing data collection time. Figure 3a,b show the sketching and a photo of the classroom, respectively.
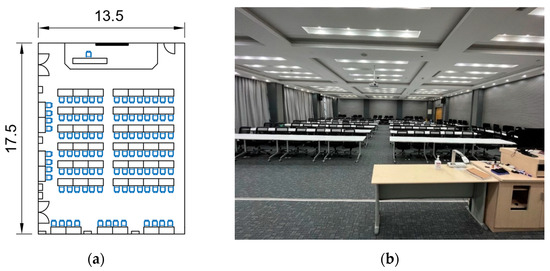
Figure 3.
(a) Sketch (b) photo of the classroom (unit: meter).
The building to be tested is the Centre of Sustainable Energy Technologies (CSET) on the University of Nottingham Ningbo China (UNNC) campus.
Table 1 shows the function and size of each story of the building, while photos of each story of the building are shown in Figure 4. It can be seen from Figure 4 that, each story of the building can be considered a room with polygon-shaped floors, and some walls are not perpendicular to the floor. The irregular shape of the building provides a unique opportunity to test the proposed system in rooms that are not rectangular.

Table 1.
Size and function of each story in the CSET building.
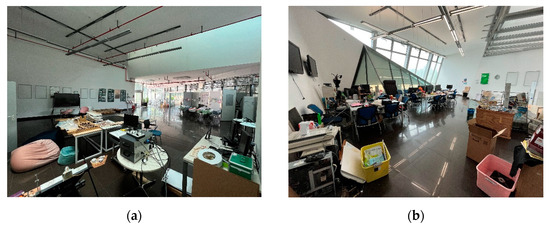
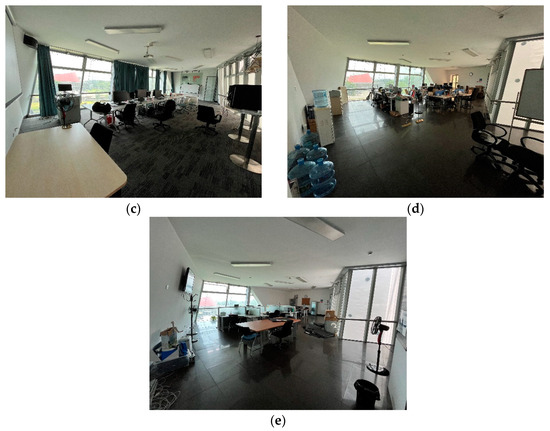
Figure 4.
Photos of each story in the CSET building: (a) ground story; (b) first story; (c) second story; (d) third story; (e) fourth story.
2.2.2. Data Collection
In this study, the frequency of data collection of the IMU and MLS was 100 and 600 Hz, respectively; this ensures sufficient data can be collected. While IMU can record acceleration and angular rate, intrinsic errors may grow exponentially with time. Thus, to reduce the time-accumulated error of IMU, the trolley was moved along near-straight line routes. Figure 5 shows the movement of the trolley in the classroom. In Figure 5, each green line with two arrows at the ends represents one single movement trajectory. Because the center of the screen of the MLS is facing the wall, the trolley moves back and forth to collect data along its path. The whole 3D point cloud of the room can be acquired after scanning along all paths. For the office building (CSET), although a regular movement trajectory is not feasible, moving the trolley along the perimeter of the room is needed; additional trajectories could be added to increase the amount of data in the 3D point cloud.
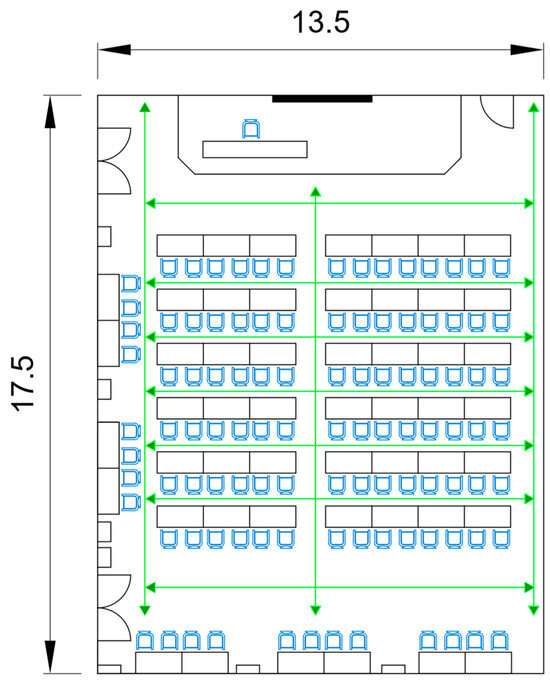
Figure 5.
Movement trajectory of the MLS (unit: meter; arrows: movement direction).
2.3. Data Processing
Raw datasets from IMU and MLS can be collected during the movement of the trolley. IMU raw data contain time, acceleration, and angular rate in each timestamp, and the X and Y coordinates of the IMU as shown in Figure 2a during movement can be estimated using these parameters. MLS raw data include time and x and z coordinates of scanned points, also shown in Figure 2a. For each trajectory, an individual 3D point cloud can be created by merging and processing the datasets from the MLS and the IMU. After combining all point clouds from each route, the complete 3D point cloud of the room can be created. The following four steps are the procedures to create point clouds for rooms: (i) IMU position estimation, (ii) IMU and MLS time synchronization, (iii) IMU and MLS data integration, and (iv) merging (multiple) individual clouds.
2.3.1. IMU Position Estimation
In this study, a Pedestrian Dead Reckoning (PDR) algorithm was used to estimate the motion of the IMU. This algorithm has shown its high positioning accuracy [39], and is commonly used to navigate indoor pedestrians [40]. When pedestrians are walking, one acceleration, two static, and one deceleration phase can be detected by this algorithm, and these phases form gait cycles. Similar to pedestrians, this algorithm can detect the cycle movement of the wheels when trolleys are moving. To estimate the positions of the IMU, the PDR algorithm proceeds in the following four steps: step detection, step length estimation, heading estimation, and position estimation. Details of the PDR algorithm used in this study can be found in the literature [39,41,42].
2.3.2. IMU and MLS Time Synchronization
Since the sampling rates, as well as the type of data collected from both IMU and MLS, are different, a time synchronization for the datasets needs to be conducted. The IMU collects 100 sets of data (acceleration and angular rate) per second, while the MLS collects 3810 sets of data (2D coordinates) per second. To ensure each MLS data can be integrated with an IMU position collected at the same time, the IMU raw data were first converted from acceleration and angular rate to coordinates data (positions), followed by linear interpolation of the coordinates data to match the data from the MLS.
In this study, the relatively small size of the wheels allowed for the estimation of hundreds of steps and their positions, resulting in a short distance between each position. Based on this, linear interpolation was performed to estimate the positions between two consecutive IMU points, with the number of inserted points determined by the number of estimated IMU positions. In addition, the rotation matrix of each point needed to be estimated for integrating both datasets. For each interpolated point in two consecutive IMU estimated points, the rotation matrix was assumed to be the same as that of the earlier IMU point. This assumption was because of the small distance between IMU points and the trolley moves at a relatively low speed. The timestamp for each interpolated point was also estimated using linear interpolation of the times between the two IMU estimated points.
2.3.3. Data Integration between IMU and MLS Data
The basic principle of integrating IMU and MLS data is to combine the coordinates collected by IMU and MLS simultaneously. As described above, both datasets were synchronized and had the same timestamp. To create the point cloud along the scanning trajectory, both datasets should be in the same coordinate system. However, the MLS was in the local coordinate system that contained 2D coordinates, while the IMU raw data were in its body frame with 3D coordinates and had directional information in each timestamp. Hence, the MLS coordinates were converted to the IMU local frame using coordinate transformation.
To convert the MLS coordinates from MLS body frame to IMU local frame, the rotation matrix between the two systems is needed. Because the initial axes of the two equipment were defined, the transformation matrix from the MLS body frame to the IMU local frame is the same as the matrix of that from the IMU body frame to its local frame. To collect the transformation matrix, the raw angular velocity data of the IMU, namely and , should be used. The change in the attitude in the IMU body frame, , can be expressed by Equations (1) and (2):
In Equation (1), is the time step between two adjacent datasets, and in Equation (2) is a 3 × 3 angular velocity matrix. Because both the angular rate and time gap are small for each timestamp, the exponential map is used to represent the change in the attitude. To transform the coordinates between two frames, an initial attitude of the IMU is required, and is shown in Equations (3)–(6):
where
In Equation (3), , , are the initial rotation matrices of roll , pitch and yaw ) axes in the body frame. The pitch and roll can be determined by averaging the values from the initial state in the same direction. The initial yaw value is determined to be zero because it is the facing of the movement direction. is the overall rotation matrix. The updated rotation matrix from the previous stage to the next step is shown in Equation (7):
The in Equation (7) is the rotation matrix between two timestamps, and this value for the initial state is . As mentioned above, the rotation of the MLS axes is the same as the rotation of the IMU in each axis; hence, the MLS coordinates of each point in each timestamp in the local frame can be described by Equation (8):
In Equation (8), are the MLS coordinates in the local coordinate system, and superscript represents the local frame and indicates the nth point in the datasets. are the collected coordinates from the MLS, and superscript represents the coordinates in the body frame. The 3D coordinates of the point in one timestamp can be expressed by Equation (9):
where are the estimated coordinates from the collected data (angular velocity and acceleration) from the IMU in the local coordinate system.
2.3.4. Point Clouds Registration
Since MLS individual clouds are in their own coordinate systems, they need to be merged into one coordinate system to create the 3D point cloud of the room. In practice, common points are used to merge TLS clouds scanned from different locations. This is because the distance between each point in the TLS cloud and its corresponding position in the ground truth, herein defined as “error”, is small (normally milli-meter level). Merging TLS clouds with common points in the clouds can create a cloud with very good accuracy. However, the coordinates of the points in each individual MLS cloud may differ more from the ground truth than the TLS cloud. Using common points from two MLS clouds to merge the two clouds may therefore accumulate errors in the merged clouds.
To reduce potential errors from the merging process, a new approach was developed. Instead of merging MLS clouds using common points as conventionally performed to create the 3D point cloud of the room, this study proposed an alternative approach of registering individual MLS clouds with the BIM model of the building. This is because the main aim of this study is to update as-built BIM models in the O&M phase. In this phase, the shape, size, and positions of structural elements in the area would remain the same unless the indoor area is renovated or reconstructed; therefore, the previous BIM model can provide accurate structural geometric information. Since the BIM model may be regarded as a “close-to-truth” reference, the errors from merging MLS clouds could be minimized. The proposed procedure can be performed first by picking the ‘feature points’ from the MLS individual cloud and the BIM model, followed by aligning each MLS cloud to its corresponding position in the BIM model using these feature points. These feature points could be corners of unmovable items in the room, such as windows, doors, columns, etc. In practice, these points need to be manually selected from the model and the cloud software, such as CloudCompare v2.13 [43] or Meshlab 2023.12 [44]. In this study, the cloud registration was to transform all the points in each MLS cloud from their local coordinate frame to the BIM frame. The details of this transformation can be found in the literature [45]. Because the selected feature points were used to compute the transformation matrix, more points could achieve a more accurate and robust estimation of the matrix.
Figure 6 shows the selected feature points used to register individual clouds to the BIM-based frame, in which Figure 6a shows the reference BIM model, and the MLS cloud is shown in Figure 6b. In Figure 6, the feature points are highlighted in red; these points are the selected identifiable corners of columns in the room. By using this approach to transform all the scanned point clouds, the complete room point clouds were created. Figure 7 shows a flowchart of using the proposed approach to create indoor 3D point clouds and update BIM models.
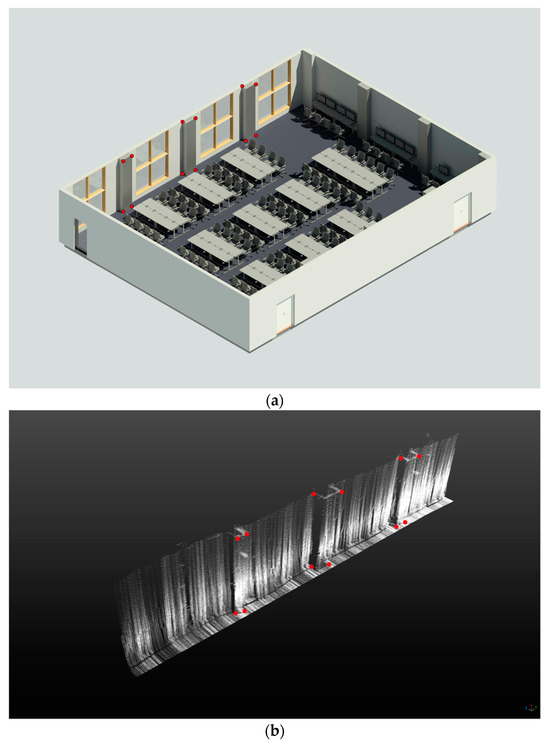
Figure 6.
A sketch of the proposed alignment method: (a) reference BIM model; (b) scanned MLS cloud; red dots: feature points used for registration.
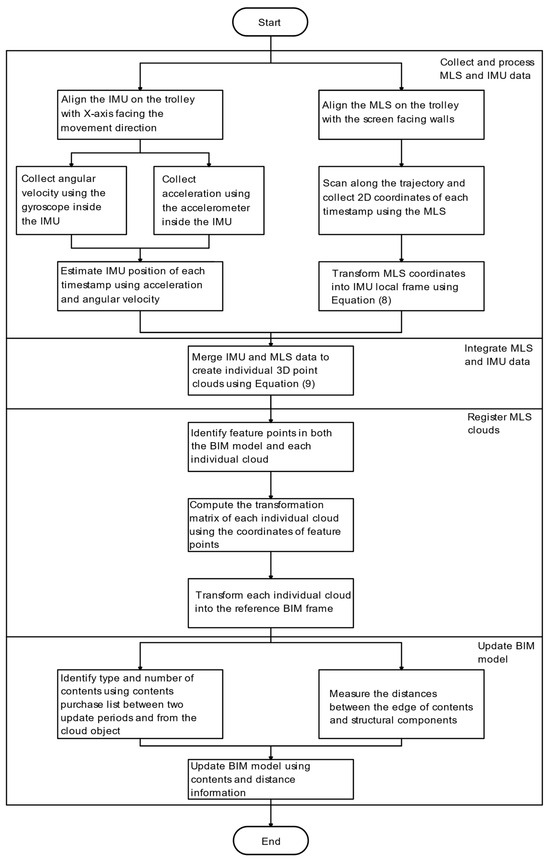
Figure 7.
Flowchart of the proposed approach.
2.4. Updating the BIM Model
Several studies in the literature have investigated using point clouds to create BIM models automatically [46,47], or to detect changes between point clouds and BIMs [48,49]; however, these approaches are not applied in practice [50]. While some studies used point clouds to create BIM models for buildings, they primarily focused on identifying structural or architectural components such as walls, columns, windows, and doors. These components typically remain unchanged unless the building undergoes renovation, reconstruction, or is damaged [51]. However, the contents inside the building may change with time and may require an update for property management purposes. This study focuses on updating BIM models manually by identifying and measuring the objects within the point clouds. To achieve this, the type and number of assets should be manually identified, which is explained in detail in Section 2.5. Afterward, the horizontal distances between the properties and the walls can be measured. From this step, the locations of the assets can be identified, and the property placed in the corresponding locations in the BIM model.
2.5. Accuracy Assessment
Because using TLS to create point clouds is costly and time-consuming, this study proposed an efficient and cost-effective approach to create indoor point clouds that can be used to update BIM models. To evaluate the accuracy of the clouds created by the proposed approach, the clouds created by TLS were used as the reference clouds for the following reasons. First, as the proposed approach aims to replace TLS for indoor point cloud creation, it is essential to compare the outputs of both approaches. Second, TLS has a high level of scanning accuracy, and is used widely to create indoor 3D point clouds and evaluate the point clouds created by other methods. Third, since the BIM models might be outdated due to changes in the contents, a scan using the TLS to serve as the reference is deemed essential. To create reference clouds, a Leica HDS 7000 TLS (Figure 8) [52] was used to collect indoor 3D point clouds for all experiment sites at the same experiment conditions. It has a 180 m working range with a 360-degree rotation angle.
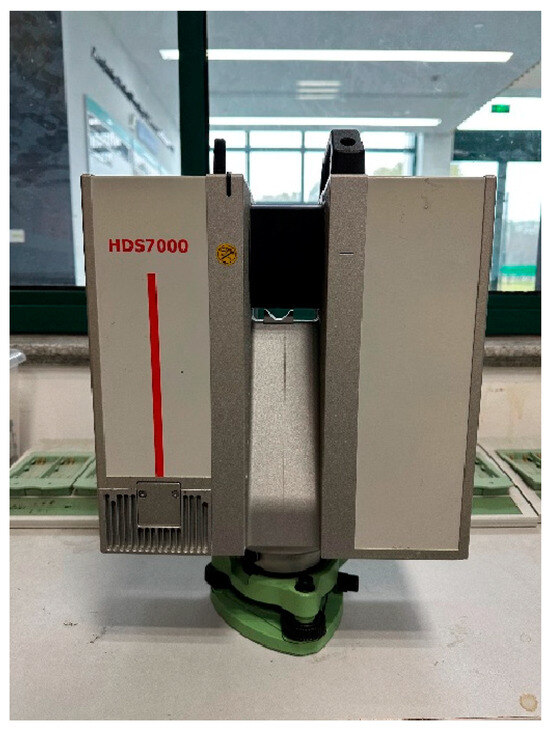
Figure 8.
A photo of Leica HDS7000 laser scanner.
To evaluate the accuracy and effectiveness of the proposed cloud creation and alignment approach, the MLS clouds merged using common points were compared with those created by the proposed approach using the TLS clouds as the reference. In particular, results were evaluated using four metrics, namely, (i) overall accuracy, (ii) specific points accuracy, (iii) contents comparison, and (iv) time duration and cost.
To compute the overall accuracy of the clouds, the Hausdorff distance algorithm is used to compute the distance between the closest points in the two point clouds and to compare the Could-to-Cloud (C2C) distance [53]. It evaluates the accuracy of the point clouds in terms of shape and size, and has been widely applied in many studies to assess the geometric accuracy, scaling error, and noise level of the point clouds [54,55,56,57].
The specific point accuracy, which can be called “Point-to-Point (P2P)” comparison, is performed by comparing the coordinates of selected points in the MLS with their reference coordinates; it has been proven to be effective in assessing the point cloud accuracy [58,59,60]. In this study, the selected points were the corner points of the selected objects (chairs, desks, etc.), which were distinct in the clouds. The comparison was made by first selecting the same n points in each point cloud; the distance between each pair of points is expressed in Equations (10)–(14):
where and represent the average coordinate difference between the selected points in the two clouds in the x, y, z, and 3D directions; denotes the distance between a pair of comparison points; is the value obtained from the reference model; and is the data obtained from the MLS model.
The contents comparison recognizes and compares the properties in the resulting clouds with the reference. In this study, a manual check was used to identify and count the properties in the MLS clouds merged using common points, the MLS clouds registered with the BIM models, and the reference TLS clouds. To support the identification, the content (item list) was acquired. In this step, all the clouds were visualized in the CloudCompare software. Generally, the properties can be categorized into three groups: (i) unique shape, (ii) objects with similar shapes (e.g., TV and monitor), and (iii) unidentifiable objects. Items such as chairs and tables fall into group (i) and can be easily identified and counted. For the properties in groups (ii) and (iii), the heights of these items could be measured. This height information can be compared with the before-updated BIM models and the item list to determine the type of the property. While this manual checking process can be subjective, this method is nonetheless used as a way to evaluate whether the overall accuracy of the clouds is comparable to the reference.
Time duration analysis compares the data collection time and cost of the proposed system with the TLS that is used conventionally. This analysis provides a means to evaluate the economic benefits and operational efficiency of the proposed MLS approach, which may be crucial for the practical application of the approach.
3. Results
3.1. Overall Accuracy of the Clouds
A cloud object created by merging multiple individual clouds can be compared to the reference TLS cloud object to assess its overall accuracy. Table 2 summarized the comparison of the cloud objects merged using common points and the proposed approach with their reference objects. The comparison includes mean C2C distance, standard deviation (STD), maximum distance between two clouds, and the percentage of the points with a C2C distance less than 0.1 m. The cloud objects were created for the experimental sites, namely, the classroom and the CSET building mentioned in Section 2.2.1. From Table 2, it can be seen that the cloud objects merged by the proposed approach obtained better accuracy than the cloud objects merged using common points in terms of mean and standard deviation of the cloud distance. The proposed approach also exhibited a smaller maximum C2C distance, and the percentages of points with errors less than 0.1 m were higher. It is worth noting that the proposed approach generally performed better in the CSET building than in the classroom.

Table 2.
C2C comparison of the cloud objects with the reference (unit: meter).
To better present the results, schematic drawings of the objects showing their C2C distance are provided in Figure 9, Figure 10 and Figure 11. These rooms are the classroom, the CSET 2F and 3F. It can also be seen from Figure 9a, Figure 10a and Figure 11a that for the cloud object merged using common points, the corner points of the room are prone to errors. Although not shown explicitly, the edge points of the objects inside the room are also prone to errors. For the cloud object using the proposed approach (Figure 9b, Figure 10b and Figure 11b), errors are concentrated on the corners of the rooms as well, but the errors are less than the cloud object merged using common points.
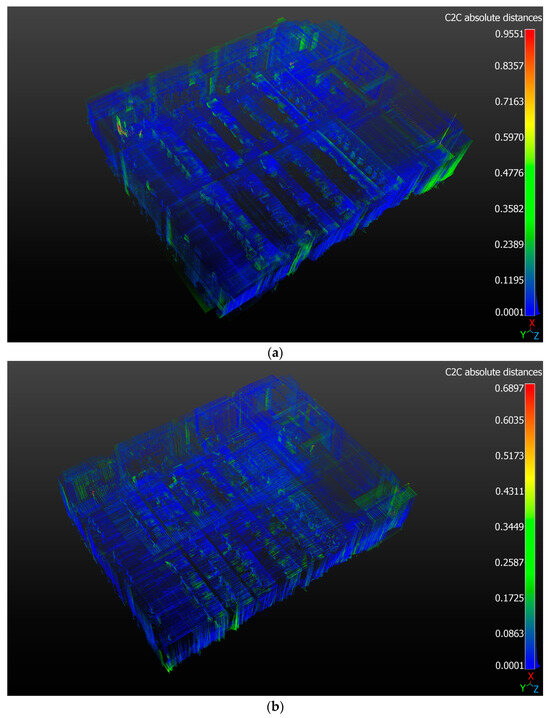
Figure 9.
Drawing of the objects of the classroom and their C2C distances: (a) object merged using common points; (b) object merged by the proposed approach.
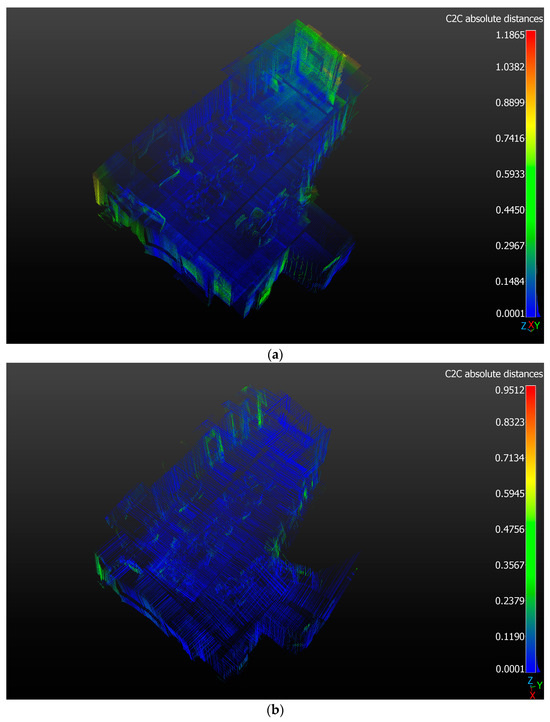
Figure 10.
Drawings of the objects of the CSET 2F and their C2C distances: (a) object merged using common points; (b) object merged by the proposed approach.
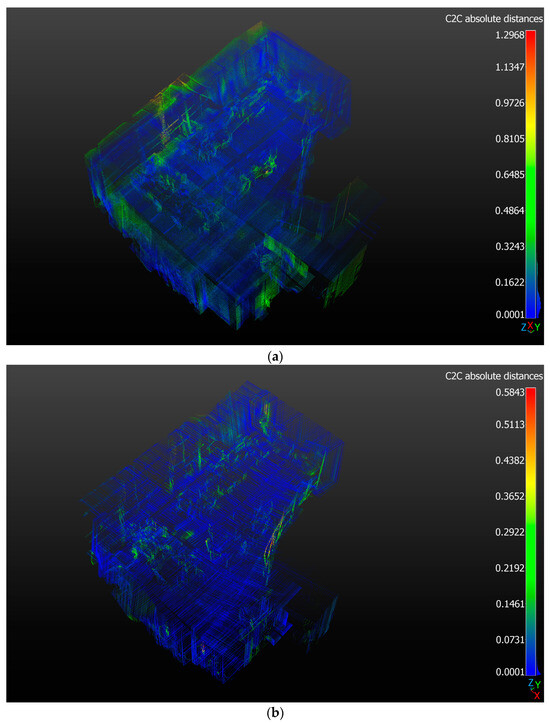
Figure 11.
Drawings of the objects of the CSET 3F and their C2C distances: (a) object merged using common points; (b) object merged by the proposed approach.
3.2. Point-to-Point Comparison
In addition to overall C2C comparison, P2P comparison can also be used to evaluate the accuracy of cloud objects. Because the shape, size, and properties are different in the sites in this study, the number of points chosen for P2P comparison in each room varied. Table 3 shows the number of points used for comparison in each cloud. Because the classroom has many desks, the edges of all desks were selected for comparison, leading to more selected points than in other rooms. Table 4 shows the P2P comparison of all the sites including mean and STD of the 3D distances, and the value of 95% Confidence Interval (CI) point.

Table 3.
The number of points selected for comparison in each cloud.

Table 4.
P2P comparison results (unit: meter).
It can be seen from Table 4 that for the cloud objects merged using common points, the mean 3D distances of the points are all over 0.2 m, in which three objects have a mean 3D distance larger than 0.3 m. Comparatively, the values are all less than 0.2 m in cloud objects merged using the proposed approach except the classroom and the CSET first floor. The STD and 95% CI point in the cloud objects are generally smaller. Therefore, it can be concluded that the proposed approach gives better cloud object accuracy than the common points approach.
Figure 12 shows the bar charts of P2P distances of all the sites. Each subfigure is further divided into the upper and lower panels; the upper panel shows the results from the proposed approach, while the lower panel displays the results from the common points. It can be seen in Figure 12 that the P2P distances of the points collected from the cloud objects merged by the proposed approach are generally lower than 0.2 m, whereas the points from the objects merged by common points give varied P2P values but, in most cases, larger than 0.2 m. This indicates that the proposed approach gives more accurate results than the common points approach.
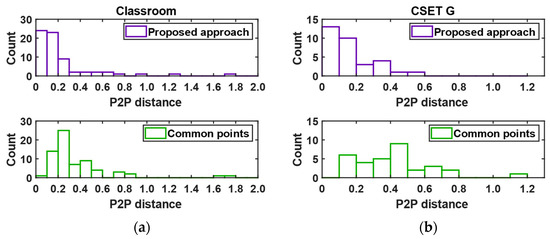
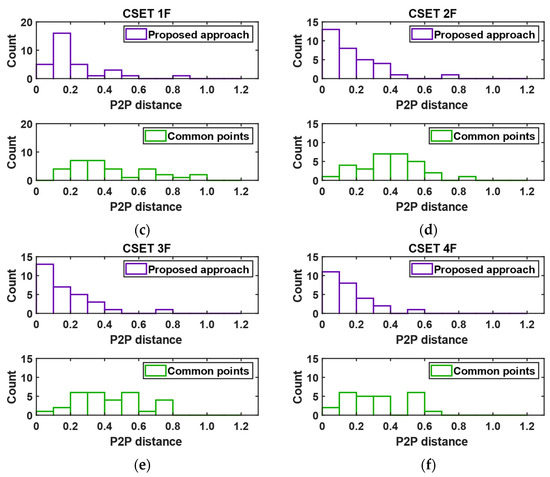
Figure 12.
P2P error distribution diagram in each site (Bar chart: number of points in each error range); (a) classroom, (b) CSET ground floor, (c) CSET first floor, (d) CSET second floor, (e) CSET third floor, (f) CSET fourth floor.
3.3. Contents Comparison
After applying the C2C and P2P comparison to the cloud objects, a content comparison was subsequently conducted. In this comparison, the numbers of each type of property identified in the objects merged by both approaches were compared with those from the references (TLS).
Figure 13 shows the number of assets that can be identified manually in each room. It can be seen from Figure 13 that the number of most properties extracted from the three cloud objects is the same for all rooms. The proposed approach generally gives better (the number of properties is closer to the reference) results as compared to the common points approach. For example, for the chairs on the CSET ground floor (Figure 13b) and the monitors on the CSET second floor (Figure 13d), the proposed approach gives more accurate numbers. This could be due to the items placed close to each other overlapped when using common points to merge individual clouds. It should be noted that some properties were not identified correctly by the proposed approach (e.g., shelf in Figure 13b), which could be attributed to the shadowing effects.
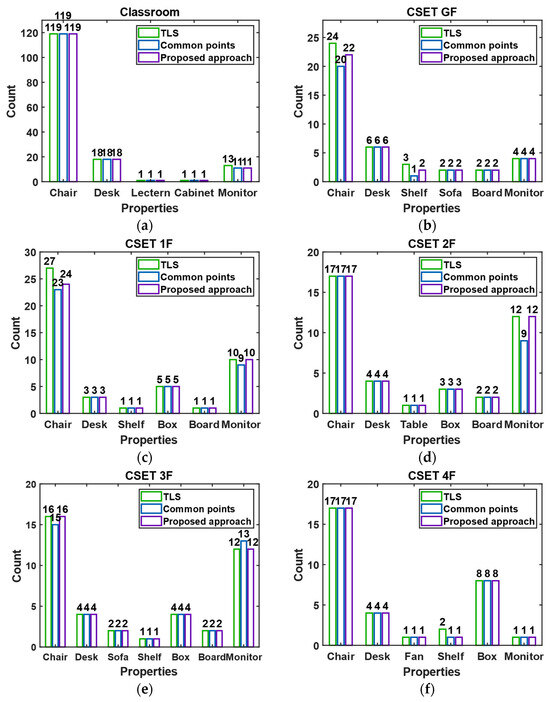
Figure 13.
Identified properties in each room: (a) Classroom; (b) CSET ground floor; (c) CSET first floor; (d) CSET second floor; (e) CSET third floor; (f) CSET fourth floor.
3.4. Time Duration and Cost
To assess the practicality and efficiency of the proposed approach, a time duration and cost analysis was conducted. Whereas a TLS may cost from USD 40,000 to USD 150,000 depending on the model and manufacturer, the proposed system costs only around USD 10,000, including an MLS, an IMU, and a laptop. The savings on the overall cost of the system are evident. Figure 14 shows the number of scans and the total scanning time in each room using TLS and MLS. It can be seen in Figure 14 that although the MLS scanned more individual clouds than the TLS, the total scanning time of the MLS in each room is less. The obvious difference in cost and time duration makes the proposed approach more attractive for the purpose of building asset management.
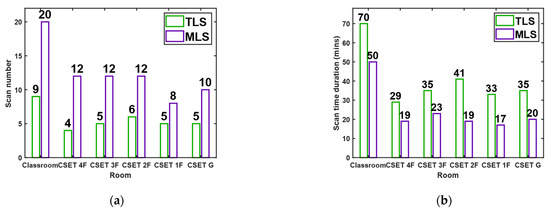
Figure 14.
Scan time and number of scans comparisons of TLS and MLS methods: (a) number of scans in each room; (b) scanning time.
3.5. Updated BIM Models
After evaluating the point clouds and the proposed approach, the created cloud objects were used to update BIM models, as described in Section 2.4. Figure 15 illustrates the BIM models before (left column) and after updates (right column), with roofs hidden for clarity.
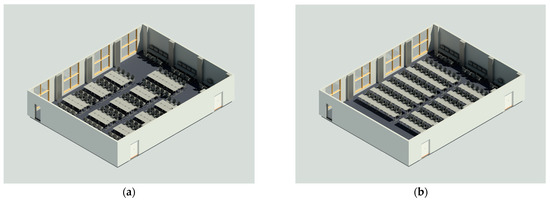
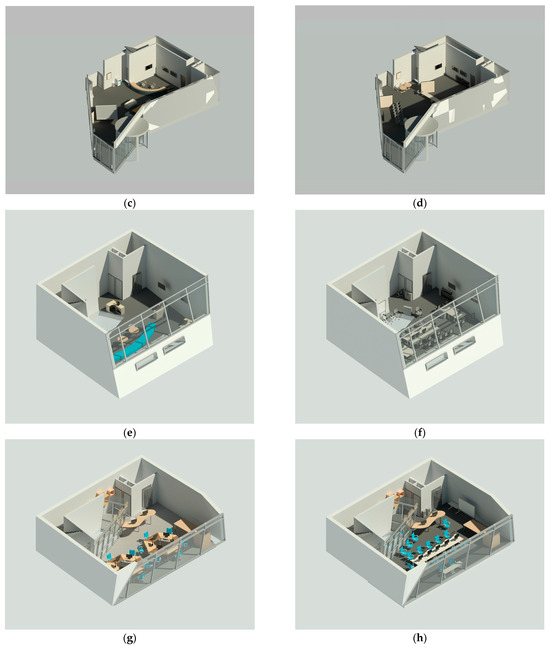
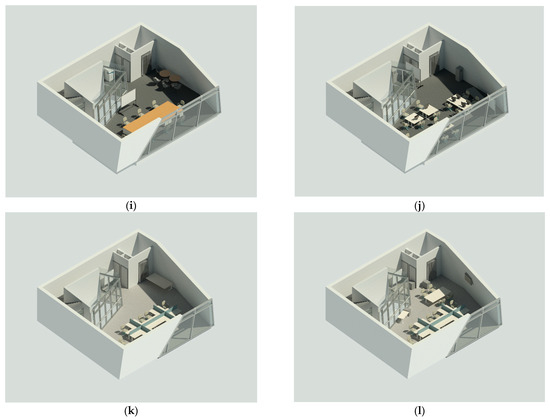
Figure 15.
Previous and updated BIM models: left column—previous models, right column—updated models; (a,b) Classroom, (c,d) CSET ground floor, (e,f) CSET first floor, (g,h) CSET second floor, (i,j) CSET third floor, (k,l) CSET fourth floor.
In Figure 15a, the desks and chairs are initially grouped, while Figure 15b shows a row arrangement suitable for lectures. Figure 15c,d depict the CSET ground floor before and after updates, showing changes from a curved desk and sofas to additional chairs. Figure 15e,f show the CSET first floor evolving from an open space with round tables and a curved sofa to a room with chairs, desks, and monitors. Figure 15g,h for the second-floor change from hexagon tables to rectangular desks. Figure 15i,j on the third floor transition from a meeting setup to a different desk arrangement. Minimal changes on the fourth floor are shown in Figure 15k,l, where only one large desk was moved and a small desk was added. The comparisons highlight significant differences between the pre- and post-update BIM models.
In this study, the success of the BIM model updates was evaluated based on the update rate and the correctness of the updates. The change rate was defined to measure the extent of modifications made to each room. This rate was calculated by dividing the number of unchanged items in the pre-update BIM model by the total number of items in the model, with item displacement and removal considered as changes. For example, if all items in a room were moved or removed, the change rate would be 100%. Additionally, correctness was assessed to determine if the updated model accurately reflected all content changes. This was calculated by dividing the number of items in the updated BIM model by the total number of items identified in the reference TLS clouds, thus defining the update accuracy.
Table 5 presents the updating rates and correctness of each BIM model. As shown in the table, except for the CSET fourth floor, the change rate for other floors exceeded 70%, indicating significant updates in the BIM models of these floors. Furthermore, the correctness of updates in all BIM models was above 90%, with two floors achieving 100% accuracy. These results demonstrate the successful updating of the BIM models.

Table 5.
Change rate and correctness of each BIM model.
4. Discussion
This study proposed an approach that involves moving MLS in nearly straight lines to scan the area, and using the IMU to estimate the movement trajectory of the MLS. By adopting the proposed approach to scan the rooms, individual clouds can be created along the moving path of the MLS. To create the cloud object of the rooms, the individual clouds should be merged, and a cloud registration approach that uses BIM models as references is proposed. In addition, a workflow was created to demonstrate the procedures from creating point clouds to update BIM models. The proposed approach was evaluated in study areas varied in shape, size, and function to assess its effectiveness, and the cloud objects were further used to update BIM models.
Results showed that the proposed approach can effectively create room-based 3D point clouds, and the proposed registration approach improves the accuracy of the cloud objects compared with the objects merged using common points. Results also showed that the accuracy levels of all the clouds were consistent, and achieved centimeter-level accuracy. Given the diverse indoor furnishing, shapes, sizes, and quantities of contents in each room, the feasibility of the proposed approach for indoor 3D point cloud creation was validated. In the literature, two studies used indoor positioning systems to navigate an MLS [35,36], and one used UWB integrated with IMU to navigate an MLS to create indoor point clouds for an atrium, achieving centimeter-level accuracy [36]. Compared to their study, the proposed approach does not require pre-installation of infrastructures and showed consistent accuracy (centimeter-level) across rooms with varied shapes and sizes. Therefore, the proposed approach is more feasible for creating indoor 3D point clouds compared to UWB-based methods.
The content comparison results showed that two chairs and one shelf on the CSET ground floor, three chairs on the CSET first floor, and one shelf on the CSET fourth floor were not identified in the cloud objects. These items were positioned in the areas difficult for the trolley to access or were obstructed by debris. For example, a shelf on the CSET ground floor, partially scanned by the TLS, was located in a cluttered corner, preventing the trolley from coming close. This issue could be resolved by using a smaller trolley to navigate tight spaces. In the classroom scenario, two monitors were partially blocked by chairs, resulting in incomplete scans and their exclusion from the content comparison. This issue can be addressed by raising the scanner to an optimum height so that the scanner can capture a wider area. The content comparison results confirmed that the number and type of the other properties identified in the cloud objects were accurate. Since these identified objects were further used to update BIM models and were reflected in the results, it can be concluded that the identified items in the cloud objects can effectively be used to update the properties in the BIM models.
The time duration and cost analysis showed that the proposed approach spent less time on scanning the indoor area, and the total costs of the approach were much lower than the TLS. Therefore, compared with the TLS approach that is conventionally used, the proposed approach can create room-based 3D point clouds in a much faster and cost-effective way.
The point clouds were further used to update existing BIM models of the rooms. In the literature, Hellmuth [61] reviewed various methods for updating digital building models and noted that while technologies such as TLS and photogrammetry were commonly used for BIM schedules and geometry updates, few studies focused on updating the contents within buildings. Osadcha et al. [51] reviewed the studies for updating the digital twin of built assets. They claimed that during the operational stage, geometric changes typically resulted from damage, renovations, or alterations in hydrological conditions, etc. This supported the effectiveness of the proposed approach for merging individual point clouds. In addition, Osadcha et al. [51] identified some challenges in using point clouds for model updates. The initial challenge involved categorizing, segmenting, and identifying objects within point clouds. Although various techniques were used to pinpoint object locations, they mainly focused on spatial positioning. The second challenge was the lack of semantic information in point clouds. Semantic information can also be used to identify objects, including type, feature, etc. While deep learning techniques have been used to identify pipelines within buildings, they have not been widely applied to recognizing other contents within clouds. Implementing such techniques requires a substantial database, which may not be feasible for this study. Given that all BIM models in this study were updated with the correctness exceeding 90%, the proposed approach demonstrates its effectiveness for updating the content information of BIM models during the O&M phase.
The mean accuracy of the cloud objects created by the proposed approach is at the centimeter level. Many studies have employed techniques to create or update BIM models with similar accuracy. For example, Cui et al. [32] used the point clouds created by two handheld scanners and a backpack scanner to create the 3D models of the structural elements (walls, columns, etc.) of the room. The accuracy of the three devices was all at the centimeter level. Masiero et al. [50] integrated UWB with photogrammetry technique to create 3D models in indoor areas, achieving centimeter-level accuracy in their tests. Oscadcha et al. [51] reviewed the data collection tools for updating building geometry, noting that photogrammetry and GPS techniques can also achieve centimeter-level accuracy. The literature supported that centimeter-level point clouds created by the proposed approach are sufficient for updating BIM models. In addition, the height information of the contents is collected by the scanner directly, and the MLS moves in straight lines. The height information therefore would not be influenced by the IMU positioning errors, and could be in millimeter-level accuracy.
Furthermore, since IMU estimates the movement trajectory of the MLS, and its positioning error accumulates over time, this error directly affects the accuracy of the created point clouds. To ensure the accuracy level of the IMU, the specifications of the IMU device were checked, which indicates that the in-run bias stability would be 10 degrees/hour [62]. Given the relatively small size of indoor areas and the scanning time for each single scan in this study took less than 2 min, the IMU error remains within acceptable limits for most areas.
However, when applying the proposed approach in a very large indoor area (factory, warehouse, etc.), the accuracy of the created point clouds should be evaluated. This can be performed by comparing each scanned cloud with the as-built BIM. Since BIM models were used to register the clouds, corresponding surfaces in both objects should overlap. If a significant incident angle is observed between the two objects, further verification of the cloud is necessary. In principle, the clouds created at the beginning of the scan process would have smaller errors than those scanned at the end, so that individual clouds that have greater errors may show in curved shapes. Although the proposed approach assumes near-straight line movement of the trolley, actual straight-line movement cannot be guaranteed. Consequently, the estimated IMU movement trajectory cannot be directly used to evaluate the error of the cloud. In addition, transforming the clouds to the BIM-defined frame may distribute the error from the end of the cloud to the beginning, directly comparing the end of the two objects may lead to incorrect comparison results.
To evaluate this error, points on a wall plane from both the cloud and the BIM model can be projected onto a 2D plane, forming a line for the wall. Since the IMU error is minimal at the start of the scanning process, the starting points of the projected lines from the cloud and the BIM models should align. Subsequently, points collected in the last few seconds of the scanning process can be used to draw perpendicular lines to the BIM-based projection line and measure distances. This distance can be further applied to evaluate the accuracy of the point clouds.
5. Conclusions
This study proposed a novel approach of using MLS and IMU to create indoor 3D point clouds to update as-built BIM models. Two study areas varying in shape, size, and function were used for the purpose of demonstration. Clouds of each room were created by moving the MLS in straight lines to generate multiple individual clouds and merging these clouds using both common points and aligning them onto BIM models. The created point clouds from both approaches were evaluated in four aspects, namely, overall accuracy, specific points accuracy, contents contained in the clouds, and time duration and cost. Results showed that the mean C2C distance of MLS clouds merged by aligning onto TLS clouds was close to 0.05 m and the mean P2P distance was close to 0.25 m, both of which were smaller (more accurate) than the conventional common points approach. The building contents in the MLS clouds were identified correctly, and the proposed approach was demonstrated to be more cost-effective and efficient, making it a more suitable approach for the BIM model updating of buildings for the purpose of asset management. It should be noted that the proposed approach requires a reference BIM model for the MLS clouds to align onto.
Author Contributions
Conceptualization, Y.Y. and C.H.; methodology, Y.Y.; software, Y.Y.; validation, Y.Y. and C.H.; formal analysis, Y.Y.; investigation, Y.Y.; resources, Y.-T.C. and C.H.; data curation, Y.Y.; writing—original draft preparation, Y.Y.; writing—review and editing, Y.-T.C., N.A.S.H., C.H. and Z.Z.; visualization, Y.-T.C.; supervision, Y.-T.C., C.H., N.A.S.H. and Z.Z.; project administration, Y.-T.C.; funding acquisition, Y.-T.C. All authors have read and agreed to the published version of the manuscript.
Funding
This grant is supported by Ningbo Science and Technology Bureau under grant number: 2023J189 and a Seed Fund from the University of Nottingham Ningbo China under grant number: RESI202209001.
Data Availability Statement
The data presented in this study are available on request from the corresponding author, the data are not publicly available due to privacy restrictions.
Conflicts of Interest
The authors declare no conflicts of interest.
References
- Liu, X.; Eybpoosh, M.; Akinci, B. Developing as-built building information model using construction process history captured by a laser scanner and a camera. In Construction Research Congress 2012: Construction Challenges in a Flat World; Cai, H., Kandil, A., Hastak, M., Dunston, P.S., Eds.; American Society of Civil Engineers: West Lafayette, IN, USA, 2012; pp. 1232–1241. [Google Scholar] [CrossRef]
- Jung, J.; Hong, S.; Jeong, S.; Kim, S.; Cho, H.; Hong, S.; Heo, J. Productive modeling for development of as-built BIM of existing indoor structures. Autom. Constr. 2014, 42, 68–77. [Google Scholar] [CrossRef]
- Xiong, X.; Adan, A.; Akinci, B.; Huber, D. Automatic creation of semantically rich 3D building models from laser scanner data. Autom. Constr. 2013, 31, 325–337. [Google Scholar] [CrossRef]
- Thomson, C.; Boehm, J. Automatic geometry generation from point clouds for BIM. Remote Sens. 2015, 7, 11753–11775. [Google Scholar] [CrossRef]
- Tzedaki, V.; Kamara, J.M. Capturing as-built information for a BIM environment using 3D laser scanner: A process model. In AEI 2013: Building Solutions for Architectural Engineering, Proceedings of the Architectural Engineering Conference 2013, State College, PA, USA, 3 April 2013; American Society of Civil Engineers: Reston, VA, USA, 2013; pp. 486–495. [Google Scholar] [CrossRef]
- Sepasgozar, S.M.; Forsythe, P.; Shirowzhan, S. Evaluation of terrestrial and mobile scanner technologies for part-built information modeling. J. Constr. Eng. Manag. 2018, 144, 04018110. [Google Scholar] [CrossRef]
- Gao, T.; Akinci, B.; Ergan, S.; Garrett, J. An approach to combine progressively captured point clouds for BIM update. Adv. Eng. Inform. 2015, 29, 1001–1012. [Google Scholar] [CrossRef]
- Volk, R.; Stengel, J.; Schultmann, F. Building Information Modeling (BIM) for existing buildings—Literature review and future needs. Autom. Constr. 2014, 38, 109–127. [Google Scholar] [CrossRef]
- Zhu, Z.; Brilakis, I. Comparison of optical sensor-based spatial data collection techniques for civil infrastructure modeling. J. Comput. Civ. Eng. 2009, 23, 170–177. [Google Scholar] [CrossRef]
- Koch, T.; Korner, M.; Fraundorfer, F. Automatic alignment of indoor and outdoor building models using 3D line segments. In Proceedings of the IEEE Conference on Computer Vision and Pattern Recognition Workshops, Las Vegas, NV, USA, 26 June–1 July 2016; pp. 10–18. [Google Scholar] [CrossRef]
- Tsai, G.; Xu, C.; Liu, J.; Kuipers, B. Real-time indoor scene understanding using bayesian filtering with motion cues. In Proceedings of the 2011 International Conference on Computer Vision, Barcelona, Spain, 6–13 November 2011; pp. 121–128. [Google Scholar] [CrossRef]
- Li, Y.; Li, W.; Tang, S.; Darwish, W.; Hu, Y.; Chen, W. Automatic indoor as-built building information models generation by using low-cost RGB-D sensors. Sensors 2020, 20, 293. [Google Scholar] [CrossRef]
- Shao, W.; Vijayarangan, S.; Li, C.; Kantor, G. Stereo visual inertial lidar simultaneous localization and mapping. In Proceedings of the 2019 IEEE/RSJ International Conference on Intelligent Robots and Systems (IROS), Macau, China, 3–8 November 2019; pp. 370–377. [Google Scholar] [CrossRef]
- Chen, Y.; Tang, J.; Jiang, C.; Zhu, L.; Lehtomäki, M.; Kaartinen, H.; Kaijaluoto, R.; Wang, Y.; Hyyppä, J.; Hyyppä, H. The accuracy comparison of three simultaneous localization and mapping (SLAM)-based indoor mapping technologies. Sensors 2018, 18, 3228. [Google Scholar] [CrossRef] [PubMed]
- Zhang, H.; Ye, C. An indoor wayfinding system based on geometric features aided graph SLAM for the visually impaired. IEEE Trans. Neural Syst. Rehabil. Eng. 2017, 25, 1592–1604. [Google Scholar] [CrossRef]
- Graven, O.H.; Srisuphab, A.; Silapachote, P.; Sirilertworakul, V.; Ampornwathanakun, W.; Anekwiroj, P.; Maitrichit, N. An autonomous indoor exploration robot rover and 3d modeling with photogrammetry. In Proceedings of the 2018 International ECTI Northern Section Conference on Electrical, Electronics, Computer and Telecommunications Engineering (ECTI-NCON), Chiang Rai, Thailand, 25–28 February 2018; pp. 44–47. [Google Scholar] [CrossRef]
- Debeunne, C.; Vivet, D. A review of visual-LiDAR fusion based simultaneous localization and mapping. Sensors 2020, 20, 2068. [Google Scholar] [CrossRef] [PubMed]
- Besl, P.J.; McKay, N.D. A method for registration of 3-D shapes. IEEE Trans. Pattern Anal. Mach. Intell. 1992, 14, 239–256. [Google Scholar] [CrossRef]
- Karam, S.; Vosselman, G.; Peter, M.; Hosseinyalamdary, S.; Lehtola, V. Design, calibration, and evaluation of a backpack indoor mobile mapping system. Remote Sens. 2019, 11, 905. [Google Scholar] [CrossRef]
- Alsadik, B.; Karam, S. The simultaneous localization and mapping (SLAM)—An overview. Surv. Geospat. Eng. J. 2021, 2, 34–45. [Google Scholar] [CrossRef]
- Tang, P.; Huber, D.; Akinci, B.; Lipman, R.; Lytle, A. Automatic reconstruction of as-built building information models from laser-scanned point clouds: A review of related techniques. Autom. Constr. 2010, 19, 829–843. [Google Scholar] [CrossRef]
- Barber, D.; Mills, J.; Smith-Voysey, S. Geometric validation of a ground-based mobile laser scanning system. ISPRS J. Photogramm. Remote Sens. 2008, 63, 128–141. [Google Scholar] [CrossRef]
- De Croon, G.; De Wagter, C. Challenges of autonomous flight in indoor environments. In Proceedings of the 2018 IEEE/RSJ International Conference on Intelligent Robots and Systems (IROS), Madrid, Spain, 1–5 October 2018; pp. 1003–1009. [Google Scholar] [CrossRef]
- Roberts, R.; Inzerillo, L.; Di Mino, G. Using UAV based 3D modelling to provide smart monitoring of road pavement conditions. Information 2020, 11, 568. [Google Scholar] [CrossRef]
- Wang, C.; Cho, Y.K.; Kim, C. Automatic BIM component extraction from point clouds of existing buildings for sustainability applications. Autom. Constr. 2015, 56, 1–13. [Google Scholar] [CrossRef]
- Jung, J.; Stachniss, C.; Ju, S.; Heo, J. Automated 3D volumetric reconstruction of multiple-room building interiors for as-built BIM. Adv. Eng. Inform. 2018, 38, 811–825. [Google Scholar] [CrossRef]
- Truong-Hong, L.; Laefer, D.F.; Hinks, T.; Carr, H. Flying voxel method with Delaunay triangulation criterion for façade/feature detection for computation. J. Comput. Civ. Eng. 2012, 26, 691–707. [Google Scholar] [CrossRef]
- Mahdjoubi, L.; Moobela, C.; Laing, R. Providing real-estate services through the integration of 3D laser scanning and building information modelling. Comput. Ind. 2013, 64, 1272–1281. [Google Scholar] [CrossRef]
- Wang, B.; Yin, C.; Luo, H.; Cheng, J.C.; Wang, Q. Fully automated generation of parametric BIM for MEP scenes based on terrestrial laser scanning data. Autom. Constr. 2021, 125, 103615. [Google Scholar] [CrossRef]
- Sanchez, V.; Zakhor, A. Planar 3D modeling of building interiors from point cloud data. In Proceedings of the 2012 IEEE International Conference on Image Processing, Lake Buena Vista, FL, USA, 30 Spetember–3 October 2012; pp. 1777–1780. [Google Scholar] [CrossRef]
- Lehtola, V.V.; Kaartinen, H.; Nüchter, A.; Kaijaluoto, R.; Kukko, A.; Litkey, P.; Honkavaara, E.; Rosnell, T.; Vaaja, M.T.; Virtanen, J.-P. Comparison of the selected state-of-the-art 3D indoor scanning and point cloud generation methods. Remote Sens. 2017, 9, 796. [Google Scholar] [CrossRef]
- Cui, Y.; Li, Q.; Yang, B.; Xiao, W.; Chen, C.; Dong, Z. Automatic 3-D reconstruction of indoor environment with mobile laser scanning point clouds. IEEE J. Sel. Top. Appl. Earth Obs. Remote Sens. 2019, 12, 3117–3130. [Google Scholar] [CrossRef]
- Pučko, Z.; Šuman, N.; Rebolj, D. Automated continuous construction progress monitoring using multiple workplace real time 3D scans. Adv. Eng. Inform. 2018, 38, 27–40. [Google Scholar] [CrossRef]
- Omar, T.; Nehdi, M.L. Data acquisition technologies for construction progress tracking. Autom. Constr. 2016, 70, 143–155. [Google Scholar] [CrossRef]
- Lau, L.; Quan, Y.; Wan, J.; Zhou, N.; Wen, C.; Qian, N.; Jing, F. An autonomous ultra-wide band-based attitude and position determination technique for indoor mobile laser scanning. ISPRS Int. J. Geo-Inf. 2018, 7, 155. [Google Scholar] [CrossRef]
- Chen, C.; Tang, L.; Hancock, C.M.; Zhang, P. Development of low-cost mobile laser scanning for 3D construction indoor mapping by using inertial measurement unit, ultra-wide band and 2D laser scanner. Eng. Constr. Archit. Manag. 2019, 26, 1367–1386. [Google Scholar] [CrossRef]
- LMS5xx LiDAR Sensors. SICK: Waldkrich, Germany. Available online: https://www.sick.com/cl/en/catalog/products/lidar-and-radar-sensors/lidar-sensors/lms5xx/c/g179651 (accessed on 25 October 2023).
- MTi-100. Movella. Hendersen, NV, USA. Available online: https://www.movella.com/products/sensor-modules/xsens-mti-100-imu (accessed on 25 October 2023).
- Yan, J.; He, G.; Basiri, A.; Hancock, C. 3-D passive-vision-aided pedestrian dead reckoning for indoor positioning. IEEE Trans. Instrum. Meas. 2019, 69, 1370–1386. [Google Scholar] [CrossRef]
- Jimenez, A.R.; Seco, F.; Prieto, C.; Guevara, J. A comparison of pedestrian dead-reckoning algorithms using a low-cost MEMS IMU. In Proceedings of the 2009 IEEE International Symposium on Intelligent Signal Processing, Budapest, Hungary, 26–28 August 2009; pp. 37–42. [Google Scholar] [CrossRef]
- Yan, J.; He, G.; Basiri, A.; Hancock, C. Vision-aided indoor pedestrian dead reckoning. In Proceedings of the 2018 IEEE International Instrumentation and Measurement Technology Conference (I2MTC), Huston, TX, USA, 14–17 May 2018; pp. 1–6. [Google Scholar] [CrossRef]
- Racko, J.; Brida, P.; Perttula, A.; Parviainen, J.; Collin, J. Pedestrian dead reckoning with particle filter for handheld smartphone. In Proceedings of the 2016 International Conference on Indoor Positioning and Indoor Navigation (IPIN), Alcalá de Henares, Madrid, Spain, 4–7 October 2016; pp. 1–7. [Google Scholar] [CrossRef]
- CloudCompare Wiki. Available online: https://www.cloudcompare.org/doc/wiki/index.php/Main_Page (accessed on 26 March 2023).
- MeshLab. Available online: https://www.meshlab.net/ (accessed on 3 July 2024).
- Zwillinger, D. CRC Standard Mathematical Tables and Formulae; Chapman and Hall/CRC: Boca Raton, FL, USA, 2002. [Google Scholar]
- Arnaud, A.; Gouiffès, M.; Ammi, M. Towards real-time 3D editable model generation for existing indoor building environments on a tablet. Front. Virtual Real. 2022, 3, 782564. [Google Scholar] [CrossRef]
- Rausch, C.; Haas, C. Automated shape and pose updating of building information model elements from 3D point clouds. Autom. Constr. 2021, 124, 103561. [Google Scholar] [CrossRef]
- Chuang, T.-Y.; Yang, M.-J. Change component identification of BIM models for facility management based on time-variant BIMs or point clouds. Autom. Constr. 2023, 147, 104731. [Google Scholar] [CrossRef]
- Meyer, T.; Brunn, A.; Stilla, U. Change detection for indoor construction progress monitoring based on BIM, point clouds and uncertainties. Autom. Constr. 2022, 141, 104442. [Google Scholar] [CrossRef]
- Masiero, A.; Fissore, F.; Guarnieri, A.; Pirotti, F.; Vettore, A. Aiding indoor photogrammetry with UWB sensors. Photogramm. Eng. Remote Sens. 2019, 85, 369–378. [Google Scholar] [CrossRef]
- Osadcha, I.; Jurelionis, A.; Fokaides, P. Geometric parameter updating in digital twin of built assets: A systematic literature review. J. Build. Eng. 2023, 73, 106704. [Google Scholar] [CrossRef]
- HDS7000. Leica Geosystems. Heerbrugg, Switzerland. Available online: https://www.yumpu.com/en/document/read/21423705/hds-7000-northern-survey-supply (accessed on 25 October 2023).
- Ahmadabadian, A.H.; Yazdan, R.; Karami, A.; Moradi, M.; Ghorbani, F. Clustering and selecting vantage images in a low-cost system for 3D reconstruction of texture-less objects. Measurement 2017, 99, 185–191. [Google Scholar] [CrossRef]
- Koutsoudis, A.; Vidmar, B.; Ioannakis, G.; Arnaoutoglou, F.; Pavlidis, G.; Chamzas, C. Multi-image 3D reconstruction data evaluation. J. Cult. Herit. 2014, 15, 73–79. [Google Scholar] [CrossRef]
- Mohammadi, M.; Rashidi, M.; Mousavi, V.; Karami, A.; Yu, Y.; Samali, B. Quality evaluation of digital twins generated based on UAV photogrammetry and TLS: Bridge case study. Remote Sens. 2021, 13, 3499. [Google Scholar] [CrossRef]
- Morgan, J.A.; Brogan, D.J.; Nelson, P.A. Application of Structure-from-Motion photogrammetry in laboratory flumes. Geomorphology 2017, 276, 125–143. [Google Scholar] [CrossRef]
- Georgantas, A.; Brédif, M.; Pierrot-Desseilligny, M. An accuracy assessment of automated photogrammetric techniques for 3D modeling of complex interiors. Int. Arch. Photogramm. Remote Sens. Spat. Inf. Sci. 2012, 39, 23–28. [Google Scholar] [CrossRef]
- Jo, Y.H.; Hong, S. Three-dimensional digital documentation of cultural heritage site based on the convergence of terrestrial laser scanning and unmanned aerial vehicle photogrammetry. ISPRS Int. J. Geo-Inf. 2019, 8, 53. [Google Scholar] [CrossRef]
- Agüera-Vega, F.; Carvajal-Ramírez, F.; Martínez-Carricondo, P. Assessment of photogrammetric mapping accuracy based on variation ground control points number using unmanned aerial vehicle. Measurement 2017, 98, 221–227. [Google Scholar] [CrossRef]
- Lewińska, P.; Róg, M.; Żądło, A.; Szombara, S. To save from oblivion: Comparative analysis of remote sensing means of documenting forgotten architectural treasures–Zagórz Monastery complex, Poland. Measurement 2022, 189, 110447. [Google Scholar] [CrossRef]
- Hellmuth, R. Update approches and methods for digital building models—Literature review. J. Inf. Technol. Constr. 2022, 27, 191–222. [Google Scholar]
- MTi-100. Available online: https://www.xsens.com/hubfs/Downloads/Leaflets/MTi-100.pdf?__hstc=157421285.4985f0839b0d76fbe6623164b247e110.1719292911553.1719292911553.1719292911553.1&__hssc=157421285.3.1719292911553&__hsfp=4040703939 (accessed on 25 June 2024).
Disclaimer/Publisher’s Note: The statements, opinions and data contained in all publications are solely those of the individual author(s) and contributor(s) and not of MDPI and/or the editor(s). MDPI and/or the editor(s) disclaim responsibility for any injury to people or property resulting from any ideas, methods, instructions or products referred to in the content. |
© 2024 by the authors. Licensee MDPI, Basel, Switzerland. This article is an open access article distributed under the terms and conditions of the Creative Commons Attribution (CC BY) license (https://creativecommons.org/licenses/by/4.0/).