1. Introduction
UWB radar realizes the detection, recognition, and imaging of specific targets by emitting and receiving electromagnetic waves [
1,
2,
3]. Compared with common sensors like optical or infrared ones, UWB radar contains certain technical advantages in high resolution, high penetrability, and all-weather, all-time functional capability, receiving wide applications in both civil and martial spheres [
4,
5,
6,
7,
8,
9]. Thus, an essential branch of UWB radar research and applications appeared, considering its capabilities: noncontact monitoring of human vital signs. It achieves human monitoring and vital sign extraction by taking advantage of the micro-Doppler modulation of radar waves by human micromotions, such as chest wall motions caused by cardiopulmonary activity [
10,
11,
12]. With the information obtained from human targets after processing radar echoes, real-time monitoring and analyses of the human body status have become a possible noninvasive healthcare approach. Furthermore, UWB radar has great research value and application potential because of its noncontact detection and privacy protection abilities in healthcare [
13,
14], clinical monitoring [
10,
15], the smart home industry [
16,
17], and various indoor applications [
18,
19], which arouses continuous interest among researchers around the globe.
The typical monitoring of human vital signs includes two procedures. The first is target positioning by estimating the range cells located after signal processing. Then, the vital signs of the target are extracted from the nearby data space using the location information, which could be concluded as locating first and target characteristics afterward. Therefore, accurate target detection becomes a problem of further vital sign extraction that requires worry in advance. Current human target detection algorithms mainly include two methods:
- (1)
Applying peak detection or data clustering to the processing results of signal energy [
20,
21], standard deviation [
22,
23], variance [
24], peak-to-peak value [
24], correlation [
25,
26], and even entropy [
27] from the obtained data matrix;
- (2)
Applying joint determination based on results after combined approaches like MTI with CA-CFAR [
28] or MTI with peaks in energy [
29].
Under ideal conditions, generally with a wide-open environment and several human targets of no more than three, the detection results appear acceptable with mere interference from and between the surroundings during multitarget detection. In such scenarios, the effectiveness of the above algorithms is verified through both simulation and actual measurement. However, most of the algorithms encounter false detections in actual detecting, leading to further deterioration in the extraction of vital signs. The unconsidered differences between the actual and experimental environments are responsible for the malfunctions when applying UWB radar in clinical monitoring or healthcare. These differences could be concluded as follows:
- (1)
Environment. The usual scene of multitarget detection appears to be an indoor situation with objects such as walls, ceilings, and furniture involved. This means that the received radar echoes contain not only the first reflection from the target, known as direct reflection, but also large amounts of secondary reflections of targets (SRTs) by the above surroundings, which might lead to false detection using the radar.
- (2)
Multitarget. In the indoor scenario, multiple human targets are limited in a concentrated distribution with a close range when coexisting, causing a shading effect and interference between reflections.
Thus, the detection performance of current methods fails to reach their ideal state with a lack of consideration of the above conditions, complex indoor surroundings, and multiple targets. To sum up, several problems of target detection based on UWB radar remain as follows:
- (1)
Accurate target detection in various environments from the received radar echoes is required, which includes target ranging and number counting.
- (2)
The SRTs caused by reflectors like furniture, ceilings, and especially walls in the indoor environment superpose the direct reflection of targets received by radar, becoming a severe interference element in the radar echoes that attenuate the accuracy of target detection.
- (3)
The multitarget detection that is closely distributed, the indoor situation in particular, becomes an even tougher issue considering their reflection interference.
This article proposed a two-step accuracy improvement for multitarget detection using UWB radar in the indoor environment against the accuracy deterioration by the SRTs and the reflection interference between targets. In the beginning, it introduces MCA-CFAR to achieve rough detection of human targets by processing the radar echoes and applying the window parameters and adaptive threshold to reduce the involvement of secondary echoes, environmental clutter, and reflection interference in multitarget detection. Then, the first step is the short-window accumulation in the time domain, windowing and accumulating the rough decisions from MCA-CFAR to suppress segments of false detections by SRTs and the close-range target reflection interference from cardiopulmonary activities. The second step introduces the decision confidence to estimate the reliability of the detection results. With the obtained short-window decision matrix from the first step, it applies the local peak detection algorithm to the accumulating results of the matrix, the decision confidence, to eliminate low-trust decisions and realize a credible interference suppression with the preset threshold. The joint suppression of false detections of the two-step algorithm could thus generate a more accurate detection result under complex detection conditions.
This article is organized into five sections.
Section 2 includes the signal model of the human target detection and problem description. The algorithm proposed is introduced in
Section 3. The experimental setup and the comparison of the results are in
Section 4. This article is concluded in
Section 5.
2. Signal Model of the Human Target Detection and Problem Description
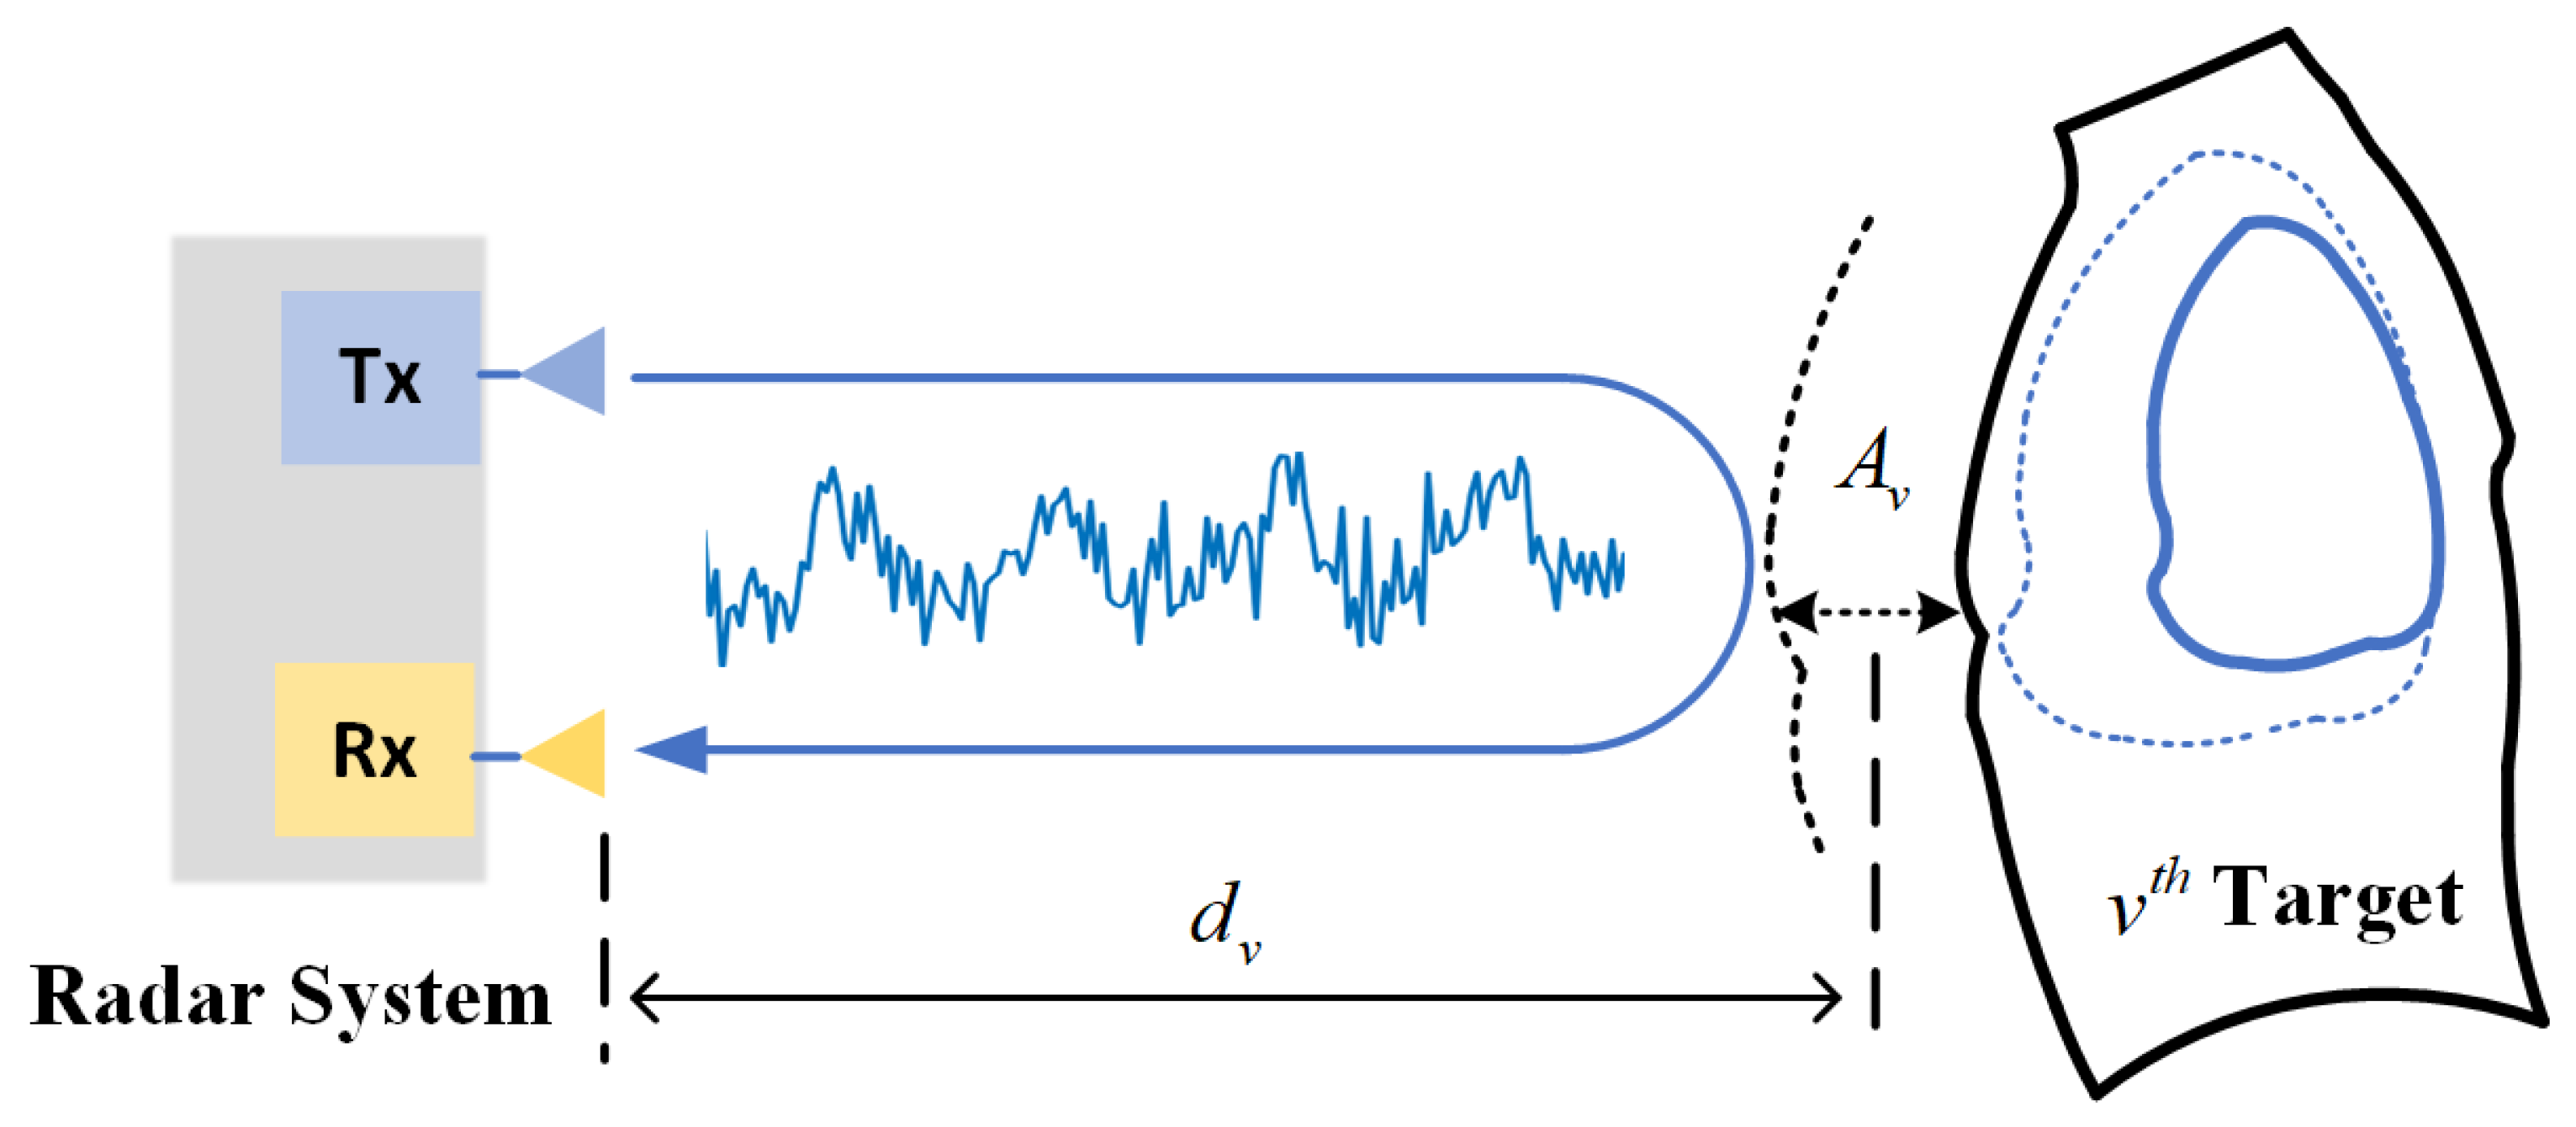
Considering the periodic cardiopulmonary activities of the human target, the chest wall motions modulate and then reflect the UWB radar signal. In ideal situations, the monitoring considers only the direct reflection of targets since the attenuation of the radar waves makes other reflections insignificant while received by the antenna. However, the undesired SRTs caused by walls in indoor situations make monitoring human activities a challenge in that they interfere with the process of target detection, leading to radar malfunctions. Therefore, it is necessary to suppress such effects or introduce procedures to reduce their disturbance in the process. In a subsection, we analyzed the interference to establish a corresponding radar monitoring model. A more comprehensive explanation of this phenomenon is provided in
Section 2.2. During the detection of a human target
v with a distance
between the steady chest wall and radar, the altered distance caused by chest motion could be expressed as
, as shown in
Figure 1. TX represents the transmitting antenna, and RX represents the receiving antenna. Thus, the actual time-varying distance function between the radar and the human chest that the radar detected using the received echoes could be expressed as follows:
where
represents the slow time,
is the pulse repetition interval,
is the chest motion amplitude caused by respiration, and
is the respiration rate.
The received radar echoes are the propagation of the emitted signal along the path of radar-to-target and target-to-radar. Then, the target with a certain impulse response (IR) function (his body reflections) under an ideal noiseless condition could be expressed as follows:
where
represents the normalized echo,
represents the propagation time cost along the path between the target and radar, and
c is the speed of light.
Through a sampling processing of the received echoes along the fast time
with a sampling rate of
, the obtained 2D echo matrix of the target could be expressed as follows:
where
represents the echo index,
represents the fast time samples index corresponding to each range cell,
represents the fast time, and
is the fast time interval.
2.1. Target Detecting Model under the Indoor Condition with SRTs
As mentioned above, the standard propagation path of radar waves starts at the radar TX to reach the human body, and then is reflected by the human body and received by the radar. However, the indoor environment with walls in close range would also reflect the human-modulated waves. Therefore, the SRTs generated would also be received with a scant decline of signal strength, causing the appearance of unreal human targets in the echo matrix and leading to the interference of target detection. Current methods fail to recognize SRTs as unreal targets to be excluded from target detection. Therefore, it is necessary to model and analyze the SRTs to reduce their interference in target detection. This article only focuses on SRTs since higher-order reflections fade into noise and out of consideration due to channel attenuation.
Still, the 2D echo matrix is here to express the received radar echoes. The matrix of multitarget monitoring in the indoor situation could be expressed as follows:
where
is the echo amplitude of the t7e
scattering point if we consider the wall as a multiple scattering reflector for clear analyzing,
represents the time of arrival of the direct reflection of the
wall scattering point,
is the distance between the scattering point and radar,
is the echo amplitude of the SRT of the
wall scattering point of the
human target,
represents the time of arrival of the SRT,
is the distance between the
human target and the
wall scattering point,
is the echo amplitude of the
human target,
reveals the instantaneous position of the chest wall of the
human target at the moment
t,
represents the normalized received pulse, and
represents the noise.
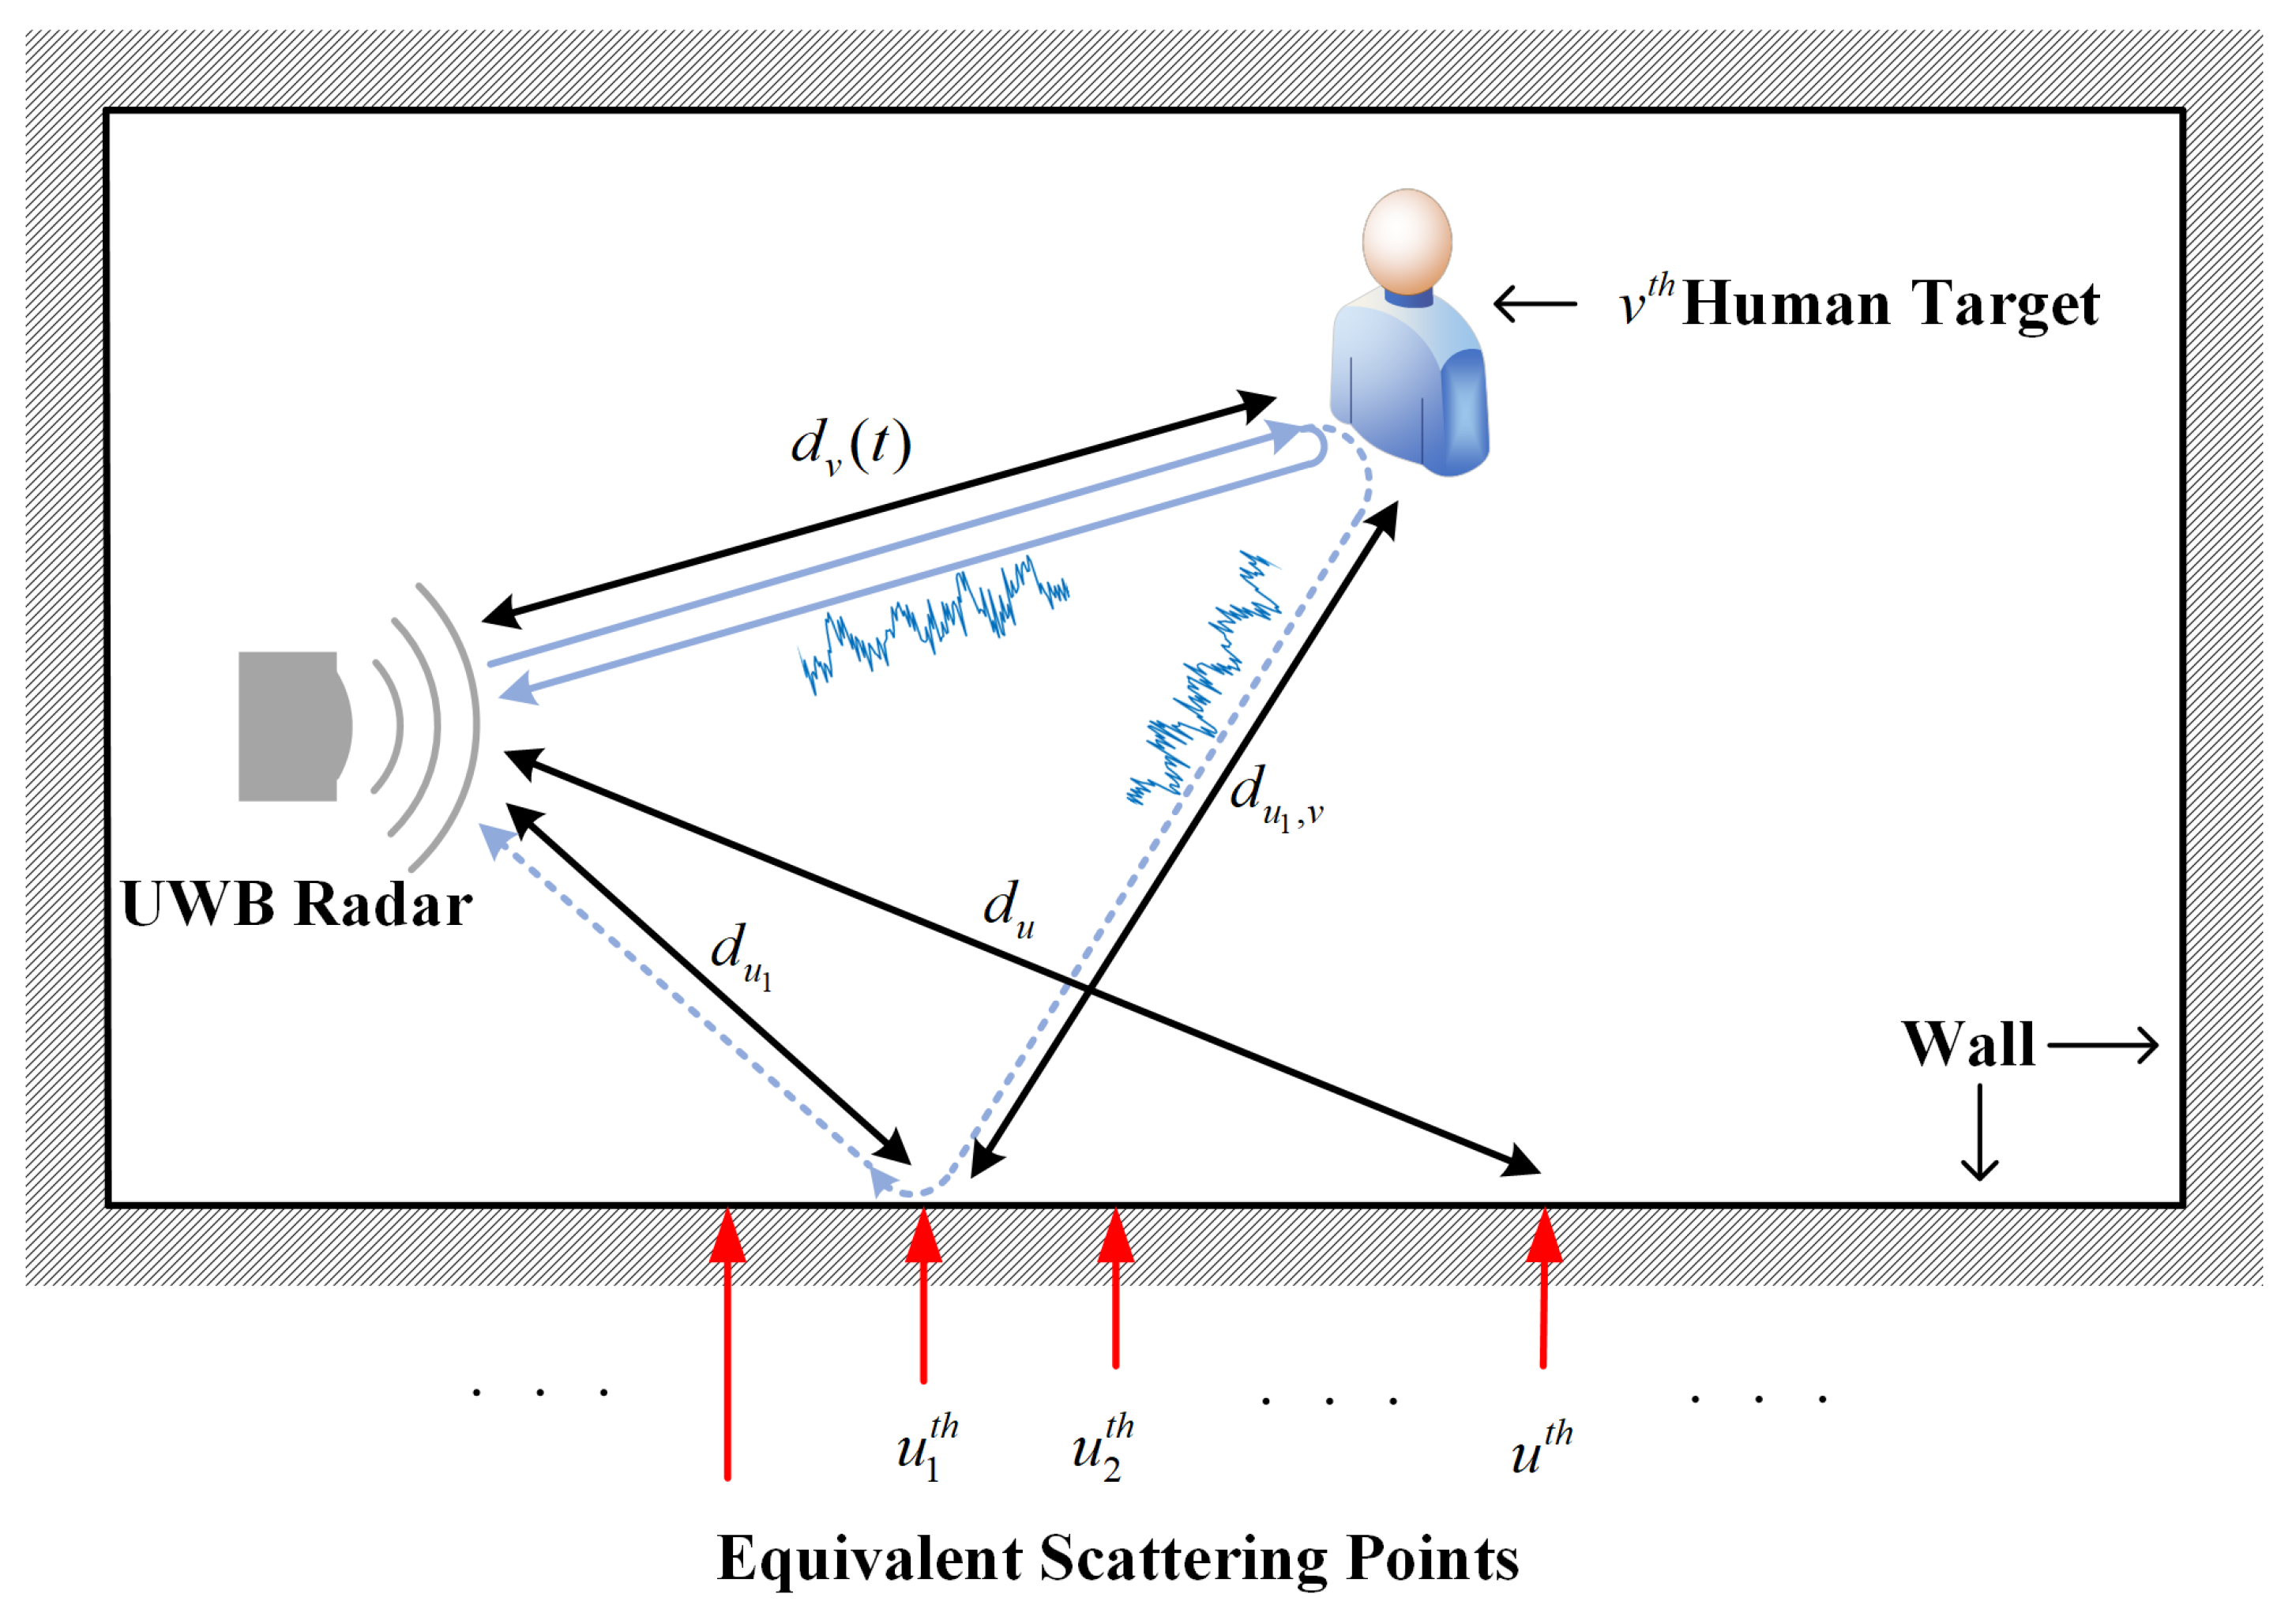
2.2. Problem Description of Target Detection with SRTs
The echoes received within an SRTs existing environment of direct reflections containing respiratory information of the target and the SRTs are shown in
Figure 2, where the blue lines represent the path of direct reflection of the
human target, the dashed line represents the path of the SRT, and the black lines represent the distance between targets.
The far-range data in the 2D echo matrix with the direct reflection from the
scattering point now also contain a composition of the SRTs by the
wall when
exists. The composed reflection
of the
wall scattering point could be expressed as follows:
where
is the echo amplitude of the direct reflection of the
wall scattering point,
is the echo amplitude of the SRT by the
wall scattering point,
represents the time of arrival of the
scattering point, and
.
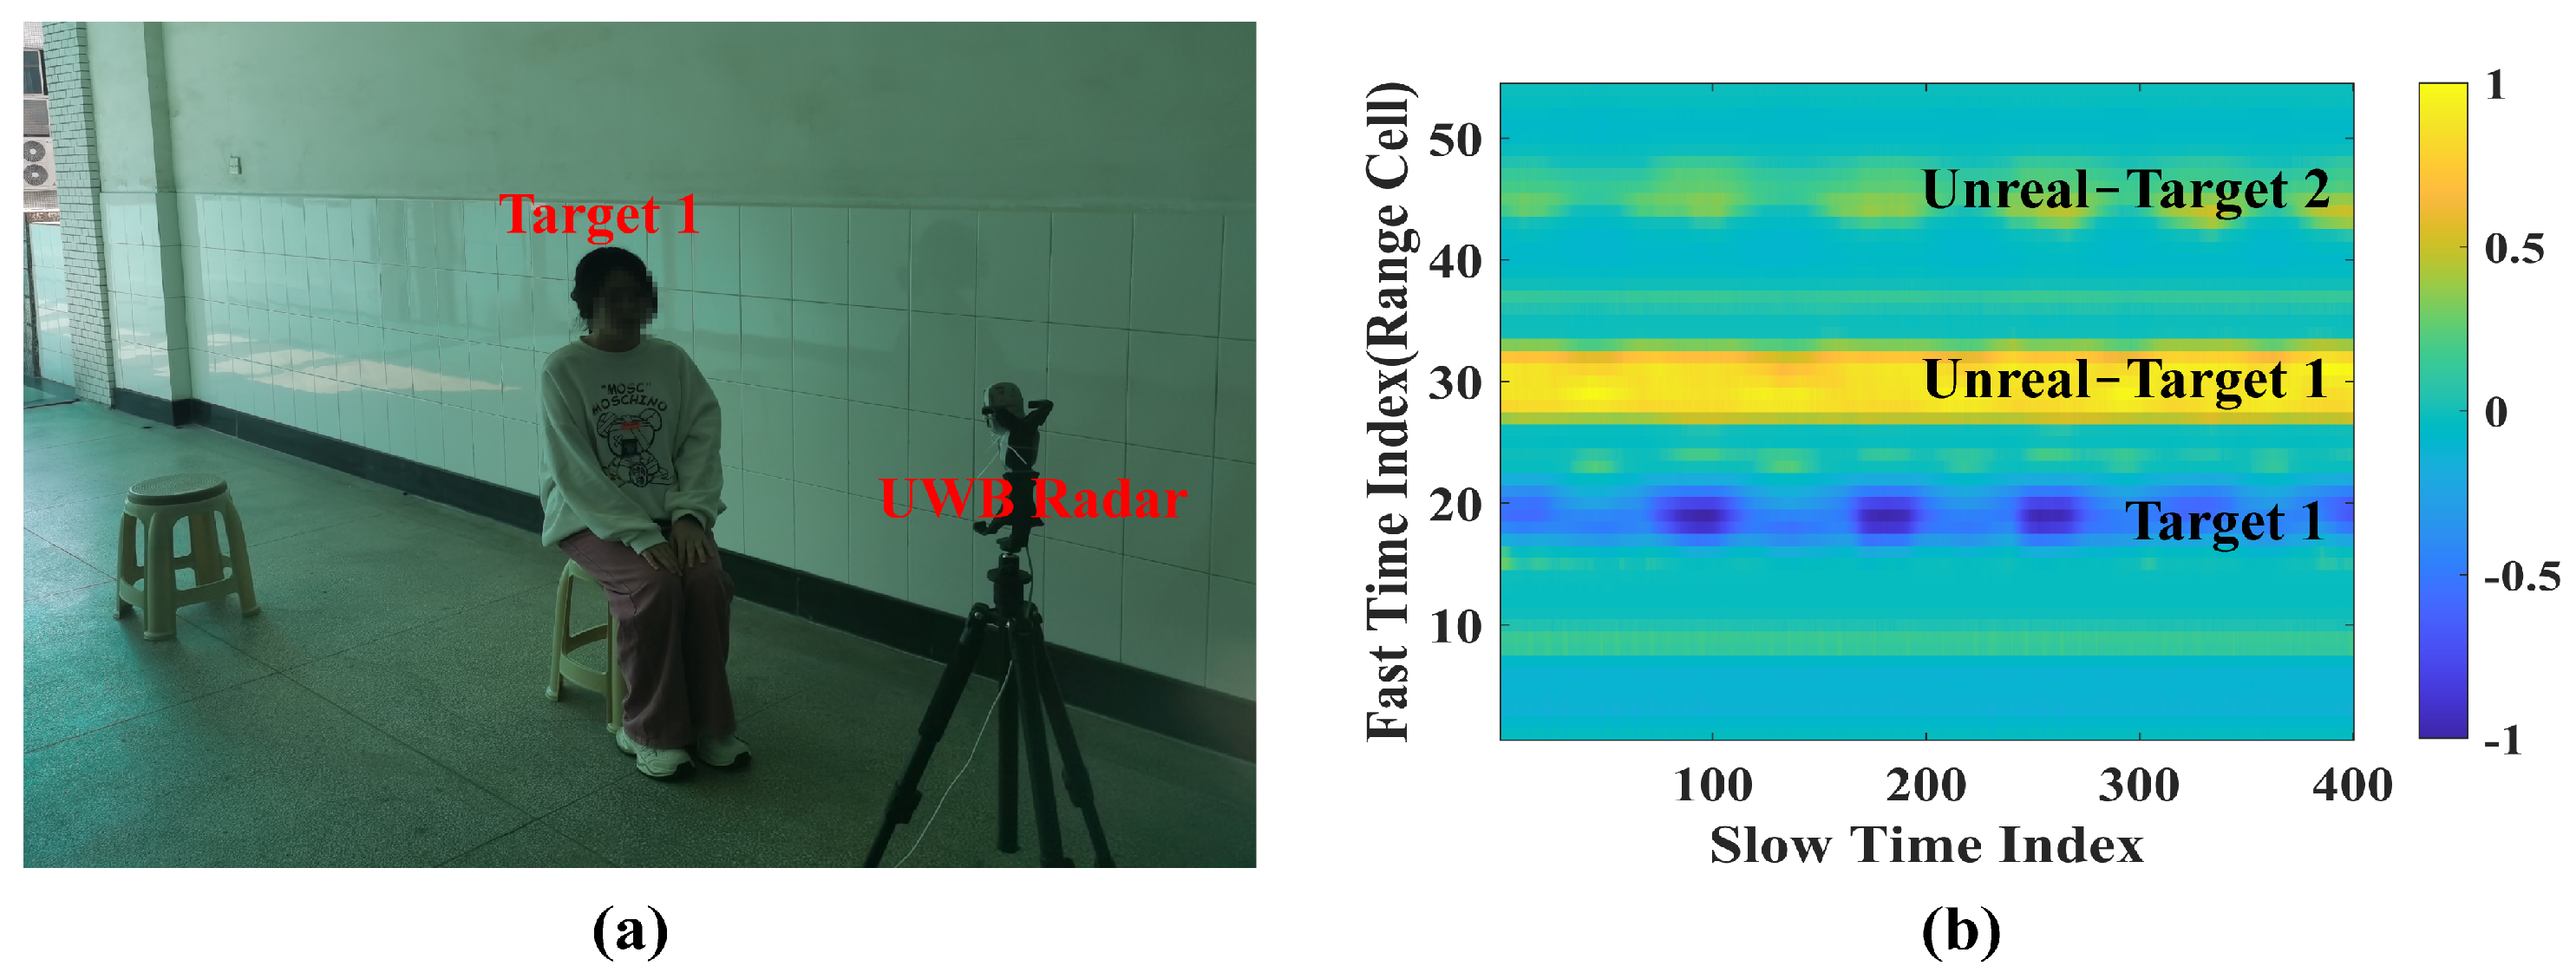
Thus, periodic respiratory changes similar to human target echoes will also occur in the farther wall section, as shown in
Figure 3. The echo matrix is normalized and centered around zero. When monitoring targets in the SRTs’ existing environment, it is obvious that there exist periodic respiratory changes around 30 and 43 range cells, as shown in
Figure 3b, with the only human target sitting at 1.2 m from the radar, as shown in
Figure 3a. Therefore, SRTs by the wall could eventuate in unreal human targets in the echo matrix that might cause false detection. Considering the actual monitoring of multiple human targets in indoor scenarios, such SRTs would be a tough challenge to manage.
Current methods, like energy-based ones, are capable of multitarget detection in limited situations. It is possible to select the energy peaks of the close-range targets for their stronger reflections compared with those farther from the radar once the preset detection threshold becomes certain. Although the SRTs might be excluded because of the signal attenuation with a longer propagation route, the far-distance human targets might also be lost for less power. Methods based on statistical means, like variance or standard deviation, could enhance the alteration in the echo matrix caused by human cardiopulmonary activities, which would make human targets easier to identify compared with the energy-based methods. On the other hand, it might also increase the value peaks of the SRTs, leading to false detections of far-distance targets.
Other methods, such as entropy-based ones, take advantage of the differences in echoes between static reflectors and micromotion targets to identify human existence. With the periodic respiratory activity of human targets, the range cells existing in human targets will have lower entropy values and generate valleys in entropy curve after the signal processing of echoes. In an ideal environment, the entropy-based methods become an effective way for target detection. Once the SRTs dominate the echoes, the entropy of the composite echoes becomes disorderly in order to interpret with multiple false valleys near the SRTs, which might cause a distortion or failure of target detection.
As for the MTI-based CA-CFAR, background reflection suppression is here to reveal the micromotion features. However, the SRTs will also be amplified, which will interfere with the subsequent target detection of CA-CFAR, especially the misidentification of distant targets. Therefore, the existing methods are insufficient in order to effectively perform in multitarget detection under the SRTs’ existing condition.
3. Methods
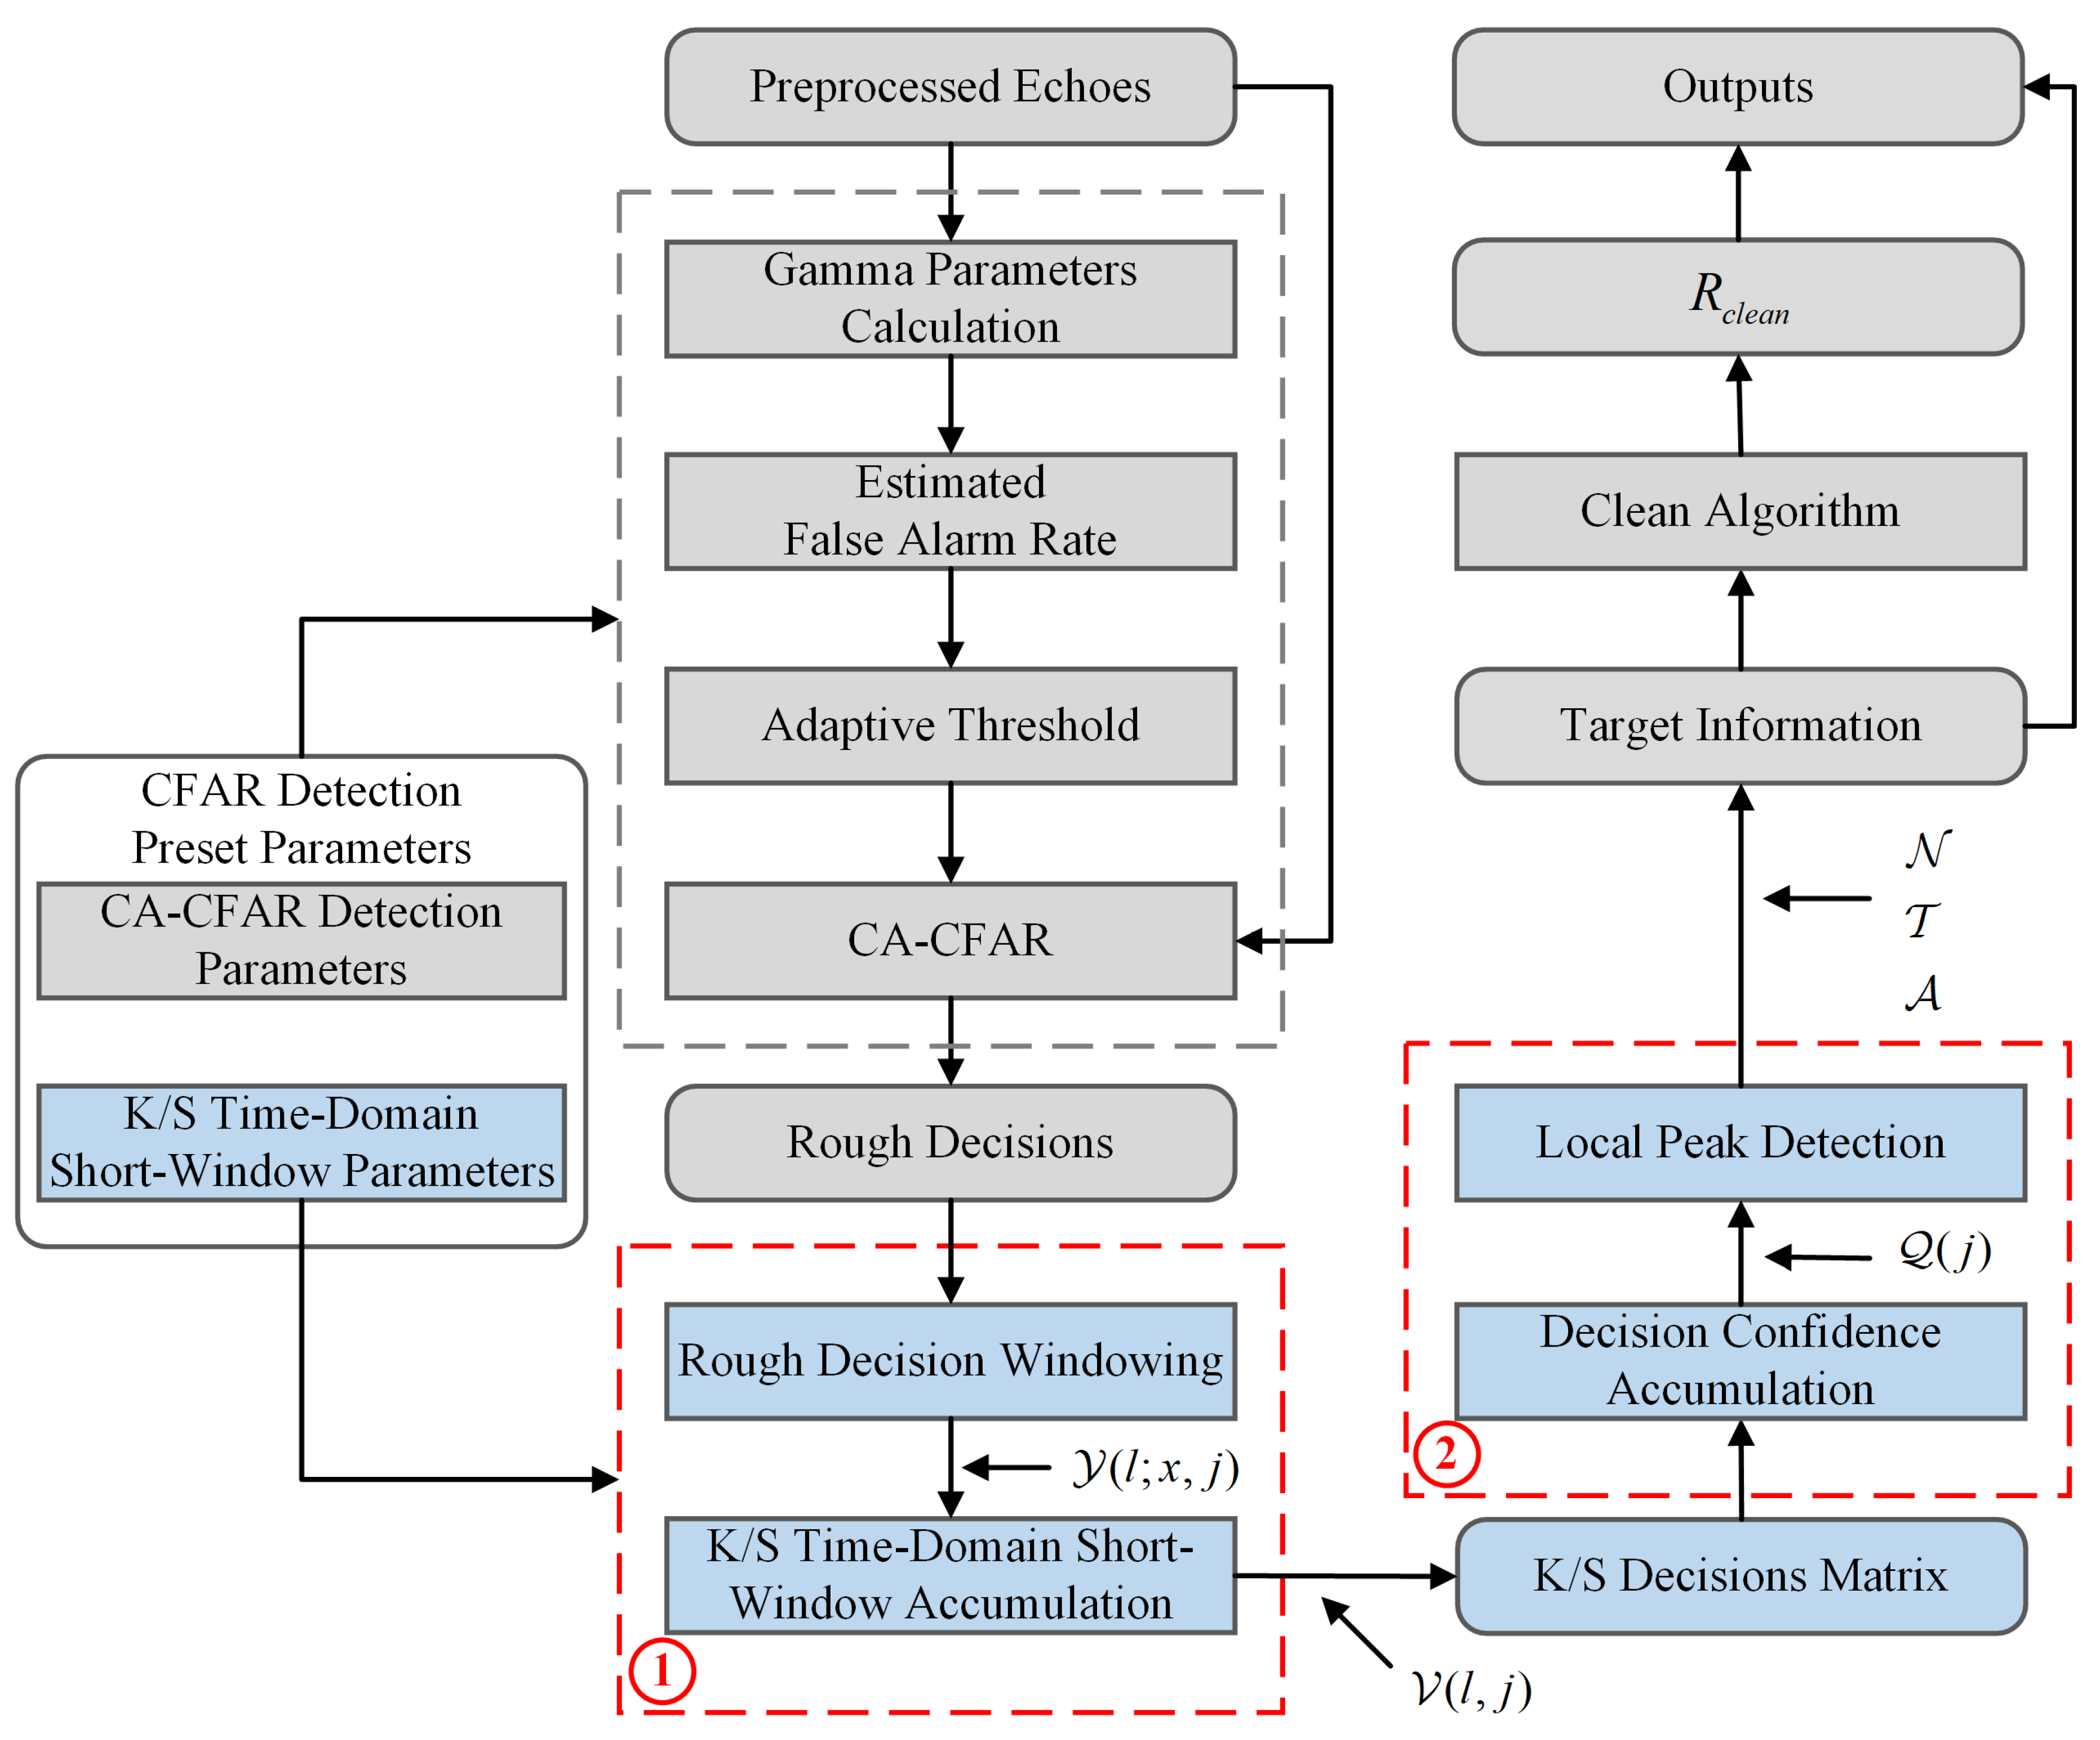
The processing logic of the proposed method in this article is shown in
Figure 4 with number 1 and 2 in red color indicating the first and second step. With the analysis of the monitoring model, the actual echoes are mainly a composition of first reflections of human targets, first reflections of the wall, SRTs, noise, and other higher-order reflections. First, we introduce linear fitting and filtering [
30] to suppress the displacement of the nonchest wall within a specific range cell to maintain the time-varying information of the target respiratory activity.
Then, we obtain the rough target detection decision through MCA-CFAR with an adaptive threshold technique after preprocessing [
31]. By analyzing the energy distribution characteristics of the environmental channel, one of the threshold components T is used to eliminate interference from stationary backgrounds. When obtaining the mean threshold component Z, the window parameters can be adjusted to introduce the parameters of the direct reflections and SRTs. Due to the power difference caused by factors such as the reflecting angle attenuating the SRTs, there will be a distinction in the estimated threshold between the direct reflections and the SRTs in one rough detection procedure, and the positive detection of the SRTs will be reduced. Similarly, the high-order reflections and noises can also be eliminated in this procedure by evaluating the clutter distribution in each range cell through the two threshold components of the preset window.
After the rough decisions, the first step in the processes of decision windowing and decision accumulation is called decision windowing and accumulation (DWA), which is the time-domain short-window accumulation by windowing and accumulating the rough decisions from MCA-CFAR to suppress segments of false detections by SRTs and the close-range target reflection interference from cardiopulmonary activities. In such a short window, the discrepancy between the respiratory signal at the front end of the window and that at the back end is relatively small to be treated as a stable channel because of the insignificant alteration by the human respiratory activity at the very interval. Therefore, the decision package after windowing reveals the detection situation of the first reflection of targets and the SRTs by walls under approximately the same conditions. With the suppression proposed, the first step can further eliminate some false detection results of SRTs in rough detection with less positive numbers.
The second step is named peak detection via decision confidence (PDDC) and involves the processes of decision confidence accumulation and local peak detection to gain an accurate target detection result. The decision confidence is a parameter that represents the number of positive detections within the corresponding range cell after the first step. With the obtained K/S decisions matrix, it applies the local peak detection algorithm to the accumulating results of the matrix, the decision confidence , to eliminate the low-trust decisions and realize a credible interference suppression with the preset threshold. Thus, the two-step accuracy improvement is capable of acquiring accurate multitarget detection results, target number , and their range information in the radar detection range, using a local peak detection algorithm. With the obtained information, the IR of the targets could be restored based on the clean algorithm.
The MCA-CFAR algorithm and its acquisition of adaptive thresholds are explained in
Section 3.1. The two-step accuracy improvement and IR reconstruction are introduced in
Section 3.2.
3.1. MCA-CFAR and Adaptive Threshold Acquisition
The rough decision
generated by the MCA-CFAR algorithm is based on the processing of the
radar echo of the echo matrix
, where
indicates negative detection and
indicates positive detection. Through the preset CA-CFAR window length
H and the guard cell length
, the nearing processing cells of the cell under test are used to generate the mean threshold component, where
. To further estimate another threshold component
T, it was found that the gamma function can effectively describe the probability distribution of a signal amplitude [
32] as a value estimation reference. Thus, under the gamma distribution of the propagation channel in the monitoring environment, the distribution satisfies the following:
where
represents the mean value,
represents the variance of data,
represents the gamma function,
is the shape parameter of the gamma distribution that determines the shape of the distribution curve, and
is the inverse scale parameter that determines the steepness of the curve.
Considering the two outputs
and
of MCA-CFAR, the rough decisions satisfy binomial distribution. Thus, the relation between the overall false alarm rate
of the short window and the false alarm rate of each detection
satisfies the following:
where
denotes the binomial coefficients.
With the given echoes for estimating
, the threshold component
T could be obtained based on the gamma cumulative distribution function [
17]:
3.2. Two-Step Accuracy Improvement and IR Reconstruction
The details of the two-step accuracy improvement method could refer to Algorithm 1. After obtaining rough decisions using MCA-CFAR, the DWA step introduces decision windowing and short-window decision accumulation to obtain decision packages. The rough decision windowing takes advantage of the steady characteristics of human microactivities within a short window in the time domain to divide the matrix into segments along the slow time using the given short-window parameters. Additionally, to mark the target area, the short-window accumulation is applied to each segment along the slow time index to gain with the number of positive detections stored in their corresponding fast time index.
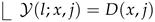
After the decision packages are acquired, the PDDC step introduces the decision confidence using the packages to estimate the reliability of the detection results. The decision confidence accumulation accumulates the decisions stored in the K/S decision matrix along the segment index to generate a number indices of each range cell and provide the value to local peak detection to estimate the target detection reliability. With the decision results
of the
judgment of time-domain short-window accumulation, the decision confidence could be expressed as follows:
where
h indicates the overall judgment times of echoes with an index of when the short-window parameter
S is given.
Then, the local peak detection is proposed to estimate the decision confidence in each range cell during target detection as follows:
where
represents the local peak detection function, revealing the local maximum sample under detection compared with the near samples, and
k is the
maximum value detected using the local peak detection function. After the peak detection process with the echo amplitude of the
target
, the target distance information
could be assessed based on a simple principle:
With the target information as the input of the clean algorithm [
33], the IR of each human target could then be restored based on the following:
where
is the restored 2D echo matrix with the IR of each human target.
| Algorithm 1: Two-Step Accuracy Improvement. |
Input: : The MCA-CFAR algorithm rough decision results of echo with j range cell, where and : The obtained radar echo matrix S: Number of successive echoes in one detection of the K/S short-window accumulation K: Number of positive detection results in a K/S short window B: The preset value of overall K/S short windows in a single detection U: The preset limitation value of the detection confidence W: The near window size of the pending value Output: Targets existence information: Targets ranging vector: Targets echo vector: Procedure: (1) Generate the K/S short window for detection. for
do (2) Decision making of the K/S short-window accumulation:
. (3) Generate the decision confidence curve if the B value is reached. (4) Decide the and using local peak-finding of based on U and W. (5) Return the target detection results , , and for the further Clean process. |
4. Experimental Setup and the Results Comparison
Considering common application scenarios, this article conducted experiments in three different environments to better illustrate and validate the accuracy of the proposed method, including open, semiopen, and indoor scenarios. The radar used for data acquisition, a single-input-single-output system developed by Central South University, realizes the data uplink with the computer through a Wi-Fi router. It is a carrier-free UWB system with three main structures, the antenna (RX and TX), the radio frequency (RF) transceiver front end, and the control and processing system. RX and TX were designed for radar signal reception and transmission, respectively. The RF transceiver front end is mainly used to transmit electromagnetic pulses and to sample the radar echoes, and it includes the transmitting and receiving antennas. The control and processing system performs the data collection and processing and hosts the main control system, which executes the commands input by the user. It operates at a central frequency of 7.29 GHz with a maximum pulse repetition frequency (PRF) of 40.5 MHz and obtained the received echo along slow time with frames per second of 20 Hz. Some significant parameters of the UWB radar could refer to
Table 1.
The introduction of the three experiments conducted is described in
Section 4.1. The processing results and performance comparison between the typical and proposed methods are presented and discussed in
Section 4.2,
Section 4.3 and
Section 4.4, respectively. The results comparison and discussion of algorithms are in
Section 4.5, and the IR reconstruction outcomes are shown in
Section 4.6.
4.1. Experiment Introduction
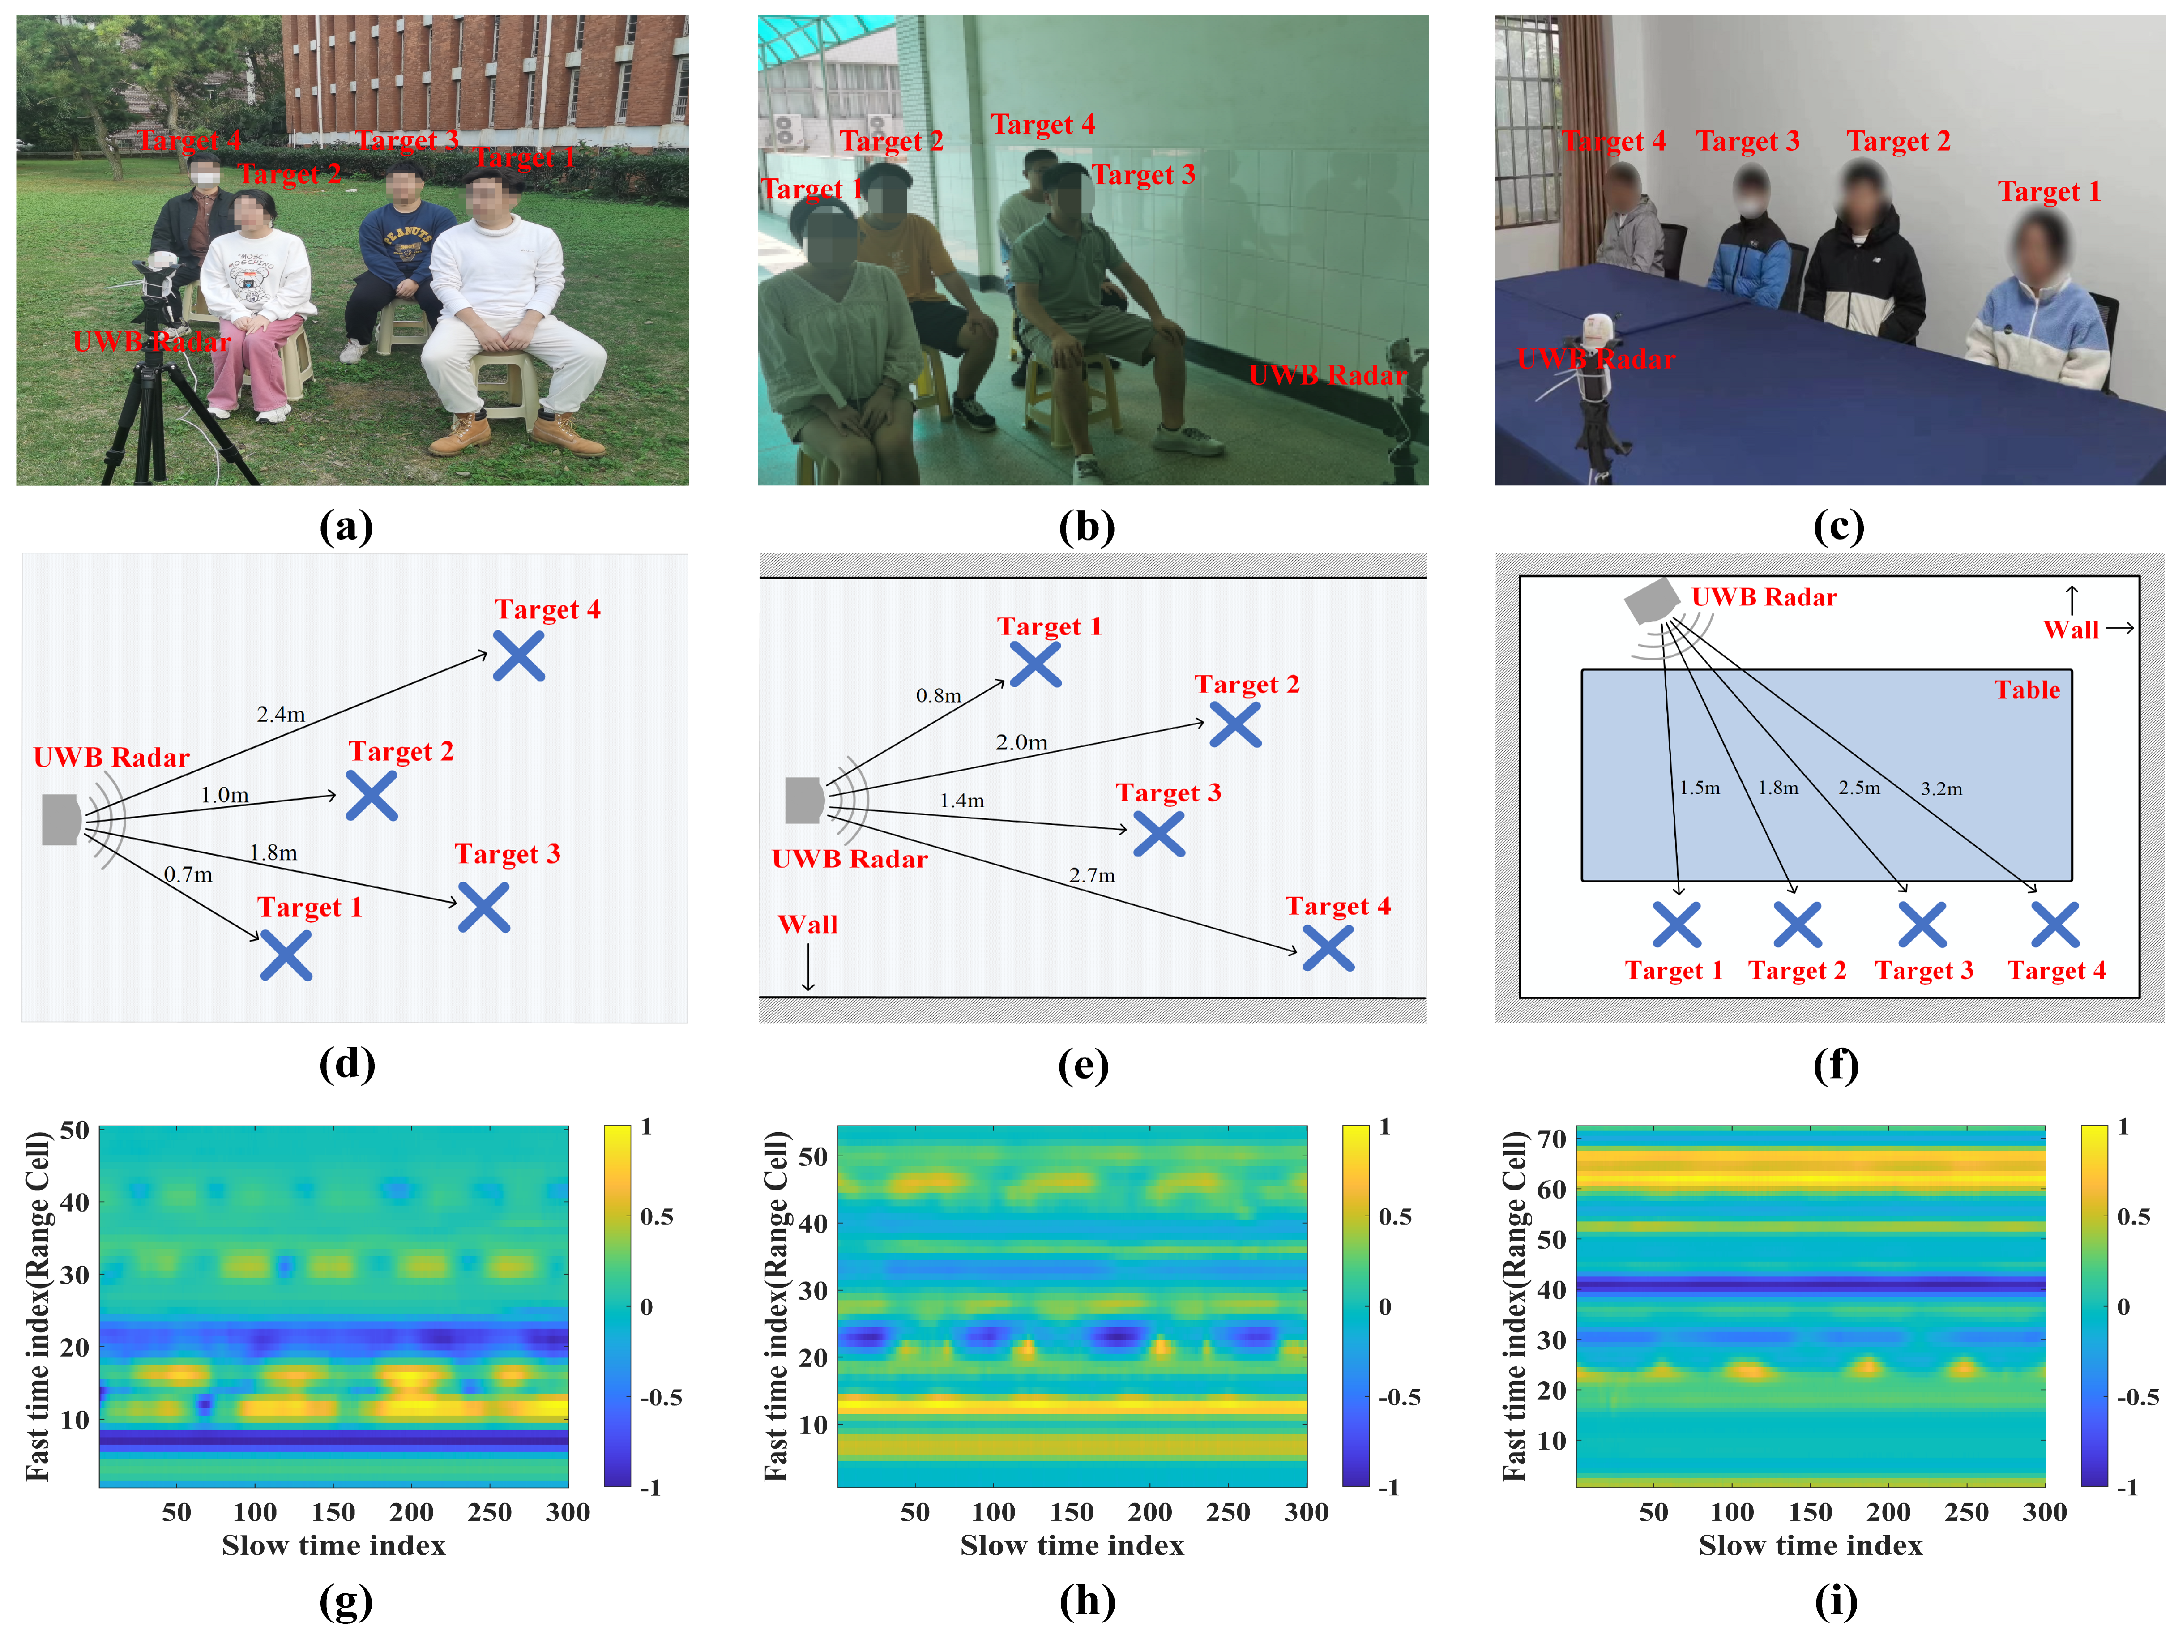
The detailed experiment setup is shown in
Figure 5, with four participants involved in each experiment, and the blue cross indicates the target location.
In the open scenario, the testing scene refers to
Figure 5a, and the location information between human targets and the radar is shown in
Figure 5d. The normalized echo matrix is shown in
Figure 5g. Without other strong reflectors in the scene, the IR of the four human targets is evident with periodic strips at each target location.
In the semiopen scenario, the testing scene is shown in
Figure 5b with the involvement of SRT-generating conditions, and the vertical view of the experiment refers to
Figure 5e with the echo matrix normalized, as shown in
Figure 5h. By comparing the experimental scene with the raw echo matrix, it can be found that the raw echo contains SRTs, such as the stripe around the 10th, 30th, and 50th range cells. Though target 4 has a far distance, his IR seems to reveal a rather strong power of echo, which is an echo composition of direction reflection of walls and target 4, leading to an overall power upraising around the near range cells.
To increase the complexity of the testing environment, we have placed the table as a common product in the applications of the indoor scenario. The testing scene is shown in
Figure 5c, and the location information between the radar and the human targets is given in
Figure 5f. The normalized echo matrix of the indoor experiment refers to
Figure 5i. By comparing the experimental scene with the raw echo matrix, it is clear that the noise and SRTs mask the reflection of targets, especially the distant ones. The respiratory strip in the time domain of targets 1 and 2 is visible from the image of the normalized echo matrix, while that of targets 3 and 4 is submerged. Thus, the reconstruction of the IR becomes necessary.
The targets labeled with the same identification in the three experiments are simply for the convenience of a discussion and do not represent the same human target. The subsequent discussion of experimental results is also based on the identification of the corresponding experimental scenario.
4.2. Experimental Results Discussion of the Open Scenario
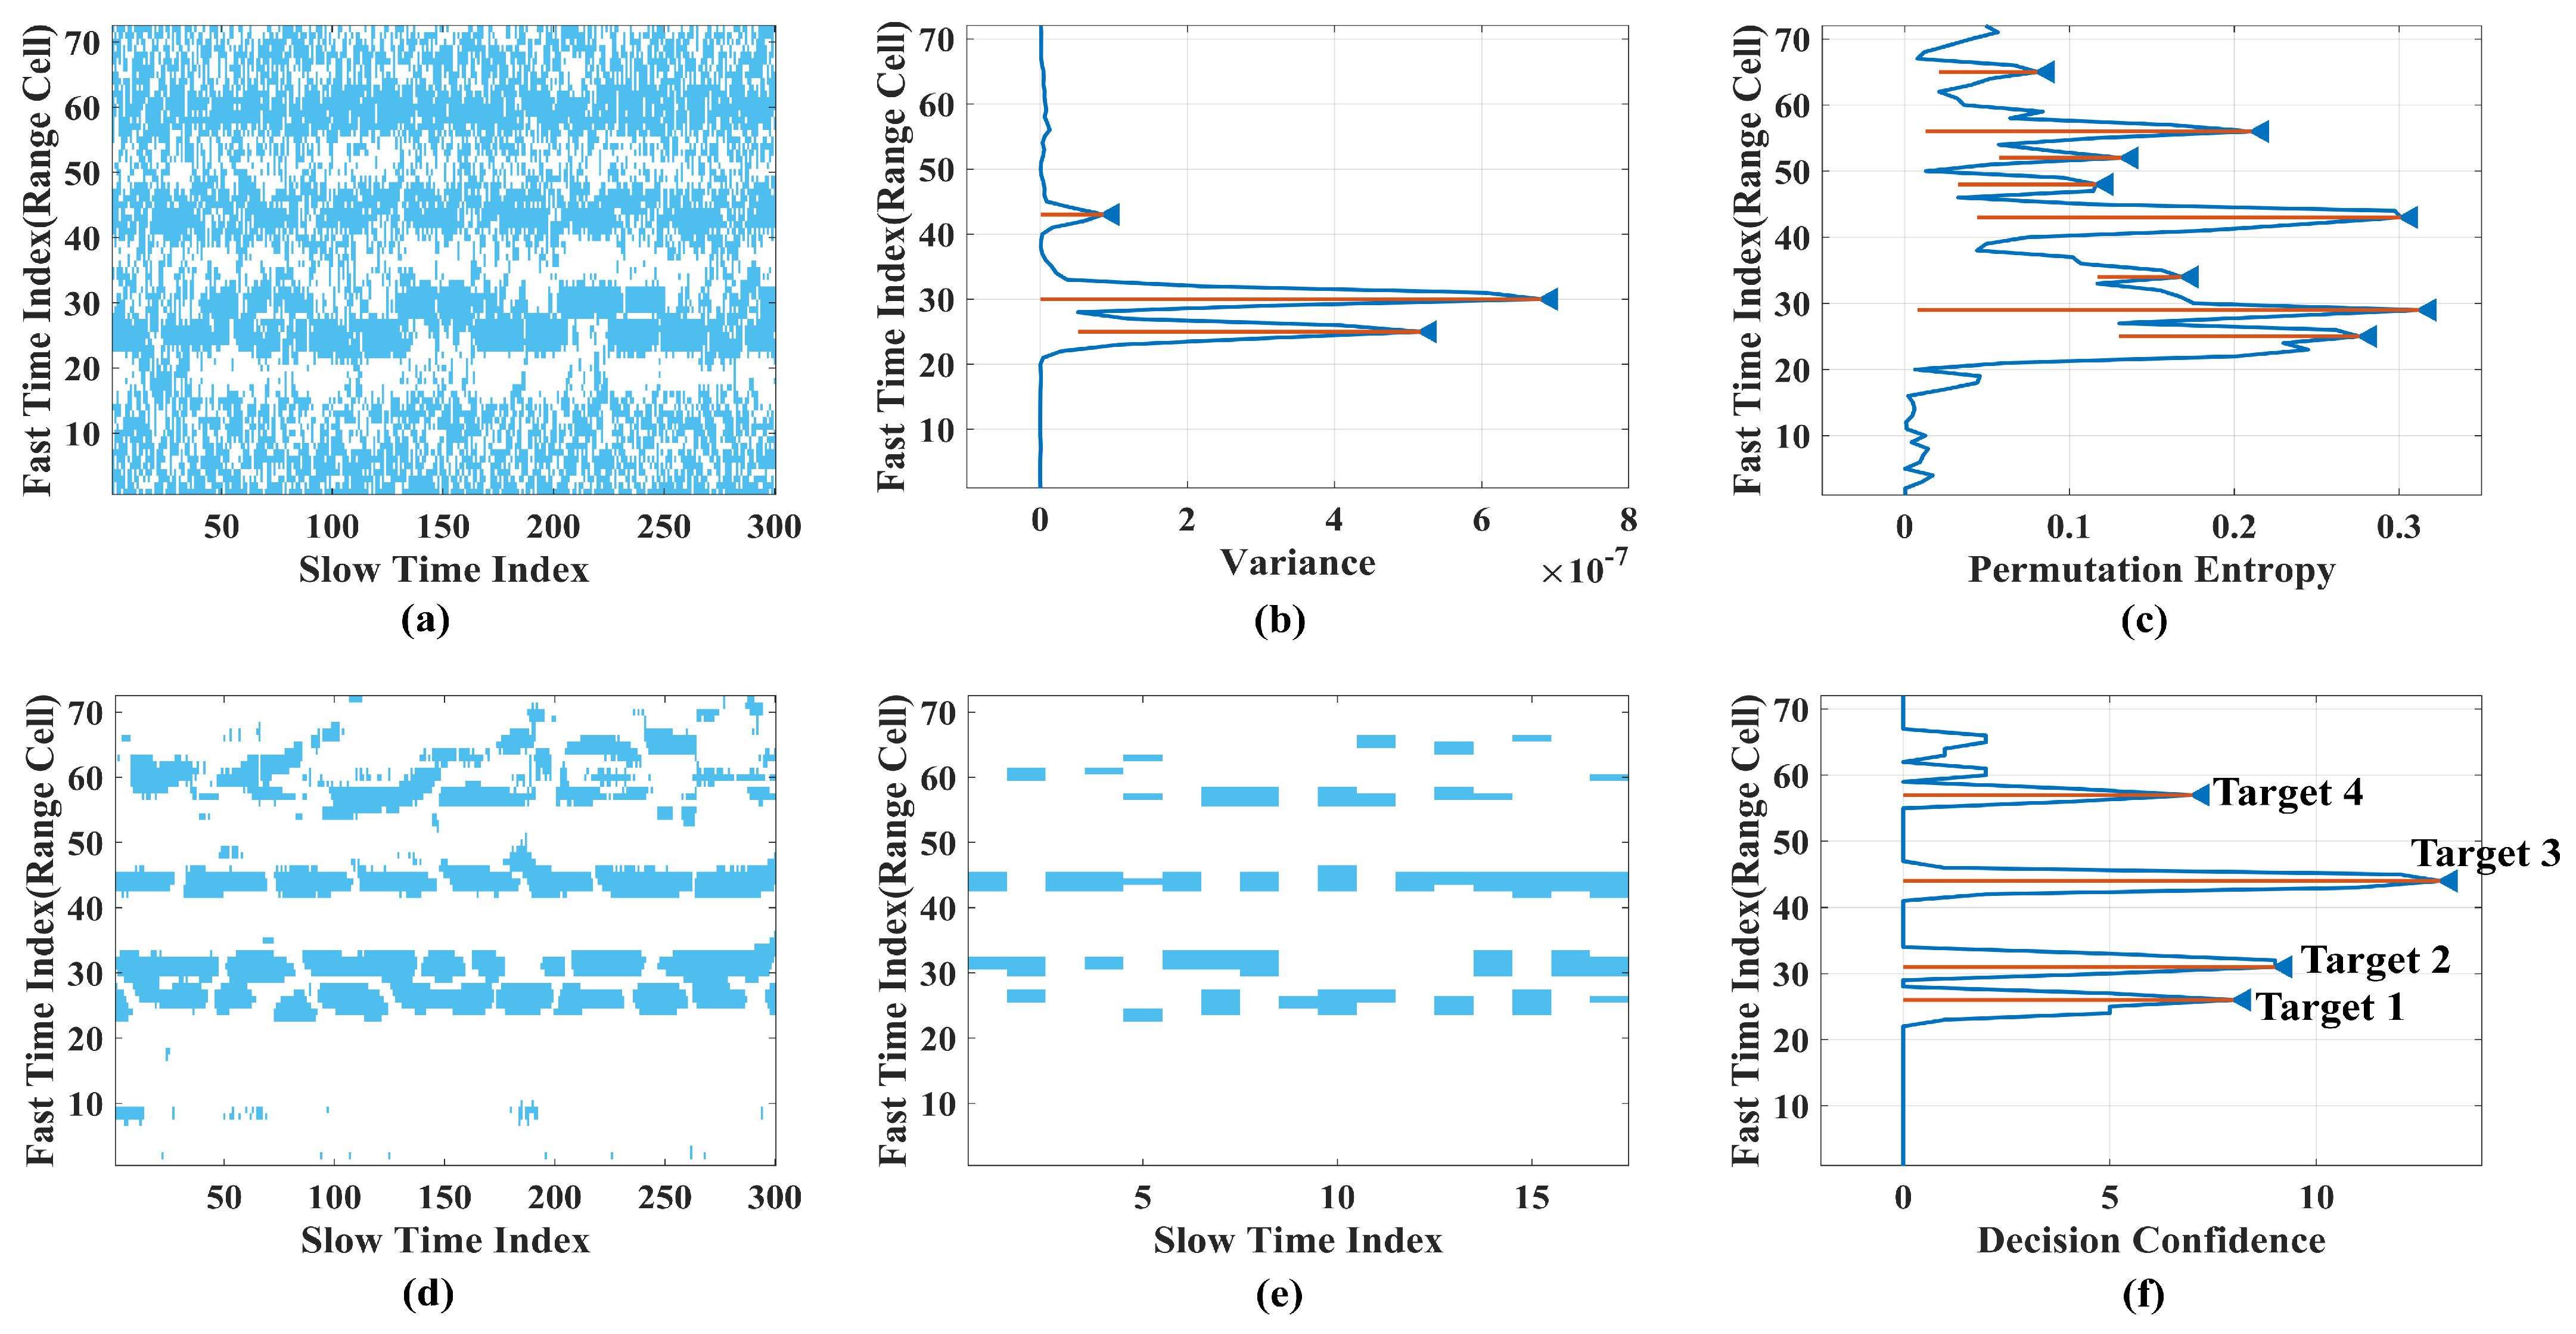
Based on the obtained echo matrix in the open scenario, we compare and discuss the results of the existing and proposed algorithms. Some typical algorithms, such as variance-based, permutation entropy (PE)–based, and MTI-energy methods, are selected with peak detection for target identification. The results of permutation entropy
is processed for clarity by
. Moreover, the CWT-based target detection method with a combination of root mean square (RMS) and excess kurtosis (EK) [
34], the PE with a clustering process based on Kmeans++ [
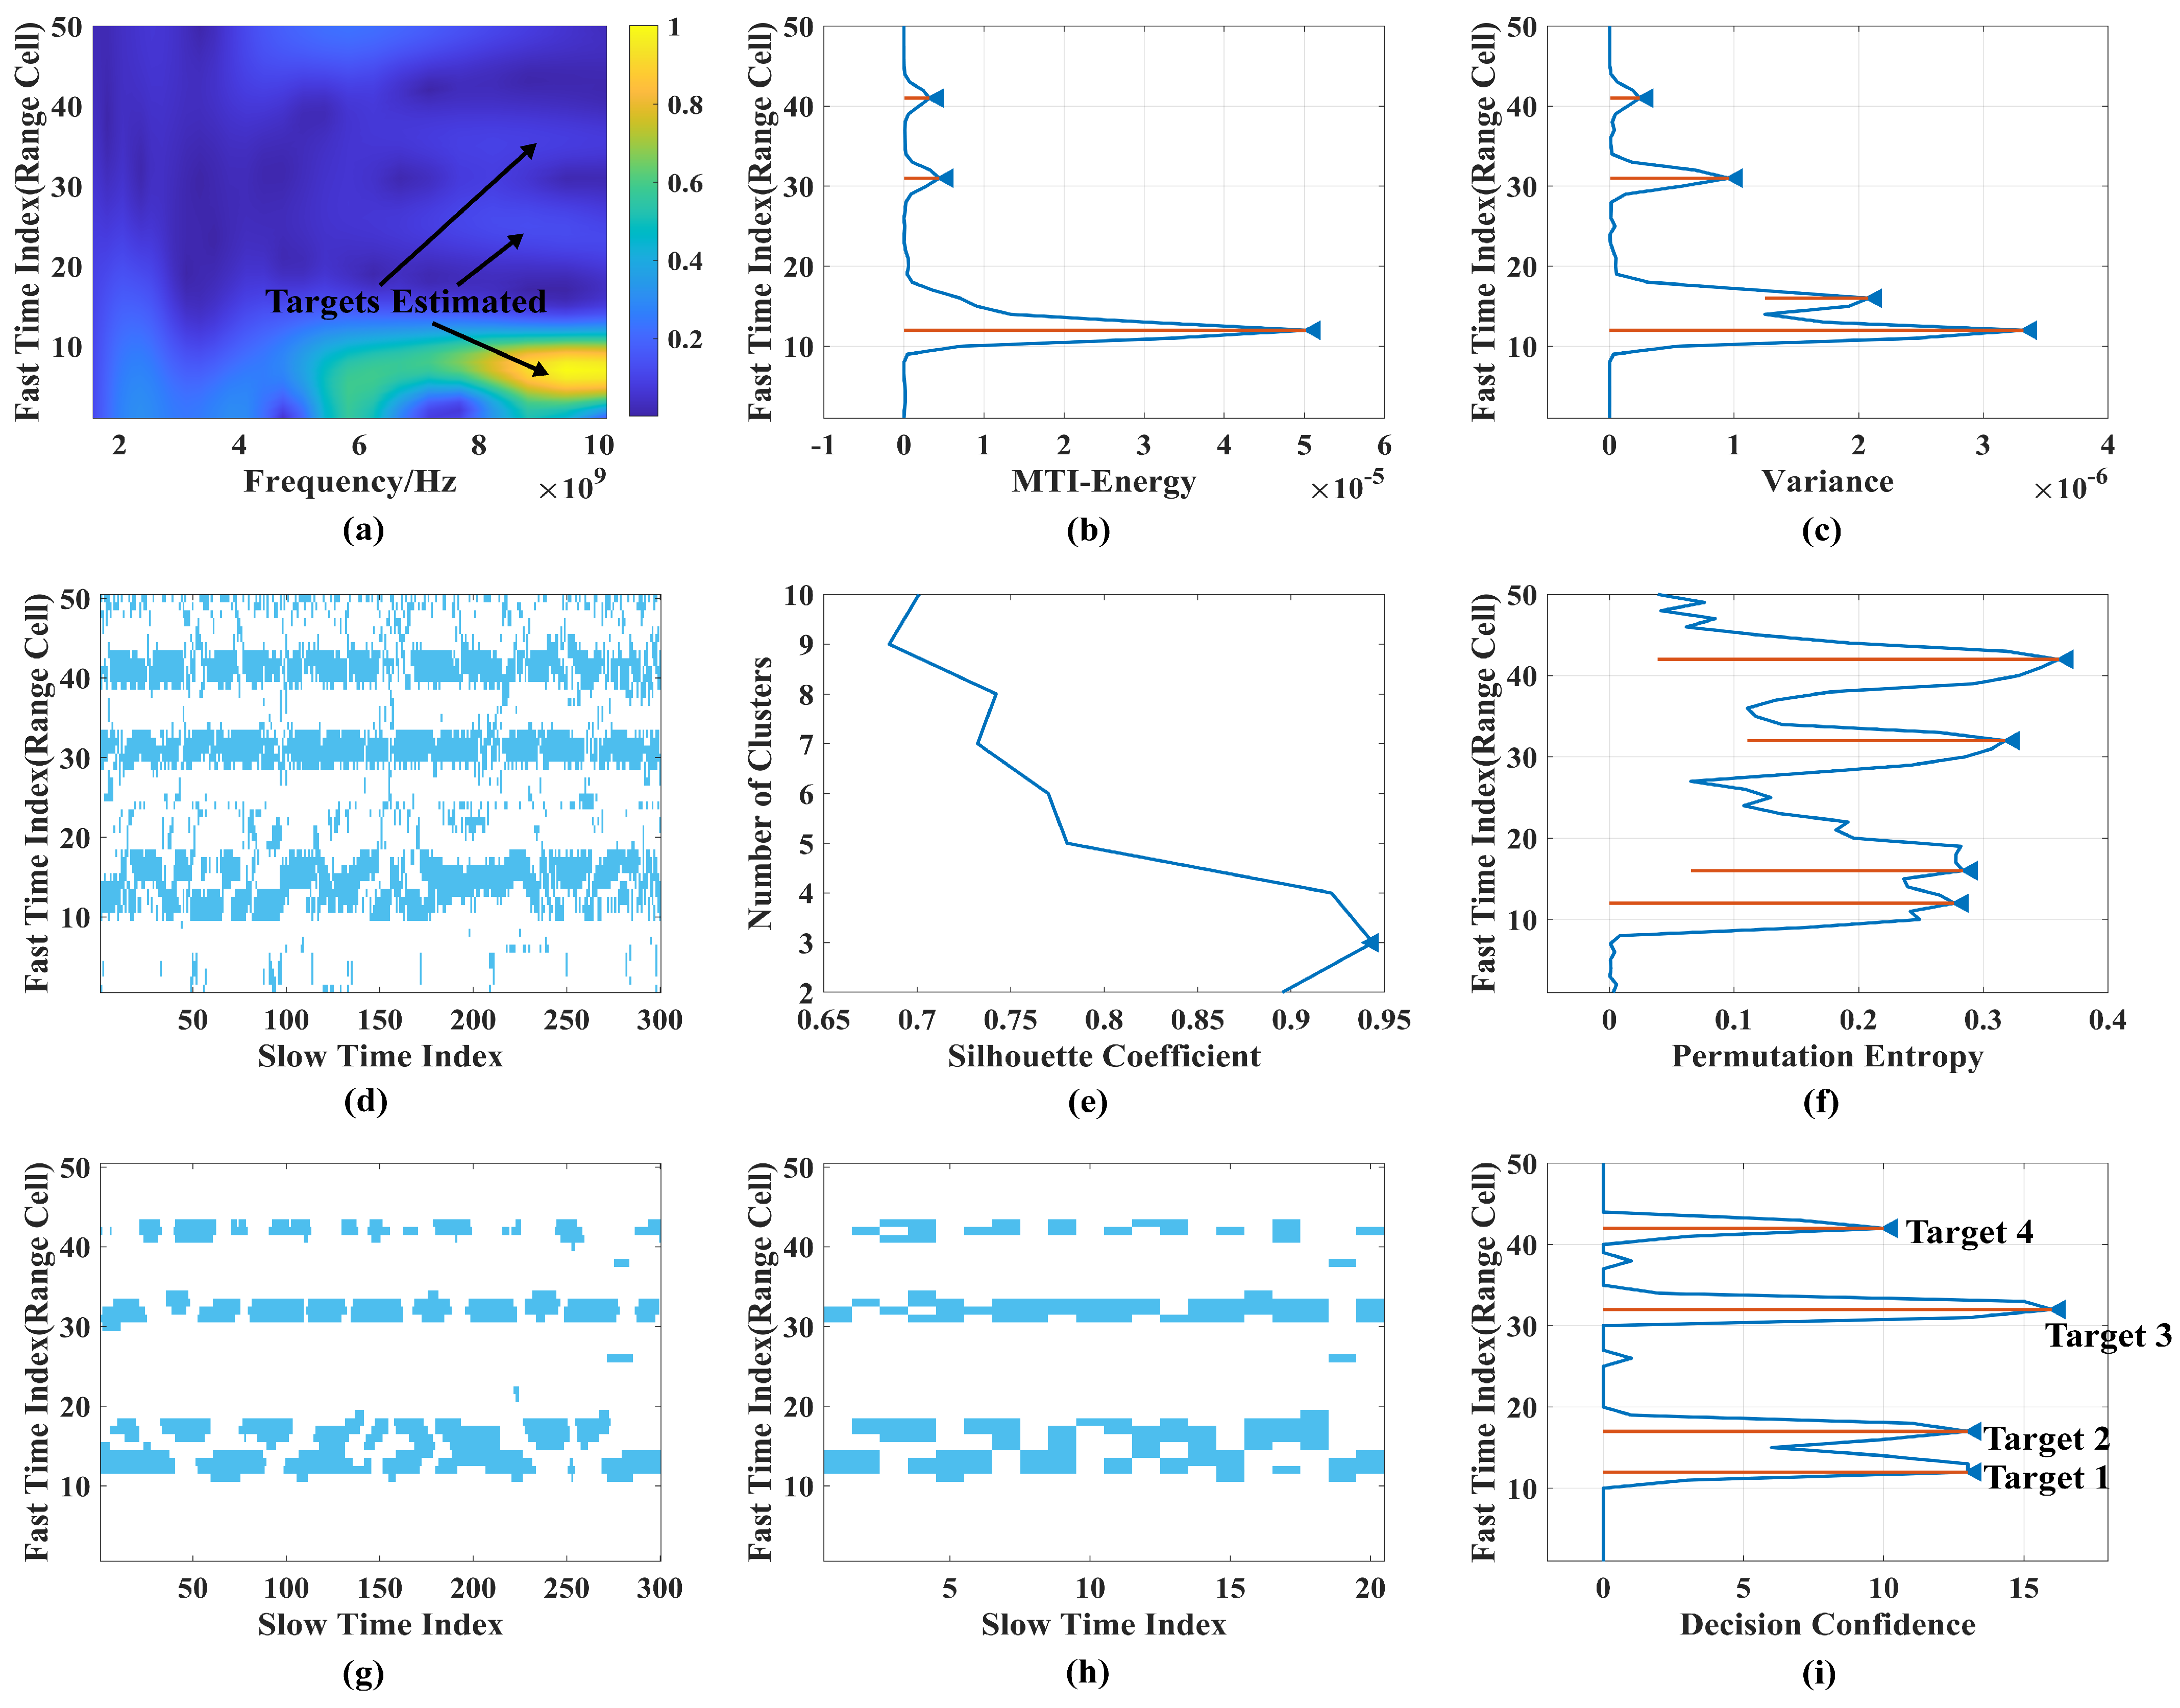
27], and the MTI-CA-CFAR target detection algorithm are compared and discussed with the proposed method in this article as well. The target detection results after data processing are shown in
Figure 6, where the blue triangle indicates the target detected by the algorithm, and the orange line indicates the distance information of the target evaluated.
A masking phenomenon occurs in the target detection process of the EK/RMS-CWT algorithm, as shown in
Figure 6a, with the detection aliasing around the 10th range cell of the two close sitting targets. The obtained EK/RMS signal with main components at the possible area of human targets is processed by CWT to generate the time–frequency results, with appeared peaks in the corresponding fast time index for target range estimation [
34]. Although bright spots can also be observed at corresponding positions, the two distant targets have a smaller magnitude than the closer targets. They are consistent with the block magnitude at the far end, which may lead to detection failure. Unfortunately, the same masking phenomenon occurs in the target detection process of the algorithm based on Kmeans++. PE-Kmeans++ uses PE after the binary process and introduces the silhouette coefficient to evaluate the clustering effect and the number of clusters [
27]. The number of clusters estimated is considered as the number of human targets, as shown in
Figure 6e. The estimation of the target number is incorrect, which indicates the possible target loss when monitoring targets with a close range using the clustering approaches based on the silhouette coefficient. Therefore, we exclude the two algorithms from further discussion.
The results of the MTI-energy method are shown in
Figure 6b. It fails to distinguish between two targets that are close in distance, and there is a specific masking phenomenon between the two energy peaks, leading to inaccurate target detection. Therefore, we abandoned the MTI-energy estimation and no longer treated it as an effective comparison in both semiopen and indoor scenarios.
Some algorithms with a desirable detection performance show their ability in multitarget detection; the variance-based algorithm with its result is shown in
Figure 6c, and the PE-based one with four peaks estimated is shown in
Figure 6f. However, the variance-based method reveals numerical attenuation with the range increasing, which might become an uncertainty requiring examination in further experiments under the SRT’s existing environment. The results of the MTI-CA-CFAR target detection algorithm, as shown in
Figure 6d, also reveal the capability of the multitarget detection with apparent band features of the four targets in the time domain. However, some false detections still exist during processing because of the interference of direct reflections between close-range targets.
Compared with the results of MTI-CA-CFAR with identical window parameters, the results of the proposed rough decision-making algorithm show an obvious advancement in dealing with the false detection issue of CA-CFAR with the results demonstrated in
Figure 6g. Then, the results of DWA are shown in
Figure 6h, with some false detection of the rough decision making suppressed. Although some false detections still exist, like around the 25th and 38th range cells, the results of PDDC reveal a successful elimination of the interference with the accurate target detection shown in
Figure 6i.
4.3. Experimental Results Discussion of the Semiopen Scenario
Based on the obtained echo matrix in the semiopen scenario, we compare and discuss the results of the existing and proposed algorithms according to a previous performance in the open scenario. The variance-based, PE-based algorithm with local peak detection and the MTI-CA-CFAR algorithm as the representative of existing algorithms are selected to compare with the proposed method in this article for their better multitarget performance. The target detection results after data processing are shown in
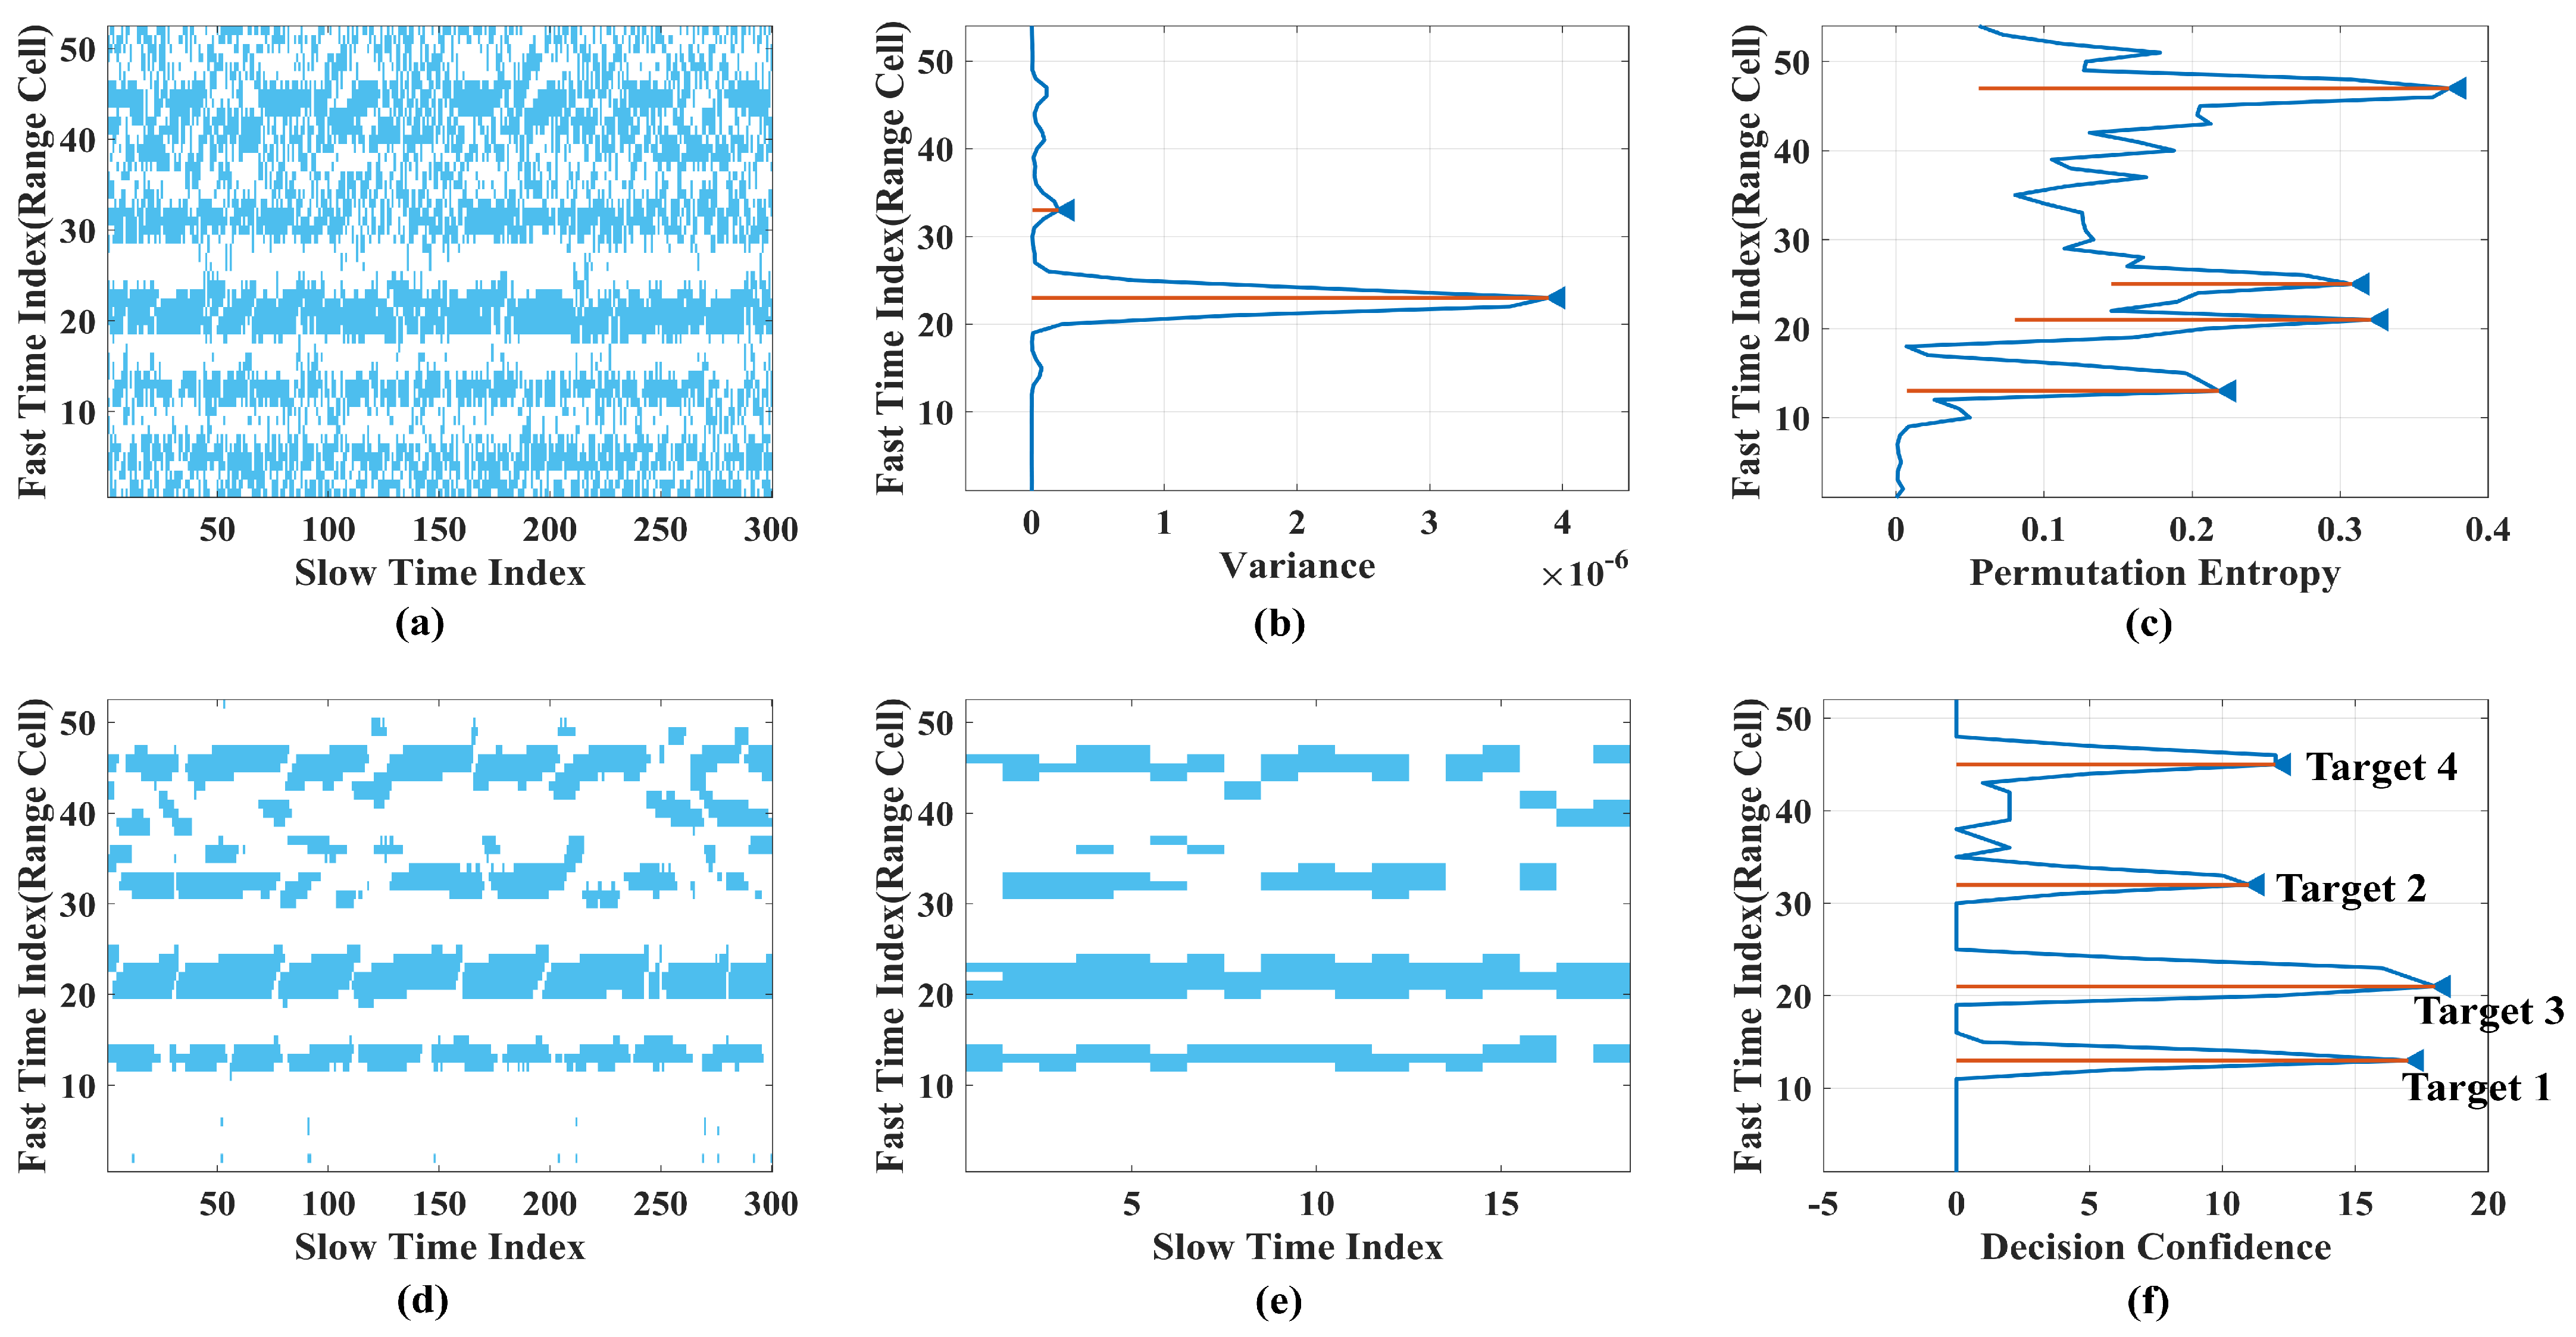
Figure 7.
As the complexity of the scene increases with target reflection interference and the SRTs involved, target detection based on MTI-CA-CFAR can still observe the band features of the four targets in the time domain, as shown in
Figure 7a. Compared with the open scenario, both the front and the far end face severe false detection problems at some time intervals, causing serious affection for the detection of the two remote targets. As predicted in
Section 4.2, the variance-based algorithm faces a loss in the detection of the far-distance targets because of the numerical attenuation with the range increasing, as shown in
Figure 7b. At the same time, target 1, which had weaker echoes due to its side detection relative to the radar, is also lost in the detection. If the preset threshold is lowered, the SRTs around the 45th range cell would be included as well. Therefore, it fails to meet the accurate monitoring requirement of a multitarget for practical applications.
The failure in accurate detection also occurs in the results of the PE-based algorithm, as shown in
Figure 7c. Due to the strong echo of target 3, there were strong fluctuations in both the front and back stages of the echo, resulting in a higher entropy value. Therefore, target 3 was judged as two targets using the PE-based algorithm. Additionally, there are multiple peaks at the far distance range cells around target 4. This indicates that the detection of the close-range targets may encounter target localization defocusing using entropy-based methods, as well as in the SRTs’ existing environment, which still requires further verification in the indoor scenario.
Compared with the results of MTI-CA-CFAR with identical parameters, the rough decisions show an obvious advancement in dealing with the false detection issue of CA-CFAR, with results shown in
Figure 7d. Then, the results of DWA are shown in
Figure 7e, with some false detection of the rough decisions suppressed. Although some false detections still exist, the results of PDDC reveal a successful elimination of the interference with the accurate target detection shown in
Figure 7f.
4.4. Experimental Results Discussion of the Indoor Scenario
Based on the obtained echo matrix in the indoor scenario, we compare and discuss the results of the existing and proposed algorithms regarding previous discussions. The variance-based, PE-based algorithm with local peak detection and the MTI-CA-CFAR algorithm are selected for a performance comparison with the proposed method in this article as well. The target detection results after data processing are shown in
Figure 8.
With strong SRTs in the indoor scenario, target detection based on MTI-CA-CFAR can still observe the band features of the four targets in the time domain, as shown in
Figure 8a. Compared with the open and semiopen scenarios, both the front and the far end face severe false detection problems, even between close-range targets. The results of far-distance targets, targets 3 and 4, are buried in the false decisions.
The variance-based algorithm also fails to detect all human targets in the scene as the alteration of reflections of far distance targets vanished in noise and SRTs with the uprising reflection of walls at the corner, as shown in
Figure 8b. The PE-based algorithm has already lost its target detection capability under a disturbance environment with interference and stronger SRTs in the indoor scenario, as shown in
Figure 8c, which is consistent with our analysis based on detection results in
Section 4.3. Due to the interference of the altering reflections between close-range targets and SRTs, PE-based methods exhibit peaks as the interference changes, making it challenging to detect a multitarget accurately.
Compared with the results of MTI-CA-CFAR with identical parameters, the rough decisions show a clear advantage in reducing the false detection in indoor scenarios, with results shown in
Figure 8d despite part of the false detection remaining. Then, the results of DWA are shown in
Figure 8e, with some false detection of the rough decisions suppressed. Although there are still some false detections, the results of PDDC reveal an elimination of the interference using the decision confidence with the accurate target detection results shown in
Figure 8f.
4.5. Results Comparison and Discussion of Algorithms for Target Detection
In order to realize a comprehensive performance comparison, the metrics estimating the target detection accuracy have been introduced to the prestage and the final results. In the prestage, the performances of the rough decisions obtained by CA-CFAR and MCA-CFAR are assessed based on two proposed indices, target detection rate and false detection rate, considering the identical preset false alarm rate of the two algorithms.
The target detection rate (TDR) is generated using the number of positive detections in the actual target existence area along the slow time of the rough decision matrix and the overall indices in the area along the slow time. This could be used to estimate the actual target detection accuracy of CFAR in the time domain. The TDR is calculated as follows:
where
and
is the actual target number in the detection area.
The false detection rate (FDR) is generated using the number of positive detections in the target nonexistence area and the overall indices in that area along the slow time of the rough decision matrix. This could be used to estimate the false detection of multitargets in the detection area of the radar in the time domain. The FDR is calculated as follows:
where
.
In the final result comparison, the performance of each algorithm is assessed based on the indices of the target detection accuracy rate (TDAR), which is estimated using the correct detection number of human targets
q by the algorithm and the actual target number in the detection area of the radar. It could be calculated as follows:
The values of each algorithm assessed by the three metrics in three scenarios are listed in
Table 2. It is clear that the TDR of the two algorithms under three different scenarios is approximate with under 3% difference, revealing the capability of the target detection performance in the target existence area. However, an interesting distinction could be found if comparing the FDRs of the two algorithms. With even less FDR, MCA-CFAR is proved to be effective in generating a rough decision for the further two-step process. The comparison between the target detection accuracies of the algorithms also reveals the same conclusion as discussed in the previous subsections using figures. The proposed algorithm shows an improved accuracy in both semiopen and indoor scenarios with a successful detection of all existing human targets in the detection area.
4.6. Results of Clean Algorithm for IR Reconstruction Based on Target Detection
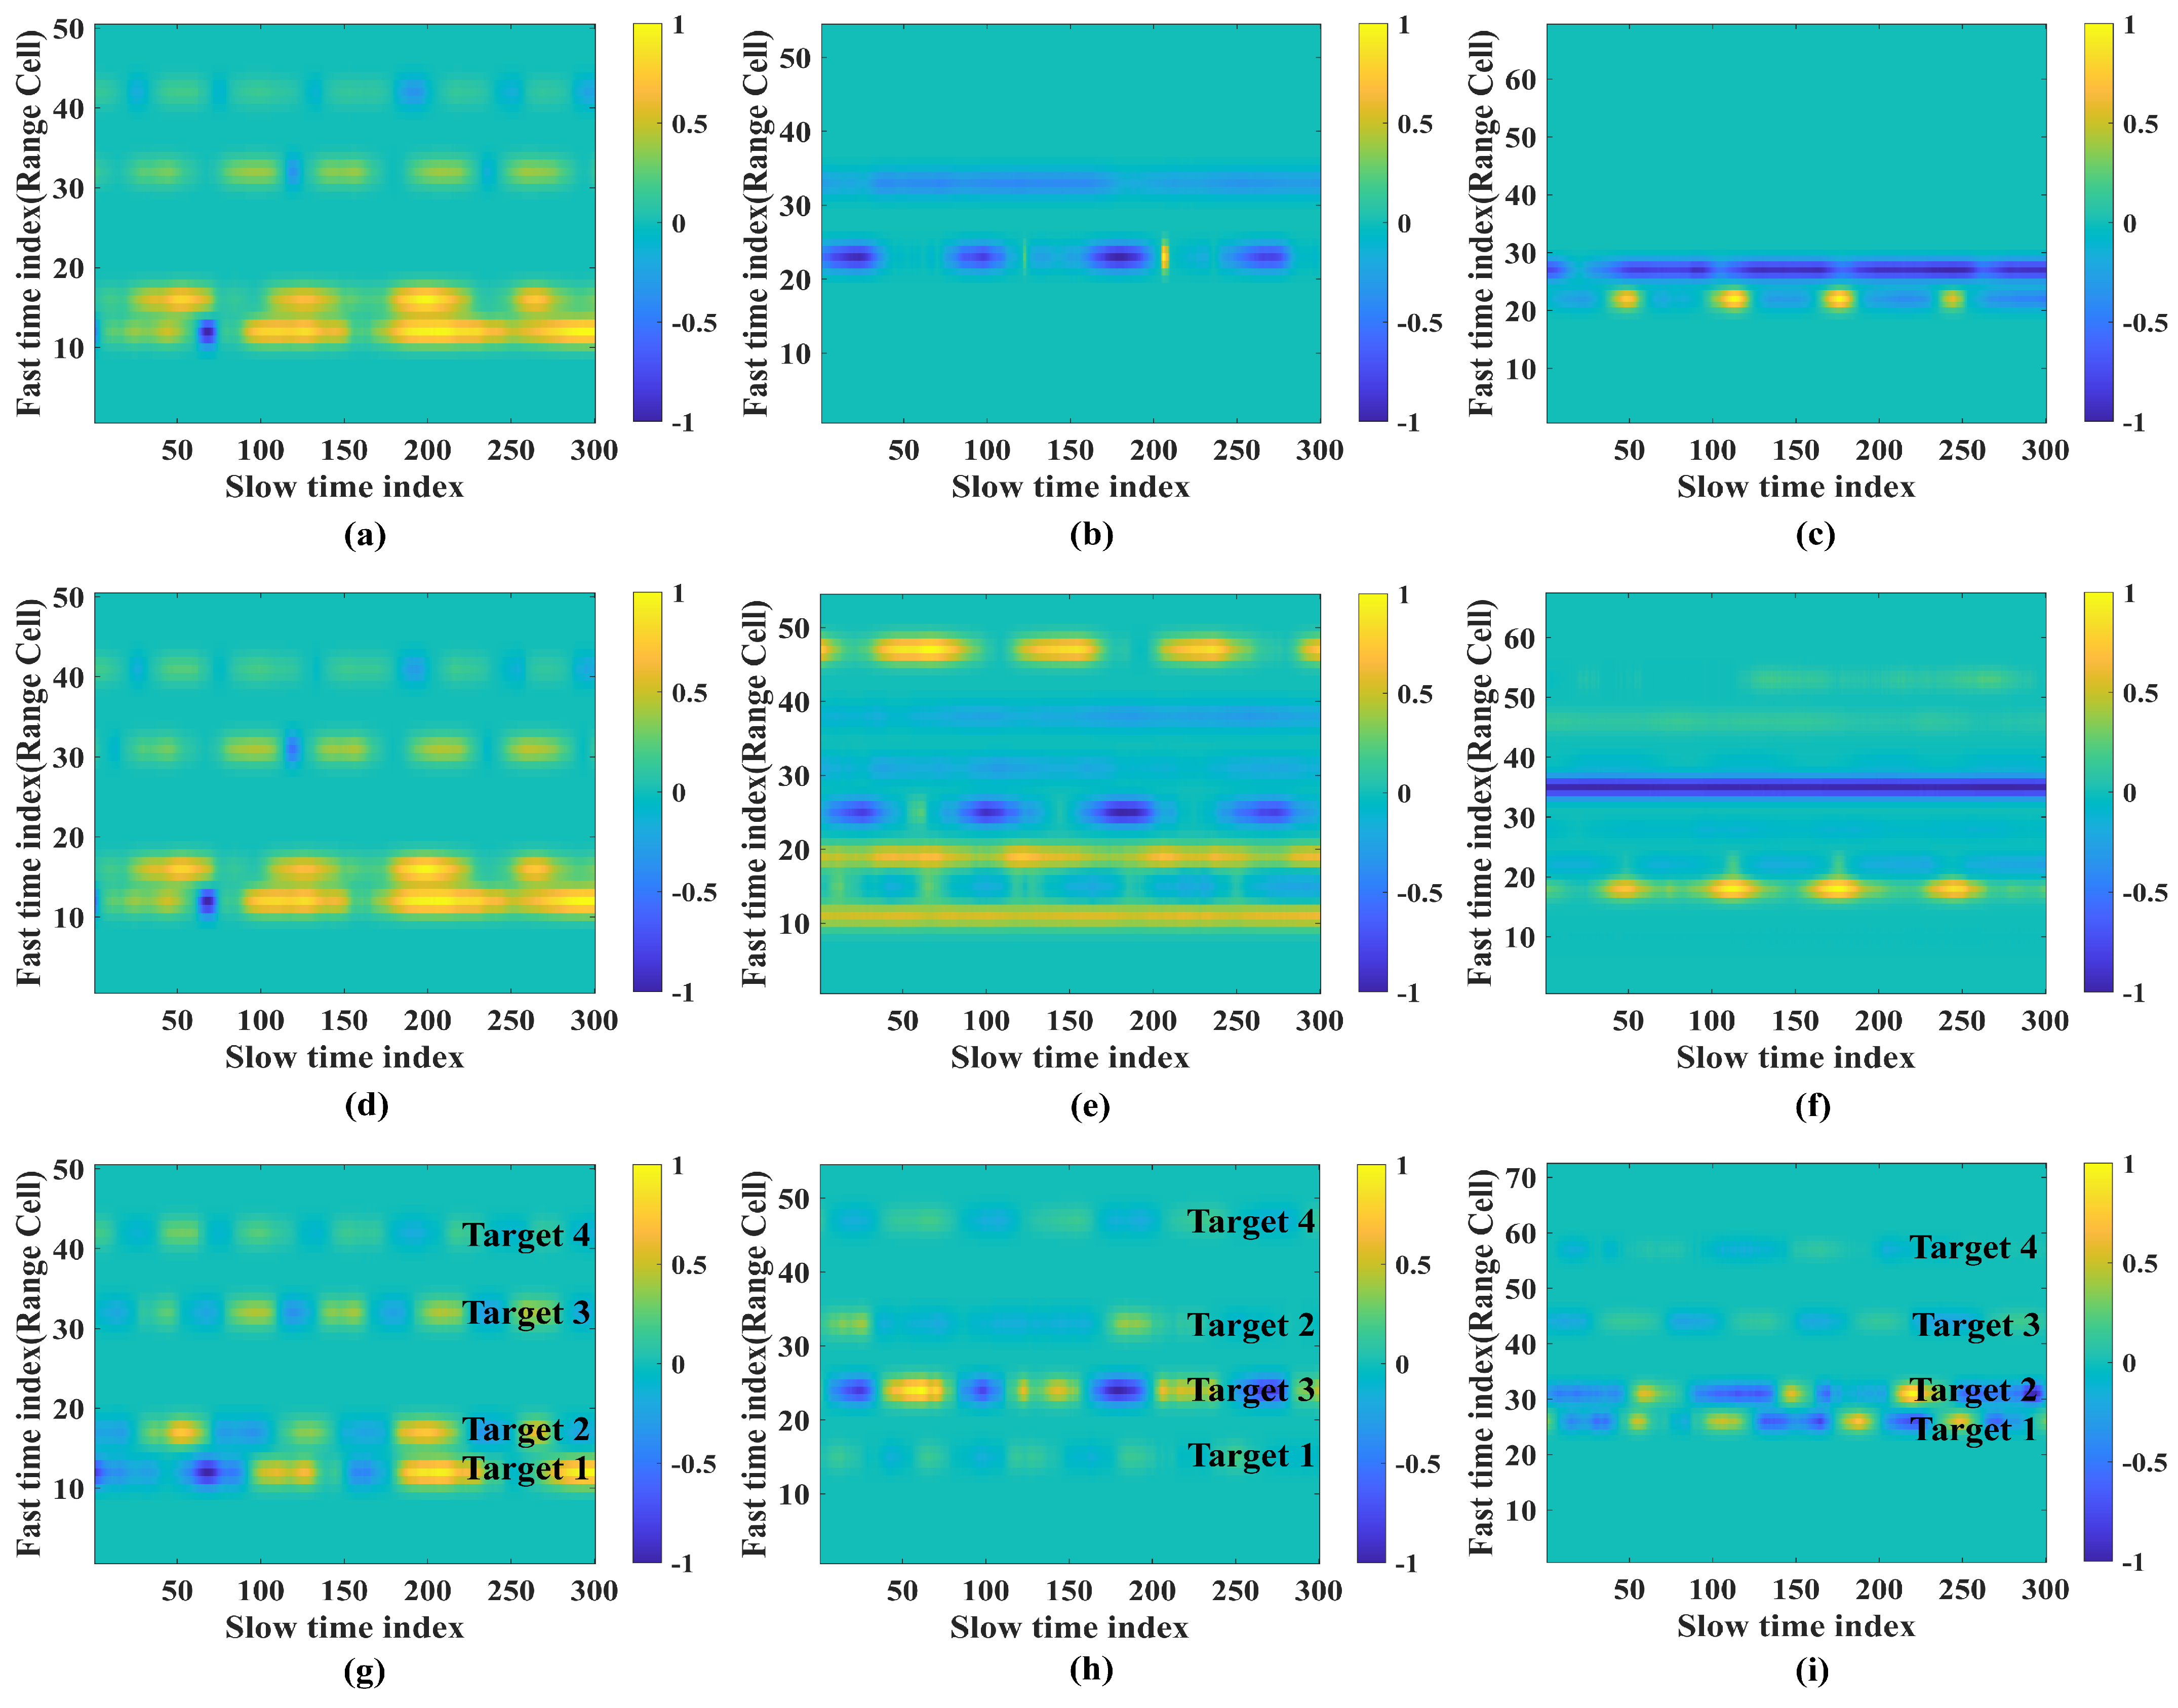
Based on the accurate target detection results obtained, the clean algorithm can be used to reconstruct the IR of each target, providing more accurate data for further usage. Two of the algorithms with preferable results in target detection, the variance-based and the PE-based, are introduced to the comparison of IR reconstruction.
The IR images based on the detection results of four human targets in the open scenario can be referred to in
Figure 9, with an IR reconstruction image of the variance-based algorithm shown in
Figure 9a, the PE-based algorithm shown in
Figure 9d, and the proposed one shown in
Figure 9g. Compared with the image of the normalized echo matrix shown in
Figure 5g, the results show regularity and consistency in the IR of each target. Although the three algorithms all realize the IR imaging, the details of IR reconstruction after the proposed algorithm also improved after the linear fitting and filtering in the preprocessing stage. Such improvements also occur in the comparison of the other two scenarios.
The IR images of the variance-based algorithm based on the detection results of four human targets in the semiopen scenario are shown in
Figure 9b, that of the PE-based in
Figure 9e, and that of the proposed in
Figure 9h. With the three IR images and the detection results in
Section 4.3, only the results of the proposed show a match between the reconstruction and the actual IR of the target compared with
Figure 5h. Additionally, the same situation is revealed in the comparison of the IR images in the indoor scenario, with the variance-based algorithm shown in
Figure 9c, the PE-based shown in
Figure 9f, and the proposed shown in
Figure 9i. The normalized image features of the IR of target 4 in
Figure 9i are not obvious, and the periodic fluctuation bands are located near the 57th range cell with the target identification marked.
5. Conclusions
This article proposed a two-step accuracy improvement for multitarget detection using UWB radar in the indoor environment against the accuracy deterioration by the SRTs and the reflection interference between targets. It takes advantage of adaptive thresholds based on the channel distribution characteristics to gain the rough decisions of the MCA-CFAR algorithm. Then, the two-step accuracy improvement first introduces the short-window accumulation in the time domain for a primary false decision suppression and then sets the decision confidence, combining the local peak detection function to eliminate the low-trust false decision from the reliable multitarget detection. With the cascading false alarm suppression, the accurate target detection results are confirmed with the number of targets and their corresponding range cells. The IR reconstruction based on the clean algorithm becomes possible with the results. Comparing the results of different algorithms with the proposed one in this article under three different conditions, the two-step accuracy improvement for multitarget detection in complex environments shows an overwhelming performance compared with current algorithms in both semiopen and indoor environments. With the obtained accurate target detection and the clean IR results, further feature extraction of human, animal, or other objects and possible multitarget identification could be valuable subsequent research objectives.
Author Contributions
Conceptualization, J.M. and D.Y.; methodology, Z.L. and Y.J.; software, Z.L.; validation, Y.J., J.M. and B.L.; formal analysis, Z.L.; investigation, Z.L. and Y.J.; resources, B.L.; data curation, Z.L. and J.M.; writing—original draft preparation, Z.L.; writing—review and editing, Y.J. and J.M.; visualization, Y.J.; supervision, D.Y. and J.M.; project administration, B.L.; funding acquisition, B.L. All authors have read and agreed to the published version of the manuscript.
Funding
This research was supported by the National Natural Science Foundation of China (grant number 62171475) and supported in part by the National Key Research and Development Program of China (grant number 2021YFC3090401).
Data Availability Statement
The data that support the findings of this study are available from the corresponding author, J.M., upon reasonable request. The data are not publicly available due to privacy or ethical restrictions.
Conflicts of Interest
The authors declare no conflicts of interest.
References
- Ali, M.; Elsayed, A.; Mendez, A.; Savaria, Y.; Sawan, M. Contact and Remote Breathing Rate Monitoring Techniques: A Review. IEEE Sens. J. 2021, 21, 14569–14586. [Google Scholar] [CrossRef]
- Jenssen, R.O.R.; Jacobsen, S.K. Measurement of Snow Water Equivalent Using Drone-Mounted Ultra-Wide-Band Radar. Remote Sens. 2021, 13, 2610. [Google Scholar] [CrossRef]
- Lv, Z.; Zhang, X.; Chen, D.; Li, D.; Wang, X.; Zhao, T.; Yang, Y.; Zhao, Y.; Zhang, X. The Development and Progress of the UWB Physical Layer. Micromachines 2023, 14, 8. [Google Scholar] [CrossRef] [PubMed]
- Chen, Z.; Xu, A.; Sui, X.; Wang, C.; Wang, S.; Gao, J.; Shi, Z. Improved-UWB/LiDAR-SLAM Tightly Coupled Positioning System with NLOS Identification Using a LiDAR Point Cloud in GNSS-Denied Environments. Remote Sens. 2022, 14, 1380. [Google Scholar] [CrossRef]
- Chen, J.; Li, M.; Yu, H.; Xing, M. Full-Aperture Processing of Airborne Microwave Photonic SAR Raw Data. IEEE Trans. Geosci. Remote Sens. 2023, 61, 5218812. [Google Scholar] [CrossRef]
- Mohd Ali Lee, R.; Daim, T.J. IR-UWB Radar Sensor for Fine Human Motion Detection. Int. J. Integr. Eng. 2020, 12, 1–110. [Google Scholar] [CrossRef]
- Chen, J.; Yu, H. Wide-beam SAR autofocus based on blind resampling. Sci. China Inf. Sci. 2023, 66, 140304. [Google Scholar] [CrossRef]
- Masiero, A.; Toth, C.; Gabela, J.; Retscher, G.; Kealy, A.; Perakis, H.; Gikas, V.; Grejner-Brzezinska, D. Experimental Assessment of UWB and Vision-Based Car Cooperative Positioning System. Remote Sens. 2021, 13, 4858. [Google Scholar] [CrossRef]
- Yan, K.; Xia, Z.; Wu, S.; Liu, X.; Fang, G. Through-Floor Vital Sign Imaging for Trapped Persons Based on Optimized 2-D UWB Life-Detection Radar Deployment. IEEE Antennas Wirel. Propag. Lett. 2022, 21, 39–43. [Google Scholar] [CrossRef]
- Liang, Z.; Xiong, M.; Jin, Y.; Chen, J.; Zhao, D.; Yang, D.; Liang, B.; Mo, J. Non-Contact Human Vital Signs Extraction Algorithms Using IR-UWB Radar: A Review. Electronics 2023, 12, 1301. [Google Scholar] [CrossRef]
- Qiao, L.; Li, X.; Xiao, B.; He, M.; Bi, X.; Li, W.; Gao, X. Learning-Refined Integral Null Space Pursuit Algorithm for Noncontact Multisubjects Vital Signs Measurements Using SFCW-UWB and IR-UWB Radar. IEEE Trans. Instrum. Meas. 2022, 77, 8506013. [Google Scholar] [CrossRef]
- Yang, D.; Zhu, Z.; Zhang, J.; Liang, B. The Overview of Human Localization and Vital Sign Signal Measurement Using Handheld IR-UWB Through-Wall Radar. Sensors 2021, 21, 402. [Google Scholar] [CrossRef] [PubMed]
- Wang, P.; Li, Q.; Yin, P.; Wang, Z.; Ling, Y.; Gravina, R.; Li, Y. A convolution neural network approach for fall detection based on adaptive channel selection of UWB radar signals. Neural Comput. Appl. 2023, 35, 15967–15980. [Google Scholar] [CrossRef]
- Chen, M.; Yang, Z.; Lai, J.; Chu, P.; Lin, J. A Three-Stage Low-Complexity Human Fall Detection Method Using IR-UWB Radar. IEEE Sens. J. 2022, 22, 15154–15168. [Google Scholar] [CrossRef]
- Lv, H.; Qi, F.; Zhang, Y.; Jiao, T.; Liang, F.; Li, Z.; Wang, J. Improved Detection of Human Respiration Using Data Fusion Basedon a Multistatic UWB Radar. Remote Sens. 2016, 8, 773. [Google Scholar] [CrossRef]
- Yang, X.; Zhang, X.; Ding, Y.; Zhang, L. Indoor Activity and Vital Sign Monitoring for Moving People with Multiple Radar Data Fusion. Remote Sens. 2021, 13, 3791. [Google Scholar] [CrossRef]
- Khan, F.; Azou, S.; Youssef, R.; Morel, P.; Radoi, E.; Dobre, O.A. An IR-UWB Multi-Sensor Approach for Collision Avoidance in Indoor Environments. IEEE Trans. Instrum. Meas. 2022, 71, 9503213. [Google Scholar] [CrossRef]
- Dong, M. A Low-Cost NLOS Identification and Mitigation Method for UWB Ranging in Static and Dynamic Environments. IEEE Commun. Lett. 2021, 25, 2420–2424. [Google Scholar] [CrossRef]
- Dong, M.; Miao, M.; Qi, Y. Experimental Study on Ultra-Wideband Ranging Through Non-Homogeneous Walls. In Proceedings of the 13th International Symposium on Antennas, Propagation and EM Theory (ISAPE), Zhuhai, China, 1–4 December 2021. [Google Scholar]
- Jing, F.; Liang, J.; Wang, Y.; Chen, P. Harmonics and intermodulation products-based fuzzy logic (HIPBFL) algorithm for vital sign frequency estimation using a UWB radar. Expert Syst. Appl. 2023, 228, 120294. [Google Scholar] [CrossRef]
- Wang, P.; Zhang, Y.; Ma, Y.; Liang, F.; An, Q.; Xue, H.; Yu, X.; Lv, H.; Wang, J. Method for Distinguishing Humans and Animals in Vital Signs Monitoring Using IR-UWB Radar. Int. J. Environ. Res. Public Health 2019, 16, 4462. [Google Scholar] [CrossRef]
- Le, M. Heart rate extraction based on eigenvalues using UWB impulse radar remote sensing. Sens. Actuators A Phys. 2020, 303, 111689. [Google Scholar] [CrossRef]
- Le, M.; Le, D.-K.; Lee, J. Multivariate singular spectral analysis for heartbeat extraction in remote sensing of uwb impulse radar. Sens. Actuators A Phys. 2020, 306, 111968. [Google Scholar] [CrossRef]
- Yang, Z.; Ma, C.; Qi, Q.; Li, X.; Li, Y. Applications of TVF-EMD in Vital Signal Detection for UWB Radar. J. Sens. 2021, 2021, 2136614. [Google Scholar] [CrossRef]
- Qiao, L.; Wang, Z.; Xiao, B.; Shu, Y.; Luan, X.; Shi, Y.; Li, W.; Gao, X. Spectral Unmixing Successive Variational Mode Decomposition for Robust Vital Signs Detection Using UWB Radar. IEEE Trans. Instrum. Meas. 2023, 72, 8502813. [Google Scholar] [CrossRef]
- Shen, H.; Xu, C.; Yang, Y.; Sun, L.; Cai, Z.; Bai, L.; Clancy, E.; Huang, X. Respiration and Heartbeat Rates Measurement Based on Autocorrelation Using IR-UWB Radar. IEEE Trans. Circuits Syst. II Express Briefs 2018, 65, 1470–1474. [Google Scholar] [CrossRef]
- Zhang, J.; Qi, Q.; Cheng, H.; Sun, L.; Liu, S.; Wang, Y.; Jia, X. A Multi-Target Localization and Vital Sign Detection Method Using Ultra-Wide Band Radar. Sensors 2023, 23, 5779. [Google Scholar] [CrossRef] [PubMed]
- He, M.; Nian, Y.; Xu, L.; Qiao, L.; Wang, W. Adaptive Separation of Respiratory and Heartbeat Signals among Multiple People Based on Empirical Wavelet Transform Using UWB Radar. Sensors 2020, 20, 4913. [Google Scholar] [CrossRef] [PubMed]
- Shang, X.; Liu, J.; Li, J. Multiple Object Localization and Vital Sign Monitoring Using IR-UWB MIMO Radar. IEEE Trans. Aerosp. Electron. Syst. 2020, 56, 4437–4450. [Google Scholar] [CrossRef]
- Ding, F. Least squares parameter estimation and multi-innovation least squares methods for linear fitting problems from noisy data. J. Comput. Appl. Math. 2023, 426, 115107. [Google Scholar] [CrossRef]
- Liang, Z.; Jin, Y.; Liang, B.; Mo, J. A Modified CA-CFAR Multi-human Detection Algorithm in Complex Environment Using Radar. In Proceedings of the International Conference on Electronic Engineering and Information Systems (EEISS 2024), Changsha, China, 13–15 January 2024. [Google Scholar]
- Liang, Z.; Mo, S.; Yang, D. A New Multi-Human Targets Impulse Response Extraction Algorithm Using UWB Radar. In Proceedings of the 2023 Cross Strait Radio Science and Wireless Technology Conference (2023 CSRSWTC), Guilin, China, 10–13 November 2023. [Google Scholar]
- Choi, J.W.; Yim, D.H.; Cho, S.H. People Counting Based on an IR-UWB Radar Sensor. IEEE Sens. J. 2017, 17, 5717–5727. [Google Scholar] [CrossRef]
- Dang, X.; Zhang, J.; Hao, Z. A Non-Contact Detection Method for Multi-Person Vital Signs Based on IR-UWB Radar. Sensors 2022, 22, 6116. [Google Scholar] [CrossRef] [PubMed]
Figure 1.
Human target detecting model using radar in an open environment.
Figure 1.
Human target detecting model using radar in an open environment.
Figure 2.
Target detecting model with SRTs under the indoor condition.
Figure 2.
Target detecting model with SRTs under the indoor condition.
Figure 3.
Problem description: (a) test scene with one human target; (b) normalized echo matrix obtained.
Figure 3.
Problem description: (a) test scene with one human target; (b) normalized echo matrix obtained.
Figure 4.
The processing flow of the two-step accuracy improvement for multitarget detection.
Figure 4.
The processing flow of the two-step accuracy improvement for multitarget detection.
Figure 5.
Experiment setup: (a) experimental scene in the open environment, (b) experimental scene in the semiopen environment, (c) experimental scene in the indoor environment, (d) schematic diagram of the open scenario, (e) schematic diagram of the semiopen scenario, (f) schematic diagram of the indoor scenario, (g) normalized echo matrix of the open scenario, (h) normalized echo matrix of the semiopen scenario, (i) normalized echo matrix of the indoor scenario.
Figure 6.
Results of different multitarget detection algorithms in the open scenario: (a) EK/RMS-CWT, (b) MTI-energy, (c) variance-based, (d) MTI-CA-CFAR, (e) PE-Kmeans++, (f) PE-based, (g) MCA-CFAR, (h) DWA, (i) PDDC.
Figure 6.
Results of different multitarget detection algorithms in the open scenario: (a) EK/RMS-CWT, (b) MTI-energy, (c) variance-based, (d) MTI-CA-CFAR, (e) PE-Kmeans++, (f) PE-based, (g) MCA-CFAR, (h) DWA, (i) PDDC.
Figure 7.
Results of different multitarget detection algorithms in the semiopen scenario: (a) MTI-CA-CFAR, (b) variance-based, (c) PE-based, (d) MCA-CFAR, (e) DWA, (f) PDDC.
Figure 7.
Results of different multitarget detection algorithms in the semiopen scenario: (a) MTI-CA-CFAR, (b) variance-based, (c) PE-based, (d) MCA-CFAR, (e) DWA, (f) PDDC.
Figure 8.
Results of different multitarget detection algorithms in the indoor scenario: (a) MTI-CA-CFAR, (b) variance-based, (c) PE-based, (d) MCA-CFAR, (e) DWA, (f) PDDC.
Figure 8.
Results of different multitarget detection algorithms in the indoor scenario: (a) MTI-CA-CFAR, (b) variance-based, (c) PE-based, (d) MCA-CFAR, (e) DWA, (f) PDDC.
Figure 9.
IR reconstruction results by the clean algorithm of three scenarios based on the target detection results of different algorithms: (a) variance-based (open), (b) variance-based (semiopen), (c) variance-based (indoor), (d) PE-based (open), (e) PE-based (semiopen), (f) PE-based (indoor), (g) proposed (open), (h) proposed (semiopen), (i) proposed (indoor).
Table 1.
Parameters of the radar.
Table 1.
Parameters of the radar.
| Parameters | Value |
|---|
| Central Frequency | 7.29 GHz |
| Bandwidth | 1.4 GHz |
| Equivalent Sampling Rate | 23.328 GS/s |
| Frames per Second | 20 Hz |
| Maximum Pulse Repetition Rate | 40.5 MHz |
| Maximum Detection Range | 9.9 m |
Table 2.
Result comparison of algorithms in three scenarios.
Table 2.
Result comparison of algorithms in three scenarios.
| | | Open Scenario | Semiopen Scenario | Indoor Scenario |
|---|
| | | TDR | FDR | TDR | FDR | TDR | FDR |
| CA-CFAR | 46.07% | 31.23% | 46.55% | 49.93% | 52.13% | 51.67% |
| MCA-CFAR | 47.9% | 4.86% | 45.11% | 7.76% | 49.68% | 6.71% |
| | | Open Scenario | Semiopen Scenario | Indoor Scenario |
| | | TDAR |
| EK/RMS-CWT | 75% | - | - |
| MTI-Energy | 75% | - | - |
| PE-Kmeans++ | 75% | - | - |
| Variance-based | 100% | 50% | 75% |
| PE-based | 100% | 75% | 50% |
| Proposed | 100% | 100% | 100% |
| Disclaimer/Publisher’s Note: The statements, opinions and data contained in all publications are solely those of the individual author(s) and contributor(s) and not of MDPI and/or the editor(s). MDPI and/or the editor(s) disclaim responsibility for any injury to people or property resulting from any ideas, methods, instructions or products referred to in the content. |
© 2024 by the authors. Licensee MDPI, Basel, Switzerland. This article is an open access article distributed under the terms and conditions of the Creative Commons Attribution (CC BY) license (https://creativecommons.org/licenses/by/4.0/).


