Abstract
This paper presents a forward modeling method for the scattering center (SC) model of dynamic ships on time-varying sea surfaces, tailored for remote sensing and target-recognition applications. Grounded in ship hydrodynamics, the methodology delineates ship movements amidst fluctuating waves, harnessing computer graphics to integrate ship–sea geometries across diverse temporal instances. Utilizing the four-path model, the composite scattering effects are segregated into distinct ship and sea contributions, along with their mutual interactions. Augmented by high-frequency electromagnetic principles, the paper quantifies and deduces SC parameters, culminating in a 3-D parameterized SC model for complex maritime targets. Unlike conventional inverse methods, this approach employs a “cause-to-effect” forward strategy, establishing clear links between SCs and local geometries, enhancing the model’s physical clarity. Using the fishing ship as a case, this research compared the normalized similarity index and position-matching rate between the reconstructed synthetic aperture radar (SAR) image and the simulated SAR image. The results indicate that all computed results exceeded 90%. Furthermore, a comparison was conducted between the reconstructed radar cross-sections (RCS) obtained by expanding the model within a large angular range and the simulated results. The root mean square error between the two was less than 3 dB, affirming the accuracy and effectiveness of the proposed model. Additionally, the research examines the variations in SCs during the six-degrees-of-freedom motions, providing a detailed quantitative analysis of their temporal trends in amplitude and position. In summary, this investigation furnishes an efficient and economical framework for rapid radar characterization in dynamic, variable marine environments, fostering advancements in remote sensing and maritime target identification.
1. Introduction
Research on the electromagnetic (EM) scattering characteristics of dynamic ships on time-varying sea surfaces is a crucial topic in the fields of radar target detection and remote sensing, driving continual advancements in maritime target detection and recognition technologies [1,2,3,4,5,6,7,8,9,10,11]. Despite certain advancements in EM scattering simulation algorithms [12,13,14,15,16,17,18], they remain confined to providing simulated data on target EM scattering characteristics, which only reflect the overall scattering properties of the targets. However, target identification requires a focus on the scattering data of various parts and the underlying “information” behind them. Unfortunately, these critical details are often lost during the synthesis process, making the extraction of target information extremely challenging and inadequate for addressing the complex demands of target identification. Additionally, the current development of simulation algorithms does not fully align with target feature-extraction techniques, implying that a significant amount of valuable data fails to translate into practical target-recognition and intelligence-gathering capabilities. Consequently, deepening the extraction techniques for the scattering characteristics of maritime ships has emerged as an urgent issue in the current research domain.
In high-frequencies, the scattering of an electrically large target can be well approximated as the aggregate response of individual scattering centers (SCs) [19]. The SC model succinctly and rationally characterizes the EM scattering properties of targets, finding extensive applications in Synthetic Aperture Radar Automatic Target-Recognition (SAR ATR) systems. Stemming from profound physical mechanisms, the SC, as a representation of EM scattering, encapsulates intricate details of target structures [20,21,22,23,24,25,26,27,28,29,30,31,32].
The modeling approaches for SCs primarily bifurcate into forward and inverse methodologies. Traditional inverse approaches commence from measured or simulated radar echo data, extracting SC parameters through parameter-estimation and inversion-optimization techniques. However, the intrinsic nature of inverse methodologies leans towards parameter estimation, leading to models that lack explicit physical interpretations and insufficiently capture targets’ feature information [20,21,22,23,24,25]. Researchers from the Electromagnetic Engineering Laboratory (EEL) at Wuhan University, led by He [26,27,28,29,30], introduced a forward-modeling approach based on geometric models for parameterizing SCs at the component level of complex targets. Grounded in high-frequency theories, this method delineates SCs in a forward manner, quantifying their scattering contributions, and deduces model parameters based on the EM principles and target geometries. By imposing physical constraints to mitigate the ambiguity of scattering sources, the model’s determinacy is bolstered. The parameterized model, along with its parameters, exhibits a robust correspondence with the local structures of the target. This approach concurrently offers insights into both the overall and component-wise scattering data of targets, revealing the concealed structural details behind them. The parameter values of the SCs serve as representations of these details in the realm of EM scattering. Leveraging the forward modeling approach for SCs, a method intertwining SAR target recognition with geometric contour features was proposed, culminating in a hierarchical SAR ATR system [31]. Through the lens of the parameterized forward modeling approach for SCs, a meticulous analysis of the composite scattering from stationary ship targets on calm seas was conducted [32].
However, the aforementioned studies primarily focus on stationary targets, overlooking the profound stochasticity of time-varying sea surface and the implications of varying ship orientations on the distribution characteristics of SCs. Consequently, these investigations remain in their nascent stages, insufficient to furnish authentic radar target-recognition systems with comprehensive and invaluable insights or technical support. In real-world scenarios, characterized by dynamic and complex target environments on time-varying sea surfaces, the application of forward modeling confronts three pivotal challenges. Firstly, the dynamic oscillations induced by oceanic waves inevitably affect maritime targets. Addressing this, the formulation of a parametric model tailored to the evolving characteristics of ship orientations stands as a formidable hurdle in the current domain. Secondly, the intricate EM couplings between the sea surface and ships introduce non-trivial influences on target properties, necessitating the incorporation of coupled scattering between the target and the sea surface. Lastly, given the pronounced stochastic nature of time-varying sea surfaces, the acquisition of robust scattering features mandates a consideration of their statistical attributes. Thus, to ascertain a SC model imbued with authentic physical interpretations under such multifaceted conditions and to offer effective technical foundations for remote sensing target recognition, it becomes imperative to broaden the scope of forward-modeling research to encompass dynamic and complex targets on time-varying sea surfaces.
In light of these considerations, this paper introduces a forward-modeling approach tailored for dynamic and complex maritime targets on time-varying sea surfaces, with applications in remote sensing and recognition. Initially, the six-degrees-of-freedom motion analysis from maritime hydrodynamics [33,34,35] is employed to elucidate the ship dynamics atop fluctuating ocean waves. Subsequently, these dynamic movements are transformed into the ship’s rotational and heaving attitudes on the sea surface, leveraging Open Graphics Library (OpenGL) technology to craft an integrated ship–sea geometry model for any given moment. Integrating spatial ray tracing with the principle of multipath propagation and the four-path model [36], a forward approach is employed to dissect and discretize the overall target-scattering characteristics into numerous component-level scattering sources. These encompass independent scattering entities from both the target and the sea surface, alongside the coupled scattering emanating from their interaction. Conclusively, guided by the high-frequency EM theory, parameters such as the three-dimensional phase center (locational parameters), scattering contributions (amplitude parameters), frequency-dependent factors, and distribution widths are quantitatively derived, facilitating the construction of a parametric model for the three-dimensional SC dynamics of complex maritime targets on time-varying sea surfaces.
The modeling method proposed in this paper is compared with the SC inverse extraction method based on simulation data using large-scale fishing ships as examples. The accuracy and efficiency of the SC model are comprehensively verified using the normalized similarity index and position-matching rate, which strengthen the integrity of the research. The experimental results demonstrate that both the similarity and position-matching rate between the reconstructed SAR images and simulated images exceed 90%. Moreover, the time complexity of the forward-modeling method is significantly lower than that of traditional simulation algorithms, requiring no complex iterative optimization processes. This method can clearly separate the local structure of SCs from the target and has rich physical significance. The forward model effectively deconstructs the EM scattering characteristics of the target, facilitating the in-depth exploration of target-feature-matching information. Additionally, the reconstructed RCS obtained by expanding the forward model within a large angular range is compared with the RL-GO simulation results, both showing a root mean square error of less than 3 dB, further validating the accuracy of the proposed forward-modeling method.
To discern the impact of the pronounced stochasticity of time-varying sea surfaces on the robustness of coupled SCs, the computation processes for the coupled SC parameters are subjected to statistical analysis [37], ensuring that the modeling outcomes resonate more authentically with the actual scattering characteristics of the targets. Furthermore, this investigation delves into the nuanced variations of the SC under the comprehensive influence of the ship’s six-degrees-of-freedom motion, encompassing pitch, roll, and heave. A detailed quantitative analysis is conducted on the temporal trends of both amplitude and positional parameters, aiming to furnish insightful guidance for the recognition and application of maritime targets. The findings underscore the heightened sensitivity of the SC’s amplitude parameters to temporal variations, while the positional distribution exhibits a comparatively diminished sensitivity.
2. Forward Modeling of Scattering Centers from Dynamic Ship Targets on Time-Varying Sea Surfaces
The process for the forward modeling of SCs for dynamic targets on a three-dimensional time-varying sea surface is illustrated in Figure 1, with the detailed steps as follows:
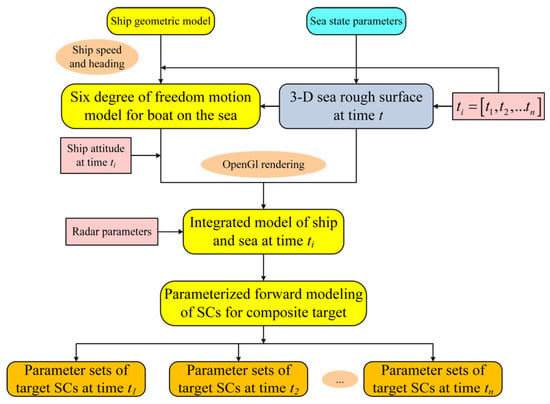
Figure 1.
Flowchart for the forward-modeling process of scattering centers from dynamic targets on time-varying sea surfaces.
- Geometric Model Acquisition: Acquire the geometric parameters of the ship, encompassing segmented surface elements and the dual-level partitioning information of its components. Additionally, gather basic simulation data including sea conditions, ship speed, and heading;
- Dynamic Attitude Calculation: Guided by the temporal sequence, utilize the imported geometric parameters. Employing the slice theory, compute the amplitude response operators. Integrate this with encountered wave spectra and a linear superposition wave model to derive the ship’s six-degree-of-freedom motions, translating them into corresponding angles, thereby estimating the ship’s posture at time . Concurrently, based on sea-condition parameters, employ a linear superposition model to generate a three-dimensional rough sea spectrum at time ;
- Model Integration: Utilize OpenGL technology to reconstruct the ship at and the sea surface into an integrated ship–sea model;
- Scattering Center Parameters Calculation: Input radar parameters such as viewing angle, frequency, and polarization. Using the ship–sea integrated model and the forward-parametric-modeling method of SCs, derive the SC parameters at time ;
- Iterative Process: Repeat Steps 2 through 4 to obtain the SC parameters for subsequent moment , continuing until the extraction of SC sets for n moments within the time sequence is complete.
2.1. Analysis of Dynamic Swinging Characteristics for Time-Varying Ship–Sea Composite Targets
According to the hydrodynamic theory, a ship, when subjected to a time-varying sea surface, is generally considered a rigid body structure with six degrees of freedom. These six degrees of freedom comprise three translational movements and three rotational movements. As depicted in Figure 2, the translational movements consist of surge along the x-axis, sway along the y-axis, and heave along the z-axis. The rotational movements include roll about the x-axis, pitch about the y-axis, and yaw about the z-axis.
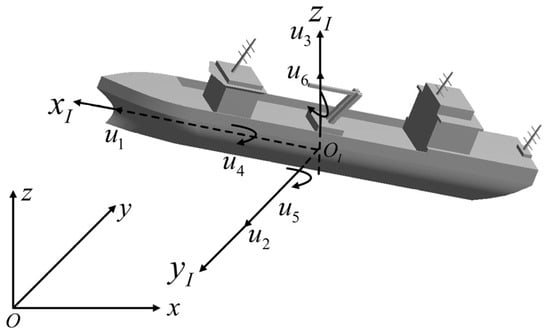
Figure 2.
Diagram of the six-degrees-of-freedom motion of the ship’s hull.
When analyzing the six-degrees-of-freedom motion of a ship, it is customary to utilize three distinct coordinate systems. These are the global coordinate system , the inertial coordinate system , and the ship-fixed coordinate system . The global coordinate system is anchored to a global Cartesian framework fixed on Earth, with its plane coinciding with the sea level. The inertial coordinate system, centered at the ship’s center of gravity, G, remains fixed on the ship and remains unaltered by the ship’s motion. The transverse axis lies on the midline plane, parallel to the reference plane; the axis points towards the bow, and the axis is oriented upwards. The ship-fixed coordinate system refers to a coordinate frame that moves with the ship’s speed, , adjusting to the ship’s motion, typically centered at the ship’s center of gravity. As the ship’s attitude changes, the ship-fixed coordinate system adjusts accordingly. The motion of the ship at any given moment can be decomposed into linear movements along the three axes originating from the ship’s center, G, and rotations about these axes.
Let the six-degrees-of-freedom motion vector in the ship-fixed coordinate system be represented as , where and are dimensional quantities measured in meters, while and denote angular quantities in radians. Based on this definition, and in alignment with Figure 2, the relationship between the inertial and ship-fixed coordinate systems can be expressed as follows:
In which,
The transformation relationship between the inertial coordinate system and the global coordinate system is illustrated in Figure 3. Here, represents the angle between the ship’s heading direction and the x-axis of the global coordinate system.
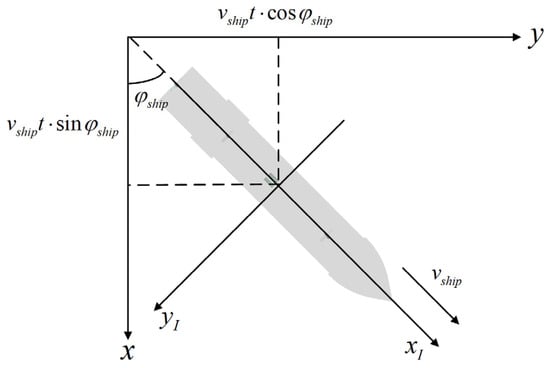
Figure 3.
Representation of ship speed and heading in the global coordinate system.
According to the generalized Newtonian laws, the linear force balance equations for a ship moving in regular waves is as follows:
Here, M represents the mass matrix, expressed as the following:
where m is the mass of the ship, denotes the ship’s center of gravity, and represents the ship’s mass moment of inertia. satisfies the following:
For ships with symmetrical mass distribution, . The variable represents the encounter frequency, defined as the following:
Here, represents the wave number, g denotes the acceleration due to gravity, stands for the angular frequency, and is referred to as the encounter angle, defined as the angle between the ship’s forward direction and the direction of wave propagation. Accordingly, the encounter spectrum is defined as the following:
represents the force amplitude exerted by water on the ship’s hull, comprising both the hydrostatic portion and the hydrodynamic components arising from ship motion, incident waves, and diffracted waves. Consequently, the fundamental motion equation is derived as the following:
Here, S denotes the restitution moment matrix of the hydrostatic component, B represents the complex added mass-moment matrix induced by the ship’s radiated force, and encapsulates the amplitude matrices of the Froude–Krylov force and the diffracted force generated by the incident and diffracted waves, respectively.
The Response Amplitude Operators (RAO) are defined as the ratio of the ship’s six-degrees-of-freedom motion vector, , to the amplitude of the incident regular wave, given by the following:
Based on the double superposition model, the elevation of a point on the rough sea surface at time t is given by the following:
Here, denotes the PM spectrum [38]. , , and signify the wave number, angular frequency, and direction angle, respectively. represents the random initial phase; and are the sampling frequency points and sampling angle points, respectively. indicates the wind-direction angle.
Utilizing the slice method [39], one can derive the response amplitude operators for waves of various frequencies and directions. According to the superposition model, the motion of a ship at a specific point on the sea surface can be viewed as being driven by waves of diverse frequencies and directions. Thus, the amplitude of the six-degrees-of-freedom motion of the ship at position and time t can be determined by the following equation,
In the computation of six degrees of freedom, understanding the ship’s parameters is paramount. These parameters encompass the center of gravity height, block coefficient, prismatic coefficient, and waterplane coefficient. Calculating these parameters necessitates knowledge of the ship’s draft, length, and breadth at the waterline, as well as the actual area of the waterplane. Figure 4 delineates the simulation process for the six-degrees-of-freedom motion atop two-dimensional waves. It meticulously establishes the dynamics of the ship based on initial boundary conditions, solves the ship’s dynamic equations using the slice theory to obtain the response amplitude operators, and then integrates these with encountered wave spectra and linear superposition wave spectra to determine the ship’s six-degrees-of-freedom motion. Ultimately, the ship’s six-degrees-of-freedom motion in waves is transformed into its pitch and heave attitudes, facilitating the construction of an integrated ship–sea geometric model for any given moment using OpenGL technology.
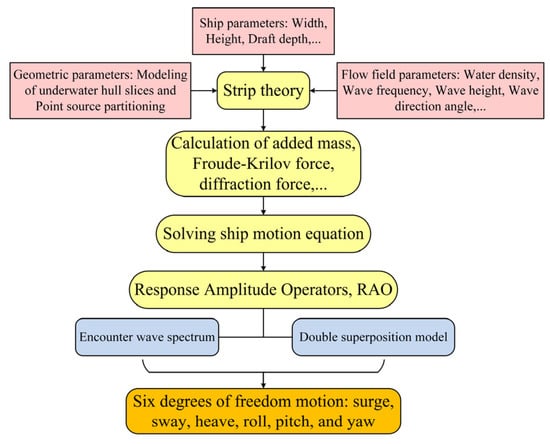
Figure 4.
Simulation workflow for six-degrees-of-freedom motion on two-dimensional waves.
2.2. Attributed Scattering-Center Model
The forward modeling approach for SCs proposed in this paper starts with the geometric model of the composite target, decomposing the target and its surface into multiple physical components. To balance the uniqueness principle of scattering mechanisms and the need for identifiable characteristics of maritime targets, a two-level partitioning method is employed to segment the ship target. Each component or structure surface is labeled with a secondary surface partitioning for differentiation. Subsequently, employing a spatial ray tracing and diversity technique based on a hybrid geometrical optics, a physical optics (GO-PO) algorithm, the paths of all rays in space are determined. Different paths classify and cluster the rays, decomposing the scattering field from the target into multiple subsets of scattering rays. The GO-PO algorithm is also utilized to compute the scattered EM field carried by each ray. The scattering contribution of each scattering source is derived from the superposition of the scattered EM fields of all rays within its subset. Based on the amplitude of the scattering field, the scattering sources are ranked, selecting dominant scattering sources as the strong SCs for the current angle. Ultimately, considering the complex scattering mechanisms and characteristics of the target, the SCs in this paper are characterized using the attributed SC model, expressed as follows:
in which and represent the angles for extracting the scattering characteristics of the target at time t. is the amplitude parameter for the i-th SC, f is the frequency of the incident wave, is the frequency of the SC, c denotes the speed of light, is the length parameter of the SC, represents the frequency-dependent factor, is the three-dimensional position vector of the SC, and denotes the azimuth of the distributed SC. If the SC is localized, ; otherwise, .
2.3. Analysis of the Four-Path Model
In high-frequency, the overall backscatter contribution originates from a collection of scattering sources formed by the target, the sea surface, and the coupling between the target and the sea surface, namely,
The total backscattering field is given by the following:
In the above expression, l, p, and q denote the numbers of scattering sources originating from the sea surface, the target, and the interaction between the target and the sea surface, respectively. Thus, the total scattering source ensemble can be represented as the union of the following three subsets:
The four-path model is illustrated in Figure 5, detailing the ray paths for various orders of scattering sources in the ship–sea integrated model. Figure 5a depicts the primary ray sets from individual target components and the multiple coupling ray sets between components. Figure 5b,c represent the secondary coupling ray sets between target components and the sea surface, respectively. Figure 5d illustrates the tertiary coupling scattering set between the sea surface and the target. Within the tertiary ray tracing, nine distinct paths can be identified:
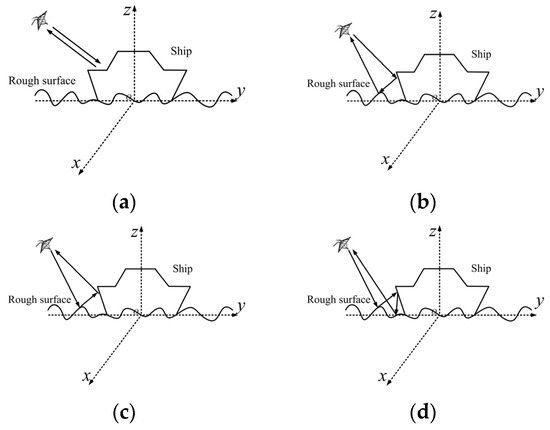
Figure 5.
Analysis of the four-path model: scattering sources in integrated ship–sea model. (a) Path 1, (b) path 2, (c) path 3, (d) path 4.
- Ship component 1 to Ship component 2 via the sea surface;
- Ship component 2 to Ship component 1 via the sea surface;
- Ship component 1 to the sea surface and then to Ship component 2;
- Ship component 2 to the sea surface and then to Ship component 1;
- Sea surface to Ship component 1 and then to Ship component 2;
- Sea surface to Ship component 2 and then to Ship component 1;
- Ship component 1 (or 2) directly to Ship component 2 (or 1) via the sea surface;
- Ship component 1 (or 2) to the sea surface and then back to Ship component 1 (or 2);
- Sea surface to Ship component 1 (or 2) and then back to Ship component 1 (or 2).
After completing tertiary ray tracing, most scenarios are successfully tracked. Among these, the first six paths are grouped as a single-ray set, representing rays interacting with both Target Component 1, Target Component 2, and the sea surface (in no order). These rays are considered the same scattering source. Conversely, rays interacting with Ship Component 1 and the sea surface, irrespective of their sequence, are categorized as another distinct scattering source. While categorizing similar scattering sets is essential, each ray still necessitates the application of the PO method to compute its respective scattering field based on its unique path. Given that most scattering ray tracing, up to three bounces, encapsulates most of the scattering processes, this research focuses exclusively on analyzing sources of scattering within the context of tertiary scattering.
2.4. Forward Computation of Scattering-Center Model Parameters
A three-dimensional attributed SC is characterized by a set of attribute parameters. The parameter set for the three-dimensional attributed SC encompasses the amplitude parameter , which signifies the amplitude of the scattered echo from the scattering structure. The frequency-dependent factor elucidates the scattering mechanism of the structure. The positional parameters denote the three-dimensional spatial or equivalent position of the scattering structure within the coordinate system. The length parameter represents the extent of the structure. The orientation parameter and the coefficient can be collectively expressed in the following form:
The forward extraction process for ship–sea SC parameterization is illustrated in Figure 6. Given the determined orientation, SC extraction frequency, and polarization conditions, spatial ray tracing and diversity techniques are employed to classify rays with similar scattering mechanisms into distinct ray subsets. For maritime ship targets, these are categorized into three primary groups: subsets resulting from direct scattering from the target structure and coupled scattering between target structures, subsets arising from direct sea-surface scattering, and subsets originating from the coupled scattering between the target structure and the sea surface. The scattering fields of these ray subsets are then computed. Based on the amplitude of the scattering fields, a set of prominent SC ensembles is identified. Subsequently, the parameter sets for these dominant SCs are forwardly deduced.
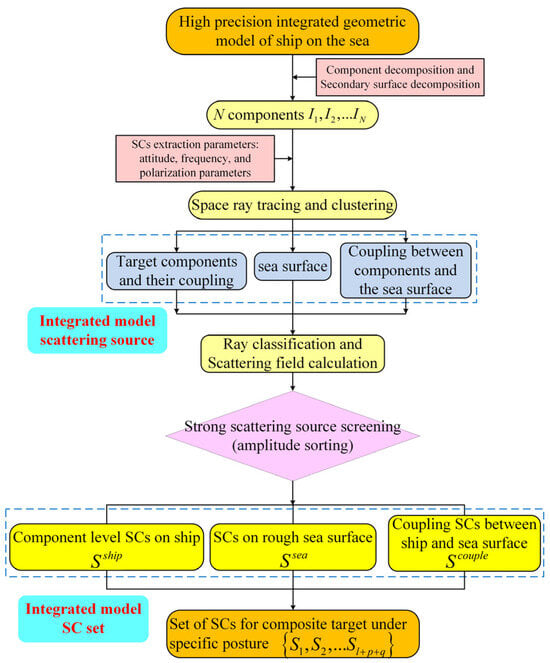
Figure 6.
Flowchart for the forward extraction of maritime ship SC parameterization.
Ref. [21] confirmed the efficacy of the automated forward-modeling approach for attributed SC parameterization in reproducing the complex EM scattering characteristics of targets such as the T72 tank. Building upon this foundation, the present research further develops a parameterization model for SCs on maritime ships over rough sea surfaces. The emphasis lies in deducing and estimating the parameter sets (position parameter r, amplitude parameter A, frequency-dependent parameter a, and distribution parameter L) corresponding to each SC, particularly focusing on interactions between ship components and the sea surface.
For individual ray paths, the position parameter is determined by calculating the effective reflection points on the ship and sea-surface elements. For ray subsets acting on ship–sea coupled components, these rays are weighted and averaged to ascertain the position of the coupled SCs. Regarding the amplitude parameter A, the echo for each ray subset is computed using the PO algorithm based on the final impacting surface. A summation of all scattering field vectors for the ray subset yields the amplitude of the coupled SC.
The frequency-dependent parameter a necessitates prior knowledge of the geometric characteristics of individual scattering structures. Geometric attributes of sea surface scattering structures are deduced based on the curvature radii of different sea segments. Once these geometric features are established, the frequency-dependent parameters for individual components are determined through reference tables, followed by selecting the minimum value for coupled regions.
Lastly, for the distribution parameter L, it is essential to identify the azimuthal endpoints of the ship–sea coupled structure. These endpoints are then projected onto an imaging plane, and the distance between the two projection points is computed. Given the inherently stochastic nature of the sea surface, individual results may exhibit excessive randomness, rendering them inconclusive. Subsequent analyses will be conducted to statistically process the SC parameters, mitigating the random variability of individual coupling results. The flowchart detailing the procedure for deducing the ship–sea coupled SC parameters and amplitude techniques is illustrated in Figure 7.
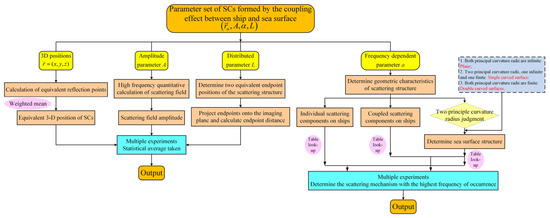
Figure 7.
Flowchart of the technique for deducing and assigning parameters of ship–sea coupled SCs.
It is undeniable that noise, such as that caused by atmospheric effects, can significantly impact radar target-detection systems. Feldman proposed a new atmospheric noise model in 1972 for the design of low-frequency navigation systems, considering the non-Gaussian nature of actual noise processes, thereby facilitating the performance analysis and optimization of receiver designs [40]. Huang et al. introduced a novel method in 2009 for speckle noise suppression and ship-target detection in SAR images, aiming to enhance the detection rate of ship targets by reducing coherent noise and employing a new detection algorithm [41]. Lu et al. presented a new technology in 2011 for ship-target recognition using Fourier Mellin transform (FMT) and a support vector machine (SVM), effectively identifying ship targets in high-resolution range profiles [42]. Wang et al. proposed a method in 2012 for measuring ship-radiated noise in shallow water and deriving source level spectra, revealing the noise levels of trailing suction hopper dredgers under different operational modes through field measurements and analysis [43]. Kellett et al. conducted a study in 2013 on the numerical prediction of ship underwater noise, using CFD methods combined with the Ffowcs Williams–Hawkings (FWH) equation for numerical simulation and validating numerical results with field measurements [44]. Pan et al. and Testa et al., respectively, introduced noise-prediction methods for atmospheric and underwater environments in 2014 and 2018, providing valuable references for ship design and optimization [45,46].
It is imperative for any research method or system to consider and mitigate the impact of such potential noise to ensure proper operation. However, current research efforts primarily focus on validating the proposed parameter forward-modeling method for dynamic ship target SCs on the time-varying sea surface. The research process is currently in the stage of basic theoretical research and validation. Our research’s definition of robustness mainly involves the distribution of target SCs in time-varying scenarios, with a focus on the changing characteristics of these SCs over time. In subsequent work, the authors will delve deeper into the impact of background noise (including noise caused by atmospheric effects) on the robustness and accuracy of the proposed model.
3. Example Analysis
3.1. Validation of the Proposed Scattering-Center Model Accuracy
This section presents the comparative experiments between the SC inverse-extraction method based on simulated data and the proposed forward-modeling method, aiming to enhance the comprehensiveness of the research. Considering that conventional target feature libraries only contain image data of targets, this research selects the normalized similarity index, representing the similarity of target structural features, and the position-matching rate, describing the coincidence of SC phase information, as two comprehensive indicators to verify the accuracy of the SC model from both the magnitude and phase aspects [27,47,48]. The detailed descriptions of these two indicators are provided below. The calculations were performed on a personal computer equipped with a Core i7 CPU and 8 GB of memory.
- (1)
- Normalized Similarity Index
Target structural features are crucial aspects of SAR-target recognition. In this research, the normalized similarity index, representing the similarity of target structural features, is utilized to validate the accuracy of the parameterized model. The similarity between the reconstructed SAR image using the parameterized model and the measured image feature vectors f and g is defined as follows:
where represents the pixel grayscale value at row x and column y of the reconstructed SAR image, denotes the pixel grayscale value at row x and column y of the measured or simulated image; is the average grayscale value of the reconstructed SAR image, is the average grayscale value of the measured or simulated image, and and represent the translation of the measured image.
- (2)
- Position-Matching Rate
It is known that the three-dimensional position of the SC (the effective position of the ray) determines the phase of the scattering field generated by the incident ray from the radar to the point of action. The position parameters of the attribute SC parameterized model are directly related to the structural characteristics of the target and describe the spatial phase information of the SC. In this research, the position-matching rate is further used to verify the performance of the forward-SC model.
The calculation method of the SC position-matching rate is as follows: the neighborhood-matching algorithm [48] is used to extract the two-dimensional position coordinates of the SC from the measured image in inverse, and then compared with the forward-calculated SC position parameters. Assuming that the method proposed in the manuscript outputs M SCs and the inverse method extracts N SCs, usually M is much larger than N. The Euclidean distance between them is calculated, and if the distance is less than two resolution units, it is considered a successful match. The number of successfully matched scattering centers is denoted as Ms, and the matching rate is calculated as shown in Equation (21).
Figure 8 depicts a schematic of the geometric model of a large fishing ship on a rough sea surface. The target Computer-Aided Design (CAD) model is decomposed into 45 surface regions, comprising approximately 400,000 faces. The basic parameters of the fishing ship are as follows: a length of 50 m, width of 9 m, height of 14 m, and draft of 3 m. A low-roughness sea surface is simulated, with the sea state set at level 2 (wind speed of 5 m/s) and a wind direction of 30°. The rough surface model has dimensions of 100 m × 100 m.

Figure 8.
Schematic of the fishing ship model at sea. (a) Right-side view, (b) rear-side view.
The forward calculation of the SCs was conducted at a frequency of 9.65 GHz, with an incidence angle of 73° and an azimuth angle of 160° for the incident plane wave. The computed parameters of the SCs are presented in Table 1, wherein the forward model provides the scattering sources corresponding to the strong SCs and their associated attributes.

Table 1.
Forward-modeling results of strong SCs from marine fishing ship at f = 9.65 GHz.
Table 1 lists the top 15 strong SCs sorted by magnitude, where No. 45 represents the region number of the rough sea surface, and the rest of the numbers denote typical scattering structures on the fishing ship. Specifically, SC 1 originates from the coupling scattering between the antenna base and the rough sea surface; SCs 2 and 4 arise from the coupling scattering between the deck and the fore/aft compartments; SCs 3, 5, 6, and 7 originate from the coupling scattering between typical components on the fishing ship and the rough sea surface; and SCs 8, 9, 10, 12, and 14 stem from the coupling interactions among scattering components on the target; SCs 11, 13, and 15 arise from the coupling scattering between the hull, antenna base, and the aft compartment, respectively, and the rough sea surface. The SAR images of the target reconstructed in this attitude are compared with simulated images, as shown in Figure 9. The parameters of the images are listed in Table 2.
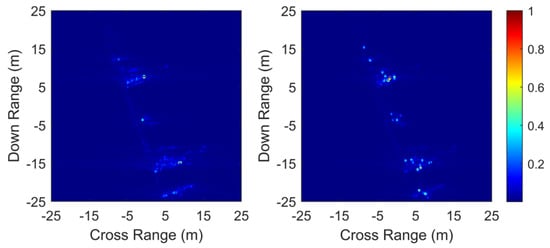
Figure 9.
Comparison between simulated (left) and reconstructed (right) SAR images for marine fishing ship. The similarity is 93.03%.

Table 2.
Imaging parameters of marine fishing ship.
The amplitude similarity between the reconstructed SAR image and the simulated image reaches 93.03%. The overall matching results of the SC positions are shown in Figure 10. The distribution of SC positions obtained by the forward model is generally consistent with the results extracted from the simulated data in inverse, with an overall position-matching rate of 92.0%. The matching results of the strong SCs are provided in Table 3, with position-matching errors within one resolution unit. The positions calculated by the forward model for SCs are well aligned with the peaks in the simulated image. The two evaluation metrics, considering both the amplitude and phase information of the reconstructed images, demonstrate the accuracy of the reconstructed target characteristics, validating the correctness and effectiveness of the proposed forward SC-modeling algorithm in this paper. From the perspective of time complexity, while traditional simulation algorithms require calculating the scattering data of each pixel point individually to obtain a SAR image, the forward model proposed in this paper can achieve high-precision SAR image data by expanding within a narrow band range. This proves that the proposed forward model not only provides target component-level knowledge for identification but also has the capability of rapidly reconstructing target SAR echoes.
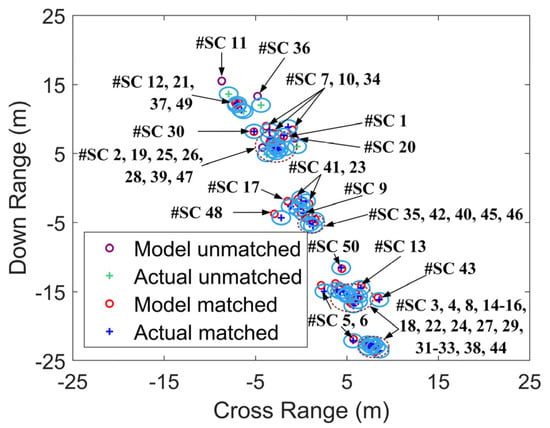
Figure 10.
Matching results of the simulated image’s inverse-extracted SC positions and the forward-calculated SC positions for marine fishing ship. The position-matching rate is 92.0%.

Table 3.
Matching results of strong SC positions.
It is worth emphasizing that the SC inverse-extraction method is a data-driven feature inversion approach, capable of extracting only the two-dimensional positional coordinates of the three-dimensional SCs from image data. When multiple three-dimensional SCs project onto the imaging plane and overlap, the inverse-extraction method can only extract one SC, resulting in a fewer number of extracted SCs than the actual ones. Similarly, since the inverse method can only extract the two-dimensional positional information of SCs, acquiring three-dimensional positions requires analyzing many poses on a global scale, and whether reasonable three-dimensional positions can be obtained lacks credible data support to draw conclusions. In contrast, the forward-SC-modeling method proposed in this paper starts directly from the target CAD model, employing space-ray-tracing and clustering techniques to forwardly deduce and quantitatively characterize the true three-dimensional coordinate attributes of SCs, representing a typical “cause and effect” forward approach. The separated SCs have clear corresponding relationships with the local structures of the target and possess genuine physical meanings, avoiding complex iterative optimization processes. Leveraging the advantage of the forward model in providing a clear physical deconstruction of target EM scattering, it facilitates the in-depth exploration of target-feature-matching information.
To further validate the accuracy of the proposed SC model, the reconstructed RCS results within a wide-angle range are provided and compared with the simulation results obtained from the Ray Launching Geometrical Optics (RLGO) algorithm, as shown in Figure 11. The RCS-extraction frequency is set to f = 9.65 GHz, with a radar zenith angle of 73° and an azimuthal scanning range of 30°–60°, HH polarization. From Figure 11, it can be observed that the reconstructed RCS from the SC parameterized model (Rec.) aligns well with the simulated RCS from the RLGO algorithm, with root mean square errors of 2.17 dBsm and 2.18 dBsm, respectively, both less than the engineering practice requirement of a less than 3 dBsm error. The comparison results indicate that the forward-modeling method for SCs proposed in this paper not only effectively extracts target scattering characteristics and establishes a one-to-one correspondence between target components and scattering sources but also rapidly reconstructs the genuine EM scattering characteristics of the target, providing technical support for dual-track applications such as radar target-remote sensing identification.
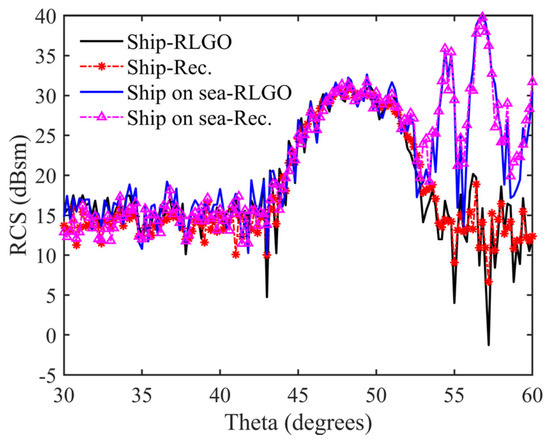
Figure 11.
Comprehensive comparison of forward model reconstruction RCS and simulation results of ships in free space and on rough sea surface. The RMSEs are 2.17 dBsm and 2.18 dBsm, respectively.
3.2. Temporal Analysis of Scattering-Center Variations on Fishing Ships at Sea
In this section, the ship’s motion model on the sea waves is combined with the forward-SC-modeling approach to analyze the temporal variations of the SCs for dynamic maritime targets on the fluctuating sea surface.
Using the fishing ship model shown in Figure 8 as a reference, a parametric model for its SC is established across various instants within a cycle. The ship’s speed is set at 0 m/s. Employing the aforementioned slicing method to compute the ship’s dynamic equation, the derived six-degree-of-freedom motion states are obtained. For the modeling focus, scenarios where the ship’s speed is zero are considered, with the primary influences on the ship’s attitude identified as roll, pitch, and heave. Consequently, the analysis simplifies the six degrees of freedom to these three primary ones, examining the impact of the ship’s motion across these degrees of freedom on the integrated ship–sea SC model.
Figure 12 illustrates the temporal variations in roll, pitch, and heave for the maritime fishing ship. Analysis of the simulation data reveals an approximate roll cycle of 3.65 s and a pitch cycle of approximately 3.85 s. Additionally, the heave cycle generally aligns closely with the pitch cycle, a relationship evident from Figure 12b,c.

Figure 12.
The temporal variations in the roll, pitch, and heave motions of the fishing ship. (a) Roll, (b) pitch, and (c) heave.
Given the time series , based on the temporal characteristics of the three primary degrees of freedom, one can infer the swing and tilt postures of the fishing ship at these four instances. This includes the angles of roll and pitch, as well as the vertical oscillation heights during the heave motion. The specific data are presented in Table 4.

Table 4.
Swinging and tilting attitudes of the fishing ship at different moments.
At the radar zenith angle of 27.09° and azimuth angle of 30°, with an extraction frequency of 9.65 GHz and HH polarization, images are reconstructed at a resolution of 0.3 m × 0.3 m, and the non-ambiguous distance is set to Rx = Ry = 100 m. Under the sea-state at level 2, the wind speed is 5 m/s. Figure 13 illustrates the reconstructed SAR images of the fishing ship’s SCs at various time intervals, with the top six prominent SCs highlighted based on their amplitude values. Table 5, Table 6, Table 7 and Table 8 detail the structural, amplitude, and three-dimensional positional parameters of the leading SCs across the four time instances. These SCs primarily emanate from the coupling effects between the ship’s hull and the sea surface, the inherent scattering of the sea surface itself, and the antennas at the ship’s fore, mid, and aft sections. Under sea state level 2 conditions, the dynamic roll and pitch of the ship on the varying sea surface minimally affect the relative distribution of the dominant SC group but significantly impact the amplitude of the SCs.
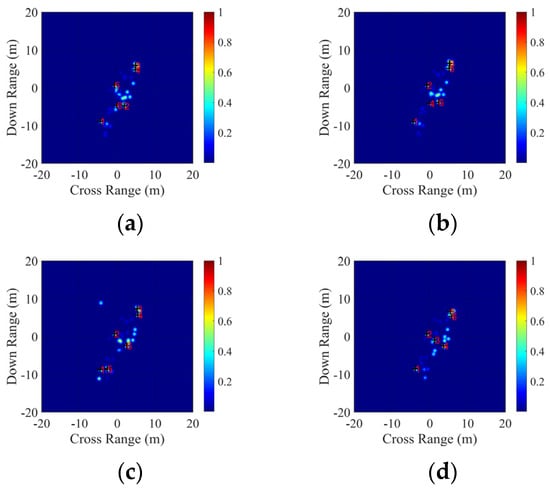
Figure 13.
Reconstructed SAR images of SCs of fishing ships at sea under different times. (a) 1.0 s. (b) 1.5 s. (c) 2.0 s. (d) 2.5 s.

Table 5.
Parameters and sources of strong scattering centers from fishing ships at sea, at t = 1.0 s.

Table 6.
Parameters and sources of strong scattering centers from fishing ships at sea, at t = 1.5 s.

Table 7.
Parameters and sources of strong scattering centers from fishing ships at sea, at t = 2.0 s.

Table 8.
Parameters and sources of strong scattering centers from fishing ships at sea, at t = 2.5 s.
It is important to note that a key feature of radar images is the strong dependency of the reflected signal’s amplitude on the object’s angular position. At different time instances, when the target assumes different attitudes, the relative amplitude distribution of bright spots in radar images varies accordingly. Moreover, the position of strong scattering sources of the target also changes, attributed to the varying scattering amplitudes exhibited by the same typical structure under different angular positions. Additionally, SCs extracted in the previous moment may disappear in the subsequent moment due to occlusion among the complex geometric structures of the target. Changes in target attitude lead to different phenomena of SC appearance and disappearance at different times. These discoveries owe to the modeling approach proposed in this paper, which aligns with the focal points of radar target-identification systems.
In traditional radar image-recognition systems, inverse techniques for SC estimation were limited to echo data, resulting in models lacking clear physical meanings and insufficient capabilities for extracting target feature information, thus failing to provide effective technical support for radar target identification. In contrast, the method proposed in this paper directly derives from the target’s CAD geometric model. Therefore, the obtained SCs have a one-to-one correspondence with the geometric structure of the composite target. The model parameters reflect the physical attributes of SCs, such as their sources and amplitude. Furthermore, the obtained SC model is three-dimensional, projected onto the imaging plane to form two-dimensional SAR images. Thus, the three-dimensional parameterized SC model obtained using our method far exceeds the information limitations of conventional radar images and possesses richer physical meanings.
In other words, the bright spots reconstructed on radar images using the model established in this paper can reveal their corresponding true physical structures. Changes or disappearances of certain bright spots caused by variations in target attitude over time can also be explained within the model.
3.3. Temporal Analysis of Scattering-Center Variations on Aircraft Carrier at Sea
Figure 14 illustrates a schematic of the aircraft carrier model, establishing a parametric SC model at different moments within its operational cycle. The fundamental dimensions of the carrier are as follows: a length of 335.12 m, width of 87.06 m, height of 73.92 m, and draft of 11.3 m. Under the sea-state at level 4 with a wind speed of 10 m/s and a wind direction set at 60°, the dimensions of the rough surface model are 400 m × 400 m. The carrier’s speed is set at 0 m/s. Analysis focuses solely on the roll, pitch, and heaving degrees of freedom.
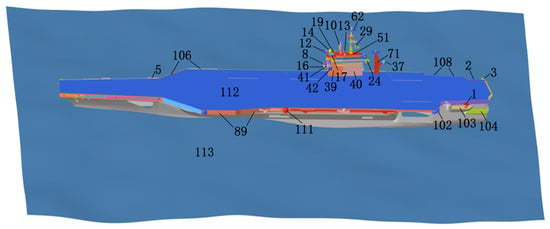
Figure 14.
Schematic of the aircraft carrier at sea.
Figure 15 illustrates the temporal variations in the roll, pitch, and heave motions of the aircraft carrier. Analysis of the ship’s simulation data indicates that the roll motion has an approximate period of 6.37 s, the pitch motion has an approximate period of 9.08 s, and the period of the heave motion closely approximates that of the pitch motion.

Figure 15.
The temporal variations in the roll, pitch, and heave motions of the aircraft carrier, with a ship speed of 0 m/s, wind speed of 10 m/s, and wind direction at 60°. (a) Roll, (b) pitch, and (c) heave.
Based on the deviations in the aircraft carrier’s motion across the three primary degrees of freedom, a temporal sequence [1.0 s, 4 s, 7.0 s, 10 s] is provided. The specific angular deviations and vertical oscillation heights at these four time points can be inferred from the aforementioned graphs, as detailed in Table 9.

Table 9.
Swinging and tilting attitudes of the aircraft carrier at different moments.
With a radar zenith angle of 27.09° and azimuth angle of 30°, a frequency extraction of f = 9.65 GHz is conducted with an incident wave polarization in HH polarization. Figure 16 presents the reconstructed SAR images of the aircraft carrier’s forward-SC model under the conditions of three-degrees-of-freedom oscillation. The imagery highlights the projections of the top six strong SCs based on their amplitude in the two-dimensional SAR display. Observations from the imagery indicate similarities in the bright spot distributions at 1.0 s and 4.0 s, as well as between 7.0 s and 10.0 s. This consistency arises from the pronounced deviations in pitch and yaw angles between the initial two time points and the subsequent two. Table 10, Table 11, Table 12 and Table 13 delineate the parameters and scattering sources of the top six strong SCs extracted based on amplitudes at the time points of 1.0 s, 4 s, 7 s, and 10 s, respectively. Given the intricate structural complexities of the aircraft-carrier target, the distributions of strong SCs vary across different time points. However, the overall contour of the SAR imagery remains consistent. Under the sea-state conditions of level 4, the oscillations of the aircraft carrier on the time-variable sea surface minimally influence the relative positioning of the SC ensemble. Nonetheless, the diverse SC rankings across the images underscore the substantial impact of oscillations on SC amplitudes.
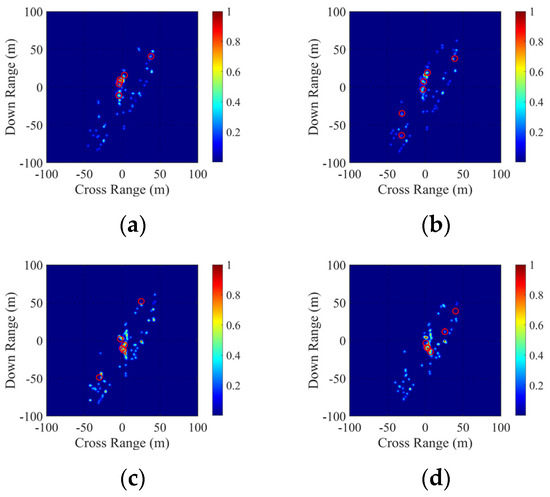
Figure 16.
Reconstructed SAR images of SCs of aircraft carrier at sea under different times. (a) 1.0 s. (b) 4.0 s. (c) 7.0 s. (d) 10.0 s.

Table 10.
Parameters and sources of strong scattering centers from aircraft carrier at sea, at t = 1.0 s.

Table 11.
Parameters and sources of strong scattering centers from aircraft carrier at sea, at t = 4.0 s.

Table 12.
Parameters and sources of strong scattering centers from aircraft carrier at sea, at t = 7.0 s.

Table 13.
Parameters and sources of strong scattering centers from aircraft carrier at sea, at t = 10.0 s.
3.4. Distribution Variations of Coupled Scattering Centers in Relation to the Dynamic Movement of the Ship
3.4.1. Impacts of Roll and Pitch on Scattering Centers
In the two aforementioned scenarios, the impacts of the ship’s tri-axial movements on its SC parameters are delineated. While these scenarios more accurately depict the ship’s oscillatory state in real-world conditions, they may not facilitate a detailed analysis of how individual degrees of freedom affect the SCs. Consequently, the focus shifts exclusively to the effects of roll and pitch on these centers. Given that both roll and pitch involve periodic motions, it suffices to consider a single cycle of the carrier’s movement. As the heave is minimal and contributes only marginally to the scattering, it is not analyzed independently. For this analysis, the carrier model is utilized, maintaining a speed of 0 m/s. The environmental conditions remain consistent, with a sea state of level four, a wind speed of 10 m/s, and a wind direction set at 90° (crosswind). From the roll simulation results depicted in Figure 17a, the period is observed to be approximately 5.5 s. Table 14 provides an overview of the carrier’s attitude throughout one full cycle during the roll scenario.

Figure 17.
The temporal variations in the roll, pitch, and heave motions of the aircraft carrier, with a ship speed of 0 m/s, wind speed of 10 m/s, and wind direction at 90°. (a) Roll, (b) pitch, and (c) heave.

Table 14.
Attitude changes of the aircraft carrier within one roll cycle.
The radar parameters extracted for the aircraft carrier under roll motion within one cycle are as follows: zenith angle of 27.09°, azimuth angle of 30°, extraction frequency f = 9.65 GHz, with HH polarization. Table 14 presents the deviation attitudes of the carrier at five specific instants within this cycle. Figure 18 depicts five reconstructed SAR images at different times during the roll motion. Table 15, Table 16, Table 17, Table 18 and Table 19 detail the six strongest amplitude SCs and their respective parameters extracted at 1.0 s, 2.375 s, 3.75 s, 5.125 s, and 6.5 s. From the five images, it is observed that at 1.0 s and 6.5 s, when the carrier deviates most from the radar direction, the ship’s edges are more prone to radar illumination, resulting in numerous SCs along its contour. However, the overall contour appears narrower due to the carrier’s smallest projected area on the radar-illuminated surface at these times. Conversely, at 3.75 s, when the carrier is closest to the radar direction, the projected area on the radar-illuminated surface is at its largest, leading to a wider image contour. Moreover, at this instant, the illuminated portion of the superstructure not only contributes directly to scattering but also forms a strong scatter source due to its equivalent biangular structure with the flight deck.
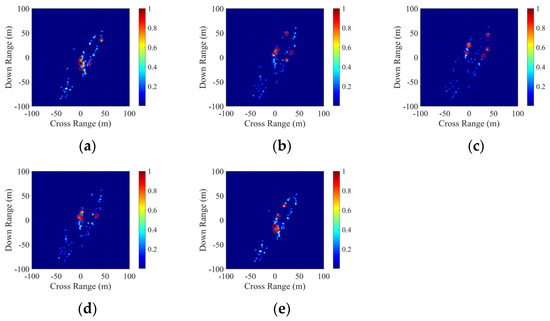
Figure 18.
Reconstructed SAR images at different instances within one cycle under roll motion conditions. (a) 1.0 s. (b) 2.375 s. (c) 3.75 s. (d) 5.125 s. (e) 6.5 s.

Table 15.
Parameters and sources of strong scattering centers from aircraft carrier at sea at t = 1.0 s, within the roll cycle.

Table 16.
Parameters and sources of strong scattering centers from aircraft carrier at sea at t = 2.375 s, within the roll cycle.

Table 17.
Parameters and sources of strong scattering centers from aircraft carrier at sea at t = 3.75 s, within the roll cycle.

Table 18.
Parameters and sources of strong scattering centers from aircraft carrier at sea at t = 5.125 s, within the roll cycle.

Table 19.
Parameters and sources of strong scattering centers from aircraft carrier at sea at t = 6.5 s, within the roll cycle.
Figure 19 presents the reconstructed high-resolution range profiles (HRRP) at various instances within the roll cycle. The profiles at the 1.0 s and 6.5 s instances are largely consistent since they represent opposite ends of a single cycle, sharing similar deflection angles and directions. Similarly, the profiles at 2.375 s and 5.125 s instances exhibit resemblance, characterized by their modest deflection angles and consistent directional orientation.
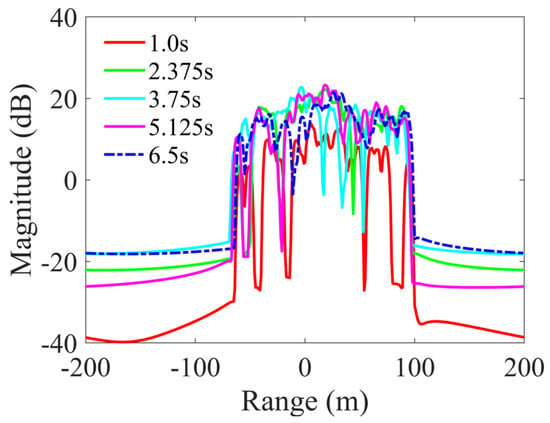
Figure 19.
Reconstructed HRRPs at various times within a roll cycle.
Continuing the analysis with a ship speed of 0 m/s and maintaining the sea state at level four, with a wind speed of 10 m/s at a direction of 90° (crosswind), we examine the impact of pitch on the extracted SCs of the carrier model. The simulation results indicate a pitch cycle of 8.4 s. The radar parameters extracted for the carrier within one roll cycle are as follows: the zenith angle is 27.09°, the azimuth angle is 30°, the extraction frequency is f = 9.65 GHz, and the polarization mode is HH polarization. Table 20 presents the pitch-deviation angles corresponding to five moments within one cycle. Figure 20 displays five SAR images reconstructed at five different times during the roll cycle. Table 21, Table 22, Table 23, Table 24 and Table 25 enumerate the six strongest SC sources and their respective parameters extracted at times 1.0 s, 3.1 s, 5.2 s, 7.3 s, and 9.4 s. As observed from Table 20, during a crosswind scenario, the pitch-deviation angle of the carrier remains within 5° throughout one cycle. From Figure 20, the overall contour information across the five SAR images remains consistent, with gradual variations observed in the relative positions of the SCs formed by the island portion. The changing order of amplitudes among the six strongest SCs marked at various times indicates a higher sensitivity of amplitude to temporal variations than the positional shifts of the SCs.

Table 20.
Attitude changes of the aircraft carrier within one pitch cycle.
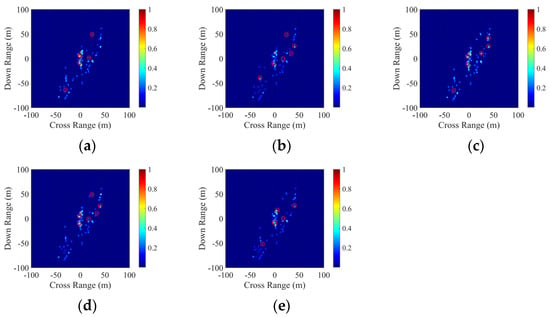
Figure 20.
Reconstructed SAR images at different instances within one cycle under pitch-motion conditions. (a) 1.0 s. (b) 3.1 s. (c) 5.2 s. (d) 7.3 s. (e) 9.4 s.

Table 21.
Parameters and sources of strong scattering centers from aircraft carrier at sea at t = 1.0 s, within the pitch cycle.

Table 22.
Parameters and sources of strong scattering centers from aircraft carrier at sea at t = 3.1 s, within the pitch cycle.

Table 23.
Parameters and sources of strong scattering centers from aircraft carrier at sea at t = 5.2 s, within the pitch cycle.

Table 24.
Parameters and sources of strong scattering centers from aircraft carrier at sea at t = 7.3 s, within the pitch cycle.

Table 25.
Parameters and sources of strong scattering centers from aircraft carrier at sea at t = 9.4 s, within the pitch cycle.
In the context of a crosswind, the amplitude of the pitch is minimal. As discerned from the reconstructed HRRPs in Figure 21 across the pitch cycle, there is minimal variation in the relative positions of the SCs extracted at different times within one cycle. The primary scattering sources are contributions from the carrier’s island region and a limited number of centers formed by its coupling with the sea surface. Additionally, SCs formed by the carrier’s edge itself and its coupling with the sea surface are evident. Under the pitch conditions, sources located at the periphery or those formed by the coupling of the periphery display a heightened sensitivity to temporal changes.
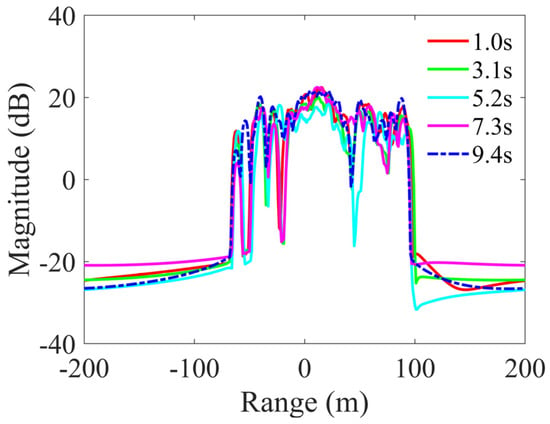
Figure 21.
Reconstructed HRRPs at various times within a pitch cycle.
3.4.2. Temporal Characteristics of Scattering-Center Amplitude and Position Parameters
Employing the fishing ship model delineated in Figure 8, under a level 2 sea state characterized by a wind speed of 5 m/s and a wind direction of 30°, the ship’s speed is set at 0 m/s. A temporal discretization spanning from 1 s to 5 s, with intervals of 0.1 s, is instituted, resulting in 41 discrete time instances corresponding to SC configurations. Three representative scattering sources are identified: primary reflection from the hull (#40), secondary coupled reflection involving both the hull (#40) and the crane’s boom (#29), and secondary coupled reflection between the stern (#37) and the sea surface (#45). Figure 22 delineates the amplitude characteristics of the SCs formed by these sources. Within this temporal scope, the amplitude fluctuations for SCs (#40), (#29-#40), and (#37-#45) reached peak values of 41 dB, 32 dB, and 43 dB, respectively. Figure 23 illustrates the positional attributes of these SCs. Over the designated interval, the maximal variations in the x-coordinates for centers (#40), (#29-#40), and (#37-#45) are 4 m, 6 m, and 3.5 m, respectively. The y-coordinates exhibited fluctuations of 3.7 m, 3.5 m, and 2.8 m, while the z-coordinates varied by 0.6 m, 0.8 m, and 0.5 m, respectively. These findings emphasize the pronounced impact of the deep-sea fishing ship’s dynamic oscillations, especially the interactions between its components and the sea surface, on the amplitude and positional characteristics of the resultant SCs under the level-2 sea state.
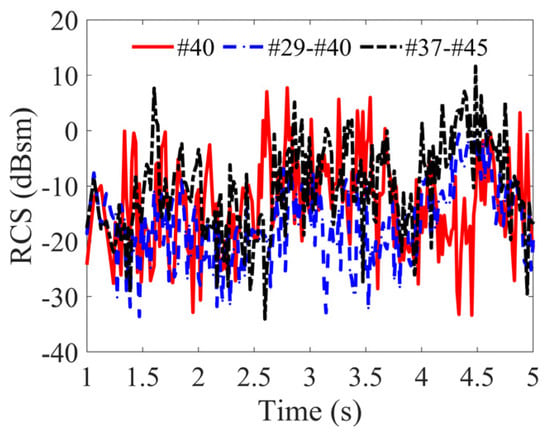
Figure 22.
Temporal evolution of scattering center’s amplitude parameters.

Figure 23.
Temporal evolution of scattering center’s three-dimensional position parameters. (a) Position x, (b) position y, (c) position z.
Utilizing the aircraft carrier model illustrated in Figure 14, simulations are conducted under sea conditions categorized as level 4, with a wind speed of 10 m/s at a direction of 60°, and a ship speed set at 0 m/s. A temporal discretization from 1 s to 7 s with increments of 0.1 s resulted in 61 discrete time points, each corresponding to SC configurations. Three representative scattering sources are chosen: the antenna mast (#17) with singular scattering, coupled scattering between the island (#16) and the deck (#112), and coupling between the deck’s side wall (#111) and the rough sea surface (#113). Figure 24 delineates the amplitude characteristics of these SCs. Within this time frame, the amplitude variations for SCs #17, #16-#112, and #111-#113 reached peaks of 23.83 dB, 9.87 dB, and 28.40 dB, respectively. Figure 25 illustrates the positional parameters of these SCs. The x-coordinate fluctuations for centers #17-#17, #16-#112, and #111-#113 are observed to be up to 30 m, 8 m, and 12 m, respectively. Correspondingly, the y-coordinate variations are up to 35 m, 8.5 m, and 7 m, while the z-coordinate changes reached up to 25 m, 9.5 m, and 10 m. These findings underscore that, under level-4 sea conditions, the dynamic oscillations of the aircraft carrier notably influence the amplitude of its components and their interactions with the sea surface, while exerting a lesser impact on positional parameters.
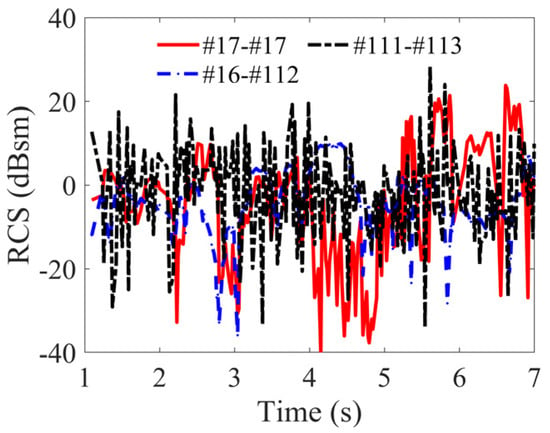
Figure 24.
Temporal evolution of scattering center’s amplitude parameters.

Figure 25.
Temporal evolution of scattering center’s three-dimensional position parameters. (a) Position x, (b) position y, (c) position z.
The experimental results demonstrate that, compared to fishing ship, the SC distribution of aircraft carriers tends to be more stable, with insignificant variations in their three-dimensional positional attributes, and considerably weaker curve fluctuations relative to fishing ship. At certain moments, there are instances of missing SCs, attributed to occlusion effects among complex targets’ scattering structures. Overall, the SC-modeling method proposed in this paper effectively captures the three-dimensional positions of SCs, along with corresponding physical attributes of scattering structures on targets, establishing a rigorous correspondence between SCs and target structures, thereby providing effective technical support for radar target-recognition systems.
4. Conclusions
This paper presents comprehensive research on the forward modeling of the SC targeting of dynamic objects on the time-varying sea surface. This article constructs the overall framework for SC forward modeling and provides a detailed description of the computation process for assigning SC parameters. Unlike traditional inverse inversion methods, this study adopts a typical “cause-to-effect” forward approach, enhancing the clarity of the model’s physical meaning. By combining two examples of fishing ships and aircraft carriers at sea, it specifically analyzes the comprehensive effects of the six-degrees-of-freedom motion—roll, pitch, and yaw—on the variation characteristics of SCs in ship–sea integrated models. Additionally, this article quantitatively analyzes the temporal variation characteristics of the amplitude and position parameters of SCs, aiming to provide guidance for maritime target-recognition applications.
However, the current research only considers the motion of ships following the waves without control. Further research is needed to address the more complex motion of ships. Additionally, the impact of noise generated by atmospheric effects on the stability of the proposed method requires further analysis and exploration. Moreover, in practical identification processes, non-cooperative ship targets often have unknown structural information or unknown swinging states. Given this, our next step will focus on establishing parameterized forward-modeling research for non-cooperative maritime ship targets, providing more powerful tools for target-remote sensing applications.
Author Contributions
Conceptualization, S.H.; methodology, R.C.; formal analysis, S.H. and R.C.; investigation, R.C.; validation, M.H.; writing—original draft preparation, R.C.; writing—review and editing, M.H.; supervision, S.H. and M.H. All authors have read and agreed to the published version of the manuscript.
Funding
This research was funded by the National Natural Science Foundation of China under Grant 62231026 and Grant 62301215.
Data Availability Statement
The data presented in this research are available on request from the corresponding author.
Acknowledgments
We gratefully thank the anonymous reviewers for their critical comments and constructive suggestions on the manuscript.
Conflicts of Interest
The authors declare no conflicts of interest.
References
- Gao, G.; Zhang, C.; Zhang, L.; Duan, D. Scattering Characteristic-Aware Fully Polarized SAR Ship Detection Network Based on a Four-Component Decomposition Model. IEEE Trans. Geosci. Remote Sens. 2023, 61, 5222722. [Google Scholar] [CrossRef]
- Meng, W.; Li, J.; Xi, Y.-J.; Guo, L.-X.; Wen, S.-K. Electromagnetic Scattering for Multiple Moving Targets above/on a Rough Surface Using Multi-dynamic-octrees-based SBR Algorithm. IEEE Trans. Geosci. Remote Sens. 2023, 61, 2005512. [Google Scholar] [CrossRef]
- Jin, X.; Su, F.; Li, H.; Xu, Z.; Deng, J. Automatic ISAR Ship Detection Using Triangle-Points Affine Transform Reconstruction Algorithm. Remote Sens. 2023, 15, 2507. [Google Scholar] [CrossRef]
- Linghu, L.; Wu, J.; Wu, Z.; Jeon, G.; Wu, T. GPU-Accelerated Computation of EM Scattering of a Time-Evolving Oceanic Surface Model II: EM Scattering of Actual Oceanic Surface. Remote Sens. 2022, 14, 2727. [Google Scholar] [CrossRef]
- Sun, Y.; Wang, Z.; Sun, X.; Fu, K. SPAN: Strong scattering point aware network for ship detection and classification in large-scale SAR imagery. IEEE J. Sel. Top. Appl. Earth Obs. Remote Sens. 2022, 15, 1188–1204. [Google Scholar] [CrossRef]
- Pui, C.Y.; Ng, B.; Rosenberg, L.; Cao, T.T. 3D ISAR for an along-track airborne radar. IEEE Trans. Aerosp. Electron. Syst. 2021, 58, 2673–2686. [Google Scholar] [CrossRef]
- Sun, Y.; Sun, X.; Wang, Z.; Fu, K. Oriented ship detection based on strong scattering points network in large-scale SAR images. IEEE Trans. Geosci. Remote Sens. 2021, 60, 5218018. [Google Scholar] [CrossRef]
- Liu, J.; Chen, H.; Wang, Y. Multi-source remote sensing image fusion for ship target detection and recognition. Remote Sens. 2021, 13, 4852. [Google Scholar] [CrossRef]
- Wang, L.; Zhang, M.; Liu, J. Electromagnetic Scattering Model for Far Wakes of Ship with Wind Waves on Sea Surface. Remote Sens. 2021, 13, 4417. [Google Scholar] [CrossRef]
- Jiang, W.Q.; Wang, L.Y.; Li, X.Z.; Liu, G.; Zhang, M. Simulation of a wideband radar echo of a target on a dynamic sea surface. Remote Sens. 2021, 13, 3186. [Google Scholar] [CrossRef]
- Zhu, J.; Qiu, X.; Pan, Z.; Zhang, Y.; Lei, B. Projection shape template-based ship target recognition in TerraSAR-X images. IEEE Geosci. Remote Sens. Lett. 2016, 14, 222–226. [Google Scholar] [CrossRef]
- Adil, M.; Buono, A.; Nunziata, F.; Ferrentino, E.; Velotto, D.; Migliaccio, M. On the Effects of the Incidence Angle on the L-Band Multi-Polarisation Scattering of a Small Ship. Remote Sens. 2022, 14, 5813. [Google Scholar] [CrossRef]
- Anderson, S. Remote sensing of the polar ice zones with HF radar. Remote Sens. 2021, 13, 4398. [Google Scholar] [CrossRef]
- Anderson, S. Bistatic and stereoscopic configurations for HF radar. Remote Sens. 2020, 12, 689. [Google Scholar] [CrossRef]
- Soldal, I.H.; Dierking, W.; Korosov, A.; Marino, A. Automatic detection of small icebergs in fast ice using satellite wide-swath SAR images. Remote Sens. 2019, 11, 806. [Google Scholar] [CrossRef]
- Le Caillec, J.-M.; Habonneau, J.; Khenchaf, A. Ship profile imaging using multipath backscattering. Remote Sens. 2019, 11, 748. [Google Scholar] [CrossRef]
- Buono, A.; De Macedo, C.R.; Nunziata, F.; Velotto, D.; Migliaccio, M. Analysis on the effects of SAR imaging parameters and environmental conditions on the standard deviation of the co-polarized phase difference measured over sea surface. Remote Sens. 2018, 11, 18. [Google Scholar] [CrossRef]
- Churnside, J.H.; Marchbanks, R.D.; Lembke, C.; Beckler, J. Optical backscattering measured by airborne lidar and underwater glider. Remote Sens. 2017, 9, 379. [Google Scholar] [CrossRef]
- Keller, J.B. Geometrical theory of diffraction. Josa 1962, 52, 116–130. [Google Scholar] [CrossRef]
- Yang, Y.; Gui, S.; Wan, Q. Superresolution Composite SAR Imaging Method by Hierarchical Pattern with Attributed Scattering Priors. IEEE Trans. Instrum. Meas. 2022, 72, 4501414. [Google Scholar] [CrossRef]
- Xie, Y.; Xing, M.; Gao, Y.; Wu, Z.; Sun, G.-C.; Guo, L. Attributed scattering center extraction method for microwave photonic signals using DSM-PMM-regularized optimization. IEEE Trans. Geosci. Remote Sens. 2022, 60, 5230016. [Google Scholar] [CrossRef]
- Liu, Z.; Wang, L.; Wen, Z.; Li, K.; Pan, Q. Multilevel scattering center and deep feature fusion learning framework for SAR target recognition. IEEE Trans. Geosci. Remote Sens. 2022, 60, 5227914. [Google Scholar] [CrossRef]
- Li, Y.; Du, L.; Wei, D. Multiscale CNN based on component analysis for SAR ATR. IEEE Trans. Geosci. Remote Sens. 2021, 60, 5211212. [Google Scholar] [CrossRef]
- Araujo, G.F.; Machado, R.; Pettersson, M.I. Non-cooperative SAR automatic target recognition based on scattering centers models. Sensors 2022, 22, 1293. [Google Scholar] [CrossRef] [PubMed]
- Jing, M.; Zhang, G. Attributed scattering center extraction with genetic algorithm. IEEE Trans. Antennas Propag. 2020, 69, 2810–2819. [Google Scholar] [CrossRef]
- He, S.Y.; Deng, F.S.; Chen, H.T.; Yu, W.X.; Hu, W.D.; Zhu, G.Q. Range profile analysis of the 2-D target above a rough surface based on the electromagnetic numerical simulation. IEEE Trans. Antennas Propag. 2009, 57, 3258–3263. [Google Scholar]
- Jianxiong, Z.; Zhiguang, S.; Xiao, C.; Qiang, F. Automatic target recognition of SAR images based on global scattering center model. IEEE Trans. Geosci. Remote Sens. 2011, 49, 3713–3729. [Google Scholar] [CrossRef]
- He, Y.; He, S.-Y.; Zhang, Y.-H.; Wen, G.-J.; Yu, D.-F.; Zhu, G.-Q. A Forward approach to establish parametric scattering center models for known complex radar targets applied to SAR ATR. IEEE Trans. Antennas Propag. 2014, 62, 6192–6205. [Google Scholar] [CrossRef]
- Liu, J.; He, S.; Zhang, L.; Zhang, Y.; Zhu, G.; Yin, H.; Yan, H. An automatic and forward method to establish 3-D parametric scattering center models of complex targets for target recognition. IEEE Trans. Geosci. Remote Sens. 2020, 58, 8701–8716. [Google Scholar] [CrossRef]
- He, S.; Hua, M.; Zhang, Y.; Du, X.; Zhang, F. Forward Modeling of Scattering Centers from Coated Target on Rough Ground for Remote Sensing Target Recognition Applications. IEEE Trans. Geosci. Remote Sens. 2023, 62, 2000617. [Google Scholar] [CrossRef]
- Zhang, L.; Zhang, Y.-H.; Yin, H.-C.; He, S.-Y.; Zhu, G.-Q. A fast SAR target indexing method based on geometric models. IEEE Trans. Geosci. Remote Sens. 2019, 57, 10226–10240. [Google Scholar] [CrossRef]
- Huang, K.; He, S.-Y.; Zhang, Y.-H.; Yin, H.-C.; Bian, Z.-D.; Zhu, G.-Q. Composite scattering analysis of the ship on a rough surface based on the forward parametric scattering center modeling method. IEEE Antennas Wirel. Propag. Lett. 2019, 18, 2493–2497. [Google Scholar] [CrossRef]
- Deng, Y.; Li, J.; Jiang, W.; Zhang, M. Investigation on the Radar Scattering and Doppler Spectrum from Trimaran Based on the Motion of Six Degrees of Freedom. IEEE J. Sel. Top. Appl. Earth Obs. Remote Sens. 2023, 16, 6889–6901. [Google Scholar] [CrossRef]
- Yao, G.; Xie, J.; Huang, W. Ocean surface cross section for bistatic HF radar incorporating a six DOF oscillation motion model. Remote Sens. 2019, 11, 2738. [Google Scholar] [CrossRef]
- Zhao, Y.; Zhang, M.; Chen, H.; Yuan, X.-F. Radar scattering from the composite ship-ocean scene: Doppler spectrum analysis based on the motion of six degrees of freedom. IEEE Trans. Antennas Propag. 2014, 62, 4341–4347. [Google Scholar] [CrossRef]
- Johnson, J.T. A study of the four-path model for scattering from an object above a half space. Microw. Opt. Technol. Lett. 2001, 30, 130–134. [Google Scholar] [CrossRef]
- Ozgun, O.; Kuzuoglu, M. Monte Carlo-based characteristic basis finite-element method (MC-CBFEM) for numerical analysis of scattering from objects on/above rough sea surfaces. IEEE Trans. Geosci. Remote Sens. 2011, 50, 769–783. [Google Scholar] [CrossRef]
- Pierson, W.J., Jr.; Moskowitz, L. A proposed spectral form for fully developed wind seas based on the similarity theory of SA Kitaigorodskii. J. Geophys. Res. 1964, 69, 5181–5190. [Google Scholar] [CrossRef]
- Salvesen, N.; Tuck, E.O.; Faltinsen, O.M. Ship Motions and Sea Loads. Trans. Soc. Nav. Archit. Mar. Eng. 1970, 78, 250–287. [Google Scholar]
- Feldman, D.A. An Atmospheric Noise Model with Application to Low Frequency Navigation Systems; Massachusetts Institute of Technology: Cambridge, MA, USA, 1972. [Google Scholar]
- Huang, S.-Q.; Liu, D.-Z.; Gao, G.-Q.; Guo, X.-J. A novel method for speckle noise reduction and ship target detection in SAR images. Pattern Recognit. 2009, 42, 1533–1542. [Google Scholar] [CrossRef]
- Lu, J.; Xi, Z.; Yuan, X.; Yu, G.; Zhang, M. Ship target recognition using high resolution range profiles based on FMT and SVM. In Proceedings of the 2011 IEEE CIE International Conference on Radar, Chengdu, China, 24–27 October 2011. [Google Scholar]
- Wang, L.S.; Robinson, S.P.; Theobald, P.; Lepper, P.A.; Hayman, G.; Humphrey, V.F. Measurement of radiated ship noise. In Proceedings of the Meetings on Acoustics, Edinburgh, Scotland, 2–6 July 2012; 17, p. 070091. [Google Scholar] [CrossRef]
- Kellett, P.; Turan, O.; Incecik, A. A study of numerical ship underwater noise prediction. Ocean Eng. 2013, 66, 113–120. [Google Scholar] [CrossRef]
- Pan, W.; Li, K.; Pan, W.; Li, K. Atmospheric Noises in SLF/ELF Ranges. Propag. SLF/ELF Electromagn. Waves 2014, 253–262. [Google Scholar] [CrossRef]
- Testa, C.; Greco, L. Prediction of submarine scattered noise by the acoustic analogy. J. Sound Vib. 2018, 426, 186–218. [Google Scholar] [CrossRef]
- Gonzalez, R.C.; Woods, R.R. Digital Image Processing, 3rd ed.; Prentice-Hall: Englewood Cliffs, NJ, USA, 2008. [Google Scholar]
- Ding, B.; Wen, G. Target reconstruction based on 3-D scattering center model for robust SAR ATR. IEEE Trans. Geosci. Remote Sens. 2018, 56, 3772–3785. [Google Scholar] [CrossRef]
Disclaimer/Publisher’s Note: The statements, opinions and data contained in all publications are solely those of the individual author(s) and contributor(s) and not of MDPI and/or the editor(s). MDPI and/or the editor(s) disclaim responsibility for any injury to people or property resulting from any ideas, methods, instructions or products referred to in the content. |
© 2024 by the authors. Licensee MDPI, Basel, Switzerland. This article is an open access article distributed under the terms and conditions of the Creative Commons Attribution (CC BY) license (https://creativecommons.org/licenses/by/4.0/).