Abstract
As the most important city in China, Beijing has experienced an economic soar, large-scale population growth and eco-environment changes in the last 20 years. Evaluating climate- and human-induced vegetation changes could reveal the relationship of vegetation-climate-human activities and provide important insights for the coordination of economic growth and environmental protection. Based on a long-term MODIS vegetation index dataset, meteorological data (temperature, precipitation) and impervious surface data, the Theil-Sen regression and the Mann-Kendall method are used to estimate vegetation change trends in this study and the residual analysis is utilized to distinguish the impacts of climate factors and human activities on vegetation restoration and degradation from 2000 to 2019 in Beijing. Our results show that the increasing vegetation areas account for 80.2% of Beijing. The restoration of vegetation is concentrated in the urban core area and mountainous area, while the degradation of vegetation is mainly concentrated in the suburbs. In recent years, the vegetation in most mountainous areas has changed from restoration to significant restoration, indicating that the growth of mountain vegetation has continued to restore. We also found that in the process of urban expansion, vegetation browning occurred in 53.1% of the urban built-up area, while vegetation greening occurred in the remaining area. We concluded that precipitation is the main climatic factor affecting the growth of vegetation in Beijing’s mountainous areas through correlation analysis. Human activities have significantly promoted the vegetation growth in the northern mountainous area thanks to the establishment of environmental protection areas. The negative correlation between vegetation and the impervious surface tends to gradually expand outwards, which is consistent with the trend of urban expansion. The positive correlation region remains stable, but the positive correlation is gradually enhanced. The response of vegetation to urbanization demonstrated a high degree of spatial heterogeneity. These findings indicated that human activities played an increasingly important role in influencing vegetation changes in Beijing.
1. Introduction
Terrestrial vegetation is an important part of the earth’s ecosystem. It releases oxygen through photosynthesis, which is an important source of oxygen on earth. Moreover, terrestrial vegetation also has a positive impact and feedback on the carbon cycle, nitrogen cycle and water cycle [1,2,3]. There are many factors affecting vegetation variations, among which climate changes and human activities are the two most important categories [4,5,6,7]. Firstly, it is generally believed that climate is an important factor in vegetation change. Rainfall and temperature are the main climate variables as claimed in many previous studies [6,8,9]. Secondly, with the growth of the economy and population, more and more studies demonstrate that human activities are the key factors causing vegetation changes [10,11,12]. One of the most representative human activities is the rapid expansion of urbanization. The population in urban areas has increased rapidly from 14% in 1900 to 50% in 2000 of the total population, in particular, it has reached 70% in developed countries [13,14]. From regional to global scales, the urbanization process and related suburban development not only have a significant impact on our living environment but also inevitably bring changes to the ecological environment of vegetation.
Remote sensing technology has emerged as an efficient substitute for the traditional, labor-intensive field experiments, providing rapid data acquisition and broad-scale detection capabilities. This advancement is particularly beneficial for extensive vegetation monitoring [15]. Among the various tools at our disposal, the vegetation index stands out as a vital measure for assessing vegetation health and ecosystem dynamics. Vegetation is distinctively characterized by its spectral signature; it absorbs more light in the red wavelength and reflects more in the near-infrared. Leveraging this property, multiple vegetation indices have been developed, the most notable being the Normalized Difference Vegetation Index (NDVI) [16] and the Enhanced Vegetation Index (EVI) [17]. NDVI, in particular, has proven instrumental in detecting shifts in vegetation dynamics, including patterns of greening and browning [18]. As research progresses, there is a growing emphasis on Fractional Vegetation Cover (FVC), a parameter that sensitively delineates vegetation biomes and responds promptly to environmental changes on regional and global scales [19]. Pioneering studies, such as those by Zhang et al. [20], who relied on the Moderate-resolution Imaging Spectroradiometer (MODIS) NDVI dataset, have unveiled a significant greening trend worldwide between 2000 and 2015. Chen et al. [21] and Wu et al. [22] confirmed this trend by observing increased global vegetation leaf area and estimating global vegetation trends through GIMMS NDVI data, respectively.
Climate change, with its manifold impacts such as shifts in temperature, rainfall, atmospheric CO2, and nitrogen deposition, is often intertwined with vegetation dynamics [21]. Studies by Sun et al. [23] and Huang et al. [24] have underscored the consequential impact of climate on vegetation, with notable spatial-temporal complexity. For instance, in the Qinghai-Tibet Plateau, their work delineated the nuanced interplay of these factors, wherein precipitation bolstered vegetation vitality, counterbalancing the suppressive effects of rising temperatures. This dynamic is particularly salient in northern China, where a pronounced warming trend over the last five decades has synchronized with substantial precipitation shifts [25,26,27]. Notably, Lucht et al. [28] have ascribed the greening observed in boreal regions mostly to increasing temperatures. Extending the scope, numerous studies have meticulously dissected the influence of climate [29,30], topography [31], land use [21], and anthropogenic activity [32] on vegetation growth, contributing to a nuanced understanding of these complex relationships.
Beijing is located in the transition zone between the mountain and the plain. The plain area is surrounded by mountains on three sides, forming a natural arc barrier, resulting in two distinct climates in front of and behind the mountains. In the past decades, the population and economy have developed rapidly and the process of urbanization has been accelerated. With the rapid urban expansion in Beijing plain area, the mountainous area of Beijing is ecological conservation, an important biodiversity center, a water source protection area, as well as the main natural vegetation distribution area. According to the ecological situation and the current needs of urban development, the government has formulated several development “Five-Year” plans to ensure that the eco-environment is fully protected and improved while Beijing’s economy continues to rapidly develop. Therefore, it becomes more and more important to explore the relative role of climate variables and human activities in vegetation changes and the correlation between urbanization expansion and vegetation growth trends in Beijing.
Under the influence of global climate change, Beijing has also experienced rapid economic development and is facing complex ecological problems. In recent years, a growing body of research has focused on investigating the patterns and determinants of vegetation change in the Beijing region. For instance, Zhao Y et al. [33] found that the vegetation in Beijing had an overall increasing trend and the NDVI fluctuations in several particular years were greatly related to temperature or precipitation anomalies based on geographically weighted regression and ordinary least squares during 2000–2015. Jiang M et al. [34] calculated the fractional vegetation coverage by the method of dimidiate pixel model based on NDVI, which suggests that human activities are very significant factors to influence and explain the changes in Beijing and they are highly spatially heterogeneous from 2000 to 2015. Chang Y et al. [35] considered that the response of vegetation to urbanization showed obvious differences and geographical heterogeneity in the urbanization gradient based on the nighttime light data. Nevertheless, these works do not continue into the latest year and quantify the role of human activities and climate factors in the process of vegetation restoration and degradation in Beijing. Moreover, few studies integrate impervious surface data and NDVI data to explore how vegetation changes during rapid urbanization.
For a fast-developing city, quantitative and continuous research about the influence of climate variability and rapid urbanization on vegetation change is of great significance. Based on the NDVI dataset, meteorological data, and impervious surface data from the last 20 years, we aim to: (1) investigate the spatiotemporal patterns of vegetation change trends by using Theil–Sen and Mann–Kendall methods excluding the influence of water; (2) evaluate the dominant factors affecting vegetation change in the mountains by using residual trend analysis approach; (3) explore the trend of vegetation growth in different stages of urban development. The results help to form an understanding of the current vegetation driving mechanism and provide a scientific basis for formulating reasonable vegetation construction, land use, and ecological environment protection strategies in Beijing. The rest of the paper is organized as follows. Section 2, “Materials and Methods”, describes our methodology, study region, remote sensing tools, and statistical tests for evaluating vegetation shifts. Section 3, “Results”, presents our findings on vegetation dynamics, spatiotemporal trends, and the impacts of natural and human factors. Section 4, “Discussion”, explores the implications, driving forces, and study limitations, proposing avenues for future inquiry. Finally, Section 5, “Conclusions”, summarizes the significant insights into vegetation change and their relevance to ecological monitoring through remote sensing.
2. Materials and Methods
2.1. Study Area
Surrounded by Taihang Mountains and Yanshan Mountains, Beijing (115.7–117.4°E, 39.4–41.6°N) lies to the north of the North China Plain (Figure 1). The total area of Beijing is 16,410.54 , of which the plain area is 6200 , accounting for 38%, and the mountainous area is 10,200 , accounting for 62%. The average altitude of the whole city is 43.5 m with a plain elevation of 20–60 m and a mountain elevation of 1000–1500 m generally. The city has a typical North Temperate semi-humid continental monsoon climate which is hot and rainy in summer, cold and dry in winter, and short in spring and autumn. The annual average precipitation is about 450 mm with 80% of the annual precipitation occurring in June, July, and August. The temperature in July is the highest, and that in January is the lowest. Although it is cold and dry in winter, there is more sunshine, with the average sunshine being more than 6 h per day. Beijing is divided into 16 districts (counties), including a high-intensive building area, a low-intensive building area and a mountain area. The area within the Fourth-Ring Road is referred to as the high-intensive building area. The area with slopes greater than 8 degrees is the mountain area. And the remaining area is the low-intensive building area.
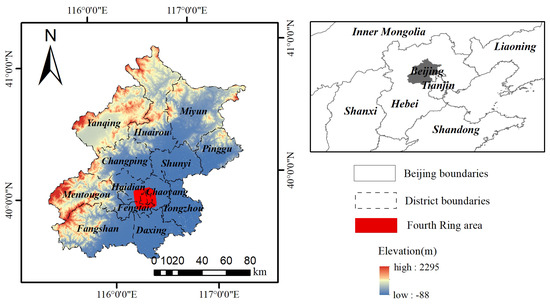
Figure 1.
Schematic diagram of the study area.
2.2. Data
2.2.1. MODIS-NDVI Dataset and Preprocessing
We used a Moderate-resolution Imaging Spectroradiometer (MODIS) Terra 16-day vegetation index product–250 m NDVI (MOD13Q1) in the manuscript from Land Processes Distributed Active Archive Center. The product has minimized the effect of cloud, cloud shadows, and noise through 16 days of synthetic data. This study used a total of 240 images of three MODIS tiles (h26v04, h26v05, and h27v05) from July and August from 2000 to 2019.
The three tiles are spliced together, and the NDVI data of Beijing is cut out using the Beijing boundary map as a mask. According to the previous research [36], the vegetation in Beijing reached the peak growth stage in July and August. The Maximum Value Composites (MVC) [37] was utilized to process the data. The maximum value of the data was taken in July and August, respectively. The mean value of July and August is calculated to represent the vegetation growth in that year and further used in the subsequent time series analysis.
2.2.2. Landsat Imagery and Preprocessing
Water bodies have a great influence on NDVI time series; even sub-pixel water bodies have a great influence on NDVI. In order to avoid the influence of water bodies as much as possible, the water bodies are extracted by the Landsat images in Beijing. Beijing is covered by two (123/032 and 123/033) WRS2 paths/rows of Landsat images. A total of 717 Landsat surface reflectance images from 2000 to 2019 are collected in this study (http://earthexplorer.usgs.gov/ (accessed on 10 January 2024)). All the data details are listed in Table 1. The CFMask algorithm was used to detect and remove snow, cloud, and cloud shadow for Landsat Image [38,39,40]. NDVI [41] and Enhanced Vegetation Index (EVI) [42,43] respond rapidly to canopy structure changes and are sensitive to high biomass areas [43]. The Modified Normalized Differences Water Index (MNDWI) is widely used to evaluate surface water information [44].

Table 1.
Summary of vegetation monitoring data in Beijing.
According to refs. [45,46], if the conditions satisfied ((MNDWI > NDVI or MNDWI > EVI) and (EVI < 0.1)), the observation results could be determined as open surface water. The interannual frequency of open surface water was calculated for each pixel and the pixels were classified as open surface water if the interannual frequency was greater than or equal to 0.75 [45,46]. Therefore, we generate 20 water body maps from 2000 to 2019 and select the map with the largest open surface water area as the water mask. The nearest neighbor method is implemented to resample to 250 m in order to match MODIS vegetation index data.
2.2.3. Climate Data
The climate data from 2000 to 2019 come from the National Earth System Science Data Center, National Science and Technology Infrastructure of China (http://www.geodata.cn (accessed on 10 January 2024)). Based on the global 0.5° climate data released by Climatic Research Unit (CRU) and the global high-resolution climate data released by WorldClim, the dataset was downscaled in China through the Delta spatial downscaling scheme [47]. To ensure the reliability of the data, Peng et al. [47] validated it against observations from 496 independent meteorological stations across China. The results from this rigorous validation process support the credibility of the dataset and underpin the subsequent analysis of vegetation change presented in this paper. To match MODIS data, these datasets were bilinear interpolated from 1 km to 250 m resolution.
2.2.4. Impervious Surface Data
The long-term impervious surface data is used to quantify city expansion and investigate the response of vegetation change trends to urbanization in this study. Impervious surface is an important part of the urban foundation surface, revealing the changes in the conurbation area better [48]. Based on Landsat images, Gong et al. [49] developed impervious surface data of Chinese provinces with 30 m resolution spatially, covering the period from 1985 to 2018 (Impervious surface data download website: http://data.ess.tsinghua.edu.cn (accessed on 10 January 2024)). The impervious surface data of Beijing from 2000 through 2018 were selected to keep consistent time with the MODIS-NDVI product in this study. We aggregated the impervious surface data into 250 m resolution to match MODIS data spatially and calculated the impervious surface ratio (ISR) in each pixel. The impervious surface ratio (ISR) of conurbation demonstrates the complicacy of the city eco-environment and the extent of urban development [50,51].
2.2.5. SRTM DEM Data
InSAR technology was applied in the SRTM mission to obtain elevation information of surface features for its efficiency and economical characteristics. The SRTM data used the WGS84 coordinate system as the horizontal reference and the EGM96 geoid as the vertical reference. It is by far the best global digital elevation data comprehensively evaluated in terms of coverage, elevation accuracy, and publicity. Since 2003, SRTM3 data with a ground resolution of 90 m has been released. We also resample it to 250 m using the bilinear interpolation method, calculate the slope, and select the slope threshold value as 8 to distinguish mountainous areas [52].
2.3. Methods
As shown in Figure 2, the study first calculates the slope and Student’s t test value of the NDVI variable for each pixel during 2000–2019 to obtain change trends of vegetation with the Theil-Sen and Mann-Kendall methods. In the mountain area, the meteorological data is utilized to analyze the influence of climate factors on vegetation variations by correlation analysis method. And residual analysis is used to distinguish the impact of climate factors and human activities on vegetation. In high- and low-intensive building areas, the impervious surface data is leveraged to study the response of vegetation to urbanization by correlation analysis.
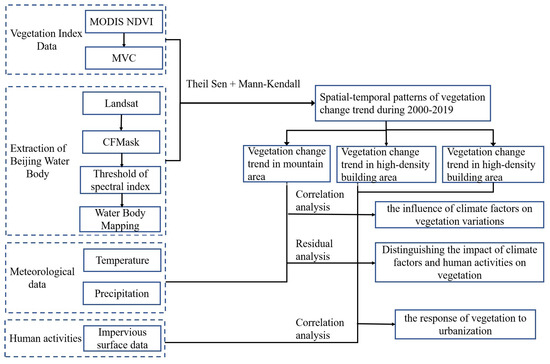
Figure 2.
Schematic diagram of this study.
2.3.1. Variation Trend Judgement
In this study, the Theil-Sen slope is acquired to obtain the trend of greenness and meteorological variables (temperature and precipitation). Compared to the least square linear fitting method, TS trend analysis is not affected by noise and outliers in the data [53,54,55], and it is a widespread method in time series trend analysis of climate variables [56,57]. The Theil-Sen slope is estimated based on the median value of the observations and at all pairwise time steps j and i. The formula is as follows:
where and represent the value of NDVI, annual accumulated precipitation or annual average temperature in the i-th and j-th year, respectively. For NDVI variation, > 0 means greenness restoration and < 0 means greenness degradation. For meteorological variables, > 0 represents precipitation or temperature increase, and < 0 represents precipitation or temperature decrease.
As a common method, we calculate the value of the Mann-Kendall method to test significance because the method has no requirement on the distribution [58]. The inspection process is as follows:
For the sequence, the test statistic S is:
where n is the length of the sequence, and are the observations at i and j time, respectively. When the data value exhibits an independent identical distribution, S is approximately normally distributed, and the variance is given by the following formula [59,60]:
where is the standard deviation. The significance of the test method is given by the statistical value Z:
where (equivalent to ) is considered of significance.
According to the vegetation greenness changes and the significance analysis, vegetation change results are classified into four groups: significant restoration, restoration, degradation and significant degradation. The Mann-Kendall tau () coefficient is adopted to investigate the correlations between two random variables, also known as the Kendall rank correlation coefficient.
2.3.2. Residual Analysis
Residual analysis is utilized to separate human-induced vegetation trends from the vegetation changes caused by climate through “NDVI-Climate” model. Considering the correlations between NDVI and meteorological variables, the “NDVI-Climate” model is established by multiple linear regression in every pixel [61].
where n is year; C is a constant; a and b are correlation coefficients of annual average temperature (T) and accumulated precipitation (P) of that year, respectively. a, b and C are calculated by the least square method.
The NDVI of climate-driven vegetation change is predicted by the “NDVI-Climate” model. And the residual represents the NDVI of human-driven vegetation trend [62,63,64].
where m is pixel, is the predicted value of the model in a specific year with temperature and precipitation impacts, and is the value of anthropogenic NDVI variation during 2000–2019.
According to the Theil-Sen method, we calculate the slopes of and as and , respectively. We also calculate the slope of actual NDVI as . Therefore, the six types of impact factors on vegetation dynamics were determined (Table 2). Specifically, > 0 indicates vegetation increases and < 0 indicates vegetation decreases. > 0 represents that climate factors have a positive impact on vegetation, while < 0 represents that climate factors have a negative impact on vegetation; > 0 represents that human activities have a positive impact on vegetation, and < 0 represents that human activities have a negative impact on vegetation [65].

Table 2.
The different dominant factors on vegetation change.
2.3.3. Correlation Analysis
Considering the spatial distribution of vegetation change trend results, Mann-Kendall coefficient correlation analysis is adopted to study the correlation between NDVI and ISR in high and low-intensive building areas and the correlation between NDVI and climate variables in the mountain area. The coefficient of the Mann-Kendall method is also called the Kendall rank correlation coefficient, which is used to test the statistical correlation of the observation values of two random variables, especially for a small sample size.
3. Results
3.1. Spatial-Temporal Characteristics of Vegetation Change Trend
The change trends of vegetation in Beijing during four periods are shown in Figure 3 including 2000–2010, 2000–2013, 2000–2016, 2000–2019. The corresponding statistical results of vegetation trends are shown in Figure 4. It can be seen that the vegetation in Beijing is totally improved. The vegetation increase is mainly concentrated in mountainous areas and high-intensive building areas. Vegetation degradation, especially the significantly degraded vegetation, is mainly concentrated in low-intensive urban areas. The significant restoration area changes from 27.8% in 2010 to 52.8% in 2019, and the restoration area changes from 55.5% in 2010 to 27.4% in 2019, which indicates that a large area of vegetation restoration has changed into significant restoration in recent years. The increase of vegetation in some urban forest parks (Figure 3e–g) shows that the construction of urban parks plays a positive role in vegetation growth. At the same time, the significant degradation area changes from 2.4% in 2010 to 5.6% in 2019, and the degraded area changes from 13% in 2010 to 12.9% in 2019, which is because that the vegetation growth situation in low-intensive urban areas of Beijing is not optimistic.
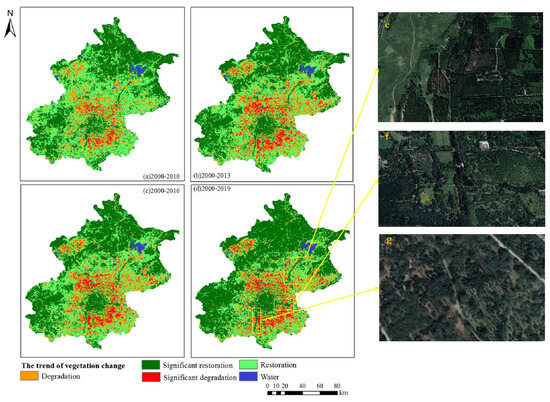
Figure 3.
The change trend of vegetation in Beijing during: (a) 2000–2010; (b) 2000–2013; (c) 2000–2016; (d) 2000–2019. The increase of vegetation in some urban forest parks (e–g) shows that the construction of urban parks plays a positive role in vegetation growth.
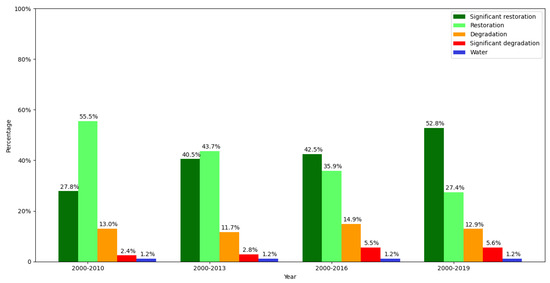
Figure 4.
Statistical results of vegetation trends in Beijing.
We counted the vegetation changes in high-intensive building areas, mountainous areas and low-intensive building areas, respectively, from 2000 to 2010, 2000 to 2013, 2000 to 2016 and 2000 to 2019. In the high-intensive building area, significant restoration is increasing continuously with 57.4% in 2010, 67.3% in 2013, 84.5% in 2016, and 90.2% in 2019 (Figure 5). The mountainous area is similar to the high-intensive building area, where significant restoration is increasing continuously with 34.2% in 2010, 57.9% in 2013, 64.8% in 2016, and 79.5% in 2019 (Figure 6). Unlike mountainous areas and high-intensive built-up areas, there has been a gradual increase in the degradation of vegetation in low-intensive built-up areas of Beijing (Figure 7), especially significantly degraded vegetation.
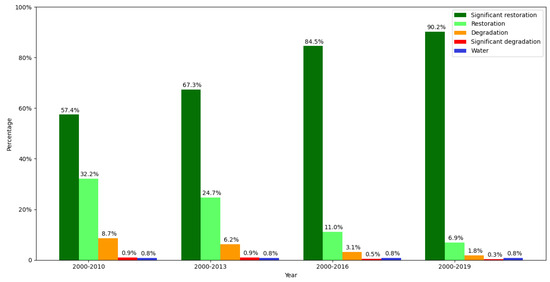
Figure 5.
Statistical results of vegetation trends in high-intensive building area of Beijing.
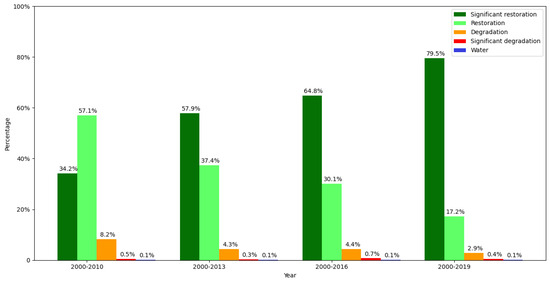
Figure 6.
Statistical results of vegetation trends in mountain area of Beijing.
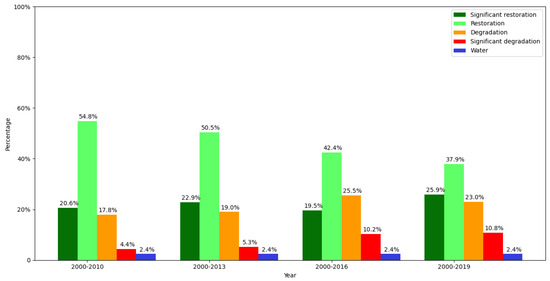
Figure 7.
Statistical results of vegetation trends in low-intensive building area of Beijing.
3.2. Driving Factors of Vegetation Change in Mountainous Area
The precipitation and temperature data are used to obtain the driving factors of vegetation change in mountain area. The trend of precipitation and temperature change in Beijing is shown in Figure 8. Temperature trends show a more pronounced east-west variation. Precipitation shows an upward trend, but with clear north-south variability. The regions with significant consistency between NDVI and temperature (p < 0.05) accounted for 2.8%, while the regions with significant consistency between NDVI and precipitation (p < 0.05) accounted for 23.6%, indicating that vegetation in Beijing responded more strongly to precipitation than to temperature. The correlation between NDVI and climate change in mountain area is shown in Figure 9. Precipitation shows a positive correlation with vegetation in most of the mountainous area (97.7%), while temperature shows a negative correlation in most of the mountainous area, reaching 78.8%. Temperature and precipitation showed significant differences in response to vegetation, especially in the northern mountainous areas.
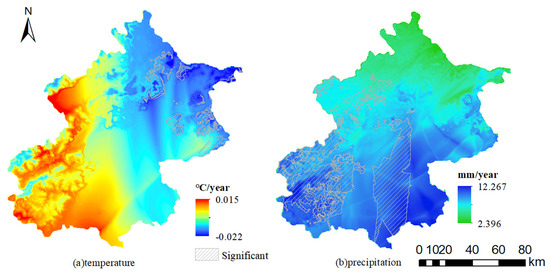
Figure 8.
The change trend of temperature and precipitation during 2000–2019 in Beijing.
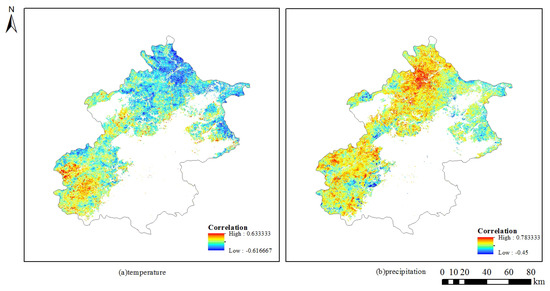
Figure 9.
Correlation coefficients between NDVI and meteorological changes during 2000–2019.
The trend analysis of NDVI residuals is shown in Figure 10a. The NDVI residuals in the northern mountainous areas of Beijing show an obvious upward trend, while those in the southern mountainous areas and areas closer to human activities show a downward trend, which indicates that the trend of NDVI residuals has obvious regional characteristics. The TS slope results of NDVI, and NDVI residuals are superimposed to obtain the NDVI dominant factor results, as shown in Figure 10b, and the NDVI driving factor statistical results are shown in Table 3. The results show that vegetation restoration accounts for the majority of the areas in the non-impervious surface area, reaching 92.9%, of which 41.5% is caused by human factors, 45.3% is caused by a combination of climatic and human activity factors, and rest is caused by climatic factors. The areas with significant increases in NDVI residuals and vegetation are mainly located in the northern mountainous areas, where human activities dominate the vegetation growth. The increasing trend of residuals in the southern mountainous area is not significant, but the increasing trend of vegetation is significant. Human activities and climate factors jointly dominate the vegetation change in this area.
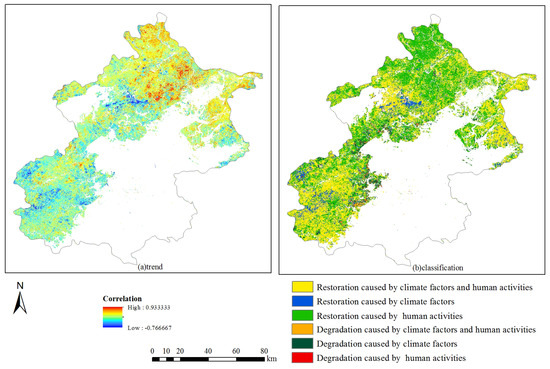
Figure 10.
Residual trend and classification results: (a) trend; (b) classification results.

Table 3.
Statistical results of driving factors of NDVI change trends.
3.3. Driving Factors of Vegetation Change in High and Low-Intensive Building Area
Impervious surface data from 2000 to 2018 is utilized to illustrate the spatial-temporal characteristics of urbanization expansion in Beijing over this period (Figure 11a). The ISA in Beijing has increased by 138.2% from 1501.6 km2 in 2000 to 3577.4 km2 in 2018 (Figure 11b). In light of interannual dynamic changes of the newly increased ISA shown in Figure 11a,b, the ISA increases rapidly during 2000–2016. In the early period of 2000–2016, the expansion of impervious surface was mainly distributed in peri-urban areas centered on high-intensive urban areas. And in the later period, it was mainly distributed in the distant suburban areas of Beijing, covering more rural areas. After 2016, the expansion of impervious surfaces tended to be almost stable.
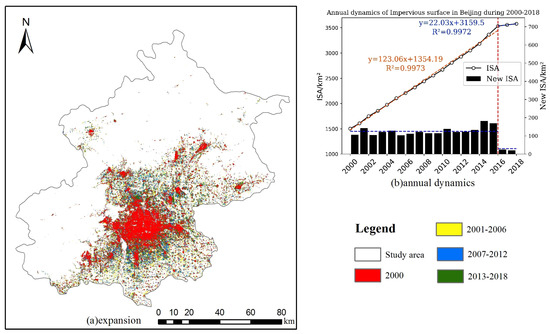
Figure 11.
Change trend of impervious surface in Beijing during 2000–2018: (a) expansion, 30 m resolution; (b) annual dynamics.
In the impervious surface area, the correlation results between NDVI and ISR are shown in Figure 12. The positive correlation indicates the growth of vegetation restoration in the process of urban expansion, while the negative correlation indicates the growth of vegetation degradation. The proportion of negative correlation increased each year from 37.5% during 2000–2010 to 53.7% during 2000–2016 (Table 4) due to the continuous urban expansion of Beijing, while the positive correlation continued to decrease, indicating a gradual increase in vegetation degradation area caused by urban expansion during this period. After 2016, the urban expansion tends to be stable, the negative correlation decreases, and the vegetation restores. The spatial distribution of correlation results shows an obvious spatial heterogeneity in vegetation growth in different regions. The negative correlation is mainly concentrated in low-intensive building areas and tends to gradually expand outwards. The positive correlation is concentrated in high-intensive building areas of the city, where the region remains stable, but the positive correlation is gradually enhanced.
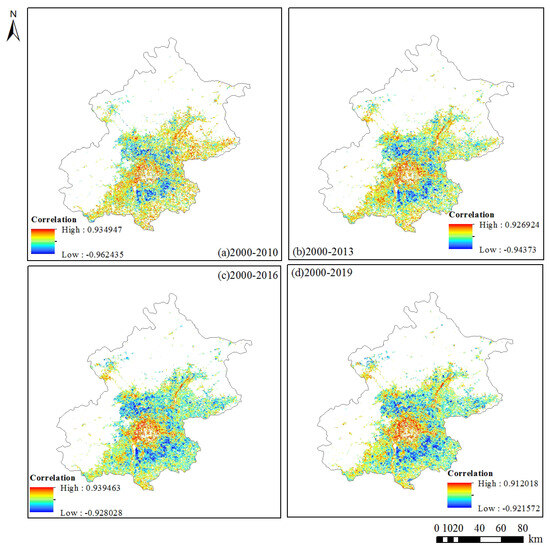
Figure 12.
Correlation between NDVI and ISR in impervious surface area in Beijing during.

Table 4.
Proportion of positive and negative correlation.
4. Discussion
4.1. The Relative Role of Driving Forces in the Process of Vegetation Restoration
Our analysis has revealed an encouraging trend of increased vegetation cover in Beijing, with 80.2% of the area experiencing restoration. This recovery exhibits spatial variability in its driving factors. In the mountainous regions, climatic conditions are key to vegetation changes, with rainfall being a significant driver of vegetation growth. This finding resonates with the wider body of research that underscores the importance of meteorological elements in vegetative trends [66]. For instance, Kulesza and Hościło [67] have concluded that rainfall is the most significant natural factor influencing forest health across Poland. Moreover, Pravalie et al. [68] found that in mountain regions such as the Carpathians, the greening trend is more closely associated with temperature increases, while in our study area, precipitation has a more pronounced effect. This highlights the regional specificity of climatic influences on vegetation dynamics.
The northernmost mountainous area of Beijing is the Beijing-Tianjin Sandstorm Source Control Project (BTSSCP), where vegetation restoration is predominantly caused by human activities. This shows that the effect of the BTSSCP project is notable. Under adverse climate conditions, human activities play a positive role and significantly improve the vegetation growth situation here, which is also consistent with previous research [69,70]. The NDVI is positively correlated with precipitation in the south of the mountain area, and the joint determinations of precipitation and human activities dominate the vegetation increases in the south of Beijing. The policy of closing hillsides for afforestation and returning farmland to forest has been implemented in the southern mountainous area. Meanwhile, some protected areas have been established. The construction of these protected areas and the implementation of the policy, together with the positive effect of precipitation, are conducive to vegetation restoration and ecological construction.
In addition to the mountainous areas, vegetation restoration is also concentrated in the high-intensive impervious surface area in Beijing. In the advanced stage of urbanization, the speed of urban expansion slows down. Due to the demand for greening, the vegetation growth trend presents a phenomenon of recovery [71,72]. This phenomenon can also be observed in developed countries such as Japan, the United Kingdom, and America [73]. The greening work in the area is getting better and better in the regions, which benefited from the urban park construction policy that Beijing has long persisted in [35,74]. In a word, proactive human activities play an important role in vegetation restoration [24,75].
4.2. The Relative Role of Driving Forces in the Process of Vegetation Degradation
Vegetation degradation in Beijing is mainly distributed in the low-intensive buildings of Beijing. The area is in the early stage of urbanization, where urban expansion has a negative role in vegetation growth. The ISA has expanded rapidly in the low-intensive building area, where the rapid transformation of cities from non-urban areas to urban areas leads to vegetation degradation [76]. In developing countries such as Bangladesh [77], and South Africa [78], this feature of urbanization to vegetation dynamics is common. Under the large-scale urban expansion, the ecological environment of vegetation is very fragile [79,80] with significant degradation. Therefore, vegetation degradation in Beijing is mainly caused by human activities [81,82].
The negative correlation between vegetation and the impervious surface has been spreading outwards, which is consistent with the trend of urbanization expansion, indicating that human factors are more important in explaining the trend of vegetation change [11,83,84]. The development of economic and social production may be conducive to ecological restoration and vegetation growth [11,85,86]. However, these areas lack ecological protection, restoration projects and policies related to vegetation protection. Under the effects of adversely climatic conditions and unreasonable human activities, vegetation degeneration has occurred in the region, which is opposite to the situation in the core urban areas. Beijing’s urban expansion tends to be stable after 2016 and gradually attaches importance to the protection of suburban vegetation, such as the implementation of a large-scale plain afforestation project (2012–2015). Moreover, given the fragile ecological environment of vegetation in these areas, the government should comprehensively consider the socio-economic development and ecological protection, and formulate more scientific and reasonable policies.
4.3. Limitations and Future Directions
Despite the considerable insights gained from our research, we must acknowledge several limitations inherent to the methodologies employed. The MODIS13Q1 vegetation index product served as the primary data source for our analysis. This product, which offers 16-day composite data, can be susceptible to atmospheric distortions such as cloud cover. These distortions occasionally result in anomalies in the observed values, either overestimating or underestimating vegetation vigor. To mitigate such discrepancies, future studies should incorporate a multi-sensor approach, leveraging data from advanced remote sensing platforms and integrating in situ field measurements to refine the NDVI assessments.
Furthermore, this study prioritized the examination of urbanization as a singular anthropogenic factor influencing vegetation dynamics. While urbanization is undoubtedly a significant driver, the scope of human activities extends beyond the realms of urban expansion. Subsequent research endeavors could adopt a more holistic view by incorporating varied datasets that encapsulate the broader spectrum of human influence. For instance, the inclusion of human footprint datasets, which quantify the cumulative pressure exerted by humans on the natural environment, could offer nuanced insights into the spatial patterns of vegetation change. Similarly, the analysis of nocturnal illumination captured through night light data could reveal the spatial extent and intensity of anthropogenic activities, providing a proxy for urban growth and associated environmental impacts.
In pursuit of a more scientific and comprehensive evaluation of anthropogenic effects on vegetation dynamics, it is imperative to synthesize these diverse data layers. Such an integrative approach will enable researchers to delineate the complex interplay between natural vegetation processes and the ever-expanding footprint of human development. The insights garnered from these multifaceted analyses will not only enhance our understanding of vegetation responses to anthropogenic pressures but also inform sustainable land management practices and urban planning strategies aimed at preserving ecological integrity in the face of rapid environmental change.
5. Conclusions
In this manuscript, we utilize MODIS NDVI data to analyze the pattern of vegetation growth trend temporally and spatially in Beijing. By leveraging climate data, Landsat images, DEM data, and impervious surface data, we evaluate the relative effects of human activities and climate changes on vegetation restoration and degradation in Beijing. Since 2000, vegetation increase has accounted for 80.2% of the total area in Beijing, mainly located in the high-intensive building and mountainous areas of Beijing. Human activities play a positive role in vegetation growth. Moreover, some large-scale ecological restoration projects have achieved good results. Beijing’s core area is located in the advanced stage of urbanization, and vegetation growth is promoted by urban greening projects in this area. The vegetation degradation area in Beijing accounts for 18.5%, mainly distributed in the low-intensive building areas of Beijing. The combined effects of these two factors and climate change dominate the degradation of vegetation. The current vegetation ecological environment is very fragile. Beijing suburbs are still in the early stage of urbanization, with considerable amounts of land converted into impervious surfaces which led to the reduction of vegetation. Therefore, we suggest that policymakers should formulate different ecological restoration policies for different ecologically vulnerable areas and areas with different urbanization gradients, and establish sustainable development strategies to ensure coordinated economic and ecological development.
Author Contributions
Conceptualization, S.C.; methodology, S.C.; software, S.C.; validation, S.C. and L.J.; formal analysis, S.C.; investigation, S.C.; resources, S.C.; data curation, S.C.; writing—original draft preparation, S.C.; writing—review and editing, S.C., K.L., L.J. and H.T.; visualization, S.C.; supervision, S.C. and H.T.; project administration, P.Z. and H.T.; funding acquisition, L.J. All authors have read and agreed to the published version of the manuscript.
Funding
This research was funded by the National Key Research and Development Program of China (grant number 31400).
Data Availability Statement
Data sharing is not applicable.
Acknowledgments
The authors would like to thank Peng Gong et al. for the public impervious surface data of Beijing on their website. We also thank Zhihong Chen and Shuli Wang for meaningful suggestions on review and editing.
Conflicts of Interest
The authors declare no conflicts of interest.
References
- Tong, S.; Zhang, J.; Ha, S.; Lai, Q.; Ma, Q. Dynamics of fractional vegetation coverage and its relationship with climate and human activities in Inner Mongolia, China. Remote Sens. 2016, 8, 776. [Google Scholar] [CrossRef]
- Hughes, M.; Myneni, R.; Dong, J.; Tucker, C.; Kaufmann, R.; Kauppi, P.; Liski, J.; Zhou, L.; Alexeyev, V. A large carbon sink in the woody biomass of Northern forests. Proc. Natl. Acad. Sci. USA 2001, 98, 14784–14789. [Google Scholar]
- David, S.S. Terrestrial ecosystems and the carbon cycle. Glob. Chang. Biol. 1995, 1, 77–91. [Google Scholar]
- Zhao, L.; Dai, A.; Dong, B. Changes in global vegetation activity and its driving factors during 1982–2013. Agric. For. Meteorol. 2018, 249, 198–209. [Google Scholar] [CrossRef]
- Jiang, C.; Nath, R.; Labzovskii, L.; Wang, D. Integrating ecosystem services into effectiveness assessment of ecological restoration program in northern China’s arid areas: Insights from the Beijing-Tianjin Sandstorm Source Region. Land Use Policy 2018, 75, 201–214. [Google Scholar] [CrossRef]
- Wang, J.; Wang, K.; Zhang, M.; Zhang, C. Impacts of climate change and human activities on vegetation cover in hilly southern China. Ecol. Eng. 2015, 81, 451–461. [Google Scholar] [CrossRef]
- Sun, W.; Song, X.; Mu, X.; Gao, P.; Wang, F.; Zhao, G. Spatiotemporal vegetation cover variations associated with climate change and ecological restoration in the Loess Plateau. Agric. For. Meteorol. 2015, 209, 87–99. [Google Scholar] [CrossRef]
- Pei, L.; Huang, S.W.; Chen, L.P. Vegetation spatio-temporal changes and the relationship with climate factors in Beijing-Tianjin Sand Source Region. J. Desert Res. 2012, 33, 1593–1597. [Google Scholar]
- Yu, L.; Wu, Z.T.; Du, Z.; Zhang, H.; Liu, Y. Quantitative analysis of the effects of human activities on vegetation in the Beijing-Tianjin sandstorm source region under the climate change. Ying Yong Sheng Tai Xue Bao J. Appl. Ecol. 2020, 31, 2007–2014. [Google Scholar]
- Feng, Q.; Ma, H.; Jiang, X.; Wang, X.; Cao, S. What has caused desertification in China? Sci. Rep. 2015, 5, 15998. [Google Scholar] [CrossRef]
- Lü, Y.; Zhang, L.; Feng, X.; Zeng, Y.; Fu, B.; Yao, X.; Li, J.; Wu, B. Recent ecological transitions in China: Greening, browning and influential factors. Sci. Rep. 2015, 5, 8732. [Google Scholar] [CrossRef] [PubMed]
- Wang, C.; Gao, Q.; Wang, X.; Yu, M. Spatially differentiated trends in urbanization, agricultural land abandonment and reclamation, and woodland recovery in Northern China. Sci. Rep. 2016, 6, 37658. [Google Scholar] [CrossRef] [PubMed]
- Kinsella, K. Urban and rural dimensions of global population aging: An overview. J. Rural Health 2001, 17, 314–322. [Google Scholar] [CrossRef] [PubMed]
- McIntyre, N.E. Ecology of urban arthropods: A review and a call to action. Ann. Entomol. Soc. Am. 2000, 93, 825–835. [Google Scholar] [CrossRef]
- Hunt, E.R.; Kelly, R.D.; Smith, W.K.; Fahnestock, J.T.; Welker, J.M.; Reiners, W.A. Estimation of carbon sequestration by combining remote sensing and net ecosystem exchange data for northern mixed-grass prairie and sagebrush–steppe ecosystems. Environ. Manag. 2004, 33, S432–S441. [Google Scholar] [CrossRef]
- Rouse, J.W.; Haas, R.H.; Schell, J.A.; Deering, D.W. Monitoring vegetation systems in the Great Plains with ERTS. NASA Spec. Publ. 1974, 351, 309. [Google Scholar]
- Liu, H.Q.; Huete, A. A feedback based modification of the NDVI to minimize canopy background and atmospheric noise. IEEE Trans. Geosci. Remote Sens. 1995, 33, 457–465. [Google Scholar] [CrossRef]
- Ollinger, S.V. Sources of variability in canopy reflectance and the convergent properties of plants. New Phytol. 2011, 189, 375–394. [Google Scholar] [CrossRef]
- Gitelson, A.A.; Kaufman, Y.J.; Stark, R.; Rundquist, D. Novel algorithms for remote estimation of vegetation fraction. Remote Sens. Environ. 2002, 80, 76–87. [Google Scholar] [CrossRef]
- Zhang, Y.; Song, C.; Band, L.E.; Sun, G.; Li, J. Reanalysis of global terrestrial vegetation trends from MODIS products: Browning or greening? Remote Sens. Environ. 2017, 191, 145–155. [Google Scholar] [CrossRef]
- Chen, C.; Park, T.; Wang, X.; Piao, S.; Xu, B.; Chaturvedi, R.K.; Fuchs, R.; Brovkin, V.; Ciais, P.; Fensholt, R.; et al. China and India lead in greening of the world through land-use management. Nat. Sustain. 2019, 2, 122–129. [Google Scholar] [CrossRef] [PubMed]
- Wu, D.; Wu, H.; Zhao, X.; Zhou, T.; Tang, B.; Zhao, W.; Jia, K. Evaluation of spatiotemporal variations of global fractional vegetation cover based on GIMMS NDVI data from 1982 to 2011. Remote Sens. 2014, 6, 4217–4239. [Google Scholar] [CrossRef]
- Sun, J.; Cheng, G.; Li, W.; Sha, Y.; Yang, Y. On the variation of NDVI with the principal climatic elements in the Tibetan Plateau. Remote Sens. 2013, 5, 1894–1911. [Google Scholar] [CrossRef]
- Huang, K.; Zhang, Y.; Zhu, J.; Liu, Y.; Zu, J.; Zhang, J. The influences of climate change and human activities on vegetation dynamics in the Qinghai-Tibet Plateau. Remote Sens. 2016, 8, 876. [Google Scholar] [CrossRef]
- Piao, S.; Ciais, P.; Huang, Y.; Shen, Z.; Peng, S.; Li, J.; Zhou, L.; Liu, H.; Ma, Y.; Ding, Y.; et al. The impacts of climate change on water resources and agriculture in China. Nature 2010, 467, 43–51. [Google Scholar] [CrossRef] [PubMed]
- Fang, J.; Piao, S.; Zhou, L.; He, J.; Wei, F.; Myneni, R.B.; Tucker, C.J.; Tan, K. Precipitation patterns alter growth of temperate vegetation. Geophys. Res. Lett. 2005, 32. [Google Scholar] [CrossRef]
- Park, H.S.; Sohn, B. Recent trends in changes of vegetation over East Asia coupled with temperature and rainfall variations. J. Geophys. Res. Atmos. 2010, 115. [Google Scholar] [CrossRef]
- Lucht, W.; Prentice, I.C.; Myneni, R.B.; Sitch, S.; Friedlingstein, P.; Cramer, W.; Bousquet, P.; Buermann, W.; Smith, B. Climatic control of the high-latitude vegetation greening trend and Pinatubo effect. Science 2002, 296, 1687–1689. [Google Scholar] [CrossRef]
- Pettorelli, N.; Chauvenet, A.L.; Duffy, J.P.; Cornforth, W.A.; Meillere, A.; Baillie, J.E. Tracking the effect of climate change on ecosystem functioning using protected areas: Africa as a case study. Ecol. Indic. 2012, 20, 269–276. [Google Scholar] [CrossRef]
- Xu, L.; Myneni, R.; Chapin Iii, F.; Callaghan, T.V.; Pinzon, J.; Tucker, C.J.; Zhu, Z.; Bi, J.; Ciais, P.; Tømmervik, H.; et al. Temperature and vegetation seasonality diminishment over northern lands. Nat. Clim. Chang. 2013, 3, 581–586. [Google Scholar] [CrossRef]
- Corenblit, D.; Steiger, J. Vegetation as a major conductor of geomorphic changes on the Earth surface: Toward evolutionary geomorphology. Earth Surf. Process. Landf. 2009, 34, 891–896. [Google Scholar] [CrossRef]
- Xu, L.; Tu, Z.; Zhou, Y.; Yu, G. Profiling human-induced vegetation change in the Horqin Sandy Land of China using time series datasets. Sustainability 2018, 10, 1068. [Google Scholar] [CrossRef]
- Zhao, Y.; Sun, R.; Ni, Z. Identification of natural and anthropogenic drivers of vegetation change in the Beijing-Tianjin-Hebei megacity region. Remote Sens. 2019, 11, 1224. [Google Scholar] [CrossRef]
- Jiang, M.; Tian, S.; Zheng, Z.; Zhan, Q.; He, Y. Human activity influences on vegetation cover changes in Beijing, China, from 2000 to 2015. Remote Sens. 2017, 9, 271. [Google Scholar] [CrossRef]
- Chang, Y.; Zhang, G.; Zhang, T.; Xie, Z.; Wang, J. Vegetation dynamics and their response to the urbanization of the Beijing–Tianjin–Hebei region, China. Sustainability 2020, 12, 8550. [Google Scholar] [CrossRef]
- Zhang, X. Study on the Temporal and Spatial Distribution of Vegetation and Its Impact Factors Based on RS in Beijing. Master’s Thesis, China University of Geosciences (Beijing), Beijing, China, 2010. [Google Scholar]
- Wang, C.; Zhu, K. Misestimation of growing season length due to inaccurate construction of satellite vegetation index time series. IEEE Geosci. Remote Sens. Lett. 2019, 16, 1185–1189. [Google Scholar] [CrossRef]
- Foga, S.; Scaramuzza, P.L.; Guo, S.; Zhu, Z.; Dilley, R.D., Jr.; Beckmann, T.; Schmidt, G.L.; Dwyer, J.L.; Hughes, M.J.; Laue, B. Cloud detection algorithm comparison and validation for operational Landsat data products. Remote Sens. Environ. 2017, 194, 379–390. [Google Scholar] [CrossRef]
- Zhu, Z.; Wang, S.; Woodcock, C.E. Improvement and expansion of the Fmask algorithm: Cloud, cloud shadow, and snow detection for Landsats 4–7, 8, and Sentinel 2 images. Remote Sens. Environ. 2015, 159, 269–277. [Google Scholar] [CrossRef]
- Zhu, Z.; Woodcock, C.E. Object-based cloud and cloud shadow detection in Landsat imagery. Remote Sens. Environ. 2012, 118, 83–94. [Google Scholar] [CrossRef]
- Tucker, C.J. Red and photographic infrared linear combinations for monitoring vegetation. Remote Sens. Environ. 1979, 8, 127–150. [Google Scholar] [CrossRef]
- Huete, A.; Liu, H.; Batchily, K.; Van Leeuwen, W. A comparison of vegetation indices over a global set of TM images for EOS-MODIS. Remote Sens. Environ. 1997, 59, 440–451. [Google Scholar] [CrossRef]
- Huete, A.; Didan, K.; Miura, T.; Rodriguez, E.P.; Gao, X.; Ferreira, L.G. Overview of the radiometric and biophysical performance of the MODIS vegetation indices. Remote Sens. Environ. 2002, 83, 195–213. [Google Scholar] [CrossRef]
- Xu, H. Modification of normalised difference water index (NDWI) to enhance open water features in remotely sensed imagery. Int. J. Remote Sens. 2006, 27, 3025–3033. [Google Scholar] [CrossRef]
- Zou, Z.; Dong, J.; Menarguez, M.A.; Xiao, X.; Qin, Y.; Doughty, R.B.; Hooker, K.V.; Hambright, K.D. Continued decrease of open surface water body area in Oklahoma during 1984–2015. Sci. Total Environ. 2017, 595, 451–460. [Google Scholar] [CrossRef]
- Zou, Z.; Xiao, X.; Dong, J.; Qin, Y.; Doughty, R.B.; Menarguez, M.A.; Zhang, G.; Wang, J. Divergent trends of open-surface water body area in the contiguous United States from 1984 to 2016. Proc. Natl. Acad. Sci. USA 2018, 115, 3810–3815. [Google Scholar] [CrossRef] [PubMed]
- Peng, S.; Ding, Y.; Liu, W.; Li, Z. 1 km monthly temperature and precipitation dataset for China from 1901 to 2017. Earth Syst. Sci. Data 2019, 11, 1931–1946. [Google Scholar] [CrossRef]
- Shahtahmassebi, A.; Yu, Z.L.; Wang, K.; Xu, H.W.; Deng, J.S.; Li, J.D.; Luo, R.S.; Wu, J.; Moore, N. Monitoring rapid urban expansion using a multi-temporal RGB-impervious surface model. J. Zhejiang Univ. Sci. A 2012, 13, 146–158. [Google Scholar] [CrossRef]
- Gong, P.; Li, X.; Wang, J.; Bai, Y.; Chen, B.; Hu, T.; Liu, X.; Xu, B.; Yang, J.; Zhang, W.; et al. Annual maps of global artificial impervious area (GAIA) between 1985 and 2018. Remote Sens. Environ. 2020, 236, 111510. [Google Scholar] [CrossRef]
- Arnold, C.L., Jr.; Gibbons, C.J. Impervious surface coverage: The emergence of a key environmental indicator. J. Am. Plan. Assoc. 1996, 62, 243–258. [Google Scholar] [CrossRef]
- Ridd, M.K. Exploring a VIS (vegetation-impervious surface-soil) model for urban ecosystem analysis through remote sensing: Comparative anatomy for cities. Int. J. Remote Sens. 1995, 16, 2165–2185. [Google Scholar] [CrossRef]
- Niu, Z.; Gong, P.; Cheng, X.; Guo, J.; Wang, L.; Huang, H.; Shen, S.; Wu, Y.; Wang, X.; Wang, X.; et al. Geographical characteristics of China’s wetlands derived from remotely sensed data. Sci. China Ser. D Earth Sci. 2009, 52, 723–738. [Google Scholar] [CrossRef]
- Fensholt, R.; Langanke, T.; Rasmussen, K.; Reenberg, A.; Prince, S.D.; Tucker, C.; Scholes, R.J.; Le, Q.B.; Bondeau, A.; Eastman, R.; et al. Greenness in semi-arid areas across the globe 1981–2007—An Earth Observing Satellite based analysis of trends and drivers. Remote Sens. Environ. 2012, 121, 144–158. [Google Scholar] [CrossRef]
- Sen, P.K. Estimates of the regression coefficient based on Kendall’s tau. J. Am. Stat. Assoc. 1968, 63, 1379–1389. [Google Scholar] [CrossRef]
- Theil, H. A rank-invariant method of linear and polynominal regression analysis (Parts 1–3). Ned. Akad. Wetensch. Proc. Ser. A 1950, 53, 1397–1412. [Google Scholar]
- Martinez, C.J.; Maleski, J.J.; Miller, M.F. Trends in precipitation and temperature in Florida, USA. J. Hydrol. 2012, 452, 259–281. [Google Scholar] [CrossRef]
- Tabari, H.; Somee, B.S.; Zadeh, M.R. Testing for long-term trends in climatic variables in Iran. Atmos. Res. 2011, 100, 132–140. [Google Scholar] [CrossRef]
- Kendall, M.G. A new measure of rank correlation. Biometrika 1938, 30, 81–93. [Google Scholar] [CrossRef]
- Kendall, M.G. Rank Correlation Methods; American Psychological Association: Washington, DC, USA, 1948. [Google Scholar]
- Mann, H. Spatial-temporal variation and protection of wetland resources in Xinjiang. Econometrica 1945, 13, 245–259. [Google Scholar] [CrossRef]
- Qu, S.; Wang, L.; Lin, A.; Zhu, H.; Yuan, M. What drives the vegetation restoration in Yangtze River basin, China: Climate change or anthropogenic factors? Ecol. Indic. 2018, 90, 438–450. [Google Scholar] [CrossRef]
- Evans, J.; Geerken, R. Discrimination between climate and human-induced dryland degradation. J. Arid Environ. 2004, 57, 535–554. [Google Scholar] [CrossRef]
- Ibrahim, Y.Z.; Balzter, H.; Kaduk, J.; Tucker, C.J. Land degradation assessment using residual trend analysis of GIMMS NDVI3g, soil moisture and rainfall in Sub-Saharan West Africa from 1982 to 2012. Remote Sens. 2015, 7, 5471–5494. [Google Scholar] [CrossRef]
- Jiang, L.; Bao, A.; Guo, H.; Ndayisaba, F. Vegetation dynamics and responses to climate change and human activities in Central Asia. Sci. Total Environ. 2017, 599, 967–980. [Google Scholar] [CrossRef] [PubMed]
- Wang, H.; Liu, G.; Li, Z.; Wang, P.; Wang, Z. Comparative assessment of vegetation dynamics under the influence of climate change and human activities in five ecologically vulnerable regions of China from 2000 to 2015. Forests 2019, 10, 317. [Google Scholar] [CrossRef]
- Misi, D.; Puchałka, R.; Pearson, C.; Robertson, I.; Koprowski, M. Differences in the climate-growth relationship of scots pine: A case study from Poland and Hungary. Forests 2019, 10, 243. [Google Scholar] [CrossRef]
- Kulesza, K.; Hościło, A. Influence of climatic conditions on Normalized Difference Vegetation Index variability in forest in Poland (2002–2021). Meteorol. Appl. 2023, 30, e2156. [Google Scholar] [CrossRef]
- Prăvălie, R.; Sirodoev, I.; Nita, I.A.; Patriche, C.; Dumitraşcu, M.; Roşca, B.; Tişcovschi, A.; Bandoc, G.; Săvulescu, I.; Mănoiu, V.; et al. NDVI-based ecological dynamics of forest vegetation and its relationship to climate change in Romania during 1987–2018. Ecol. Indic. 2022, 136, 108629. [Google Scholar] [CrossRef]
- Zhang, Y.; Zhang, C.; Wang, Z.; Chen, Y.; Gang, C.; An, R.; Li, J. Vegetation dynamics and its driving forces from climate change and human activities in the Three-River Source Region, China from 1982 to 2012. Sci. Total Environ. 2016, 563, 210–220. [Google Scholar] [CrossRef] [PubMed]
- Xu, W.; Gu, S.; Zhao, X.; Xiao, J.; Tang, Y.; Fang, J.; Zhang, J.; Jiang, S. High positive correlation between soil temperature and NDVI from 1982 to 2006 in alpine meadow of the Three-River Source Region on the Qinghai-Tibetan Plateau. Int. J. Appl. Earth Obs. Geoinf. 2011, 13, 528–535. [Google Scholar] [CrossRef]
- Liu, Q.; Yang, Y.; Tian, H.; Zhang, B.; Gu, L. Assessment of human impacts on vegetation in built-up areas in China based on AVHRR, MODIS and DMSP_OLS nighttime light data, 1992–2010. Chin. Geogr. Sci. 2014, 24, 231–244. [Google Scholar] [CrossRef]
- Luck, G.W.; Smallbone, L.T.; O’Brien, R. Socio-economics and vegetation change in urban ecosystems: Patterns in space and time. Ecosystems 2009, 12, 604–620. [Google Scholar] [CrossRef]
- Liu, Y.; Wang, Y.; Peng, J.; Du, Y.; Liu, X.; Li, S.; Zhang, D. Correlations between urbanization and vegetation degradation across the world’s metropolises using DMSP/OLS nighttime light data. Remote Sens. 2015, 7, 2067–2088. [Google Scholar] [CrossRef]
- Sun, X.P.; Wang, T.M.; Wu, J.G.; Ge, J.P. Change trend of vegetation cover in Beijing metropolitan region before and after the 2008 Olympics. Ying Yong Sheng Tai Xue Bao J. Appl. Ecol. 2012, 23, 3133–3140. [Google Scholar]
- Li, S.; Yang, S.; Liu, X.; Liu, Y.; Shi, M. NDVI-based analysis on the influence of climate change and human activities on vegetation restoration in the Shaanxi-Gansu-Ningxia Region, Central China. Remote Sens. 2015, 7, 11163–11182. [Google Scholar] [CrossRef]
- Chang, S.; Wang, J.; Zhang, F.; Niu, L.; Wang, Y. A study of the impacts of urban expansion on vegetation primary productivity levels in the Jing-Jin-Ji region, based on nighttime light data. J. Clean. Prod. 2020, 263, 121490. [Google Scholar] [CrossRef]
- Dewan, A.M.; Yamaguchi, Y. Land use and land cover change in Greater Dhaka, Bangladesh: Using remote sensing to promote sustainable urbanization. Appl. Geogr. 2009, 29, 390–401. [Google Scholar] [CrossRef]
- Burgoyne, C.; Kelso, C.; Ahmed, F. Human activity and vegetation change around mkuze game reserve, South Africa. S. Afr. Geogr. J. Suid-Afr. Geogr. Tydskr. 2016, 98, 217–234. [Google Scholar] [CrossRef]
- Wang, J.; Zhou, W.; Pickett, S.T.; Yu, W.; Li, W. A multiscale analysis of urbanization effects on ecosystem services supply in an urban megaregion. Sci. Total Environ. 2019, 662, 824–833. [Google Scholar] [CrossRef] [PubMed]
- Shan, N.; Shi, Z.; Yang, X.; Gao, J.; Cai, D. Spatiotemporal trends of reference evapotranspiration and its driving factors in the Beijing–Tianjin Sand Source Control Project Region, China. Agric. For. Meteorol. 2015, 200, 322–333. [Google Scholar] [CrossRef]
- Anzhou, Z.; Anbing, Z.; Chunyan, L.; Dongli, W.; Haixin, L. Spatiotemporal variation of vegetation coverage before and after implementation of Grain for Green Project in the Loess Plateau. Ecol. Eng 2017, 104, 13–22. [Google Scholar]
- Tian, H.; Cao, C.; Chen, W.; Bao, S.; Yang, B.; Myneni, R.B. Response of vegetation activity dynamic to climatic change and ecological restoration programs in Inner Mongolia from 2000 to 2012. Ecol. Eng. 2015, 82, 276–289. [Google Scholar] [CrossRef]
- Li, J.; Feng, L.; Pang, X.; Gong, W.; Zhao, X. Radiometric cross calibration of gaofen-1 wfv cameras using landsat-8 oli images: A simple image-based method. Remote Sens. 2016, 8, 411. [Google Scholar] [CrossRef]
- Tian, H.; Cao, C.; Dai, C.; Zheng, S.; Lu, S.; Xu, M.; Chen, W.; Zhao, J.; Liu, D.; Zhu, H. Analysis of vegetation fractional cover in jungar banner based on time-series remote sensing data. Geo-Inf. Sci. 2014, 16, 126–133. [Google Scholar]
- Salvati, L.; Zitti, M. Natural resource depletion and the economic performance of local districts: Suggestions from a within-country analysis. Int. J. Sustain. Dev. World Ecol. 2008, 15, 518–523. [Google Scholar] [CrossRef]
- Madu, I.A. The impacts of anthropogenic factors on the environment in Nigeria. J. Environ. Manag. 2009, 90, 1422–1426. [Google Scholar] [CrossRef]
Disclaimer/Publisher’s Note: The statements, opinions and data contained in all publications are solely those of the individual author(s) and contributor(s) and not of MDPI and/or the editor(s). MDPI and/or the editor(s) disclaim responsibility for any injury to people or property resulting from any ideas, methods, instructions or products referred to in the content. |
© 2024 by the authors. Licensee MDPI, Basel, Switzerland. This article is an open access article distributed under the terms and conditions of the Creative Commons Attribution (CC BY) license (https://creativecommons.org/licenses/by/4.0/).