Article

Estimating Winter Cover Crop Biomass in France Using Optical Sentinel-2 Dense Image Time Series and Machine Learning

1
Centre d’Etudes Spatiales de la Biosphère (CESBIO), Centre National d’études Spatiales (CNES)/Centre National de la Recherche Scientifique (CNRS)/Institut National de Recherche pour l’Agriculture, l’Alimentation et l’Anvironnement (INRAE)/Institut de Recherche pour le Développement (IRD)/Université Toulouse III-Paul Sabatier, 18, Avenue Edouard Belin, 31401 Toulouse, France
2
EarthDaily Agro, 31130 Balma, France
*
Author to whom correspondence should be addressed.
Remote Sens. 2024, 16(5), 834; https://doi.org/10.3390/rs16050834
Submission received: 17 January 2024 / Revised: 17 February 2024 / Accepted: 26 February 2024 / Published: 28 February 2024

Abstract

:
Cover crops play a pivotal role in mitigating climate change by bolstering carbon sequestration through biomass production and soil integration. However, current methods for quantifying cover crop biomass lack spatial precision and objectivity. Thus, our research aimed to devise a remote-sensing-based approach to estimate cover crop biomass across various species and mixtures during fallow periods in France. Leveraging Sentinel-2 optical data and machine learning algorithms, we modeled biomass across 50 fields representative of France’s diverse cropping practices and climate types. Initial tests using traditional empirical relationships between vegetation indices/spectral bands and dry biomass revealed challenges in accurately estimating biomass for mixed cover crop categories due to spectral interference from grasses and weeds, underscoring the complexity of modeling diverse agricultural conditions. To address this challenge, we compared several machine learning algorithms (Support Vector Machine, Random Forest, and eXtreme Gradient Boosting) using spectral bands and vegetation indices from the latest available image before sampling as input. Additionally, we developed an approach that incorporates dense optical time series of Sentinel-2 data, generated using a Radial Basis Function for interpolation. Our findings demonstrated that a Random Forest model trained with dense time series data during the cover crop development period yielded promising results, with an average R-squared (r2) value of 0.75 and root mean square error (RMSE) of 0.73 t·ha−1, surpassing results obtained from methods using single-image snapshots (r2 of 0.55). Moreover, our approach exhibited robustness in accounting for factors such as crop species diversity, varied climatic conditions, and the presence of weed vegetation—essential for approximating real-world conditions. Importantly, its applicability extends beyond France, holding potential for global scalability. The availability of data for model calibration across diverse regions and timeframes could facilitate broader application.

1. Introduction

Mitigating climate change is an unavoidable challenge for the coming years. Agriculture is an activity that presents a great opportunity to reduce the impacts of climate change, particularly through the implementation of agricultural practices that promote the sequestration of carbon in the soil [1,2,3]. Soil carbon storage and sequestration can be achieved by planting cover crops during the fallow period within crop rotations [4,5,6], organic matter input to the soil [7], and biochar [8]. Moreover, organic carbon storage in agricultural soils has additional benefits in increasing soil fertility [9], enhanced water holding capacity [10], higher biodiversity [11], and other ecosystem services. Soil organic carbon (SOC) storage could also account for an additional source of revenue for farmers through carbon credits and subsidies [12]. Cover crops also aim to limit the disadvantages observed in periods of bare soil (e.g., risk of drainage and nitrate leaching) while offering a set of direct and indirect benefits. In addition to SOC storage, they contribute to climate mitigation by increasing the surface albedo [6,13,14,15], and by reducing surface heat fluxes and the surface temperature [16]. The adoption of cover crops also reduces soil erosion and it increases soil fertility [17]. Another benefit is that cover crops can retain soil nitrogen from chemical nitrogen fertilizer for cash crops [18,19], and reduce leaching of farmland nitrogen to the groundwater and watershed surface waters [20].
In the literature, various terms are used to describe cover crops, such as “green manure”, “intermediate crop”, and “catch crop”. Cover crops are planted at different times of the year, leading to distinctions like winter cover crops, spring cover crops, summer cover crops, and autumn cover crops, depending on the season of planting. Winter cover crops, for instance, are typically sown in late summer after a winter crop or in late fall after the harvest of summer crops. They are either destroyed before the end of the calendar year (e.g., catch crops) or continue to grow through the winter, and often exhibit lush green growth by the following spring. The termination of cover crops can be achieved through methods like mowing, tilling, plowing, rolling, or the application of herbicides while the cover crops are still in their green, vegetative state [21].
Given the evolving nature of this agricultural practice, a wide range of field practices has emerged, underscoring the need for the comprehensive mapping and monitoring of cover crop adoption. Based on data from the Farm Field Survey (FSS), the utilization of cover crops has shown a notable rise in the European Union (EU) and United Kingdom (UK), expanding from 6.5% of total agricultural lands in 2010 to 8.9% in 2016 [22]. Yet, the application of cover crops is presently an underutilized agricultural method [23] and it is anticipated to experience further growth in the EU in the coming years.
In France, an increasing number of farmers are embracing cover cropping practices, driven both by voluntary adoption and compliance with local regulations and cost-sharing programs. Notably, in 2017, the proportion of agricultural lands left bare during the winter was reduced to 14%, indicating a decrease of three and six percentage points from 2014 and 2011, respectively [24]. France, as one of the largest European Union Member States, exhibits diverse environmental conditions, including continental, Mediterranean, and oceanic climates [25], and maintains a substantial area under cover cropping [26]. A list of 44 recognized cover crops was proposed in France [24] facilitating farmers’ adherence to the Ecological Focus Area (EFA) requirements for biodiversity conservation as part of the Common Agricultural Policy.
The monitoring of cover crops requires the estimation of important vegetation descriptors, such as the period and duration of vegetation development, percentage vegetative ground cover, and aboveground biomass in order to quantify their environmental benefits [27]. In this context, the ability of remote sensing to observe surface conditions is a promising technique to leverage the development of indirect biomass estimation methods [28], to compensate for the impossibility of collecting data over large areas.
Numerous research studies have shown the capability of optical satellite data to estimate the biomass of diverse crops [29,30,31,32,33]. Usually, such approaches rely on the use of spectral band ratios. These ratios leverage the growing disparity in the levels of red light absorbed by chlorophyll in leaves and the infrared light reflected due to cell structure as leaves accumulate biomass [34]. Conversely, alternative methods such as the simple ratio (SR) [35] have been suggested by other researchers. Moreover, the efficacy of indices incorporating near-infrared red-edge bands, such as the red-edge simple ratio (SRre) and the Red-Edge Triangular Vegetation Index (RTVI), has been emphasized, showcasing stronger correlations with crop biomass [32,36,37].
Indeed, the estimation of mixed cover crop development or biomass using satellite imagery remains limited, especially when considering mixtures of cover crop species. Prabhakara et al. [38] found a linear relationship between the normalized difference vegetation index (NDVI) and percentage groundcover of six winter cover crop species on the east coast of the United States using a handheld multispectral radiometer. Thieme et al. [39] demonstrated the application of remote sensing for evaluating cover crop biomass and percentage vegetative ground cover in Maryland, USA, focusing on grass monocultures. Fan et al. [40] showcased how Sentinel-2 imagery proved valuable for gauging the variations in winter vegetative cover within the Netherlands. Xia et al. [41] also used Sentinel-2 imagery and local factors to predict cover crop properties and biomass nitrogen using partial least squares regression in the US. Although they achieved good correlations with red clover biomass, they highlighted that the mixed cover crops posed challenges, emphasizing the need for expanded datasets to improve estimates based on remote sensing. Jennewein et al. [42] assessed the use of Sentinel-2 and Sentinel-1 (SAR) imagery to estimate winter cover crop biomass across 27 fields in Maryland over multiple seasons and highlighted the significance of red-edge bands in addressing saturation issues in biomass estimation, and also some limitations related to species-level effects. Goffart et al. [43] assessed the suitability of Sentinel-2 satellite data for estimating the biomass production of winter cover crops in Belgium, including various single and mixed cover crop species. In their study, they established empirical relationships between biomass and 73 vegetation indices (VIs) derived from multiple bands, and compared the satellite-based biomass estimation with visual farmer-based estimates and reference field measurements. Holzhauser et al. [44] conducted a two-year trial in northern Germany, focusing on the calibration of the multispectral sensor Sequoia (Parrot) to assess winter cover crop biomass (oilseed radish, saia oat, spring vetch, and winter rye, both individually and in mixtures). Kharel et al. [45] assessed mixed-species cover crop biomass estimation in a limited region of Mississippi, US, employing high-resolution Planet Scope imagery. However, they emphasized the necessity for further research to determine the most suitable spectral bands and vegetation indices for this purpose. Kümmerer et al. [46] and Roth et al. [47] have shown the efficacy of unmanned aerial vehicles (UAVs) in assessing the canopy height and biomass yield of cover crops, indicating their potential for precise and site-specific crop management strategies.
Most of these studies highlighted the need for further research on estimating biomass of mixtures of different cover crops species, considering the presence of weed infestation, and recommended exploring approaches including weather data, machine learning, proximal sensing, and crop–soil simulation models for accurate biomass estimation, particularly at the landscape scale. Furthermore, most current studies rely on the use of images obtained on dates close to and prior to the sampling date, making it difficult to apply automatic and scalable methods, since cloud cover conditions can vary significantly between different regions. In recent literature, advancements have been made in detecting the presence of cover crops and determining their termination dates [21,48,49,50]. However, significant gaps persist, particularly in accurately estimating biomass, in the presence of weeds and cover crop mixtures. Wang et al. [51] also highlighted the scarcity of studies focused on estimating cover crop biomass using multispectral sensing across a higher number of sites, typically yielding limited accuracy.
Crop–soil simulation model approaches have been developed also focusing on cover crop biomass estimation [52]. Although these approaches are very important in the sense of understanding better the physiological process of the vegetation and simulating scenarios with different combination of other variables that impact on the plant–soil–water system, they depend on many different parameters that need to be calibrated for each species and may be more difficult to apply for mixed cover crops, especially when considering the need to upscale the approach.
To our knowledge no study has yet evaluated the potential of combining optical Sentinel-2 dense image time series and machine learning for estimating cover crop biomass considering the diverse cover crop species or mixtures and the capability of such an approach for large-scale applications. The objective of this work was to investigate a methodology using Sentinel-2 satellite optical data and machine learning to estimate single species or mixed winter cover crop biomass in various regions of France. We investigated conventional methods based on vegetation indices from the final satellite observation before biomass collection across different cover crop groups and weed infestation levels. Additionally, we assessed the benefits of employing multivariate methods via machine learning, incorporating various vegetation indices, spectral bands, and dense Sentinel-2 image time series.

2. Materials and Methods

2.1. Study Area

From February to April 2023, fresh aboveground biomass samples were gathered from 50 fields situated in diverse agricultural regions across France, encompassing various climatic conditions based on the classification defined by Joly et al. [53]. This sampling campaign spanned five out of the eight distinct climate types found in France, as illustrated in Figure 1.
The climate of the Southwest Basin features high average annual temperatures (above 13 °C), numerous hot days (>23 per year), limited frost days, a substantial annual temperature range (15 to 16 °C), and moderate interannual variability in both winter and summer temperatures, along with moderately variable precipitation more relevant in winter. The degraded oceanic climate of the Central and Northern plains is characterized by intermediate temperatures (around 11 °C annually) and weak precipitation (less than 700 mm per year), with rain falling for about 12 days in January and over 8 days in July. Altered oceanic climate presents relatively high average annual temperatures (approximately 12.5 °C), few cold days (4 to 8 per year), and a focus of precipitation during winter, leading to relatively dry summers. The clear oceanic climate presents stable, moderate temperatures and abundant annual precipitation (slightly over 1000 mm), with pronounced interannual variation in winter precipitation. Areas with Mediterranean and mountain climates were disregarded as cover crops are negligible in those areas in France (Fendrich et al. [26]; see also Figure 1).
Figure 1b highlights the geographic regions characterized by municipalities exhibiting substantial areas with soils covered by cover crops during the fallow period, by the area where the cover crop coverage exceeds 20%. The monitored fields were distributed in the regions with highest cover crop concentration in France.

2.2. Field Data Sampling Procedures and Cover Crop Characteristcs

The first biomass sampling campaign was organized in September 2022. Fifty fields with different species composition presenting visually different levels of aerial biomass had been selected based on in situ and remote sensing data analysis.
These fields were deliberately selected to include diverse combinations of grasses (such as ryegrass, barley, wheat, and triticale), brassicas (including radish, mustard, and rapeseed), borages (phacelia), flaxes (linseed) and legumes (like vetch, peas, clover, and fava bean), aiming to investigate the accuracy of biomass estimation in mixtures with different plant architectures and leaf types. The data collected concerned the cover crop species but also weeds when they were present (here, weed is defined as plant species that were not planted as the main cover crops and emerged spontaneously afterwards).
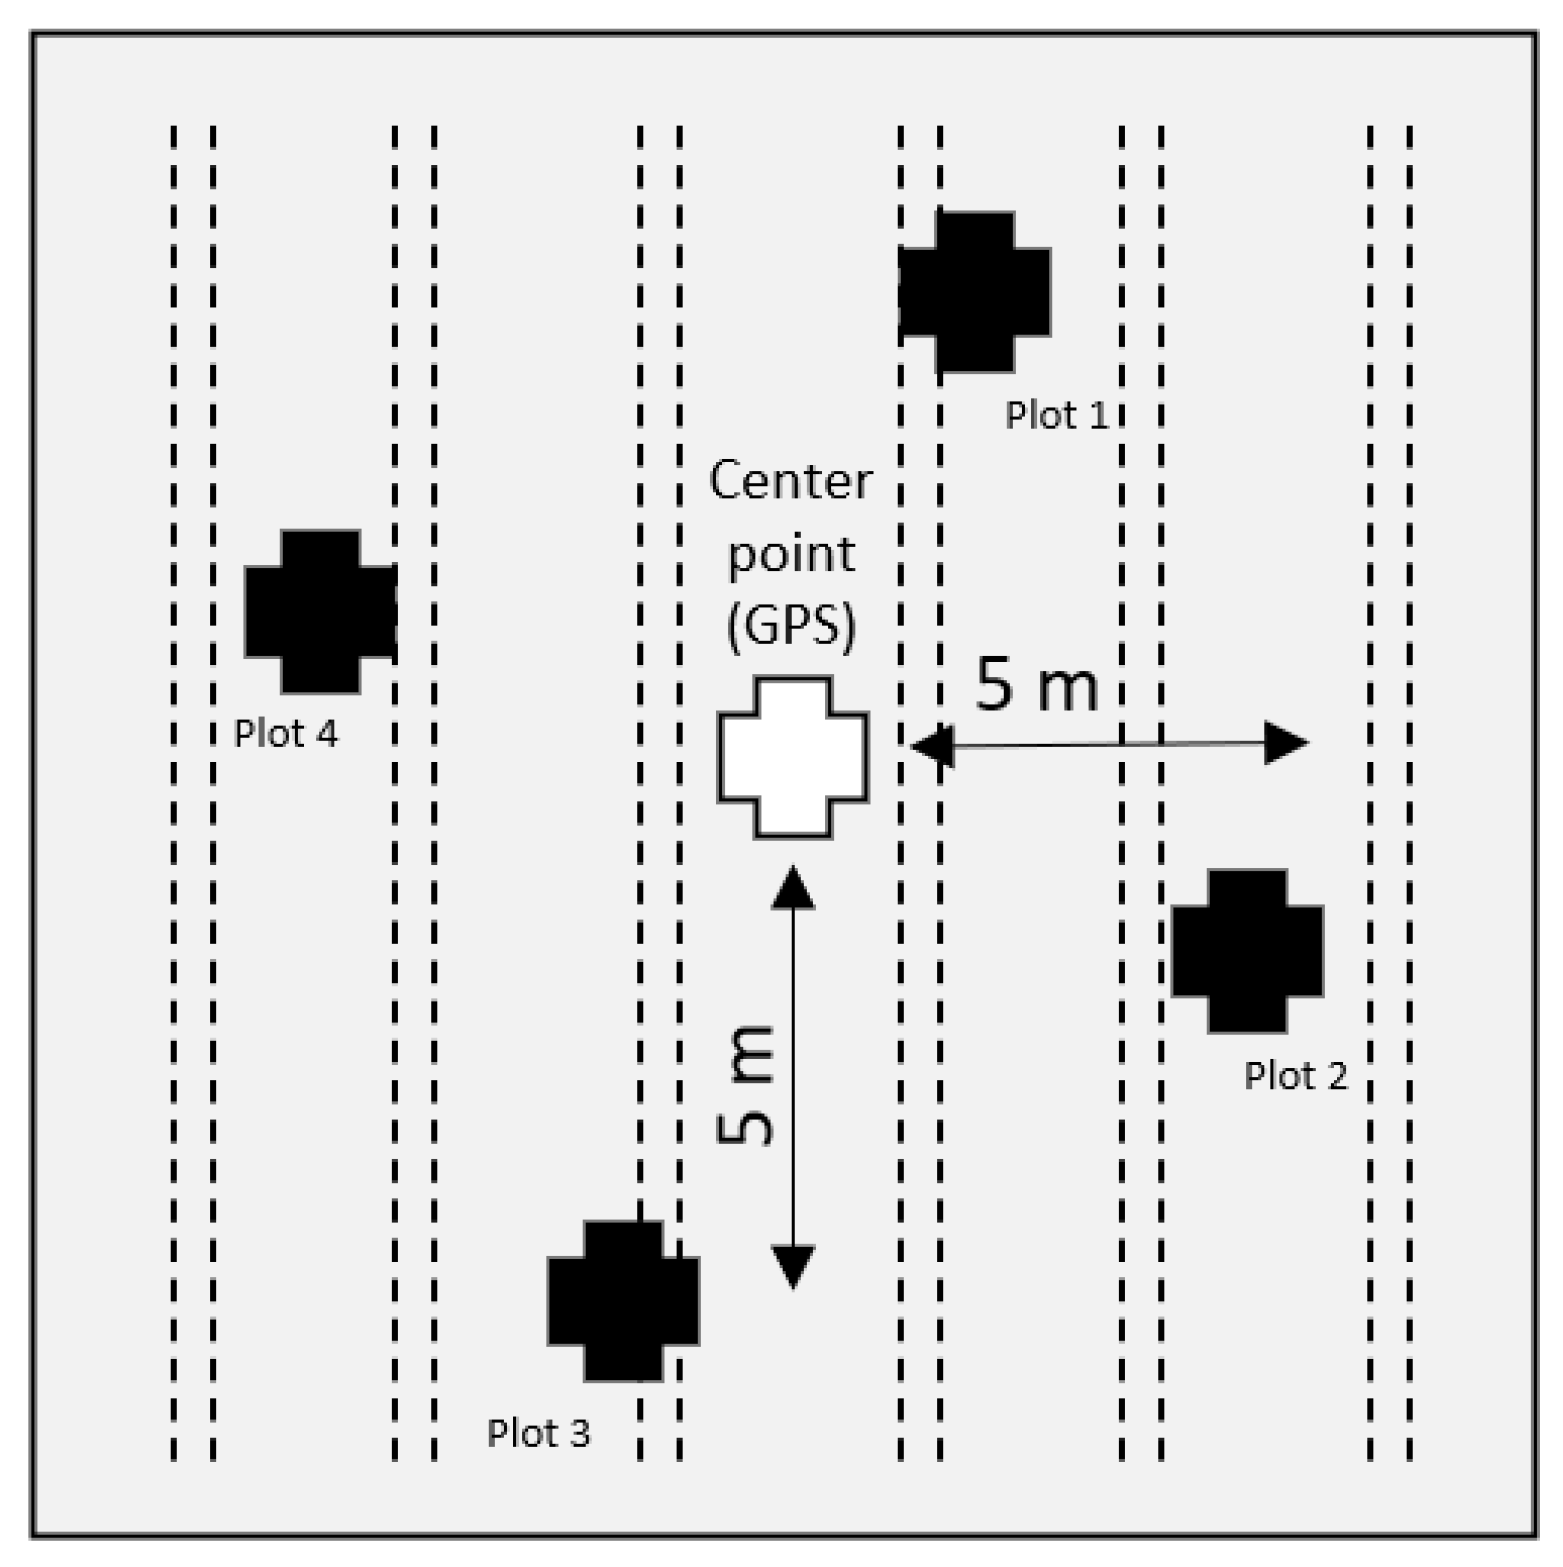
We used the Elementary Sampling Unit (ESU) protocol to collect the fresh biomass samples. The protocol involves defining four square plots, each measuring 1 square meter, around a central point that has been geolocalized using a handheld GPS device (Figure 2). The operator ensured positioning accuracy by consistently verifying satellite signals, thereby maintaining positional accuracies typically falling within the range of approximately 3 m to 5 m.
Within each of these square plots, fresh biomass is collected and weighed in the field. After collection, the biomass samples from each 1 square meter plot are examined, and the most representative or typical sample is selected to be sent to a laboratory for analysis. Between one and three ESUs were collected in each field during the period from February to April 2023, before the cover crops were destroyed. This resulted in a total of 92 ESUs being collected.
Every ESU was situated at a minimum distance of 50 m from the field border and within a uniform biomass area (evaluated by visual means). We did not control previous crop management or intended cash crops planted after cover crop termination.
The selected samples of each ESU were promptly sealed in plastic pouches to prevent moisture loss, then weighed while still fresh in the laboratory (maximum one day lag). Samples were then eventually sorted to separate species and subsamples were oven dried at constant temperature (80 °C) for no less than 48 h until a stable weight was achieved, aiming to ascertain the percentage of dry matter content and derive the production of dry aboveground mass (DAM) measured in metric tons per hectare (t·ha−1) per species at each ESU.
The method for assessing biomass via remote sensing considers dominant species or groups such as grasses, legumes, brassicas, boraginaceous, and weeds. Samples with 70% or more dry weight representation of a single group are categorized accordingly, while those lacking a predominant group are classified as mixed cover crops. Table 1 outlines the variability characteristics of cover crops in the fields, aiding in the implementation of this categorization approach.
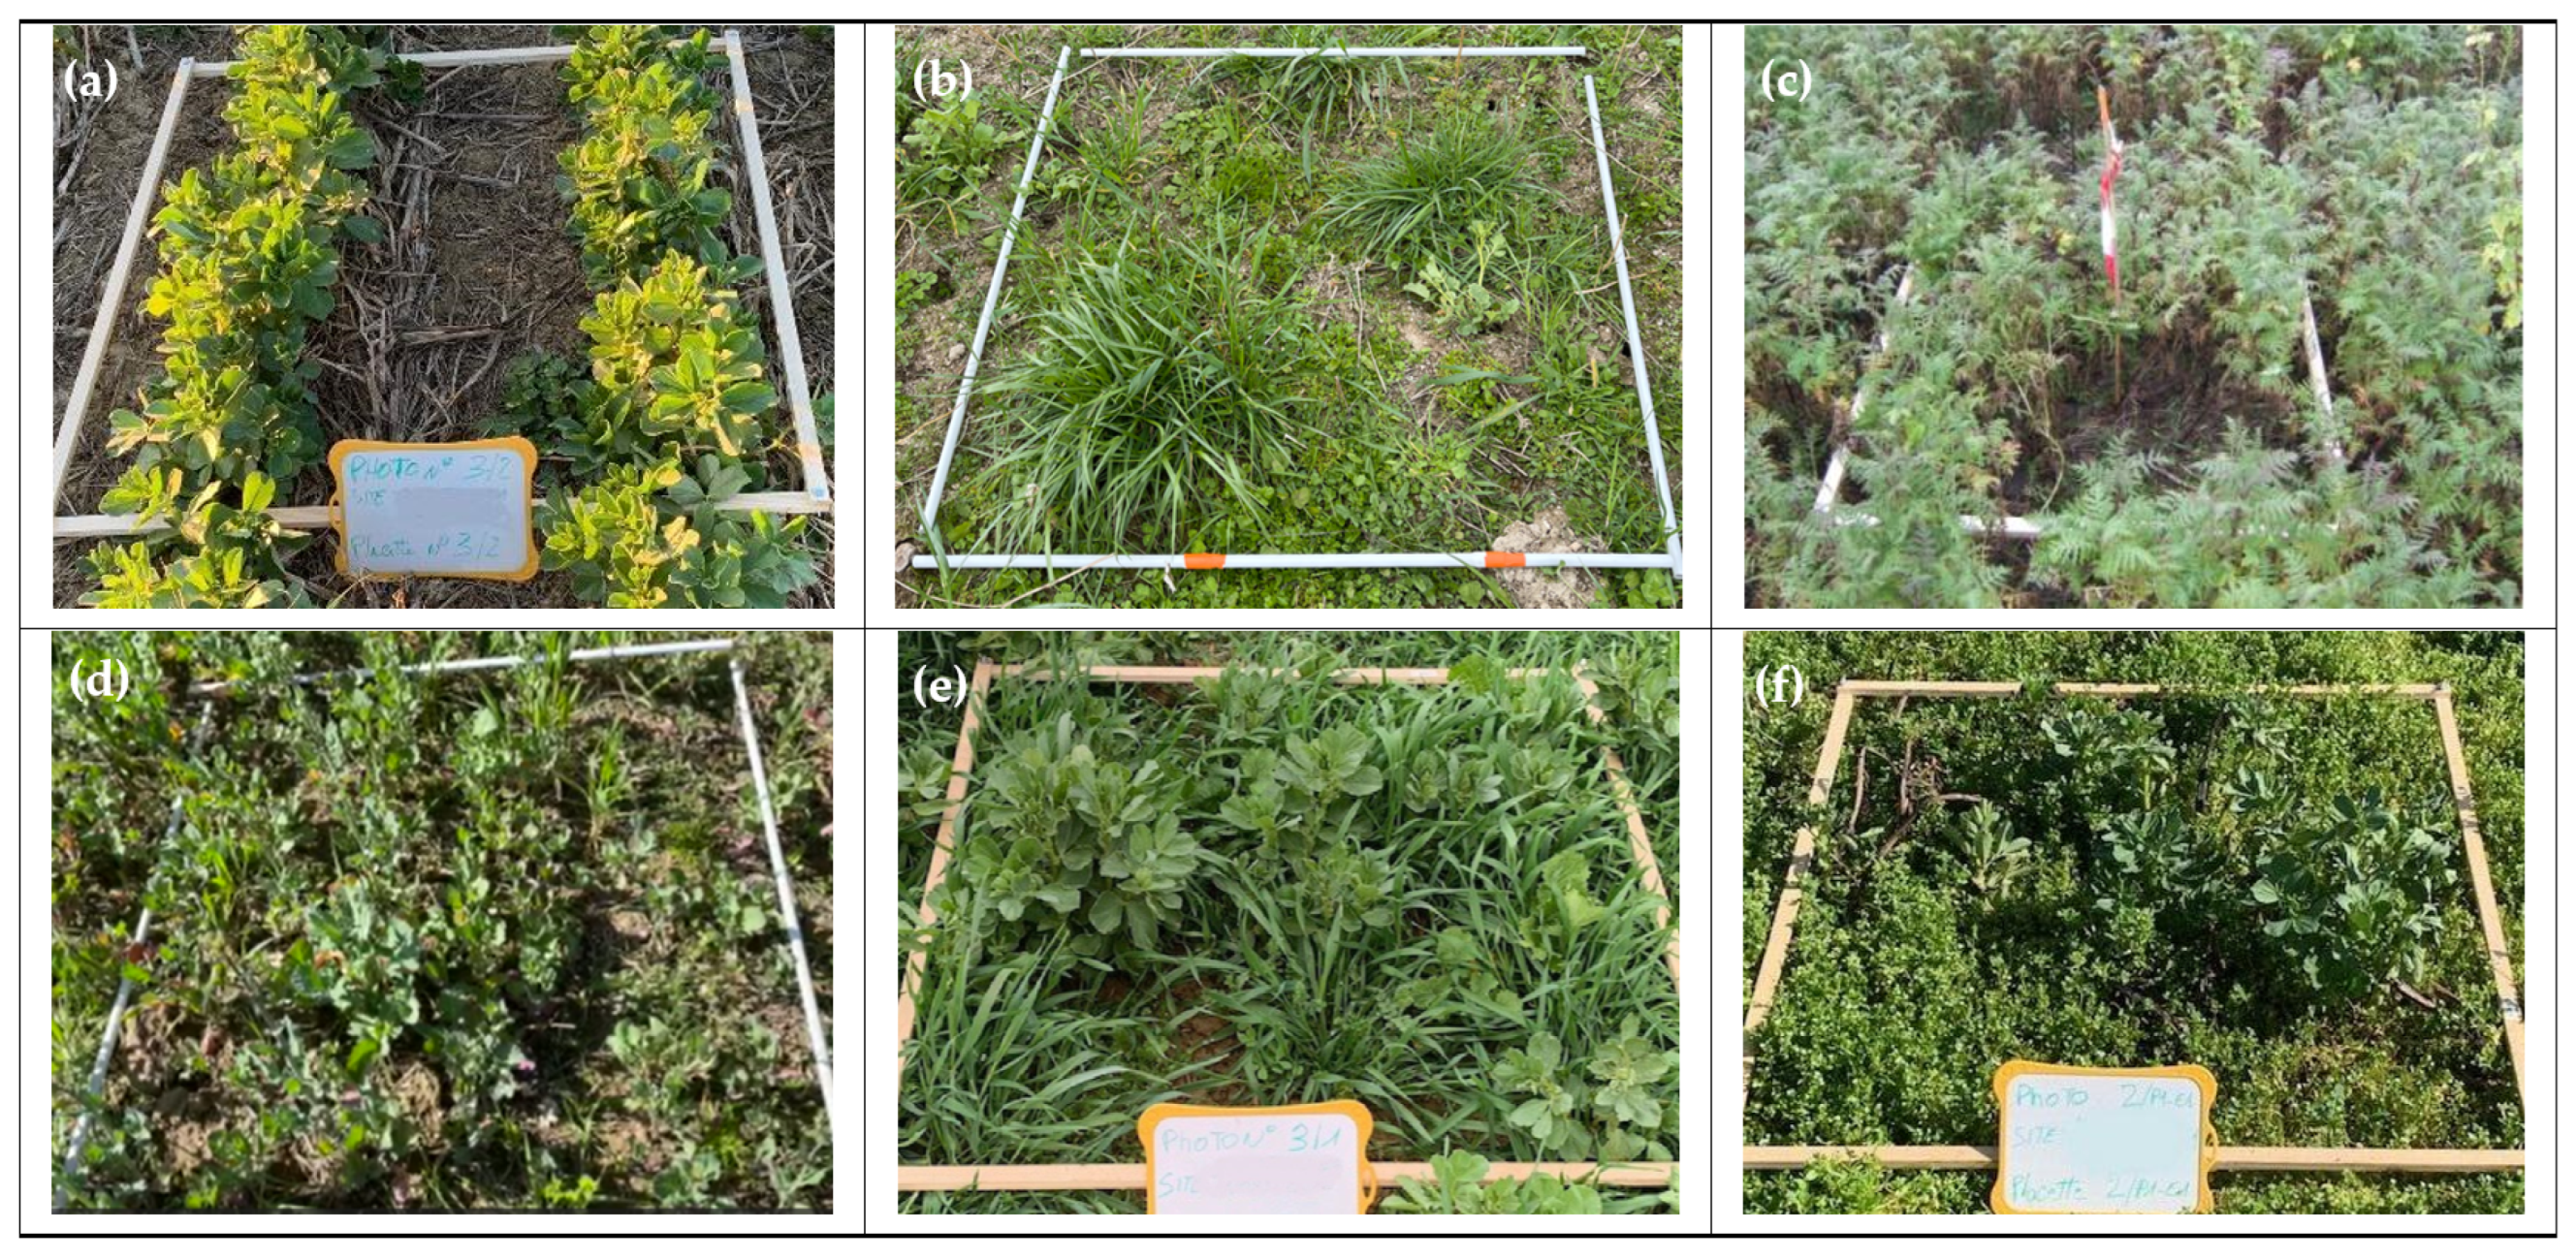
Grasses, legumes, brassicas, borages, flax, and weeds were present in 62, 62, 13, 11, 2, and 50 sites, respectively. Moreover, the number of samples with more than 70% predominance of groups of species were 39, 14, 5, 2, and 4, for grasses, legumes, brassicas, borages, and weeds, respectively, while 28 fields were considered as mixed cover crops. Figure 3 shows examples of ESU samples for each group of species.

2.3. Satellite Data

The analysis was conducted using Level-2A data from the Sentinel-2 Harmonized Collection, employing the sen2cor algorithm for atmospheric correction [54]. For the computation of vegetation indices (VIs), the 10 and 20 m resolution surface reflectance bands (SB) from the Sentinel-2 multispectral instrument were utilized, as outlined in Table A1 in Appendix A. The selection of these specific VIs results from an extensive review of the literature and encompasses VIs closely associated with crop biomass or proxies for crop biomass. This approach aims to assess a multitude of potential band combinations offered by Sentinel-2. Notably, in line with recommendations by Jaramaz et al. [55] and Delegido et al. [56], the incorporation of the red-edge bands is anticipated to augment the accuracy of estimating crop biophysical parameters, such as Leaf Area Index (LAI), which has a direct correlation with aerial biomass [43]. The adopted methodology for cloud and shadow masking involved a combination of the sentinel2cloudless algorithm with the Cloud Displacement Index (CDI). The CDI method harnesses the triad of closely correlated near-infrared bands, each captured from distinct viewing angles. Consequently, lofty entities like clouds exhibit parallax, facilitating their reliable discrimination from other terrestrial objects [57]. The sentinel2cloudless is an automated cloud-detection algorithm for Sentinel-2 imagery [58] based on a gradient boosting algorithm.
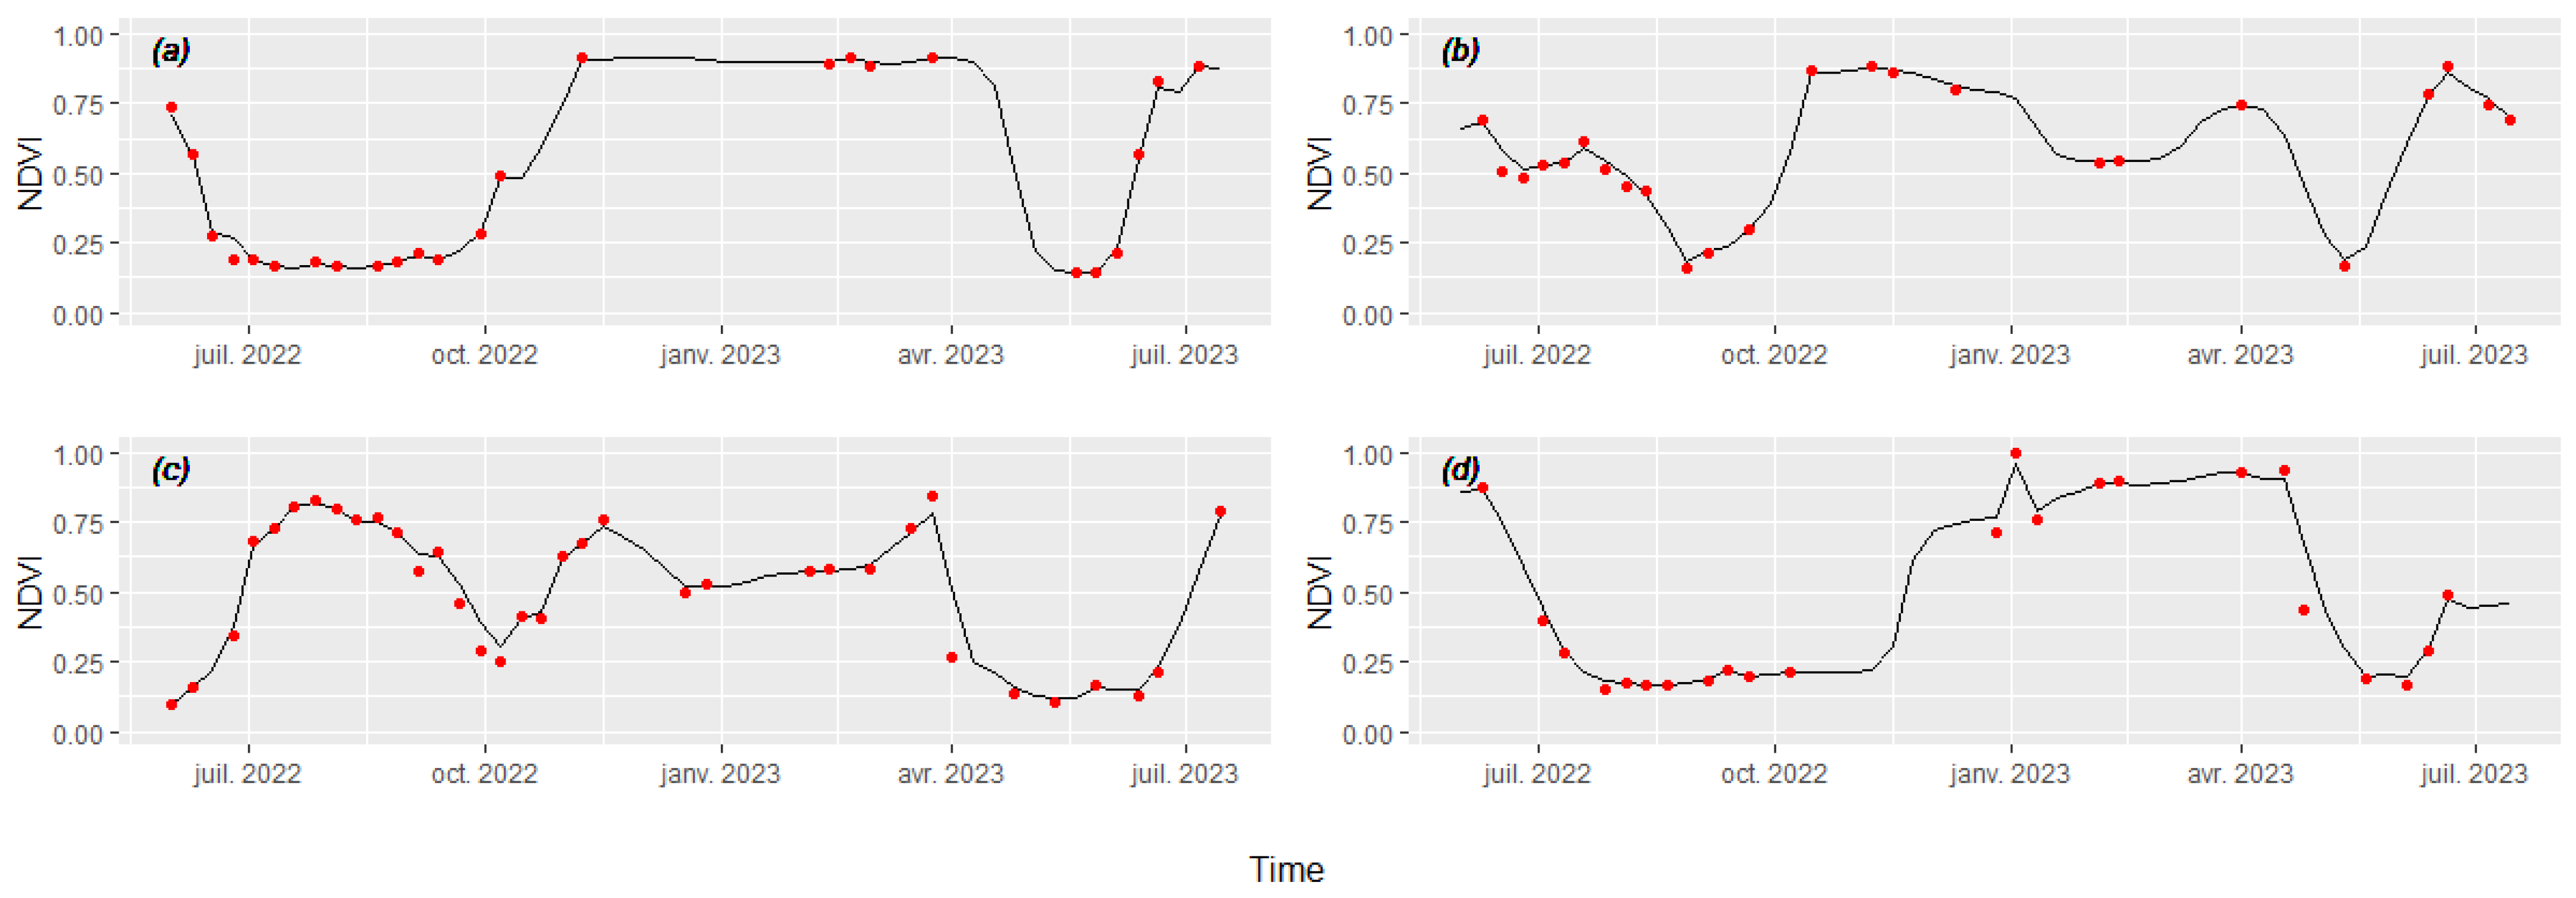
Moreover, we produced dense time series comprising evenly distributed temporal observations, in order to test a multi-temporal approach. To achieve this, we employed the QGIS Plugin GEE Time Series Explorer [59] to extract pixel-based temporal sequences from the Sentinel-2 Harmonized Collection using the same cloud-shadow masks as described before. Subsequently, we applied a composite of Radial Basis Function (RBF) convolution filters as a kernel smoother to address data gaps stemming from cloud and shadow occlusions [60,61]. This approach uses the sigma parameter to define each kernel size, as described in Bendini et al. [61], which for this study were empirically set at σ 1 = 0.25, σ 2 = 0.5, and σ 3 = 2. This was followed by a resampling technique predicated on selecting the maximum value within each 8-day interval. The dense time series generated for each of the 10 SBs and 23 VIs comprised 30 observations between 10 October 2022 and 27 May 2023, resulting in a set of 990 attributes. We examined the Clear Sky Observations (CSO) count for various climatic types throughout this period by analyzing 92 pixel-based time series from sample locations. The percentages of CSO varied across climatic regions, with the degraded oceanic climate in the central and northern plains, altered oceanic climate, clear oceanic climate, and the climatic region of the southwest basin having percentages of 16%, 16%, 20%, and 26%, respectively. In Figure A1, provided in Appendix A, we illustrate interpolation results for a representative sample from each climatic type.

2.4. Methods

To achieve the main objective of this study, which is devising a robust methodology to estimate winter fallow cover crop biomass in France using Sentinel-2 data, our initial step involved an analysis to determine the most effective combinations of spectral bands, vegetation indices (VIs), and statistical models. Employing a cross-validation approach akin to methodologies previously utilized by Goffart et al. [43] and Swoish et al. [62], we used the last image before in situ sampling.
Subsequently, we scrutinized all VIs and spectral bands through a multivariate approach using different machine learning models, to harness the full spectral data encapsulated within Sentinel-2 imagery considering the last available image before the sampling.
Finally, we performed a multivariate analysis encompassing satellite observations spanning the entire phenological cycle of the cover crops. This comprehensive evaluation aimed to discern the advantages of integrating temporal information.

2.4.1. Empirical Relationships with Spectral Bands and Vegetation Indices Using the Last Available Image before the Sampling

The process entailed extracting 10 and 20 m Sentinel-2 surface reflectance data, along with calculating VIs, from cloud-free images using a 20 m radius buffer around each sampling point, aligning with the GPS positions of the 92 ESU samples. This extraction yielded median values representing each sample, encompassing 12 to 14 pixels at 10 m resolution and 2 to 4 pixels at 20 m resolution bands. Our analysis predominantly favored regression models for biomass estimation based on VI values, emphasizing instances where the coefficient of determination (r2) increased and the root mean square error (RMSE) decreased. A smaller RMSE means higher accuracy in biomass estimation, as it is an absolute measure of error [63]. Additionally, the relationships were tested at a level of significance of 5% ( α = 0.05). Following the procedures described by Goffart et al. [43], we tested a linear model, a polynomial model (2 degrees), and exponential and power models. These analyses were performed using R software (Version 2023.03.1) [64].

2.4.2. Multivariate Analyses Using Machine Learning Algorithms

Following an assessment of the empirical relationships between the last available cloud-free images before the sampling and the dry aboveground biomass, considering various vegetation indices and spectral bands, our exploration extended to employing advanced multivariate methodologies utilizing machine learning techniques. This approach aimed to harness the potential of all the spectral data encapsulated within Sentinel-2 imagery. We encompassed the utilization of prominent machine learning (ML) regression algorithms prevalent in contemporary literature, including the Random Forest (RF) Regressor, Support Vector Machine (SVM), and extreme Gradient Boosting (XGBoost). Random Forest regression constructs decision tree ensembles in training, leveraging individual predictions averaged for the final output. It introduces randomness through bootstrapped samples and random feature subsets to curb overfitting [65]. SVM is a robust supervised learning algorithm used for classification and regression [66]. It seeks optimal hyperplanes by maximizing margins in higher-dimensional spaces, effectively segregating data points and minimizing errors. XGBoost [67] is a machine learning algorithm which works sequentially building decision trees and correcting errors using gradient descent optimization, in order to ensure model accuracy while preventing overfitting. These ML algorithms have been widely used in the remote sensing field, both for regression problems like biomass and yield estimation [45,68], and for Land Use and Land Cover classification [69,70].
Additionally, to assess the added value arising from the time-related information gathered during the growth stages of the cover crop cycle, we utilized the most effective machine learning algorithm obtained in the previous step. A regression analysis was conducted using the dense time series encompassing all VIs and spectral bands as predictors for the dry biomass estimation. Subsequently, we employed the Random Forest algorithm for the variable importance analysis, aiming to identify the most essential variables in order to reduce the dimensionality of the input data and to propose a robust model with a lower computational cost.
The SVM algorithm was refined using a radial kernel and a grid search over the cost parameter (0–10) and gamma (0.1–1). Similarly, the RF model underwent grid search tuning over the maximum number of nodes (1–10) and number of trees (50–500), with RMSE as the evaluation metric. The XGBoost model was optimized using grid search to explore hyperparameters, with ranges empirically chosen: 0–500 for boosting rounds, 0.01–0.3 for learning rate, 3–15 for maximum tree depth, and 0–1 for minimum loss reduction. The e1071 [71], randomForest [72], caret [73], and xgboost [67] R packages were used for the modeling exercises.

2.5. Validation

To enhance the robustness of our model’s performance estimation beyond a single train–test split, we employed a cross-validation approach. This strategy involved stratification based on the spatial geometry of fields within each ESU to prevent samples from overlapping between training and testing subsets, thus mitigating potential biases from spatial redundancy. The dataset was randomly divided into training and testing sets, with 70% allocated for training and the remaining 30% for testing. This process was repeated 1000 times to generate multiple train–test pairs. Subsequently, metrics including Cross-Validation Root Mean Square Error (CVRMSE), R-squared (r2), and Mean Absolute Error (MAE) were averaged across the 1000 iterations to yield an overall assessment of the model’s performance. We also calculated the variance of the estimators using the infinitesimal jackknife method [74]. The infinitesimal jackknife is a variance estimation technique that iteratively removes very small continuous fractions of data from a dataset, aiming to approximate the variance of an estimator more efficiently than the traditional jackknife method by considering continuous, infinitesimal alterations instead of individual observations [74]. The randomForest [72], caret [73] and randomForestCI [75] R packages were used for the validation methods.

2.6. Model Spatialization of the Final Dry Biomass on the Experimental Fields across France

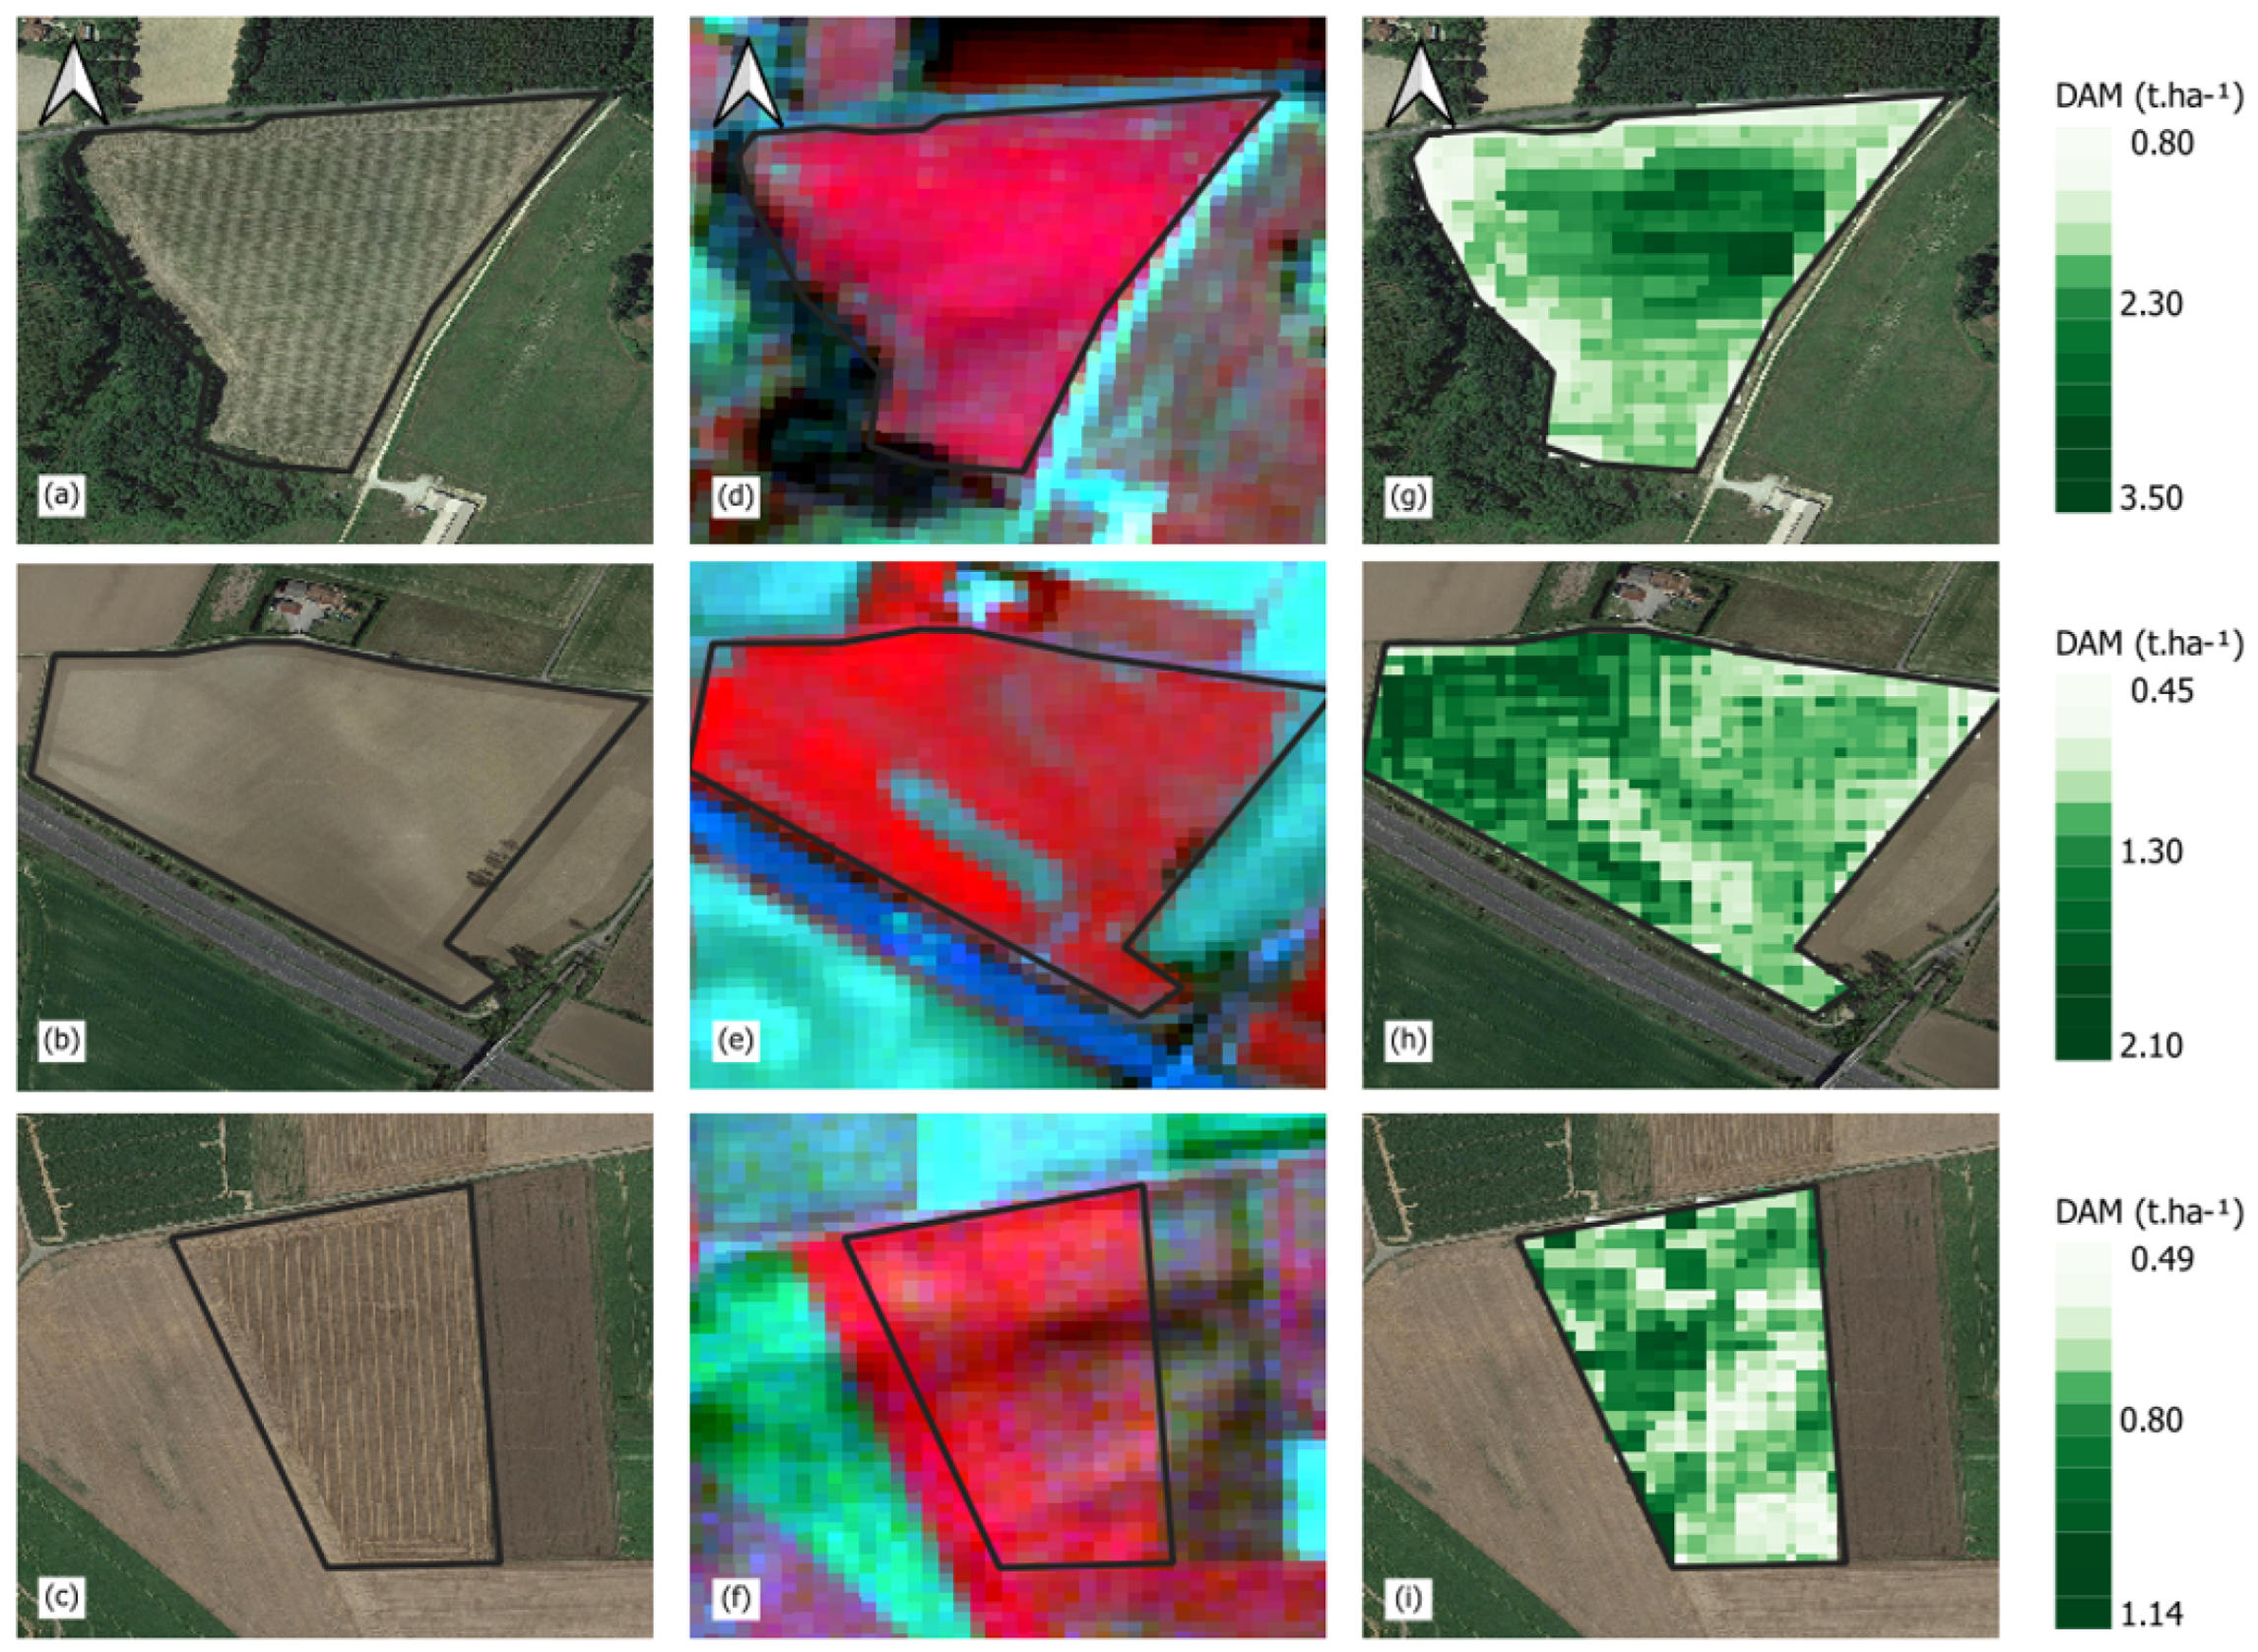
To visually analyze the variation within fields regarding final dry biomass predictions and demonstrate the potential scalability of the approach presented in this work, we implemented it across all fields to generate final dry aboveground biomass maps. Initially, we extracted Sentinel-2 satellite images and applied cloud-shadow masks using the Google Earth Engine (GEE) Python API. Subsequently, we performed interpolation and resampling of the pixel-based time series, following the methodology described before, creating cloud-shadow-free Sentinel-2 data cubes for each field. This process considered the selected predictor variables from the chosen model. Finally, we applied the proposed model using the scikit-learn Python package [76] to produce the final dry biomass maps for each field. We show some examples with different levels of intra-field spatial variability.

3. Results

3.1. Cover Crop Characteristics

The distribution of the sampled biomass per crop type, the median and standard deviation values of dry aboveground biomass, the water content, and weed percentages of the field measurements are presented in Table 2. The average biomass for all the crop types is in line with what was reported by other authors [43,62] with values of DAM ranging from 0.69 to 5.08 t·ha−1.
We observed notable variations in DAM values in different groups of plants. Specifically, the weed group presented higher DAM values, with an average of 5.08 t·ha−1, while the brassica group presented lower values, with an average of 0.69 t·ha−1. When examining the variability within each group we can see that certain groups demonstrated greater DAM variability than others. The groups containing grasses and weeds exhibited the highest standard deviations, with values of 1.42 t·ha−1 and 2.71 t·ha−1, respectively. Additionally, these groups displayed notable variability in water content, with standard deviations of 4.88% and 5.31%, respectively. Even though the group with mixed species demonstrated less variability in dry biomass, it exhibited significant variation in water content, emphasizing the diverse conditions present in the field. In contrast, the legumes maintained a relatively consistent water content.
The species composition of each group considering the final dry aboveground biomass percentage of each species was analyzed. The grass group was composed of rye (19%), Italian ryegrass (26%), triticale (6%), spelt (2%), barley (11%), oat (4%), and other non-identified grasses (25%). The legume group was composed of fava beans (88%) and weeds (9%). The borage group was composed of 95% of phacelia, while the group of brassicas presented 55% of rapeseed and 34% of non-identified brassicas. Finally, the mixed group presented fava beans (29%), rye (9%), clover (3%), vetch (2%), Italian ryegrass (4%), oat (8%), phacelia (4%), triticale (7%), rapeseed (3%), spelt (2%), and weeds (23%). The weed group was mostly found in fava bean fields. In the end the fava bean represented less than 25% of the biomass of these fields.

3.2. Cover Crop Satellite-Based Phenology and Spectral Behavior

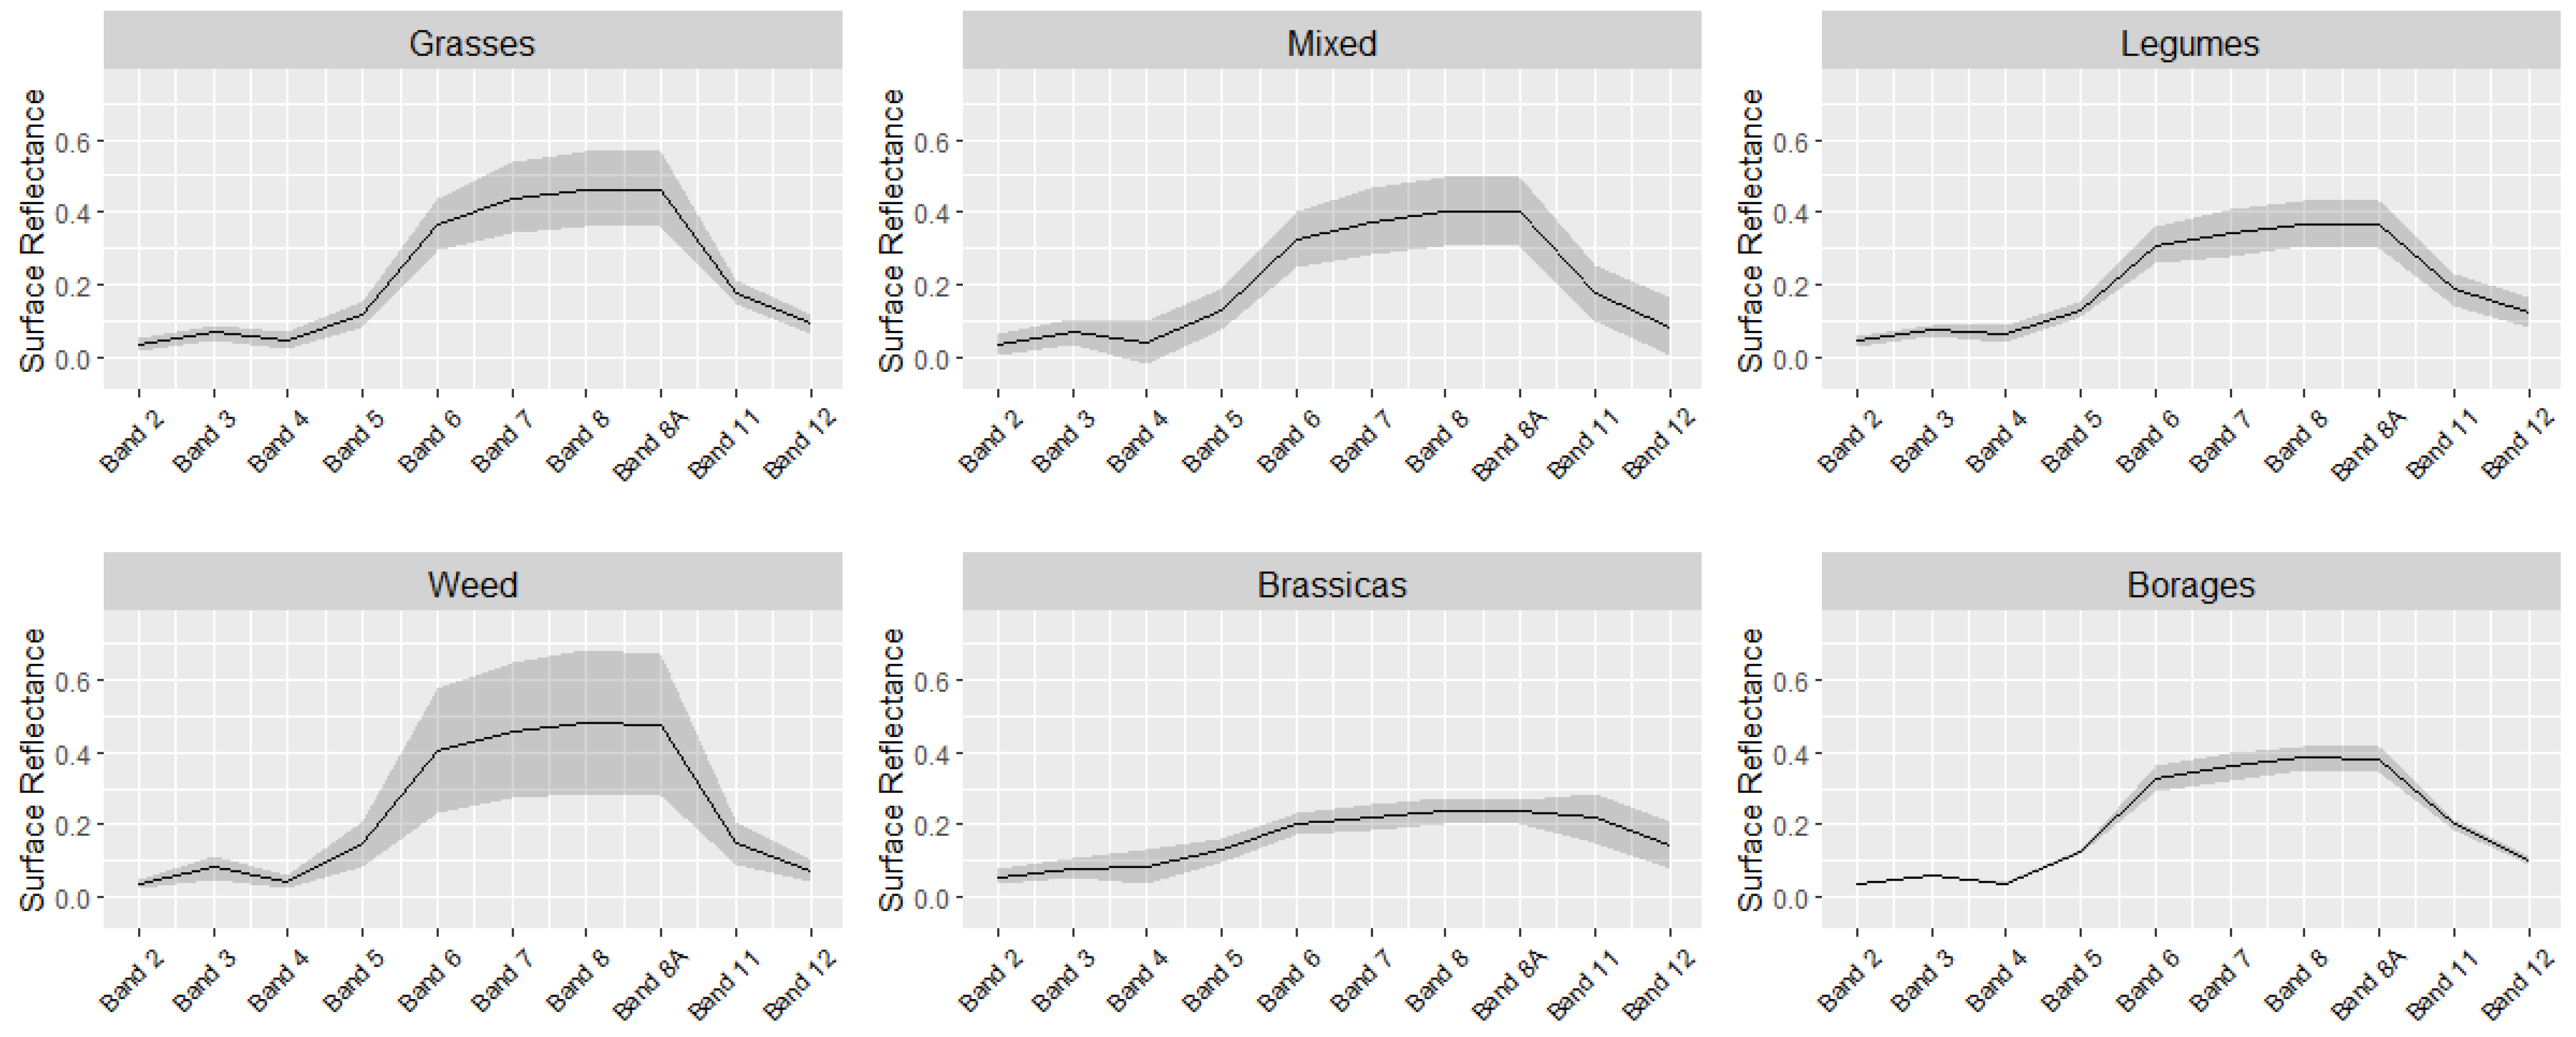
We derived pixel-wise spectral profiles from the Sentinel-2 spectral bands with the last available image of each sampled pixel. Figure 4 shows averaged spectral profiles, with the respective standard deviations for each group.
Upon analyzing Figure 4, one can observe the pronounced variability in the spectral characteristics of weeds, grasses, and mixed groups. Additionally, the brassicas group displays reduced absorption in the red band and heightened absorption in the infrared regions. This observation potentially indicates that the vegetation within the brassica group might have already reached senescence by the sampling date (see here below).
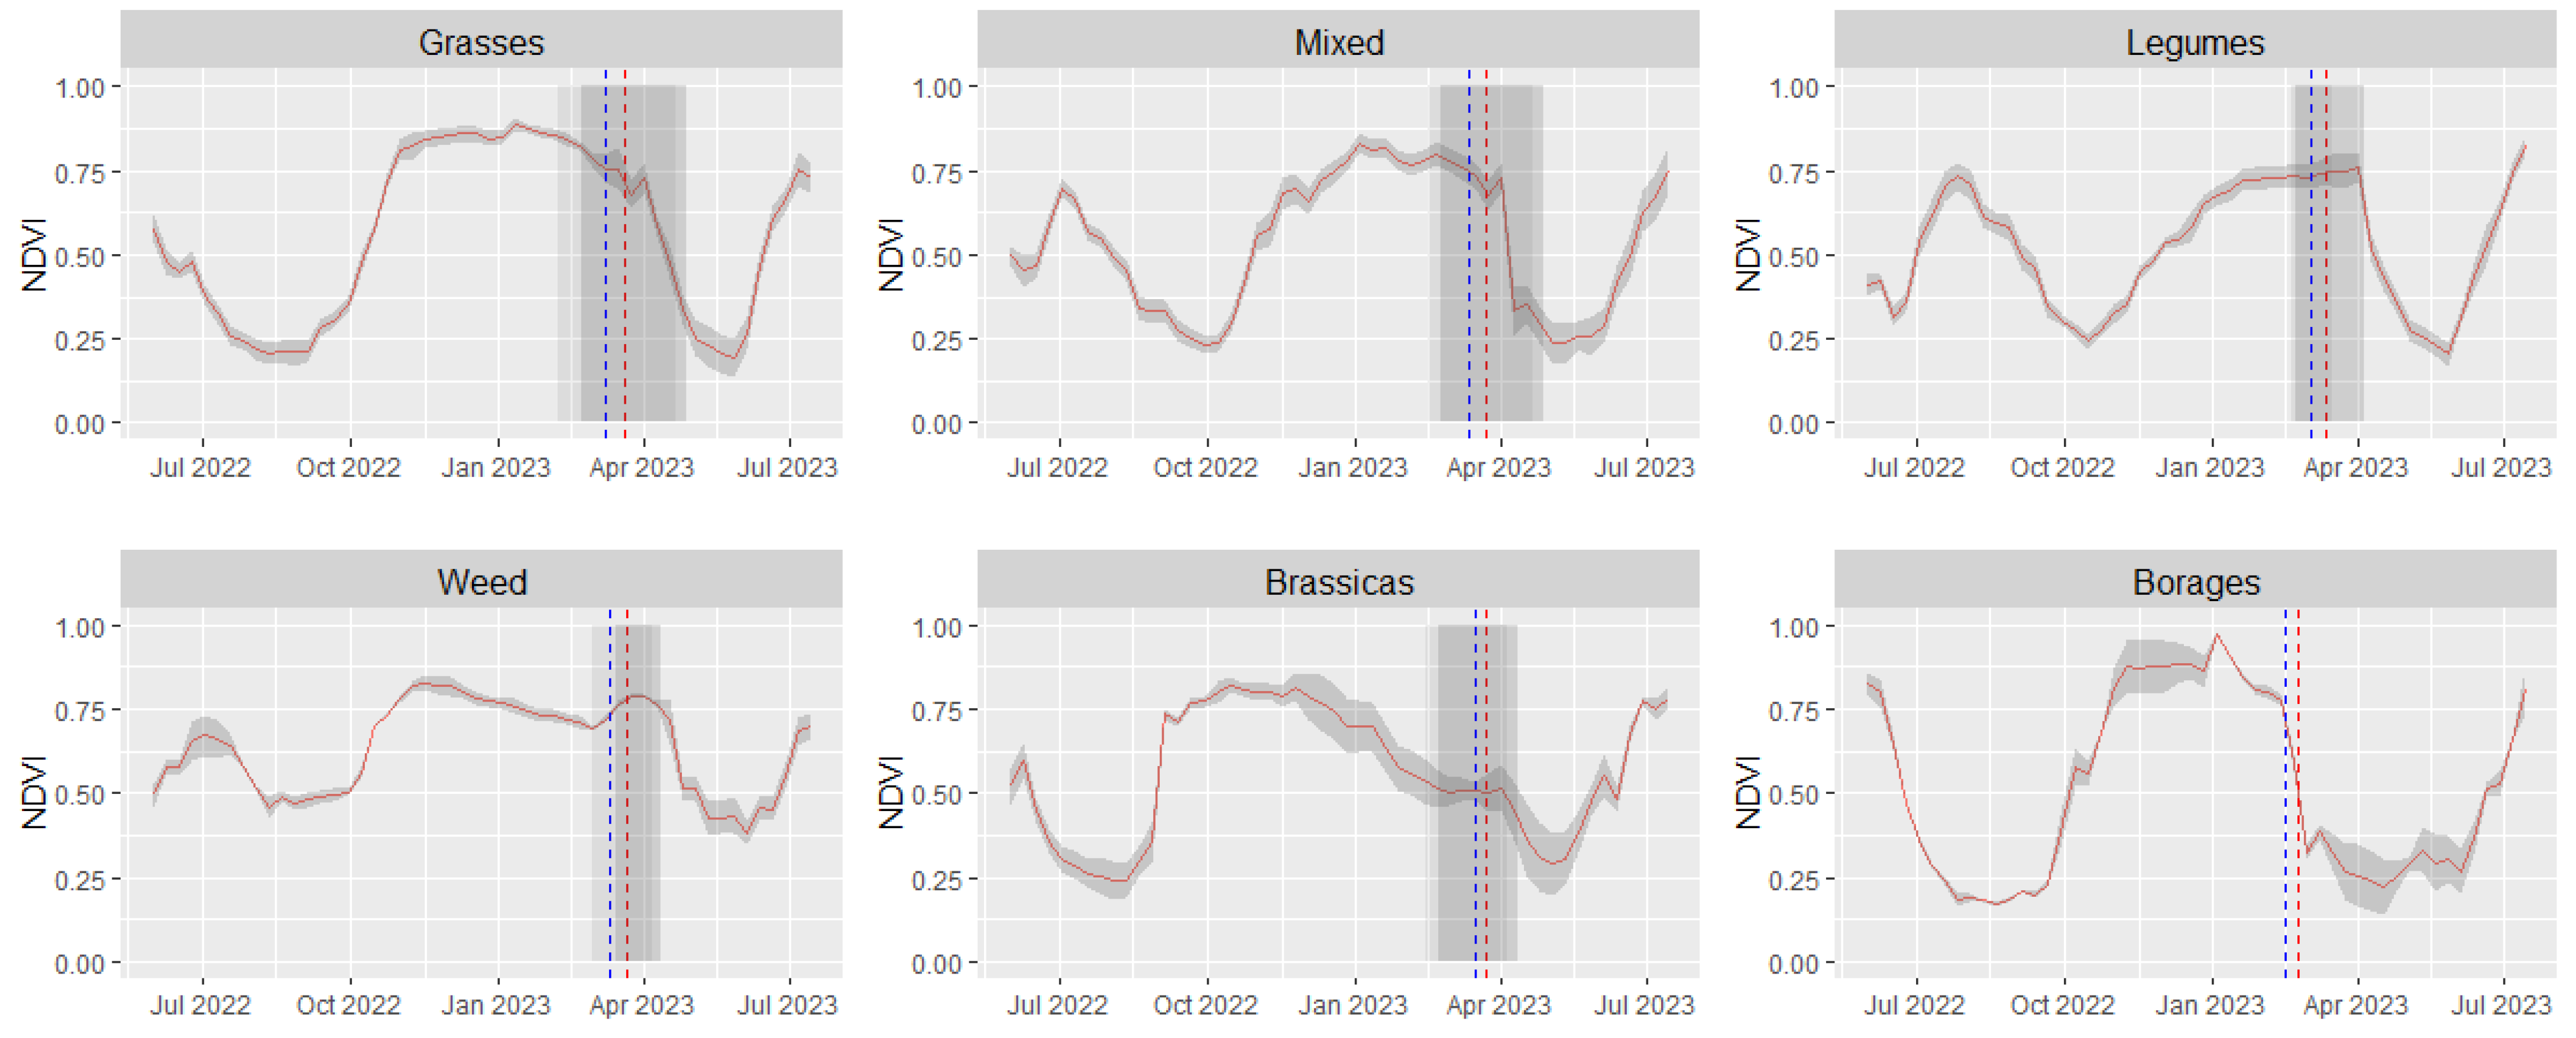
We also derived pixel-wise NDVI fitted time series with 8-day temporal resolution for the period of July 2022 to July 2023. Figure 5 shows averaged profiles for the target period, with the respective standard deviations for each group on the pixels of all the study sites.
The behavior of the grasses group exhibited a spectral–temporal pattern, wherein the NDVI values peaked at around 0.85 in late February. The higher NDVI values may not directly correlate with final biomass but could indicate increased photosynthetic activity rather than fresh biomass. A relatively gradual decline was noted from March to May, suggesting that the cover crops might not have been terminated abruptly through methods such as mowing or plowing, but rather by the possible use of herbicides. In contrast, the legumes and the borages demonstrated abrupt decreases in NDVI values. The same was observed for the mixed group, which contains a higher composition of fava beans (29%), which may have dominated the observed spectral–temporal behavior. The brassica category, primarily led by rapeseed, exhibited an earlier and faster start of the season (sowing/emergence dates), displaying a notably distinct pattern. The vegetative peak occurred in December, coinciding with the onset of decreasing NDVI values. This decline might signify either an accelerated senescence triggered earlier than usual or issues hindering crop development post this period. We verified that these fields were affected by negative temperatures during December, which hindered their development, which can also be observed from the spectral profile in Figure 4.

3.3. Assessment of the Empirical Relationships between VI/SB Values and DAM

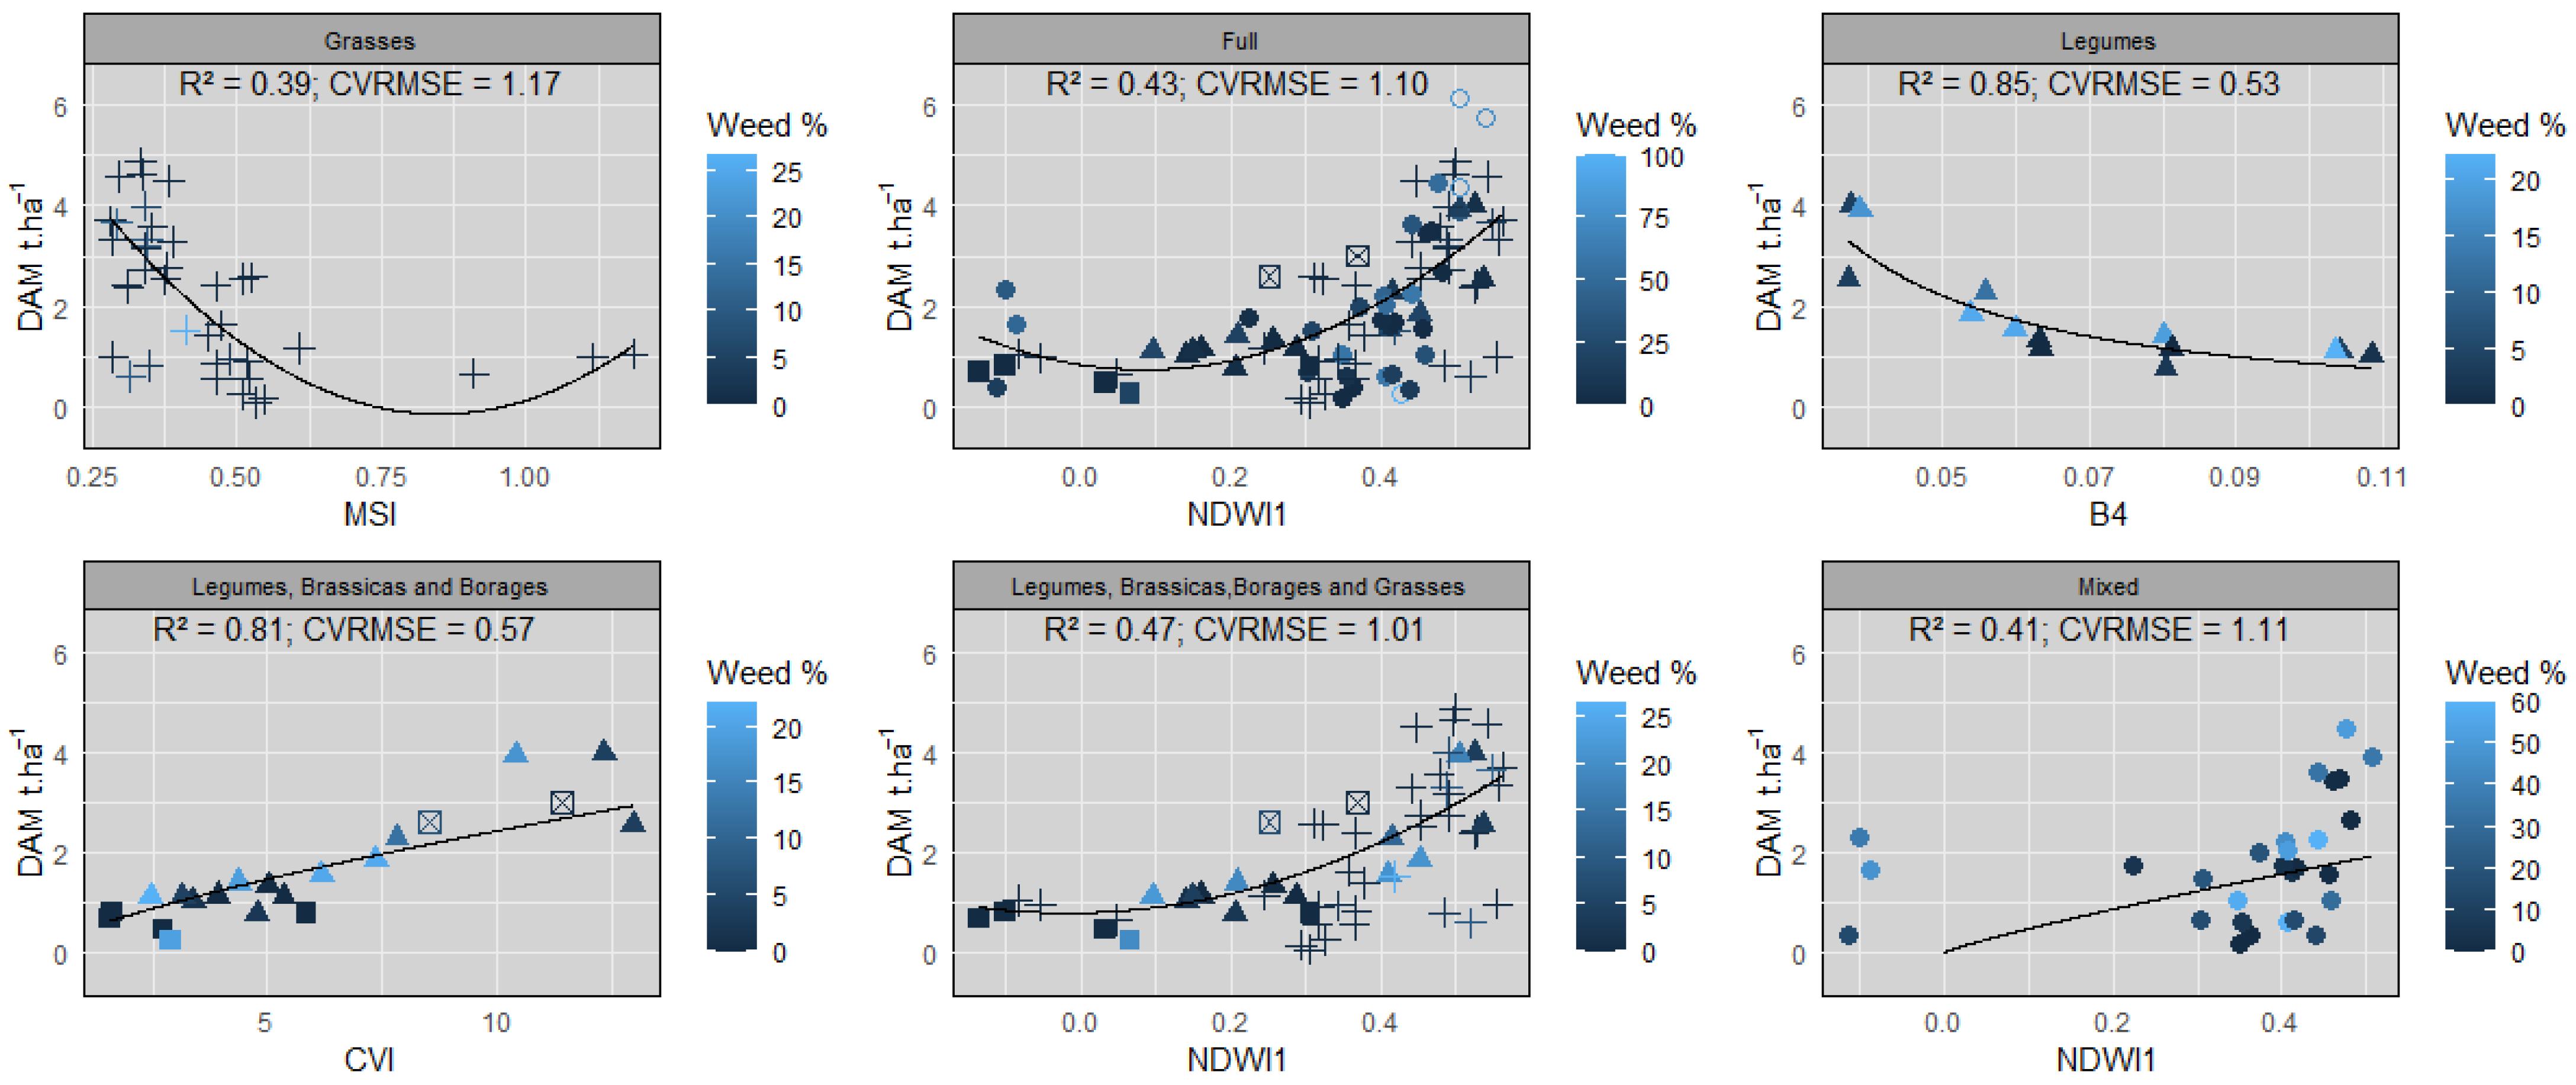
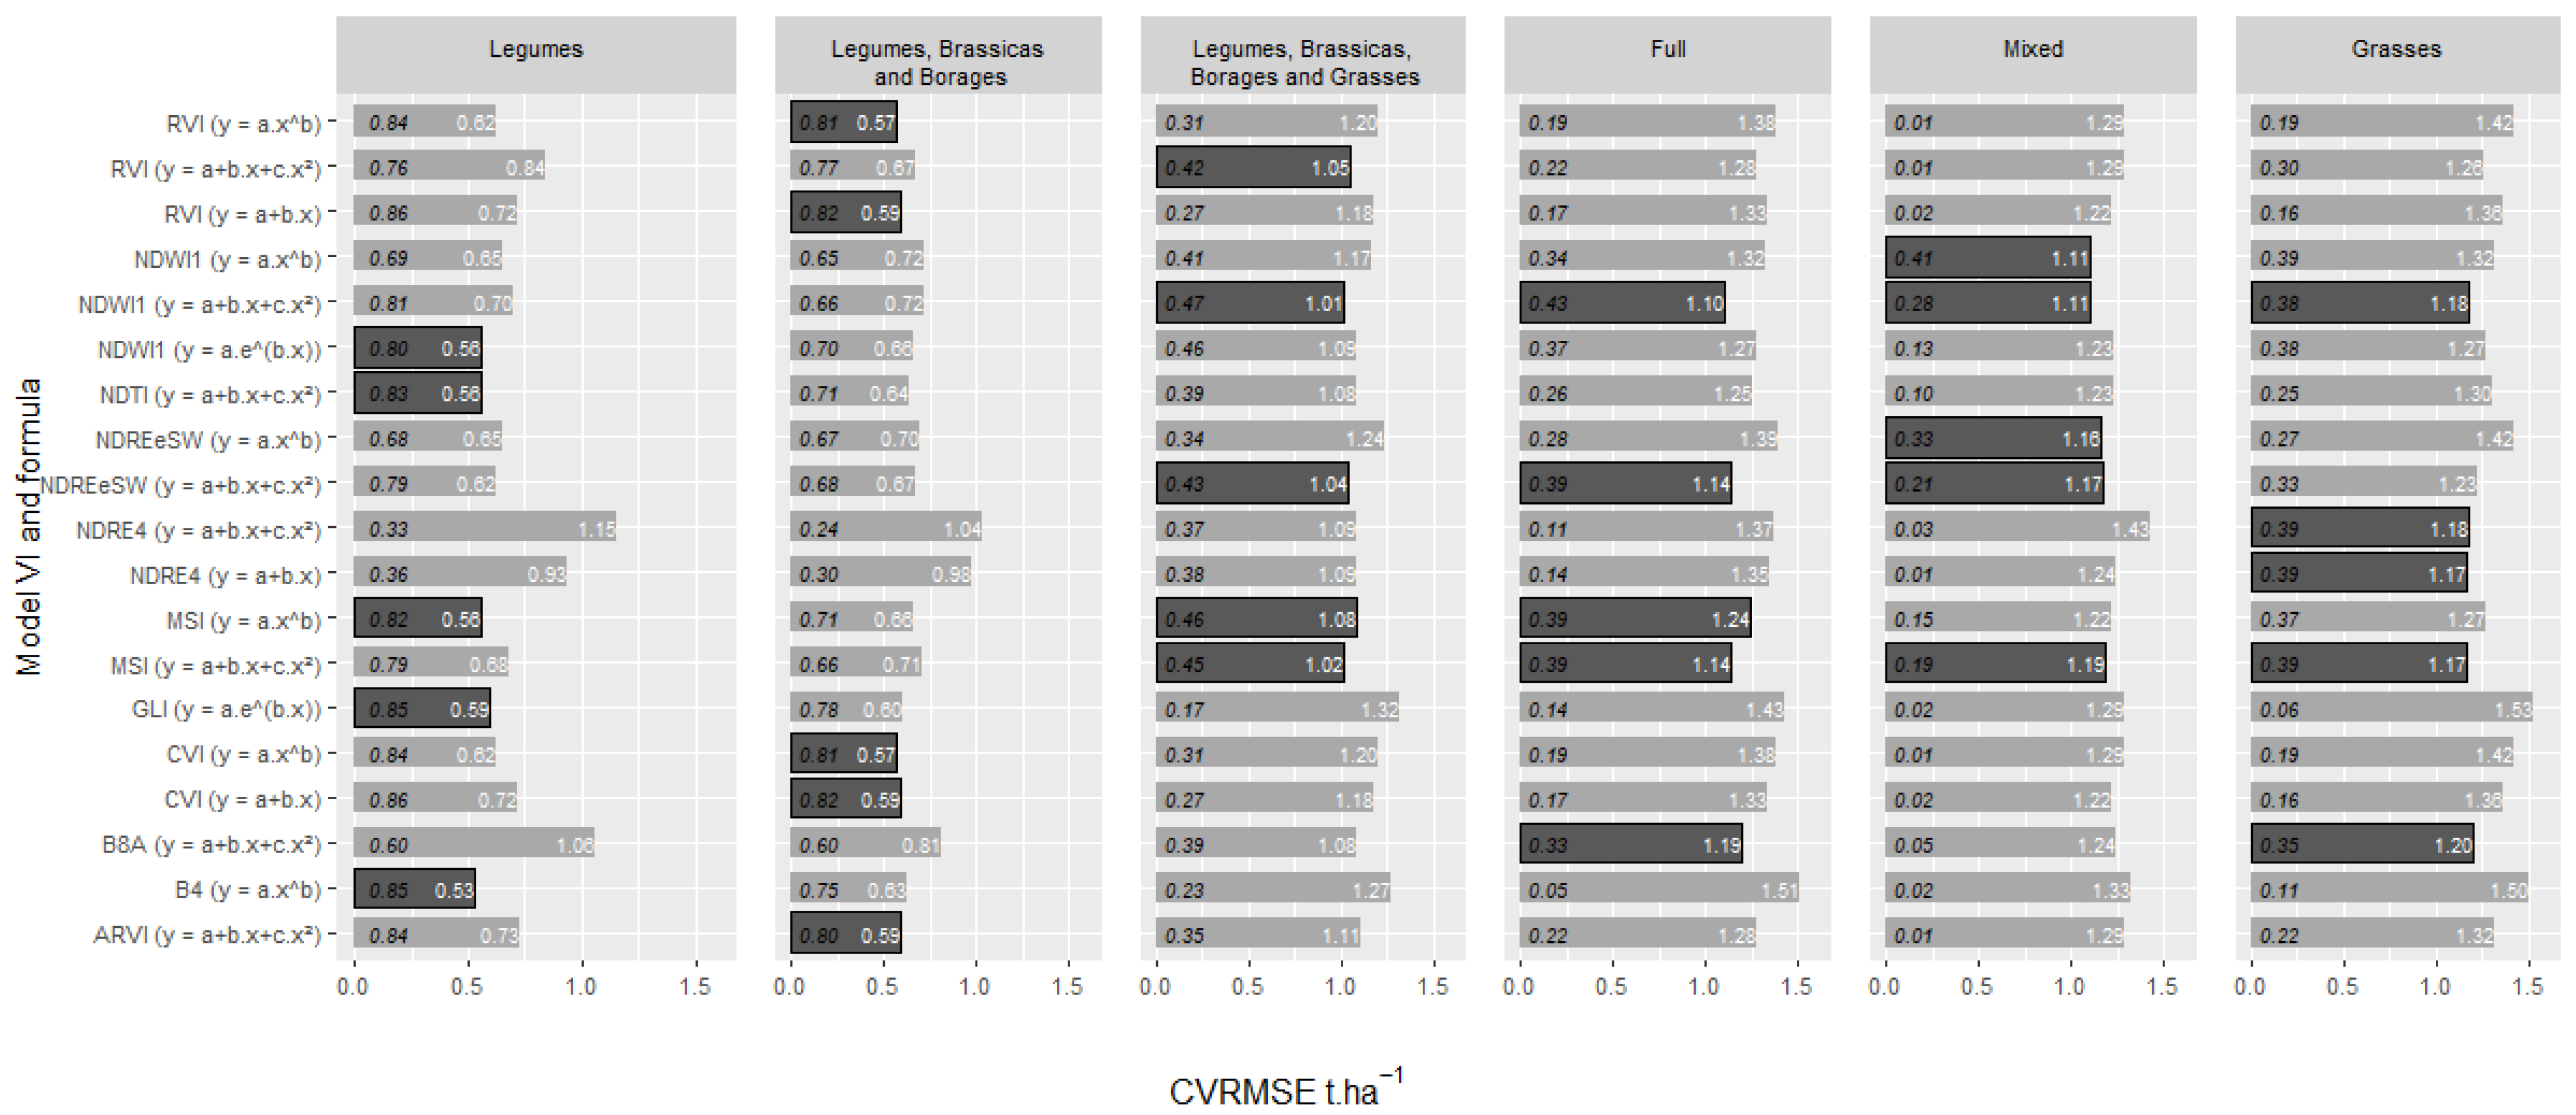
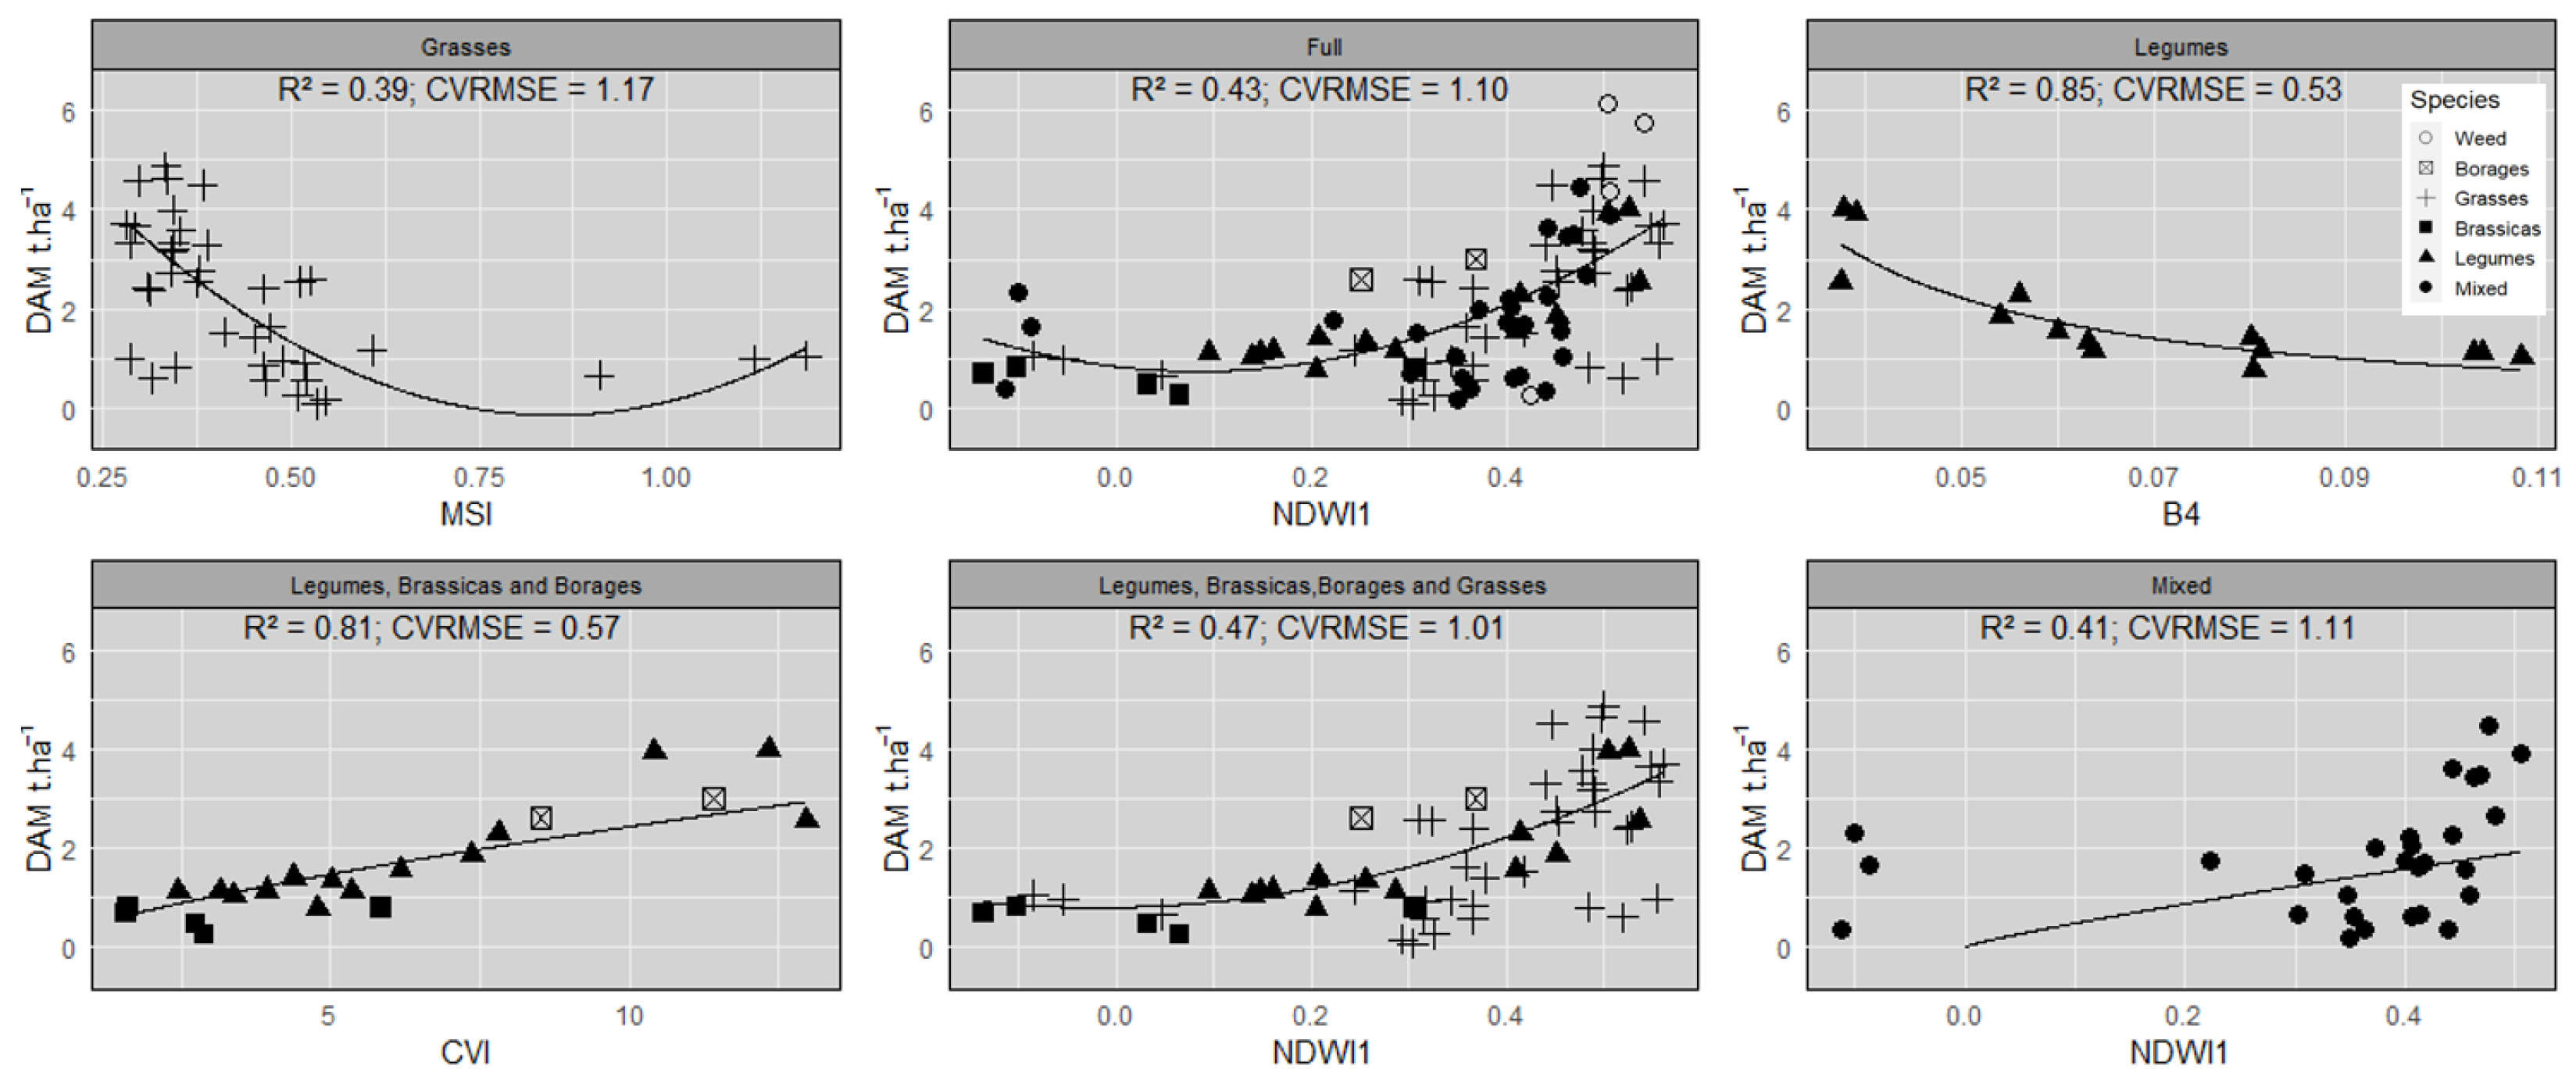
Overall, the average of the absolute difference of the days from field sampling to imagery collection was 11 days. In this study, a model should be understood as a combination of a model type (e.g., linear regression, power, etc.) and a VI or SB (e.g., MSI or B8A). In total, 132 models were tested (4 model types × 33 VIs/SBs). The selection of the five best models per winter cover crop group, based on the CVRMSE, is presented in Figure 6. The best models usually consider an exponential (y = a·eb·x), power (y = a·xb), or polynomial (y = a + b·x + c·x2) relationship (Figure 6 and Figure 7). For pure stands, the CVRMSE of the five best models varies between 0.53 and 0.59 t·ha−1 for legumes, and between 1.17 and 1.2 t·ha−1 for grasses. R2 is around 0.83 for legumes and 0.38 for grasses.
According to CVRMSE and r2, legume models perform better than grass models. The CVRMSEs observed for the mixed group and for the full dataset, respectively, 1.15 t·ha−1 and 1.16 t·ha−1 on average for the five best models, are higher than the CVRMSE observed for pure stands of legumes (0.56 t·ha−1), even when grouped with borages and brassicas (0.58 t·ha−1). This shows clearly that, when mixing with grasses, the relationship between the VIs and SBs in the last available image before the sampling with the biomass are strongly affected. R2 is a bit bigger for the full dataset, with an average of 0.39, rather than the mixed group (r2 = 0.28). The average DAM value for the full dataset was 2.01 t·ha−1, while for the mixed group it was 1.67 t·ha−1. The weak relationships for the grasses can be related to the higher number of samples, which incorporates more variability. This can be seen when analyzing Figure 5, which shows the range of the dates of sampling compared to the range of the dates of the last available images. Additionally, the grasses exhibited a lower biomass than expected. Prior studies by Swoish et al. [62] and Kharel et al. [45] have indicated a higher biomass within this group. Upon visual inspection of the samples in the field, it was observed that the grasses did not grow optimally, displaying significant soil exposure during periods of low coverage (refer to Figure 3) and registering lower water content, as shown in Table 2.
Considering the full dataset, the relationships are notably weak and limited. The best model showcases a CVRMSE of 1.1 t·ha−1 and an r2 of 0.43. Only 3.03% of the tested models exhibited a CVRMSE lower than 1.2 t·ha−1 and all of these models were of the polynomial type. Goffart et al. [43] identified a CVRMSE of 0.59 t·ha−1 for the best model concerning their full dataset, albeit its substantial limitations. Only 8.1% of the models tested exhibited a CVRMSE lower than 0.69 t·ha−1. It was even worse for the mixed group, where, with our data, only 1.5% of the models showed a CVRMSE of less than 1.2 t·ha−1 and an r2 higher than 0.3, while Goffart et al. [43] found that 23% of models have a CVRMSE of less than 0.7 t·ha−1 (the CVRMSE of the best model being equal to 0.6 t·ha−1). Nonetheless, their study encompassed a smaller region characterized by reduced species diversity and less diverse climatic conditions. These findings underscore the complexity involved in predicting the dry biomass of mixed cover crops using basic empirical relationships reliant on spectral data from the most recent available image before the sampling date. Figure 7 shows the best relationships for each group of single and mixed species.
When legumes, borages, and brassicas were grouped together, 22.7% of the models exhibited a CVRMSE lower than 0.7 t·ha−1. However, upon including grasses in this grouping, none of the models achieved a CVRMSE lower than 1 t·ha−1. This outcome clearly indicates a negative impact of the grasses on the models. While having more homogeneous fields with well-developed grasses in the dataset might potentially lead to improved results for this group, the primary objective of this study was to consider samples that accurately represent real-world field conditions. The focus was on assessing the model’s capacity to manage diverse cover crop farming conditions.
Among the various VIs assessed for estimating cover crop biomass, NDWI1 emerged as the most effective for diverse groups like the full group, the mixed group, and the group with legumes, brassicas, borages, and grasses. In the evaluation of the top 30 models (comprising the top 5 from six categories), NDWI1 and MSI demonstrated superior performance, appearing six and seven times, respectively. The importance of the NDWI1 index was confirmed by other authors [43,44]. These indices rely on specific Sentinel-2 bands—B8A and B11. Additionally, NDReSw surfaced as a strong contender, being identified four times among the best VIs. This index calculates the normalized difference between red-edge and shortwave infrared bands (B6 and B12), indicating potential for the biomass estimation of cover crops. Despite NDVI’s widespread use in the literature, it did not prove significant for estimating cover crop biomass. This aligns with similar conclusions drawn by other researchers [42,43,44,45,62]. The RVI also seemed to be informative for the biomass estimation of cover crops, being one of the top five for the groups with legumes, borages, and brassicas, even when including the grasses, although in this case the relationship was weaker. Swoish et al. [62] also confirmed the relevance of RVI when using Sentinel-2 data.
We examined the most notable outliers, particularly concerning the empirical correlation between MSI and the dry biomass of grasses. In this analysis, three data points exhibited remarkably high MSI values despite having low biomass. Investigation revealed that these areas had been affected by sub-zero temperatures, resulting in a significant level of leaf senescence. Additionally, some regrowth was observed in these areas, contributing to soil coverage. This regrowth likely stimulated sufficient photosynthetic activity, consequently generating detectable reflectance signals. Moreover, the presence of senescent leaves in these areas is anticipated to cause an elevated response in the shortwave infrared spectrum. This, in turn, would impact on the calculation of the MSI, which relies on the ratio between the B11 and B8A spectral bands. We also analyzed deeper areas with mixed cover crops where the correlation between NDWI1 and the dry biomass of this group displayed outliers, notably showing negative NDWI1 values. Our investigation revealed that this anomaly was attributed to issues with the imagery, likely arising from a failure in the cloud mask algorithm specifically in shadowed regions, resulting in the presence of negative NDWI1 values. However, despite these outliers affecting the observed empirical relationship, eliminating them would not significantly enhance the outcome, as the relationship still exhibits a high level of dispersion. This highlights the necessity of evolving to a more robust methodology capable of handling such common situations.

3.4. Multivariate Analyses Considering the Last Available Images with all the Spectral Bands and VIs Using Machine Learning Algorithms

To investigate the potential of all the spectral data of Sentinel-2 imagery, we tested different machine learning (ML) regression algorithms considering all the VI and SB values of the last available image before the sampling and the final dry biomass of the full dataset only. We tuned the models considering a different range of parameters. The results are summarized in Table 3.
The RF model presented the best performance based on the r2 and CVRMSE, followed by the SVM algorithm. We can observe a slight improvement compared to the empirical relationships with only one VI/SB, showing the importance of exploring the multidimensionality of the spectral information.

3.5. Multivariate Analyses Using the Dense Time Series with All the Spectral Bands and VIs Using Machine Learning Algorithms

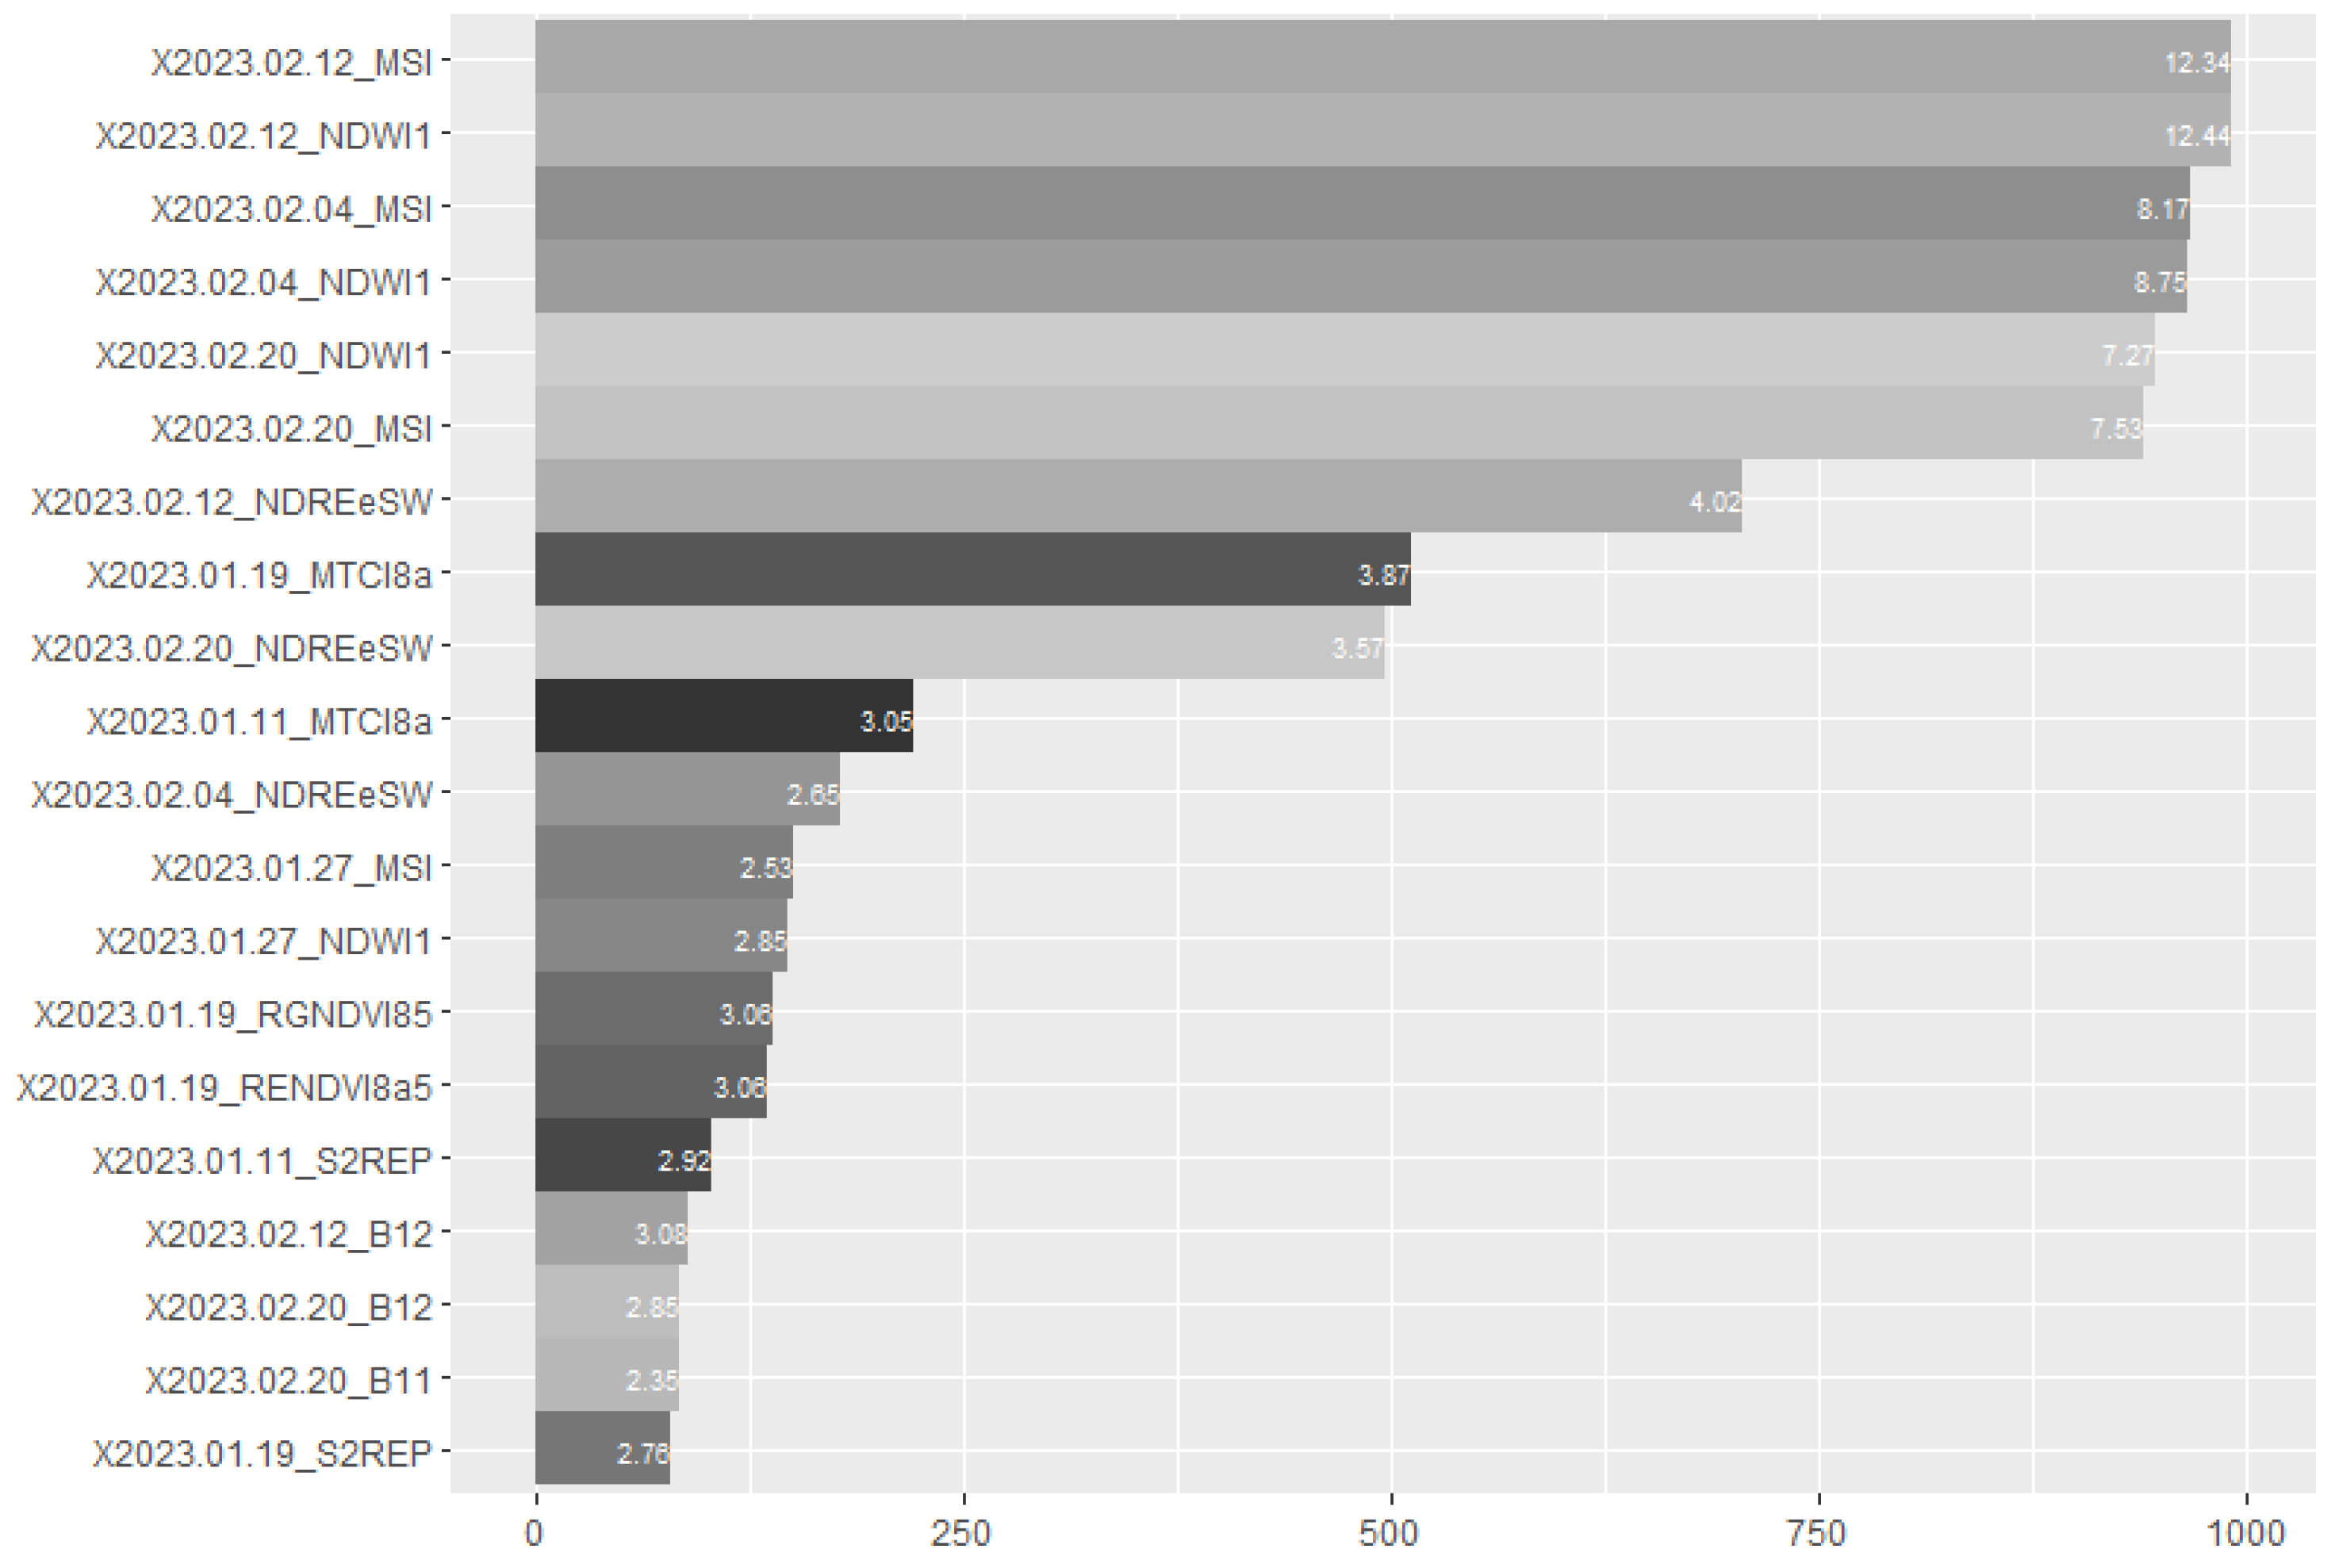
When adding the temporal information, considering all the 990 variables in the model (33 VI/SB during 30 observations in time) the results were significantly improved. The achieved median r2 was 0.75 and the CVRMSE was 0.73 t·ha−1. We select the 20 most important variables based on the Gini index and the frequency with which each variable was selected among the top 10 most important variables in each of the 1000 iterations. The model was tuned by obtaining the parameters for the number of trees and maximum nodes, which were set to 100 and 20, respectively. Figure 8 shows the top 20 most relevant variables obtained from the RF model.
The analysis of Figure 8 shows the significance of the highlighted vegetation indices during the assessment of the empirical relationships, particularly the MSI and NDWI1. All of the selected variables consisted of observation values obtained during the period between January and February 2023. Except for the brassica group, this period was related to the period when the vegetation was at the peak of the cover crop development. This finding suggests a hypothesis: a universal model based on identifying vegetation peaks may be more robust than relying solely on the last available image before sampling, potentially enhancing the transferability to diverse seasons and regions.
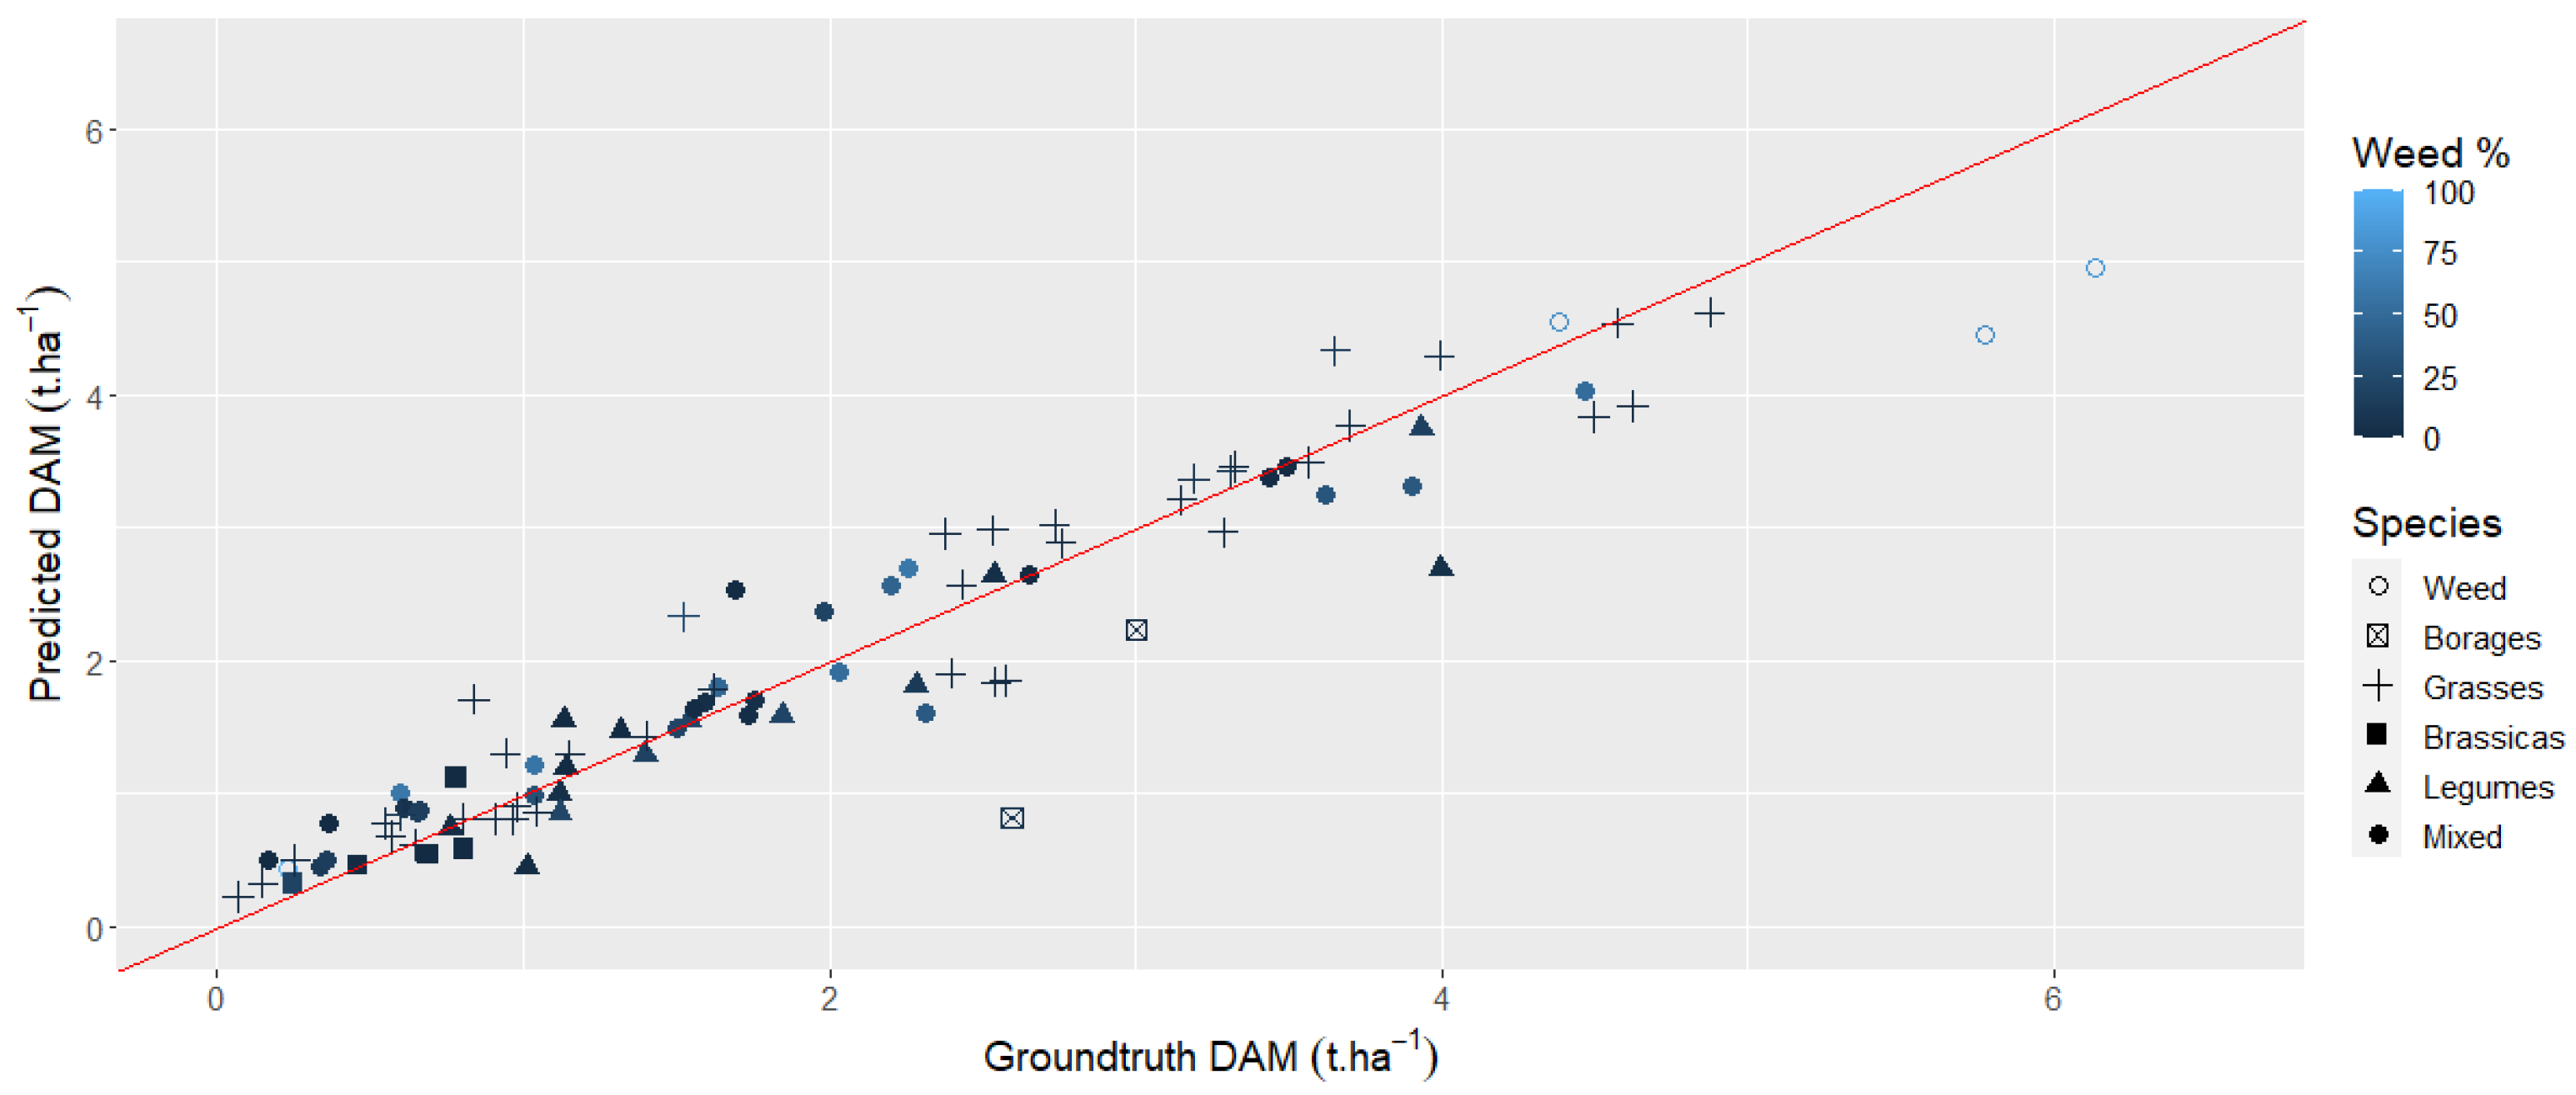
When using only the 20 most important variables, the median achieved r2 was 0.73, with a CVRMSE of 0.75 t·ha−1. Figure 9 displays a scatter plot illustrating the correspondence between predicted and actual outcomes, obtained by the averaged model across 1000 iterations.
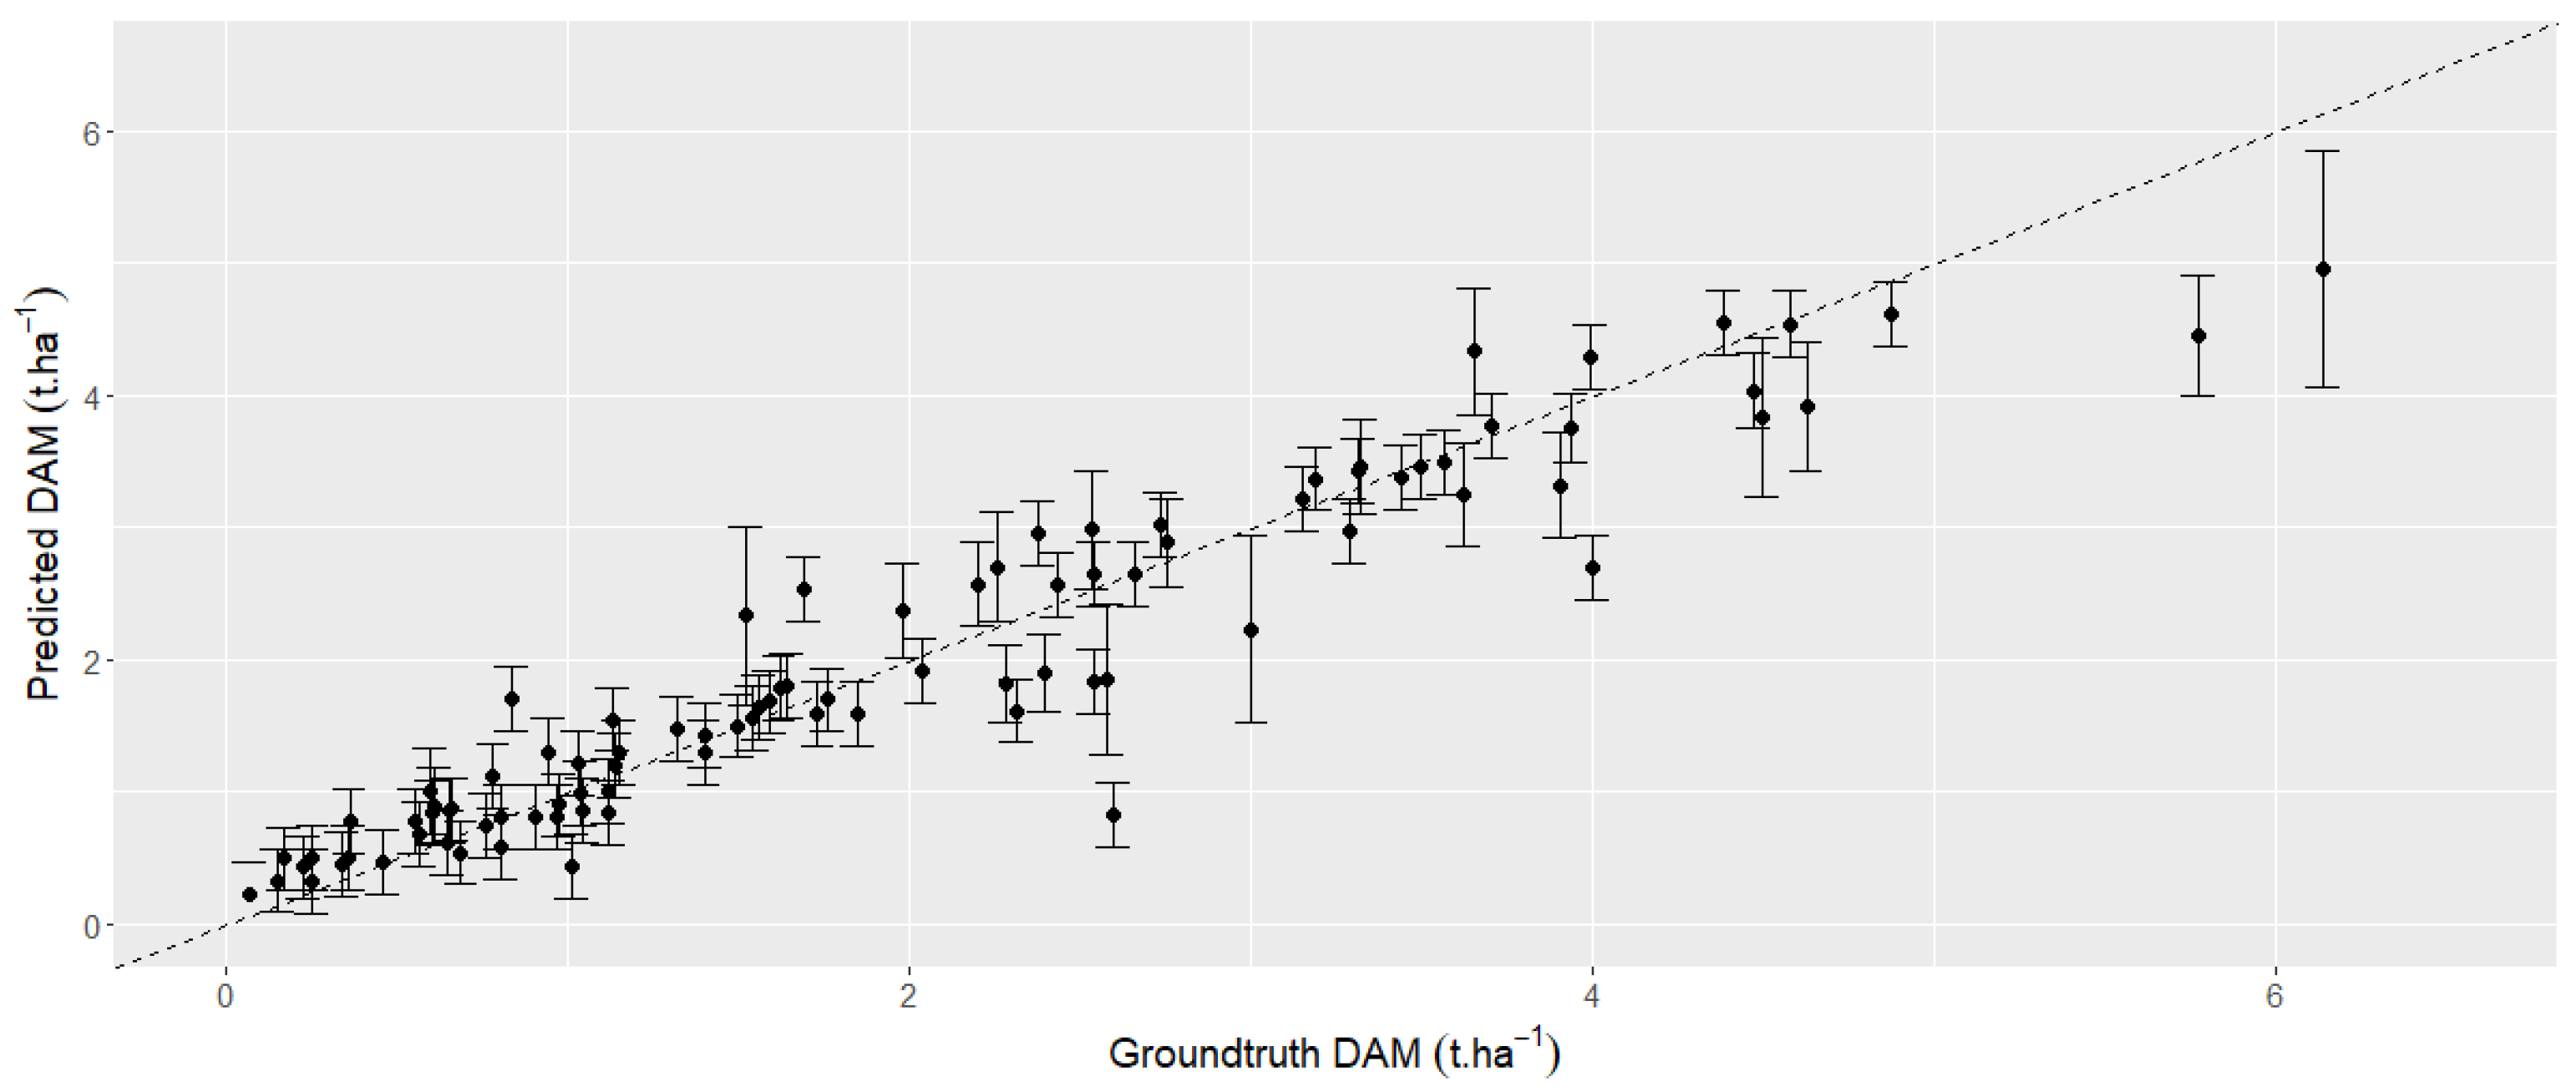
Figure 9 does not depict any evident trend for particular species groups or varying levels of weed infestation. There is a slightly increased dispersion noted for higher biomass values, notably in the two samples exhibiting the highest biomass. These specific samples corresponded to fields with over 70% weed infestation. Figure 10 shows the error bar plots for the average RF model obtained with 1000 iterations by the infinitesimal jackknife technique.
The error graph reveals increased variance in predictions for samples with higher biomass values, particularly for weed samples as previously mentioned. Nevertheless, there is no discernible trend evident when analyzing prediction errors.

4. Discussion

4.1. Key Contributions of the Study

This study aimed to explore a methodology using Sentinel-2 satellite optical data to estimate winter cover crop biomass in France. First, we examined traditional methods based on vegetation indices calculated from the last satellite image acquired before biomass in situ sampling across different cover crop groups and weed infestation levels. Furthermore, we evaluated the advantages of employing machine learning methods with various vegetation indices, spectral bands, and dense Sentinel-2 image time series.
Our findings confirm the potential of utilizing Sentinel-2 dense image time series and machine learning for estimating the aboveground biomass of both single species and mixtures of cover crops in France. Notably, the method demonstrated robustness across different weed infestation levels. Also, the Normalized Difference Water Index 1 (NDWI1) and Moisture Stress Index (MSI) were identified as promising vegetation indices for biomass estimation, consistent with the recent literature [43,44].
The results suggest that constructing a universal model based on identifying vegetation peaks through dense optical image time series may offer greater robustness than relying solely on the last available image before sampling. Previous studies [41] observed close alignment between the maximum vegetation index date and sampling date in most fields, with variations attributed to termination or harvesting practices. They proposed that higher temporal resolution could better capture these variations. However, comprehensive validation of this hypothesis requires further research.

4.2. Potential Applications of the Proposed Method

We used our approach across all fields in which in situ biomass was measured to create maps displaying final dry aboveground biomass, visually illustrating the variation within fields. The best model obtained across 1000 iterations, using the 20 selected variables, was used for predicting the biomass for those fields. Figure 11 exhibits examples highlighting different levels of spatial variability within the fields.
Unlike aggregated or generalized methods, pixel-based assessment of biomass allows a good representation of field variability providing a detailed and accurate portrait of biomass distribution across the landscape [77]. It improves our ability to discern, analyze, and understand the diverse features present in individual fields and allows us to relate them to spatial variability in microclimates or in soil properties [78,79,80,81]. This information is invaluable to farmers or farmer’s advisers as it allows them to adapt their management to optimize the production or their net margins.
High-resolution biomass estimates enable detailed mapping in precision agriculture, facilitating the delineation of management zones for targeted nitrogen application [82,83]. Accurate mapping of biomass variations at a granular level simplifies the creation of zones tailored to specific field requirements, optimizing nitrogen fertilizer application in correspondence with varying biomass levels.
DAM maps, as illustrated in Figure 11, could serve as input data for models simulating soil organic carbon (SOC) stock changes, crucial for the monitoring, reporting, and verification of SOC stock changes for national inventories, carbon markets, or the Common Agricultural Policy [27]. Paustian et al. [84] and Smith et al. [85] recommended using remote-sensing-derived estimates of biomass input to the soil to increase the accuracy of the SOC stock changes assessment. The French Low Carbon Label methodology [86] for cropland using Earth Observation (EO)-derived cover crop biomass assessment is recommended and it avoids a discount on premiums paid to farmers compared to using regional statistics of cover crop biomass.
Effective methods to monitor cover crop biomass on a large scale are essential, as cover crops are integral for achieving multiple ecosystem services, enhancing crop production resilience, ensuring food security, mitigating climate change impacts, and sustaining agricultural economic viability [87].

4.3. Limitations and Prospects for Future Work

Some limitations are apparent in this study. Principally, challenges related to fieldwork, particularly the collection of biomass data across an entire country, have constrained the scope of data collection to a single season in France. Despite efforts outlined in the methodology to encompass a diverse range of practices and representativeness, it is acknowledged that not all cover crop practices have been fully covered. To address this limitation, future research should expand both the temporal and spatial coverage, incorporating additional seasons and a wider array of cover crop practices, including those sown in summer or spring. Additionally, it is noteworthy that the observed biomass range in this study was relatively low, possibly influenced by various factors such as climatic conditions, particularly the dry conditions prevalent during the study period.
Future research could also investigate the incorporation of biophysical and climate variables. Considering the potential advantages of increased temporal resolution, testing the integration of different sensors is a promising avenue to explore.
Incorporating microwave data for vegetation monitoring, either in addition to or instead of optical data, could enhance the proposed approach, particularly in areas where high cloud cover may limit optical data application. Synthetic Aperture Radar (SAR) data have been utilized for estimating crop characteristics through the analysis of backscatter intensity and phase information, particularly in L-band, C-band, or X-band wavelengths with dual-pol or quad-pol configurations. This enables the detection of vegetation volume scattering, crucial for estimating total crop biomass. Previous studies on cash crops using satellite missions with configurations similar to the current Sentinel-1 mission have demonstrated significant dynamics of satellite signals, particularly during specific phenological stages (e.g., stem elongation or fruiting period), often specific to the studied species [88,89,90,91,92]. Given the diversity of practices associated with cover crops, including the use of different species alone or in mixtures, analyzing SAR signals observed on cover crops is essential. In a study conducted by Jennewein et al. [42], the biomass estimation of cereal grass cover crops (e.g., wheat, triticale, or cereal rye) was based on the combined use of optical and SAR (interferometric coherence) data. Although the results were species-specific, it underscores the need for further research into alternative methods of setting up cover crops to identify generic features of SAR images that can be utilized for biomass estimation.

5. Conclusions

In the present study we conduct an examination of traditional methods for estimating cover crop biomass, highlighting their limitations and the imperative for advancement. Drawing from this understanding, we employ machine learning techniques to enhance our investigation. We identify constraints within traditional methodologies, particularly in accurately estimating biomass for mixed cover crops. By leveraging dense image time series and machine learning, we overcome these challenges, thereby improving precision in biomass estimation, especially for mixed cover crops. Our study raises insights relevant to other researchers, demonstrating that the adoption of dense time series data and key vegetation indices enhances the model’s accuracy. Additionally, our approach eliminates the need to use the last available image before sampling, thus mitigating difficulties associated with image availability due to cloud cover. In this regard, we underscore the potential robustness of our approach in diverse agricultural contexts and its scalability, making it accessible for widespread implementation. Notably, our methodology not only provides a monitoring tool for cover crop adoption to enhance ecosystem services but also facilitates the optimization of soil nutrition management and biomass monitoring for carbon credit measurement. In conclusion, our research advances cover crop biomass estimation, contributing to climate-resilient farming practices and ecosystem stewardship, with potential positive environmental and economic impacts.

Author Contributions

Conceptualization, H.d.N.B., R.F., A.A. and É.C.; methodology, H.d.N.B. and R.F.; software, H.d.N.B.; validation, H.d.N.B.; field experiments, A.G. and P.C.; writing—original draft preparation, H.d.N.B.; writing—review and editing, É.C., R.F. and H.C.; supervision, É.C. and R.F. All authors have read and agreed to the published version of the manuscript.

Funding

This research falls within the scope of the Easy4Ag project, which is funded by the France 2030 program under grant N° DOS0178310/00–N° DOS0178311/00.

Data Availability Statement

Data are unavailable due to privacy.

Conflicts of Interest

The authors Pierre Carrere, Dr. Harold Clenet, Aurelie Galvani and Dr. Aubin Allies are employed by the company EarthDaily Agro. The remaining authors declare that the research was conducted in the absence of any commercial or financial relationships that could be construed as a potential conflict of interest.

Appendix A

Table A1. Summarized vegetation indices derived from the surface reflectance of Sentinel 2.
Vegetation IndexFormulaReference
Normalized Difference Vegetation Index (NDVI)(B8 − B4)/(B8 + B4)Rouse et al. [93]
Enhanced Vegetation Index (EVI)2.5 × (B8 − B4)/ ((B8 + 6 × B4 − 7.5 × B2) + 1)Liu and Huete [94]
Chlorophyll Vegetation Index (CVI)(B8/B3) (B4/B3)Vincini et al. [95]
Enhanced Vegetation Index 2 (EVI2)2.5 × (B8 − B4)/ ((B8 + 2.4 × B4) + 1)Sentinel Hub
Moisture stress index (MSI)(B6 − B12)/ (B6 + B12)Rock, B.N. et al. [96]
Normalized Difference of Red-edge and SWIR2 (NDReSw)B11/B8ARadoux et al. [97]
Normalized Difference Water Index 1 (NDWI1)(B8A − B11)/ (B8A + B11)Gao et al. [98]
Sentinel 2 red-edge position (S2REP)705 + 35 × ((((B7 + B4)/2) − B5)/ (B6 − B5))Frampton [99]
Soil-Adjusted Vegetation Index (SAVI)(1 + L) × ((B8−B4)/(B8 + B4 + L) [L = 1]Huete [100]
MERIS Terrestrial Chlorophyll Index (MTCI8a)(B8A − B5)/ (B5 − B4)Dash and Curran [101]
Red-edge normalized difference vegetation index (RENDVI8a5)(B8A − B5)/(B8A + B5)Gitelson et al. [102]
Normalized Difference Index (RENDVI85)(B8 − B5)/(B8 + B5)Delegido et al. [56]
Ratio Vegetation Index (RVI)B8/B4Birth et al. [103]
NDTI (Normalized Difference Tillage Index)(B11 − B12)/(B11 + B12)Van Deventer et al. [104]
NDWI (Normalized Difference Water Index)(B3−B8)/(B3 + B8)McFeeters [105]
Soil-Adjusted and Atmospherically Resistant Vegetation Index (SARVI)(1 + L) × (B8 − (B4 − (B4 − B2)))/(B8 + (B4 − (B4 − B2)) + L) [L = 1]Kaufman et al. [106]
Green Leaf Area Index (GLI)(2 × B3 − B4 − B2)/(2 × B3 + B4 + B2)Louhaichi et al. [97]
Normalized Difference Red-Edge Index (NDRE1)(B8 − B5)/(B8 + B5)Gitelson et al. [102]
Normalized Difference Red-Edge Index (NDRE2)(B8 − B6)/(B8 + B6)Gitelson et al. [102]
Normalized Difference Red-Edge Index (NDRE3)(B8 − B7)/(B8 + B7)Gitelson et al. [102]
Normalized Difference Red-Edge Index (NDRE4)(B6 − B5)/(B6 + B5)Gitelson et al. [102]
Sentinel-2 LAI Green Index (SeLI)(B8A − B5)/(B8A + B5)Pasqualotto et al. [107]
Atmospherically Resistant Vegetation Index (ARVI)(B8 − (B4 − γ × (B4 − B2)))/ (B8 + (B4 − γ × (B4 − B2))) [ γ = 1]Kaufman et al. [106]
Figure A1. Examples of interpolated pixel-based NDVI time series, showcasing selected samples from distinct climate regions. The black line denotes the interpolated time series, while the red dots represent the original values. (a) Sample situated in the Altered Oceanic climate, exhibiting 8% of CSO during the period from October/22 to May/23. (b) Sample from the degraded oceanic climate of the Central and Northern plains, displaying 19% of CSO. (c) Sample located in the climatic region of the Southwest Basin, featuring 28% of CSO. (d) Sample located in the Clear Oceanic climate, with 14% of CSO.
Remotesensing 16 00834 g0a1
Figure A2. Best VI–DAM model by category with different time lags between the sampling date and the image.
Remotesensing 16 00834 g0a2
Figure A3. Best VI–DM biomass model by category with different weed percentages for each group.
Remotesensing 16 00834 g0a3

References

  1. Ceschia, E.; Béziat, P.; Dejoux, J.F.; Aubinet, M.; Bernhofer, C.; Bodson, B.; Buchmann, N.; Carrara, A.; Cellier, P.; Di Tommasi, P.; et al. Management effects on net ecosystem carbon and GHG budgets at European crop sites. Agric. Ecosyst. Environ. 2010, 139, 363–383. [Google Scholar] [CrossRef]
  2. Rosegrant, M.W.; Koo, J.; Cenacchi, N.; Ringler, C.; Robertson, R.D.; Fisher, M.; Cox, C.M.; Garrett, K.; Perez, N.D.; Sabbagh, P. Food Security in a World of Natural Resource Scarcity: The Role of Agricultural Technologies; Intl Food Policy Res Inst: Washington DC, USA, 2014. [Google Scholar]
  3. Chabbi, A.; Lehmann, J.; Ciais, P.; Loescher, H.W.; Cotrufo, M.F.; Don, A.; SanClements, M.; Schipper, L.; Six, J.; Smith, P.; et al. Aligning agriculture and climate policy. Nat. Clim. Chang. 2017, 7, 307–309. [Google Scholar] [CrossRef]
  4. Varvel, G.E. Soil organic carbon changes in diversified rotations of the western Corn Belt. Soil Sci. Soc. Am. J. 2006, 70, 426–433. [Google Scholar] [CrossRef]
  5. Poeplau, C.; Don, A. Carbon sequestration in agricultural soils via cultivation of cover crops–A meta-analysis. Agric. Ecosyst. Environ. 2015, 200, 33–41. [Google Scholar] [CrossRef]
  6. Lugato, E.; Cescatti, A.; Jones, A.; Ceccherini, G.; Duveiller, G. Maximising climate mitigation potential by carbon and radiative agricultural land management with cover crops. Environ. Res. Lett. 2020, 15, 094075. [Google Scholar] [CrossRef]
  7. Vereecken, H.; Schnepf, A.; Hopmans, J.W.; Javaux, M.; Or, D.; Roose, T.; Vanderborght, J.; Young, M.; Amelung, W.; Aitkenhead, M.; et al. Modeling soil processes: Review, key challenges, and new perspectives. Vadose Zone J. 2016, 15, vzj2015.09.0131. [Google Scholar] [CrossRef]
  8. Steinbeiss, S.; Gleixner, G.; Antonietti, M. Effect of biochar amendment on soil carbon balance and soil microbial activity. Soil Biol. Biochem. 2009, 41, 1301–1310. [Google Scholar] [CrossRef]
  9. Su, Y.Z.; Wang, F.; Suo, D.R.; Zhang, Z.H.; Du, M.W. Long-term effect of fertilizer and manure application on soil-carbon sequestration and soil fertility under the wheat–wheat–maize cropping system in northwest China. Nutr. Cycl. Agroecosyst. 2006, 75, 285–295. [Google Scholar] [CrossRef]
  10. Karhu, K.; Mattila, T.; Bergström, I.; Regina, K. Biochar addition to agricultural soil increased CH4 uptake and water holding capacity–Results from a short-term pilot field study. Agric. Ecosyst. Environ. 2011, 140, 309–313. [Google Scholar] [CrossRef]
  11. Wall, D.H.; Nielsen, U.N.; Six, J. Soil biodiversity and human health. Nature 2015, 528, 69–76. [Google Scholar] [CrossRef]
  12. Rejesus, R.M.; Aglasan, S.; Knight, L.G.; Cavigelli, M.A.; Dell, C.J.; Lane, E.D.; Hollinger, D.Y. Economic dimensions of soil health practices that sequester carbon: Promising research directions. J. Soil Water Conserv. 2021, 76, 55A–60A. [Google Scholar] [CrossRef]
  13. Kaye, J.P.; Quemada, M. Using cover crops to mitigate and adapt to climate change. A review. Agron. Sustain. Dev. 2017, 37, 1–17. [Google Scholar] [CrossRef]
  14. Carrer, D.; Pique, G.; Ferlicoq, M.; Ceamanos, X.; Ceschia, E. What is the potential of cropland albedo management in the fight against global warming? A case study based on the use of cover crops. Environ. Res. Lett. 2018, 13, 044030. [Google Scholar] [CrossRef]
  15. Pique, G.; Carrer, D.; Lugato, E.; Fieuzal, R.; Garisoain, R.; Ceschia, E. About the Assessment of Cover Crop Albedo Potential Cooling Effect: Risk of the Darkening Feedback Loop Effects. Remote. Sens. 2023, 15, 3231. [Google Scholar] [CrossRef]
  16. Ceschia, E.; Mary, B.; Ferlicoq, M.; Pique, G.; Carrer, D.; Dejoux, J.; Dedieu, G. Potentiel d’atténuation des changements climatiques par les couverts intermédiaires. Innov. Agron 2017, 62, 43–58. [Google Scholar]
  17. Soil Science Society of America. Glossary of soil science terms 2008. In ASA-CSSA-SSSA; Soil Science Society of America: Madison, WI, USA, 2008. [Google Scholar]
  18. Abdalla, M.; Hastings, A.; Cheng, K.; Yue, Q.; Chadwick, D.; Espenberg, M.; Truu, J.; Rees, R.M.; Smith, P. A critical review of the impacts of cover crops on nitrogen leaching, net greenhouse gas balance and crop productivity. Glob. Chang. Biol. 2019, 25, 2530–2543. [Google Scholar] [CrossRef]
  19. Thapa, R.; Mirsky, S.B.; Tully, K.L. Cover crops reduce nitrate leaching in agroecosystems: A global meta-analysis. J. Environ. Qual. 2018, 47, 1400–1411. [Google Scholar] [CrossRef]
  20. De Baets, S.; Poesen, J.; Meersmans, J.; Serlet, L. Cover crops and their erosion-reducing effects during concentrated flow erosion. Catena 2011, 85, 237–244. [Google Scholar] [CrossRef]
  21. Gao, F.; Anderson, M.C.; Hively, W.D. Detecting cover crop end-of-season using VENμS and sentinel-2 Satellite imagery. Remote. Sens. 2020, 12, 3524. [Google Scholar] [CrossRef]
  22. Borrelli, P.; Panagos, P. An indicator to reflect the mitigating effect of Common Agricultural Policy on soil erosion. Land Use Policy 2020, 92, 104467. [Google Scholar] [CrossRef]
  23. Kathage, J.; Smit, B.; Janssens, B.; Haagsma, W.; Adrados, J.L. How much is policy driving the adoption of cover crops? Evidence from four EU regions. Land Use Policy 2022, 116, 106016. [Google Scholar] [CrossRef] [PubMed]
  24. de L’agriculture et de L’alimentation, M. GRAPH’AGRI. Available online: https://agreste.agriculture.gouv.fr/agreste-web/ (accessed on 1 October 2023).
  25. Ols, C.; Hervé, J.C.; Bontemps, J.D. Recent growth trends of conifers across Western Europe are controlled by thermal and water constraints and favored by forest heterogeneity. Sci. Total. Environ. 2020, 742, 140453. [Google Scholar] [CrossRef]
  26. Fendrich, A.N.; Matthews, F.; Van Eynde, E.; Carozzi, M.; Li, Z.; d’Andrimont, R.; Lugato, E.; Martin, P.; Ciais, P.; Panagos, P. From regional to parcel scale: A high-resolution map of cover crops across Europe combining satellite data with statistical surveys. Sci. Total. Environ. 2023, 873, 162300. [Google Scholar] [CrossRef] [PubMed]
  27. Bockstaller, C.; Sirami, C.; Sheeren, D.; Keichinger, O.; Arnaud, L.; Favreau, A.; Angevin, F.; Laurent, D.; Marchand, G.; De Laroche, E.; et al. Apports de la télédétection au calcul d’indicateurs agri-environnementaux au service de la PAC, des agriculteurs et porteurs d’enjeu. Innov. Agron. 2021, 83, 43–59. [Google Scholar]
  28. TUCKER, C.J. A critical review of remote sensing and other methods for non-destructive estimation of standing crop biomass. Grass Forage Sci. 1980, 35, 177–182. [Google Scholar] [CrossRef]
  29. Zheng, D.; Rademacher, J.; Chen, J.; Crow, T.; Bresee, M.; Le Moine, J.; Ryu, S.R. Estimating aboveground biomass using Landsat 7 ETM+ data across a managed landscape in northern Wisconsin, USA. Remote. Sens. Environ. 2004, 93, 402–411. [Google Scholar] [CrossRef]
  30. Hively, W.; Lang, M.; McCarty, G.; Keppler, J.; Sadeghi, A.; McConnell, L. Using satellite remote sensing to estimate winter cover crop nutrient uptake efficiency. J. Soil Water Conserv. 2009, 64, 303–313. [Google Scholar] [CrossRef]
  31. Günlü, A.; Ercanli, I.; Başkent, E.; Çakır, G. Estimating aboveground biomass using Landsat TM imagery: A case study of Anatolian Crimean pine forests in Turkey. Ann. For. Res. 2014, 289–298. [Google Scholar]
  32. Kross, A.; McNairn, H.; Lapen, D.; Sunohara, M.; Champagne, C. Assessment of RapidEye vegetation indices for estimation of leaf area index and biomass in corn and soybean crops. Int. J. Appl. Earth Obs. Geoinf. 2015, 34, 235–248. [Google Scholar] [CrossRef]
  33. Punalekar, S.M.; Verhoef, A.; Quaife, T.; Humphries, D.; Bermingham, L.; Reynolds, C. Application of Sentinel-2A data for pasture biomass monitoring using a physically based radiative transfer model. Remote. Sens. Environ. 2018, 218, 207–220. [Google Scholar] [CrossRef]
  34. Cate, R.; Artley, J.; Phinney, D. Quantitative Estimation of Plant Characteristics Using Spectral Measurement: A Survey of the Literature; Lockheed Engineering And Management Services Company, Inc.: Bethesda, MD, USA, 1980. [Google Scholar]
  35. Stenberg, P.; Rautiainen, M.; Manninen, T.; Voipio, P.; Smolander, H. Reduced simple ratio better than NDVI for estimating LAI in Finnish pine and spruce stands. Silva Fenn. 2004, 38, 3–14. [Google Scholar] [CrossRef]
  36. Chen, P.F.; Nicolas, T.; Wang, J.H.; Philippe, V.; Huang, W.J.; Li, B.G. New index for crop canopy fresh biomass estimation. Spectrosc. Spectr. Anal. 2010, 30, 512–517. [Google Scholar]
  37. Hosseini, M.; McNairn, H.; Mitchell, S.; Robertson, L.D.; Davidson, A.; Homayouni, S. Synthetic aperture radar and optical satellite data for estimating the biomass of corn. Int. J. Appl. Earth Obs. Geoinf. 2019, 83, 101933. [Google Scholar] [CrossRef]
  38. Prabhakara, K.; Hively, W.D.; McCarty, G.W. Evaluating the relationship between biomass, percent groundcover and remote sensing indices across six winter cover crop fields in Maryland, United States. Int. J. Appl. Earth Obs. Geoinf. 2015, 39, 88–102. [Google Scholar] [CrossRef]
  39. Thieme, A.; Hively, W.D.; Gao, F.; Jennewein, J.; Mirsky, S.; Soroka, A.; Keppler, J.; Bradley, D.; Skakun, S.; McCarty, G.W. Remote sensing evaluation of winter cover crop springtime performance and the impact of delayed termination. Agron. J. 2023, 115, 442–458. [Google Scholar] [CrossRef]
  40. Fan, X.; Vrieling, A.; Muller, B.; Nelson, A. Winter cover crops in Dutch maize fields: Variability in quality and its drivers assessed from multi-temporal Sentinel-2 imagery. Int. J. Appl. Earth Obs. Geoinf. 2020, 91, 102139. [Google Scholar] [CrossRef]
  41. Xia, Y.; Guan, K.; Copenhaver, K.; Wander, M. Estimating cover crop biomass nitrogen credits with Sentinel-2 imagery and sites covariates. Agron. J. 2021, 113, 1084–1101. [Google Scholar] [CrossRef]
  42. Jennewein, J.S.; Lamb, B.T.; Hively, W.D.; Thieme, A.; Thapa, R.; Goldsmith, A.; Mirsky, S.B. Integration of Satellite-Based Optical and Synthetic Aperture Radar Imagery to Estimate Winter Cover Crop Performance in Cereal Grasses. Remote. Sens. 2022, 14, 2077. [Google Scholar] [CrossRef]
  43. Goffart, D.; Curnel, Y.; Planchon, V.; Goffart, J.P.; Defourny, P. Field-scale assessment of Belgian winter cover crops biomass based on Sentinel-2 data. Eur. J. Agron. 2021, 126, 126278. [Google Scholar] [CrossRef]
  44. Holzhauser, K.; Räbiger, T.; Rose, T.; Kage, H.; Kühling, I. Estimation of Biomass and N Uptake in Different Winter Cover Crops from UAV-Based Multispectral Canopy Reflectance Data. Remote. Sens. 2022, 14, 4525. [Google Scholar] [CrossRef]
  45. Kharel, T.P.; Bhandari, A.B.; Mubvumba, P.; Tyler, H.L.; Fletcher, R.S.; Reddy, K.N. Mixed-Species Cover Crop Biomass Estimation Using Planet Imagery. Sensors 2023, 23, 1541. [Google Scholar] [CrossRef]
  46. Kümmerer, R.; Noack, P.O.; Bauer, B. Using High-Resolution UAV Imaging to Measure Canopy Height of Diverse Cover Crops and Predict Biomass. Remote. Sens. 2023, 15, 1520. [Google Scholar] [CrossRef]
  47. Roth, R.T.; Chen, K.; Scott, J.R.; Jung, J.; Yang, Y.; Camberato, J.J.; Armstrong, S.D. Prediction of Cereal Rye Cover Crop Biomass and Nutrient Accumulation Using Multi-Temporal Unmanned Aerial Vehicle Based Visible-Spectrum Vegetation Indices. Remote. Sens. 2023, 15, 580. [Google Scholar] [CrossRef]
  48. Gao, F.; Jennewein, J.; Hively, W.D.; Soroka, A.; Thieme, A.; Bradley, D.; Keppler, J.; Mirsky, S.; Akumaga, U. Near real-time detection of winter cover crop termination using harmonized Landsat and Sentinel-2 (HLS) to support ecosystem assessment. Sci. Remote. Sens. 2023, 7, 100073. [Google Scholar] [CrossRef]
  49. Thieme, A.; Yadav, S.; Oddo, P.C.; Fitz, J.M.; McCartney, S.; King, L.; Keppler, J.; McCarty, G.W.; Hively, W.D. Using NASA Earth observations and Google Earth Engine to map winter cover crop conservation performance in the Chesapeake Bay watershed. Remote. Sens. Environ. 2020, 248, 111943. [Google Scholar] [CrossRef]
  50. Najem, S.; Baghdadi, N.; Bazzi, H.; Lalande, N.; Bouchet, L. Detection and Mapping of Cover Crops using Sentinel-1 SAR Remote Sensing data. IEEE J. Sel. Top. Appl. Earth Obs. Remote. Sens. 2023, 17, 1446–1461. [Google Scholar] [CrossRef]
  51. Wang, S.; Guan, K.; Zhang, C.; Jiang, C.; Zhou, Q.; Li, K.; Qin, Z.; Ainsworth, E.A.; He, J.; Wu, J.; et al. Airborne hyperspectral imaging of cover crops through radiative transfer process-guided machine learning. Remote. Sens. Environ. 2023, 285, 113386. [Google Scholar] [CrossRef]
  52. Basche, A.D.; Archontoulis, S.V.; Kaspar, T.C.; Jaynes, D.B.; Parkin, T.B.; Miguez, F.E. Simulating long-term impacts of cover crops and climate change on crop production and environmental outcomes in the Midwestern United States. Agric. Ecosyst. Environ. 2016, 218, 95–106. [Google Scholar] [CrossRef]
  53. Joly, D.; Brossard, T.; Cardot, H.; Cavailhes, J.; Hilal, M.; Wavresky, P. Les types de climats en France, une construction spatiale. Cybergeo Eur. J. Geogr. 2010. [Google Scholar] [CrossRef]
  54. Main-Knorn, M.; Pflug, B.; Louis, J.; Debaecker, V.; Müller-Wilm, U.; Gascon, F. Sen2Cor for sentinel-2. In Proceedings of the Image and Signal Processing for Remote Sensing XXIII. SPIE, Warsaw, Poland, 11–13 September 2017; Volume 10427, pp. 37–48. [Google Scholar]
  55. Jaramaz, D.; Perovic, V.; Belanovic, S.; Saljnikov, E.; Cakmak, D.; Mrvic, V.; Zivotic, L. The ESA Sentinel-2 mission vegetation variables for remote sensing of plant monitoring. In Proceedings of the Conference Proceedings 2nd International Scientific Conference, Belgrade, Serbia, 14–17 May 2013; pp. 950–961. [Google Scholar]
  56. Delegido, J.; Verrelst, J.; Alonso, L.; Moreno, J. Evaluation of sentinel-2 red-edge bands for empirical estimation of green LAI and chlorophyll content. Sensors 2011, 11, 7063–7081. [Google Scholar] [CrossRef] [PubMed]
  57. Frantz, D.; Haß, E.; Uhl, A.; Stoffels, J.; Hill, J. Improvement of the Fmask algorithm for Sentinel-2 images: Separating clouds from bright surfaces based on parallax effects. Remote. Sens. Environ. 2018, 215, 471–481. [Google Scholar] [CrossRef]
  58. Zupanc, A. Improving Cloud Detection with Machine Learning. 2020. Available online: https://medium.com/sentinel-hub/improving-cloud-detection-with-machine-learning-c09dc5d7cf13 (accessed on 5 February 2023).
  59. Rufin, P.; Rabe, A.; Nill, L.; Hostert, P. GEE timeseries explorer for qgis–instant access to petabytes of earth observation data. Int. Arch. Photogramm. Remote. Sens. Spat. Inf. Sci. 2021, 46, 155–158. [Google Scholar] [CrossRef]
  60. Schwieder, M.; Leitão, P.J.; da Cunha Bustamante, M.M.; Ferreira, L.G.; Rabe, A.; Hostert, P. Mapping Brazilian savanna vegetation gradients with Landsat time series. Int. J. Appl. Earth Obs. Geoinf. 2016, 52, 361–370. [Google Scholar] [CrossRef]
  61. do Nascimento Bendini, H.; Fonseca, L.M.G.; Schwieder, M.; Körting, T.S.; Rufin, P.; Sanches, I.D.A.; Leitão, P.J.; Hostert, P. Detailed agricultural land classification in the Brazilian cerrado based on phenological information from dense satellite image time series. Int. J. Appl. Earth Obs. Geoinf. 2019, 82, 101872. [Google Scholar] [CrossRef]
  62. Swoish, M.; Filho, J.F.D.C.L.; Reiter, M.S.; Campbell, J.B.; Thomason, W.E. Comparing satellites and vegetation indices for cover crop biomass estimation. Comput. Electron. Agric. 2022, 196, 106900. [Google Scholar] [CrossRef]
  63. Hyndman, R.J.; Koehler, A.B. Another look at measures of forecast accuracy. Int. J. Forecast. 2006, 22, 679–688. [Google Scholar] [CrossRef]
  64. Team, R.D.C. R: A Language and Environment for Statistical Computing; Version 2023.03.1; R Foundation for Statistical Computing: Vienna, Austria, 2010. [Google Scholar]
  65. Breiman, L. Random forests. Mach. Learn. 2001, 45, 5–32. [Google Scholar] [CrossRef]
  66. Cortes, C.; Vapnik, V. Support vector machine. Mach. Learn. 1995, 20, 273–297. [Google Scholar] [CrossRef]
  67. Chen, T.; Guestrin, C. Xgboost: A scalable tree boosting system. In Proceedings of the 22nd Acm Sigkdd International Conference on Knowledge Discovery and Data Mining, San Francisco, CA, USA, 13–17 August 2016; pp. 785–794. [Google Scholar]
  68. Flynn, K.C.; Baath, G.; Lee, T.O.; Gowda, P.; Northup, B. Hyperspectral reflectance and machine learning to monitor legume biomass and nitrogen accumulation. Comput. Electron. Agric. 2023, 211, 107991. [Google Scholar] [CrossRef]
  69. Li, H.; Song, X.P.; Hansen, M.C.; Becker-Reshef, I.; Adusei, B.; Pickering, J.; Wang, L.; Wang, L.; Lin, Z.; Zalles, V.; et al. Development of a 10-m resolution maize and soybean map over China: Matching satellite-based crop classification with sample-based area estimation. Remote. Sens. Environ. 2023, 294, 113623. [Google Scholar] [CrossRef]
  70. Blickensdörfer, L.; Schwieder, M.; Pflugmacher, D.; Nendel, C.; Erasmi, S.; Hostert, P. Mapping of crop types and crop sequences with combined time series of Sentinel-1, Sentinel-2 and Landsat 8 data for Germany. Remote. Sens. Environ. 2022, 269, 112831. [Google Scholar] [CrossRef]
  71. Dimitriadou, E.; Hornik, K.; Leisch, F.; Meyer, D.; Weingessel, A.; Leisch, M.F. The e1071 Package. In Misc Functions of Department of Statistics (e1071), TU Wien; 2006; pp. 297–304. Available online: https://rdocumentation.org/packages/e1071/versions/1.7-14 (accessed on 1 March 2023).
  72. Liaw, A.; Wiener, M. Classification and regression by randomForest. R News 2002, 2, 18–22. [Google Scholar]
  73. Kuhn, M. Building predictive models in R using the caret package. J. Stat. Softw. 2008, 28, 1–26. [Google Scholar] [CrossRef]
  74. Efron, B. The Jackknife, the Bootstrap and Other Resampling Plans; Department of Statistics Stanford Iniversity: Stanford, CA, USA, 1982. [Google Scholar]
  75. Efron, B. Estimation and accuracy after model selection. J. Am. Stat. Assoc. 2014, 109, 991–1007. [Google Scholar] [CrossRef]
  76. Pedregosa, F.; Varoquaux, G.; Gramfort, A.; Michel, V.; Thirion, B.; Grisel, O.; Blondel, M.; Prettenhofer, P.; Weiss, R.; Dubourg, V.; et al. Scikit-learn: Machine learning in Python. J. Mach. Learn. Res. 2011, 12, 2825–2830. [Google Scholar]
  77. Wijmer, T.; Al Bitar, A.; Arnaud, L.; Fieuzal, R.; Ceschia, E. AgriCarbon-EO: V1. 0.1: Large Scale and High Resolution Simulation of Carbon Fluxes by Assimilation of Sentinel-2 and Landsat-8 Reflectances using a Bayesian approach. EGUsphere 2023, 2023, 1–41. [Google Scholar] [CrossRef]
  78. Weiss, M.; Jacob, F.; Duveiller, G. Remote sensing for agricultural applications: A meta-review. Remote. Sens. Environ. 2020, 236, 111402. [Google Scholar] [CrossRef]
  79. Blackmore, S.; Godwin, R.J.; Fountas, S. The analysis of spatial and temporal trends in yield map data over six years. Biosyst. Eng. 2003, 84, 455–466. [Google Scholar] [CrossRef]
  80. Grieve, B.D.; Duckett, T.; Collison, M.; Boyd, L.; West, J.; Yin, H.; Arvin, F.; Pearson, S. The challenges posed by global broadacre crops in delivering smart agri-robotic solutions: A fundamental rethink is required. Glob. Food Secur. 2019, 23, 116–124. [Google Scholar] [CrossRef]
  81. Nowak, B.; Marliac, G.; Michaud, A. Estimation of winter soil cover by vegetation before spring-sown crops for mainland France using multispectral satellite imagery. Environ. Res. Lett. 2021, 16, 064024. [Google Scholar] [CrossRef]
  82. Breunig, F.M.; Galvão, L.S.; Dalagnol, R.; Dauve, C.E.; Parraga, A.; Santi, A.L.; Flora, D.P.D.; Chen, S. Delineation of management zones in agricultural fields using cover–crop biomass estimates from PlanetScope data. Int. J. Appl. Earth Obs. Geoinf. 2020, 85, 102004. [Google Scholar] [CrossRef]
  83. Constantin, J.; Minette, S.; Vericel, G.; Jordan-Meille, L.; Justes, E. MERCI: A simple method and decision-support tool to estimate availability of nitrogen from a wide range of cover crops to the next cash crop. Plant Soil 2023, 1–19. [Google Scholar] [CrossRef]
  84. Paustian, K.; Collier, S.; Baldock, J.; Burgess, R.; Creque, J.; DeLonge, M.; Dungait, J.; Ellert, B.; Frank, S.; Goddard, T.; et al. Quantifying carbon for agricultural soil management: From the current status toward a global soil information system. Carbon Manag. 2019, 10, 567–587. [Google Scholar] [CrossRef]
  85. Smith, P.; Lanigan, G.; Kutsch, W.L.; Buchmann, N.; Eugster, W.; Aubinet, M.; Ceschia, E.; Béziat, P.; Yeluripati, J.B.; Osborne, B.; et al. Measurements necessary for assessing the net ecosystem carbon budget of croplands. Agric. Ecosyst. Environ. 2010, 139, 302–315. [Google Scholar] [CrossRef]
  86. Soenen, B. Méthode LBC Grandes Cultures (version 1.1) LABEL BAS-CARBONE Méthode Grandes Cultures. Available online: https://www.ecologie.gouv.fr/sites/default/files/M%C3%A9thode%20LBC%20Grandes%20cultures.pdf (accessed on 1 December 2023).
  87. Lamichhane, J.R.; Alletto, L. Ecosystem services of cover crops: A research roadmap. Trends Plant Sci. 2022. [Google Scholar] [CrossRef] [PubMed]
  88. Allies, A.; Roumiguie, A.; Dejoux, J.F.; Fieuzal, R.; Jacquin, A.; Veloso, A.; Champolivier, L.; Baup, F. Evaluation of multiorbital SAR and multisensor optical data for empirical estimation of rapeseed biophysical parameters. IEEE J. Sel. Top. Appl. Earth Obs. Remote. Sens. 2021, 14, 7268–7283. [Google Scholar] [CrossRef]
  89. Baup, F.; Ameline, M.; Fieuzal, R.; Frappart, F.; Corgne, S.; Berthoumieu, J.F. Temporal evolution of corn mass production based on agro-meteorological modelling controlled by satellite optical and SAR images. Remote. Sens. 2019, 11, 1978. [Google Scholar] [CrossRef]
  90. Betbeder, J.; Fieuzal, R.; Baup, F. Assimilation of LAI and dry biomass data from optical and SAR images into an agro-meteorological model to estimate soybean yield. IEEE J. Sel. Top. Appl. Earth Obs. Remote. Sens. 2016, 9, 2540–2553. [Google Scholar] [CrossRef]
  91. Fieuzal, R.; Baup, F. Estimation of leaf area index and crop height of sunflowers using multi-temporal optical and SAR satellite data. Int. J. Remote. Sens. 2016, 37, 2780–2809. [Google Scholar] [CrossRef]
  92. Fieuzal, R.; Baup, F.; Marais-Sicre, C. Monitoring wheat and rapeseed by using synchronous optical and radar satellite data—From temporal signatures to crop parameters estimation. Adv. Remote Sens. 2013, 2, 33222. [Google Scholar] [CrossRef]
  93. Rouse, J.W.; Haas, R.H.; Schell, J.A.; Deering, D.W. Monitoring vegetation systems in the Great Plains with ERTS. NASA Spec. Publ. 1974, 351, 309. [Google Scholar]
  94. Liu, H.Q.; Huete, A. A feedback based modification of the NDVI to minimize canopy background and atmospheric noise. IEEE Trans. Geosci. Remote. Sens. 1995, 33, 457–465. [Google Scholar] [CrossRef]
  95. Vincini, M.; Frazzi, E.; D’Alessio, P. A broad-band leaf chlorophyll vegetation index at the canopy scale. Precis. Agric. 2008, 9, 303–319. [Google Scholar] [CrossRef]
  96. Rock, B.N.; Vogelmann, J.E.; Williams, D. Field and airborne spectral characterization of suspected damage in red spruce (Picea rubens) from vermont. In Proceedings of the Machine Processing of Remotely Sensed Data Symposium, West Lafayette, IN, USA, 25–27 June 1985. [Google Scholar]
  97. Radoux, J.; Chomé, G.; Jacques, D.C.; Waldner, F.; Bellemans, N.; Matton, N.; Lamarche, C.; d’Andrimont, R.; Defourny, P. Sentinel-2’s potential for sub-pixel landscape feature detection. Remote. Sens. 2016, 8, 488. [Google Scholar] [CrossRef]
  98. Gao, B.C. NDWI—A normalized difference water index for remote sensing of vegetation liquid water from space. Remote. Sens. Environ. 1996, 58, 257–266. [Google Scholar] [CrossRef]
  99. Frampton, W.J.; Dash, J.; Watmough, G.; Milton, E.J. Evaluating the capabilities of Sentinel-2 for quantitative estimation of biophysical variables in vegetation. ISPRS J. Photogramm. Remote. Sens. 2013, 82, 83–92. [Google Scholar] [CrossRef]
  100. Huete, A.R. A soil-adjusted vegetation index (SAVI). Remote. Sens. Environ. 1988, 25, 295–309. [Google Scholar] [CrossRef]
  101. Dash, J.; Curran, P. The MERIS terrestrial chlorophyll index. Int. J. Remote Sens. 2004, 25, 540–5413. [Google Scholar] [CrossRef]
  102. Gitelson, A.; Merzlyak, M.N. Quantitative estimation of chlorophyll-a using reflectance spectra: Experiments with autumn chestnut and maple leaves. J. Photochem. Photobiol. B Biol. 1994, 22, 247–252. [Google Scholar] [CrossRef]
  103. Birth, G.S.; McVey, G.R. Measuring the color of growing turf with a reflectance spectrophotometer 1. Agron. J. 1968, 60, 640–643. [Google Scholar] [CrossRef]
  104. Van Deventer, A.; Ward, A.; Gowda, P.; Lyon, J. Using thematic mapper data to identify contrasting soil plains and tillage practices. Photogramm. Eng. Remote. Sens. 1997, 63, 87–93. [Google Scholar]
  105. McFeeters, S.K. The use of the Normalized Difference Water Index (NDWI) in the delineation of open water features. Int. J. Remote. Sens. 1996, 17, 1425–1432. [Google Scholar] [CrossRef]
  106. Kaufman, Y.J.; Tanre, D. Atmospherically resistant vegetation index (ARVI) for EOS-MODIS. IEEE Trans. Geosci. Remote. Sens. 1992, 30, 261–270. [Google Scholar] [CrossRef]
  107. Pasqualotto, N.; Delegido, J.; Van Wittenberghe, S.; Rinaldi, M.; Moreno, J. Multi-crop green LAI estimation with a new simple Sentinel-2 LAI Index (SeLI). Sensors 2019, 19, 904. [Google Scholar] [CrossRef]
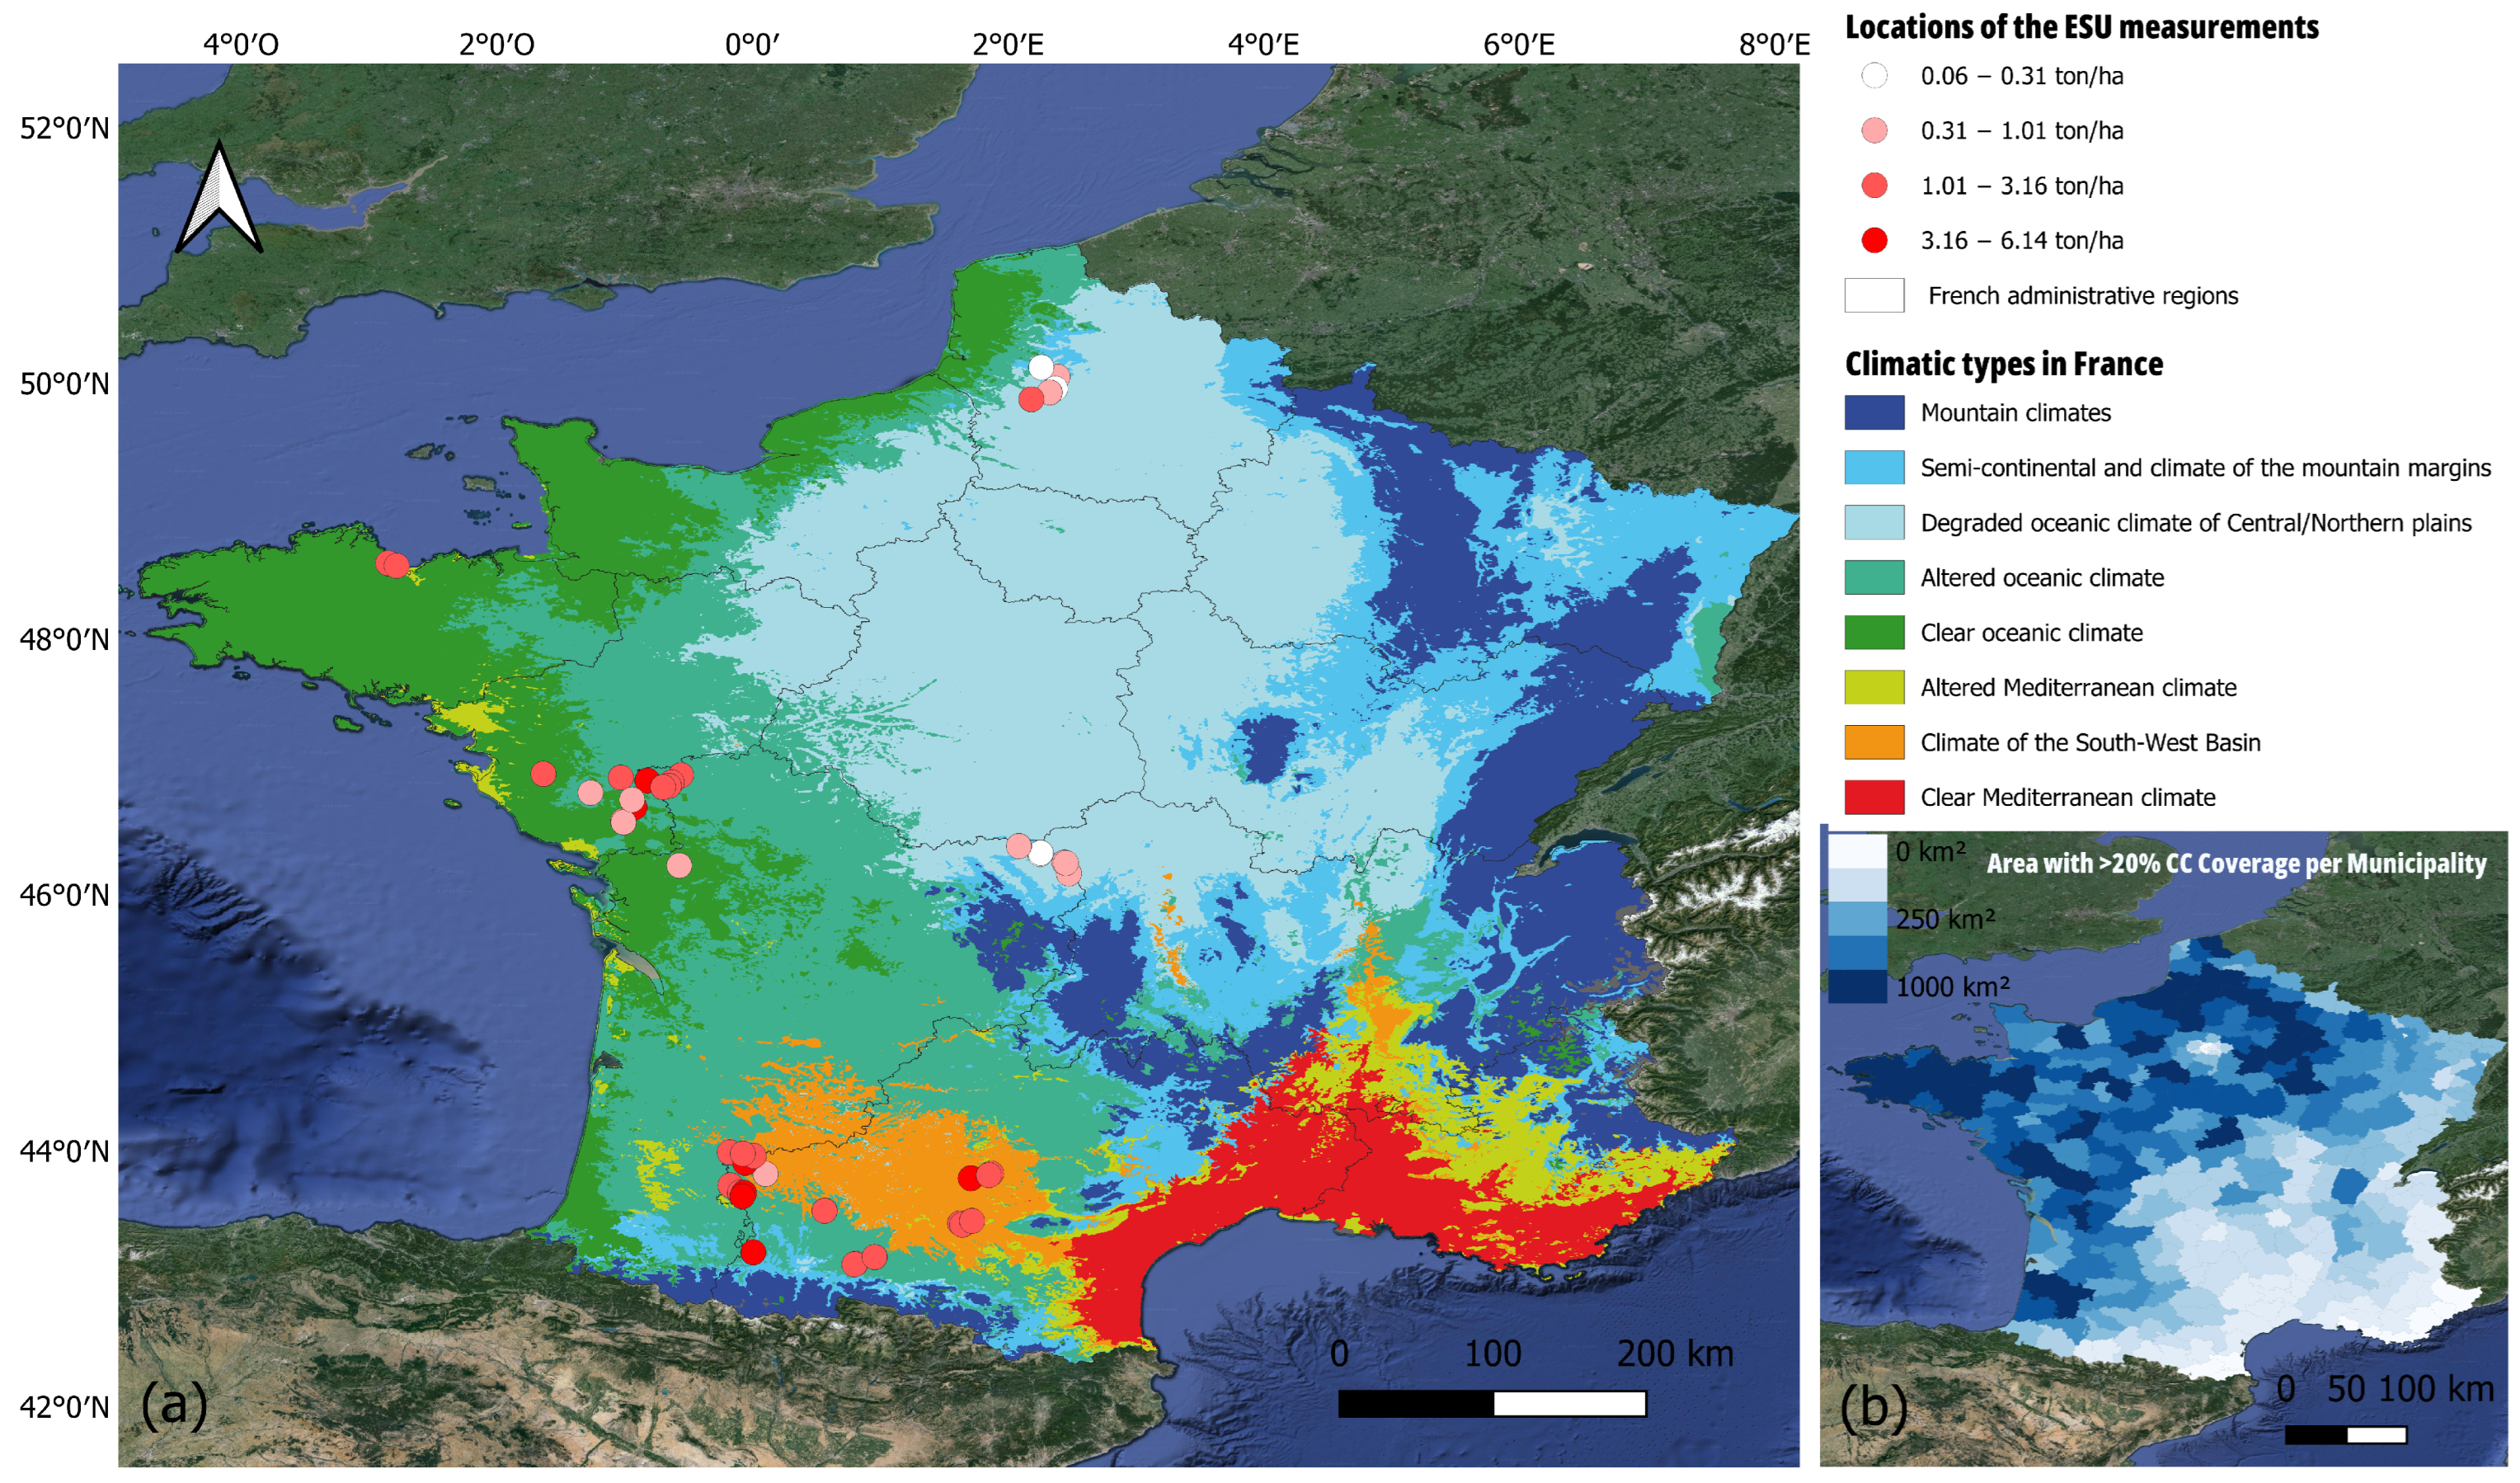
Figure 1. (a) Location of winter cover crop biomass sampling campaign in 2023, considering the different climatic types of France. (b) Distribution of the cover crops in France during 2016–2017, the blue gradient reflects the range of the areas with more than 20% of cover crops by municipality (adapted from Fendrich et al. [26]). Projected coordinate reference system: WGS84.
Remotesensing 16 00834 g001
Figure 2. Illustrative scheme of the ESU protocol for the sample collection. Slight variations can be made in order to accommodate the different planting schemes (basically for cases when plants were sowed in rows or randomly).
Remotesensing 16 00834 g002
Figure 3. Examples of ESU samples for each group of species. (a) Fava bean (legume) with fresh biomass of 1104.90 g, 86.27% water content; the total dry biomass was 1.52 t·ha−1. (b) Ray grass (grasses) with fresh biomass of 102.50 g, 75.32% water content; the total dry biomass was 0.25 t·ha−1. (c) Phacelia (borage) with fresh biomass of 1630 g, 86.91% water content; the total dry biomass was 2.13 t·ha−1. (d) Rapeseed (brassica) with fresh biomass of 1163.40 g, 83.47% water content; the total dry biomass was 1.92 t·ha−1. (e) Mixed cover crops (triticale, fava bean, and radish) with, respectively, 563.90 g, 742.90 g, and 152.90 g of fresh biomass, and 83.7%, 88.46%, and 90.26% water content; the total dry biomass was 1.92 t·ha−1. (f) Fava bean (legume) with fresh biomass of 858.10 g, 82.95% water content and predominance of weed (3014.4 g and 88.76% water content); the total dry biomass was 4.85 t·ha−1.
Remotesensing 16 00834 g003
Figure 4. Averaged spectral behavior of each group of species and standard deviations.
Remotesensing 16 00834 g004
Figure 5. Averaged NDVI temporal behavior of each group of species and standard deviations. The vertical dashed lines in red are the median sampling dates and in blue are the median dates of the last available images considering the different groups of species. The shadows are the deviations.
Remotesensing 16 00834 g005
Figure 6. Based on cross-validation RMSE, top 5 of the models tested (highlighted bars) for the legumes, for the combined group of legumes, brassicas, and borages, for the combined group of legumes, brassicas, borages, and grasses, for the whole dataset (full), for the mixed group, and for the grasses. The italic black number is the r2 of the model and the white numbers are the CVRMSE.
Remotesensing 16 00834 g006
Figure 7. Best VI–DAM biomass model by category.
Remotesensing 16 00834 g007
Figure 8. The 20 most relevant variables identified by the Random Forest model. The variables are named according to the observation date and respective VI/SB. The values in white represent the average Gini index across 1000 iterations for each variable. Meanwhile, the X-axis indicates the frequency with which each variable was selected among the top 10 most important variables in each iteration.
Remotesensing 16 00834 g008
Figure 9. Scatter plot illustrating the correspondence between predicted and actual outcomes, obtained by the averaged model across 1000 iterations.
Remotesensing 16 00834 g009
Figure 10. Error bars plot for an average RF model across 1000 iterations, when applied to the full dataset, obtained by the infinitesimal jackknife technique.
Remotesensing 16 00834 g010
Figure 11. (ac) Google satellite, (df) false-color composition (NIR–red–blue), (gi) DAM map (before termination).
Remotesensing 16 00834 g011
Table 1. Cover crop mix characteristics across 92 sites in France.
ParameterMaximumMinimumMeanMedianSD
Species (number site−1)5.001.001.902.001.00
Grasses (percentage of total biomass−1)100.000.0050.2854.3342.33
Legumes (percentage of total biomass−1)100.000.0026.3513.1932.04
Brassicas (percentage of total biomass−1)100.000.006.310.0021.80
Borages (percentage of total biomass−1)97.820.003.480.0015.31
Flaxes (percentage of total biomass−1)34.040.000.450.003.63
Weeds (percentage of total biomass−1)100.000.0013.131.3421.83
Table 2. Median dry aboveground biomass (DAM), mean water content, and weed percentage of the field measurements for each group of species.
Group of SpeciesObservationsDry Biomass (t·ha−1)Water Content (%)Weed (%)
Grasses392.40 ± 1.4280.36 ± 4.882.13
Legumes141.36 ± 1.0486.24 ± 2.659.25
Brassicas50.69 ± 0.2482.39 ± 1.283.94
Borages22.80 ± 0.2985.72 ± 1.683.65
Mixed281.67 ± 1.1883.53 ± 3.6422.60
Weeds45.08 ± 2.7182.70 ± 5.3183.70
Table 3. Machine learning model results.
Machine Learning ModelTuned Parametersr2MAECVRMSE
Random Forest (RF)maxnodes: 20; ntree: 1000.550.730.98
Support Vector Machine (SVM)kernel: radial;
cost: 1; gamma: 0.1
0.530.710.97
eXtreme Gradient Boosting (XGBoost)nfold: 5; nrounds: 10; eta: 0.3;
max depth: 10; subsample: 0.7
0.460.811.08
Multivariate Linear Regression-0.241.121.56
Disclaimer/Publisher’s Note: The statements, opinions and data contained in all publications are solely those of the individual author(s) and contributor(s) and not of MDPI and/or the editor(s). MDPI and/or the editor(s) disclaim responsibility for any injury to people or property resulting from any ideas, methods, instructions or products referred to in the content.