Article

Sentinel-2 versus PlanetScope Images for Goldenrod Invasive Plant Species Mapping

by
Bogdan Zagajewski
1,*,
Marcin Kluczek
1,
Karolina Barbara Zdunek
1 and
David Holland
2
1
Department of Geoinformatics, Cartography and Remote Sensing, Chair of Geomatics and Information Systems, Faculty of Geography and Regional Studies, University of Warsaw, 00-927 Warszawa, Poland
2
Applied Research, Ordnance Survey, Southampton SO16 0AS, UK
*
Author to whom correspondence should be addressed.
Remote Sens. 2024, 16(4), 636; https://doi.org/10.3390/rs16040636
Submission received: 10 December 2023 / Revised: 4 February 2024 / Accepted: 6 February 2024 / Published: 8 February 2024

Abstract

:
A proliferation of invasive species is displacing native species, occupying their habitats and degrading biodiversity. One of these is the invasive goldenrod (Solidago spp.), characterized by aggressive growth that results in habitat disruption as it outcompetes native plants. This invasiveness also leads to altered soil composition through the release of allelopathic chemicals, complicating control efforts and making it challenging to maintain ecological balance in affected areas. The research goal was to develop methods that allow the analysis of changes in heterogeneous habitats with high accuracy and repeatability. For this reason, we used open source classifiers Support Vector Machine (SVM), Random Forest (RF), and satellite images of Sentinel-2 (free) and PlanetScope (commercial) to assess their potential in goldenrod classification. Due to the fact that invasions begin with invasion footholds, created by small patches of invasive, autochthonous plants and different land cover patterns (asphalt, concrete, buildings) forming heterogeneous areas, we based our studies on field-verified polygons, which allowed the selection of randomized pixels for the training and validation of iterative classifications. The results confirmed that the optimal solution is the use of multitemporal Sentinel-2 images and the RF classifier, as this combination gave F1-score accuracy of 0.92–0.95 for polygons dominated by goldenrod and 0.85–0.89 for heterogeneous areas where goldenrod was in the minority (mix class; smaller share of goldenrod in canopy than autochthonous plants). The mean decrease in the accuracy analysis (MDA), indicating an informativeness of individual spectral bands, showed that Sentinel-2 bands coastal aerosol, NIR, green, SWIR, and red were comparably important, while in the case of PlanetScope data, the NIR and red were definitely the most important, and remaining bands were less informative, and yellow (B5) did not contribute significant information even during the flowering period, when the plant was covered with intensely yellow perianth, and red-edge, coastal aerosol, or green II were much more important. The maximum RF classification values of Sentinel-2 and PlanetScope images for goldenrod are similar (F1-score > 0.9), but the medians are lower for PlanetScope data, especially with the SVM algorithm.

Graphical Abstract

1. Introduction

Plants and animals, by occupying new habitats, develop natural population strategies; this process is naturally limited by the availability of suitable habitats and species interactions. Moreover, natural barriers and ecological corridors are disrupted by human activities, thereby increasing the scale and extent of the spread of invasive species, leading to the displacement of representatives of native fauna and flora, changing the stability of the ecosystem [1]. The extinction of indigenous species and the destruction of biodiversity is so significant that it is regulated by international and domestic law. In 2014, the European Union (EU) issued Regulation No. 1143/2014 (with subsequent updates) on the prevention and management of the introduction and spread of invasive alien species. Goldenrod (Solidago spp.) is not currently on lists of the most threatening native plant species, but its lush and long flowering period significantly distracts some native pollinators (wasps, bees, bumblebees, butterflies, and beetles) adapted to native flowering plant species, the disappearance of which causes a decline in the populations of the insect representatives concerned. The goldenrods spread large numbers of seeds and reproduce vegetatively; moreover, their allopatric properties inhibit germination and nutrient uptake and growth of neighboring plants [2]. The presence of honey-giving goldenrod flowers in devastated areas allows the presence of some insect species, while at the same time their essential oils (EOs) negatively affect plant growth and development [3], e.g., substances from Solidago canadensis leaves were the most poisonous to flies (Musca domestica) and mosquitoes (Culex quinquefasciatus), while oils from Solidago gigantea leaves were poisonous to Spodoptera littoralis larvae. The above elements mean that goldenrod is considered a moderately invasive species, but it is widely distributed [4], which leads to the systematic transformation of habitats from which indigenous plants, insects, and the rhizosphere are eliminated [5]. Invasions start from small, local areas, usually entering under canopies of trees and bushes, which makes it difficult to identify emerging individuals, but they regularly occupy new areas. An interest in using remote sensing to identify invasive and expansive species has increased significantly in recent years due to open source tools and data that are characterized by high temporal, spatial, and spectral resolution, allowing the identification of plant species and communities at local and regional scales (without interpolation) [6,7]. This is important for tracking the dynamics of invasion and an assessment of threats to biodiversity. Most works have used aerial data or high-resolution satellite imagery; Sabat-Tomala et al. [8], based on airborne hyperspectral HySpex images, Random Forest (RF), and Support Vector Machine (SVM) algorithms, classified three species of expansive and invasive plants (including Solidago spp.) with accuracy of around 0.90 (F1-scores), emphasizing that the results obtained for spring, summer, and autumn images were similar, and the fusion of all the data allowed goldenrod to be mapped with an F1-score of 0.99. However, it is still a challenge to develop a method for identifying the early stages and new outposts of the invasion, consisting of spectrally heterogeneous objects [8]. This problem was analyzed by Rizaludin Mahmud et al. [9], identifying goldenrod in the heterogeneous urban landscape of Japan. Using hyperspectral signatures, the authors developed the Solidago altissima flower index (SAFI), which, combined with high-resolution WorldView-2 (WV-2) satellite images, allowed the identified spectral characteristics to be applied on a landscape scale. This method was based on the Maximum Likelihood algorithm, scoring an overall accuracy of 72% (OA) [9]. Akandil et al. [10] identified Solidago gigantea using high-resolution multispectral images acquired with a drone. The images were captured during the peak of a goldenrod bloom in August, distinguishing homogeneous patches on the basis of visual interpretation. The Maximum Likelihood algorithm classified goldenrod with 95% producer accuracy (PA) and user accuracy (UA). A different approach in terms of the date of acquisition of the images, falling in spring before the development of goldenrod flowers, but also using AISA aerial hyperspectral images, was proposed by Ishii and Washitani [11]; the General Linear Model algorithm classified the first three MNF bands (after Minimum Noise Fraction transformation), achieving 94% UA and 80% PA. The results obtained for Solidago altissima suggest that hyperspectral data recorded in early spring may be a valuable asset in detecting invasion footholds before other plant species develop in the study area. The same observation was confirmed by Sabat-Tomala et al. [8] based on airborne HySpex images.
Previous work on goldenrod mapping focuses mainly on high-resolution aerial images, e.g., the above-cited UAV [10] or hyperspectral [8] studies, which offer good results but, due to the range of the acquired images, they concern only small case studies. Therefore, a much more important element is the verification of medium-resolution satellite images and the early detection of invasion footholds, i.e., the first stages that will allow the identification of small and heterogeneous patches. Another problem is the compactness of patches of invasive species, which often reproduce through underground roots or produce big numbers of seeds that are dispersed far by wind, allowing them to quickly colonize new areas, e.g., along expressways and railway routes. These areas are difficult to identify, because there is a heterogeneity of technical infrastructure and plants, and some plants do not dominate in the canopy, but constitute dangerous sources of invasion, e.g., hiding in bushes, woodlots, under plant canopies, and other places where mowing machines do not have access.
Being a part of the European Space Agency (ESA) Copernicus program, the Sentinel-2 mission is invaluable for monitoring. The Sentinel-2A and Sentinel-2B satellites offer a shortened revisit time of up to 5 days (10 days at the equator with one satellite) and a wide swath of imaging reaching 290 km using the MultiSpectral Instrument (MSI) and offering 13 spectral bands, with a spatial resolution of 10 m, 20 m, and 60 m (Table 1) [12]. The images are valuable to a wide range of applications especially since the data are free, corrected, and well provided via the Copernicus Data Access Service platform [13].
PlanetScope, a project by Planet Labs, has revolutionized the availability of satellite data with its constellation of CubeSats [14]. It provides daily acquisition and high spatial resolution, e.g., the currently operated SuperDove sensor offers a 3.7 m pixel size (32.5 km × 19.6 km), covering 20,000 km2 as a maximum image strip per orbit, which enables the capture of up to 200 million km2 of Earth’s surface every day via the 130-satellite PlanetScope constellation, which are located on 450–580 km orbits [15,16]. The SuperDove satellites, part of the third generation of the fleet, are equipped with the PSB.SD instrument, which captures eight spectral bands with 16-bit radiometric resolution (Table 1). PlanetScope images are available at various processing levels, with Level 3B offering images after radiometric correction, geometric correction, and orthorectification [16]. Although PlanetScope data are commercial, the company provides access for educational and research purposes through the Planet’s Education and Research Program [17].
Both systems, Sentinel-2 and PlanetScope, have unique features and applications. Sentinel-2 is irreplaceable in projects requiring a broad spectral range (especially NIR and SWIR), frequent revisit times, and multiscale environmental monitoring. Conversely, PlanetScope provides frequent data updates with high spatial resolution, which is key for quick responses to changes, where data recency and frequency are a priority.
The topic of identifying other expansive and invasive plant species in Sentinel-2 data is described in [18,19]. Sentinel-2 images offer high temporal resolution, allowing the capture of the different stages of phenological development of invasive plants in relation to native species, which is one of the key elements of the strategic advantage of alien species over native plants. Sentinel-2 thus fills the time gaps caused by the lack of airborne hyperspectral data [20], providing valuable data to conduct monitoring on regional and continental scales and significantly reducing costs [21].
In our studies, we focus on RF and SVM classifiers, because these classifiers allow the analysis of a significant amount of input data, which is important in the identification of plant species that change during the growing season. Additionally, the process of optimizing classification parameters is relatively simple and fast, and the results obtained achieve high accuracy. RF, especially, offers high efficiency in identifying changing vegetation, and requires a relatively small number of training patterns (300–700 pixels). But in the literature, there is a belief that deep learning methods offer better classification results, so below we would like to point out that many studies do not confirm this opinion, especially in the case of heterogeneous vegetation. In the case of deep learning networks, if the amount of entered data is large, the optimization and classification time is significantly extended compared to the use of machine learning algorithms [22,23,24]. Due to an independence and automatic selection of the training set in neural networks, there is a risk of over-fitting the model, as well as the selection of irrelevant training samples [23,25]. Often, the use of deep learning requires much more data to train the network than in the case of other algorithms in the field of artificial intelligence [25,26]. Subsequently, the selection of matching spectral bands is a challenge to prepare a well-functioning model, because most often the training of the network takes place on a limited number of bands, and expanding it with a larger number is extremely time-consuming and requires increased memory for relearning, which traditional machine learning algorithms do not have to deal with [27]. The authors [23,28] pointed to the lower performance of neural networks than algorithms such as SVM or RF in the case of noisy data; heterogeneous classes are also a problem in deep learning, as the boundaries of individual classes are distorted and the inability to distinguish different pixels within a class treated as a large patch becomes apparent [24,29]. Lake et al. [30] identified leafy spurge (or wolf’s milk leafy spurge; Euphorbia virgata, which is also an invasive yellow flowering plant in the US) based on a deep learning network (CNN) and high-resolution images of WorldView-2 (eight bands) and PlanetScope (four spectral bands, 3 m spatial resolution). The obtained overall accuracy was 96.3% based on CNN + Long Short-Term Memory (LSTM), while for the variant considering only CNN, the accuracy of PlanetScope data classification was 89.9% and, for WorldView-2, it was 96.1%.
The aim of this paper is to assess the usefulness of widely available Sentinel-2 and high-resolution commercial PlanetScope multispectral data, as well as the Random Forest (RF) and Support Vector Machine (SVM) algorithms for the identification of goldenrod (Solidago spp.). Previous methods of monitoring goldenrod were based on traditional botanical research, which is burdened with high costs and is time-consuming; hence, in many countries, orthophotomaps, airborne imaging, or high-resolution satellite images are used to identify goldenrod at local scales. Due to the nature of the plants investigated, which form heterogeneous polygons with native species during the first stages of the invasion, the research challenge was to assess the accuracy of the classified patches. Various scenarios were tested, including the random selection of a different number of pixels (in 100 repetitions of iterative classification), using entire polygons with the dominant share of goldenrod, but also polygons where goldenrod was beginning to appear, creating different mix patterns.

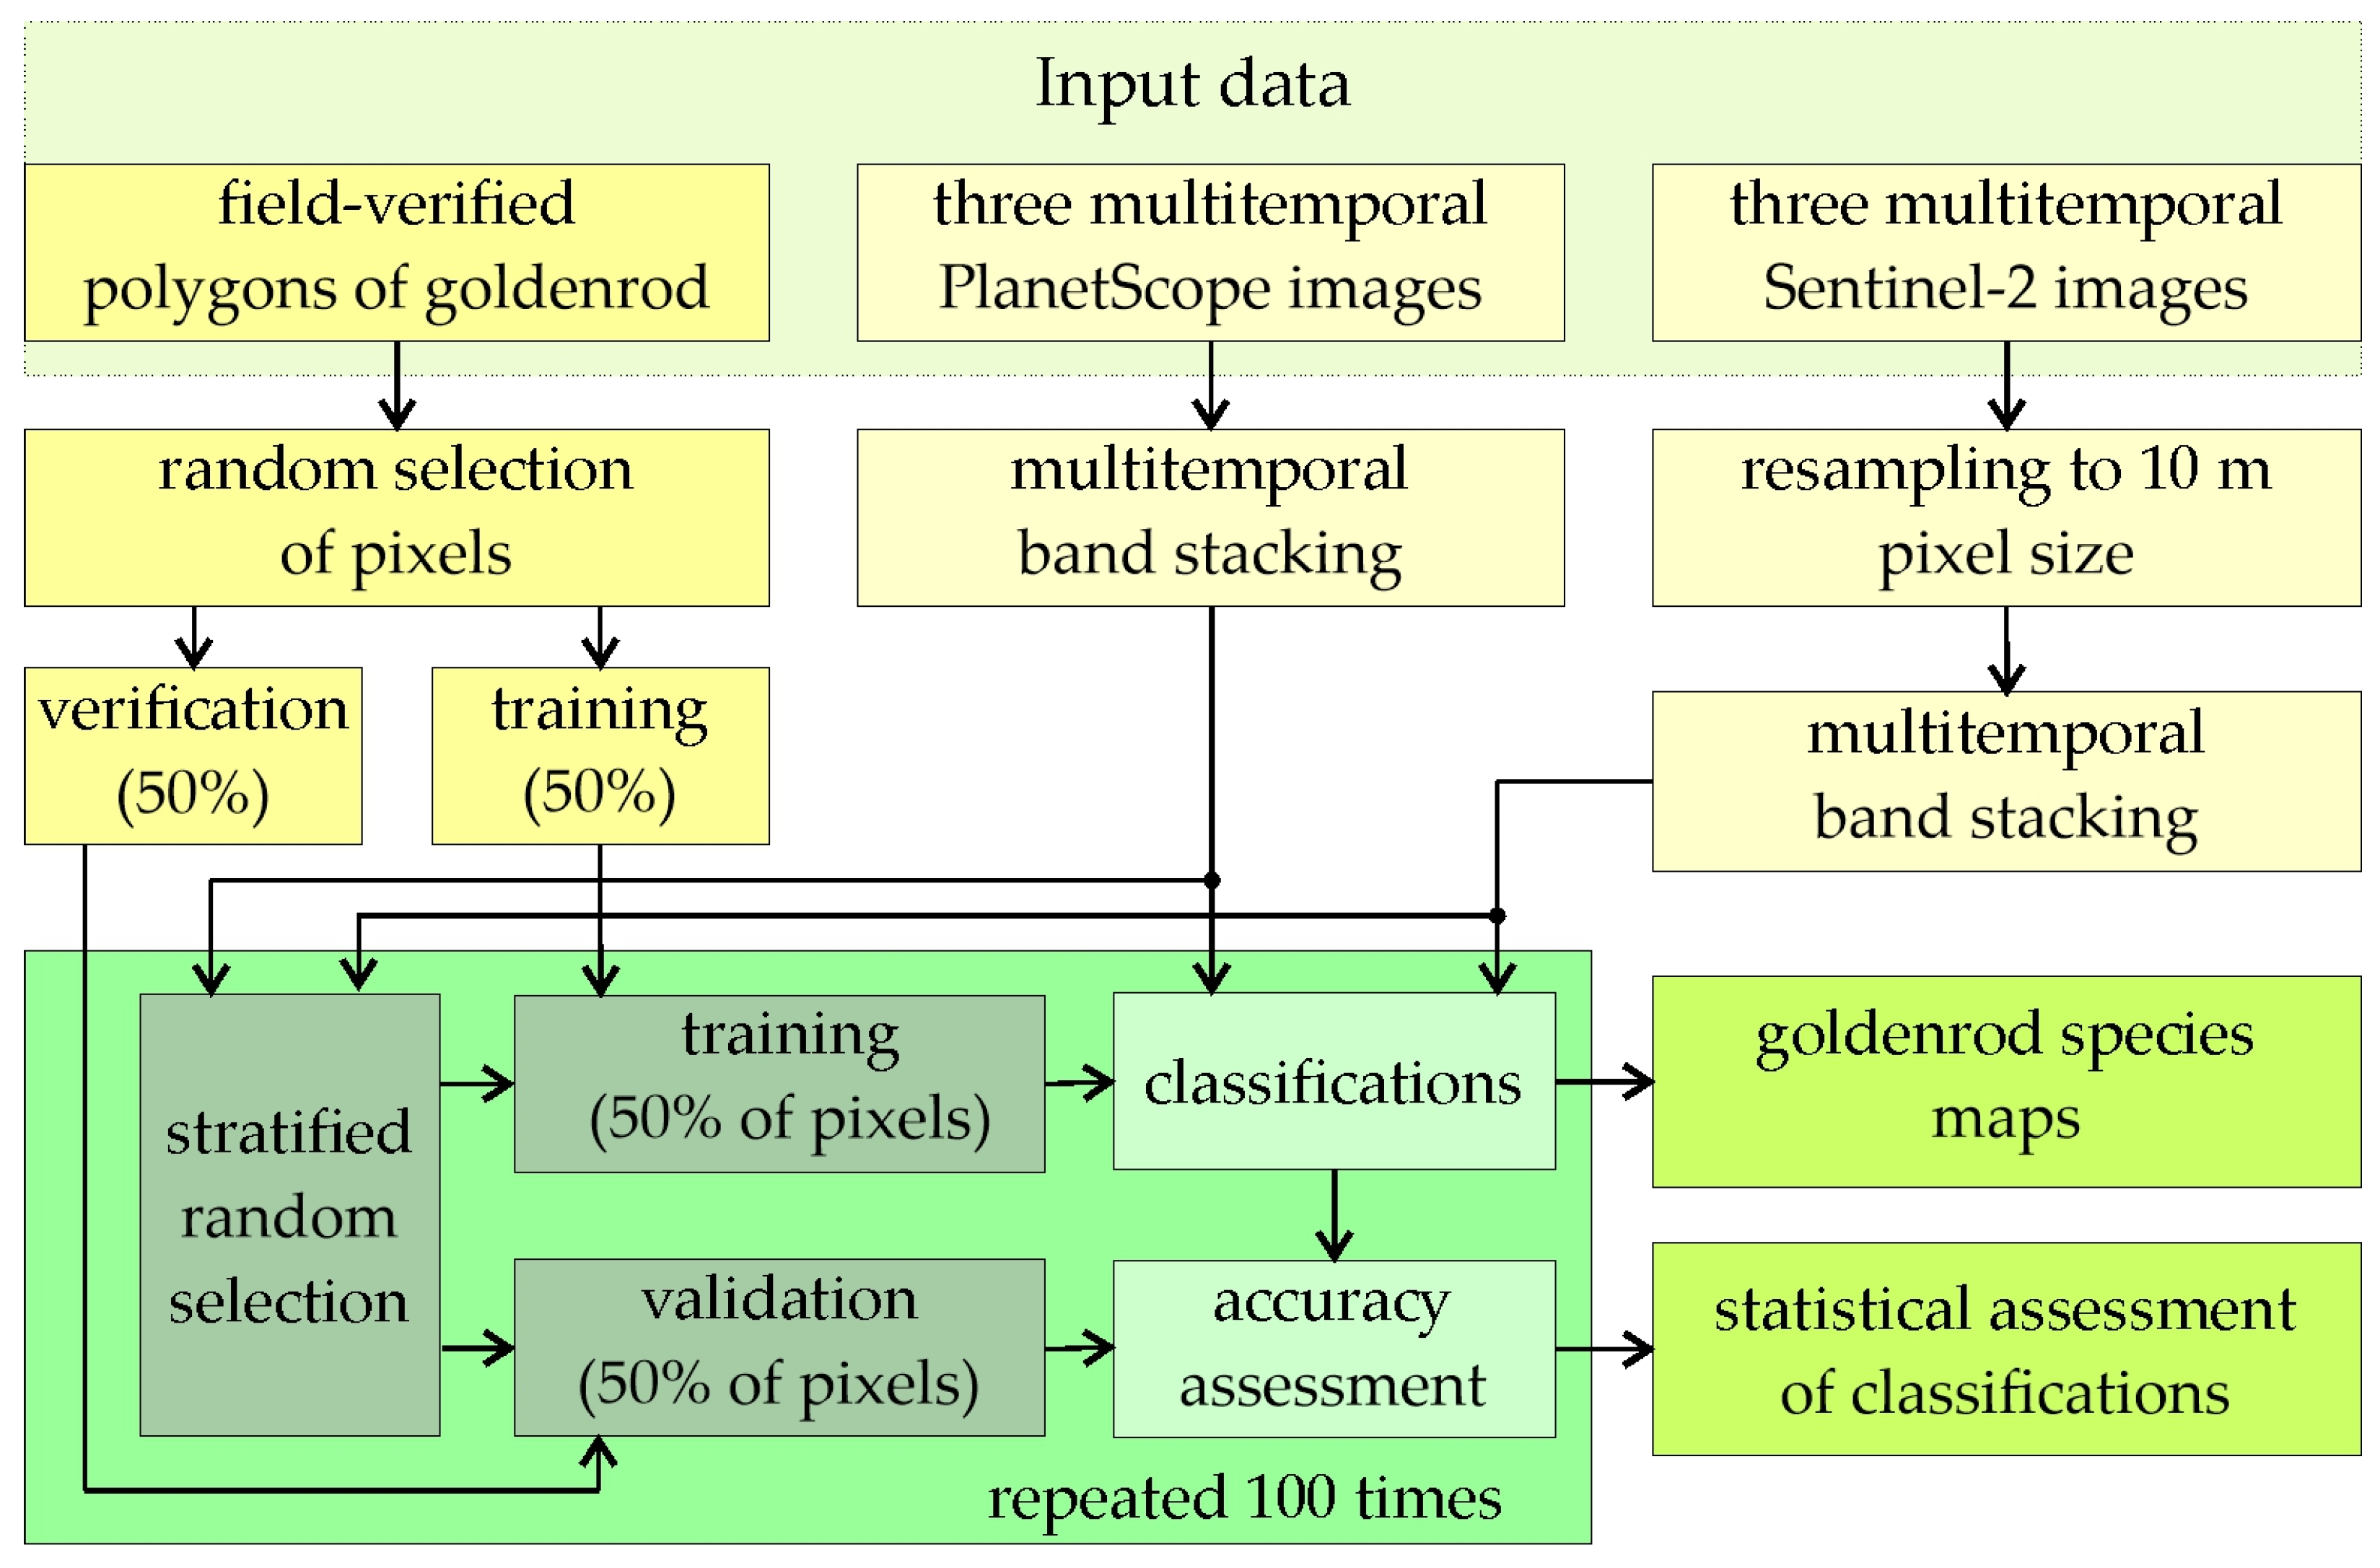
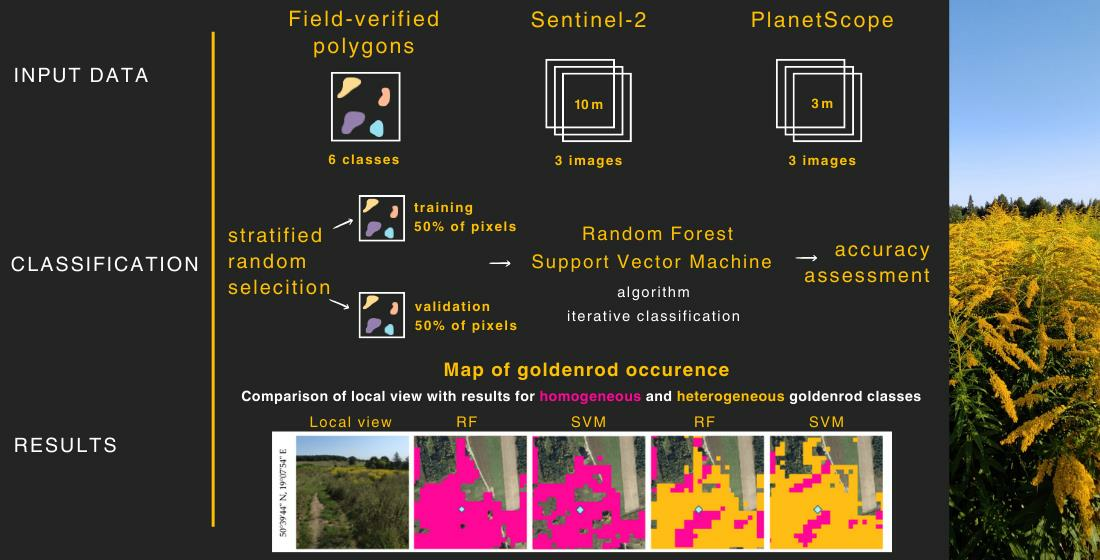
2. Materials and Methods

Goldenrod mapping was based on multitemporal Sentinel-2 and PlanetScope satellite images, which were acquired on the same dates, representing the flowering period, early and late autumn (faded inflorescences are big, dry, and durable, which reflect a significant amount of radiation), allowing goldenrod to be distinguished from surrounding plants. As training and verification patterns, field-verified polygons were used; two types of classes were created: (a) goldenrod, which represented homogeneous core areas of goldenrod, and (b) the mix class, in which goldenrod is present but mixed with a significant dominance (much above 50%) of bushes, single trees, or other grassland species (Figure 1) to capture initial stages of goldenrod invasion. Based on goldenrod occurrence polygons, randomized training and verification pixels allowed the classification, in 100 subsequent iterations, of the spatial distribution of the plant; this was intended to capture the spectral variability of individual hatchlings representing different stages of invasion; Random Forest and Support Vector Machine classifiers were used as open source algorithms in the R programming language (Figure 2).

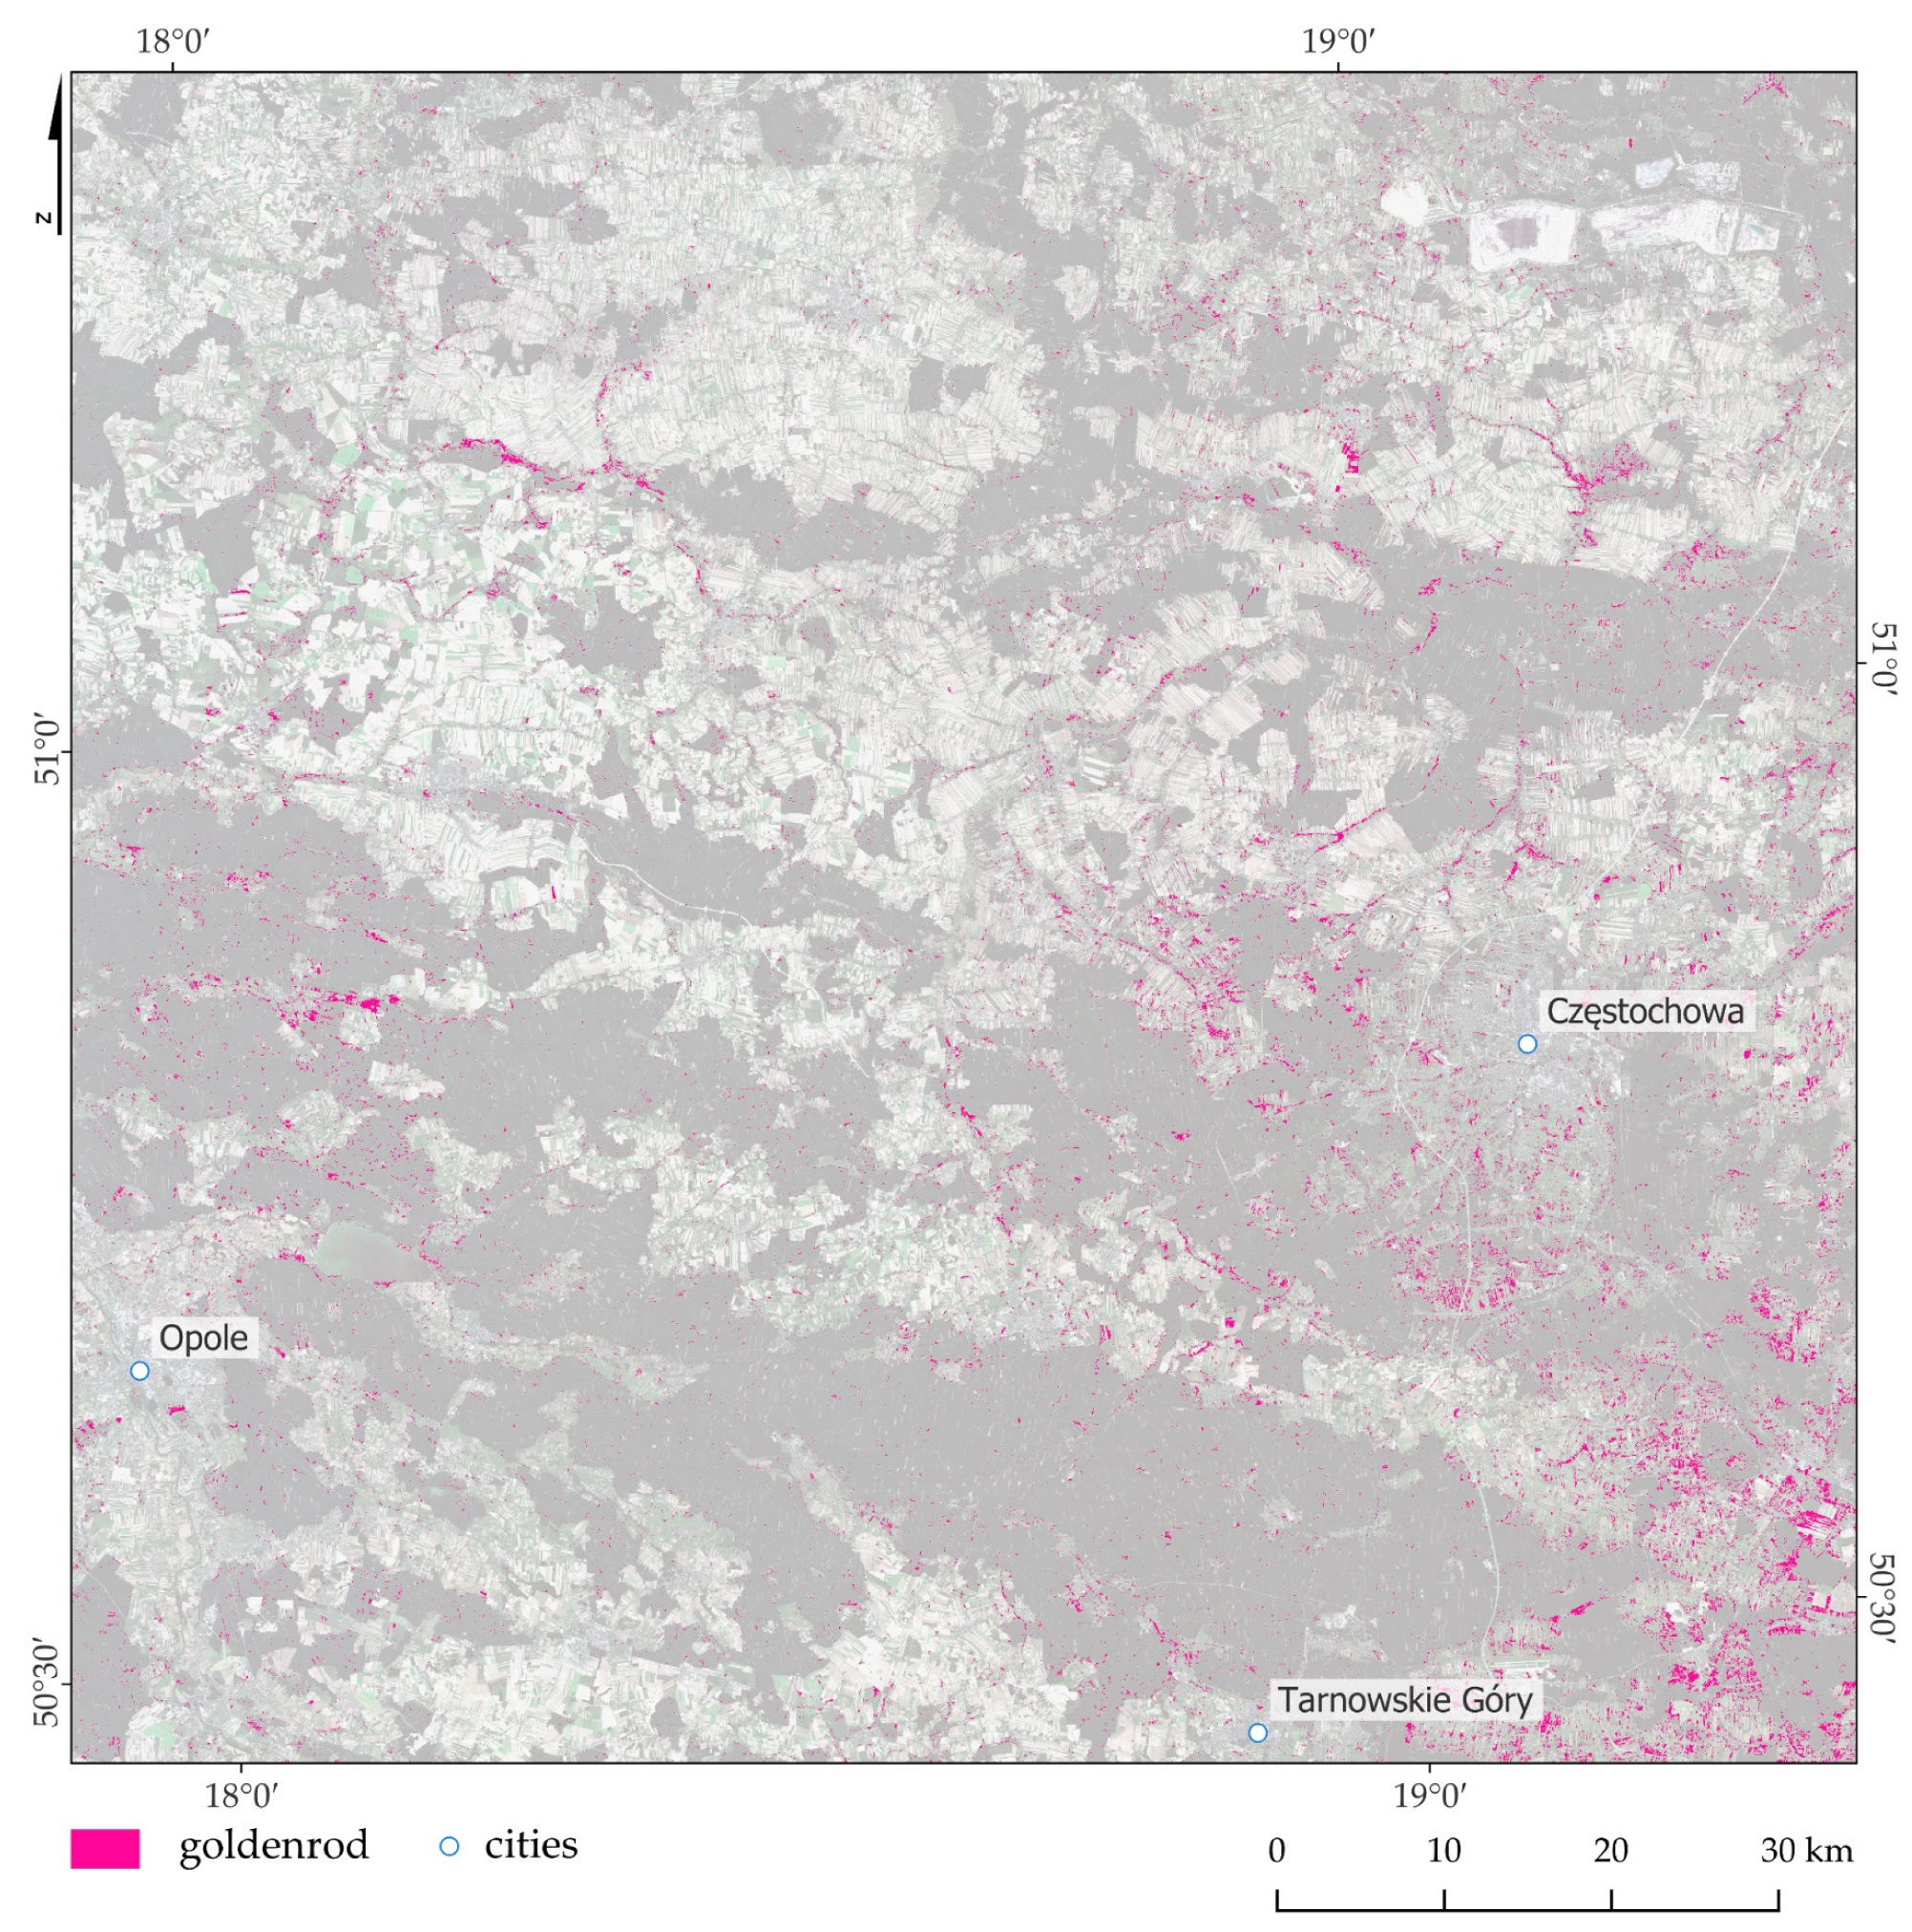
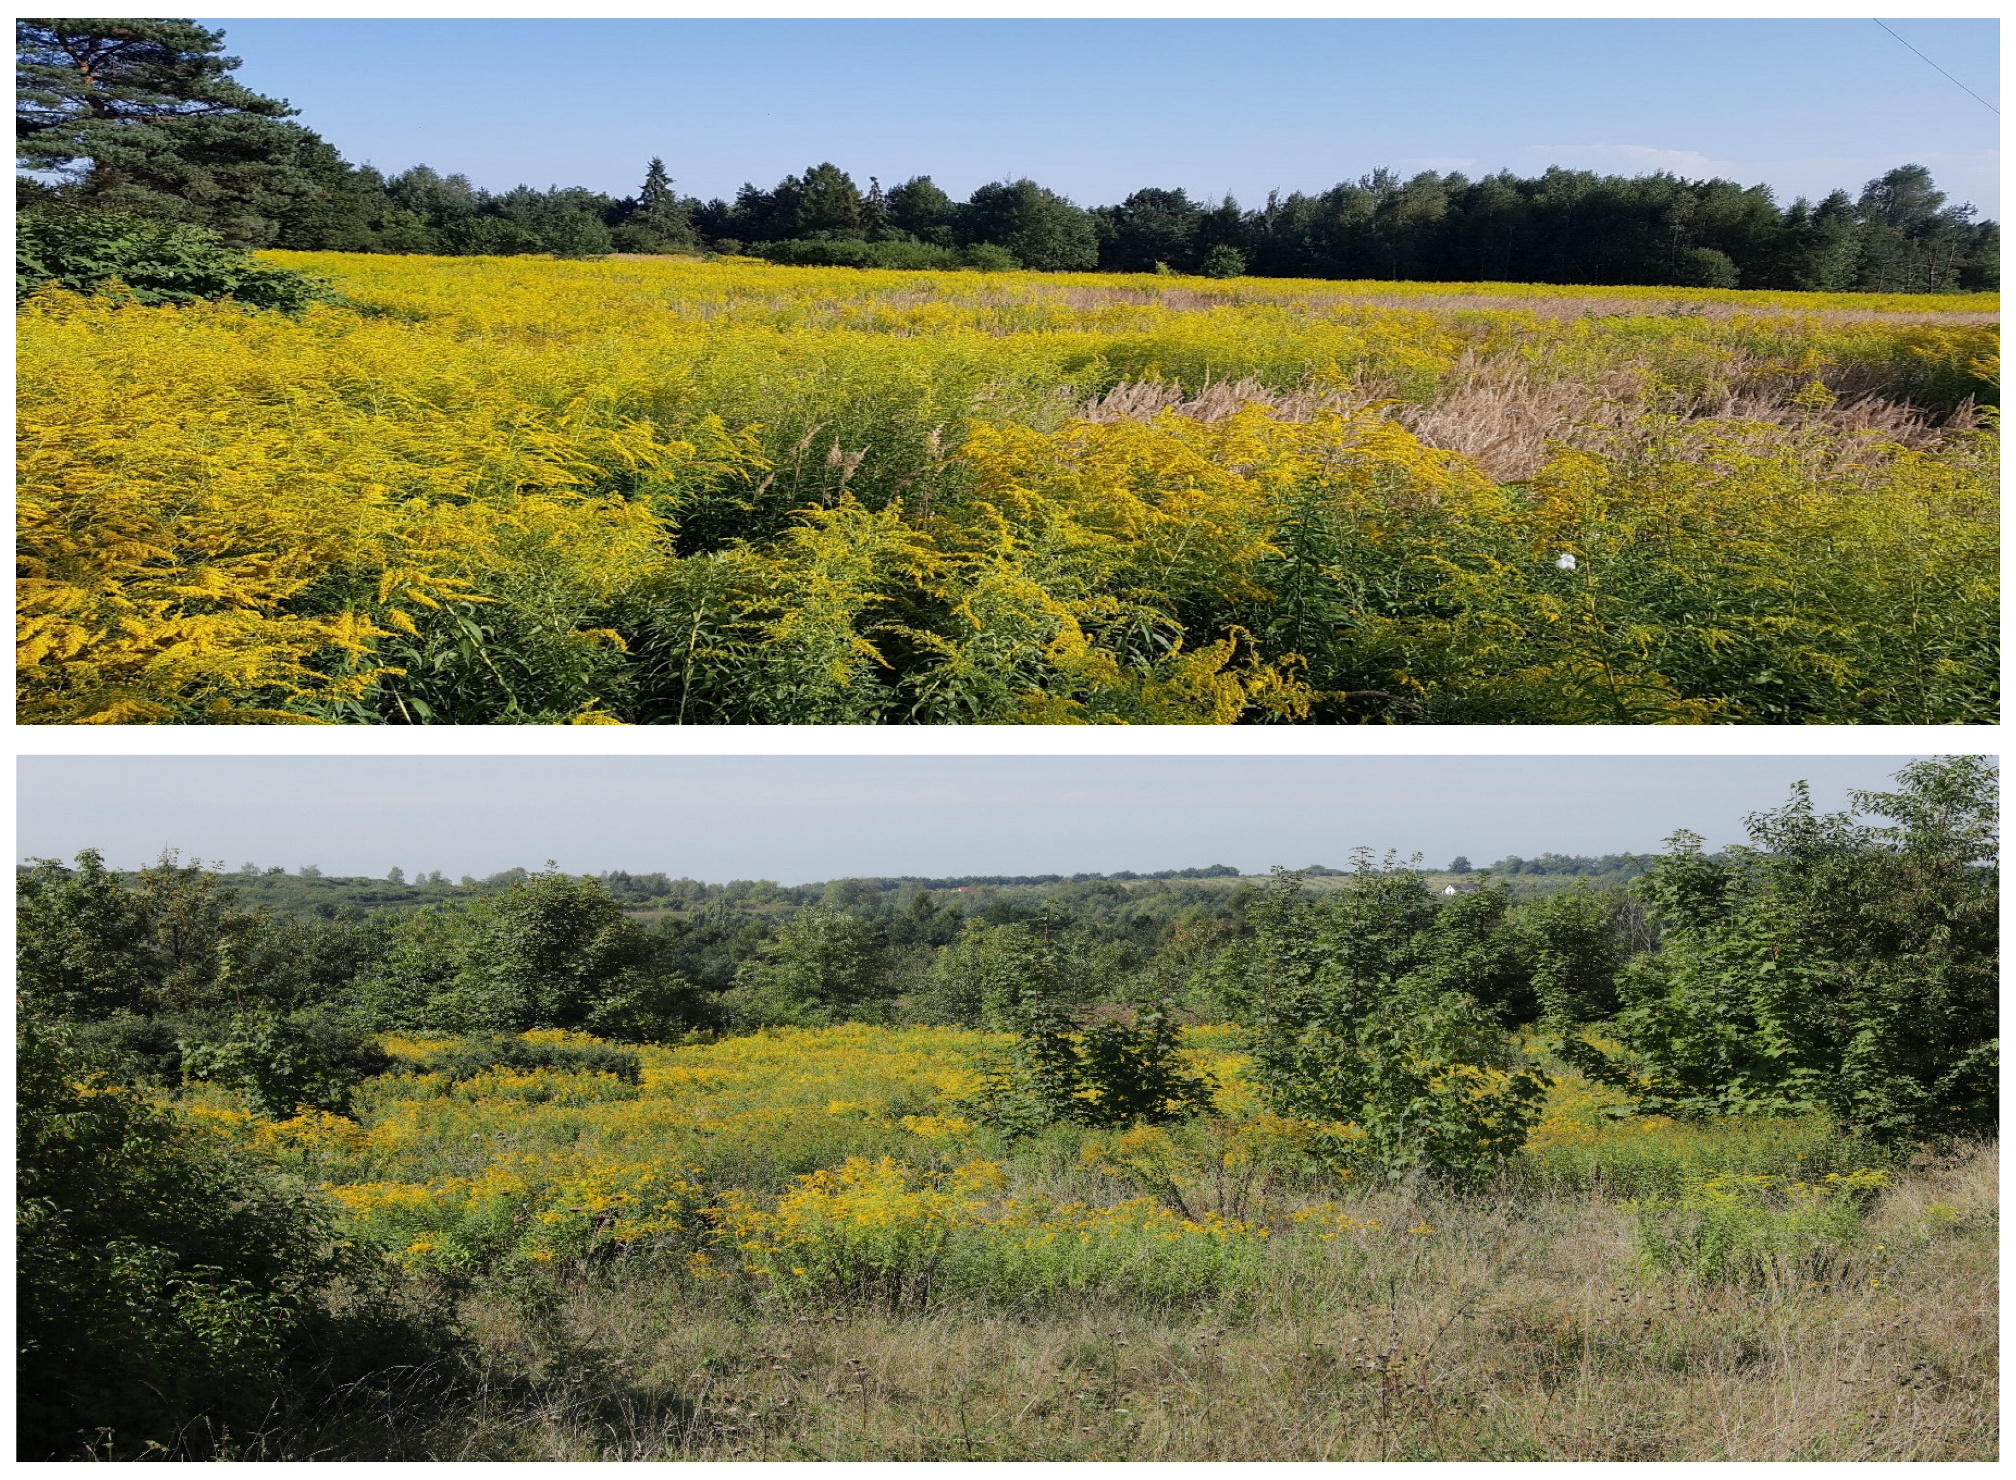
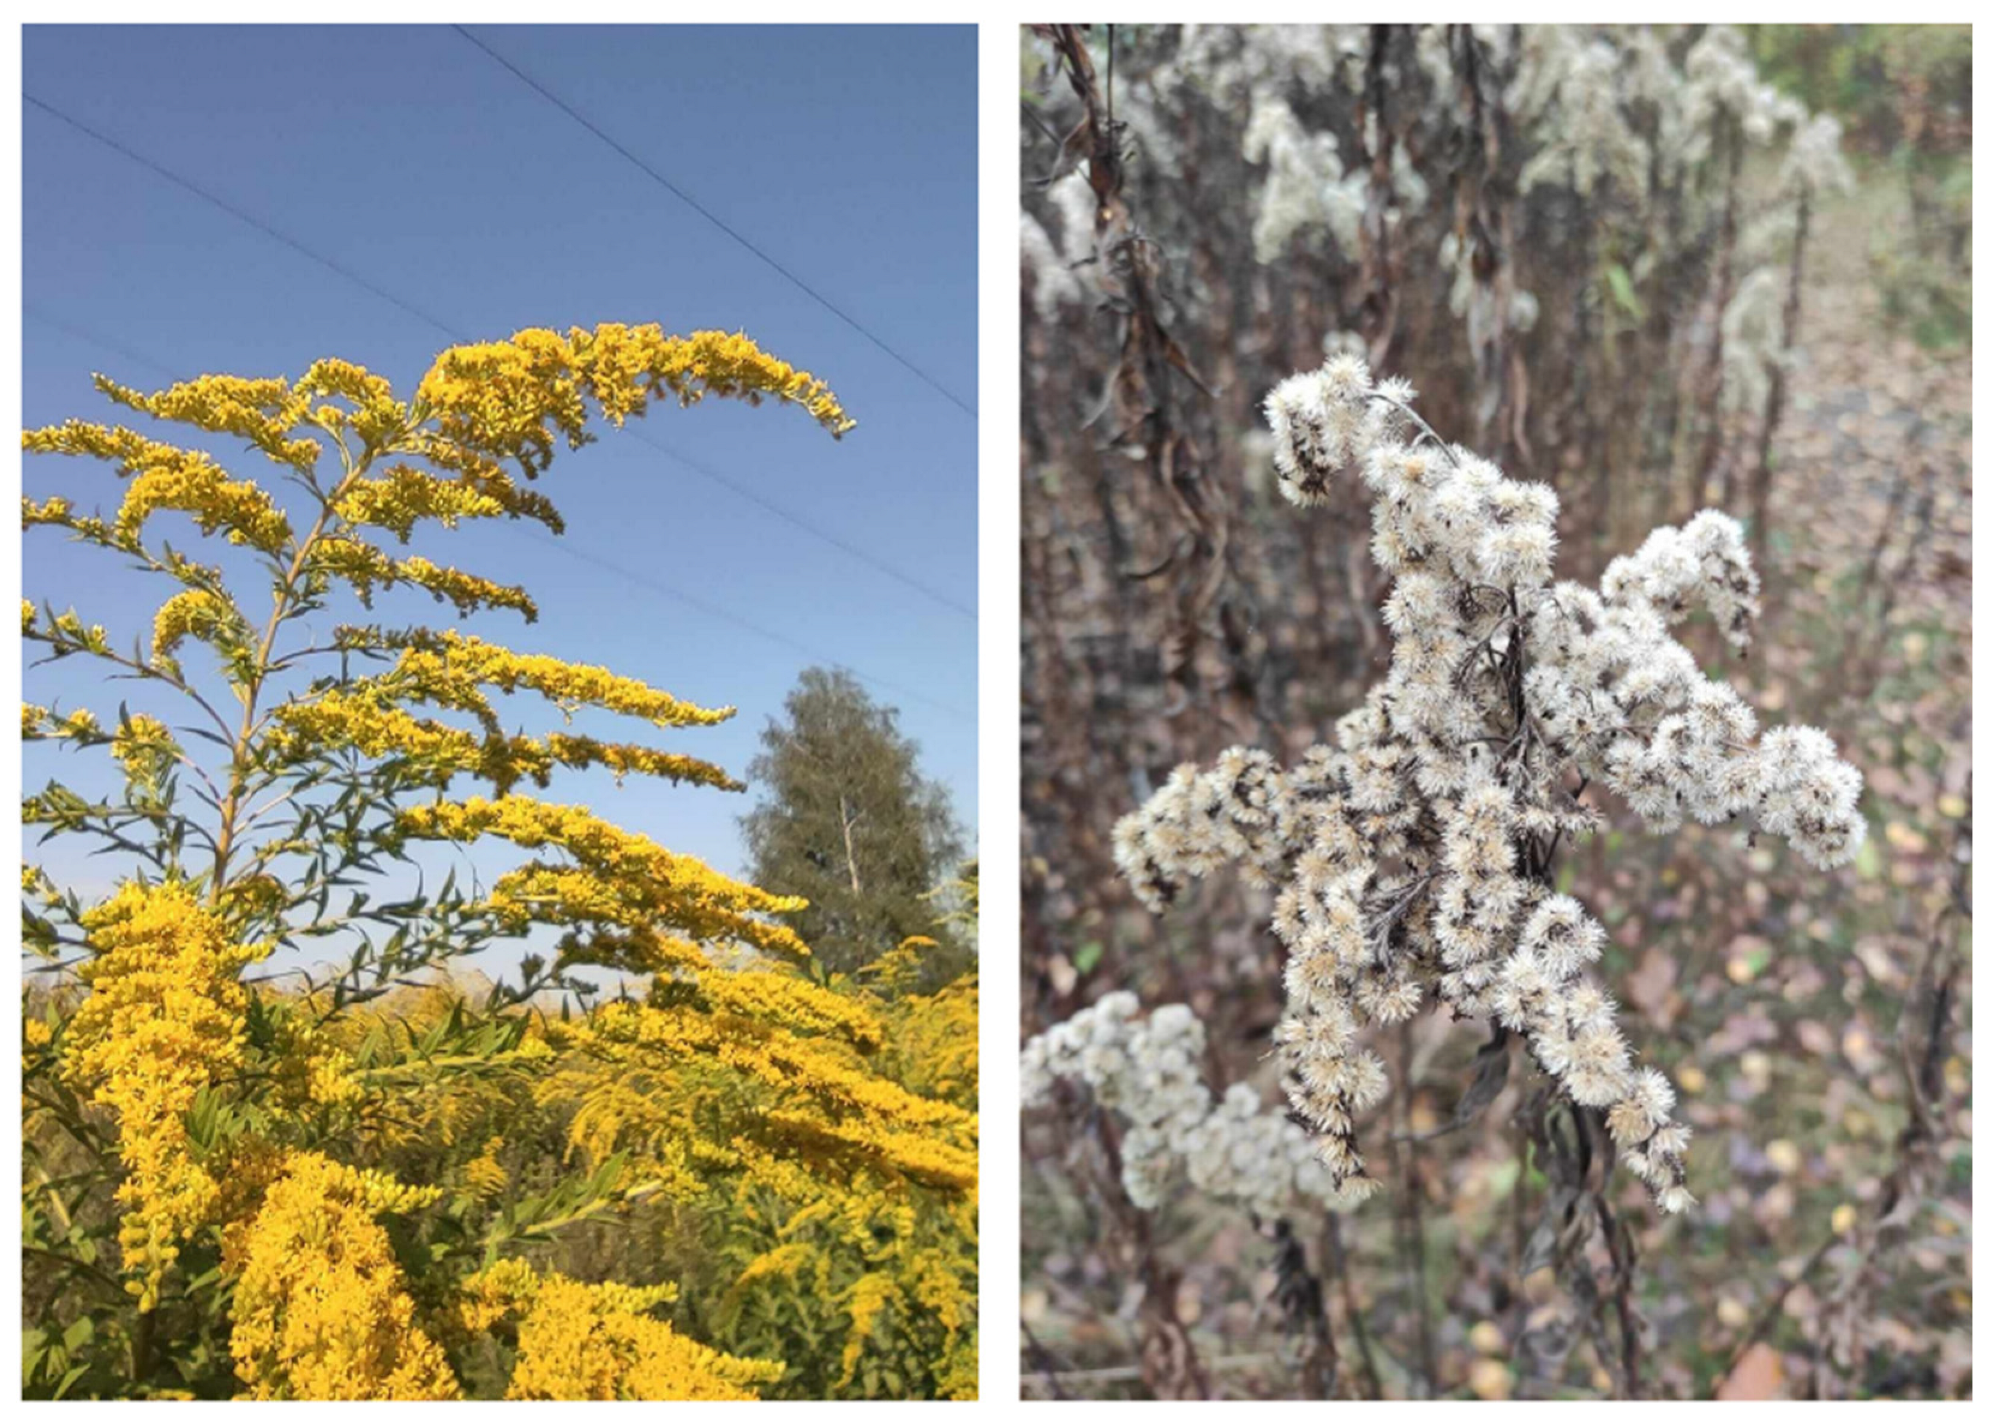
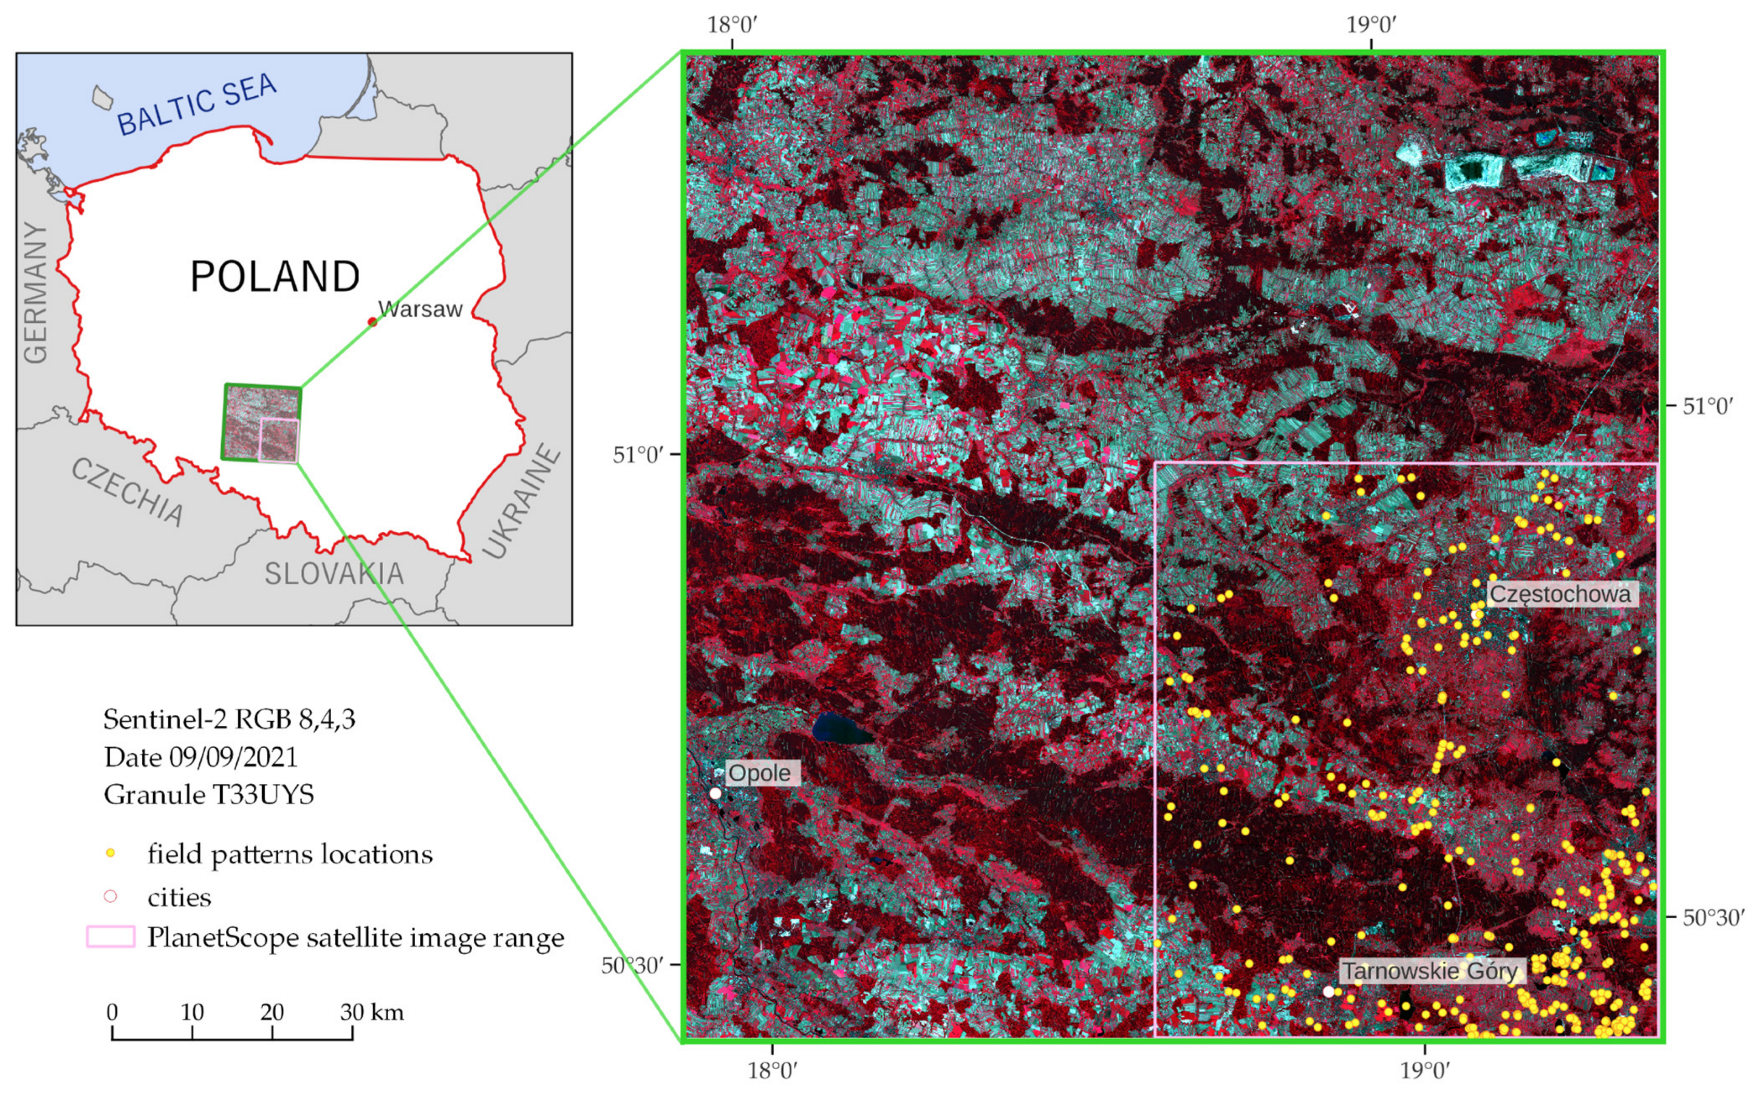
2.1. Research Target and Area

The giant (tall) goldenrod (Solidago gigantea Aiton) and the Canadian goldenrod (Solidago canadensis L.) belong to the Asteraceae family (formerly Compositae), which is one of the biggest groups among plants, with about 24,000–32,000 species. Both species are perennials reaching considerable sizes (giant goldenrod reaches up to 250 cm, while Canadian goldenrod reaches up to 150 cm in height). Their yellow inflorescences bloom from July to October; however, the period of the most intense bloom falls between the second half of August and the end of September (Figure 3). It is worth noting that the allelopathic properties of chemical substances secreted by goldenrod inhibit development of other plant species [2], allowing it to gain a competitive advantage and facilitate new invasions [31]. In Europe, these species grow in both natural and anthropogenic environments, commonly occurring on the edges of forests, roadside belts, as well as meadow wastelands, creating characteristic compact, single-species patches (Figure 2). Both Solidago species show similar adaptations, enabling the rapid expansion of their range, thanks to which they currently occupy almost all of Europe [3]. Nagy et al. [32] confirmed that mowing, grazing, and periodic flooding had negative consequences for development of S. gigantea, but short-term mowing does not improve diversity of the Solidago canopy, while long-term agricultural treatments improved diversity of natural plants.
The research area is a fragment of the Silesian-Cracow Upland (near Częstochowa; Figure 4), where there are large areas of wasteland and industrial areas, where a dynamic increase in invasive and expansive species is observed. Field studies were conducted in early September (3–4 September 2021) to capture the period when goldenrod was in full bloom, which allowed the identification of the full range of the species occurrence, especially in heterogeneous patches, in this area (Figure 4) to identify large patches of (a) homogeneous goldenrod, and (b) heterogeneous polygons with the constant presence of various species. We were aware that such heterogeneous classes would be difficult to identify and may reduce scored classification results, but the presence of even single specimens of goldenrod causes rapid colonization. For this reason, the mix class is a valuable indicator of the direction of changes. Goldenrod occurs mainly on post-agricultural and post-industrial wastelands, where high dynamics of changes resulting from secondary succession lead to difficulties in the identification of sufficiently large and numerous homogeneous reference targets, so we focused on field-verified goldenrod patterns, identifying homogeneous and heterogeneous polygons, which makes it possible to distinguish it from other objects of a heterogeneous habitat [9].

2.2. Input Data

The reference material for classification consisted of polygons identified during field reconnaissance of the study area. Efforts were made to ensure that the size of the patterns exceeded the area of 20 × 20 = 400 m2 to fit a 10 m pixel of the Sentinel-2 image; the same patterns were used to classify PlanetScope images, whose pixel size is smaller (3 × 3 m); hence, the number of used pixels for Sentinel-2 and PlanetScope classifications is different (Table 2). The location of polygons was confirmed using Locus Map ver. 4.3.3 software (Asamm Software, Prague, Czech Republic), which allowed the documentation of the patterns with two geotagged photos, e.g., to verify post-classification maps. As background classes, forests, agricultural crops, built-up areas, and surface water were added (Table 2), but these classes had no effect on the presented accuracies.
From all the obtained patterns (Table 2), an equal number of randomly selected and balanced pixels (50–700 for Sentinel-2 data, and 50–1000 pixels for PlanetScope) of all classes was applied; a group of 50 training pixels was selected from the whole set (Table 2) for the first classification, and then verification was carried out on independent pixels (verified in the field, but not used for training). This procedure was repeated 100 times in order to select various patterns, while maintaining comparability of samples (an identical research procedure was carried out for all objects and images, repeating it for sets of 100, 200, ..., 1000 pixels). The results indicated that an optimal training set should consist of 500–700 pixels (increasing this number of training pixels does not increase accuracy, but the classification time increases significantly).
Two sets of data were prepared for these two scenarios, (a) the goldenrod patterns (with significant majority of the species—almost goldenrod homogeneous polygons) and (b) goldenrod patterns (the same as above), but also an additional mix class, which was represented by a mix of goldenrod with a dominance of other objects, e.g., bushes and single trees. Such differentiation was intended to optimize the field verification process.
Goldenrod classification was carried out on the open access satellite Sentinel-2 images representing surface reflectance (level-2A), which were obtained from ESA’s Copernicus Open Access Hub [33]. Commercial satellite PlanetScope data were obtained from Planet Explorer [34] based on the Planet Science Education and Research (E&R) Program. We acquired 3 images from each sensor from almost identical periods (Sentinel-2: 9 September 2021, 29 October 2021, 3 November 2021; PlanetScope: 11 September 2021, 30 October 2021, 3 November 2021) to capture the spectral diversity of goldenrod (early September scenes represent goldenrod covered with intense yellow perianth, while November scenes present faded and dry inflorescences that reflect a large amount of radiation, which allowed the distinction of this species from other plants, already frozen). The images were acquired from the third generation of Super Dove satellites with an installed PSB.SD instrument: 8 spectral bands (6 of which have a spectrum interoperable with Sentinel-2 bands), 16-bit radiometric resolution, and 3 m pixel size. We used the orthorectified OrthoScene product (level 3B), which was geometrically corrected and radiometrically calibrated [34]. We deliberately did not change the pixel size of the PlanetScope images, e.g., trying to resample it to 9 m to keep more comparable with 10 m Sentinel-2 pixels, because the higher spatial resolution allowed a more accurate identification of goldenrod patches (which are very heterogeneous in the initial stages of the invasion). On the other hand, the advantage of higher spatial resolution compensated for the lower spectral resolution, in particular, no SWIR channels and only one NIR band (Table 1). The second important question was whether it makes sense to resample 60 m Sentinel-2 bands (B1, B9) to 10 m, but the effects of using them are positive, because B1 and B9 showed high informativeness [35]. This may be due to the fact that the absorption maxima of the photosynthetic active radiation of the two most important chlorophylls are 430 and 662 nm for chlorophyll a and 453 and 642 nm for chlorophyll b, while the central wavelength for B1 is 442.7 nm (Sentinel-2a) and 442.2 nm (Sentinel-2b), with a bandwidth for both sensors of 21 nm, which covers the key ranges for plants. On the other hand, B9 covers the turgor range of plant cells and tissues, i.e., the state of hydration including the state of tension of the cell wall as a result of the hydrostatic pressure inside the cell.
Spring and early summer scenes offered worse informativeness of images, and early flowering meadows or low crops with soil clearances did not contribute significantly more important spectral ranges than in autumn images, when overblown and dry inflorescences reflected a significant amount of the characteristic spectrum. Zdunek [36] showed that the most informative Sentinel-2 image for Solidago identification in 2021 was the scene acquired at the beginning of November 2021. This may be due to the fact that the dry inflorescences reflect the characteristic species electromagnetic spectrum, allowing the identification of this plant species against other plants, which are in the final stage of vegetative development, and are often already frozen by the first autumn frosts. The images were verified using the QA band for the detection of any potential distortions, and then twelve-band Sentinel-2 data were resampled using the nearest neighbor method for 10 m pixel sizes (using ESA SNAP 9.0 software). Then, the single scenes were stacked into a 36-band data cube of Sentinel-2 and 24-band PlanetScope multitemporal compositions using GDAL [37].

2.3. Classification Procedure

Pixel values were extracted from the satellite input data. An iterative accuracy assessment was then carried out, where the set was randomly split into training and validation in a 50:50 ratio (split polygon-wise to ensure as much objectivity as possible). Random Forest and Support Vector Machine classifiers were trained simultaneously on the same data sets. The procedure was carried out 100 times. On the best data set (which achieved the highest mean F1-score for all classes), a variable importance analysis was also carried out on Random Forest for individual channels and dates to measure the impact of their significance. The pixels to be trained were also randomly selected (50, 100, 150, 200, 300, 500, 700, 1000 pixels) in order to maintain balanced data sets and not to favor any one class during the learning process of the algorithm. In the second scenario, polygons were randomly selected that covered about 700 pixels for training. Algorithm hyperparameter tuning was also carried out for Random Forest, ntree = 500 and mtry = 5, and for the Support Vector Machine radial kernel, cost = 100 and gamma = 0.01.
The following measures were used to assess accuracy: the producer accuracy, user accuracy, and F1-score [38]. In order to assess the impact of individual channels and dates of image acquisition, a variable importance analysis based on the Random Forest classifier measure of mean decrease accuracy (MDA) was used [22,39].

3. Results

The classification results confirmed that goldenrod creates spectrally characteristic patterns, which, regardless of the algorithm used, are correctly identified on both the Sentinel-2 and PlanetScope images; the highest F1-score accuracies of individual iterations oscillated around 0.92–0.95 (Table 3 and Table 4). Nevertheless, spatial differentiations of the share of individual objects (goldenrod, grasses, herbaceous plants, bushes, single trees) generated varied signals for different patches, and this was reflected in the results of individual iterations of different scenarios (Figure 5). The Random Forest classifier produced better results than SVM, and this concerned both the number of classification iterations obtaining F1-score values above 0.90, as well as the median and mean values for all 100 iterations (Table 3 and Table 4, Figure 5), and the increase in the number of training pixels reduced the worst classification results, allowing an increase in the median and mean F1-score values of Sentinel-2 data (Figure 6). SVM in individual iterations obtained high values of the classification, but it was surprising that in the case of the PlanetScope images, the median of 100 iterations reached only the value of a 0.43 F1-score (Figure 7, Table 4).
The median value for patterns consisting of at least 400 training pixels indicated an optimal pixel value range of around 400–700 pixels for the recognition of goldenrod (Table 3 and Table 4, Figure 6 and Figure 7). In the case of the PlanetScope data, there is clearly no improvement in the lowest classification values (Figure 7). Reportedly, low classification values occur regardless of the number of pixels used in the training patterns, and this phenomenon was not observed in the case of the Sentinel-2 data (Table 3); this is due to the small pixel size of the PlanetScope images, which allows the identification of small areas in the initial stages of invasion that do not contain goldenrod (Table 4).
Analyzing the impact of the number of training pixels on the obtained goldenrod classification results (Figure 6), it is clearly visible that regardless of the classifiers (RF or SVM), the maximum classification accuracy of polygons dominated by goldenrod (marked as yellow and orange in Figure 6) reaches similar values, which means that the training and verification field-verified patches are sufficiently homogeneous to identify goldenrod even on the 50 to 700 pixels of the Sentinel-2 data (Table 3), and 50–1000 pixels of PlanetScope (Table 4). Nevertheless, apart from more homogeneous surfaces (identified as goldenrod), there are also heterogeneous patches (marked as “mix” class; covered by other elements of land cover, where goldenrod occupies the area in minority), which are an important indicator of invasion directions. To identify such polygons, the number of training pixels should reach 500–700. In the case of the mix class, the median F1-score exceeds 0.70, with SVM producing significantly better results (by about 10 percentage points) than RF, but increasing the training pixels significantly improves the lowest classification accuracy (Figure 6 and Figure 7). This allowed the identification of the mix class in the best iterations with an accuracy of almost 0.90 for the SVM classifier, while RF achieved the best results at the level of 0.85 (F1-score). For this reason, the results presented below come from the RF classifier and are based on classifications obtained from patterns consisting of 700 training pixels, randomly selected in 100 subsequent iterations.
It is worth noting that the Sentinel-2 images, which contain several NIR and SWIR bands, offer much higher accuracy (around 20 percentage points) than the PlanetScope data (Figure 5). This difference may be due to the fact that PlanetScope has only one NIR band (B8), which turned out to be crucial for both sensors (the most informative in the case of PlanetScope, and in the case of Sentinel-2, the band B9 scored second place; Table 5); additionally, the SWIR band (B12), which is not present in the PlanetScope scanner, and also coastal aerosol, green, red, and red-edge were crucial. Based on the fact that for both Sentinel-2 and PlanetScope, the optimal period for the identification of goldenrod was the period of intense yellow flowering, and the PlanetScope scanner offers the yellow band (B5), the MDA analysis confirmed the usefulness of the B5 in summer during goldenrod flowering, while late autumn images were much less informative (Table 5).
Based on the Sentinel-2 images and the Random Forest classifier, 898.54 km2 of mixed patterns (initial stages of goldenrod infestation, which remain in the minority) has been identified, which is 7.45% of the Sentinel-2 image area, while the area where goldenrod dominates other plants is 90.84 km2 (0.75%; Figure 8, Figure 9 and Figure 10).
This area was quite well verified during field research in 2021 and 2022, confirming, on the one hand, a large and fast expansion of goldenrod, but on the other hand, many preventive activities were observed, e.g., mowing and plowing fields where goldenrod appeared. These areas are mainly located in the eastern part of the research area, in the vicinity of big cities (Częstochowa, Tarnowskie Góry, and the northern part of the Silesian agglomeration), where part of the area is intended for the development of new technical infrastructure, e.g., logistics centers, and commercial, service, and production facilities; this is due to optimal location in relation to motorways. The second reason for this is the presence of many post-industrial and post-mining residues, as well as post-agricultural areas, which are automatically entered through secondary succession.
Approximation to selected areas is confirmed by the common occurrence of goldenrod, and the difference in detection is mainly due to the resolution of the images; on the one hand, the three-meter PlanetScope images are characterized by greater spatial accuracy, but they lack the NIR and SWIR ranges, which turn out to be valuable, and PlanetScope’s yellow band (B5) was relatively important only in the flowering phase (Table 5).
Based on tens of thousands of pixels verified in the field (Table 2), the classification results confirm the high usefulness of the proposed methodology, because the three highest results of 100 individual classification iterations of both RF and SVM for Sentinel-2 and PlanetScope data, regardless of whether these classifications were based on 50–700 (Sentinel-2) or 50–1000 (PlanetScope), obtained F1-scores ranging from 0.90 to 0.95 (Table 3 and Table 4). However, differences were observed for the median results, where for 700 pixels, the highest classification value was obtained for RF and Sentinel-2 (F1-score: 0.87), SVM (Sentinel-2): 0.81, RF (PlanetScope): 0.64, and SVM (PlanetScope): 0.42 (Table 3 and Table 4). The obtained error matrices (Table 6) confirm the distinguishability of individual spectral features of the analyzed objects, including goldenrod and heterogeneous patches created by them during invasion. Slight mixing of classification results is beyond doubt, as goldenrod encroaches on all surrounding surfaces, including the immediate vicinity of houses, yards, and gardens.

4. Discussion

Both Sentinel-2 and PlanetScope images produced very high accuracies of goldenrod classification; in each case, homogeneous patches of goldenrod produced the highest RF and SVM classification results > 0.9 measured using the F1-score, but looking in detail, regarding RF and scenarios involving training patterns consisting of 400 pixels, the achieved results of F1-scores > 0.9 were produced 22 times (out of 100 classification iterations). For patterns consisting of 500 pixels, it was 31 times, 600 was 28 times, and 700 was 35. For the SVM algorithm, it was 10 times for patterns consisting of 400 pixels, 6 times for 500 pixels, 13 for 600, and 13 for 700; regarding the median values for RF and a pattern consisting of 700 pixels, the F1-score was 0.87, and for SVM, it was 0.81. In the case of PlanetScope, the regularities are similar, i.e., RF turns out to be better, because for the classification results based on 400, 500, 600, 700, and 1000 training pixels, the obtained classification results were measured 16, 16, 16, and 20 times, respectively, using an F1-score > 0.9, while for the SVM algorithm, it was 8, 8, 9, 12, and 7 times. What is noteworthy is the maximum F1-score value, which is similar for the Sentinel-2 results, while the medians are significantly lower, because for RF and classification based on 700 pixels, it was 0.64 (F1-score), and for SVM, it was 0.42. Therefore, an analysis of the influence of the number of pixels on the classification result allowed the definition of the required number of patterns, which are obligatory for field verifications.
Attention should be drawn to reasons for the situation that PlanetScope is characterized by nine times higher spatial accuracy than Sentinel-2 images (it is worth remembering that some of the bands have been resampled from the original resolution of 20 m and 60 m to 10 m), and yet the median PlanetScope classification accuracy is lower; therefore, the mean decrease in accuracy (MDA) confirmed that the most informative spectral range was NIR (for PlanetScope, it is in first place (the most informative band), for Sentinel-2, it is in second place); however, comparing the different periods of image acquisition (reflecting different vegetative stages of goldenrod), the most useful Sentinel-2 bands were the green, red-edge, and NIR (B9) bands, at the same time for which the corresponding PlanetScope bands did not show significant input. Dao et al. [40], analyzing invasive grassland species, confirmed that statistically important spectral ranges were especially the blue (below 500 nm), red-edge (680–730 nm), and near-infrared (NIR, beyond 730 nm). This was not confirmed by Mouta et al. [41], who identified the invasive species Acacia longifolia using Sentinel-2 images, and ecological models demonstrated the usefulness of the blue (458–523 nm) and green (543–578 nm) channel, in which the yellow flowers of Acacia as well as other yellow plants can be better distinguished due to the high presence of carotenoids and other pigments. This observation was not confirmed in our research, because the yellow range of the PlanetScope (B5) obtained an MDA value of 11.39 during flowering, which was below the average (17.51; Table 5); in the remaining periods, the usefulness of the yellow band was even lower, taking the last, eighth place in the ranking of all spectral channels offered with the PlanetScope detector. Gholizadeh et al. [42] used the partial least squares linear discriminant analysis (PLSLDA) [43] model to distinguish Lespedeza cuneata (‘sericea’) from native species based on airborne imaging spectroscopy and vegetation functional traits with an overall accuracy of about 94%. Their results proved that the specific phenology and structure of invasive plants are important factors for their identification; for sericea, this was the distribution of photosynthetic and photoprotective pigments such as chlorophyll a + b and carotenoids, and for this reason, they indicated that bands from the PAR region are the most important. In addition, they highlighted the usefulness of red-edge, NIR, and SWIR to distinguish other invasive species, which also confirms our assumptions. Similar observations on eight species of natural high-mountain grasslands of the Tatra Mountains were made by Kycko et al. [44], which, based on biophysical variables and spectral features obtained with the ASD FieldSpec 4 spectrometer, showed statistically significant differences for different ranges of the electromagnetic spectrum for individual plant species exposed to trampling and the same species located away from tourist trails. This was also confirmed for High-Arctic plant species [45].
An interesting element was the comparison of the Random Forest and Support Vector Machine classifiers. RF is recommended due to the speed of the classification process, a simpler procedure for optimizing the classification process, and better classification results in the case of fewer training samples. On the other hand, SVM offered higher classification results, but the classification procedure was longer and required more training pixels. As other research has shown [46], the use of neural network algorithms (including deep learning) offered comparable results, but on a smaller amount of input data; however, in the identification of species, it was more important to use multitemporal data to obtain the spectra in different periods of phenological development, which allows a more accurate identification of the studied species than even more advanced algorithms based on less spectral data.
In a small part of our research area, Sabat-Tomala et el. [8], using airborne HySpex hyperspectral images (430 spectral bands with a resolution of one meter), which were acquired in three periods of the 2016 growing season, the beginning of flowering (June), the optimum of flowering (end of August), and the beginning of autumn (end of September), based on SVM and RF classifiers, identified goldenrod and three expansive plant species with slightly better accuracies (five percentage points higher). In our case, the best iterations of the multitemporal Sentinel-2 offered F1-scores of 0.92–0.95, while the median F1-score was 0.88, and in the three-meter PlanetScope images (3 × 8 spectral bands), the best results achieved similar values (0.92), while the median was about 20 percentage points lower, thus indicating less stability in the performance of classification algorithms for PlanetScope than for Sentinel-2, as also shown by Jensen et al. [29]. Smerdu et al. [47] used a single aerial orthophoto (RGB + NIR bands), Sentinel-2 multitemporal compositions, and an SVM classifier in their attempt to identify the invasive Japanese knotweed in Ljubljana’s heterogeneous urban landscape; the results for multitemporal composite scenes were seven percentage points higher than for single scenes (90% for Sentinel-2; 83% for aerial images). So, multitemporal satellite data offered similar results to single-scene airborne hyperspectral images, and were a few percentage points higher than few-spectral-band airborne orthophotomaps using the same classifiers (RF, SVM) [48,49]; this was also confirmed by Kluczek et al. [35]. Similar results of leafy spurge (Euphorbia virgata), which is also an invasive yellow flowering plant in the US, were achieved, with an overall accuracy of 96.3% (based on CNN + Long Short-Term Memory), while for the variant considering only CNN, the accuracy of PlanetScope data classification was 89.9%, and for WorldView-2, it was 96.1% [30]. These results are identical to our all-goldenrod outcomes from the multitemporal Sentinel-2 and PlanetScope data based on the Random Forest classifier as well as SVM (but only for sets of 700 training pixels; Figure 6 and Figure 7), and higher than those achieved for another goldenrod species, Solidago altissima, on the high-resolution WorldView-2 images (overall accuracy of 72%) [9]. This result may suggest that the number of spectral bands is important, as WorldView-2 also has eight spectral bands, the same as PlanetScope, and thus achieves lower results than Sentinel-2, which also offers SWIR bands such as B11 (1610 nm) and B12 (2190 nm). Wang et al. [50] concentrated on the classification of invasive Pedicularis spp., using multitemporal Sentinel-2 data, reporting F1-scores ranging from 0.92 to 0.97, while PlanetScope achieved F1-scores in the range of 0.71 to 0.82, which is a similar observation to our ones, in that PlanetScope offers several percentage points lower than Sentinel-2. The researchers also stressed that the number of features is more important than the spatial resolution. Further attempts to compare Sentinel-2 data with PlanetScope were made by Marzialetti et al. [51], who calibrated Random Forest models for both satellite platforms, showcasing high predictive performances with R2 > 0.6 and RMSE < 0.008. Although Sentinel-2 exhibited slightly superior performance, the PlanetScope-based model effectively delineated invaded areas.
In the case of the extensive comparisons of Sentinel-2 and PlanetScope data, Kluczek et al. [35] investigated the effectiveness of both satellite images (additionally airborne HySpex hyperspectral images) for the classification of montane woody species; the multitemporal Sentinel-2 data cube, comprising 21 scenes, delivered comparable results with HySpex (F1-scores of 0.93 for RF and 0.89 for SVM); in contrast, the three high-resolution PlanetScope images yielded less precise results, with F1-scores of 0.89 for RF and 0.87 for SVM. Very important in this case was the use of multitemporal data, which allowed the identification of plant species’ spectral properties along the vegetation period. The observation was confirmed by Zagajewski et al. [39], who, using multitemporal Sentinel-2 data for woody species, achieved the best overall accuracies for SVM (86%; median), RF (84%), and ANN (84%), and for Landsat data, the best results were obtained for the RF classifier (84%), and the worst were for ANN (76%).
Also, the date of acquisition of the imagery is important as shown by Rakotoarivony et al. [52], who focused on Lespedeza cuneata and identified the optimal period for detection to be the mid-to-late growing season, achieving an overall classification accuracy of 81% (mid-August) and 82% (end of September) using PlanetScope data. The observation was also confirmed by Han et al. [53] and Sabat-Tomala et al. [8] in the case of goldenrod, bushgrasses, and blackberries.
Nevertheless, the key element is to provide appropriate training patterns in the heterogeneity of the patches they form in the studied ecosystems, which, taking into account the phase of vegetation development, allow the determination of the spectral characteristics of the tested plants, which allows the learned algorithm to assign individual pixels of the image to the required class. Sabat-Tomala et al. [8] and Rizaludin Mahmud et al. [9] have highlighted a need for field identification, but the achieved results allowed the identification of goldenrod with high accuracy, and high-resolution aerial data allow for constant monitoring of the directions of goldenrod invasion. In the case of Sentinel-2 data, due to the 10 m pixel, a good solution is to use the mix class, which allows mapping of surfaces with goldenrod in the initial stages.

5. Conclusions

Our research confirmed that the remote sensing identification of goldenrod is possible using both Sentinel-2 and PlanetScope data. Sentinel-2 images offer lower spatial resolution, but higher spectral resolution, including in the NIR and SWIR range, which produced better research results. Although goldenrod forms compact surfaces covered with yellow perianth, and the PlanetScope sensor offers a yellow spectral range, this does not play a key role in the recognition of goldenrod, although the optimal period for identifying this plant is its flowering period. We have identified the following observations:
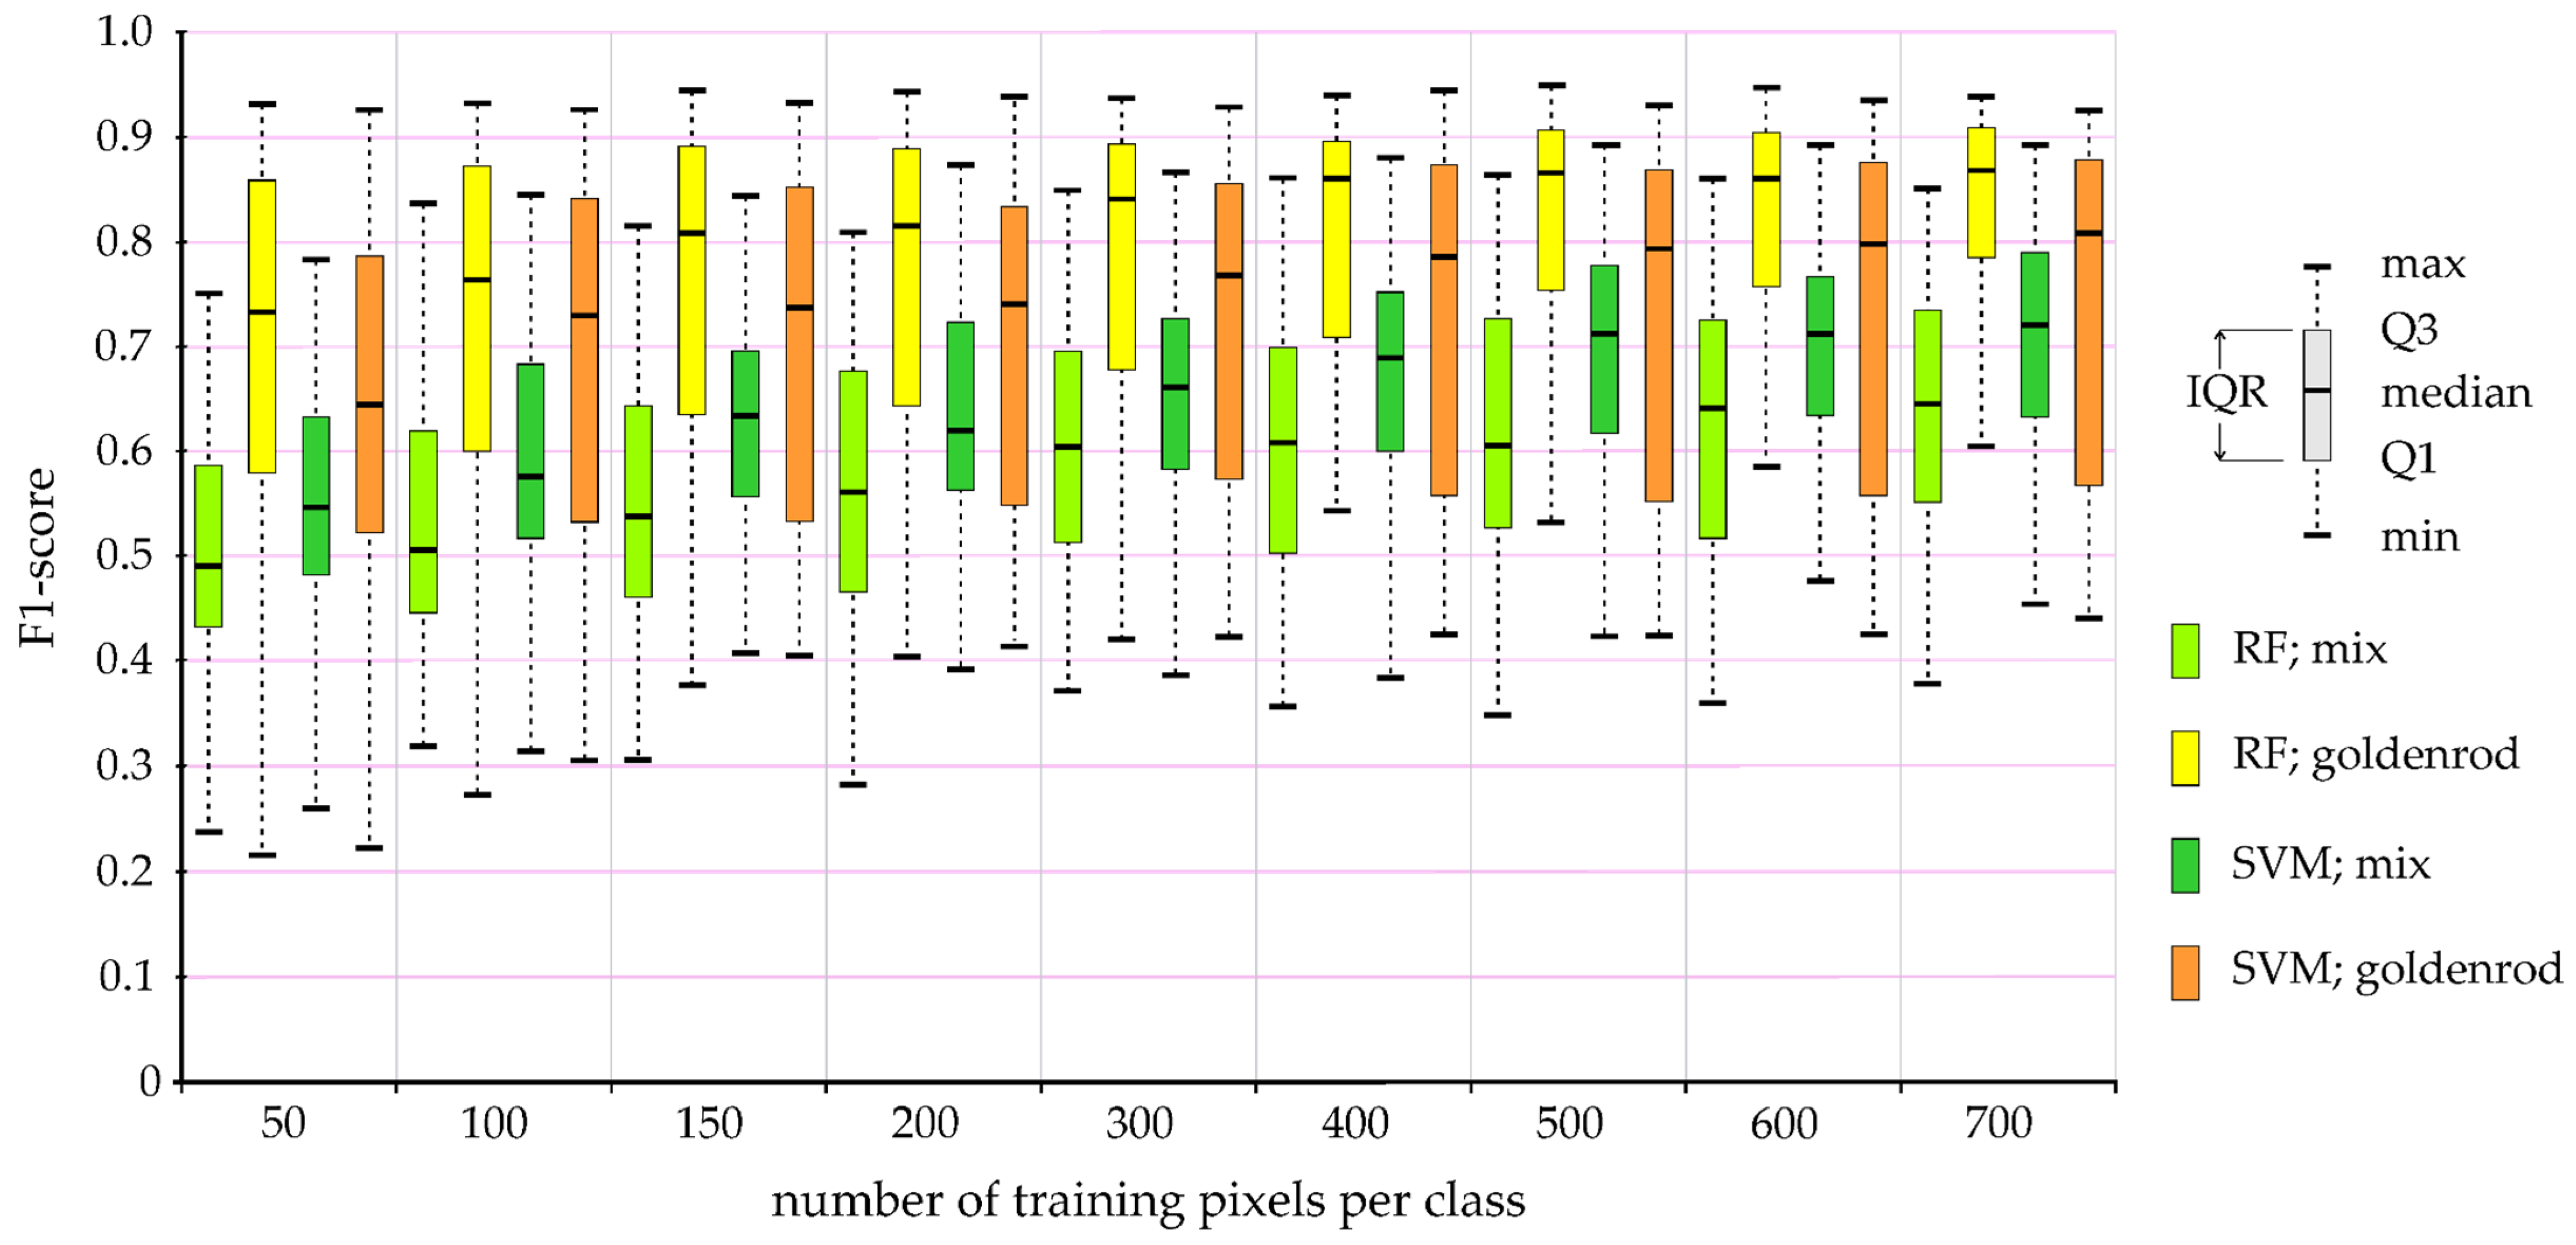
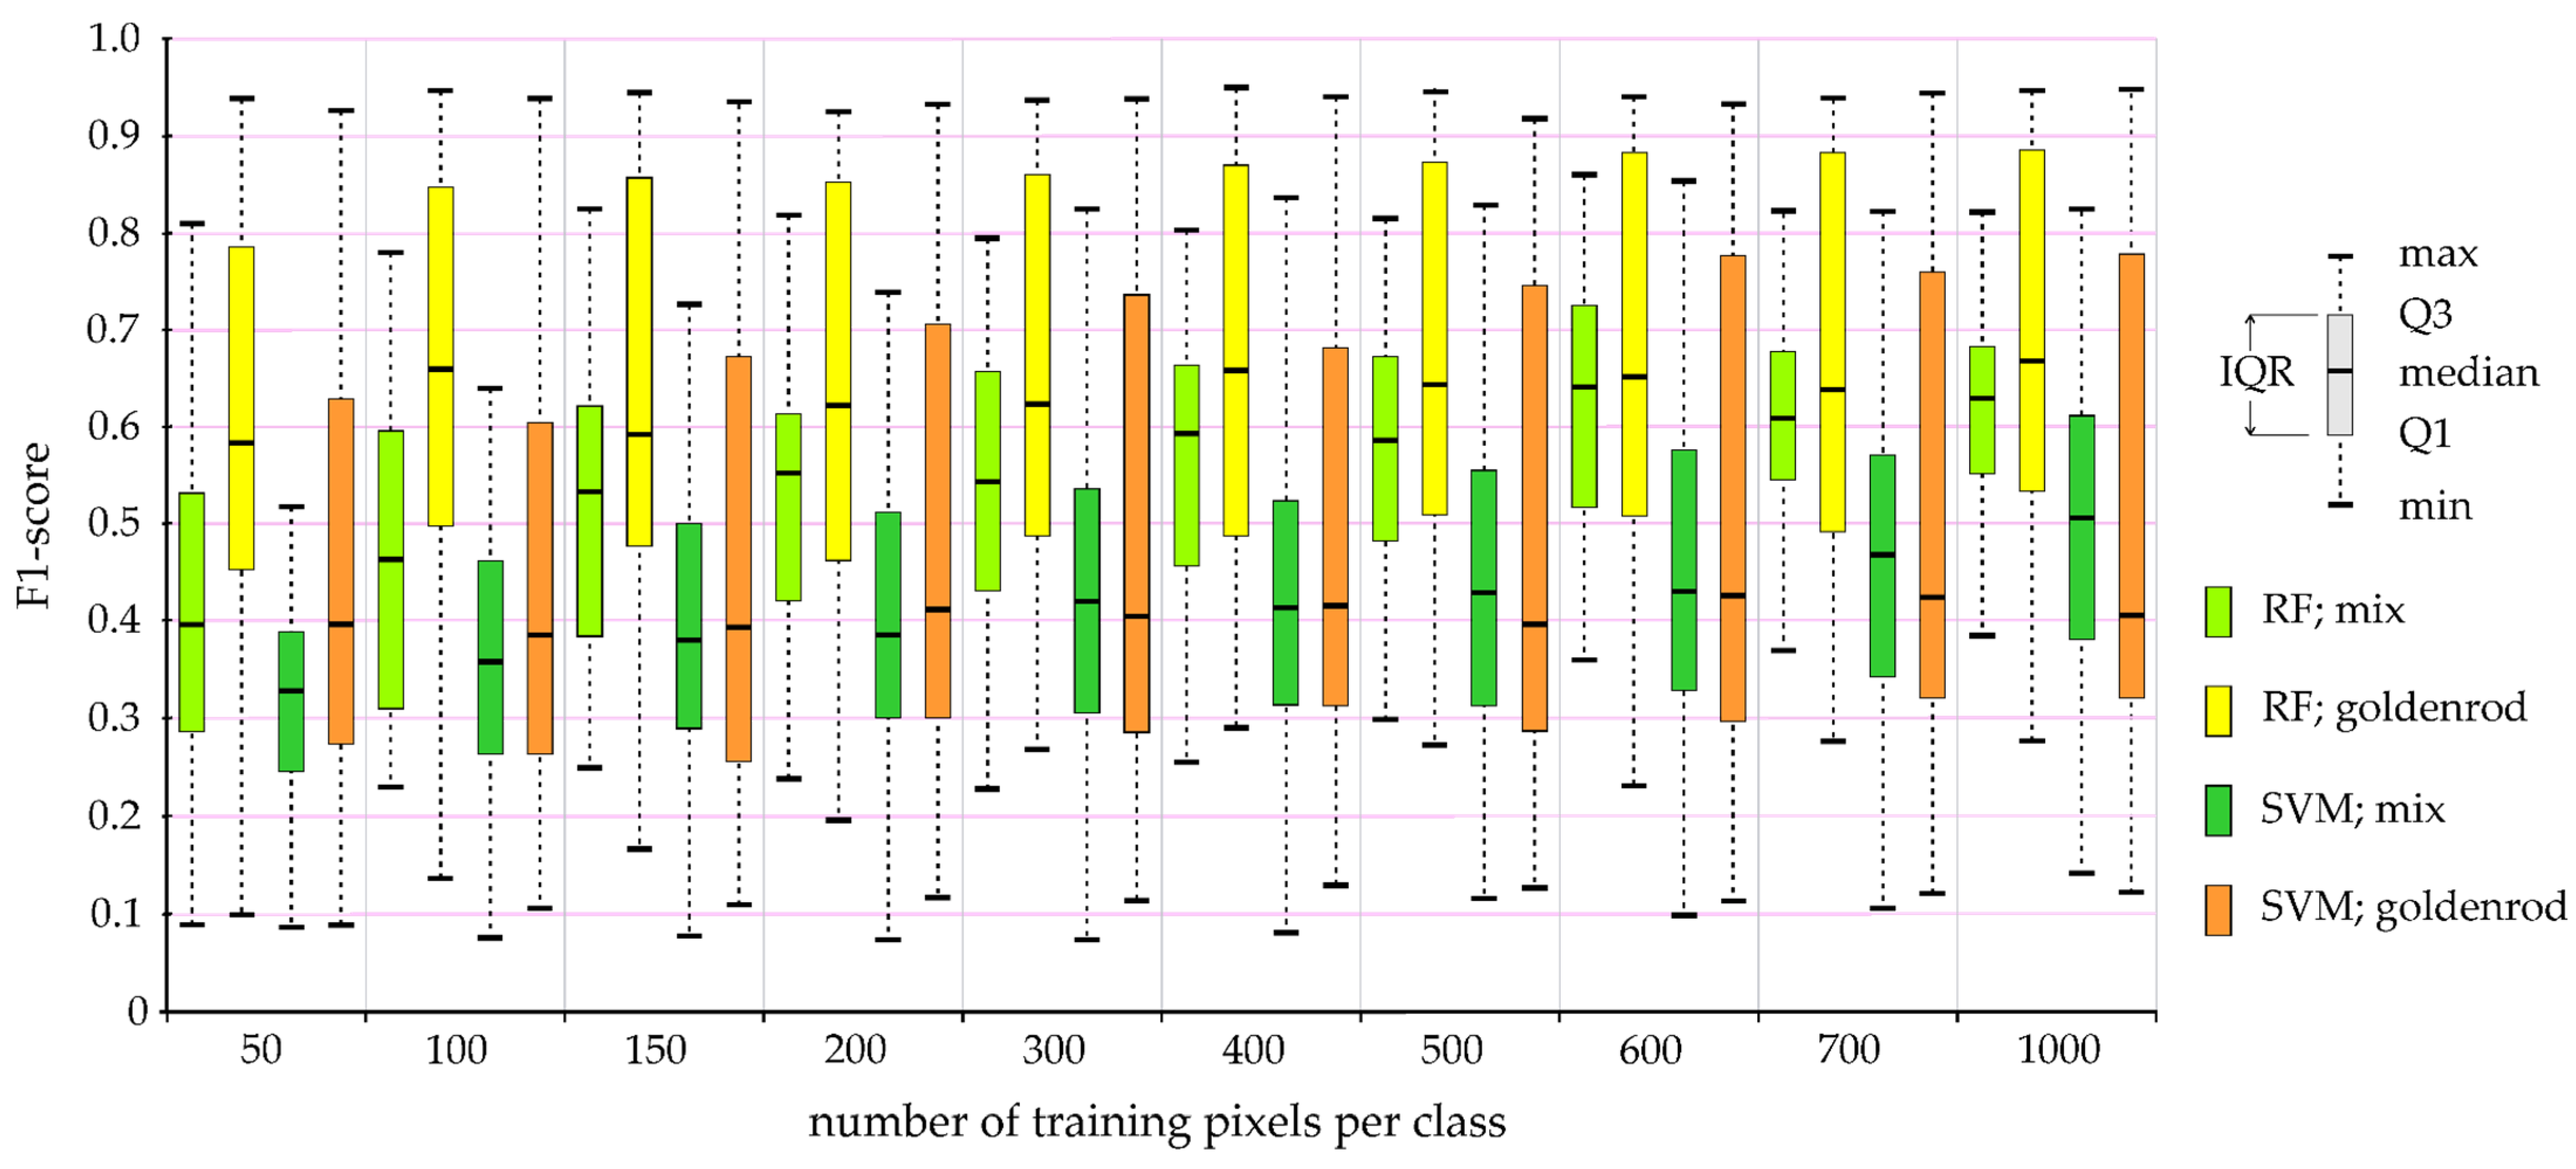
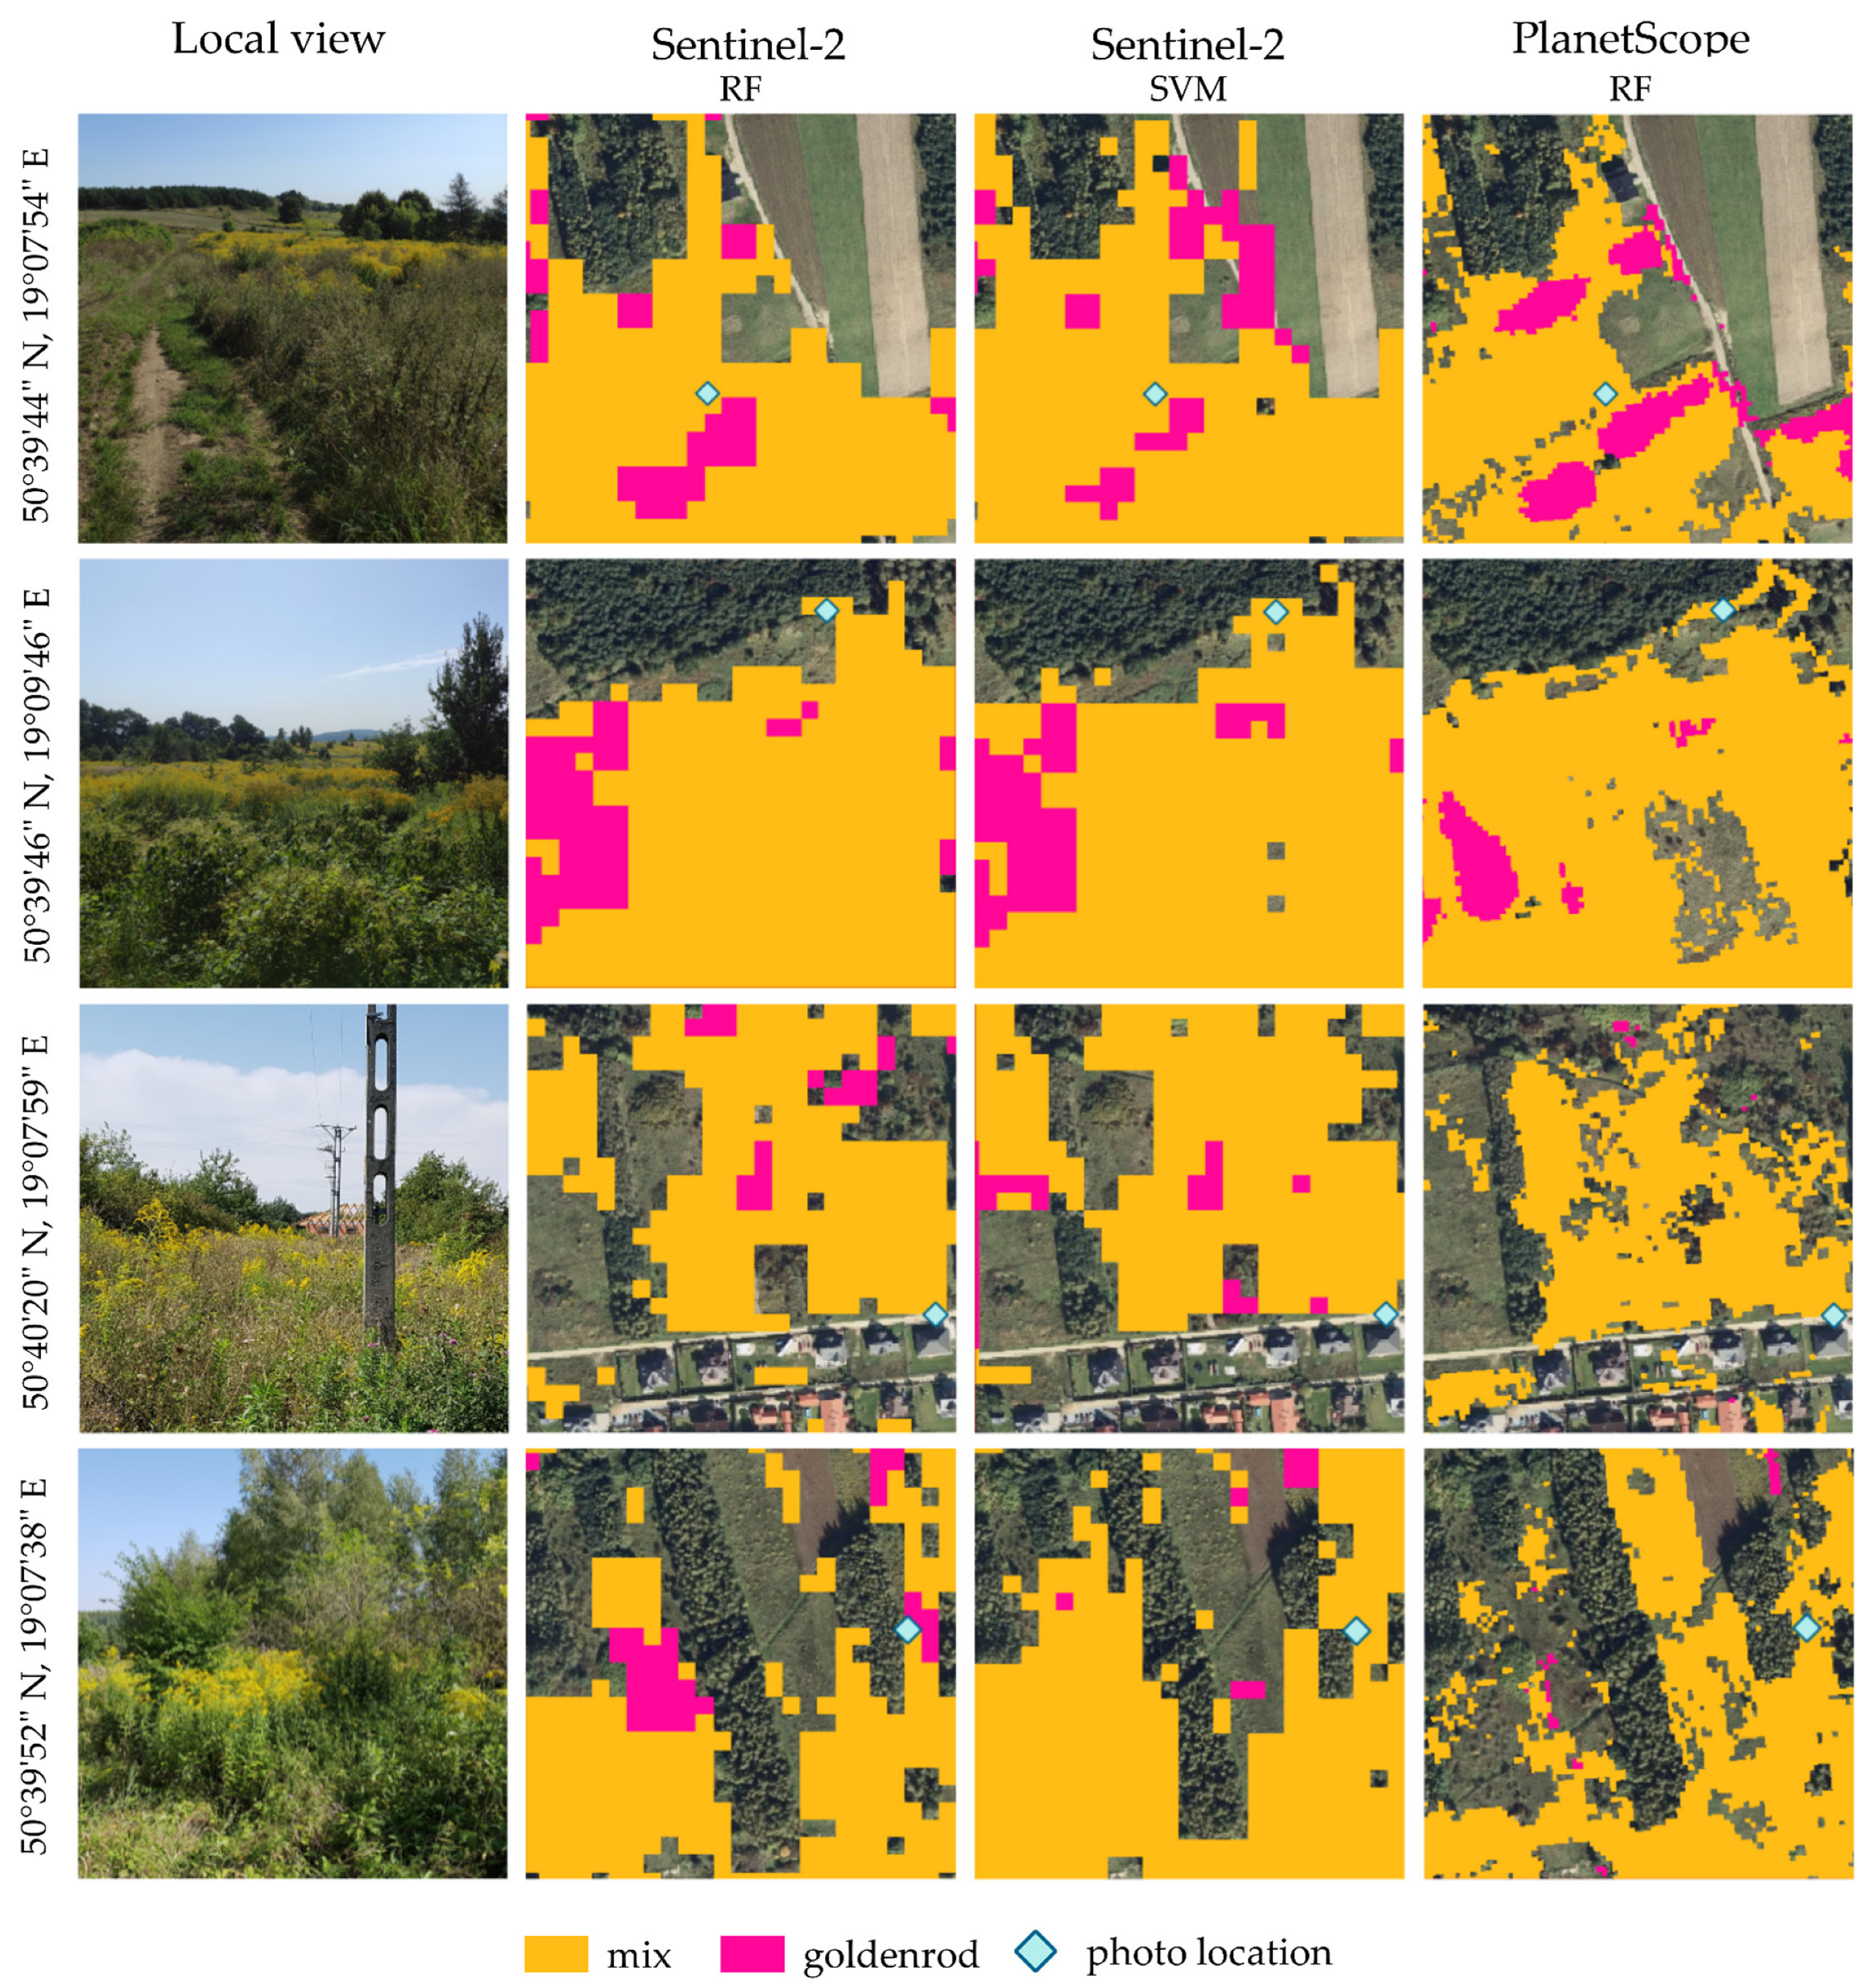
  • the recommended classification method of goldenrod is the use of two classes: (a) homogeneous goldenrod (canopy almost homogeneously covered by goldenrod) and (b) a mix class (confirms the presence of goldenrod, but other plants dominate). The classification results may be lower by a few percentage points, but reflect more accurately cores of the invasion and also indicate the beginnings and directions of the invasion (around the homogeneous patches of goldenrod are visible mixes).
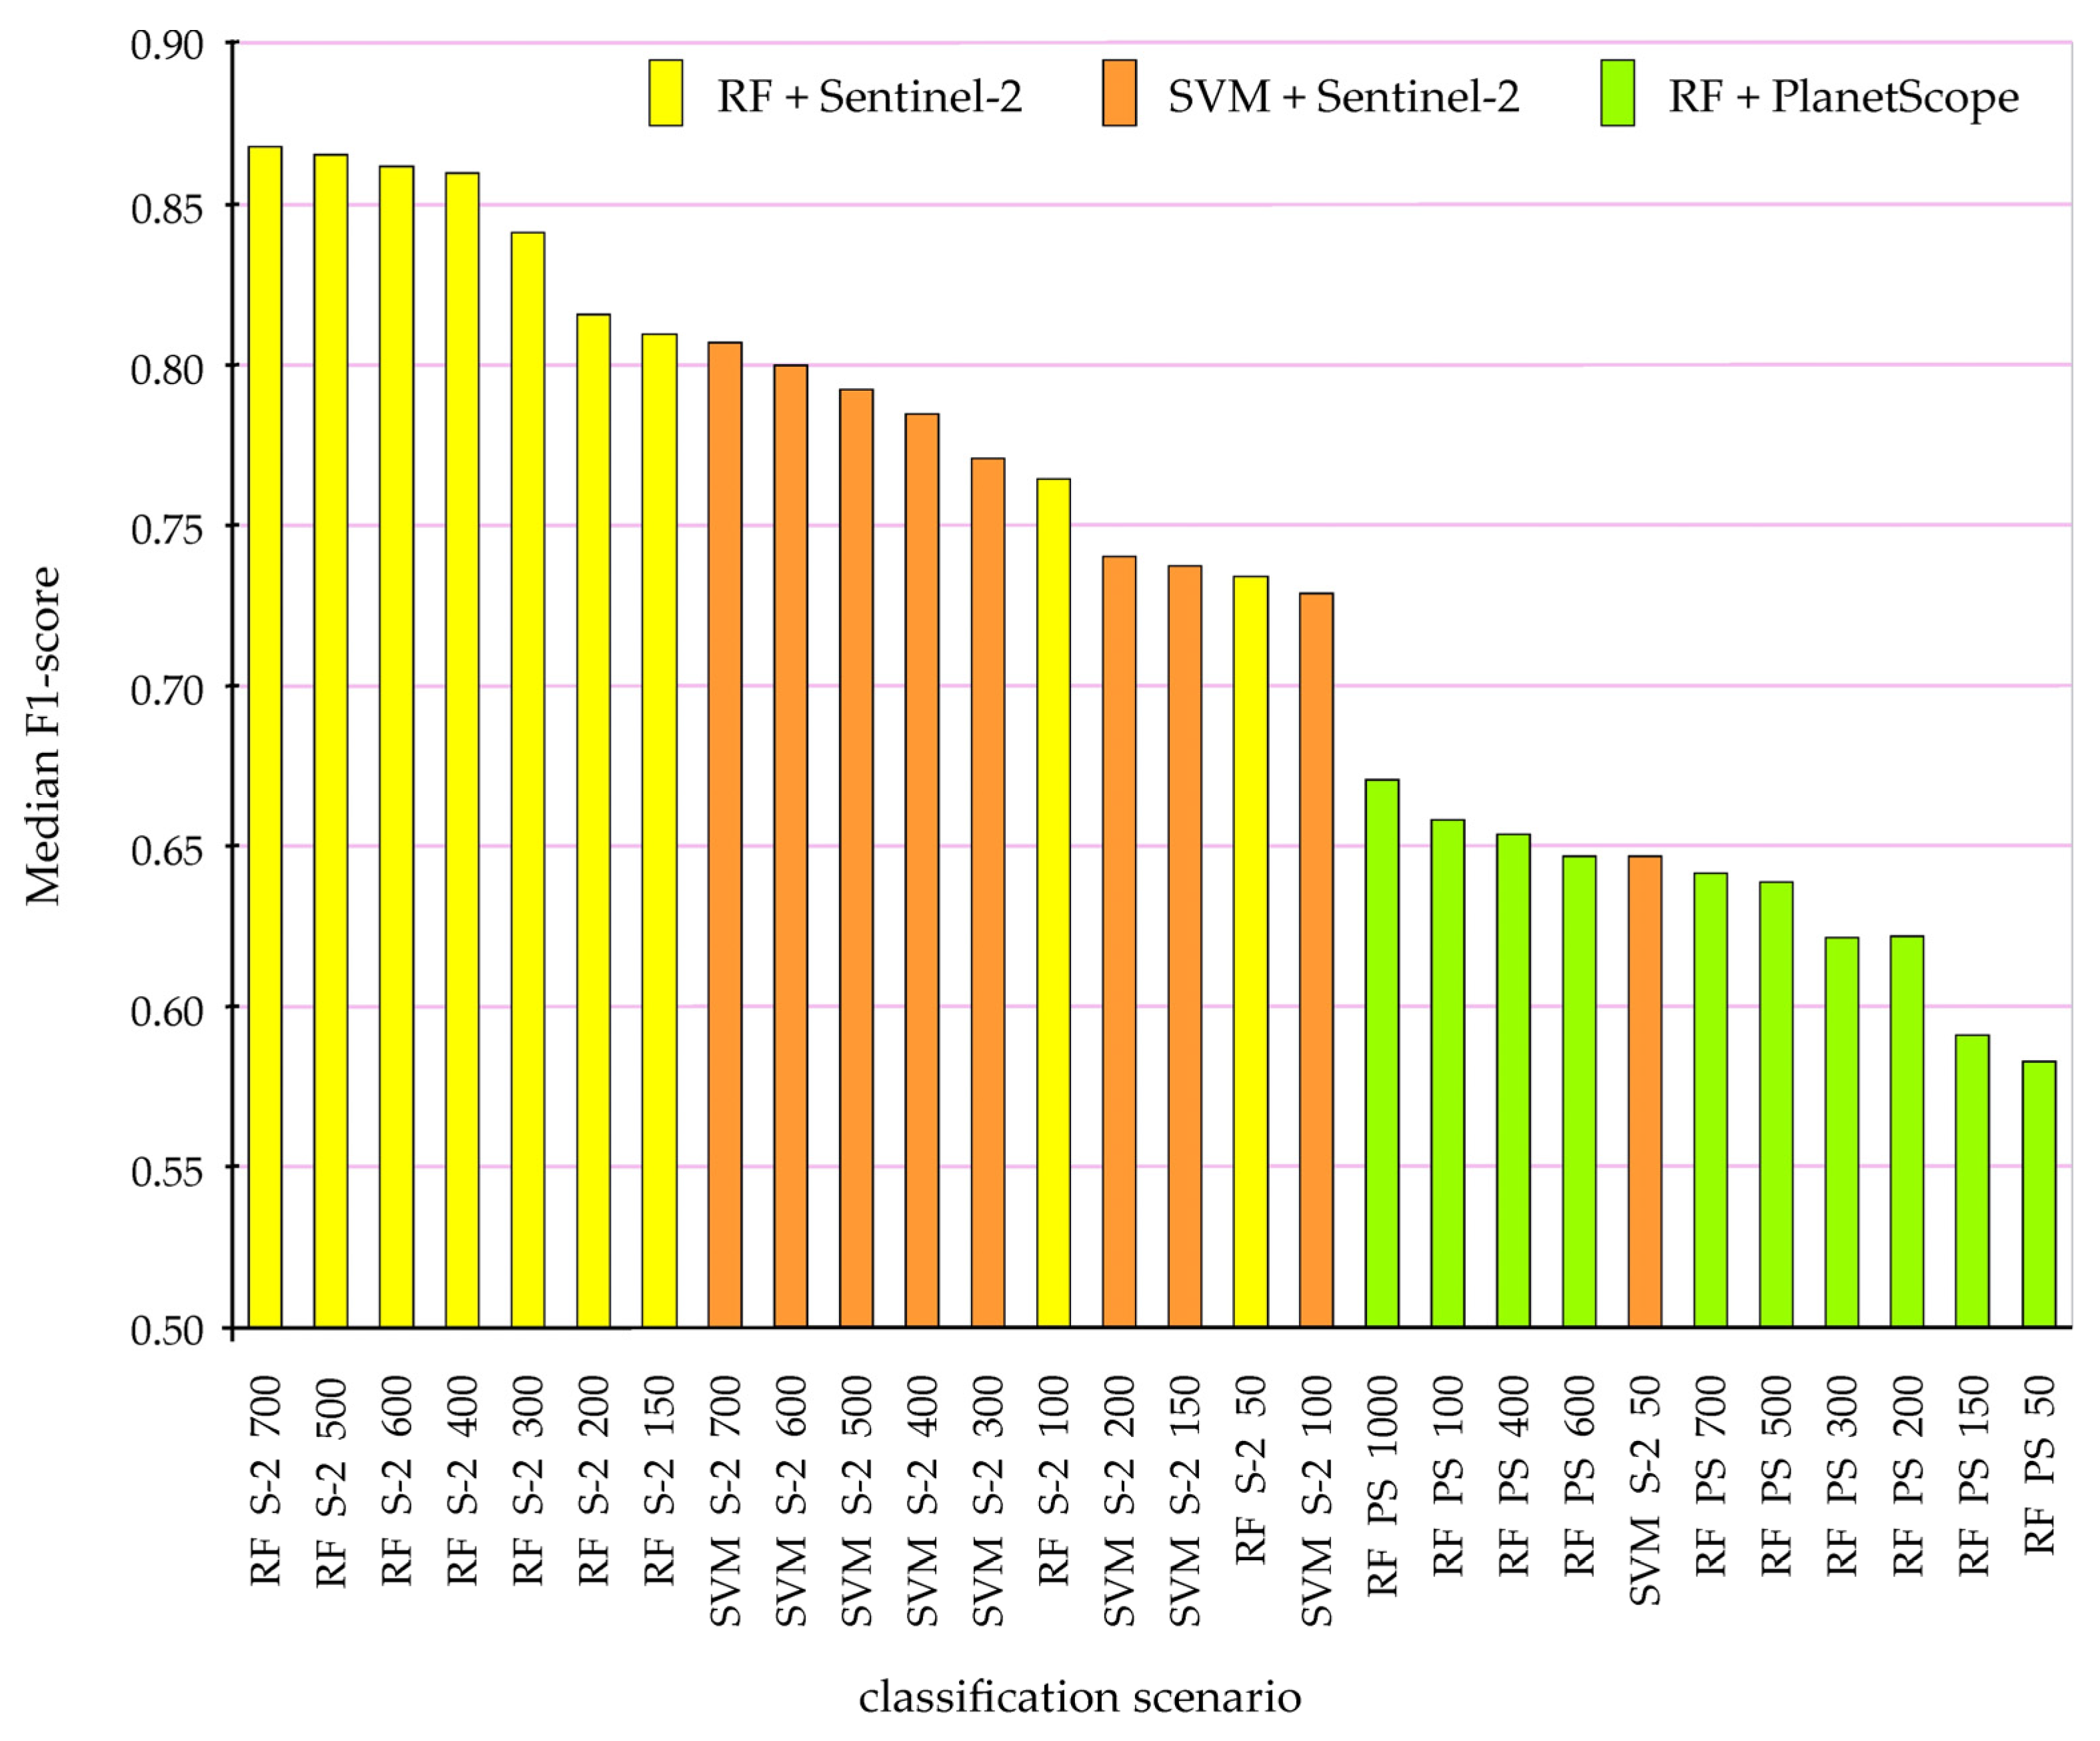
  • multitemporal images of Sentinel-2 offer more information than high-resolution PlanetScope images. In the case of compact and dense patches covered with goldenrod, the differences in accuracy (median of the F1-score) are comparable, but in the case of new invasions with a heterogeneous canopy, the classification scores differ by up to 50% in favor of the Sentinel-2 images.
  • the RF algorithm offers better identification results of pure goldenrod patches than SVM for both Sentinel-2 and PlanetScope images, but SVM offers higher median results of heterogeneous patches of goldenrod and native plants in early stages of the invasion.
  • the RF algorithm obtains the best identification of goldenrod from the Sentinel-2 images with F1-score results exceeding 0.9 in any scenario involving any number of homogeneous goldenrod training pixels.
  • the best period to identify the goldenrod is the time of flowering, and the highest MDA values were obtained using the September Sentinel-2 and PlanetScope scenes, but the autumn images are not much worse. This may be due to large dry, faded inflorescence panicles, which reflect a large amount of the spectrum characteristic of this species.

Author Contributions

Conceptualization and methodology were elaborated by all authors; software was developed by M.K.; validation and formal analyses: M.K. and K.B.Z.; field investigation: B.Z. and K.B.Z.; final language proof: D.H.; manuscript preparation: all authors; supervision, project administration, and funding acquisition: B.Z. All authors have read and agreed to the published version of the manuscript.

Funding

This research was conducted in the frame of the European Union’s Horizon 2020 research and innovation program under the Marie Skłodowska-Curie grant agreement No. 734687 (H2020-MSCA-RISE-2016: innovation in geospatial and 3D data—VOLTA) and the Polish Ministry of Science and Higher Education (Ministerstwo Nauki i Szkolnictwa Wyższego) in the frame of H2020 co-financed projects 3934/H2020/2018/2 and 379067/PnH/2017 in the period 2017–2022. An article processing charge (APC) was covered by the University of Warsaw by the Excellence Initiative–Research University (IDUB UW) program: grant No. BOB-661-159/2024.

Data Availability Statement

Satellite data are publicly available online: Sentinel-2 images were acquired from the Copernicus Open Access Hub (https://scihub.copernicus.eu/ (accessed on 26 April 2023)). PlanetScope satellite imagery was acquired from Planet Explorer (https://www.planet.com/explorer/ (accessed on 26 April 2023)). Reference polygons were acquired during field mapping by Bogdan Zagajewski and Karolina B. Zdunek, who conducted field verification on 3–4 September 2021, and the digital version was prepared by Karolina Barbara Zdunek.

Acknowledgments

The authors are grateful to Planet Labs PBC for providing PlanetScope satellite data through the Planet Science Education and Research (E&R) Program.

Conflicts of Interest

The authors declare no conflicts of interest.

References

  1. Weber, E. The dynamics of plant invasions: A case study of three exotic goldenrod species (Solidago L.) in Europe. J. Biogeogr. 1998, 25, 147–154. [Google Scholar] [CrossRef]
  2. Abhilasha, D.; Quintana, N.; Vivanco, J.; Joshi, J. Do allelopathic compounds in invasive Solidago canadensis s.l. restrain the native European flora? J. Ecol. 2008, 96, 993–1001. [Google Scholar] [CrossRef]
  3. Benelli, G.; Pavela, R.; Cianfaglione, K.; Nagy, D.U.; Canale, A.; Maggi, F. Evaluation of two invasive plant invaders in Europe (Solidago canadensis and Solidago gigantea) as possible sources of botanical insecticides. J. Pest Sci. 2019, 92, 805–821. [Google Scholar] [CrossRef]
  4. General Directorate for Environmental Protection (GDOŚ). List of Alien Plant Species Analyzed in the Project. Available online: http://projekty.gdos.gov.pl/igo-lista-inwazyjnych-gatunkow-obcych-roslin (accessed on 14 June 2023). (In Polish)
  5. Maxwell, S.L.; Fuller, R.A.; Brooks, T.M.; Watson, J.E.M. Biodiversity: The ravages of guns, nets and bulldozers. Nature 2016, 536, 143–145. [Google Scholar] [CrossRef]
  6. Niphadkar, M.; Nagendra, H. Remote sensing of invasive plants: Incorporating functional traits into the picture. Int. J. Remote Sens. 2016, 37, 3074–3085. [Google Scholar] [CrossRef]
  7. Kattenborn, T.; Leitloff, J.; Schiefer, F.; Hinz, S. Review on Convolutional Neural Networks (CNN) in vegetation remote sensing. ISPRS J. Photogramm. Remote Sens. 2021, 173, 24–49. [Google Scholar] [CrossRef]
  8. Sabat-Tomala, A.; Raczko, E.; Zagajewski, B. Mapping Invasive Plant Species with Hyperspectral Data Based on Iterative Accuracy Assessment Techniques. Remote Sens. 2022, 14, 64. [Google Scholar] [CrossRef]
  9. Rizaludin Mahmud, M.; Numata, S.; Hosaka, T. Mapping an invasive goldenrod of Solidago altissima in urban landscape of Japan using multi-scale remote sensing and knowledge-based classification. Ecol. Indic. 2020, 111, 105975. [Google Scholar] [CrossRef]
  10. Akandil, C.; Meier, P.; Otaru, O.; Joshi, J. Mapping invasive giant goldenrod (Solidago gigantea) with multispectral images acquired by unmanned aerial vehicle. J. Digit. Landsc. Archit. 2021, 6, 245–256. [Google Scholar] [CrossRef]
  11. Ishii, J.; Washitani, I. Early detection of the invasive alien plant Solidago altissima in moist tall grassland using hyperspectral imagery. Int. J. Remote Sens. 2013, 34, 5926–5936. [Google Scholar] [CrossRef]
  12. Sentinel-2. Satellite Description. Available online: https://sentinels.copernicus.eu/web/sentinel/missions/sentinel-2/satellite-description (accessed on 23 January 2024).
  13. Copernicus Browser. Available online: https://dataspace.copernicus.eu/browser/ (accessed on 23 January 2024).
  14. Tarca, G.; Hoelzle, M.; Guglielmin, M. Using PlanetScope images to investigate the evolution of small glaciers in the Alps. Remote Sens. Appl. Soc. Environ. 2023, 32, 101013. [Google Scholar] [CrossRef]
  15. PlanetScope Instruments. Available online: https://earth.esa.int/eogateway/missions/planetscope#instruments-section (accessed on 23 January 2024).
  16. PlanetScope Product Specifications. Available online: https://assets.planet.com/docs/Planet_PSScene_Imagery_Product_Spec_letter_screen.pdf (accessed on 23 January 2024).
  17. Planet’s Education and Research Program. Available online: https://www.planet.com/markets/education-and-research/?utm_source=google&utm_medium=paid-search&gad_source=1&gclid=Cj0KCQiAsburBhCIARIsAExmsu4y4PtuIaA4hnmoAYdHLH53PYGCK18cRMmJMELRPpCd0oMlHD4pkzEaAvCwEALw_wcB (accessed on 23 January 2024).
  18. Rajah, P.; Odindi, J.; Mutanga, O.; Kiala, Z. The utility of Sentinel-2 Vegetation Indices (VIs) and Sentinel-1 Synthetic Aperture Radar (SAR) for invasive alien species detection and mapping. Nat. Conserv. 2019, 35, 41–61. [Google Scholar] [CrossRef]
  19. Nkhwanana, N.; Adam, E.; Ramoelo, A. Assessing the utility of Sentinel-2 MSI in mapping an encroaching Serephium plumosum in South African rangeland. Appl. Geomat. 2022, 14, 435–449. [Google Scholar] [CrossRef]
  20. Bakacsy, L.; Tobak, Z.; van Leeuwen, B.; Szilassi, P.; Biró, C.; Szatmári, J. Drone-Based Identification and Monitoring of Two Invasive Alien Plant Species in Open Sand Grasslands by Six RGB Vegetation Indices. Drones 2023, 7, 207. [Google Scholar] [CrossRef]
  21. Royimani, L.; Mutanga, O.; Odindi, J.; Dube, T.; Matongera, T.N. Advancements in satellite remote sensing for mapping and monitoring of alien invasive plant species (AIPs). Phys. Chem. Earth 2019, 112, 237–245. [Google Scholar] [CrossRef]
  22. Ahmed, N.; Atzberger, C.; Zewdie, W. Species Distribution Modelling performance and its implication for Sentinel-2-based prediction of invasive Prosopis juliflora in lower Awash River basin, Ethiopia. Ecol. Process. 2021, 10, 18. [Google Scholar] [CrossRef]
  23. Liu, P.; Choo, K.-K.R.; Wang, L.; Huang, F. SVM or deep learning? A comparative study on remote sensing image classification. Soft Comput. 2017, 21, 7053–7065. [Google Scholar] [CrossRef]
  24. Bergamo, T.F.; de Lima, R.S.; Kull, T.; Ward, R.D.; Sepp, K.; Villoslada, M. From UAV to PlanetScope: Upscaling fractional cover of an invasive species Rosa rugosa. J. Environ. Manag. 2023, 336, 117693. [Google Scholar] [CrossRef] [PubMed]
  25. Haq, M.A.; Azam, M.F.; Vincent, C. Efficiency of artificial neural networks for glacier ice-thickness estimation: A case study in western Himalaya, India. J. Glaciol. 2021, 67, 671–684. [Google Scholar] [CrossRef]
  26. Waśniewski, A.; Hościło, A.; Zagajewski, B.; Moukétou-Tarazewicz, D. Assessment of Sentinel-2 Satellite Images and Random Forest Classifier for Rainforest Mapping in Gabon. Forests 2020, 11, 941. [Google Scholar] [CrossRef]
  27. Bhuiyan, M.A.E.; Witharana, C.; Liljedahl, A.K.; Jones, B.M.; Daanen, R.; Epstein, H.E.; Kent, K.; Griffin, C.G.; Agnew, A. Understanding the Effects of Optimal Combination of Spectral Bands on Deep Learning Model Predictions: A Case Study Based on Permafrost Tundra Landform Mapping Using High Resolution Multispectral Satellite Imagery. J. Imaging 2020, 6, 97. [Google Scholar] [CrossRef] [PubMed]
  28. Papp, L.; van Leeuwen, B.; Szilassi, P.; Tobak, Z.; Szatmári, J.; Árvai, M.; Mészáros, J.; Pásztor, L. Monitoring Invasive Plant Species Using Hyperspectral Remote Sensing Data. Land 2021, 10, 29. [Google Scholar] [CrossRef]
  29. Jensen, T.; Seerup Hass, F.; Seam Akbar, M.; Holm Petersen, P.; Jokar Arsanjani, J. Employing Machine Learning for Detection of Invasive Species using Sentinel-2 and AVIRIS Data: The Case of Kudzu in the United States. Sustainability 2020, 12, 3544. [Google Scholar] [CrossRef]
  30. Lake, T.A.; Briscoe Runquist, R.D.; Moeller, D.A. Deep learning detects invasive plant species across complex landscapes using Worldview-2 and Planetscope satellite imagery. Remote Sens. Ecol. Conserv. 2022, 8, 875–889. [Google Scholar] [CrossRef]
  31. Weisberg, P.J.; Dilts, T.E.; Greenberg, J.A.; Johnson, K.N.; Pai, H.; Sladek, C.; Kratt, C.; Tyler, S.W.; Ready, A. Phenology-based classification of invasive annual grasses to the species level. Remote Sens. Environ. 2021, 263, 112568. [Google Scholar] [CrossRef]
  32. Nagy, D.U.; Rauschert, E.S.J.; Henn, T.; Cianfaglione, K.; Stranczinger, S.; Pal, R.W. The more we do, the less we gain? Balancing effort and efficacy in managing the Solidago gigantea invasion. Weed Res. 2020, 60, 232–240. [Google Scholar] [CrossRef]
  33. COAH, ESA’s Copernicus Open Access Hub. 2022. Available online: https://scihub.copernicus.eu/ (accessed on 1 December 2022).
  34. PE, PlanetScope Explorer. 2022. Available online: https://www.planet.com/explorer/ (accessed on 18 December 2022).
  35. Kluczek, M.; Zagajewski, B.; Zwijacz-Kozica, T. Mountain Tree Species Mapping Using Sentinel-2, PlanetScope, and Airborne HySpex Hyperspectral Imagery. Remote Sens. 2023, 15, 844. [Google Scholar] [CrossRef]
  36. Zdunek, K.B. Assessment of Sentinel-2 Satellite Images for the Identification of Goldenrod Species (Solidago spp.). Bachelor’s Thesis, Geography within Inter-faculty Individual Studies in Mathematics and Natural Sciences. University of Warsaw, Warsaw, Poland, 30 June 2022; p. 39. [Google Scholar]
  37. GDAL/OGR Contributors. GDAL/OGR Geospatial Data Abstraction Software Library. Open Source Geospatial Foundation. 2022. Available online: https://gdal.org/ (accessed on 10 November 2022).
  38. Shao, G.; Tang, L.; Liao, J. Overselling overall map accuracy misinforms about research reliability. Landsc. Ecol. 2019, 34, 2487–2492. [Google Scholar] [CrossRef]
  39. Zagajewski, B.; Kluczek, M.; Raczko, E.; Njegovec, A.; Dabija, A.; Kycko, M. Comparison of Random Forest, Support Vector Machines, and Neural Networks for Post-Disaster Forest Species Mapping of the Krkonoše/Karkonosze Transboundary Biosphere Reserve. Remote Sens. 2021, 13, 2581. [Google Scholar] [CrossRef]
  40. Dao, P.D.; Axiotis, A.; He, Y. Mapping native and invasive grassland species and characterizing topography-driven species dynamics using high spatial resolution hyperspectral imagery. Int. J. Appl. Earth Obs. Geoinf. 2021, 104, 102542. [Google Scholar] [CrossRef]
  41. Mouta, N.; Silva, R.; Pais, S.; Alonso, J.M.; Gonçalves, J.F.; Honrado, J.; Vicente, J.R. ‘The Best of Two Worlds’—Combining Classifier Fusion and Ecological Models to Map and Explain Landscape Invasion by an Alien Shrub. Remote Sens. 2021, 13, 3287. [Google Scholar] [CrossRef]
  42. Gholizadeh, H.; Friedman, M.S.; McMillan, N.A.; Hammond, W.M.; Hassani, K.; Sams, A.V.; Charles, M.D.; Garrett, D.R.; Joshi, O.; Hamilton, R.G.; et al. Mapping invasive alien species in grassland ecosystems using airborne imaging spectroscopy and remotely observable vegetation functional traits. Remote Sens. Environ. 2022, 271, 112887. [Google Scholar] [CrossRef]
  43. Li, H.-D.; Zeng, M.-M.; Tan, B.-B.; Liang, Y.-Z.; Xu, Q.-S.; Cao, D.-S. Recipe for revealing informative metabolites based on model population analysis. Metabolomics 2010, 6, 353–361. [Google Scholar] [CrossRef]
  44. Kycko, M.; Zagajewski, B.; Zwijacz-Kozica, M.; Cierniewski, J.; Romanowska, E.; Orłowska, K.; Ochtyra, A.; Jarocińska, A. Assessment of Hyperspectral Remote Sensing for Analyzing the Impact of Human Trampling on Alpine Swards. Mt. Res. Dev. 2017, 37, 66–74. [Google Scholar] [CrossRef]
  45. Zagajewski, B.; Kycko, M.; Tømmervik, H.; Bochenek, Z.; Wojtuń, B.; Bjerke, J.W.; Kłos, A. Feasibility of hyperspectral vegetation indices for the detection of chlorophyll concentration in three high Arctic plants: Salix polaris, Bistorta vivipara, and Dryas octopetala. Acta Soc. Bot. Pol. 2018, 87, 3604. [Google Scholar] [CrossRef]
  46. Raczko, E.; Krówczyńska, M.; Wilk, E. Asbestos roofing recognition by use of convolutional neural networks and high-resolution aerial imagery. Testing different scenarios. Build. Environ. 2022, 217, 109092. [Google Scholar] [CrossRef]
  47. Smerdu, A.; Kanjir, U.; Kokalj, Ž. Automatic detection of Japanese knotweed in urban areas from aerial and satellite data. Manag. Biol. Invasions 2020, 11, 661–676. [Google Scholar] [CrossRef]
  48. Maxwell, A.E.; Warner, T.A.; Fang, F. Implementation of machine-learning classification in remote sensing: An applied review. Int. J. Remote Sens. 2018, 39, 2784–2817. [Google Scholar] [CrossRef]
  49. Xi, Y.; Ren, C.; Tian, Q.; Ren, Y.; Dong, X.; Zhang, Z. Exploitation of Time Series Sentinel-2 Data and Different Machine Learning Algorithms for Detailed Tree Species Classification. IEEE J. Sel. Top. Appl. Earth Obs. Remote Sens. 2021, 14, 7589–7603. [Google Scholar] [CrossRef]
  50. Wang, W.; Tang, J.; Zhang, N.; Wang, Y.; Xu, X.; Zhang, A. Spatiotemporal Pattern of Invasive Pedicularis in the Bayinbuluke Land, China, during 2019–2021: An Analysis Based on PlanetScope and Sentinel-2 Data. Remote Sens. 2023, 15, 4383. [Google Scholar] [CrossRef]
  51. Marzialetti, F.; Di Febbraro, M.; Frate, L.; De Simone, W.; Acosta, A.T.R.; Carranza, M.L. Synergetic use of unmanned aerial vehicle and satellite images for detecting non-native tree species: An insight into Acacia saligna invasion in the Mediterranean coast. Front. Environ. Sci. 2022, 10, 880626. [Google Scholar] [CrossRef]
  52. Rakotoarivony, M.N.A.; Gholizadeh, H.; Hammond, W.M.; Hassani, K.; Joshi, O.; Hamilton, R.G.; Fuhlendorf, S.D.; Trowbridge, A.M.; Adams, H.D. Detecting the invasive Lespedeza cuneata in grasslands using commercial small satellite imagery. Int. J. Remote Sens. 2023, 44, 6802–6824. [Google Scholar] [CrossRef]
  53. Han, X.; Wang, Y.; Ke, Y.; Liu, T.; Zhou, D. Phenological heterogeneities of invasive Spartina alterniflora salt marshes revealed by high-spatial-resolution satellite imagery. Ecol. Indic. 2022, 144, 109492. [Google Scholar] [CrossRef]
Figure 1. Goldenrod is well identified in the field, because tall and intensely yellow flowering plants form compact patches, displacing other plants from the habitat being taken over; in the foreground on the right, there is an expansive native species of wood small-reed (bushgrass; Calamagrostis epigejos; upper photo). Also, goldenrod does very well in the immediate neighborhood of shrubs and individual trees, first eliminating other grasses and perennials, and then spreading its own seeds to neighboring areas. Its light weight and adaptations to anemochoria allow it to colonize relatively remote areas (lower photo). Photo credit: Bogdan Zagajewski.
Remotesensing 16 00636 g001
Figure 2. Research method based on multitemporal Sentinel-2 and PlanetScope images; the training and verification patterns were randomly selected pixels from field-verified goldenrod occurrence polygons; 100 iterations of Random Forest and Support Vector Machine classifications were carried out, allowing the selection of optimal sets of patterns that were used for the final classifications.
Remotesensing 16 00636 g002
Figure 3. A close look at goldenrod in the different vegetation stages—in the peak of the flowering period (left photo) and after the flowering period (right photo). Photo credit: Karolina Barbara Zdunek.
Remotesensing 16 00636 g003
Figure 4. Research area. Field research was conducted in the southeastern quadrant of the Sentinel-2 scene (bordered by a green line), which overlapped with the PlanetScope data (white line; the same polygons were used to classify both multitemporal satellite images). Due to the size of the polygons and the scale of the Sentinel-2 image, the research polygons have been presented in the form of a yellow signature, not reflecting the real size of the patterns acquired in the field. Poland’s border is outlined with a red line on the left figure.
Remotesensing 16 00636 g004
Figure 5. Median value of the F1-scores as a measure of classification accuracy of goldenrod according to the scenarios tested: RF, Random Forest (yellow box); SVM, Support Vector Machine (orange box); S-2, Sentinel-2 image classification results; PS, PlanetScope (green box); 50–1000 number of training pixels used for classification. SVM results for PlanetScope data achieved F1-score values below 0.55.
Remotesensing 16 00636 g005
Figure 6. The impact of the number of pixels used in training patterns on the accuracy of post-classification maps based on Sentinel-2 multitemporal images. Explanations: max/min—maximum/minimum value of F1-score during 100 iterations of the classification process; Q1/Q3—first/third quartile; IQR—interquartile range; RF—Random Forest classification; SVM—Support Vector Machine classification; mix—other plants (shrubs, single trees, grasses, and perennials) dominate on given plots, but goldenrod is present; goldenrod—polygons dominated by goldenrod, but other plants may also occur.
Remotesensing 16 00636 g006
Figure 7. The impact of the number of pixels used in training patterns on the accuracy of post-classification maps based on PlanetScope multitemporal images. Explanations: max/min—maximum/minimum value of scored F1-score during 100 iterations of the classification process; Q1/Q3—first/third quartile; IQR—interquartile range; RF—Random Forest classification; SVM—Support Vector Machine classification; mix—other plants (shrubs, single trees, grasses, and perennials) dominate on given plots, but goldenrod is present; goldenrod—polygons dominated by goldenrod, but other plants may also occur.
Remotesensing 16 00636 g007
Figure 8. Goldenrod distribution map with the dominance of goldenrod (polygons marked in pink to highlight small surfaces with intense color), as well as mixes with other species (yellow marked polygons), based on multitemporal Sentinel-2 images and the Random Forest classifier. In the background, Sentinel-2 image is presented.
Remotesensing 16 00636 g008
Figure 9. Goldenrod distribution map with the dominance of goldenrod (pink marked), based on multitemporal Sentinel-2 images and the Random Forest classifier. In the background, Sentinel-2 image is presented.
Remotesensing 16 00636 g009
Figure 10. Referencing the results of Sentinel-2 and PlanetScope image iterative classification method (randomly selected 700 training pixels for each classification, the whole procedure was repeated 100 times) to the field situation. An orthophotomap was used in the background (pixel size of 0.05 m, prepared by the Polish Head Office of Geodesy and Cartography). Photo credit: Karolina B. Zdunek.
Remotesensing 16 00636 g010
Table 1. Technical parameters of the Sentinel-2 and PlanetScope sensors. Explanation: NA—not available (PlanetScope does not offer the equivalent band to Sentinel-2 imagery); PSB.SD—3rd generation of PlanetScope sensor (SuperDove).
Sentinel-2PlanetScope
Bands123456788A9111212345678
Central wavelength (nm)44349056066570574078384286594016102190443490531565610665705865
Interoperable with Sentinel-212NA3NA458a
Spatial resolution (m)60101010202020102060202033333333
Available temporal resolution (days)51
Radiometric resolution (bits)1216
Orbit altitude786 km (98.62°; heliosynchronous)475–525 km (~98°; heliosynchronous); PSB.SD
Frame sizeswath width: 290 km32.5 km × 19.6 km; PSB.SD
Table 2. Unbalanced set of patterns used to classify goldenrod; from this set, 50–700 randomized pixels for Sentinel-2 and 50–1000 pixels for PlanetScope were selected for iterative classifications based on 50:50 stratified random sampling.
Sentinel-2PlanetScope
Number of PolygonsNumber of PixelsNumber of Pixels
goldenrod5412549993
mix43192210,999
forest4046,568754,738
agriculture crops7538,580491,142
built-up areas5525,941108,968
surface waters2796,505859,943
Table 3. Achieved F1-scores based on iterative classification of Sentinel-2 images and randomized pixel selection, depending on the number of training pixels used for classification (three highest results of iterative classification, number of iterations whose results achieved higher F1-score values than 0.90, median and mean for 100 iterations; 1st, the highest (1st) F1-score; 2nd, 2nd highest F1-score; 3rd, 3rd highest F1-score; F1-score > 0.90, number of iterations with F1-score > 0.90).
RF SVM
Training pixels5010015020030040050060070050100150200300400500600700
1st0.930.930.940.940.940.940.950.950.940.920.930.930.940.930.940.930.940.93
2nd0.920.920.940.930.940.940.940.940.940.910.930.920.930.920.930.930.920.93
3rd0.920.920.930.930.930.930.930.940.940.910.920.920.920.920.930.920.920.92
F1-score > 0.9010121917162231283551113681061313
Median0.730.770.810.820.840.860.870.860.870.650.730.740.740.770.790.790.800.81
Mean0.700.730.760.760.790.810.820.820.820.650.700.700.690.720.730.720.740.74
Table 4. Obtained F1-scores based on the PlanetScope multitemporal data depending on the number of training pixels used for classification (three highest results of iterative classification, number of iterations whose results achieved higher F1-score value > 0.90 median and mean for 100 iterations; 1st, the best F1-score; 2nd, the 2nd best F1-score; 3rd, the 3rd best F1-score; >0.90, number of iterations with F1-score > 0.90).
RF SVM
Training pixels501001502003004005006007001000501001502003004005006007001000
1st0.940.950.940.920.940.950.940.940.940.950.930.940.930.930.940.940.920.930.940.95
2nd0.910.930.930.920.930.930.930.940.930.950.910.920.920.920.930.930.910.930.940.92
3rd0.900.920.920.920.930.930.930.930.930.930.900.900.920.910.920.920.910.920.930.92
>0.9031212813161616202043547889127
Median0.580.660.590.620.620.650.640.650.640.670.390.390.390.410.400.420.400.430.420.40
Mean0.590.640.630.620.640.660.660.660.670.680.450.450.440.480.480.480.480.500.490.49
Table 5. Mean decrease in accuracy (MDA) presenting an impact of individual image acquisition periods and spectral bands on the result of goldenrod identification. Explanation of the colors used in the tables: MDA value < 10 the cell is marked with yellow, 10–20: neutral ecru, 20–30 light green, >30: green.
Sentinel-2
Band9 September 202129 October 20213 November 2021MeanOrderRangeCentral wavelength (nm)
B116.9035.8139.6330.781Coastal aerosol442.7
B223.0724.1317.0221.417Blue492.4
B334.7517.5415.1922.493Green559.8
B424.8822.7818.9622.215Red664.6
B534.4515.7914.2721.506Red-edge704.1
B617.4416.2912.5515.4312Red-edge740.5
B718.6216.0611.7915.4911Red-edge782.8
B821.7916.911.3416.6810NIR832.8
B8A21.5818.1911.7317.179Narrow NIR864.7
B930.1917.7221.9223.282NIR945.1
B1123.6519.9315.3819.658SWIR1613.7
B1228.4020.1318.2422.264SWIR2202.4
Mean24.6420.1117.34
PlanetScope
Band11 September 202130 October 20213 November 2021MeanOrderRangeCentral wavelength (nm)
B116.119.2714.8513.416Coastal blue443
B212.5615.2413.7513.854Blue490
B38.1315.0212.2311.797Green I531
B415.7111.5813.7213.675Green II565
B511.396.9311.139.828Yellow610
B628.257.1616.8617.422Red665
B717.4518.828.5814.953Red-edge705
B830.4915.5815.7320.601NIR865
Mean17.5112.4513.36
Table 6. The error matrices of multitemporal Sentinel-2 images with the Random Forest (RF) and Support Vector Machine (SVM) classifiers based on 700 training pixels. Explanations: OA—overall accuracy; PA—producer accuracy; UA—user accuracy; F1—F1-score.
RFOA = 0.97
forestmixgoldenrodcropswaterbuilt-upPAF1
forest16,8650001131.000.99
mix5676728210780.810.85
goldenrod0167463030.970.96
crops79311213,7180610.990.95
water300018,50201.001.00
built-up1713381370111,5290.880.93
UA0.980.910.940.911.000.99
SVMOA = 0.99
forestmixgoldenrodcropswaterbuilt-upPAF1
forest17,018302236310.990.99
mix7377637270590.800.85
goldenrod101774600230.940.94
crops5750814,9690910.990.99
water1100018,454451.001.00
built-up513941411,4350.990.98
UA0.990.920.940.991.000.98
Disclaimer/Publisher’s Note: The statements, opinions and data contained in all publications are solely those of the individual author(s) and contributor(s) and not of MDPI and/or the editor(s). MDPI and/or the editor(s) disclaim responsibility for any injury to people or property resulting from any ideas, methods, instructions or products referred to in the content.

