Technical Note

An Innovative Sensor Integrated with GNSS and Accelerometer for Bridge Health Monitoring

1
Jiangsu Hydraulic Research Institute, Nanjing 210017, China
2
No. 1 Institute of Geology and Mineral Resources of Shandong Province, Jinan 250109, China
3
Key Laboratory of Cableway Intelligent Deformation Monitoring of Shandong Provincial Bureau of Geology and Mineral Resources, Jinan 250109, China
4
Faculty of Architecture, Civil and Transportation Engineering, Beijing University of Technology, Beijing 100124, China
5
Imperial College London, London SW7 2BX, UK
6
RWDI UK Ltd., Milton Keynes MK11 3EA, UK
7
UbiPOS UK Ltd., Nottingham NG7 1QE, UK
*
Author to whom correspondence should be addressed.
Remote Sens. 2024, 16(4), 607; https://doi.org/10.3390/rs16040607
Submission received: 2 January 2024 / Revised: 31 January 2024 / Accepted: 2 February 2024 / Published: 6 February 2024
(This article belongs to the Special Issue Advances in Applications of Remote Sensing GIS and GNSS)

Abstract

:
This paper presents an innovative integrated sensor that combines GNSS and a low-cost accelerometer for bridge health monitoring. GNSS and accelerometers are both significant and effective sensors for structural monitoring, but they each have limitations. The sampling rate of GNSS data is relatively low, making it challenging to capture high-frequency vibrations, while accelerometers struggle with low-frequency signals and are susceptible to environmental changes. Additionally, GNSS receivers and accelerometers are often installed separately, leading to challenges in data fusion processing due to differing temporal and geospatial references. The proposed integrated sensor addresses these issues by synchronizing GNSS and an accelerometer’s time and geospatial coordinate reference. This allows for a more accurate and reliable deformation and vibration measurement for bridge monitoring. The performance of the new sensor was assessed using a high-quality/cost Leica GM30 GNSS receiver and a Sherborne A545 accelerometer. Experiments conducted on the Wilford suspension bridge demonstrate the effectiveness of this innovative integrated sensor in measuring deformation and vibration for bridge health monitoring. The limitation of the low-cost MEMS (Micro Electromechanical System) accelerometer for the weak motion frequency detection is also pointed out.

1. Introduction

Due to the advantages of the real-time 3D absolute displacements of monitoring, continuous autonomous operation, and reliable performance in various weather and visibility conditions, GNSS sensors have proven to be effective for deformation monitoring in structures such as tall buildings, dams, and bridges [1,2,3,4]. Compared to traditional monitoring methods, GNSS overcome many limitations, as they can easily identify low-frequency structural vibration responses. They have been widely used in bridge structural health monitoring over the past decade [5,6,7,8]. However, noise, such as the multipath effects and random errors, can cause true dynamic displacements to be obscured, limiting the effectiveness of GNSS vibration monitoring in modal parameter identification [9,10]. Therefore, data processing methods should be employed to eliminate GNSS measurement errors before extracting structural dynamic characteristics.
Generally, there are five GNSS positioning models for the structural deformation model, which can be summarized as follows:
(1)
Static differential positioning model: This model refers to technology based on the difference method between stations to eliminate atmospheric and other related errors after accumulating a certain amount of GNSS observation data for a certain period;
(2)
Real-time kinematic (RTK) positioning model: The RTK model is a positioning technology that involves a monitoring station continuously receiving corrections of satellite signals and other related errors from a reference station based on their known positions and then obtains a high-precision location in real time;
(3)
Network RTK (NRTK) positioning model: The NRTK model is based on RTK technology and utilizes multiple GNSS reference stations around the monitoring station to model satellite signals and other related errors to obtain accurate positioning results;
(4)
Precision point positioning (PPP) positioning model: The PPP model is a method used to directly obtain high-precision absolute coordinates of monitoring points based on extra positioning data such as precision orbit and clock deviation, which means that this method does not require reference stations;
(5)
PPP–RTK positioning model: The PPP–RTK model combines PPP and RTK technologies, using a small amount of reference station data on the server to model distance-related errors and broadcast them. The user can determine locations in the PPP model within a large area around the reference station.
The accuracy of the above positioning models is listed in Table 1 [11].
Accelerometers can work without external signals and have been deployed widely to obtain vibration information for structural health monitoring. Mita and Yokoi proposed an innovative design for an optical accelerometer that uses a Fiber Bragg grating element. A prototype accelerometer was also designed and compared with a reference servo-type accelerometer by a shake table test [12]. Accelerometers are also deployed for stayed-cable bridge damage detection and localization [13]. To solve the data transmission issue, a high-sensitivity wireless accelerometer was developed for structural health monitoring [14]. The high cost of sensors is a significant obstacle to the widespread promotion of real-time online bridge health monitoring systems. Therefore, finding sensors that can meet the requirements of structural monitoring while maintaining low costs is an essential research topic. To reduce cost, self-made MEMS accelerometer prototypes were developed and validated in the laboratory and on an operational cable-stayed bridge [15]. A data-driven model for extensive wind turbine blade monitoring was proposed using a single accelerometer and actuator [16]. Ponzo achieved eigenfrequencies and the equivalent viscous damping factor using an accelerometer [17] and demonstrated that force-balanced accelerometers detected the fundamental frequency of the investigated bridge, which was less than 1 Hz [18]. However, accelerometers are likely to be affected by environmental factors, such as temperature and humidity, and are sensitive to the installation location and orientation [19,20].
GNSS have the strength to obtain stable and precise deformation data and low-vibration information, while accelerometers are suited for high-vibration data, which means that GNSS integrated with accelerometers have great potential for structural health monitoring. Scholars have proposed many ideas for their combination [21,22,23]. Geng revealed that GPS networks upgraded with strong-motion accelerometers can provide new information for an improved understanding of the earthquake rupture process [24]. Xiong found that the results of a GNSS were close to those of accelerators and theoretical calculation results of finite element analysis as part of the Tianjin Fumin Bridge experiment [25]. Xin proposed a seismogeodetic instrument named Strong Motion Accelerographs with GNSS 2000 (SMAG2000); it showed advantages when compared with a Trimble SG160-09 and SIO-GAP by designed experiments [26]. Low-cost MEMS accelerometers were adopted to improve the performance of GNSS landslide monitoring [27]. The error of GNSS data also can be detected by accelerometer data analysis [28].
The main reason for the difficulty in taking full advantage of the strengths of the combination of GNSS and accelerometers is the need for a unified time and geospatial reference, leading to data processing problems [29]. GNSS receivers and accelerometers are always installed in different locations with different coordinate systems. Most accelerometers do not have a time stamp which also causes the issue of data fusion with GNSS data. This paper introduces an innovative sensor integrated with GNSS and a low-cost accelerometer to solve the previous problems. Dedicated experiments are also designed and conducted by data analysis and compared with a known high-quality/cost GNSS receiver (Leica GM30) and accelerometer (Sherborne A545); the innovated sensor meets the requirements of structural health monitoring of a long-span bridge, which paves the path to utilizing the strengths of the two sensors to obtain more accurate deformation and vibration information.

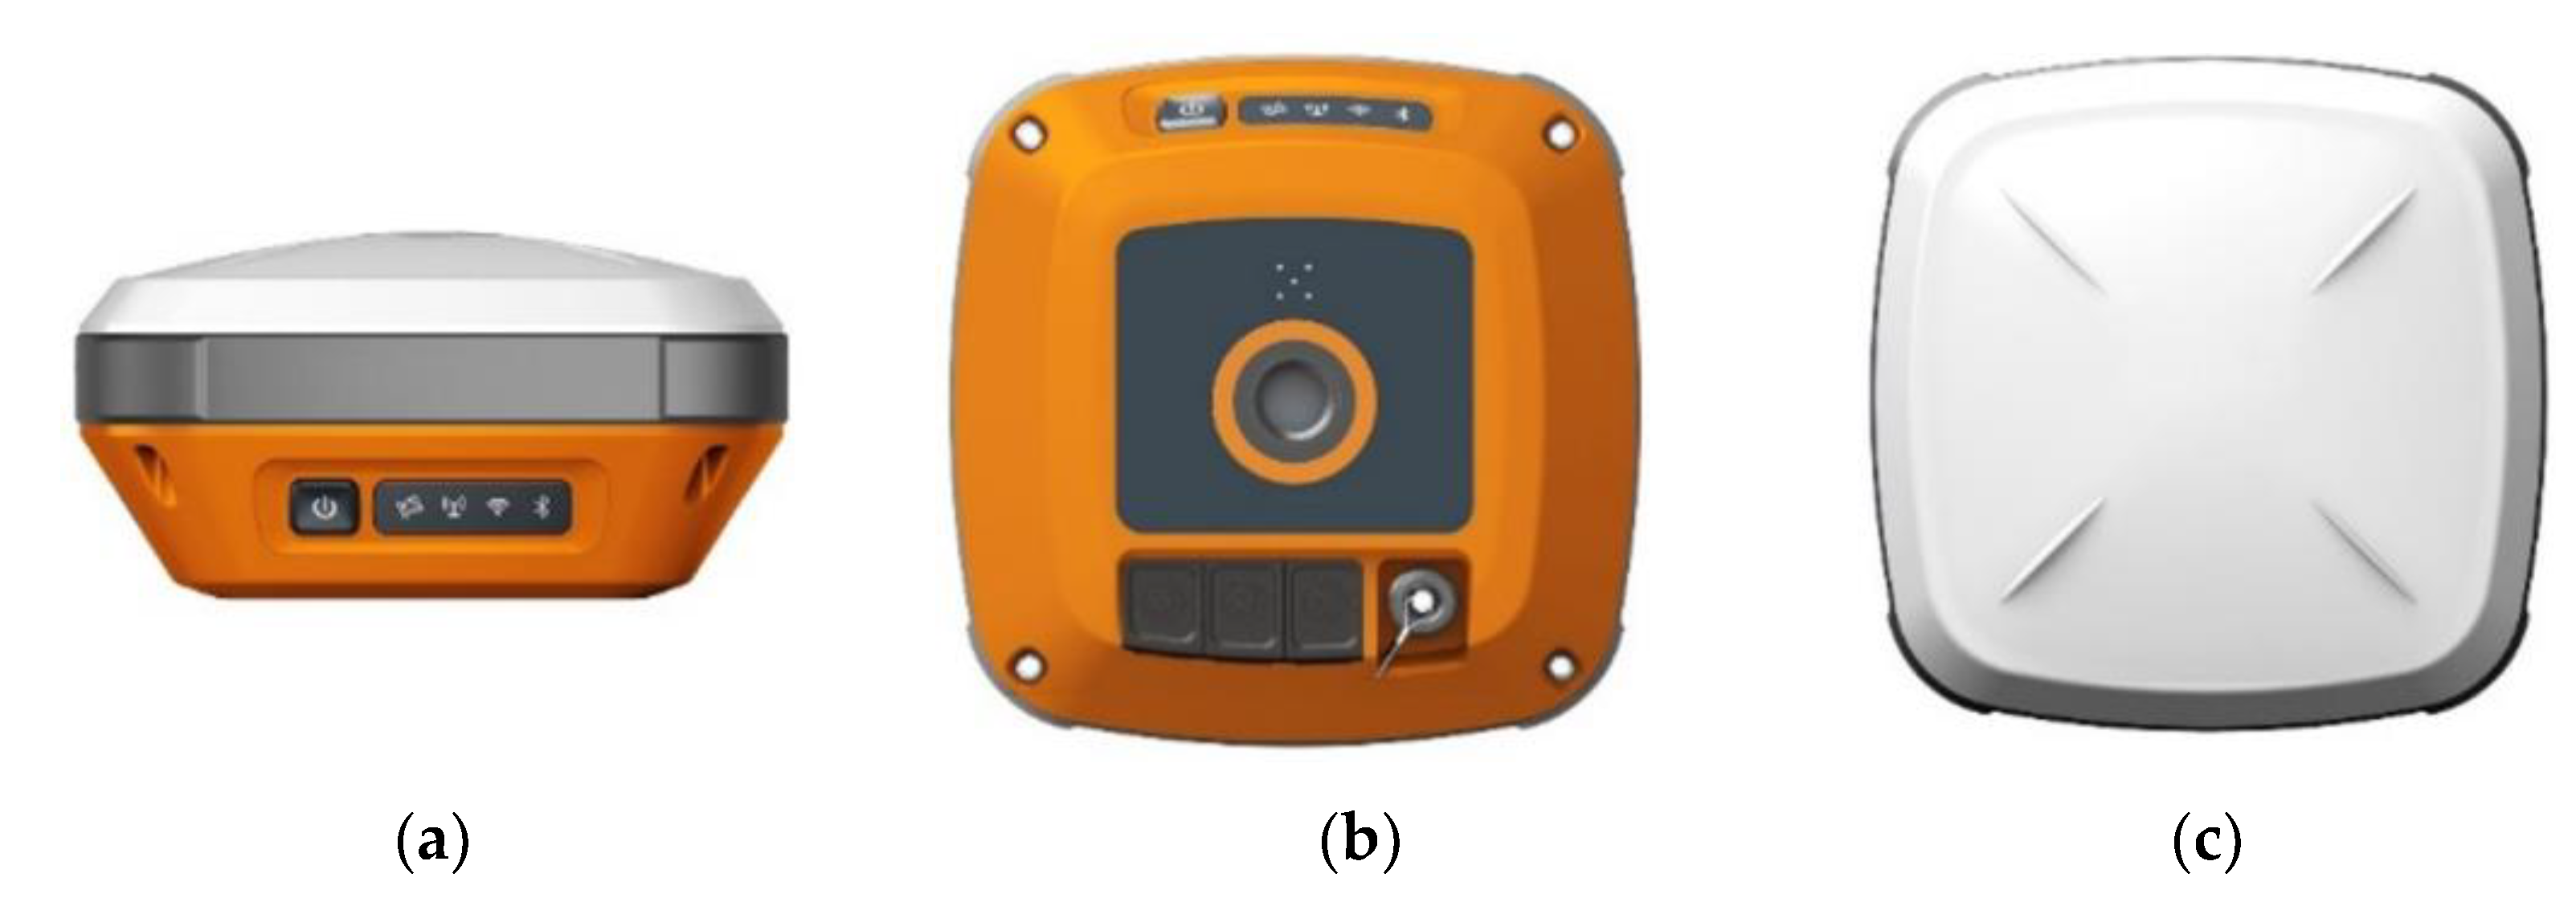
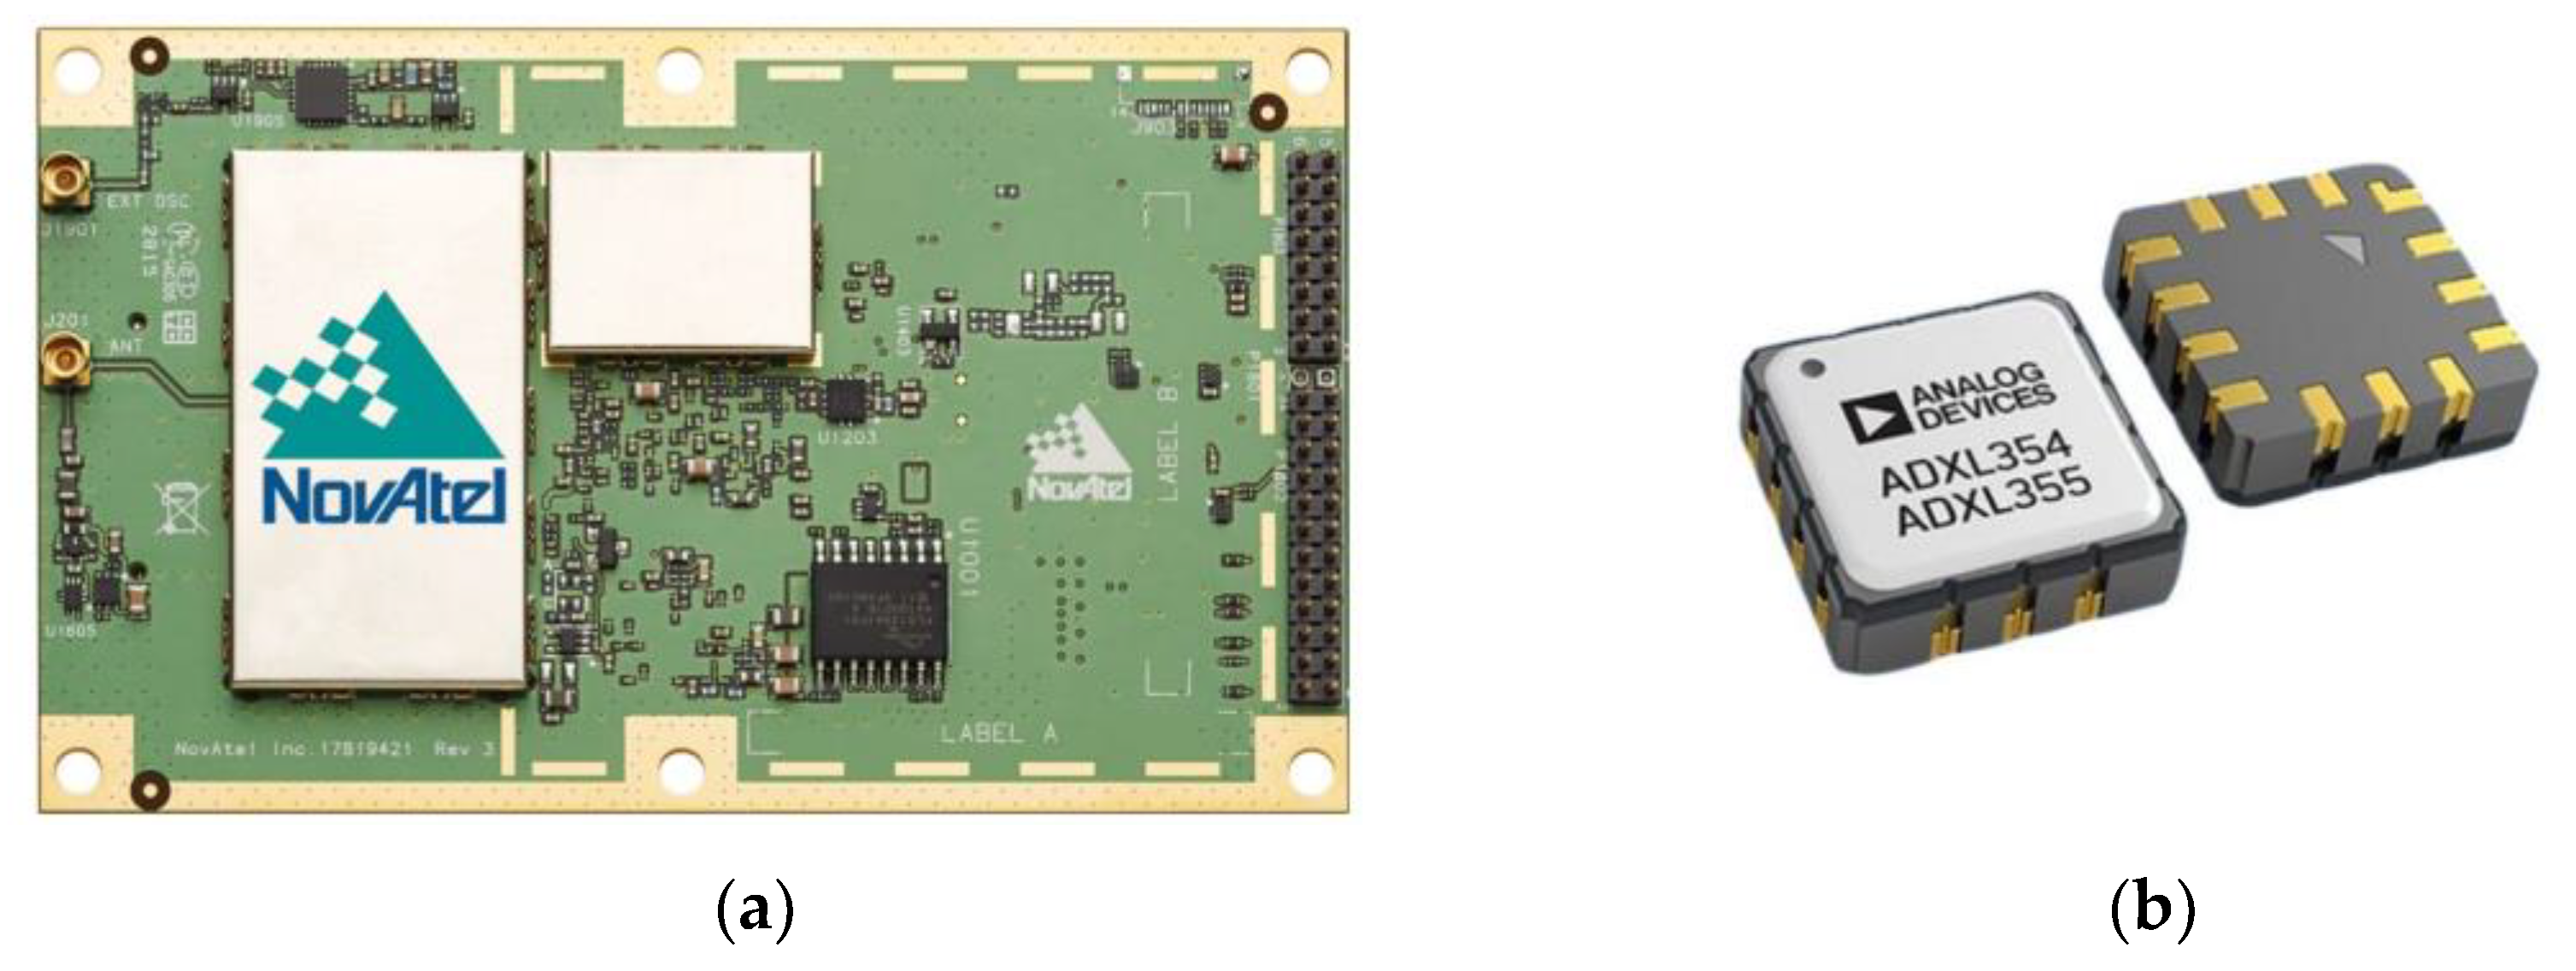
2. Innovative Sensor Introduction

The figure of the sensor is shown in Figure 1, and it integrates an antenna, GNSS chip (Novatel OEM729), low-cost MEMS accelerometer, power, and other communication devices in one box with a size of 146 mm × 146 mm × 76 mm.
A Novatel (OEM729) board was adopted to receive and process the GNSS signal and a MEMS sensor from ANALOG DEVICES (ADXL355) was used to measure the acceleration (Figure 2). The key parameters of the two sensors are listed in Table 2 and Table 3.
It should be noted that generally, low-cost MEMS accelerometers have higher levels of noise compared to other analogue signal accelerometers. The difference may not be significant when measuring vibration frequencies of high dynamic structures. However, the limitation becomes more apparent when measuring relatively stationary objects. This point was also demonstrated in subsequent experiments.

3. Sensor Experiment and Assessment

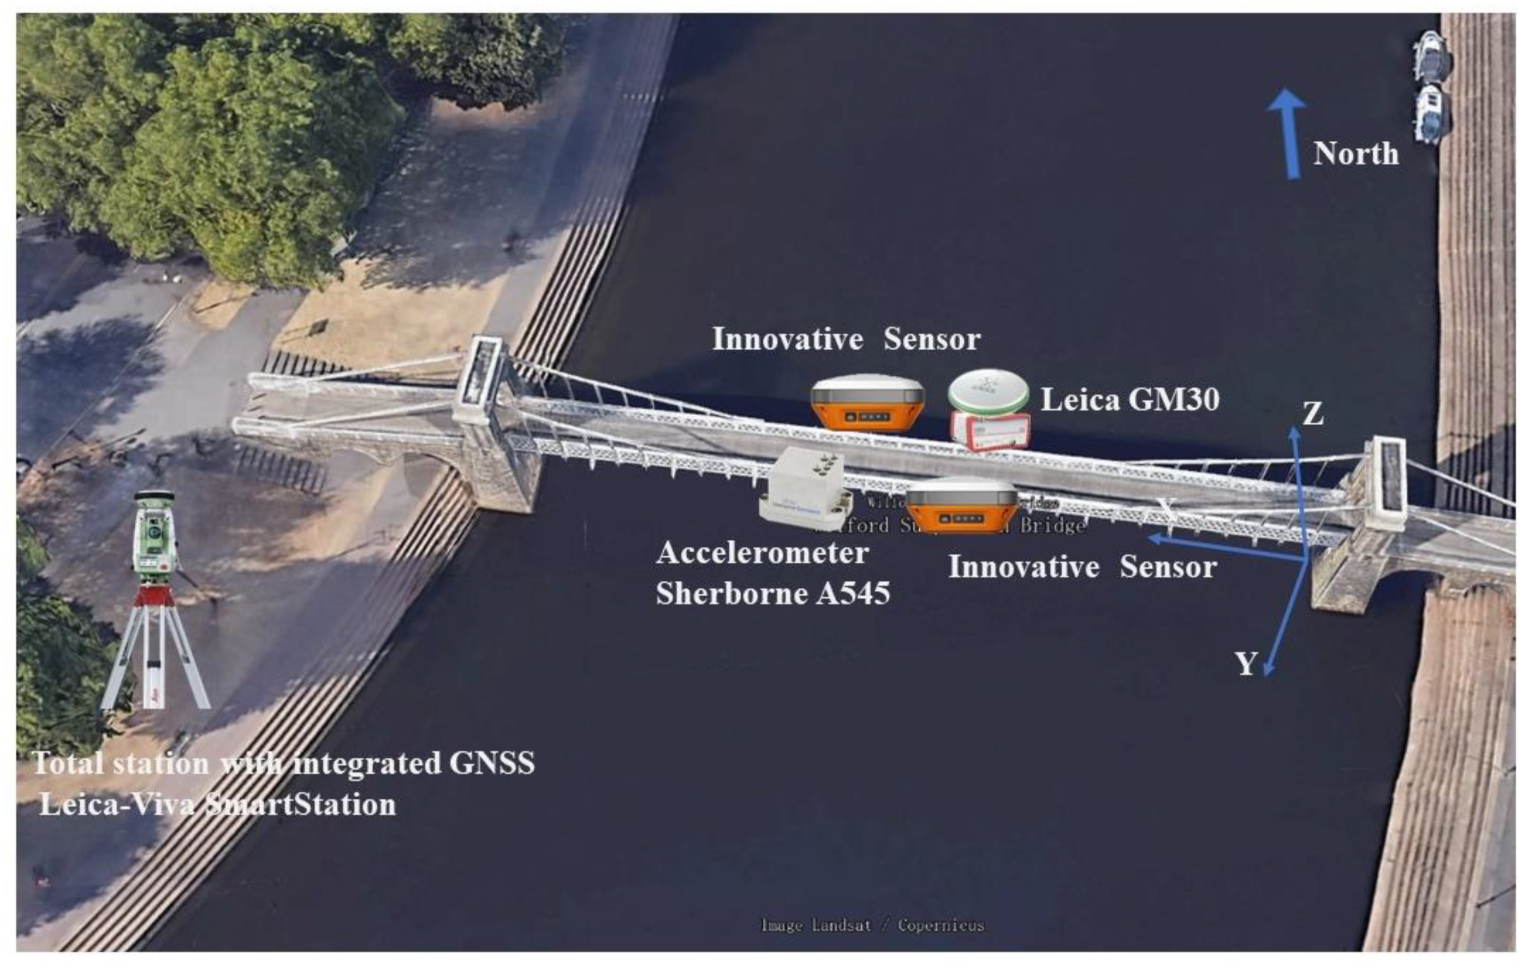
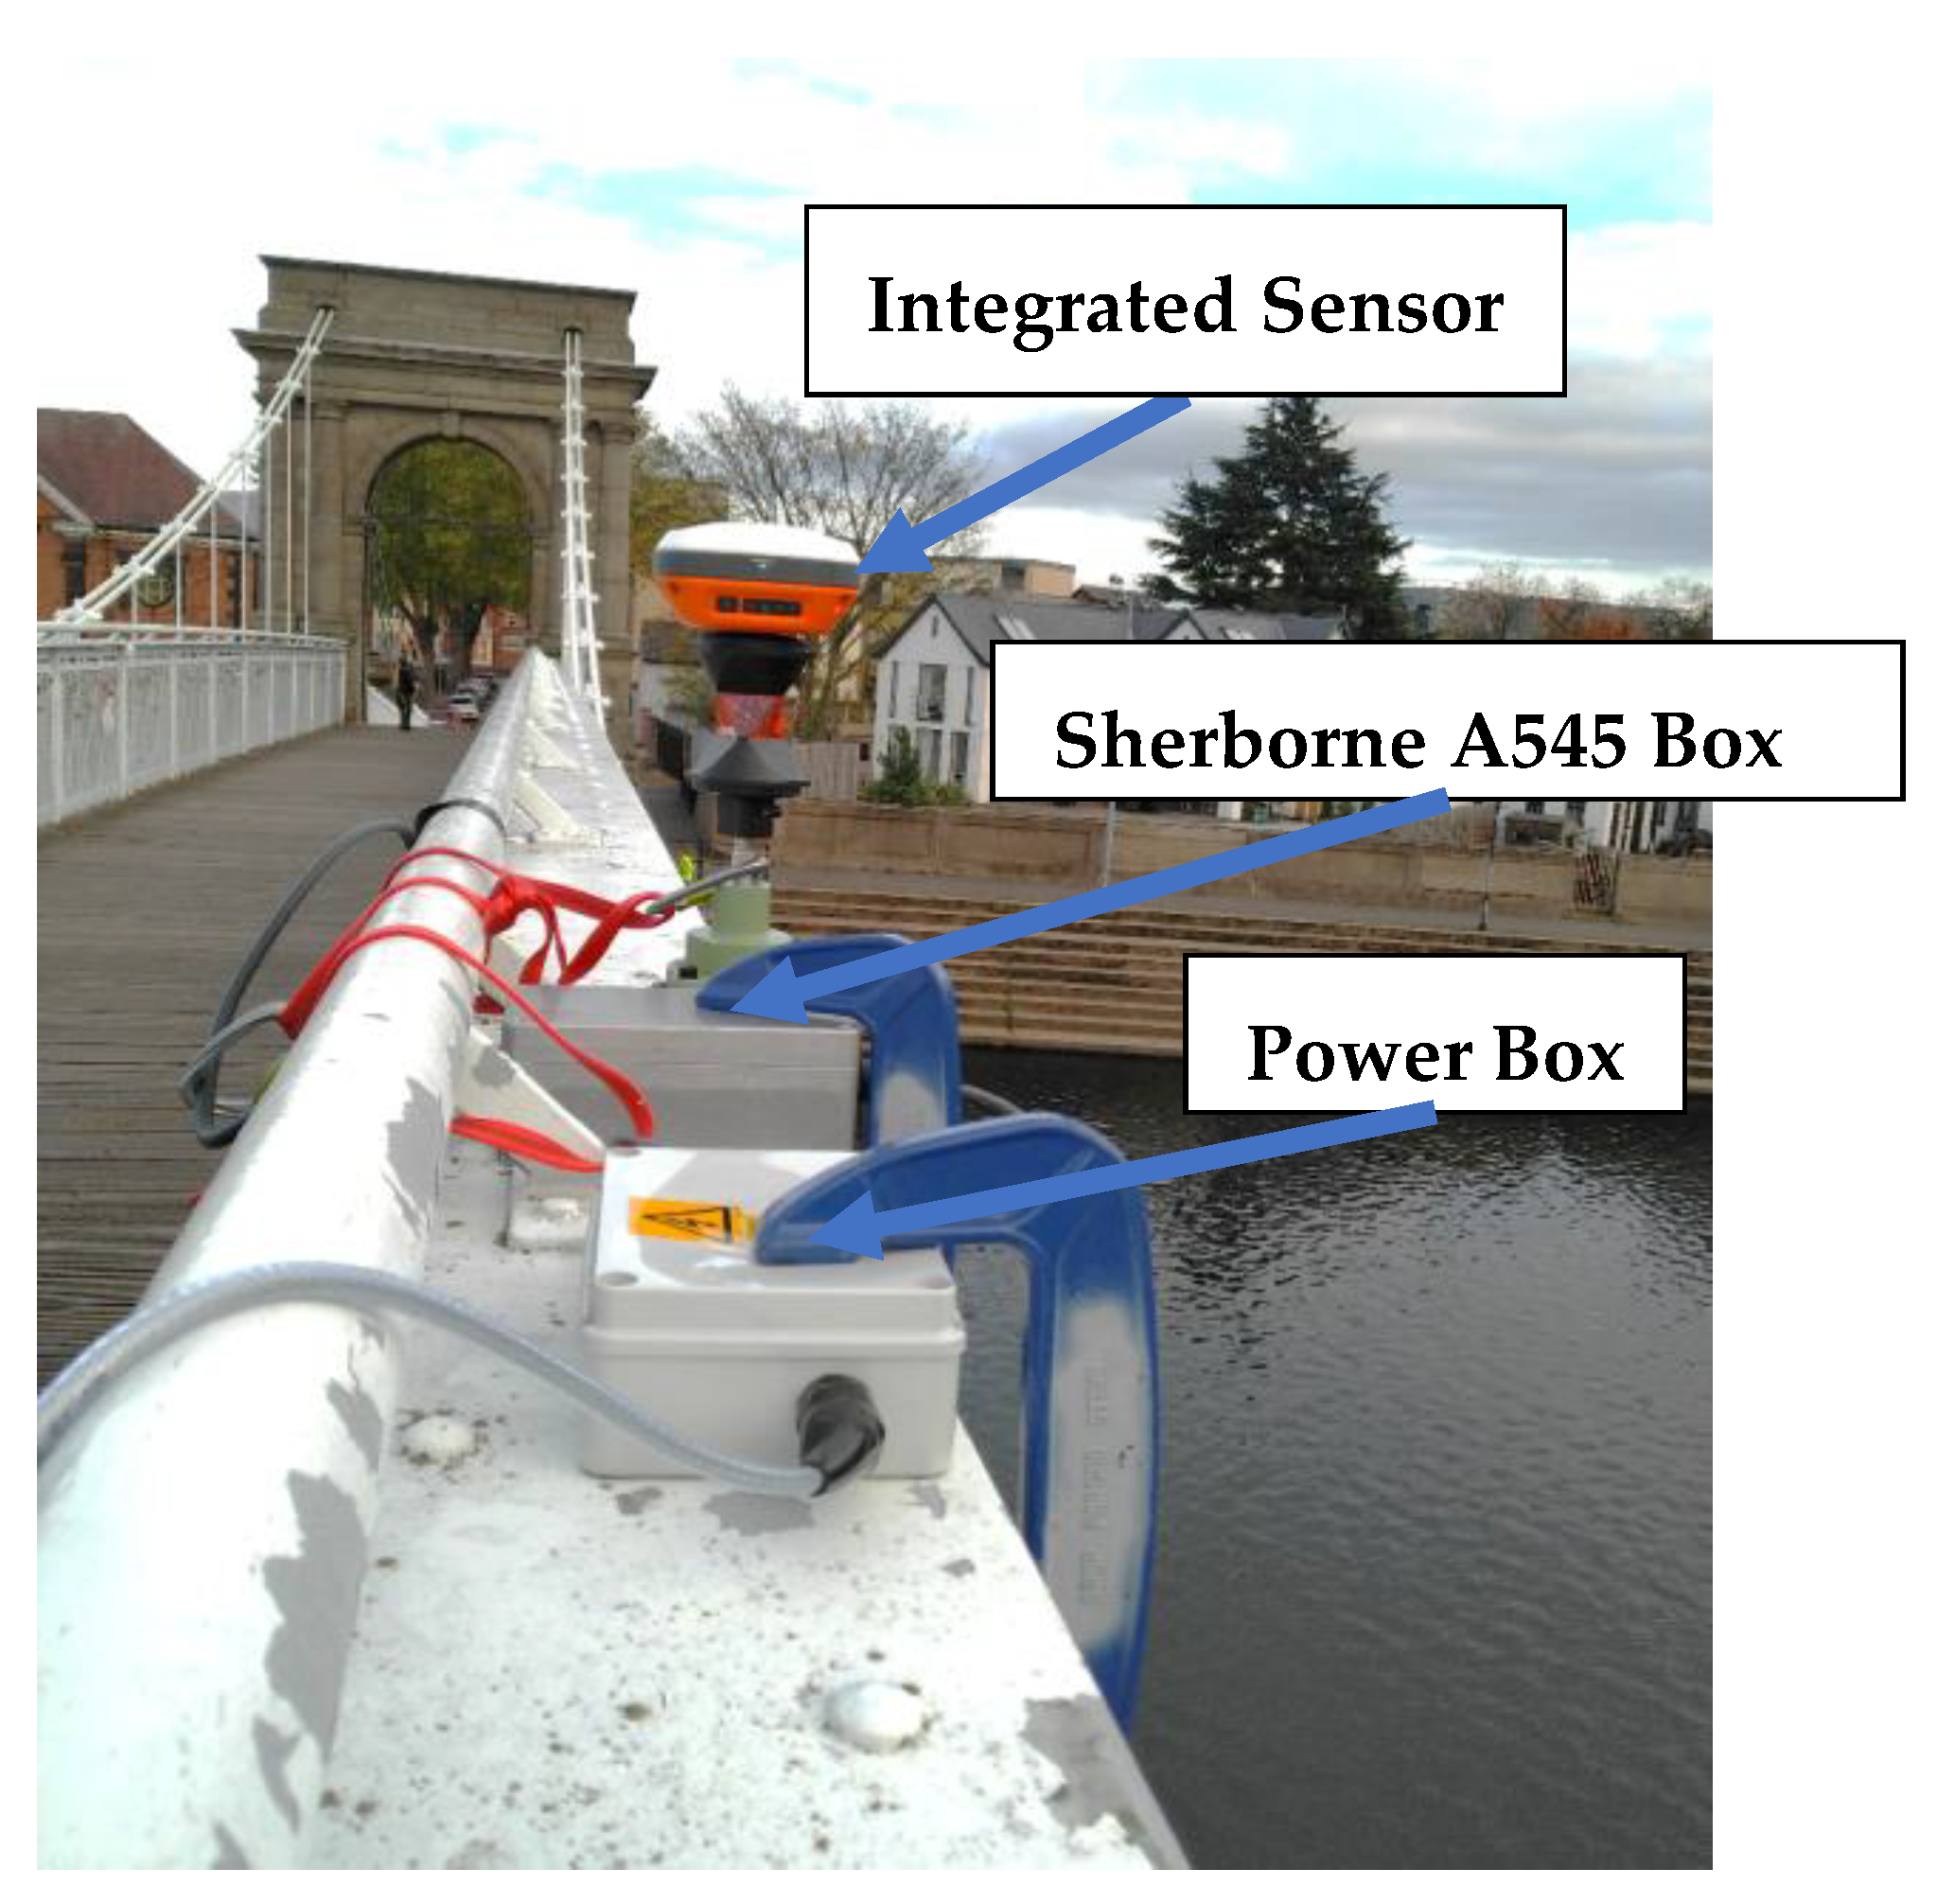
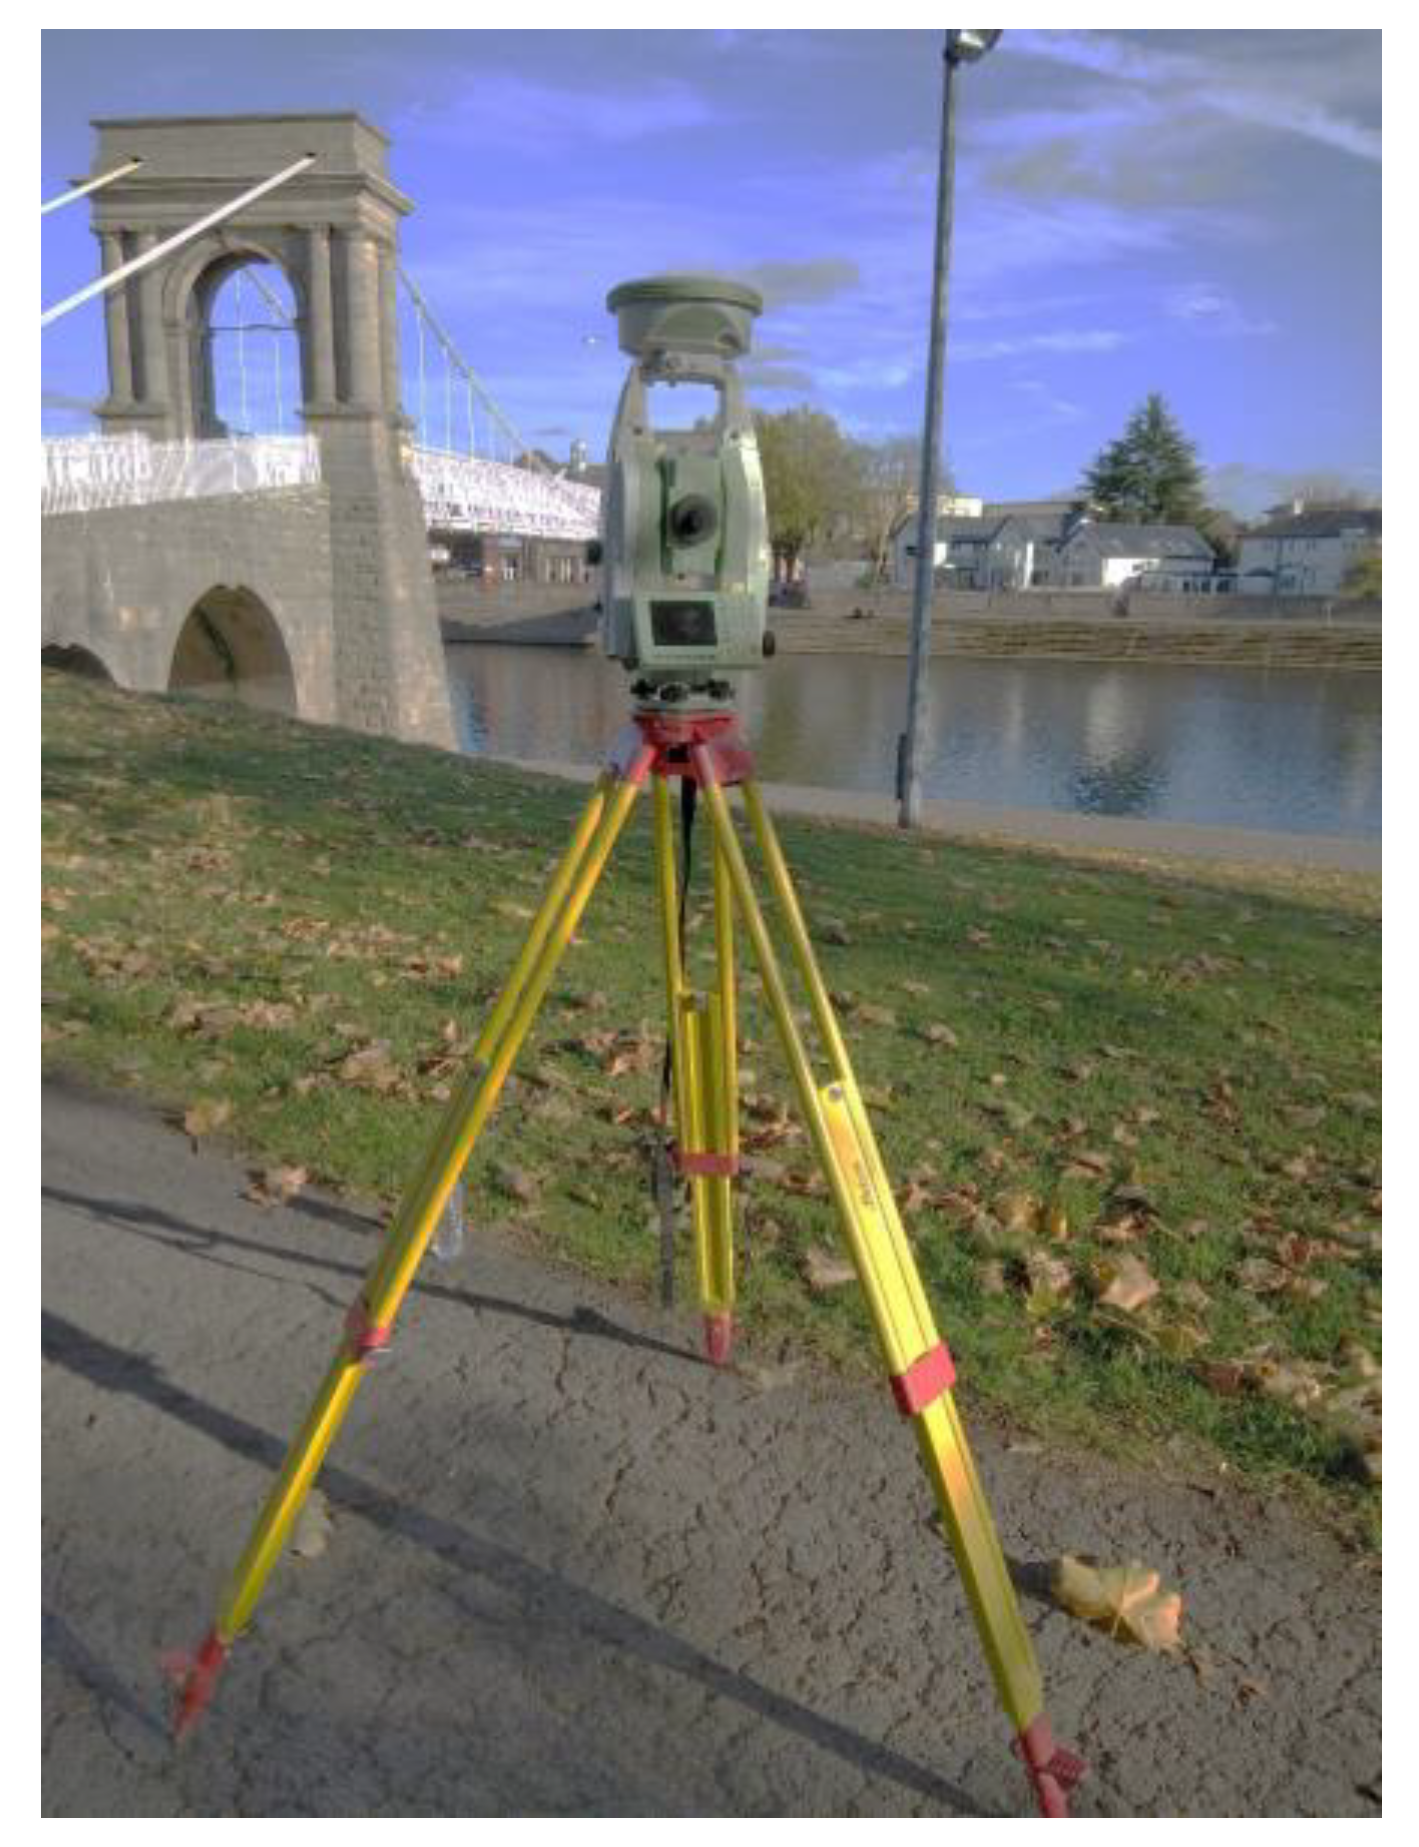
3.1. Experiment Introduction

To evaluate the performance of the new sensor more accurately, the Wilford suspension bridge was chosen as the test bed (Figure 3). Figure 4 demonstrates the location of all the sensors.
A high-cost, high-quality GNSS receiver (Leica GM30) was adopted and installed on the bridge’s north side for the positioning accuracy assessment. The innovative integrated sensor was installed near the Leica receiver (Figure 5). The key positioning parameters of the Leica GM30 are listed in Table 4.
For the accelerometer assessment, a high-quality/cost accelerometer (Sherborne A545) was employed as a compared device, whose key parameters are listed in Table 5. Figure 6 demonstrates the location of the sensors and they were installed on the south side of the bridge.
A Viva SmartStation with integrated GNSS from Leica was installed on the riverside as the base station (Figure 7). The total station was designed as an auxiliary device to assess the positioning accuracy of the integrated sensor. However, because of the low sampling rate and unstable data, a Leica receiver was finally taken as the compared sensor to assess the performance of positioning accuracy.

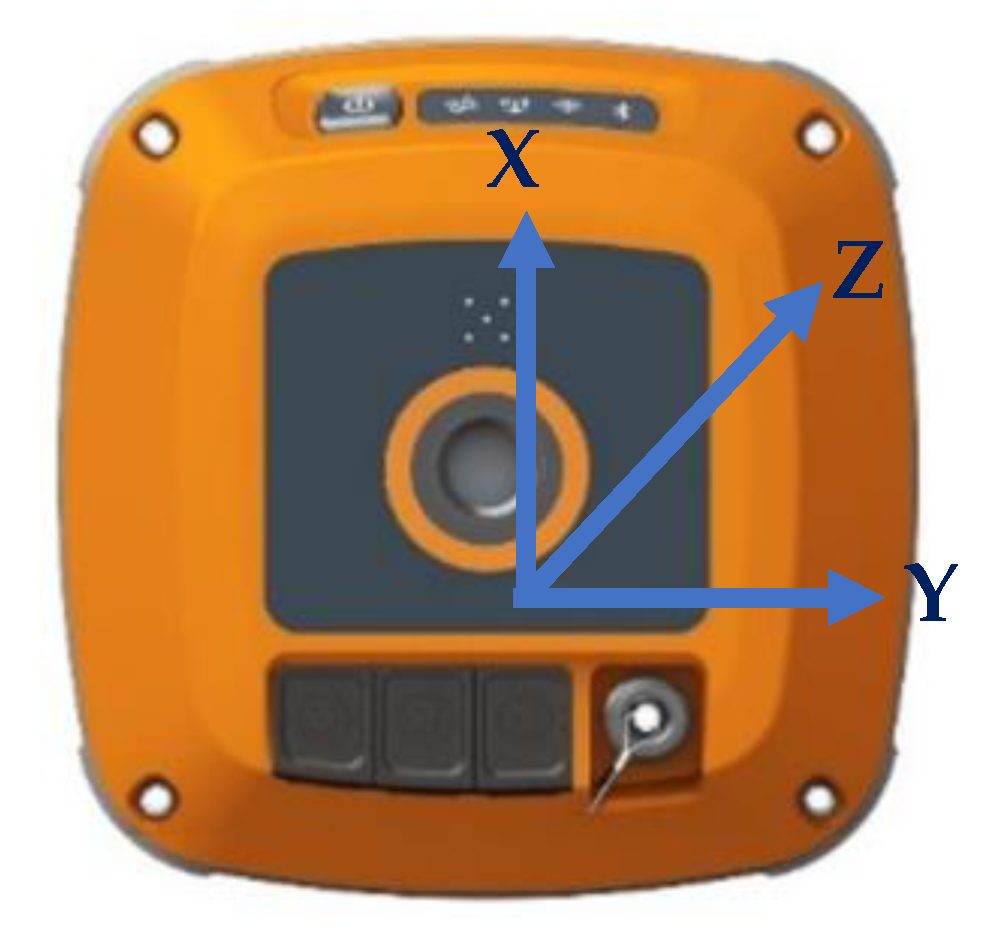
3.2. Time Synchronization and Geospatial Reference of Accelerometer

The difficulty in applying integrated acceleration and GNSS sensors to structural health monitoring lies in the unification of time and geospatial references. Normally, the data output by an accelerometer has no timestamp while GNSS data have high-precision timestamps. GNSS measurements are based on a geodetic coordinate system, while accelerometer results are based on the orientation in which the accelerometer is mounted. To solve the above problems, we designed an innovative sensor which realizes the data fusion of the implemented accelerometer and GNSS through hardware integration.
A PPS (pulse per second) is an electrical signal that the GNSS chip can accurately generate once per second, and the new sensor adopts this feature to synchronize the accelerometer data’s time with the GNSS time every second.
For the geospatial reference of the accelerometer data, the new sensor mounts the accelerometer with the X axis pointing towards the panel containing the button, the Y axis pointing perpendicular to the X axis, and the Z axis pointing vertically up (Figure 8). Therefore, the axial direction of the sensor needs to be parallel or vertical to the structural axis when installing it in the operational environment.

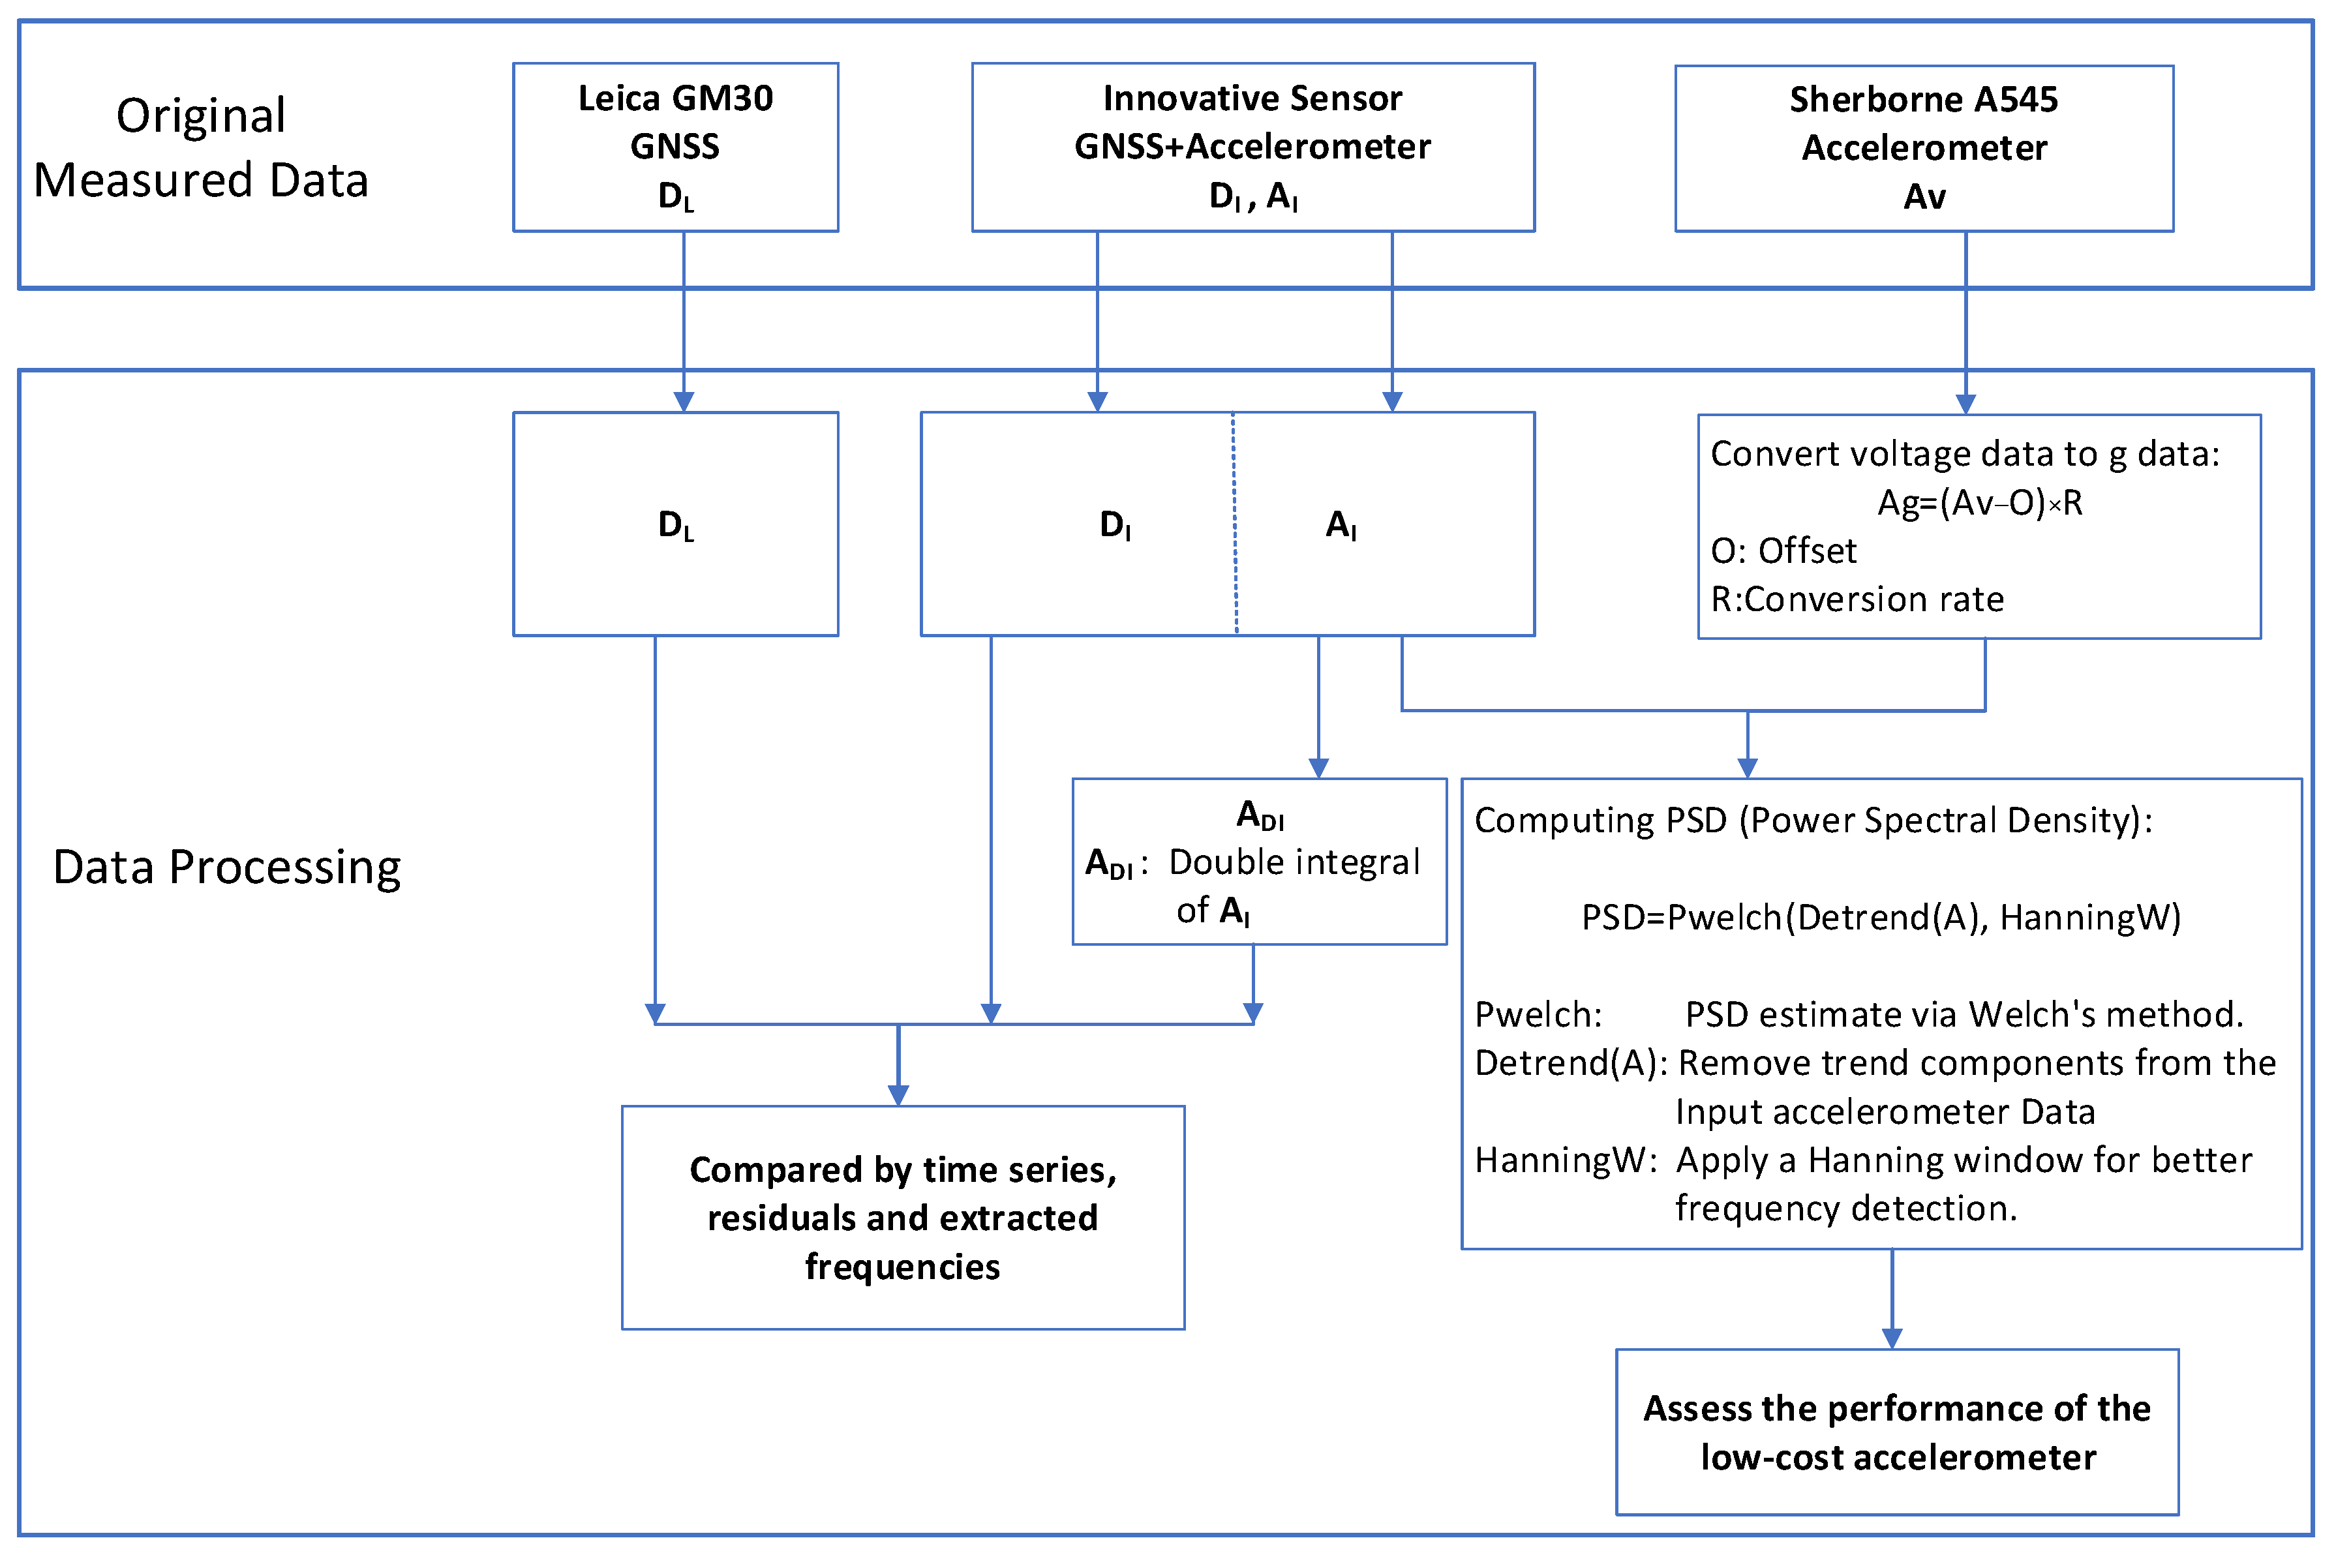
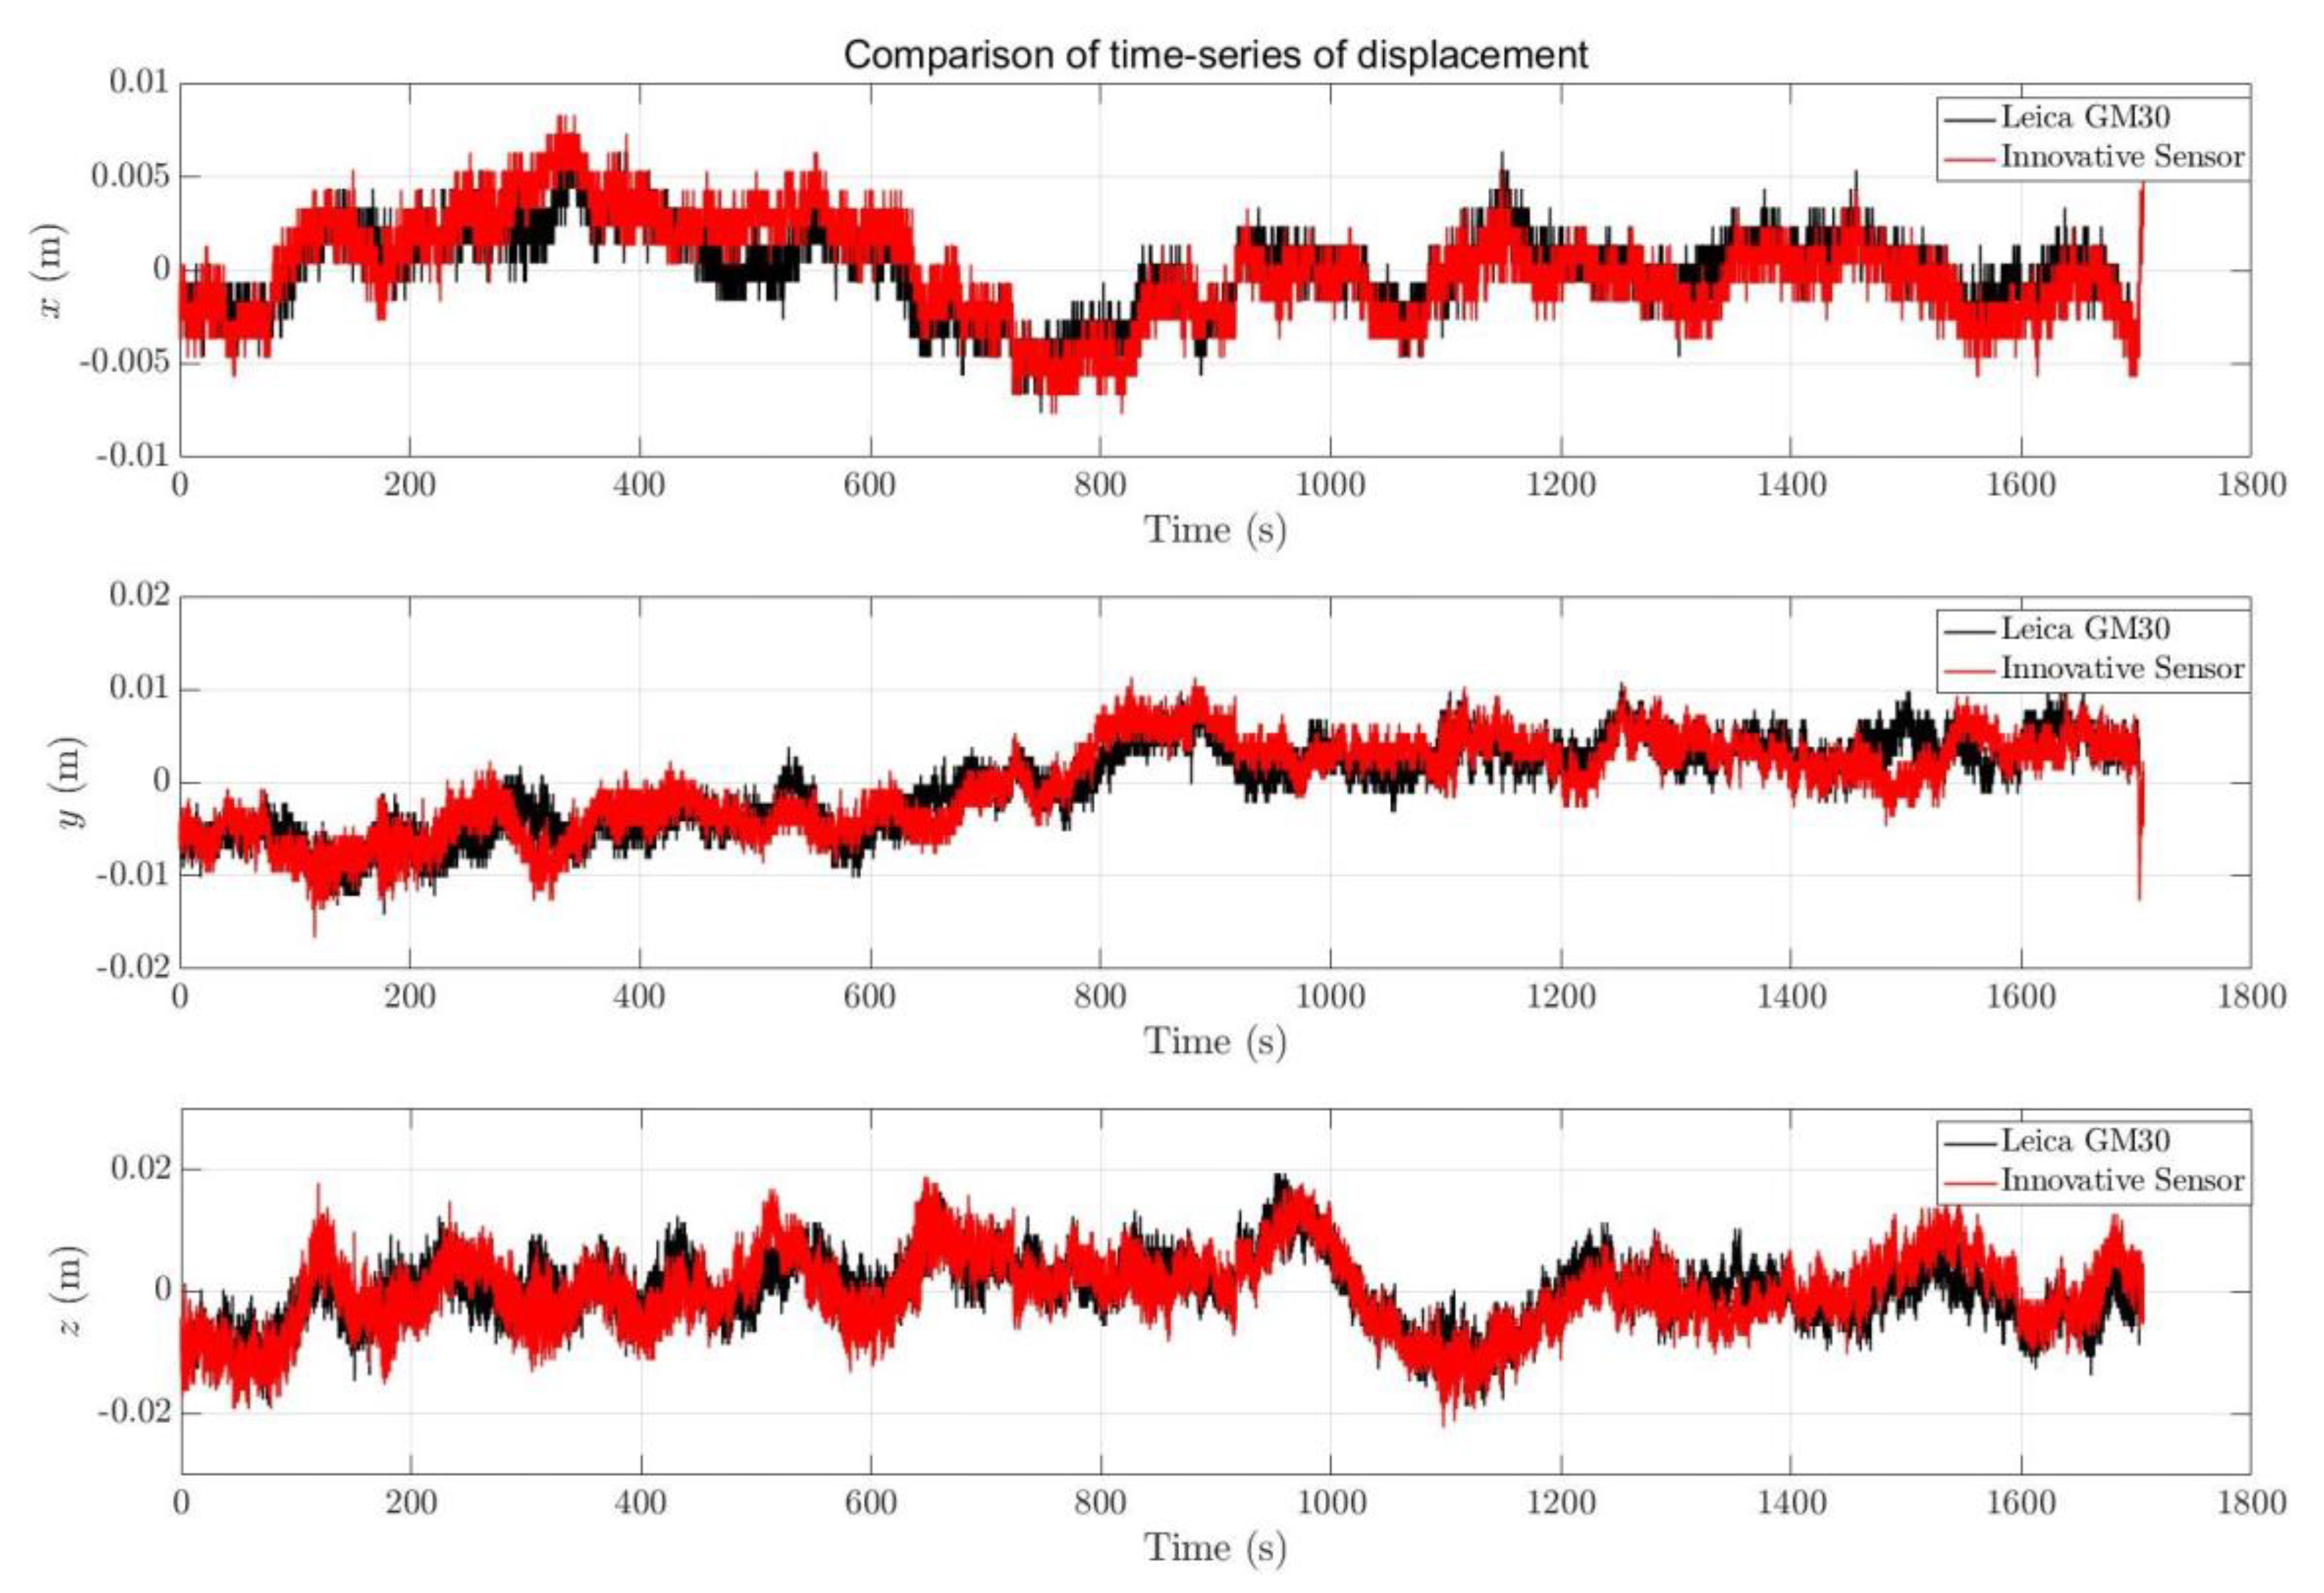
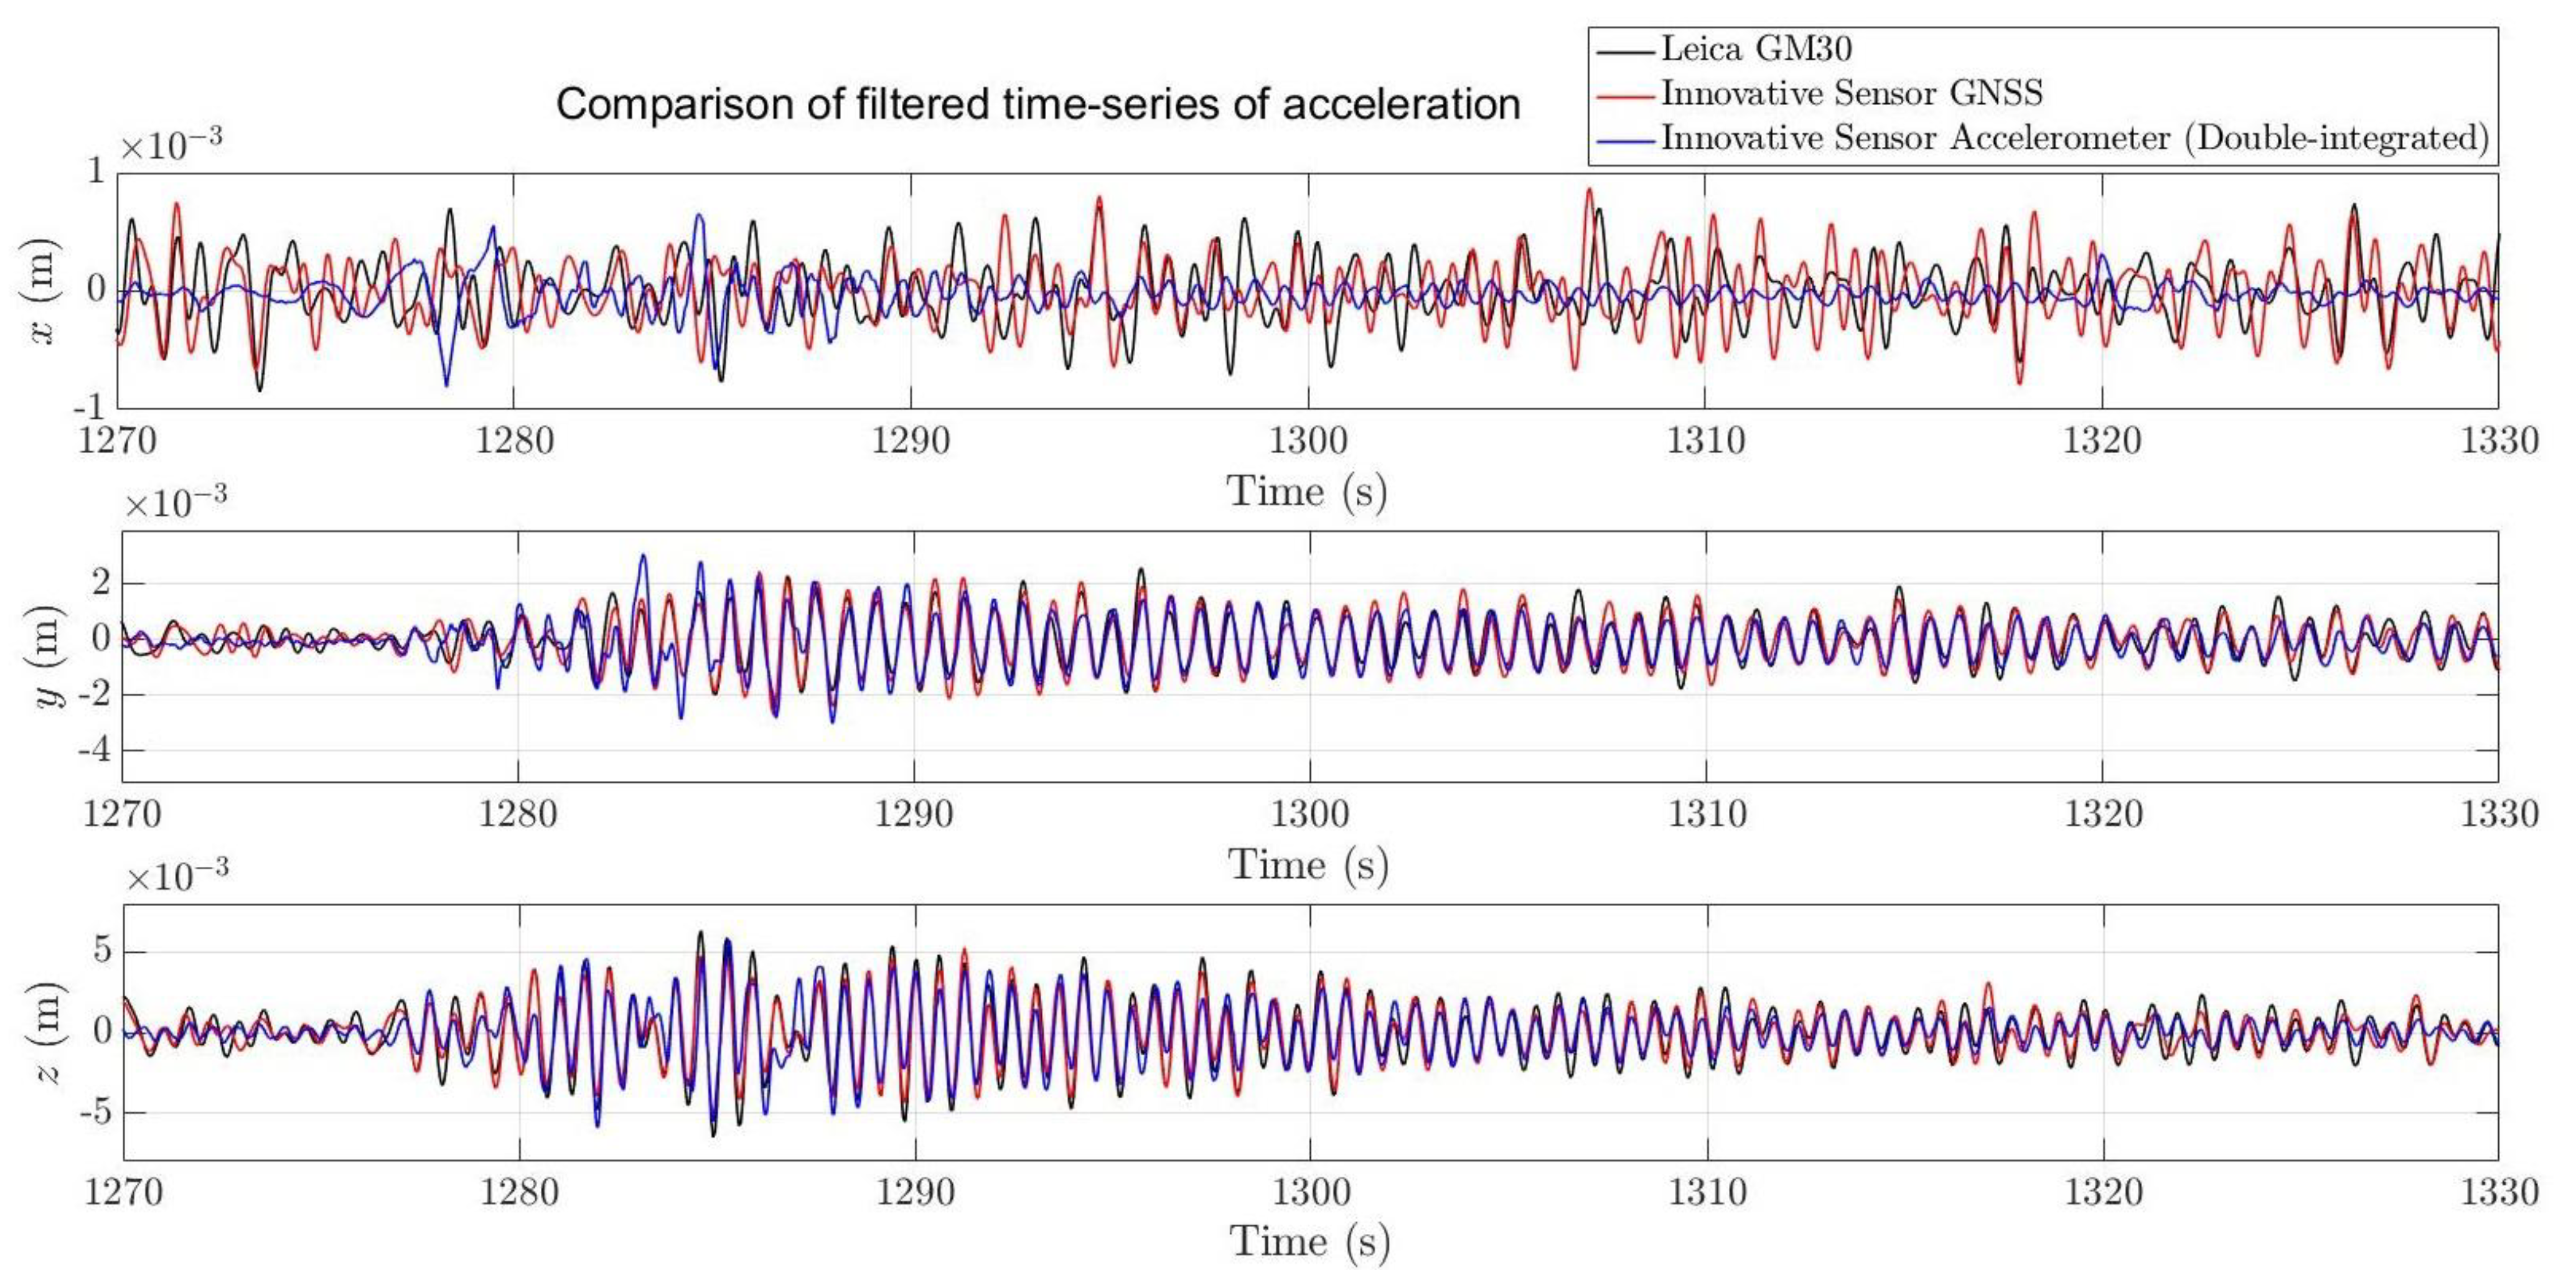
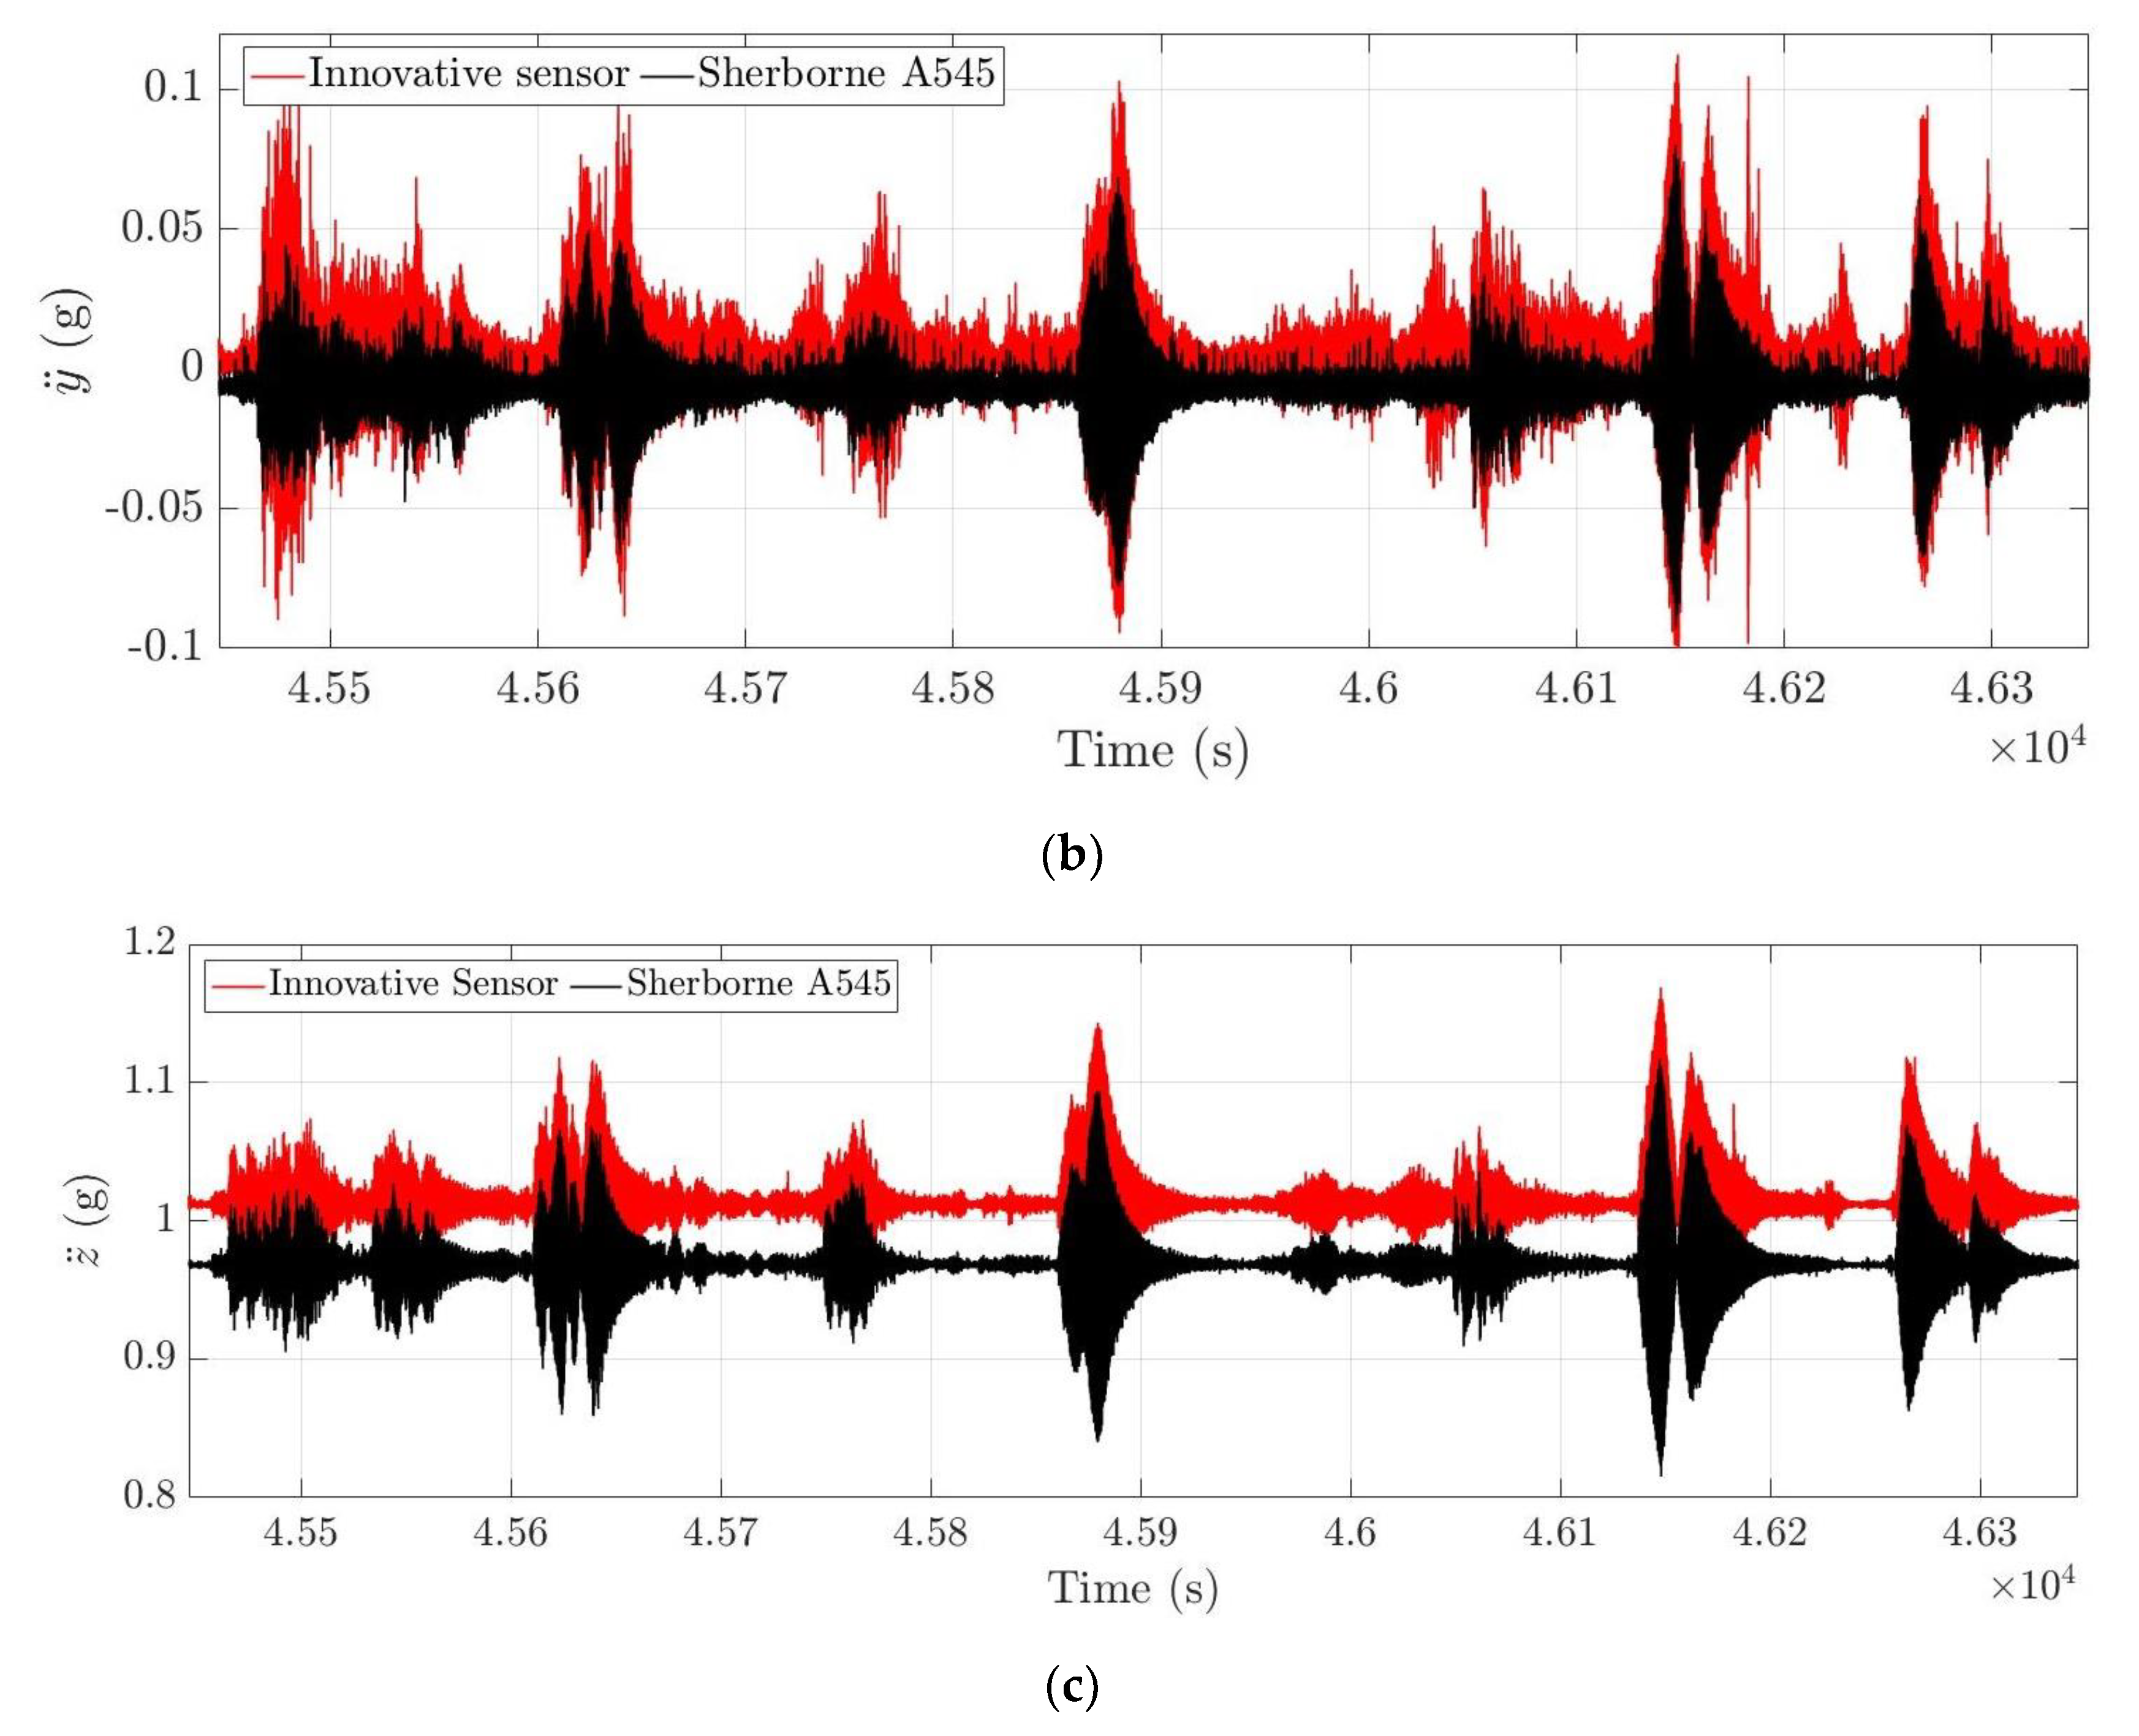
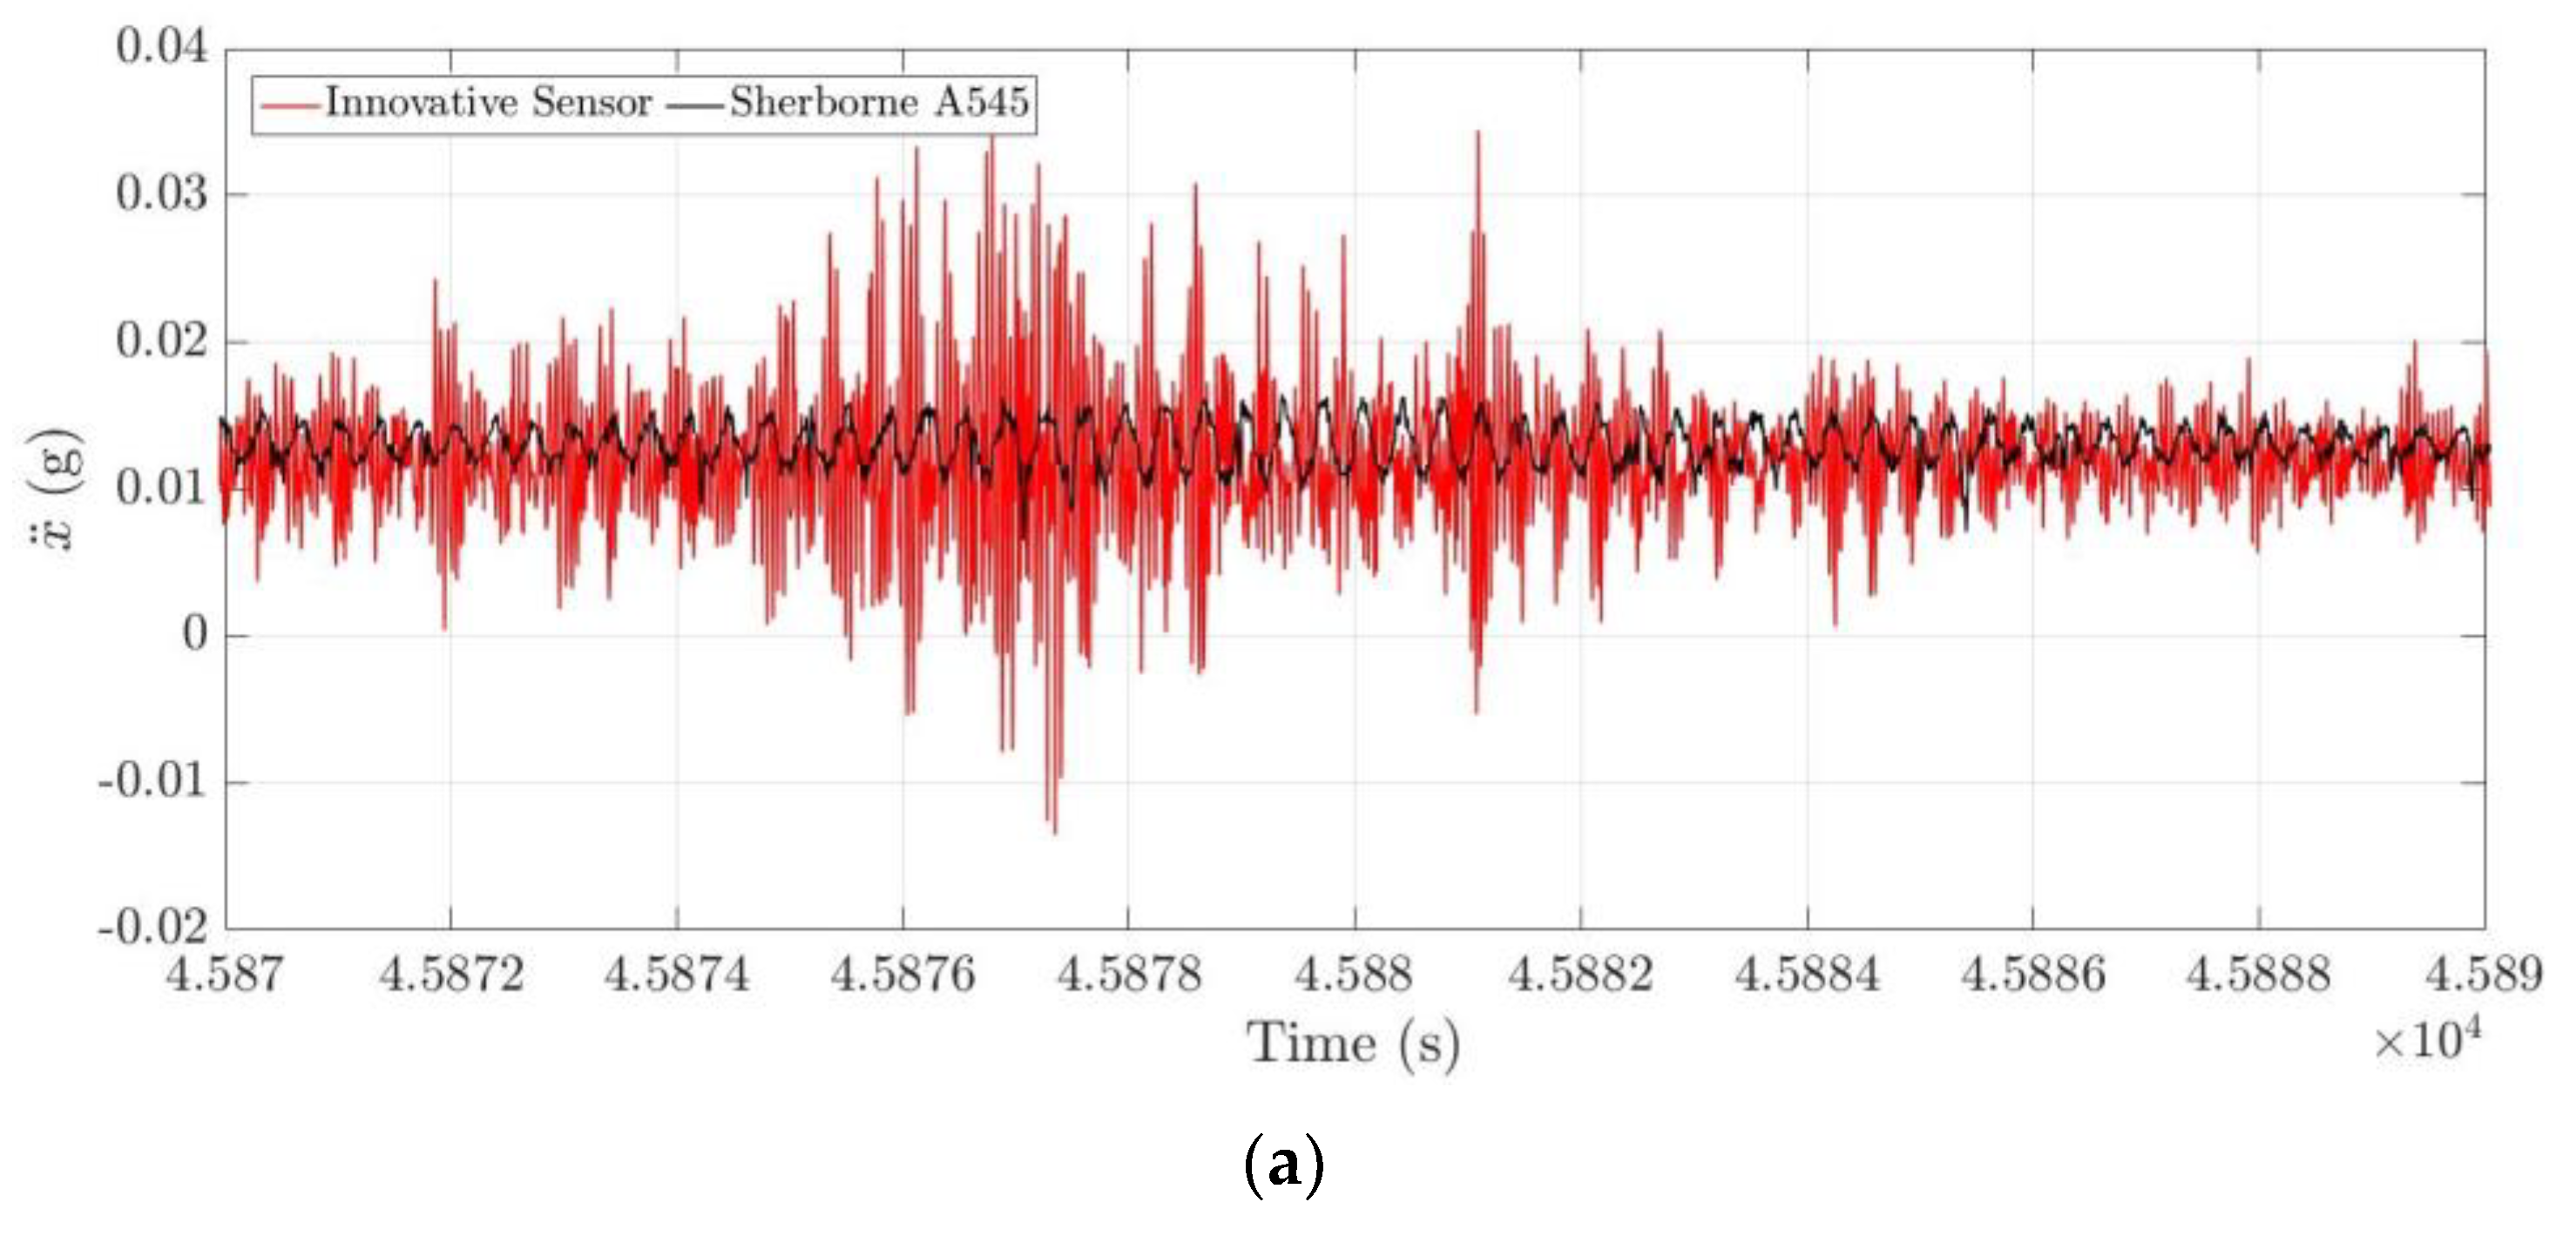
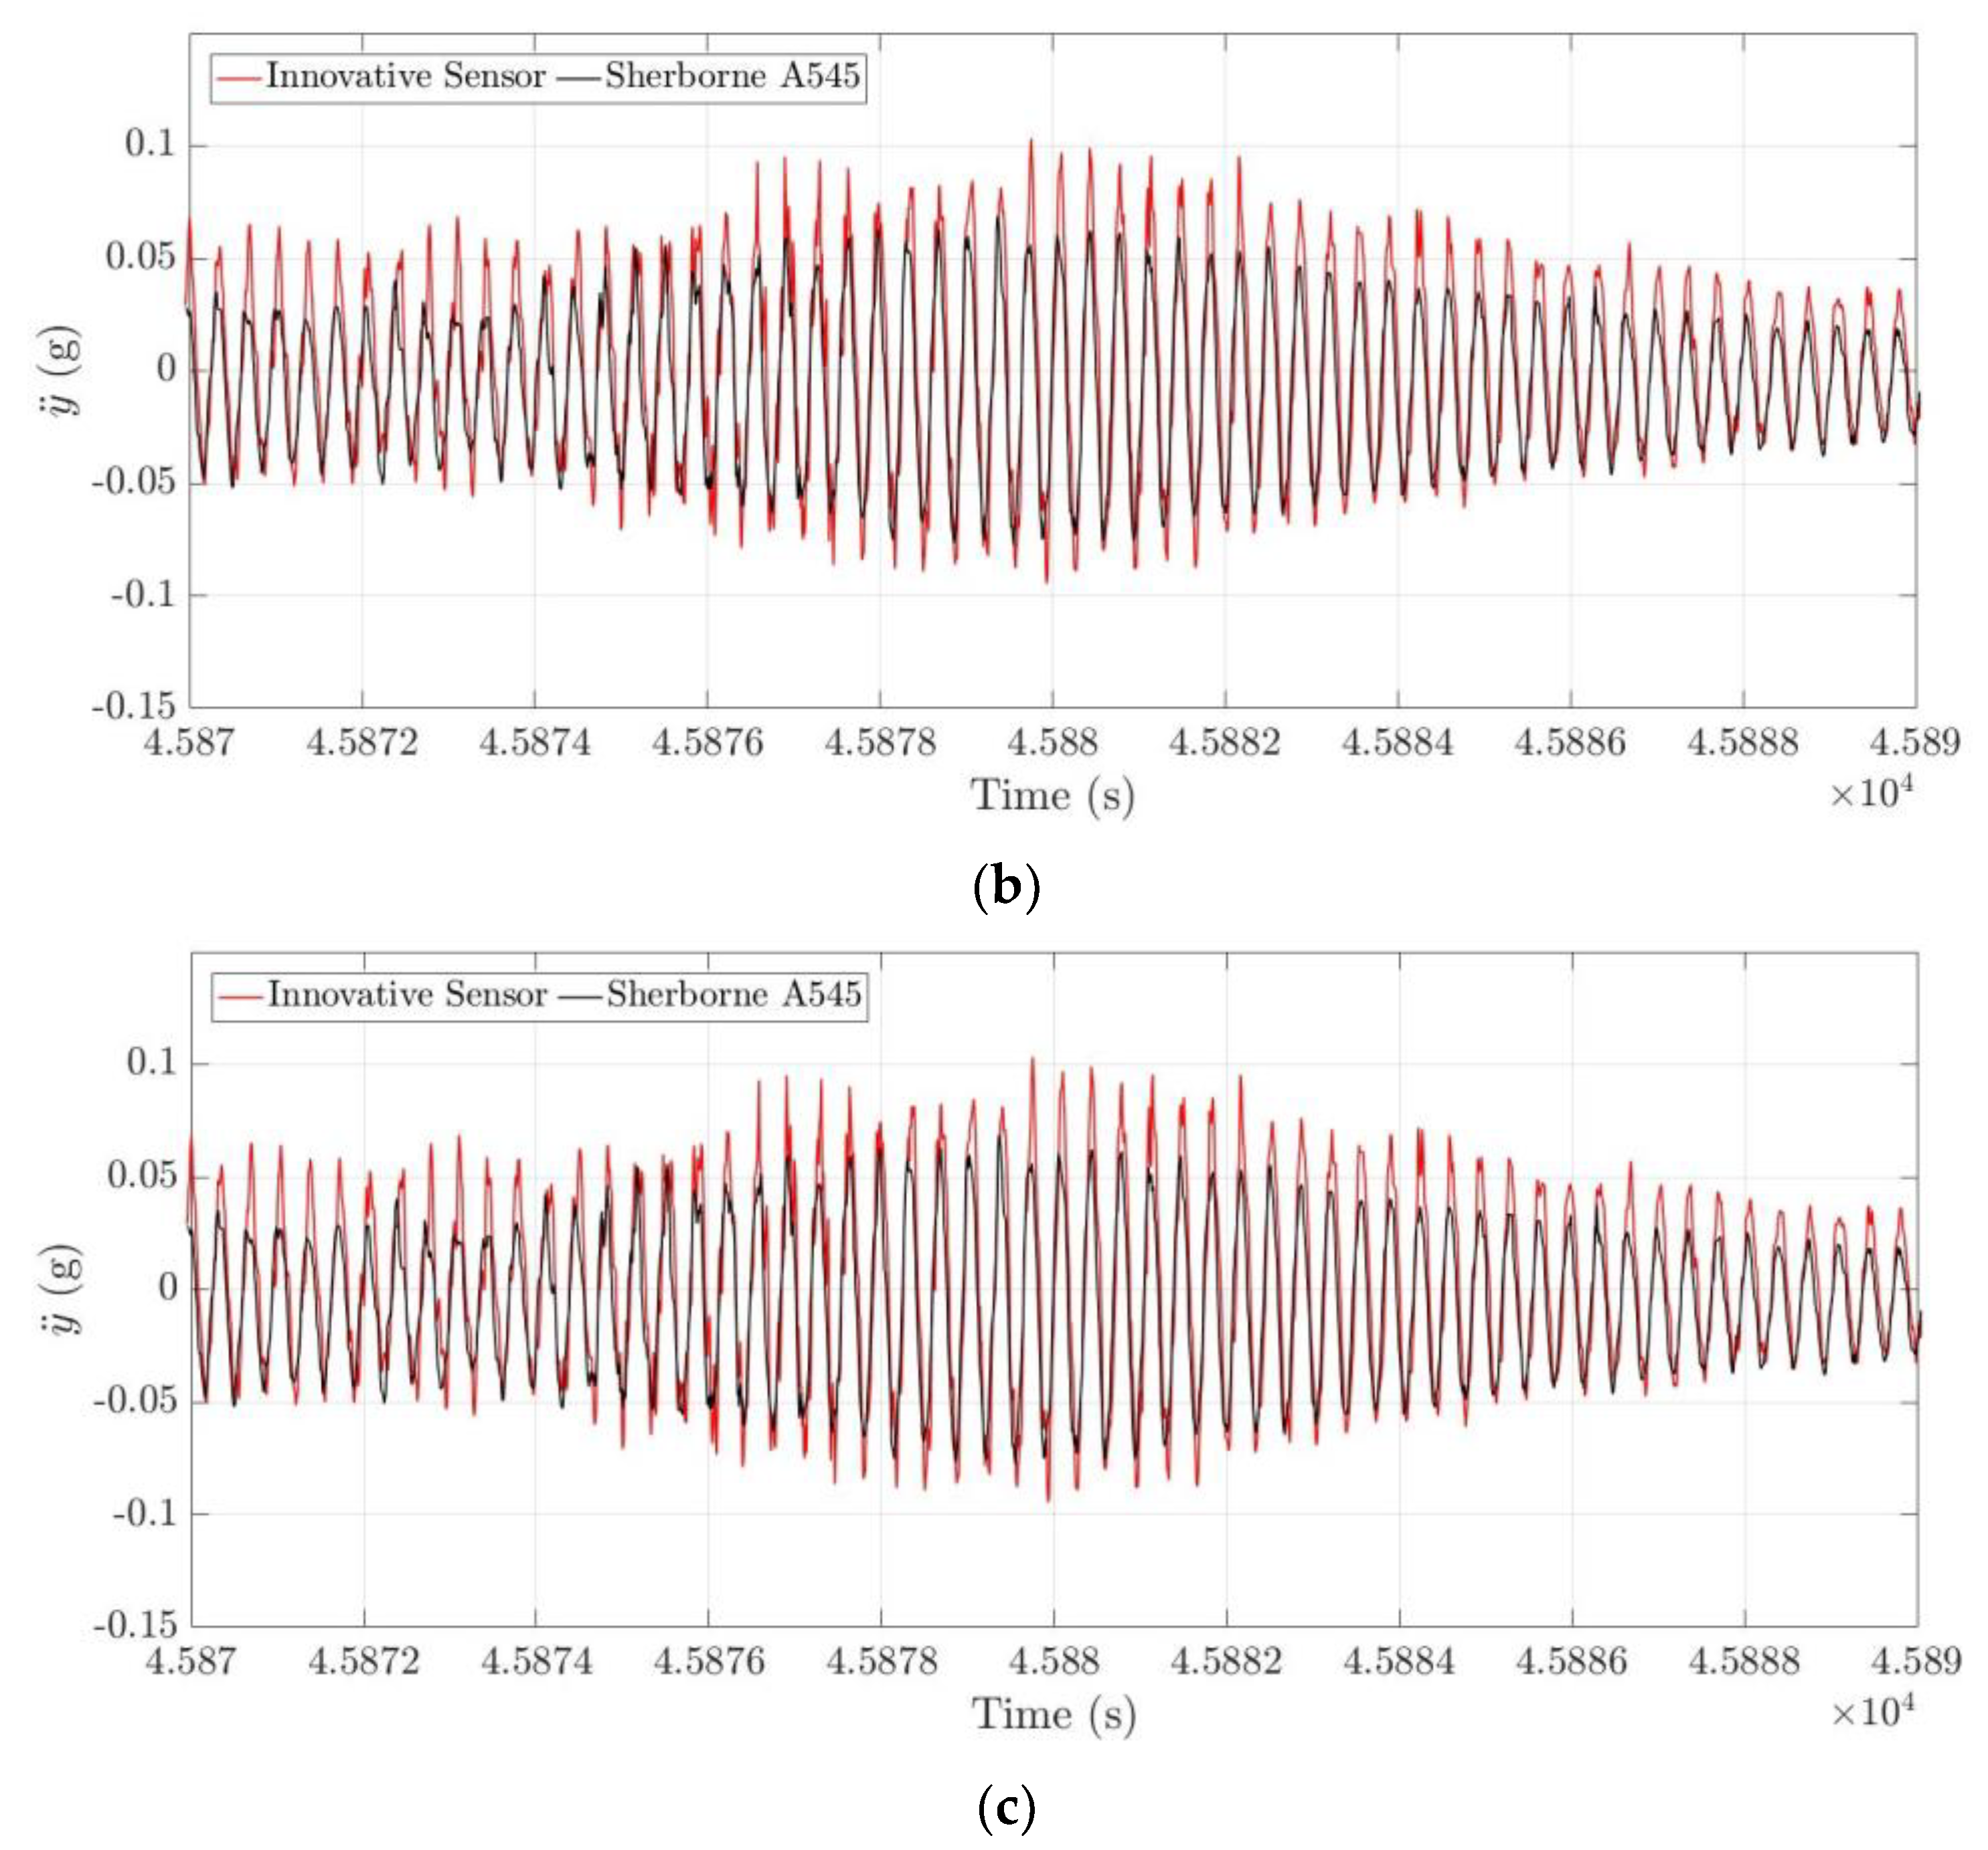
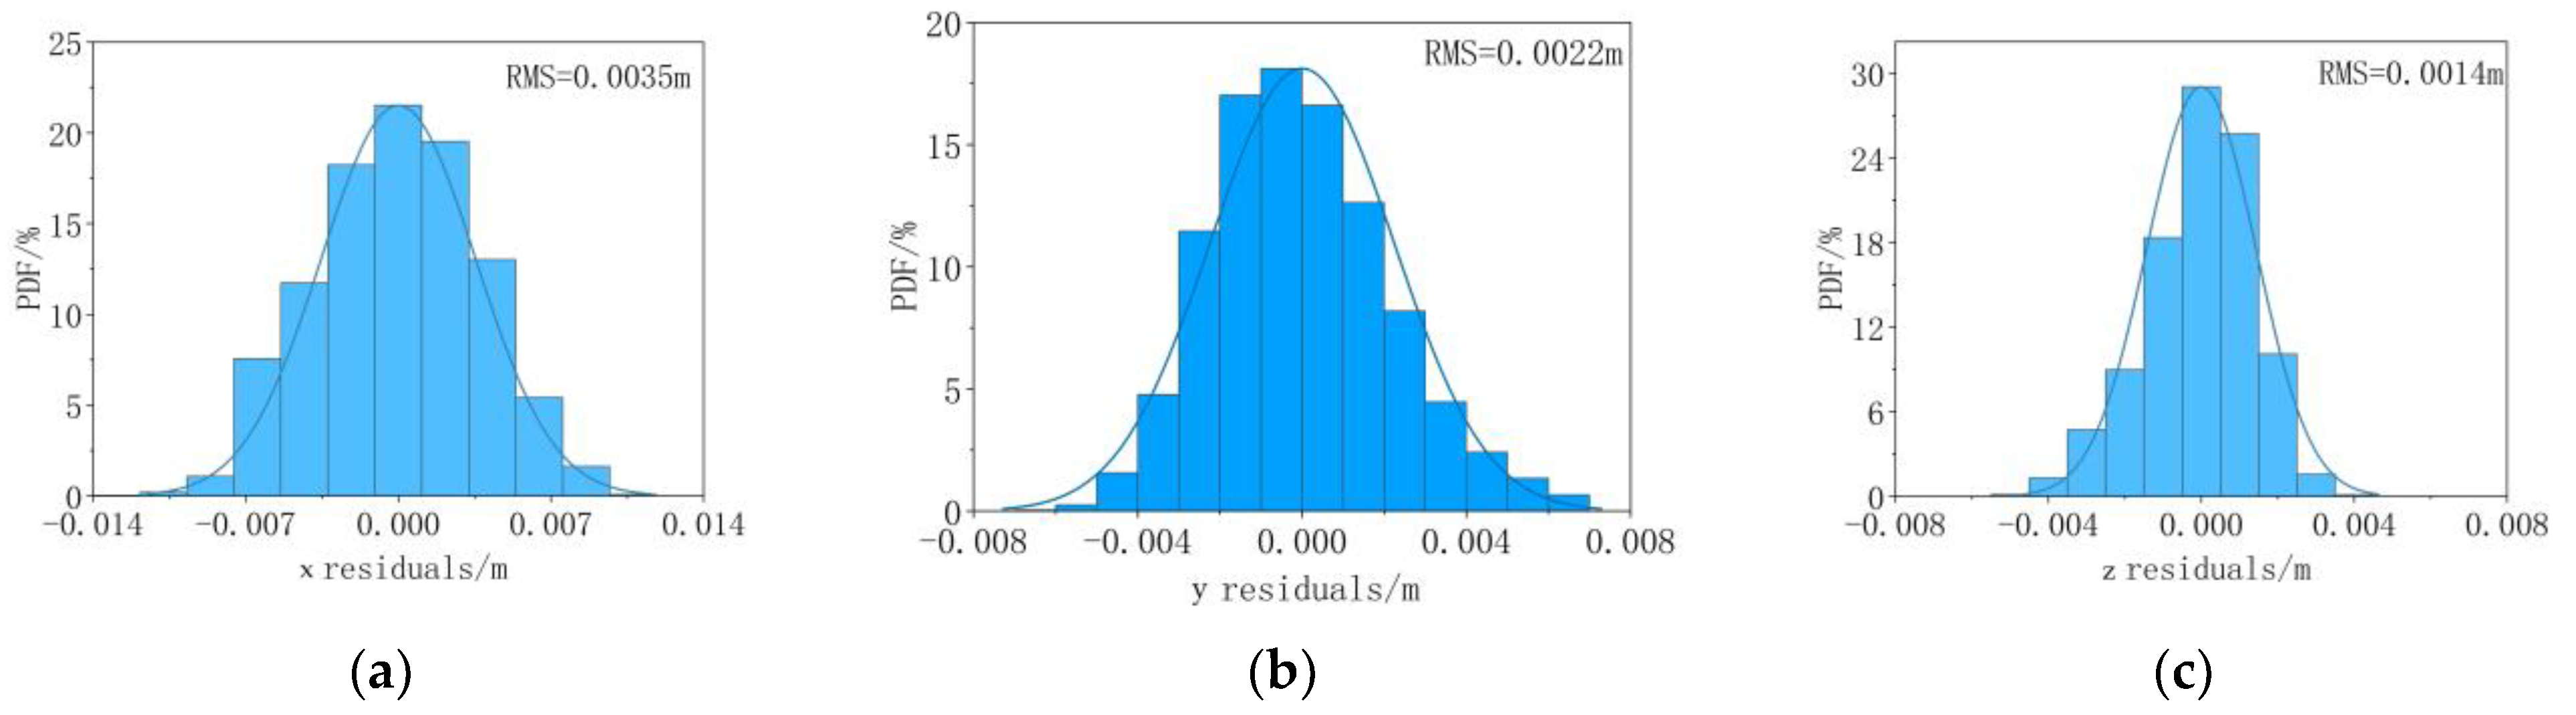
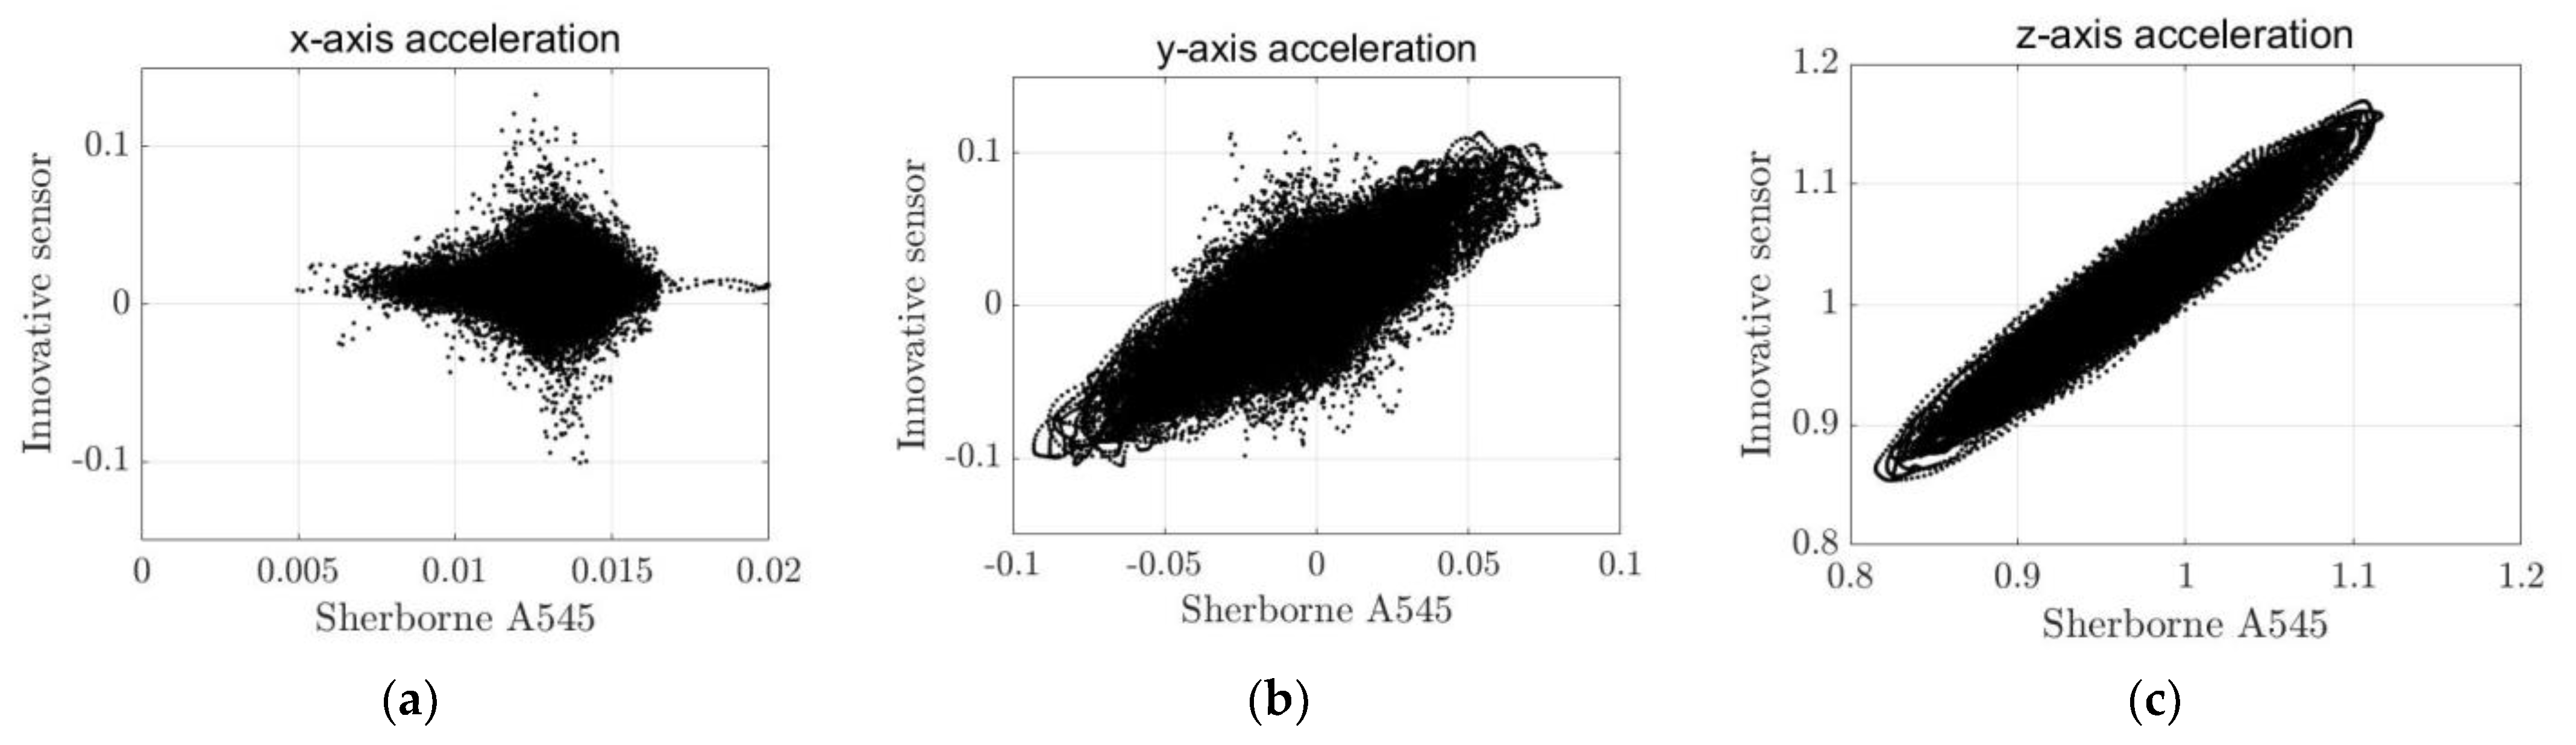
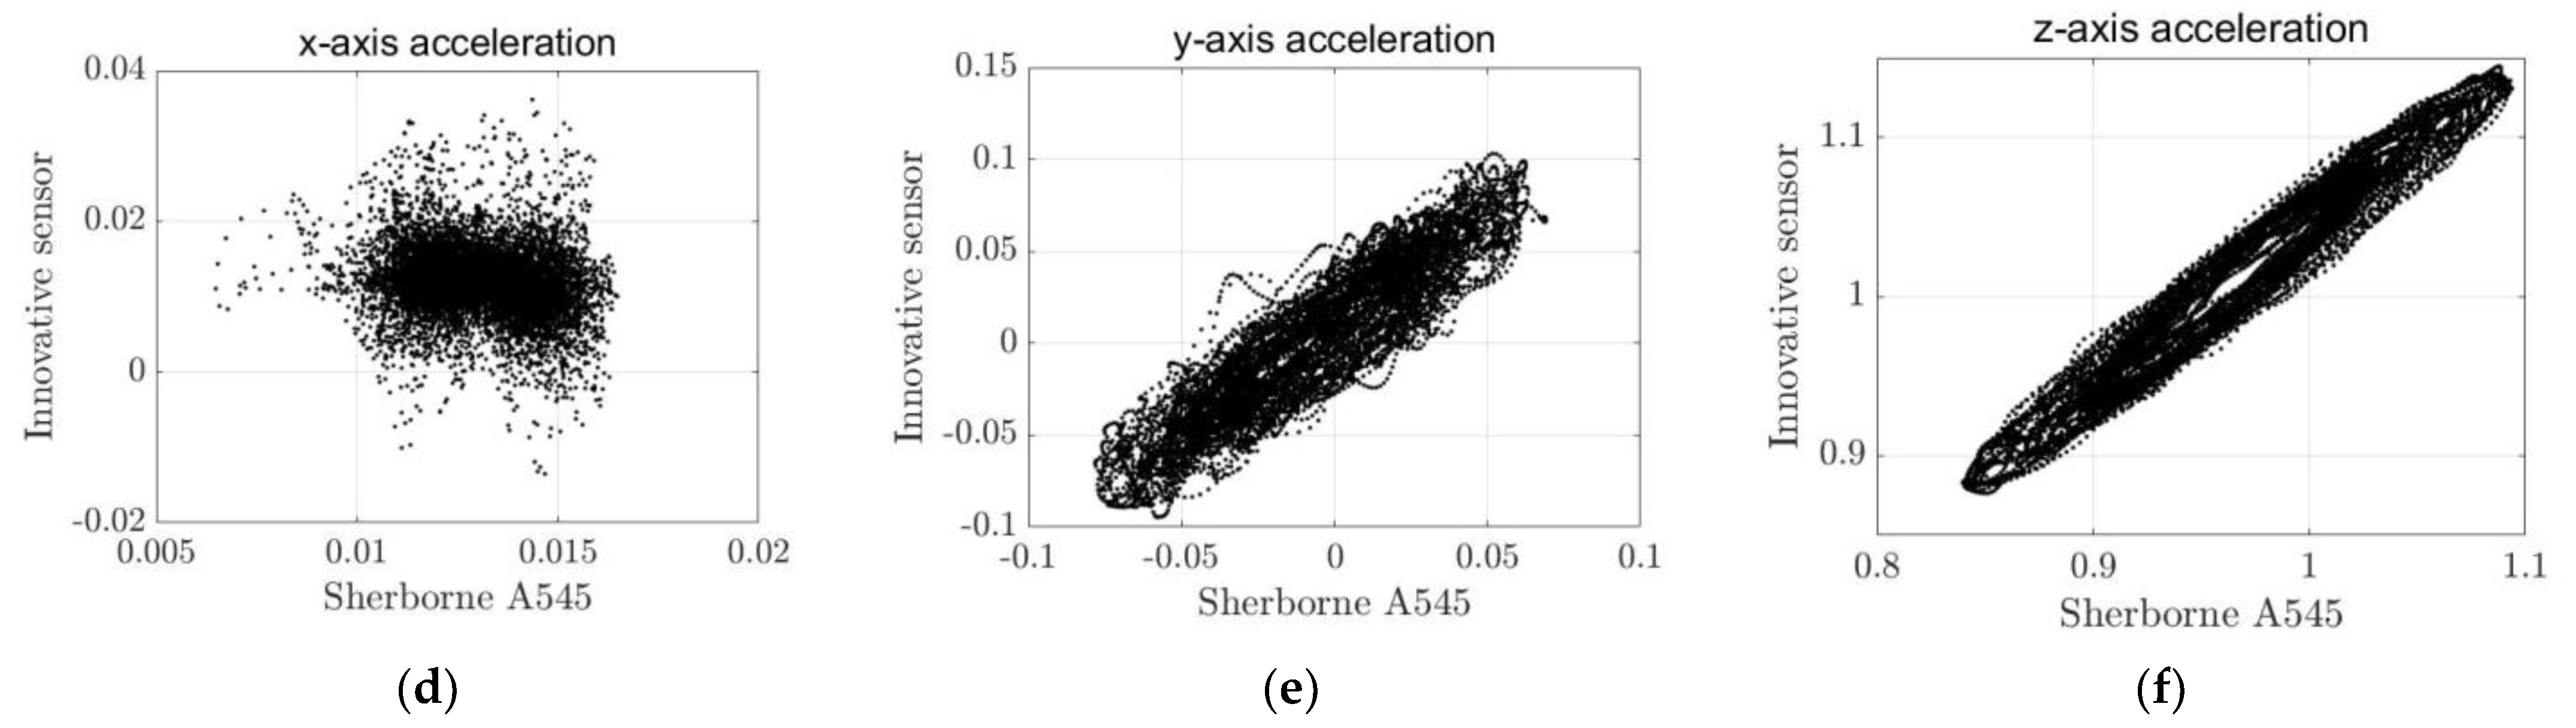
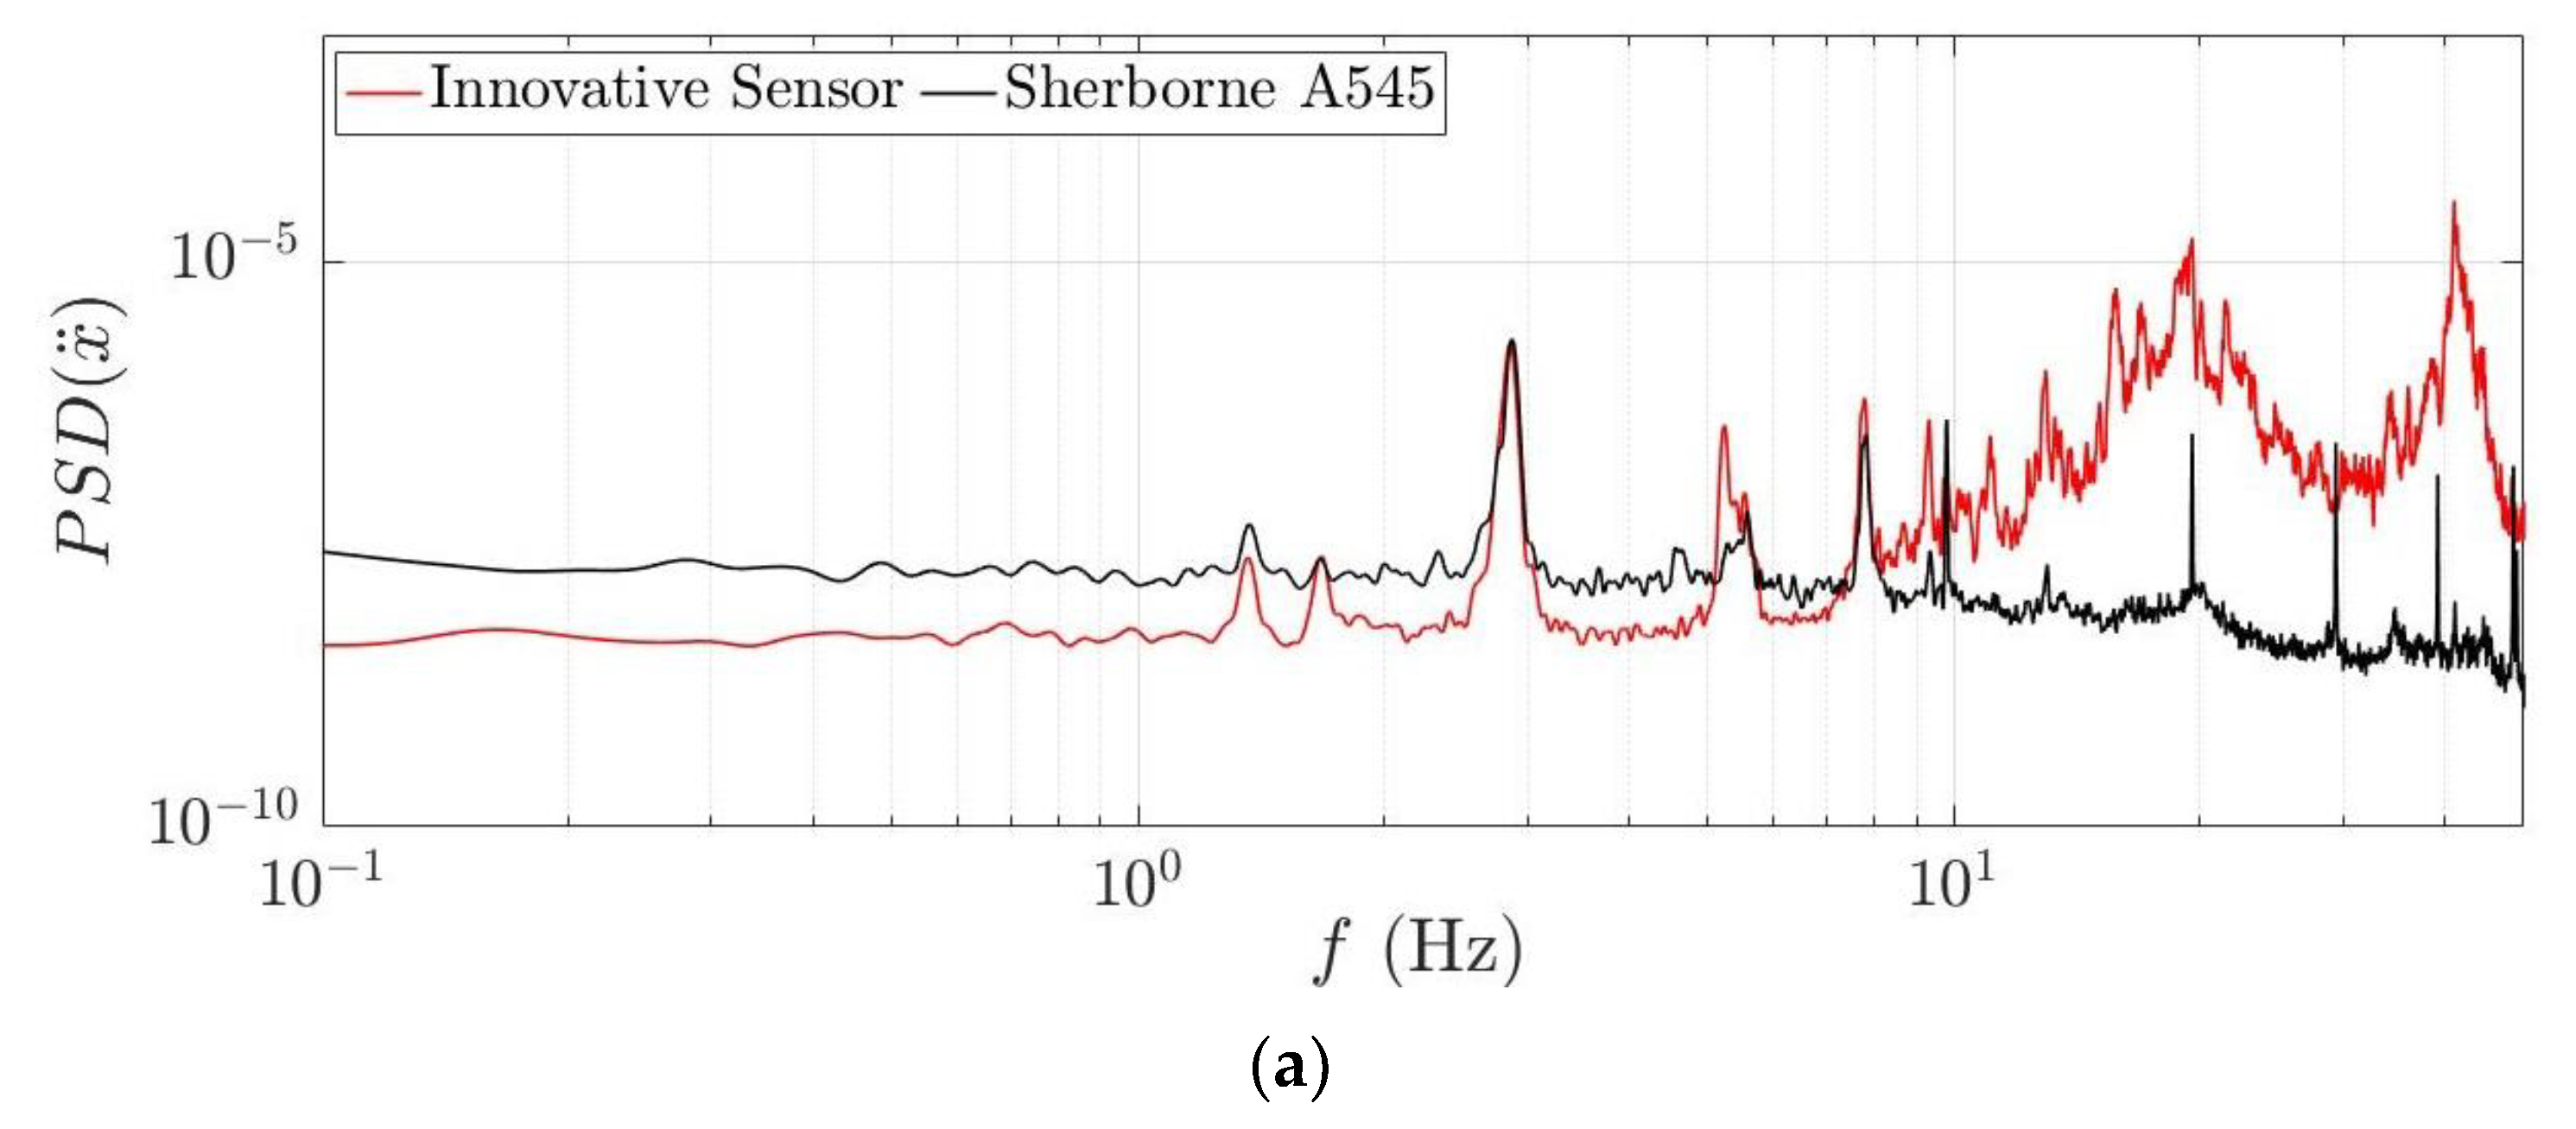
3.3. Data Processing and Analysis

All data should be analyzed on a unified geospatial reference which is the bridge coordinate system as shown in Figure 4. Figure 9 shows the flowchart of the procedure to process the data. Leica Geo Office (V7) was adopted to process the GNSS data collected from the Leica GM30 and the innovative sensor with RTK mode. MATLAB (R2016a) with developed code was employed to process the accelerometer data and assess the performance of the new sessor.
Figure 10 shows the time series of the two GNSS receivers’ positioning data which match very well with slight fluctuations. The displacement is small in the direction of the longitudinal axis of the bridge, while Y and Z directions are susceptible to traffic and wind loading with significant displacement. Figure 11 demonstrates the residual distribution between the two GNSS sensors. There is no apparent systematic deviation between them which indicates the great performance of the positioning accuracy for the innovative sensor.
Figure 12 shows the comparison of natural frequencies estimated by GNSS data from the innovative sensor and the Leica GM30 GNSS receiver. The agreements can be found in the x, y, and z directions. However, because of the low sampling rate and sensitivity limitation of GNSS, only one frequency source was extracted in the y and zdirections, and there was no apparent frequency detected in the xdirection.
To further analyze and assess the low-cost accelerometer data, high-order digital Butterworth filters were employed to process the GNSS and MEMS accelerometer data. The sampling frequency of the GNSS data is 10Hz, and that of the accelerometer data is 100 Hz. The normalized cutoff frequency for GNSS data is (0.1/10) Hz with the second order for the Butterworth filter, while the number is (0.8/100) Hz with the fifth order for the accelerometer data.
Figure 13 demonstrates the time series of the data from Leica GMS30, GNSS, and accelerometer data from the innovative sensor, which were filtered, detrended, and smoothed. It can be seen that the deformation matched well in y and z directions during the moment the bridge exhibited a significant dynamic response caused by human-induced excitation.
The low-cost MEMS accelerometer’s performance assessment is the key to this innovative sensor. The high-cost, high-quality Sherborne A545 accelerometer was applied for comparison. Figure 14 shows a comparison of the 20 min time histories of acceleration measured by the innovative sensor against those measured by the Sherborne A545. Unlike the x acceleration, good agreement in the y and z accelerations can be seen in Figure 14b,c. These agreements became very noticeable when the bridge exhibited a large dynamic response caused by human-induced excitation, which is illustrated in Figure 15b,c, showing a 20 s time series of acceleration along the y and z axes. This observation is expected since the large dynamic response of the bridge reduces the random effects of noise on the time histories of acceleration. The significant difference in the x-direction acceleration may be caused by the mechanical fitting of the innovative sensor. On site, the Sherborne A545 was installed at about 20 cm higher than the innovative sensor; this is thought to also have caused small offsets in the time histories of the y and z accelerations.
The agreement in the time histories of acceleration measured by the two sensors is visualized by the scatter plots in Figure 16 and quantitatively assessed by Pearson correlation coefficients and the R-squared values (based on a first-order linear fitting). As can be inferred from Table 6, 20 s time histories of y and z acceleration show higher correlation coefficients and R-squared values, indicating better agreement.
Comparing the estimated PSDs of acceleration measured by the two sensors, Figure 17 shows good agreement regarding the locations of spectral peaks of frequencies lower than 10 Hz, which are the measurements of the natural frequencies at the mid-span of the bridge. The frequencies collected from the x, y, and z directions at the mid-span are listed in Table 7 and there is no significant difference in extracted frequencies between the two types of accelerometers. It should be noted that the experiment only measured the frequency at the mid-span to assess the performance of the low-cost MEMS accelerometer and did not obtain the mode shapes of the structure.
There are obviously mismatched spectral peaks for frequencies higher than 10 Hz, especially for the x direction with weak motion. This demonstrates the limitations of the MEMS accelerometer, which has higher sensitivity and higher noise levels compared with the high-cost one. It can also be determined from Figure 14a that there is a significant data fluctuation in the weak motion in the x direction; however, the data’s consistency is relatively good in the y and z directions with high levels of vibration.

4. Discussion and Conclusions

This paper introduced an innovative sensor integrated with a GNSS chip and low-cost MEMS accelerometer. The delicate experiments considered were performed to assess the sensor’s performance. The high-quality Leica GM30 GNSS receiver and Sherborne A545 accelerometer were employed as compared devices. A suspension bridge in normal operation was adopted as the test bed.
For the GNSS performance assessment, the time series of the data and residuals distributions were analyzed and demonstrated. The results show no apparent systematic deviation between the data of the Leica GM30 and the innovative sensor. The agreement of the double-integrated accelerometer and GNSS data during the significant response also underlines the correctness of the time synchronization and geospatial reference of the low-cost MEMS accelerometer built into the innovative sensor.
For the accelerometer’s performance assessment, the agreement in time histories of acceleration measured by the two sensors is visualized by scatter plots and quantitatively assessed by Pearson correlation coefficients and R-squared values (based on a first-order linear fitting). Twenty-second time histories of y- and z-direction accelerations show higher agreement. The estimated PSDs were also calculated and compared by two sensors which showed a slight difference of less than 1% of the natural frequencies of the Wilford suspension bridge. However, the higher noise levels of low-cost MEMS accelerometers reduce their performance, making them less suitable for monitoring weak-motion structures.
Our innovative sensor was installed and is running well on the Forth Road Bridge in the UK and the Husutong Yangtze River Bridge, the Zhixi Yangtze River Bridge, etc., in China. To take full advantage of this sensor, some research was carried out by our team, such as using accelerometer data to detect GNSS gross errors and improve GNSS positioning accuracy [28]. It also should be pointed out that less research has been conducted on the stability of the low-cost MEMS accelerometer in an operational environment compared with the high-quality accelerometer. In future work, the team will continue to carry out more research about the complementarity between accelerometers and GNSS to improve positioning accuracy and reliability and reduce the structural health monitoring cost.

5. Patents

Patent application for this innovative integrated sensor has started with publication/announcement number CN113670183A.

Author Contributions

Conceptualization, X.M. and S.Z.; Data curation, D.T.N. and Y.X.; Formal analysis, D.T.N. and X.M.; Funding acquisition, X.M. and G.Y.; Methodology, D.T.N., Y.X., X.M. and S.Z.; Project administration, X.M.; Resources, G.Y.; Software, Y.X. and D.T.N.; Writing—original draft, Y.X.; Writing—review and editing, X.M., S.Z. and H.L. All authors have read and agreed to the published version of the manuscript.

Funding

This research was funded by the European Space Agency, grant number 4000108996/13/NL/US and 4000116646/16/NL/US.

Data Availability Statement

The data presented in this study are available on request from the corresponding author.

Acknowledgments

The authors thank the European Space Agency for their continuous sponsorship to both GeoSHM Feasibility and Demonstration projects from 2013. With the support of Guangzhou Geoelectron Technology Co., Ltd., the innovative sensor was manufactured and realized. Amey and Bear Scotland are both thankful for their further support to the exploitation of the GeoSHM achievements. The authors appreciate Craig Hancock at Loughborough University for the final proofreading of the paper.

Conflicts of Interest

The Author Dinh Tung Nguyen was employed by the RWDI UK Ltd. The Author George Ye was employed by the UbiPOS UK Ltd. The remaining authors declare that the research was conducted in the absence of any commercial or financial relationships that could be construed as a potential conflict of interest. The funders had no role in the design of the study; in the collection, analyses, or interpretation of data; in the writing of the manuscript; or in the decision to publish the results.

References

  1. Meng, X.; Roberts, G.; Dodson, A.; Brown, C. GNSS for bridge deformation: Limitations and solutions. In Proceedings of the Third International Conference on Bridge Maintenance, Safety and Management, Porto, Portugal, 16–19 July 2006. [Google Scholar]
  2. Yu, D.; Yang, Q.; University, C.A. The identification of structural loading response for long-span bridge by using GNSS time series. Technol. Econ. Areas Commun. 2013, 15. [Google Scholar] [CrossRef]
  3. Davarpanah, S.M.; Sharifzadeh, M.; Sattarvand, J.; Narimani, S. Evaluation of building displacement induced by epb tunneling through GPS-GNSS monitoring system and back analysis technique (tabriz subway twin tunnels). Civ. Eng. J. 2016, 2, 270–285. [Google Scholar] [CrossRef]
  4. Barzaghi, R.; Cazzaniga, N.; Pinto, L.; Tornatore, V. GNSS methods in dam monitoring: Case studies and future perspectives. In Proceedings of the 3rd Joint International Symposium on Deformation Monitoring (JISDM), Vienna, Austria, 30 March–1 April 2016; AUT: Vienna, Austria, 2016. [Google Scholar]
  5. Shen, N.; Chen, L.; Liu, J.B.; Wang, L.; Tao, T.Y.; Wu, D.W.; Chen, R.Z. A review of Global Navigation Satellite System (GNSS)-based dynamic monitoring technologies for structural health monitoring. Remote Sens. 2019, 11, 1001. [Google Scholar] [CrossRef]
  6. Moschas, F.; Stiros, S. Dynamic deflections of a stiff footbridge using 100-Hz GNSS and accelerometer data. J. Surv. Eng. 2015, 141, 04015003. [Google Scholar] [CrossRef]
  7. Msaewe, H.A.; Psimoulis, P.A.; Hancock, C.M.; Roberts, G.W.; Bonenberg, L. Monitoring the response of Severn Suspension Bridge in the United Kingdom using multi-GNSS measurements. Struct. Control. Health Monit. 2021, 28, e2830. [Google Scholar] [CrossRef]
  8. Gaxiola-Camacho, J.R.; Bennett, R.; Guzman-Acevedo, G.M.; Gaxiola-Camacho, I.E. Structural evaluation of dynamic and semi-static displacements of the Juarez Bridge using GPS technology. Measurement 2017, 110, 146–153. [Google Scholar]
  9. Xi, R.J.; Chen, H.; Meng, X.L.; Jiang, W.P.; Chen, Q.S. Reliable dynamic monitoring of bridges with integrated GPS and BeiDou. J. Surv. Eng. 2018, 144, 04018008. [Google Scholar] [CrossRef]
  10. Yu, L.N.; Xiong, C.B.; Gao, Y.; Zhu, J.S. Combining GNSS and accelerometer measurements for evaluation of dynamic and semi-static characteristics of bridge structures. Meas. Sci. Technol. 2020, 31, 125102. [Google Scholar] [CrossRef]
  11. Jiang, W.; Liang, Y.; Yu, Z.; Xiao, Y.; Chen, Y.; Chen, Q. Progress and Thoughts on Application of Satellite Positioning Technology in Deformation Monitoring of Water Conservancy Projects. Geomat. Inf. Sci. Wuhan Univ. 2022, 47, 1625–1634. [Google Scholar]
  12. Mita, A.; Yokoi, I. Fiber Bragg grating accelerometer for structural health monitoring. In Proceedings of the Fifth International Conference on Motion and Vibration Control (MOVIC 2000), Sydney, Australia, 4–8 December 2000. [Google Scholar]
  13. Kaloop, M.R.; Wan, H.J. Stayed-cable bridge damage detection and localization based on accelerometer health monitoring measurements. Shock Vib. 2015, 2015, 102680. [Google Scholar] [CrossRef]
  14. Zhu, L.; Fu, Y.; Chow, R.; Spencer, B.F., Jr.; Park, J.W.; Mechitov, K. Development of a high-sensitivity wireless accelerometer for structural health monitoring. Sensors 2018, 18, 262. [Google Scholar] [CrossRef]
  15. Bedon, C.; Bergamo, E.; Izzi, M.; Noè, S. Prototyping and validation of MEMS accelerometers for structural health monitoring—The case study of the Pietratagliata cable-stayed bridge. J. Sens. Actuator Netw. 2018, 7, 30. [Google Scholar] [CrossRef]
  16. García, D.; Tcherniak, D. An experimental study on the data-driven structural health monitoring of large wind turbine blades using a single accelerometer and actuator. Mech. Syst. Signal Process. 2019, 127, 102–119. [Google Scholar] [CrossRef]
  17. Ponzo, F.C.; Ditommaso, R.; Auletta, G.; Ielpo, P. Numerical model calibration of a bridge by using inverse engineering: A case study. In International Conference on Experimental Vibration Analysis for Civil Engineering Structures; Springer: Cham, Switzerland, 2023; pp. 441–450. [Google Scholar]
  18. Ponzo, F.C.; Auletta, G.; Ielpo, P.; Ditommaso, R. DInSAR–SBAS satellite monitoring of infrastructures: How temperature affects the “Ponte della Musica” case study. J. Civ. Struct. Health Monit. 2024. [CrossRef]
  19. Murià-Vila, D.; Camargo, J.; Aldama, B.D.; Rodríguez, G.; Aguilar, L.A.; Ayala, M. Structural health monitoring of an instrumented building in Mexico with accelerometers and GPS sensors. In Proceedings of the 6th International Conference on Structural Health Monitoring of Intelligent Infrastructure, Hong Kong, China, 9–11 December 2013. [Google Scholar]
  20. Kim, K.; Sohn, H. Dynamic displacement estimation by fusing LDV and LiDAR measurements via smoothing based Kalman filtering. Mech. Syst. Signal Process. 2017, 82, 339–355. [Google Scholar] [CrossRef]
  21. Meng, X.; Dodson, A.H.; Roberts, G.W. Detecting bridge dynamics with GPS and triaxial accelerometers. Eng. Struct. 2007, 29, 3178–3184. [Google Scholar] [CrossRef]
  22. Bogusz, J.; Figurski, M.; Nykiel, G.; Szolucha, M.; Wrona, M. GNSS-based multi-sensor system for structural monitoring applications. J. Appl. Geod. 2012, 6, 55–64. [Google Scholar] [CrossRef]
  23. Teunissen, P. Experimental evaluation of smartphone accelerometer and low-cost dual frequency GNSS sensors for deformation monitoring. Sensors 2021, 21, 7946. [Google Scholar]
  24. Geng, J.; Bock, Y.; Melgar, D.; Crowell, B.W.; Haase, J.S. A new seismogeodetic approach applied to GPS and accelerometer observations of the 2012 brawley seismic swarm: Implications for earthquake early warning. Geochem. Geophys. Geosystems 2013, 14, 2124–2142. [Google Scholar] [CrossRef]
  25. Xiong, C.; Lu, H.; Zhu, J. Operational modal analysis of bridge structures with data from GNSS/accelerometer measurements. Sensors 2017, 17, 436. [Google Scholar] [CrossRef]
  26. Xin, S.; Geng, J.; Zeng, R.; Zhang, Q.; Wang, T. In-situ real-time seismogeodesy by integrating multi-GNSS and accelerometers. Measurement 2021, 179, 109453. [Google Scholar] [CrossRef]
  27. Cina, A.; Manzino, A.M.; Bendea, I.H. Improving GNSS Landslide Monitoring with the Use of Low-Cost MEMS Accelerometers. Appl. Sci. 2019, 9, 5075. [Google Scholar] [CrossRef]
  28. Hu, L.; Bao, Y.; Sun, Z.; Meng, X.; Tang, C.; Zhang, D. Outlier Detection Based on Nelder-Mead Simplex Robust Kalman Filtering for Trustworthy Bridge Structural Health Monitoring. Remote Sens. 2023, 15, 2385. [Google Scholar] [CrossRef]
  29. Benedetti, E.; Dermanis, A.; Crespi, M. On the feasibility to integrate low-cost mems accelerometers and GNSS receivers. Adv. Space Res. 2017, 59, 2764–2778. [Google Scholar] [CrossRef]
Figure 1. The appearance of the integrated sensor: (a) the side view of the sensor; (b) the button view of the sensor; (c) the top view for the sensor.
Remotesensing 16 00607 g001
Figure 2. The main measurement unit of the sensor. (a) GNSS chip—Novatel (OEM729) board; (b) MEMS accelerometer—ADXL355.
Remotesensing 16 00607 g002
Figure 3. Wilford Suspension Bridge located at Nottingham.
Remotesensing 16 00607 g003
Figure 4. The installation diagram of the sensors for the Wilford Suspension Bridge.
Remotesensing 16 00607 g004
Figure 5. The location of the integrated sensor and Leica GM30 antenna.
Remotesensing 16 00607 g005
Figure 6. The location of the integrated sensor, accelerometer box, and power box.
Remotesensing 16 00607 g006
Figure 7. Leica Viva SmartStation with integrated GNSS installed as reference station.
Remotesensing 16 00607 g007
Figure 8. Accelerometer axis direction in the innovative sensor box.
Remotesensing 16 00607 g008
Figure 9. Flowchart of the data processing.
Remotesensing 16 00607 g009
Figure 10. Comparison of original time series of displacement.
Remotesensing 16 00607 g010
Figure 11. Histograms of the residuals between Leica GM30 and innovative sensor. (a) residuals of x direction. (b) residuals of y direction. (c) residuals of z direction.
Remotesensing 16 00607 g011
Figure 12. Comparison of natural frequencies estimated from GNSS data by the innovative sensor and Leica GM30 in the x, y, and z directions.
Remotesensing 16 00607 g012
Figure 13. Comparison of filtered time series of acceleration with x, y, and z directions.
Remotesensing 16 00607 g013
Figure 14. Comparison of time histories of acceleration measured by innovative sensor and Sherborne A545 accelerometers: (a) x axis; (b) y axis; (c) z axis.
Remotesensing 16 00607 g014aRemotesensing 16 00607 g014b
Figure 15. Comparison of 20 s time histories of acceleration measured by innovative sensor and Sherborne A545 accelerometers: (a) x axis; (b) y axis; (c) z axis.
Remotesensing 16 00607 g015aRemotesensing 16 00607 g015b
Figure 16. Scatter plots of the acceleration measured by the innovative sensor and Sherborne A545 accelerometers: 20 min time histories (ac) and 20 s time histories (df).
Remotesensing 16 00607 g016aRemotesensing 16 00607 g016b
Figure 17. Comparison of estimated power spectral density of acceleration measured by the innovative sensor and Sherborne A545 accelerometers: (a) x axis, (b) y axis, and (c) z axis.
Remotesensing 16 00607 g017aRemotesensing 16 00607 g017b
Table 1. The accuracy of the different GNSS positioning models.
Positioning ModelResponse TimePlane Accuracy/mmElevation Accuracy/mm
Static differentialNear real time ± ( 0.5 ~ 1 ) ± ( 1 ~ 3 )
RTKReal time ± ( 5 ~ 10 ) ± ( 10 ~ 20 )
NRTKReal time ± ( 20 ~ 30 ) ± ( 30 ~ 40 )
PPPReal time ± ( 30 ~ 50 ) ± ( 50 ~ 100 )
PPP–RTKReal time ± ( 30 ~ 50 ) ± ( 50 ~ 100 )
Table 2. Novatel OEM729 multi-frequency GNSS receiver parameters.
ParameterItemComments
Signal TrackingGPSL1 C/A, L1C, L2C, L2P, L5
GLONASSL1, L2, L3, L5
GalileoE1, E5 AltBOC, E5a, E5b, E6
BeiDouB1l, B1C, B2a, B2b, B2l, B3l
SBAS/QZSSL1 C/A, L1C, L2C, L5, LEX
Horizontal Position
(Accuracy—RMS)
Single Point L11.5 m
Single Point L1/L21.2 m
SBAS60 cm
DGPS (code)40 cm
RTK1 cm + 1 ppm
Table 3. ADXL355 accelerometer parameters.
ParameterTest Condition/CommentsTypical ValueUnit
Zero Offset±2 g (X, Y, and Z)±25mg
Sensitivity±2 g (X, Y, and Z)400mV/g
Sensitivity Change Due to Temperature−40 °C to +125 °C±0.01%/°C
Nonlinearity±2 g0.1%
Noise (Spectral Density)±2 g (X, Y, and Z)22.5 µ g / H z
Table 4. Key positioning parameters of Leica GM30.
RTK Positioning ModesReference Station
(Smoothed)
Monitoring
(Instantaneous)
Network RTK
(Instantaneous)
Single baseline (<30 km)Hz: 6 mm + 1 ppm
V: 10 mm + 1 ppm
Hz: 8 mm + 1 ppm
V: 15 mm + 1 ppm
Hz: 8 mm + 1 ppm
V: 15 mm + 1 ppm
Network RTKHz: 6 mm + 1 ppm
V: 10 mm + 1 ppm
Hz: 8 mm + 1 ppm
V: 15 mm + 1 ppm
Hz: 8 mm + 1 ppm
V: 15 mm + 1 ppm
Table 5. Key parameters of the accelerometer with temperature at 25 °C (Sherborne A545).
ParameterValue
Zero Offset≤±2 mV
Nonlinearity≤±0.5% FRO
Hysteresis≤0.02% FRO
Resolution≤0.0005% FRO
Damping Ratio0.7 (±0.2)
Noise Output10 µV (rms) max
Table 6. Summary of the Pearson correlation coefficients and R-squared values.
AxisPearson Correlation CoefficientsR-Squared Values
20 min Data20 s Data20 min Data20 s Data
X−0.0098−0.190.0000920.0038
Y0.730.910.540.84
Z0.920.980.840.95
Table 7. Comparison of mid-span natural frequencies estimated by the innovative sensor and Sherborne A545 accelerometers.
Sherborne A545Innovative SensorDifference (%)
1.3691.3640.37%
1.6751.6800.30%
2.3242.3150.39%
2.4172.4080.37%
2.8732.8610.42%
4.5674.5550.26%
5.2835.2330.95%
5.5835.5420.73%
7.8057.7750.38%
9.3549.3230.33%
11.1411.10.36%
11.7111.650.51%
Disclaimer/Publisher’s Note: The statements, opinions and data contained in all publications are solely those of the individual author(s) and contributor(s) and not of MDPI and/or the editor(s). MDPI and/or the editor(s) disclaim responsibility for any injury to people or property resulting from any ideas, methods, instructions or products referred to in the content.

