Article

Evaluating the Dynamics of Groundwater Storage and Its Sustainability in the Loess Plateau: The Integrated Impacts of Climate Change and Human Activities

Key Laboratory of Western China’s Environmental System (Ministry of Education), College of Earth and Environmental Sciences, Lanzhou University, 222 South Tianshui Road, Lanzhou 730000, China
*
Author to whom correspondence should be addressed.
Remote Sens. 2024, 16(23), 4375; https://doi.org/10.3390/rs16234375
Submission received: 21 October 2024 / Revised: 19 November 2024 / Accepted: 21 November 2024 / Published: 23 November 2024

Abstract

:
In recent decades, the Loess Plateau has undergone rapid urbanization alongside extensive afforestation efforts aimed at controlling soil erosion. These large-scale land use changes have inevitably affected the region’s hydrological cycle. Despite these changes, the impact on groundwater has not been thoroughly investigated. This study aims to examine the spatial and temporal evolution of groundwater storage (GWS) in the Loess Plateau from 2003 to 2022, identify the driving factors behind these changes, and evaluate the sustainability of groundwater levels through the Reliability–Resilience–Vulnerability framework. GWS changes were estimated using GRACE gravity satellite data and the Global Land Assimilation Dataset (GLDAS). Our study also analyzed the drivers of GWS evolution by integrating land use change data, ERA5-Land reanalysis data, and various statistical data. Our findings indicate a decline in GWS at a rate of −6.9 ± 3.84 mm/yr. Seasonal variations show that the GWS is relatively higher in spring and autumn, but lower in summer and winter. The eastern part of the Loess Plateau in particular is experiencing a rate of decline that is 150% of that of the overall regional average. Groundwater storage in the Loess Plateau is currently at a critically unsustainable level, with conditions in the west being more favorable compared to the central and eastern regions. Climate factors such as precipitation, evaporation, and runoff did not show a significant correlation with GWS changes. Increases in forest areas and water consumption together explained 95.8% of the changes in GWS, with forest area growth being the dominant factor. Human activities are identified as the main cause of GWS decline. This study’s findings improve our understanding of GWS dynamics in the Loess Plateau and offer a scientific basis for formulating groundwater resource management and ecological restoration policies in the region.

Graphical Abstract

1. Introduction

Water resources are crucial to national economic and social development, especially in arid and semi-arid regions where they are considered a basic strategic resource, forming the backbone of sustainable socio-economic progress [1,2]. In recent years, with increasing economic development and population growth, groundwater resources have often been unsustainably overexploited, and many environmental and geological problems are arising in various countries and regions, which seriously influence human life and economic development [3,4]. The over-exploitation of groundwater has caused a decline in the groundwater table, which has given rise to land subsidence, seawater intrusion in coastal cities, the degradation of water quality, and other problems [5]. It is thus particularly important to understand the dynamic pattern of regional groundwater evolution and its driving forces for the effective management and sustainable utilization of groundwater resources [6,7].
To date, approaches to studying groundwater storage can be broadly categorized into two main types: direct and indirect methods. Direct methods involve techniques such as monitoring wells and hydrological modeling, while indirect methods primarily rely on gravity satellite data [8,9,10,11,12,13,14,15,16,17]. The advantage of using monitoring wells is that they provide the most direct and reliable data. However, their distribution is often limited by topographical and other objective factors, with most wells being located in plains and river valleys. As a result, this method is primarily applicable to monitoring the groundwater in flat areas [18]. However, in regions with a more complex topography, such as plateaus and mountainous areas, data from monitoring wells in valley regions often fail to fully capture the groundwater conditions across the entire plateau or mountain range, resulting in a limited representativeness. Hydrological models simulate groundwater through modeling, but they often require a large number of empirical parameters, which, along with the model structure, add to the uncertainty in groundwater simulation results [19]. Since the launch of the GRACE satellite in 2002, its observational data have introduced a new method for monitoring groundwater changes. GRACE monitors TWS by observing variations in the Earth’s gravitational field. It is important to note that GRACE does not directly measure GWS. Instead, researchers estimate GWS indirectly by combining TWS data from GRACE with supplementary datasets, such as those provided by the GLDAS. These additional datasets enable the isolation of components like surface water and soil moisture, facilitating the estimation of GWS. Many scholars, both domestic and international, have explored the combination of GRACE satellite data and GLDAS assimilation data from various perspectives. In practice, the computed results are further verified regarding their reliability by comparing their estimations to real data measured from actual groundwater monitoring wells. For example, Liu et al. [20] used the GRACE satellite data to develop a groundwater drought index in order to assess GWS and drought potential in the Taihang Mountains. Zhao et al. [21] used GRACE satellite data to analyze the spatial and temporal evolution of GWS in the Ordos Basin, and wavelet analysis was applied to determine the impact of human activity on GWS in the basin. Amiri et al. [22] combined the data from GRACE with in situ water quality monitoring to verify the reliability of groundwater storage evolution calculations in the Yazd Province, Iran.
Several studies have clearly shown that climate change and human activities are important factors influencing the dynamics of global water resources [23,24,25]. Climate change impacts precipitation patterns, snowmelt timing, and evapotranspiration processes, directly influencing the availability and distribution of water resources. Simultaneously, human activities, such as urbanization, mineral extraction, and the over-exploitation of water resources, significantly disrupt the hydrological cycle, exacerbating issues like water scarcity and quality degradation. Recent studies have quantified changes in groundwater storage variability by analyzing key driving factors, accounting for the combined effects of climate change and human activities. However, studies have shown that natural lakes are the dominant contributors to global changes in TWS [26], with their dynamics being highly sensitive to climatic factors such as precipitation and evaporation. This finding represents a critical step towards understanding the interactions between surface water and groundwater. For example, increased lake evaporation and reduced surface runoff due to higher temperatures could further affect natural groundwater recharge, while the human regulation of reservoirs may amplify regional disparities in these changes. These interconnected factors highlight the need for a deeper understanding of the combined effects of human activities and climate change on water storage variability.
The Loess Plateau is one of the most seriously eroded areas in the world and is ecologically fragile. With continuing economic development and population growth, there is an ever-increasing imbalance between water supply and demand, which adds great pressure to the management of water resources [27]. Over the past decade, groundwater monitoring wells in many regions of the Loess Plateau have recorded abnormal declines in groundwater levels. The precise causes remain unclear, but the management measures taken to date have had unintended negative consequences for groundwater. A series of anti-soil erosion measures have been taken by the Chinese government in the Loess Plateau since the late 1980s, especially after 1999, when large-scale reforestation and farmland-to-forest projects were initiated [28,29,30], which have been effective in greatly reducing local soil erosion. However, large-scale urbanization and vegetation restoration have promoted land cover changes in the Loess Plateau, that have altered the region’s hydrological cycle, complicating groundwater evolution. Most existing studies on the drivers of groundwater storage evolution use statistical approaches, correlating groundwater storage with influencing factors to quantify the contributions of human activities (water consumption, mineral extraction) and climate change (precipitation, evaporation, runoff) [4,31,32,33,34]. However, previous studies have overlooked the most critical factor influencing groundwater: land cover change. High-resolution satellite data provide new opportunities to investigate land cover/use changes in relation to groundwater storage variations, enabling more comprehensive insights into the spatial and temporal drivers of groundwater evolution in the Loess Plateau.
The presented study will thus conduct a comprehensive temporal and spatial analysis of groundwater storage evolution and its driving factors in the Loess Plateau from 2003 to 2022, using data from GRACE, GLDAS, basic groundwater monitoring, high-resolution data on land use change, ERA5-Land reanalysis, and several statistical sources. The research findings will clarify the precise relationship between groundwater storage and climate change, human activities, and land use change, providing scientific data to support future groundwater resource management in the Loess Plateau.
The aims of this study are (1) to reveal the spatiotemporal evolution of groundwater storage in the Loess Plateau from 2003 to 2022, (2) to assess in detail the driving factors behind variations in groundwater storage, and (3) to identify which land use types contribute most significantly to these changes.

2. Study Area and Data
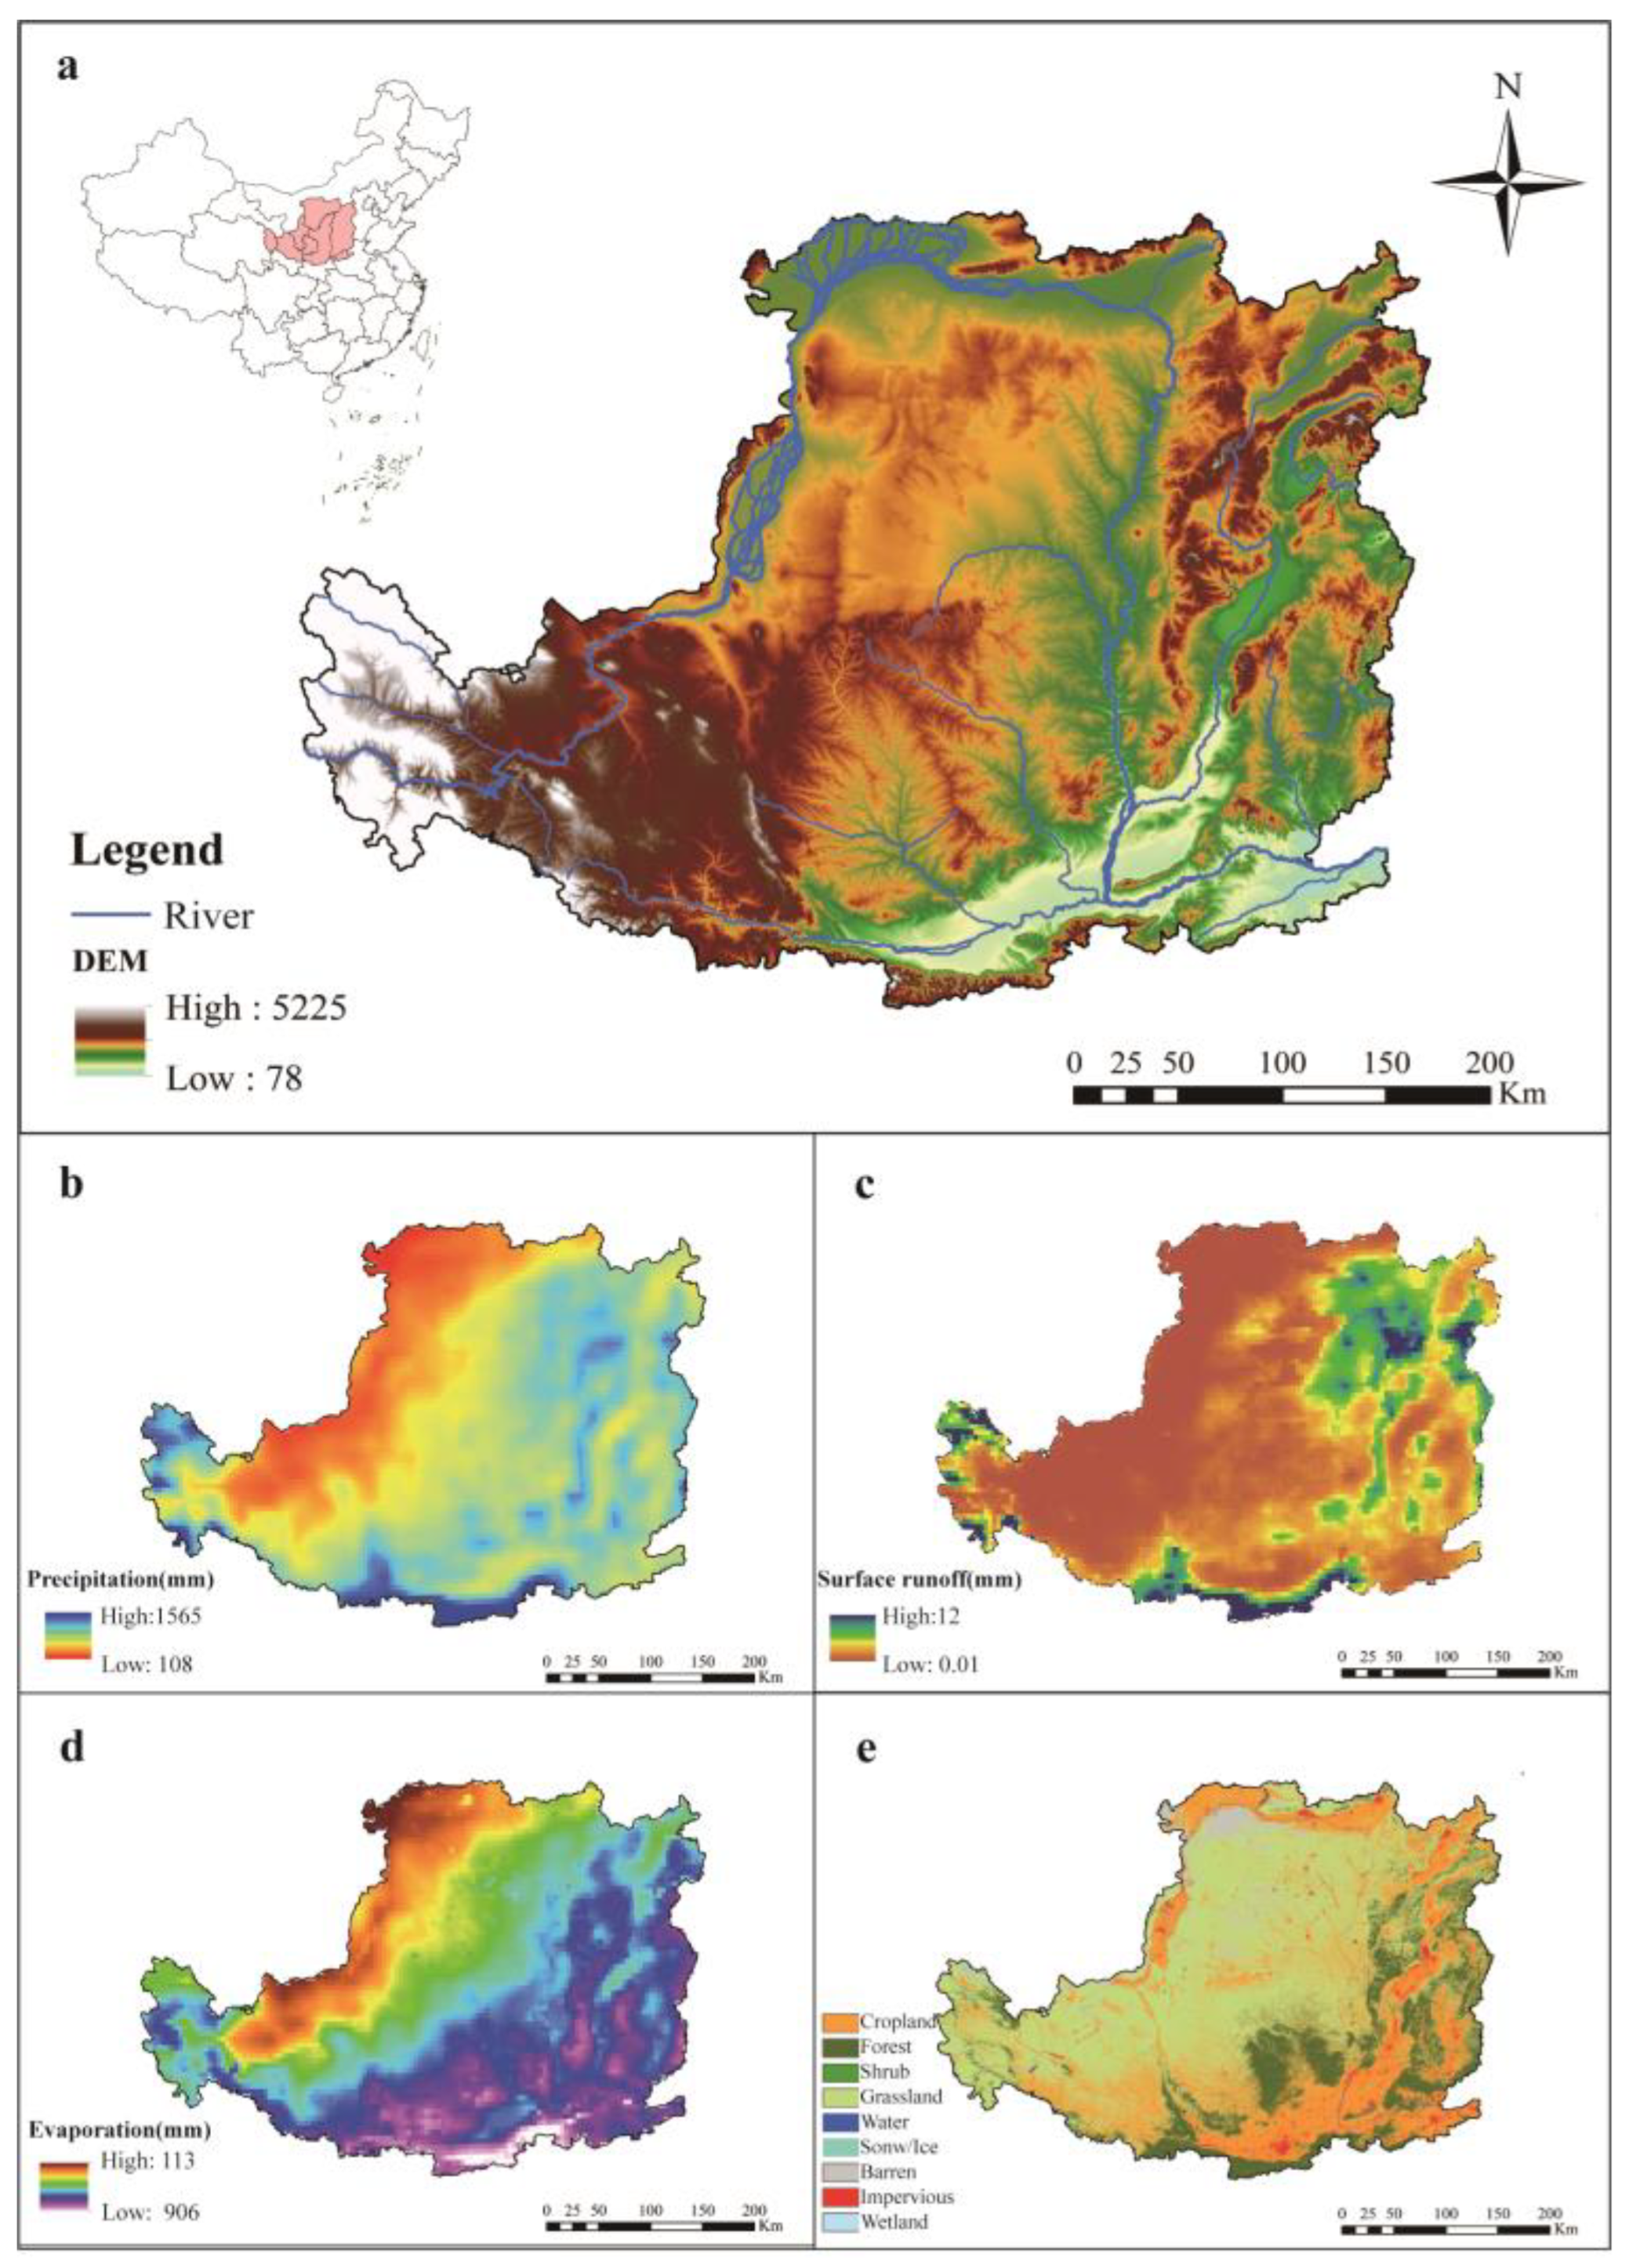
2.1. Study Area

The Loess Plateau is located in the middle and upper reaches of the Yellow River, China’s second longest river (Figure 1), and spans seven provinces and autonomous regions, including Gansu, Qinghai, Ningxia, Shaanxi, Shanxi, Inner Mongolia, and Henan [35]. It sits on the second step of China’s terrain and represents a typical transition zone between monsoon and non-monsoon regions, semi-humid and semi-arid areas, and forests and grasslands, as well as agricultural and pastoral lands. Its land use patterns are mainly composed of arable land, grasslands, and woodlands. Rainfall is unevenly distributed across both space and time, with most precipitation occurring between July and September. The regional water system in the Loess Plateau is structured around the Yellow River as its main artery, with approximately 200 rivers originating within the Plateau. The soils of the Loess Plateau are the most severely eroded in China [29,36,37]. Since 1999, China has implemented a large-scale ecological restoration program. In 2018 alone, 7.07 million hectares of afforestation were completed, with the Loess Plateau representing approximately 40% of this total [38]. These extensive vegetation restoration efforts have substantially reduced soil erosion on the Plateau. However, ongoing climate change, human activities, and land use alterations may introduce complex effects on the water cycle [39,40], complicating groundwater evolution in the region.

2.2. Data

2.2.1. GRACE Data

To date, GRACE gravity satellite data have been primarily provided by three leading institutions: the Center for Space Research at the University of Texas (CSR), the German Research Centre for Geosciences (GFZ), and the Jet Propulsion Laboratory (JPL) [41]. The GRACE data used in this study come from the GRACE/GRACE-FO RL06 Mascon gravity field model, provided by the University of Texas Center for Space Research (https://www2.csr.utexas.edu/grace/RL06_mascons.html, accessed on 26 April 2023). These data have a spatial resolution of 0.25° × 0.25° and span the period from 2003 to 2022. Compared to JPL and GFZ, the CSR GRACE data offer the highest spatial resolution among GRACE products and exhibit clear advantages in regional hydrology and groundwater studies [20]. Gaps between the GRACE and GRACE-FO missions were interpolated using Singular Spectrum Analysis (SSA) to generate a continuous dataset. Based on Amiri et al. [42], a window size of 24 months was selected to capture medium-to-long-term trends and cyclical changes in the GRACE data. This was informed by the outcome of the cross-validation test, which showed that this size of window performs effectively in recovering missing data, especially within one-year intervals. We chose a reconstruction order of 12 for the leading component—a value high enough to retain the dominant signal while minimizing the influence of high-frequency noise.

2.2.2. GLDAS Data

The Global Land Data Assimilation System (GLDAS), developed jointly by NASA and NOAA’s National Centers for Environmental Prediction (NCEP), offers crucial data for studying the global hydrological cycle. GLDAS employs advanced data assimilation techniques to integrate satellite and ground-based observations into a unified framework, utilizing land surface models such as Noah, Mosaic, the Community Land Model (CLM), and Variable Infiltration Capacity (VIC) [41]. The GLDAS Noah dataset demonstrated the smallest bias and uncertainty among the four types of GLDAS models used for in situ measurements [43]. Additionally, soil moisture data from the Noah dataset showed a higher correlation with GRACE TWS [20], and GLDAS Noah dataset has the same resolution as the GRACE dataset, making it particularly suitable for further estimations of groundwater storage (GWS). This study utilized the soil water, canopy water, snow water and surface water data for the Loess Plateau from the GLDAS Noah Land Surface Model L4 monthly dataset (https://disc.gsfc.nasa.gov/datasets/GLDAS_NOAH025_M_2.1/summary, accessed on 16 May 2023), with a spatial resolution of 0.25° × 0.25°. To ensure consistency with GRACE data, average soil water-, canopy water-, snow water-, and surface water-equivalent values from 2004 to 2009 were used as a baseline for anomaly analysis.

2.2.3. Groundwater Monitoring Data

The topography of the Loess Plateau is highly complex, and the distribution of groundwater monitoring wells is uneven due to topographic and other objective factors. Most of these wells are located in relatively flat areas, such as river valleys, and their density is lower compared to economically developed regions in southern China. This uneven distribution poses challenges in fully capturing the groundwater evolution across the Loess Plateau. Despite these limitations, the groundwater monitoring wells in the Loess Plateau provide valuable reference points for assessing the reliability of GWS calculations. The accuracy of GRACE-based GWS calculations was validated by comparing them with direct groundwater measurements. Due to the large size of the Loess Plateau, comprehensive groundwater monitoring data are not feasible. Thus, this study includes 2–6 groundwater level monitoring sites per province or region, totaling 21 wells, to perform correlation analyses with the GWS data.

2.2.4. Other Data

Land use and cover data were sourced from the China Land Cover Dataset, published by Wuhan University [44], which is based on Landsat imagery with a spatial resolution of 30 m and spans the years 2003 to 2022. This dataset includes categories such as farmland, forest, shrub, grassland, water, snow and ice, barren land, impervious surfaces, and wetlands. Rainfall, evaporation, and surface runoff data were sourced from ERA5-Land. Data on water consumption and coal mining were sourced from provincial and municipal statistical yearbooks, along with the China Energy Statistical Yearbook. Seasonal classifications adhere to meteorological standards: spring (March to May), summer (June to August), autumn (September to November), and winter (December to February).

3. Research Methods

3.1. Methods for Estimating Changes in Groundwater Storage

Terrestrial water stocks ( T W S ) consist mainly of components such as soil moisture storage, surface water stocks, glacial water stocks, snow water equivalent, canopy water stocks, and biomass water stocks. Changes in biomass water storage are orders of magnitude smaller than the other components and can usually be ignored. G W S can theoretically be separated from terrestrial water storage by deducting the other components.
  G W S = T W S S M S S W E C W S S W S
where T W S is the terrestrial water storage; S M S is the soil moisture storage; S W E is the snow water equivalent; C W S is the canopy water storage; and S W S is the surface water storage anomaly. It should be noted that, in non-glacier-covered areas, glacier water storage is zero, and Equation (1) is applicable. In glacier-covered areas, the influence of glacier distribution must typically be taken into account. Total terrestrial water storage (TWS) is derived from GRACE/GRACE-FO satellite data, representing the sum of all water stored on and within the land surface. S M S , S W E , C W S , and S W S are extracted directly from the corresponding layers of the GLDAS–Noah model. These components are summed to calculate the non-groundwater components. All data were processed at a monthly resolution to ensure consistency across datasets.

3.2. Mutation Analysis and Trend Test

Firstly, this study employs the Mann–Kendall mutation test to determine whether the GWS sequence for the Loess Plateau from 2003 to 2022 exhibits significant changes. If a mutation is detected, the study period is divided into two phases, before and after the mutation, using the mutation year as a Mann–Kendall (MK) method boundary. If no abrupt change is detected, the entire sequence is analyzed, and a Mann–Kendall trend analysis (with a 0.05 significance level) is performed to evaluate GWS trends over the study period.
The Mann–Kendall (MK) method is a non-parametric approach that does not assume a specific distribution for the data, is robust against outliers, and is well-suited for hydrometeorological time series analysis [45,46]. Currently, the Mann–Kendall (MK) method is widely used for trend analysis of long time series, including detecting abrupt changes, performing significance tests on trends, and calculating the significance Z -value.
  S = i < j s g n x j x i
  s g n x j x i = 1   x j < x i 1   x j > x i   0     x j = x i  
  v a r s = n n 1 2 n = 5 18
  Z = S 1 v a r S   S > 0   0   S = 0 S + 1 v a r s   S < 0
For the Z statistic, values above 0 indicate an upward trend, while values below 0 represent a downward trend. Absolute Z values of 1.28, 1.64, and 2.32 or higher indicate significance at the 90%, 95%, and 99% confidence levels, respectively.
The MK method was also used to test for mutation points in the data series. Firstly, the original sample series was arranged in reverse order to calculate the MK test value of the new series. The intersection of the two curves was then taken as the pending mutation point. If the change trend is significant, then the intersection of the two curves is judged as the mutation point of the original sequence.

3.3. Evaluation of Groundwater Sustainability

The evaluation of groundwater sustainability is based on the concept introduced by Loucks [47], defining the Sustainability Index ( S I ) through three dimensions, the Reliability ( R E L ), Resilience ( R E S ), and Vulnerability ( V U L ) of the groundwater system.
  S I i =   R E L i × R E S i × 1 V U L i
The parameter i represents the i t h groundwater storage change, with a dimensionless value ranging from 0 to 1. Reliability ( R E L ) is calculated as the ratio of the number of positive values to the total number of data points in the groundwater storage change time series. Resilience ( R E S ) is determined using the ratio of occurrences where a positive value follows a negative value to the total number of negative values. Vulnerability ( V U L ) is calculated as the ratio of the number of negative values to the total number of data points. According to the Sustainability Index ( S I ) classification, 0 ≤   S I   ≤ 0.2 indicates extremely unsustainable, 0.2 < S I ≤ 0.30 indicates severely unsustainable, 0.3 < S I ≤ 0.5 indicates slightly unsustainable, 0.5 < S I ≤ 0.75 indicates moderately sustainable, and 0.75 < S I ≤ 1.0 indicates highly sustainable.

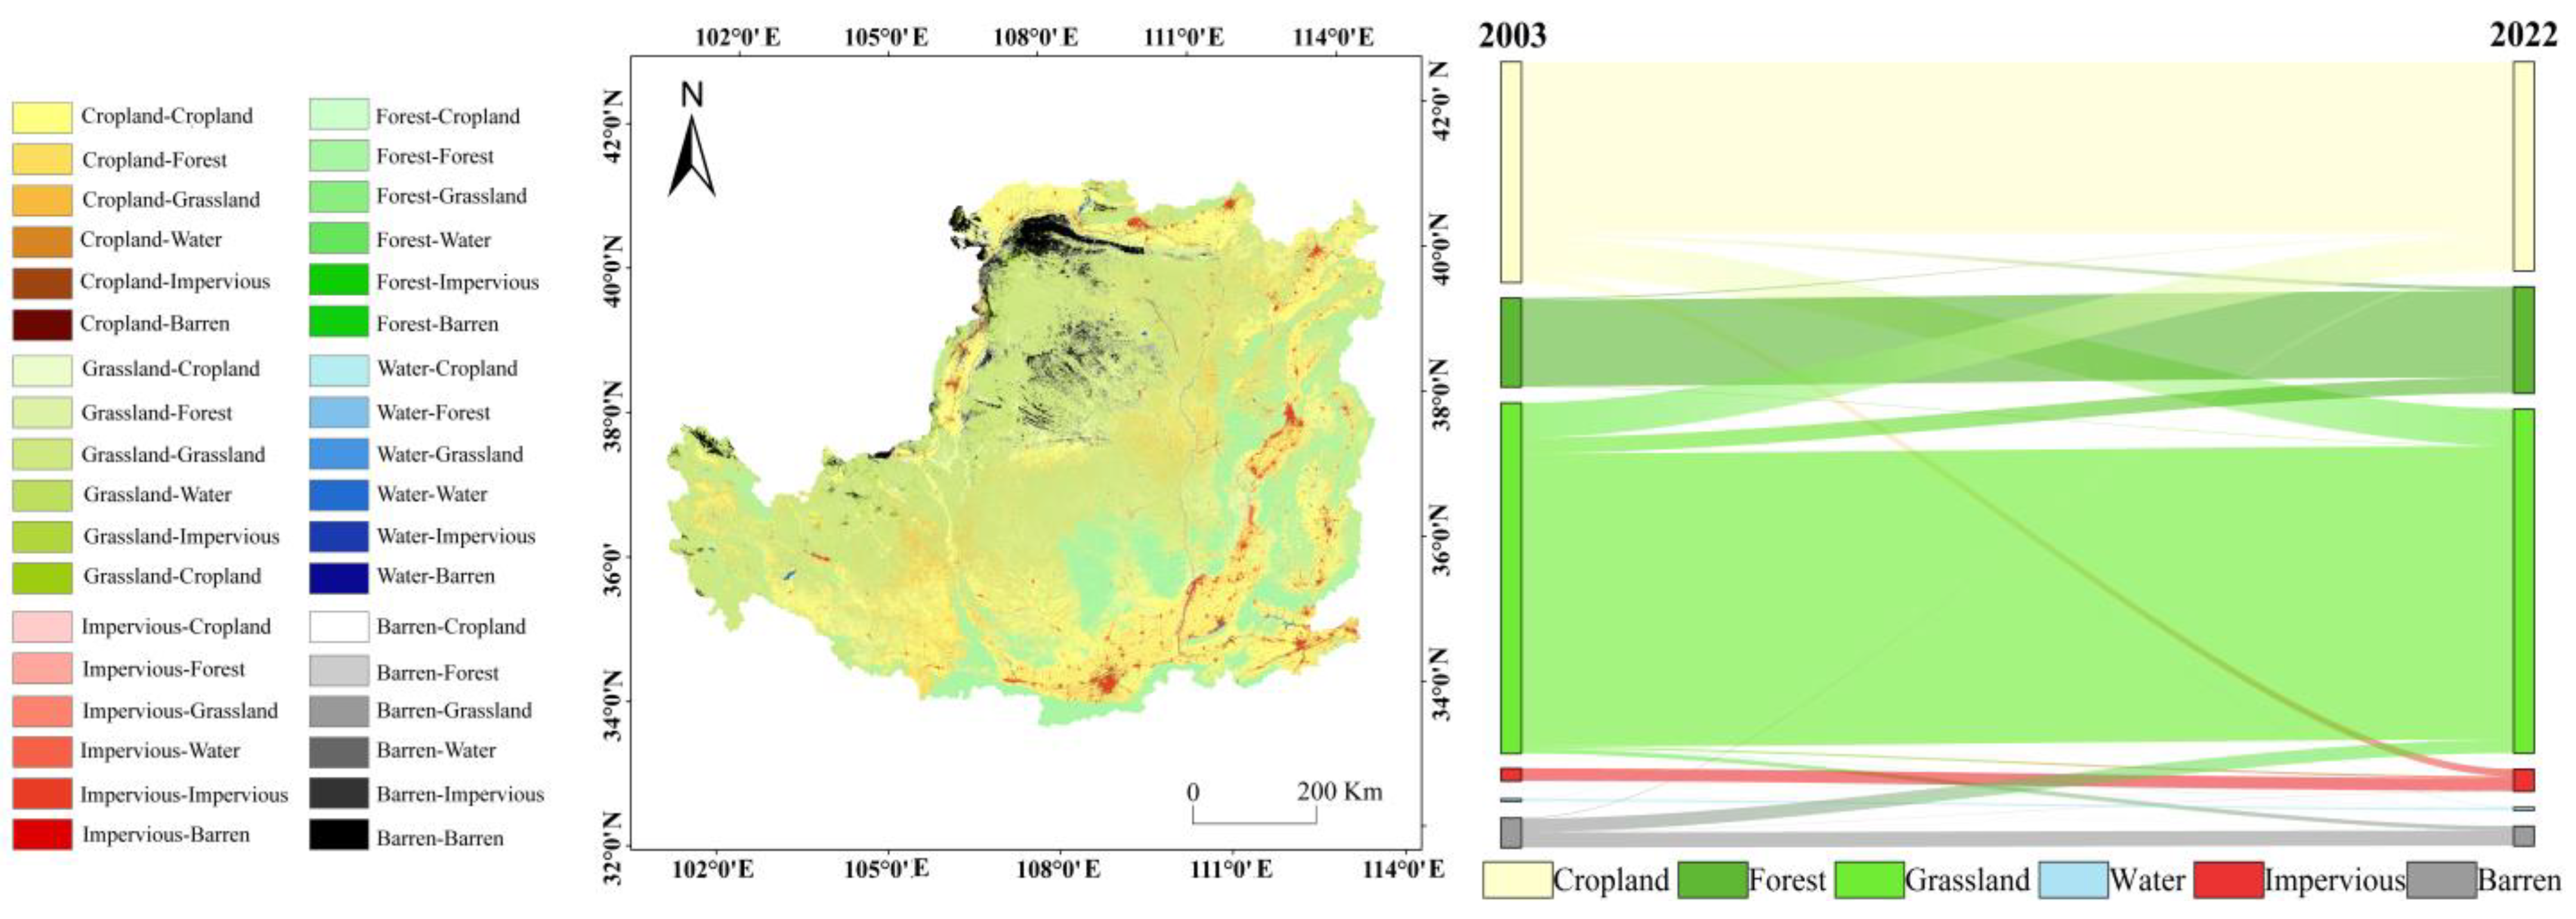
3.4. Land Use Transition Matrix

The land use transition matrix effectively reflects the quantity and direction of land type changes during the study period. Thus, this study utilizes the matrix to examine the land use change characteristics of the Loess Plateau from 2003 to 2022. The general expression of the land use transfer matrix is:
Q a b = Q 11 Q 1 n Q n 1 Q m n
Q represents the area, where a is the initial land use type at the start of the study period, and b is the land use type at the end of the study period; Q a b represents the area in which the initial land use type was changed from type a to land use type b , and n is the number of land use types.

3.5. Relative Contribution

The relative contribution ratio quantifies the impact of each influencing factor on GWS and identifies the dominant factors. Given that the factors have different magnitudes and ranges, they need to be standardized first. The relative contribution of each factor to changes in GWS is then analyzed using a stepwise multiple linear regression model, as expressed below:
  G W S =   b 1 A + b 2 B + + b i K
  μ i = b i b 1 + b 2 + b 3   i = 1 , 2 , 3
In this study, G W S represents the standardized value of GWS, while A , B , , K denote the standardized values of each influencing factor. The parameter μ i indicates the relative contribution rate of each influencing factor to changes in groundwater depth, and b i is the regression coefficient for each factor. Independent variables include rainfall, evaporation, runoff, water consumption, land use change, and coal mining from 2003 to 2022, with GWS in the Loess Plateau as the dependent variable. To conduct multiple linear regression analyses, the following conditions must be met: (1) The independent variables must not exhibit multicollinearity, and the Durbin–Watson (D-W) test will be applied to check for autocorrelation. (2) Multicollinearity among the independent variables must be absent, with stepwise regression helping to mitigate this issue.

4. Results

4.1. Reliability of Groundwater Storage Evolution

We selected data from groundwater monitoring wells that spatially and temporally overlapped with the Loess Plateau-wide GRACE data, aiming to validate the reliability of the inversion results (Table 1). An analysis of the correlation between measured groundwater levels and GRACE estimates showed a moderate positive correlation (r > 0.5) among the 21 wells, of which 14 exhibited a significant positive correlation with high synchronization of gain and loss. Four wells showed no significant correlation, and three wells displayed a negative correlation. More than 66% of the groundwater monitoring wells align with the groundwater evolution patterns derived from GRACE. Overall, the validation results demonstrate that the GRACE inversion data are consistent with the measured data, confirming the applicability of GRACE-GLDAS satellite data for studying groundwater level fluctuations in the Loess Plateau over extended time periods. This supports the use of these data for further research in this region. Figure 2 illustrates the evolutionary trend in GWS alongside groundwater level changes observed in typical monitoring wells, offering a more intuitive representation of the positive and negative correlations between GWS and groundwater levels.

4.2. Inter-Annual Variation in Groundwater Storage in the Loess Plateau

The time series analysis of GWS changes in the Loess Plateau, based on GRACE data from 2003 to 2022, shows a marked declining trend. The Mann–Kendall (MK) test was used to detect any possible breakpoints in the annual GWS series. The results indicated no mutation points throughout the study period, thus allowing the entire period from 2003 to 2022 to be treated as a continuous time series for the analysis.
The MK trend test further confirmed a significant decline in GWS during this period (Z = −15.733). Between 2003 and 2022, GWS decreased between −4.5 mm and −138.5 mm, with an average annual change rate of −6.9 mm/yr (Figure 3). The standard error for this rate is 3.84 mm/yr. This decrease corresponds to a total loss of approximately 88 km3 of groundwater over the 20-years span. According to the temporal characteristics of groundwater, the most severe groundwater low occurred in 2021, when the average value of GWS for the whole year fell to −159.1 mm, the lowest in 20 years. The lowest monthly value was recorded in June 2021, at −195.1 mm. From the perspective of recharge, there is no obvious synchronous trend between groundwater fluctuations and changes in rainfall. The time-series trend of declining GWS underscores the escalating conflict between groundwater resources and human activities. Therefore, it is of great significance to pay continuous attention to the evolution of GWS in the Loess Plateau and implement a regional water ecological security plan.

4.3. Intra-Annual Variation in Groundwater Storage in the Loess Plateau

From 2003 to 2022, the GWS in the Loess Plateau was generally higher in spring and autumn, and lower in summer and winter (Figure 4). Groundwater storage peaks in March, September, and November, while groundwater storage lows occur in June and December.
The intra-annual variation in GWS results from the combined influence of natural recharge and human-induced depletion. In terms of recharge, GWS seasonal fluctuations in the Loess Plateau are primarily driven by atmospheric precipitation, surface water infiltration, and snow/ice meltwater. Precipitation in the Loess Plateau is mainly concentrated from July to September, whereas higher temperatures and high evaporation occur in June, with relatively less precipitation, resulting in limited recharge of groundwater, and thus lower groundwater levels. In addition, the recharge of groundwater by precipitation has a lagging effect, and with the arrival of the rainy season, GWS will peak in autumn. In winter, low precipitation and insufficient groundwater recharge, coupled with low temperatures leading to soil freezing, further reduces water infiltration, thus maintaining groundwater at a low level. With warming temperatures in March, snowmelt and increasing precipitation both augment GWS.
From the point of view of human activities, summer is the peak season for agricultural water consumption, and the increase in water consumption for irrigation exacerbates the decline in groundwater levels. The combination of lower precipitation in winter and ongoing domestic water demand leads to further groundwater abstraction, leaving groundwater levels at low levels.

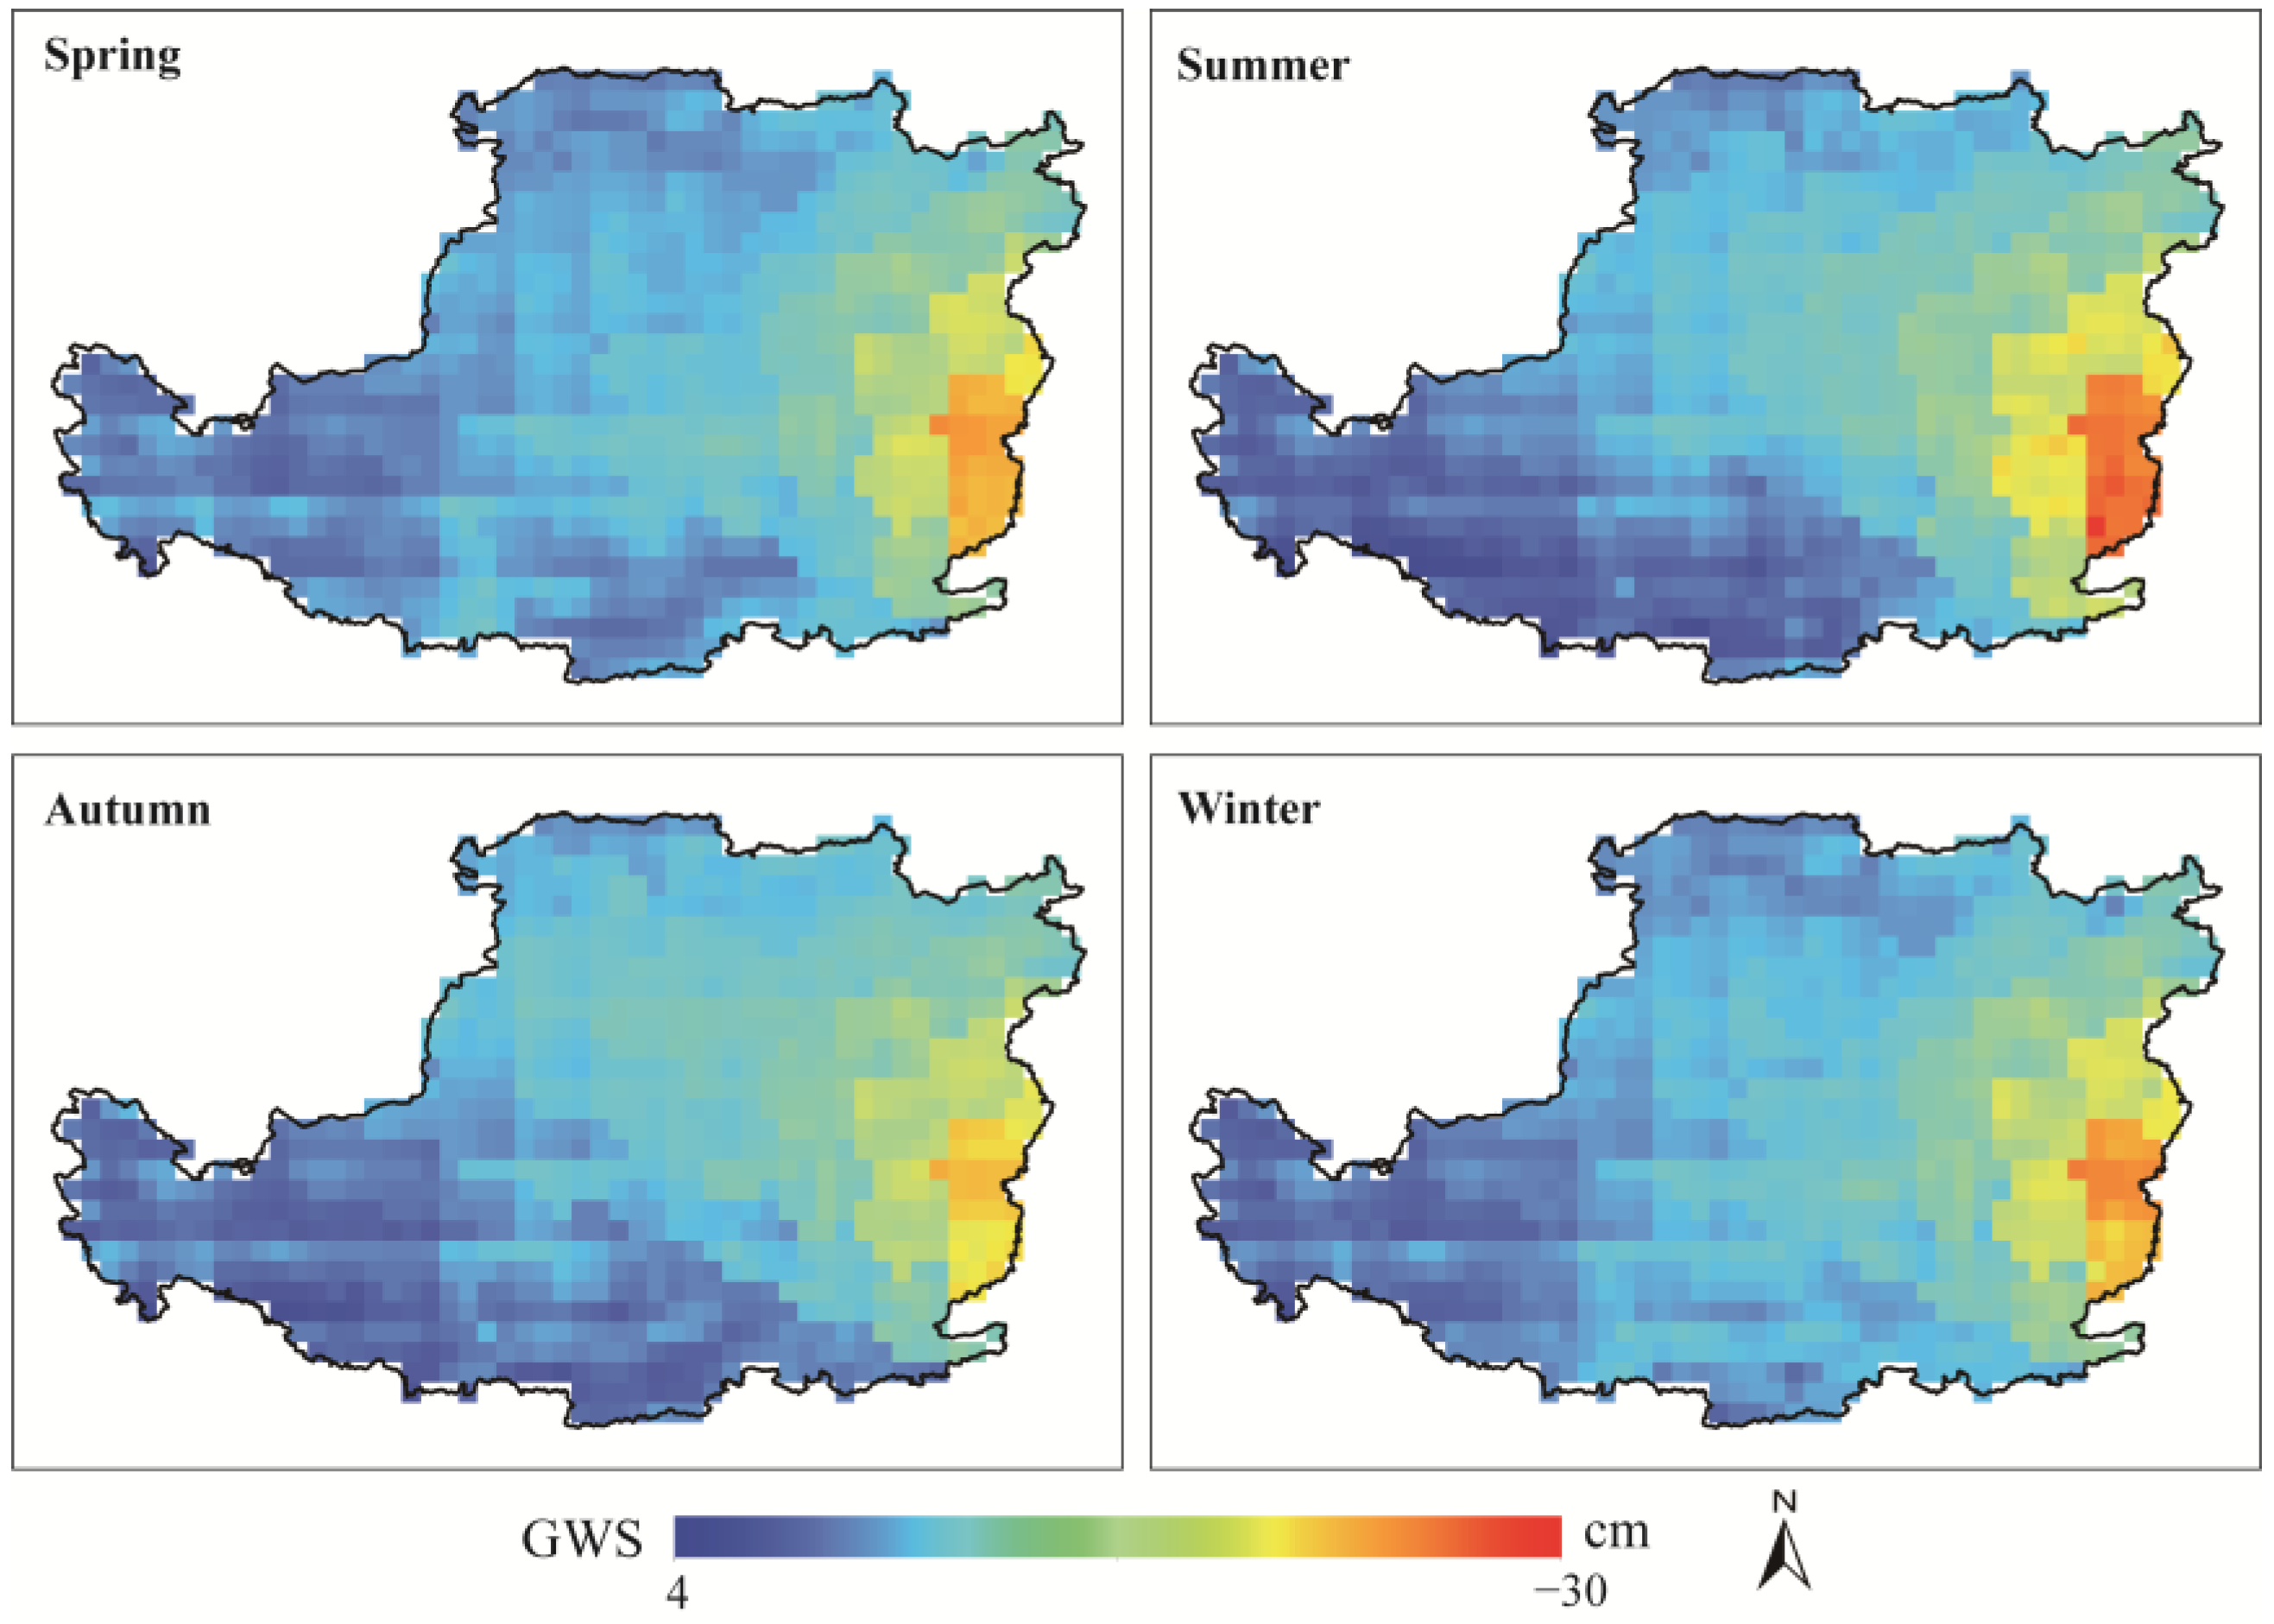
4.4. Spatial Variation in Groundwater Storage in the Loess Plateau

Figure 5 demonstrates the spatial variation in the annual average GWS in the Loess Plateau from 2003 to 2022. The equivalent water height of the groundwater in the Loess Plateau demonstrates significant zonal differences in space. From 2003 to 2008, the groundwater height was more uniform and stable in space as a whole. The GWS in the eastern Loess Plateau in 2003–2006 was the area with the highest value in the entire region, with abundant GWS. However, from 2009 onwards, the groundwater in the Loess Plateau showed a sustained decline, with hotspot areas of decline in the eastern region. The annual rate of groundwater change in the eastern region is about −10.6 mm/yr, with a standard error of 7.54 mm/yr, reflecting significant variability in annual changes due to local climate and human activity differences. This rate is higher than the overall average (−6.9 mm/a) and represents 150% of the overall rate of decline in the Loess Plateau.
The seasonal distribution of GWS from 2003 to 2022 reveals that the most pronounced groundwater level decline occurred in the eastern region, which is most obvious in summer, showing the largest decrease (Figure 6). The Loess Plateau belongs to the arid continental monsoon climate zone, where rainfall is mainly concentrated in autumn, and groundwater is not recharged in the summer due to high temperatures, high levels of evaporation, and low rainfall. At the same time, summer is also the peak period of water consumption for agricultural irrigation in the Loess Plateau, exacerbating the decline in the groundwater level.
The primary hotspot for groundwater level decline in the eastern Loess Plateau is located in Shanxi Province, where the highest GWS value during the study period was recorded in 2004, with an annual average of 58.38 mm—much higher than the overall level of the Loess Plateau in that year (15.43 mm). The lowest value of GWS in the region occurred in 2021, when the annual average GWS was as low as −309.9 mm. The overall level of GWS in the Loess Plateau in that year was −159.1 mm. The region is an important coal resource base in the Loess Plateau, where resource and engineering water shortages co-exist, and the significant over-exploitation of groundwater has already formed a few large-area groundwater cones of depression in the region. Additionally, long-term coal mining has severely impacted the hydrogeological structure, disrupting the natural recharge, runoff, and discharge conditions of shallow, medium, and deep groundwater, and causing a series of groundwater environmental problems. In 2016, the Chinese government began groundwater remediation work in the region; however, from the current research results, the groundwater situation in the region is still not optimistic. Moreover, the region’s proximity to the North China Plain—one of the most water-scarce areas in China—links the GWS decline in this area to the groundwater depletion funnel in the North China Plain [48]. Overall, the decreasing trend of GWS in the Loess Plateau could, to some extent, impact the region’s water and ecological security.

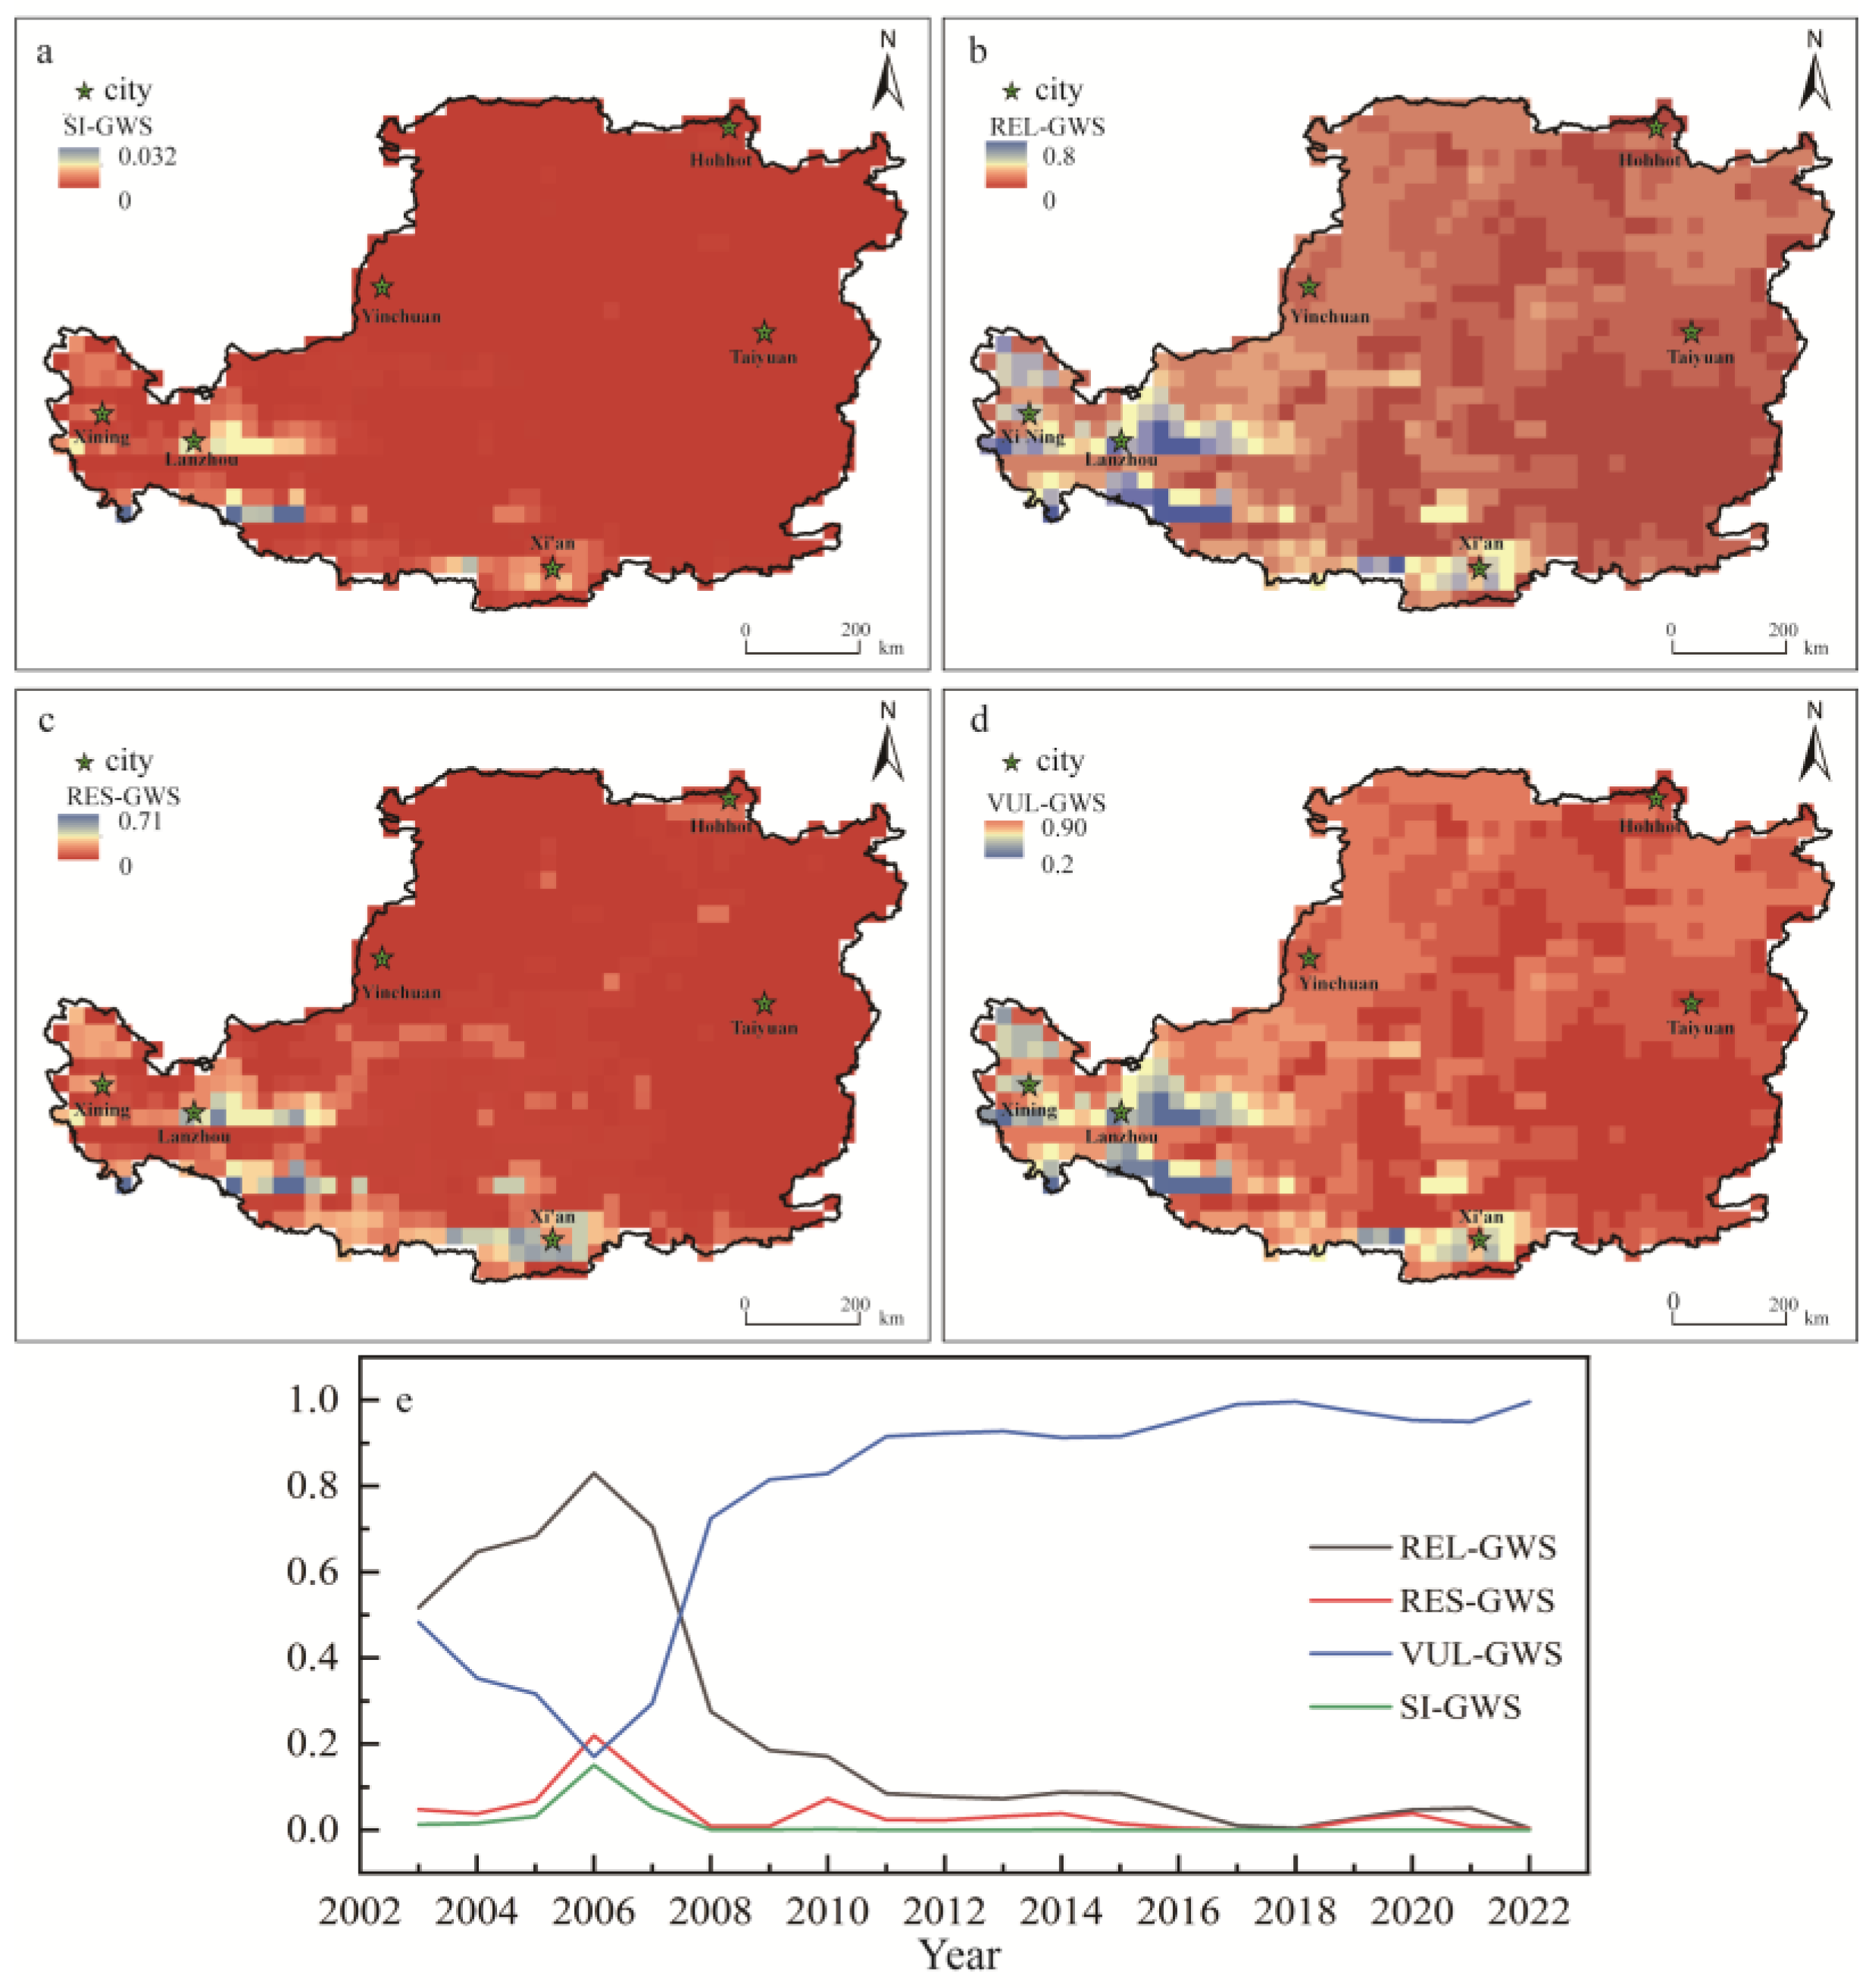
4.5. Evaluation of Groundwater Sustainability in the Loess Plateau

Groundwater sustainability reflects the capacity of groundwater systems to provide an adequate quantity and quality of water for both ecosystems and human activities. Evaluating groundwater sustainability in the Loess Plateau is essential for understanding the current status of groundwater in this region, and it plays a critical role in advancing groundwater resource management and protection efforts. We constructed a Reliability–Resilience–Vulnerability (RRV) framework to assess groundwater storage sustainability across the Loess Plateau. The findings reveal that groundwater sustainability in the Plateau has been critically unsustainable since 2003 (Figure 7e). Although the sustainability index improved slightly between 2003 and 2006, it declined sharply after 2006, reaching its lowest levels in 2008. Spatially, groundwater sustainability in the western part of the Loess Plateau is relatively higher than in the central and eastern regions (Figure 7a–d). Our analysis of the Reliability, Resilience, and Vulnerability of groundwater storage indicates that the unsustainable groundwater conditions in the central and eastern Plateau are driven by a low Reliability, low Resilience, and high Vulnerability. In contrast, the western Plateau exhibits comparatively better levels of these attributes. Nevertheless, the overall unsustainability of groundwater storage on the Loess Plateau remains concerning.
Using five provincial capital cities on the Loess Plateau as case studies, we analyzed groundwater sustainability in key urban areas. Lanzhou had the highest sustainability index (0.135), followed by Xining (0.05) and Xi’an (0.047), while the groundwater sustainability was significantly lower in Hohhot and Taiyuan (since all five cities have an SI ≤ 0.2, all suffer from extremely unsustainable groundwater). These findings indicate that cities in the central and eastern parts of the Loess Plateau experience higher groundwater unsustainability than those in the western region. This pattern was also reflected in the Reliability, Resilience, and Vulnerability metrics. Taiyuan and Xi’an have potentially higher groundwater recharge due to factors like rainfall, evaporation, and runoff compared to Lanzhou and Xining, but their sustainability indices are notably low. As Taiyuan and Xi’an are in densely populated areas with high levels of economic development, this exerts substantial pressure on water resources. This suggests that groundwater management efforts on the Loess Plateau should focus on the relatively humid central and eastern regions, where population density and economic activity place significant demands on groundwater resources, rather than the arid western areas.

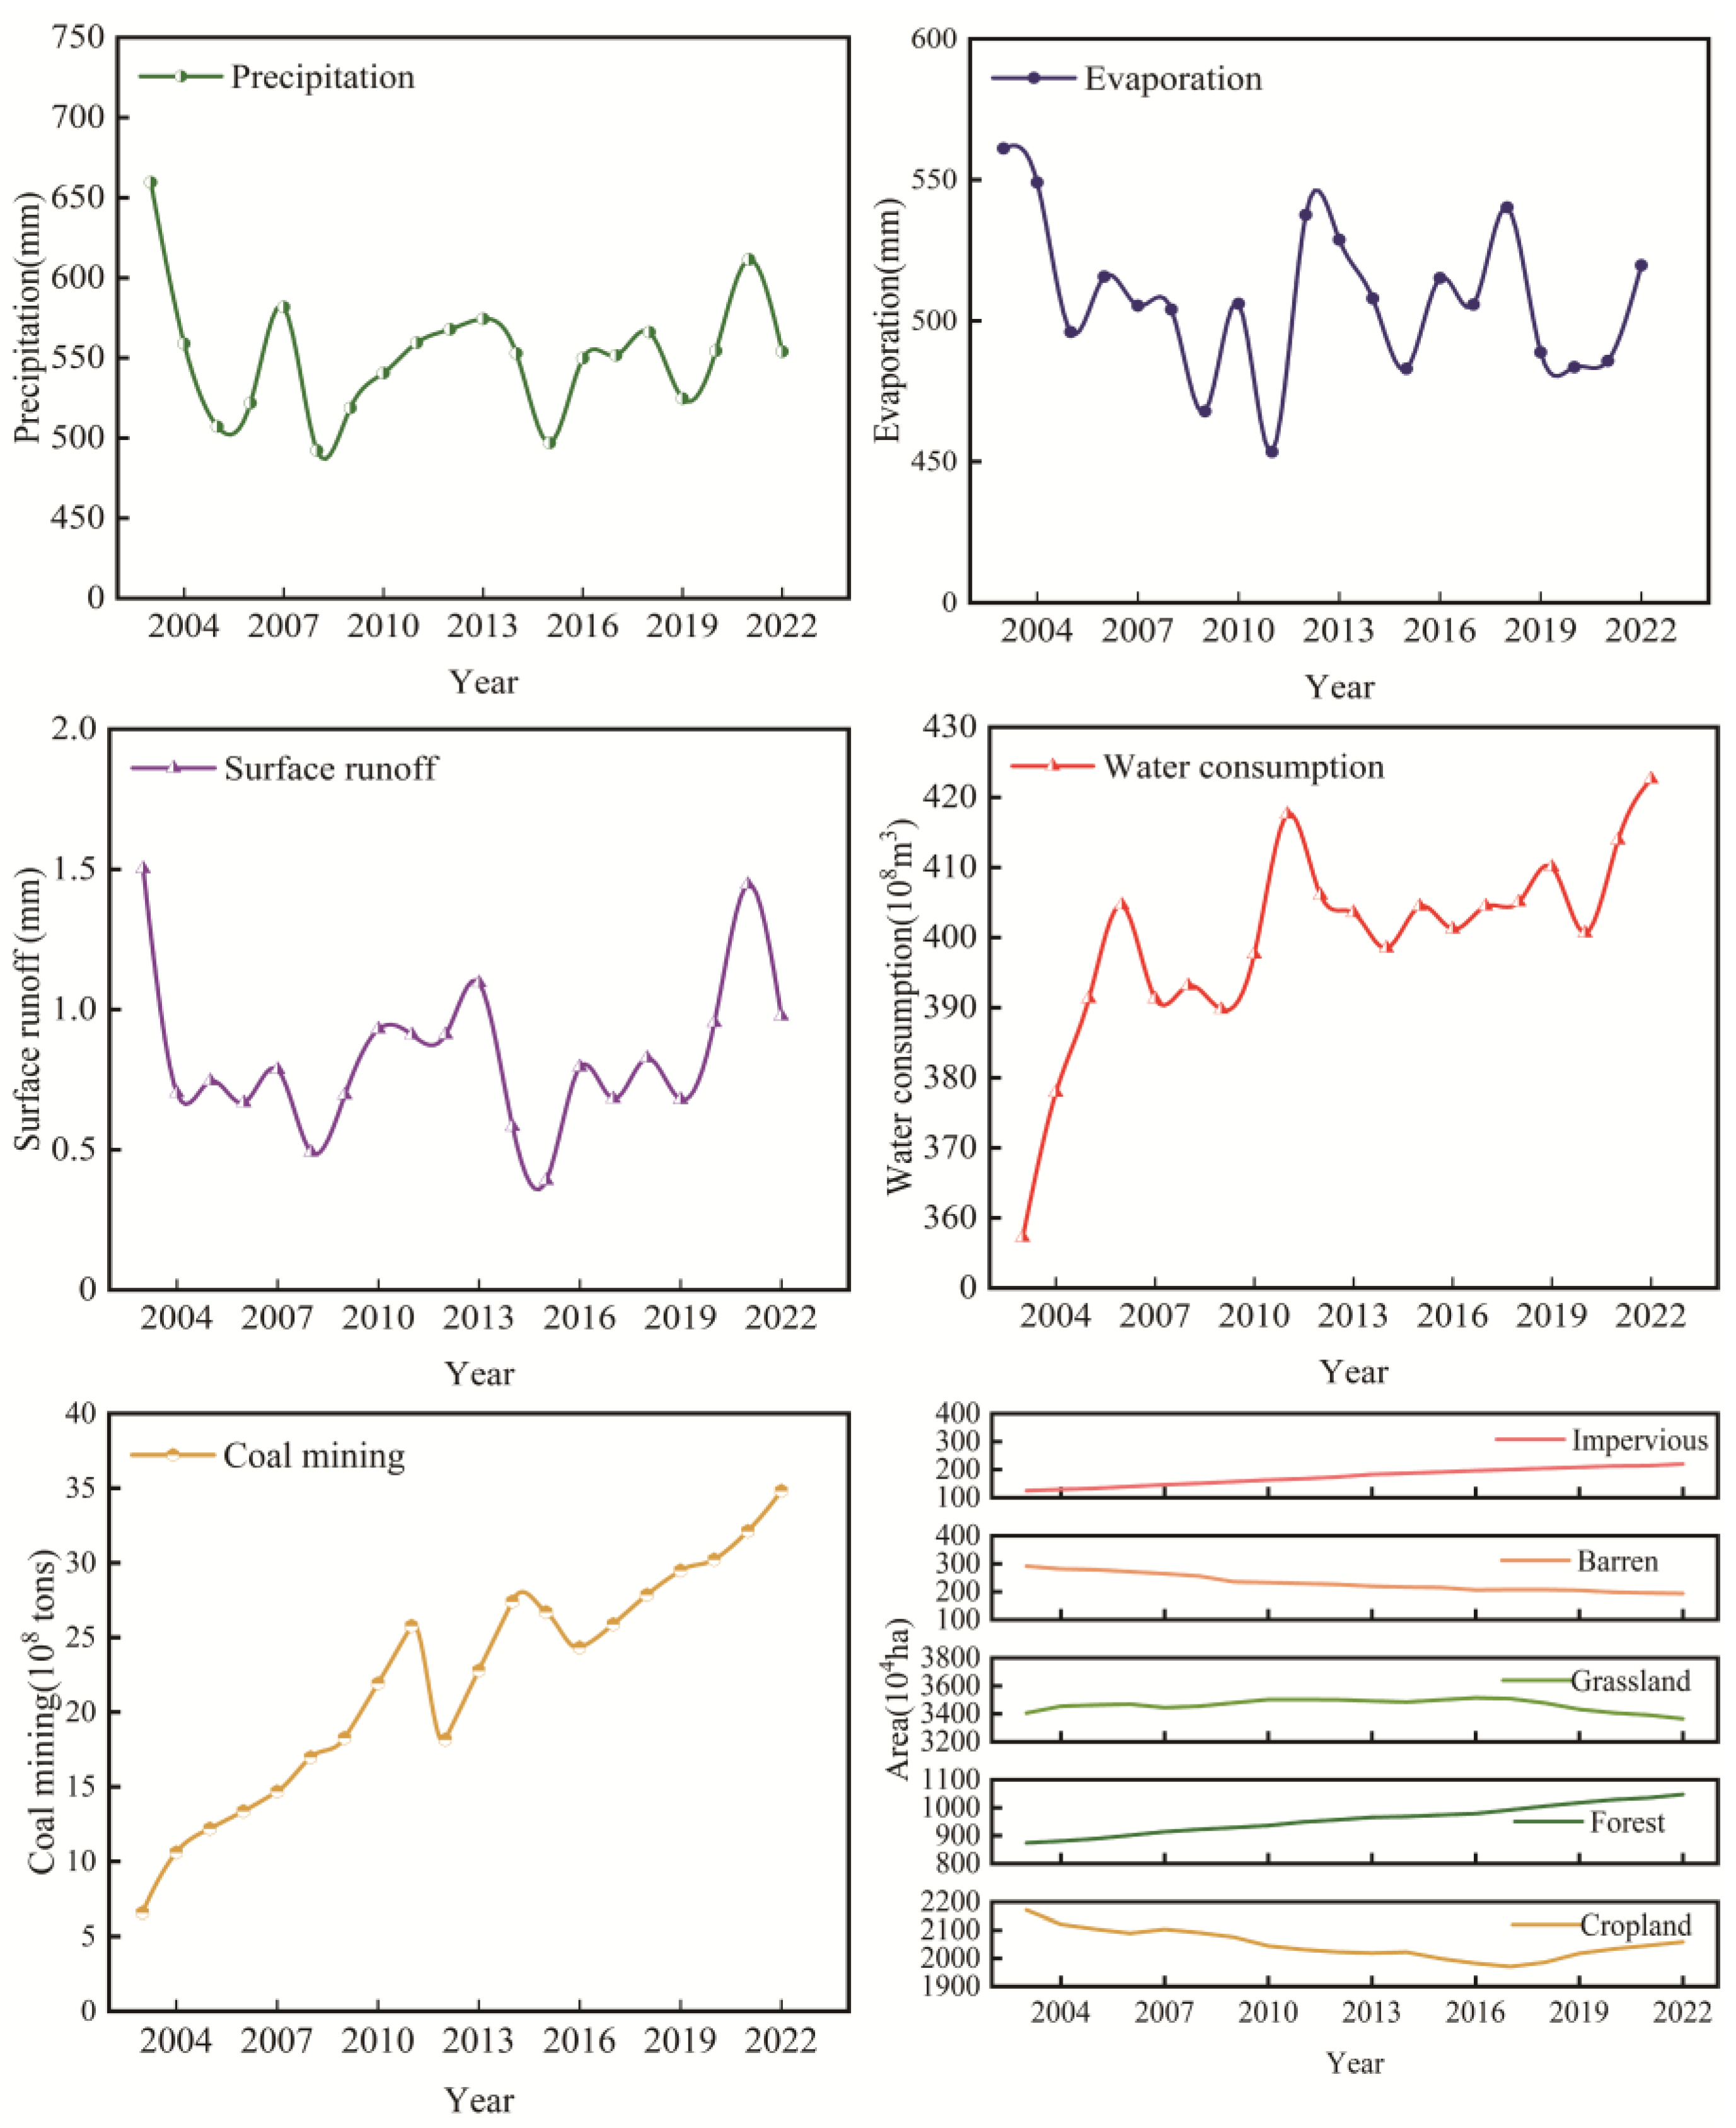
4.6. Drivers of Groundwater Storage Changes in the Loess Plateau

Previous studies have indicated that changes in GWS are influenced by precipitation infiltration, surface water recharge, groundwater discharge, human extraction, and the complex effects of vegetation [49,50,51,52,53]. Therefore, the total GWS of the Loess Plateau is used as the sample, with precipitation (PRE), evapotranspiration (EVA), and surface runoff (SR) serving as indicators to represent groundwater recharge from precipitation and surface water infiltration. Water consumption (CS) and coal mining (CM) are chosen to represent direct human activities. Land use changes in less than 1% of the area were considered negligible, and the main land use categories analyzed included forest, cropland, grassland, impervious surfaces, and barren land (Figure 8).
There was no significant correlation between climate variables and GWS evolution in the Loess Plateau, as indicated by the correlation coefficients for precipitation (r = −0.0032), evapotranspiration (r = −0.22), and surface runoff (r = 0.2). Climate factors such as precipitation, evaporation, and runoff fluctuated over the 20-year period but remained stable overall, exerting limited influence on groundwater depletion. In contrast, human activities like water consumption (r = −0.62) and coal mining (r = −0.9) exhibited a significant negative correlation with GWS (Figure 9). Over the 20-year period, the rapid growth of water consumption and coal mining intensified groundwater extraction and depletion, having a negative impact on GWS.
In terms of land cover changes, forest areas (r = −0.97) and impervious surfaces (r = −0.96) demonstrated a strong negative correlation with GWS, while cropland (r = 0.68) and barren land (r = 0.92) exhibited a significant positive correlation. Grassland (r = −0.29), on the other hand, showed no significant relationship with GWS (Figure 9). These findings suggest that the expansion of forests and impervious surfaces has negatively impacted GWS. Over the past 20 years, impervious surfaces and forested areas have been the only land use types that have expanded in the Loess Plateau. (Figure 10), primarily driven by urbanization associated with decades of economic growth in the region. Urbanization inevitably leads to the expansion of impervious surfaces. Since 1999, rapid forest expansion has been recorded in the Loess Plateau as a result of several ecological conservation projects promoted by the Chinese government, such as farmland reforestation and afforestation programs. The expansion of impervious surfaces and forested areas has negatively impacted groundwater recharge.

5. Discussion

5.1. Impacts of Human Activities and Climate Change on Groundwater Storage

In order to reveal the major driving factors for the variation in groundwater storage in the Loess Plateau, a contribution model was adopted, indicating that forest area and water consumption played dominant roles. Multiple linear stepwise regression analysis showed that increased water consumption and forest area explained 95.8% of the decline in GWS (R2 = 0.958), demonstrating an excellent fit. The remaining 4.2% is accounted for by other factors. These findings indicate that human-induced factors are the predominant contributors to groundwater depletion in the Loess Plateau. Among all factors affecting GWS in the region, the expansion of forested areas contributed to 82.5% of the variance observed (r = −0.97), indicating that forest expansion greatly impacts GWS. Water consumption contributed to 17.5% of the variance observed.
A quantitative analysis of land cover changes reveals that the most significant transformation on the Loess Plateau between 2003 and 2022 was the notable expansion of forested areas (Figure 8 and Figure 10), which increased by 19.8% over the 20-year period. Although the extent of impervious land grew rapidly during this time, it still occupies a relatively small proportion of the total area (3%), resulting in a limited impact on groundwater recharge. The forest expansion primarily stemmed from the conversion of grassland and cropland. According to the land cover transfer matrix, 78.96% of the newly added forest area came from grassland conversion, while 20.96% resulted from cropland conversion. Spatially, this conversion was concentrated in the east-central region of the Loess Plateau, which also corresponds to the area with the most significant decline in groundwater storage. This suggests that land-cover change is a key driver of groundwater storage dynamics.
Based on the land use transfer matrix, we identified that the main sources of forestland expansion in the Loess Plateau were from the conversion of grassland and farmland, and these land use changes played a key role in affecting GWS. Furthermore, abundant evidence suggests that these surface changes have altered groundwater recharge, thus affecting groundwater levels. For example, Huang and Pang [54] used the chloride ion balance method to study the effects of different land cover types on groundwater recharge and found that large-scale tree planting reduces groundwater replenishment. Similarly, Chen et al. [55] found that groundwater recharge from rainfall infiltration is most efficient in grasslands, and transitions from other land cover types to forests lead to significant reductions in recharge rates. Our findings also confirm that the forest expansion in the Loess Plateau was primarily from grassland and cropland (Figure 8), further proving that land cover changes have a profound effect on GWS.
Studies have also shown that afforestation not only alters subsurface infiltration but also significantly increases transpiration, as forests consume much more water than grasslands and croplands [56,57]. Additionally, the larger canopy of forests intercepts rainwater, which evaporates back into the atmosphere without reaching the ground [58]. It was also found that runoff from afforested areas would be much lower than from natural grassland areas [15], which would significantly affect the recharge of groundwater from surface runoff and hence the evolution of GWS. Given that the Loess Plateau is a typical semi-arid to semi-humid transition zone, large-scale afforestation may exacerbate groundwater stress. Therefore, it is essential to reassess and evaluate the benefits and drawbacks of large-scale afforestation in the Loess Plateau, and make timely adjustments to environmental management programs and policies to ensure the sustainable development of the region.
In recent years, a large number of studies and monitoring have identified a significant warming and humidification trend in northwestern China [59,60,61,62], a climate change trend that may have far-reaching impacts on the water cycle in the Loess Plateau. The western part of the Loess Plateau may also exhibit significant warming and humidification, likely influenced by the warming and humidification trend in western China, while the eastern part is more significantly affected by monsoon climate. Although increased precipitation in the northwest could enhance groundwater recharge, this benefit may be diminished by higher evaporation rates due to warming, further complicating and introducing uncertainty to the impacts of climate change on GWS. Our analysis revealed weak correlations between GWS changes and climatic factors such as precipitation and evaporation, suggesting that climate change exerts a limited direct influence on groundwater variation. Instead, anthropogenic activities appear to be the primary driver, likely masking the direct effects of climate change on GWS. However, the indirect effects of climate change may become increasingly significant if the warming and humidification trend continues in the future. Given this, regional water management strategies should consider the long-term implications of these trends to ensure sustainable groundwater use in the Loess Plateau. However, the future sustainability of groundwater storage in the Loess Plateau is seriously challenged under the current patterns of human activity intensity and land use change. Without effective interventions, groundwater resources may continue to decline at the current rate of decline, further exacerbating the regional water crisis and threatening not only the balance of the ecosystem, but also having far-reaching impacts on irrigated agriculture and socio-economic development.

5.2. Policy Recommendations

Studies have indicated that GWS in the Loess Plateau is decreasing, with the eastern portion particularly affected. The main factors contributing to this decrease are the expansion of forestland and the steady increase in water consumption. Therefore, water conservation should be vigorously promoted, while improving water supply facilities, including enhancing techniques such as wastewater treatment and reutilization, along with rainfall collection. Strict regulations and evaluations of groundwater extraction in the Loess Plateau should be enforced. Additionally, the large-scale afforestation programs in the region should be reexamined and reassessed to determine whether further implementation is warranted. For future afforestation, tree species and shrubs with lower water requirements should be prioritized to prevent further depletion of GWS and to mitigate the negative impact of human activities on groundwater levels.

5.3. Future Perspectives

At this stage, there is limited information on the impact of land use changes on GWS, and the effects of vegetation are typically assessed using NDVI in a general manner, without quantifying specific land use types. In this paper, we systematically quantify, for the first time, the spatial and temporal evolution of GWS in the Loess Plateau from 2003 to 2022 and provide an in-depth exploration of the impact of different land use types on GWS. The expansion of forest area and the continuous increase in water consumption are the primary drivers of GWS decline. These findings offer valuable insights for the sustainable management of groundwater resources in the Loess Plateau.
However, some limitations remain in studying GWS. Firstly, the GRACE satellite data have a relatively low resolution, making them suitable only for large-area groundwater studies. Secondly, this study focuses solely on the regional causes of groundwater changes, overlooking the effects of groundwater fluctuations from surrounding areas. Future research should aim to optimize the simulation of interactions between regional and external groundwater systems, providing a more comprehensive and objective understanding of the factors driving regional groundwater changes.

6. Conclusions

Land cover change is a critical factor influencing the evolution of regional GWS. This paper analyzed GWS changes in the Loess Plateau using GRACE-GLDAS data and validated the consistency of the results by comparing them with measured data from groundwater monitoring wells. High-resolution land cover data, ERA5-Land data, and multiple statistical sources are used to examine the spatial and temporal evolution of groundwater in the Loess Plateau and its driving factors. The following conclusions are drawn:
(1)
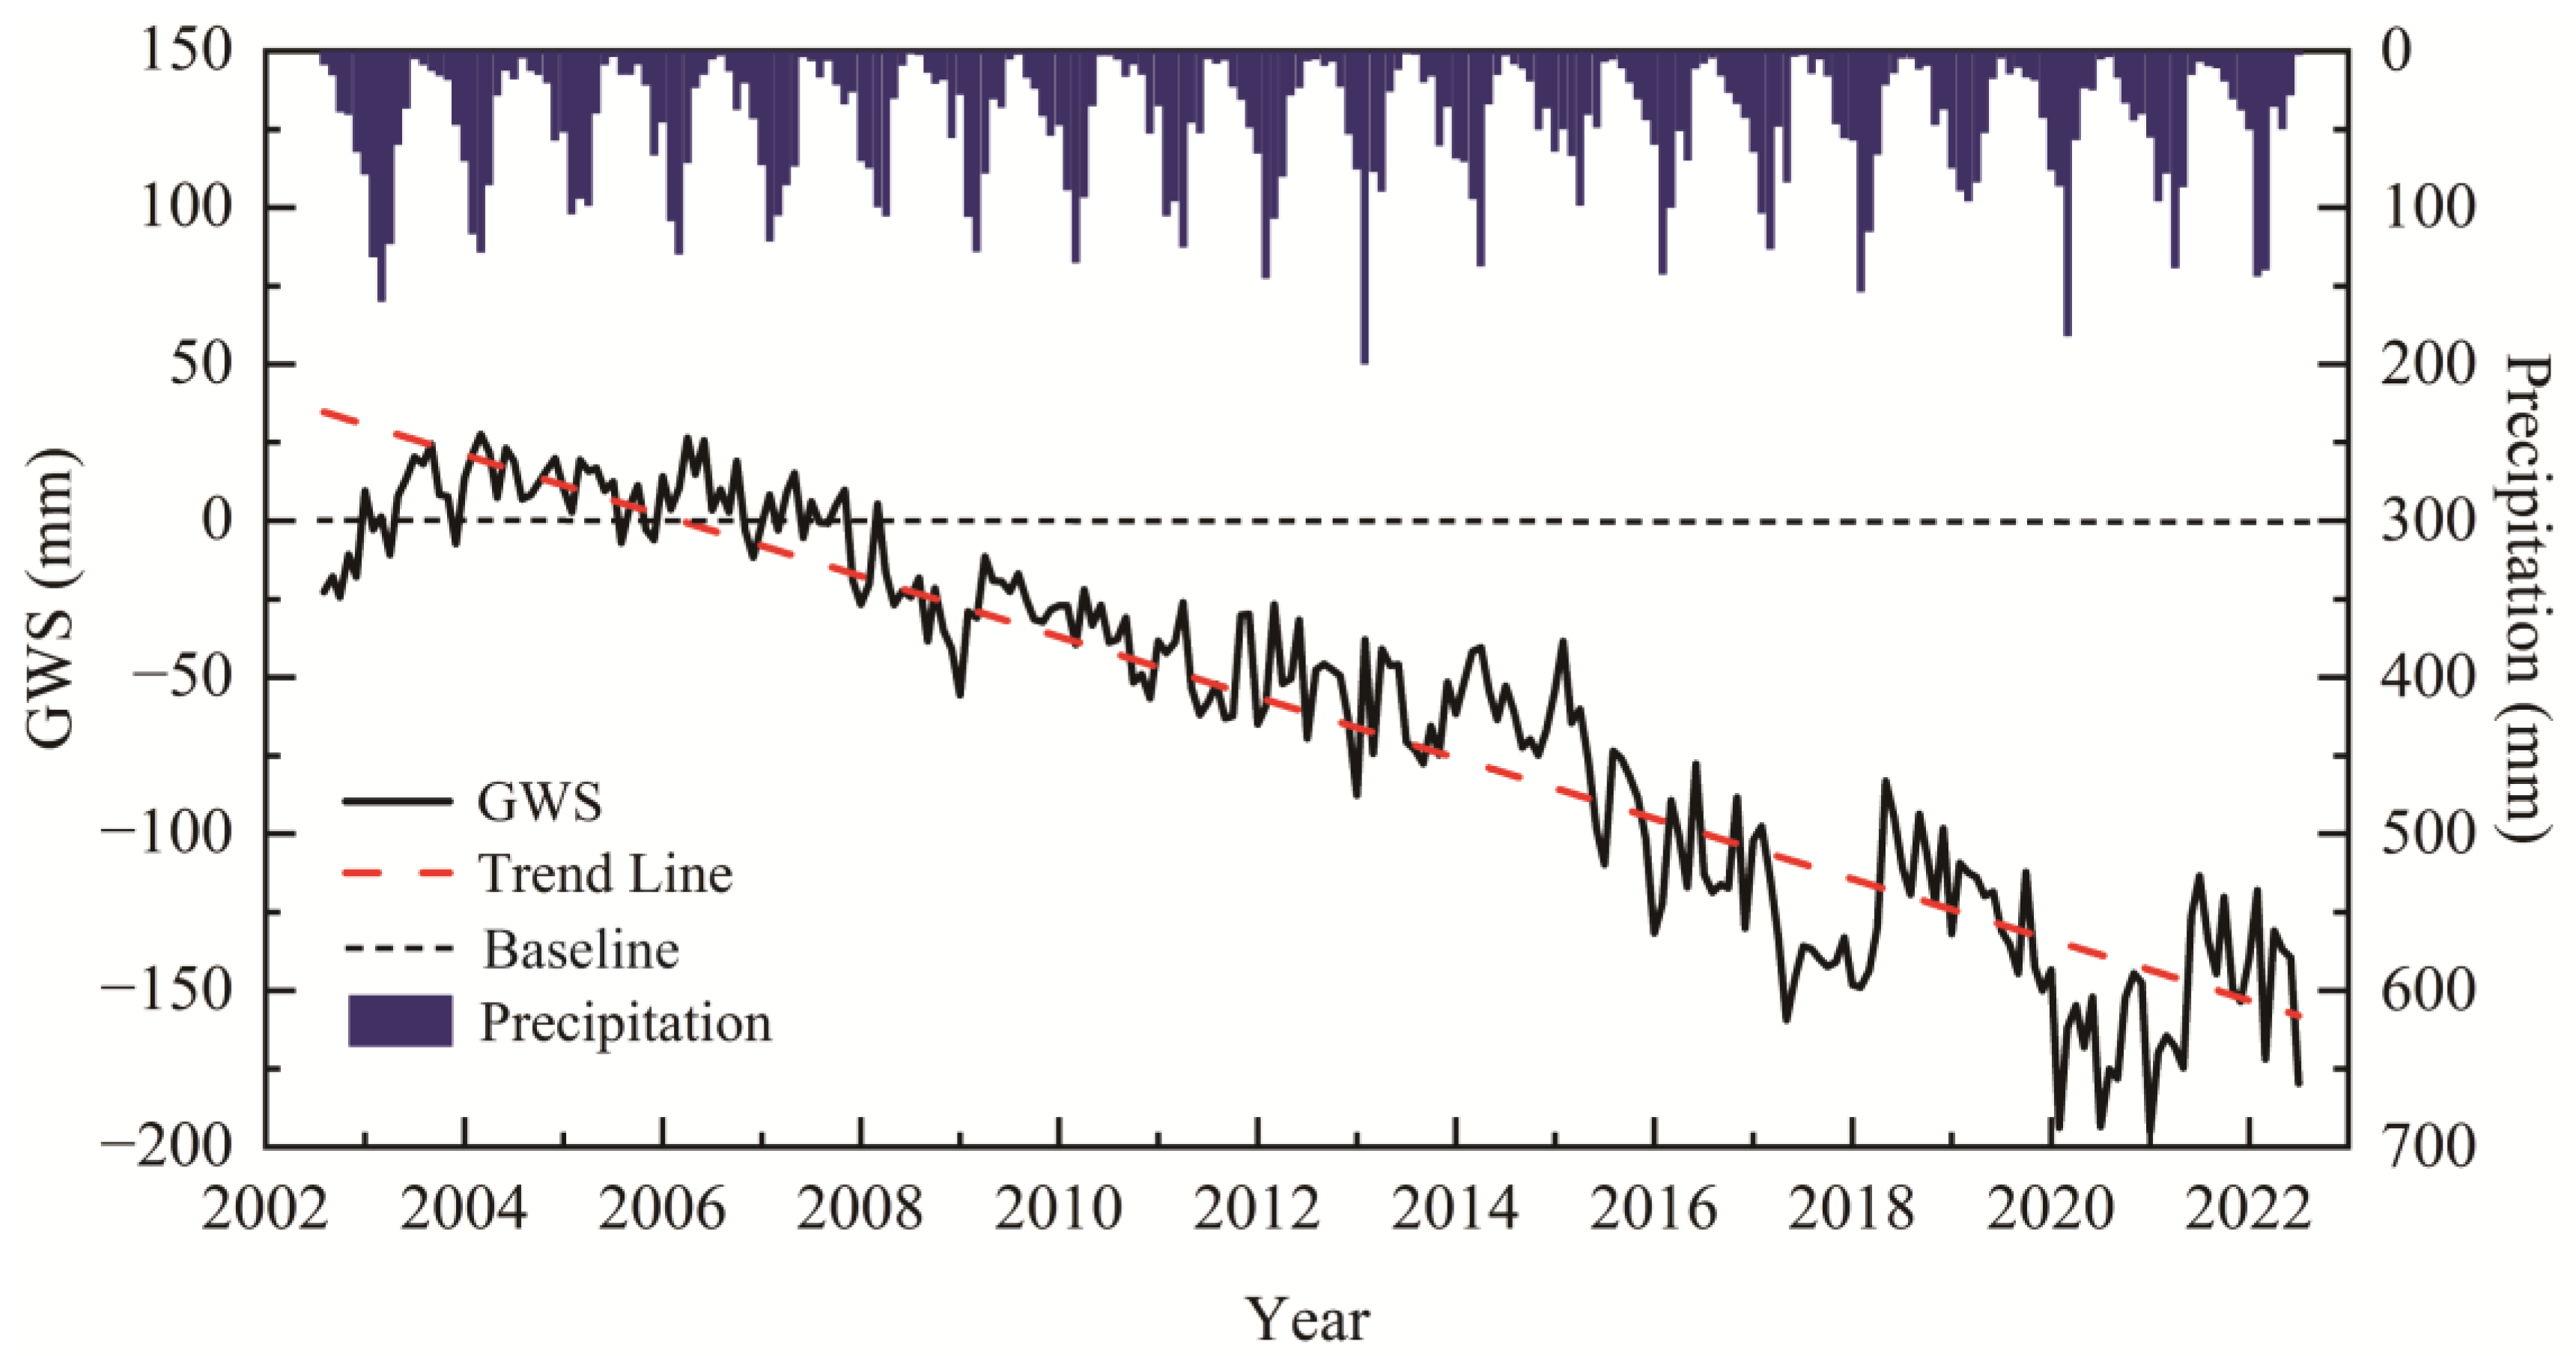
GWS in the Loess Plateau decreased at an average rate of around −6.9 ± 3.84 mm/yr between 2003 and 2022. The total GWS dropped from −4.5 mm in 2003 to −138.5 mm in 2022, amounting to a total groundwater loss of 88 km3.
(2)
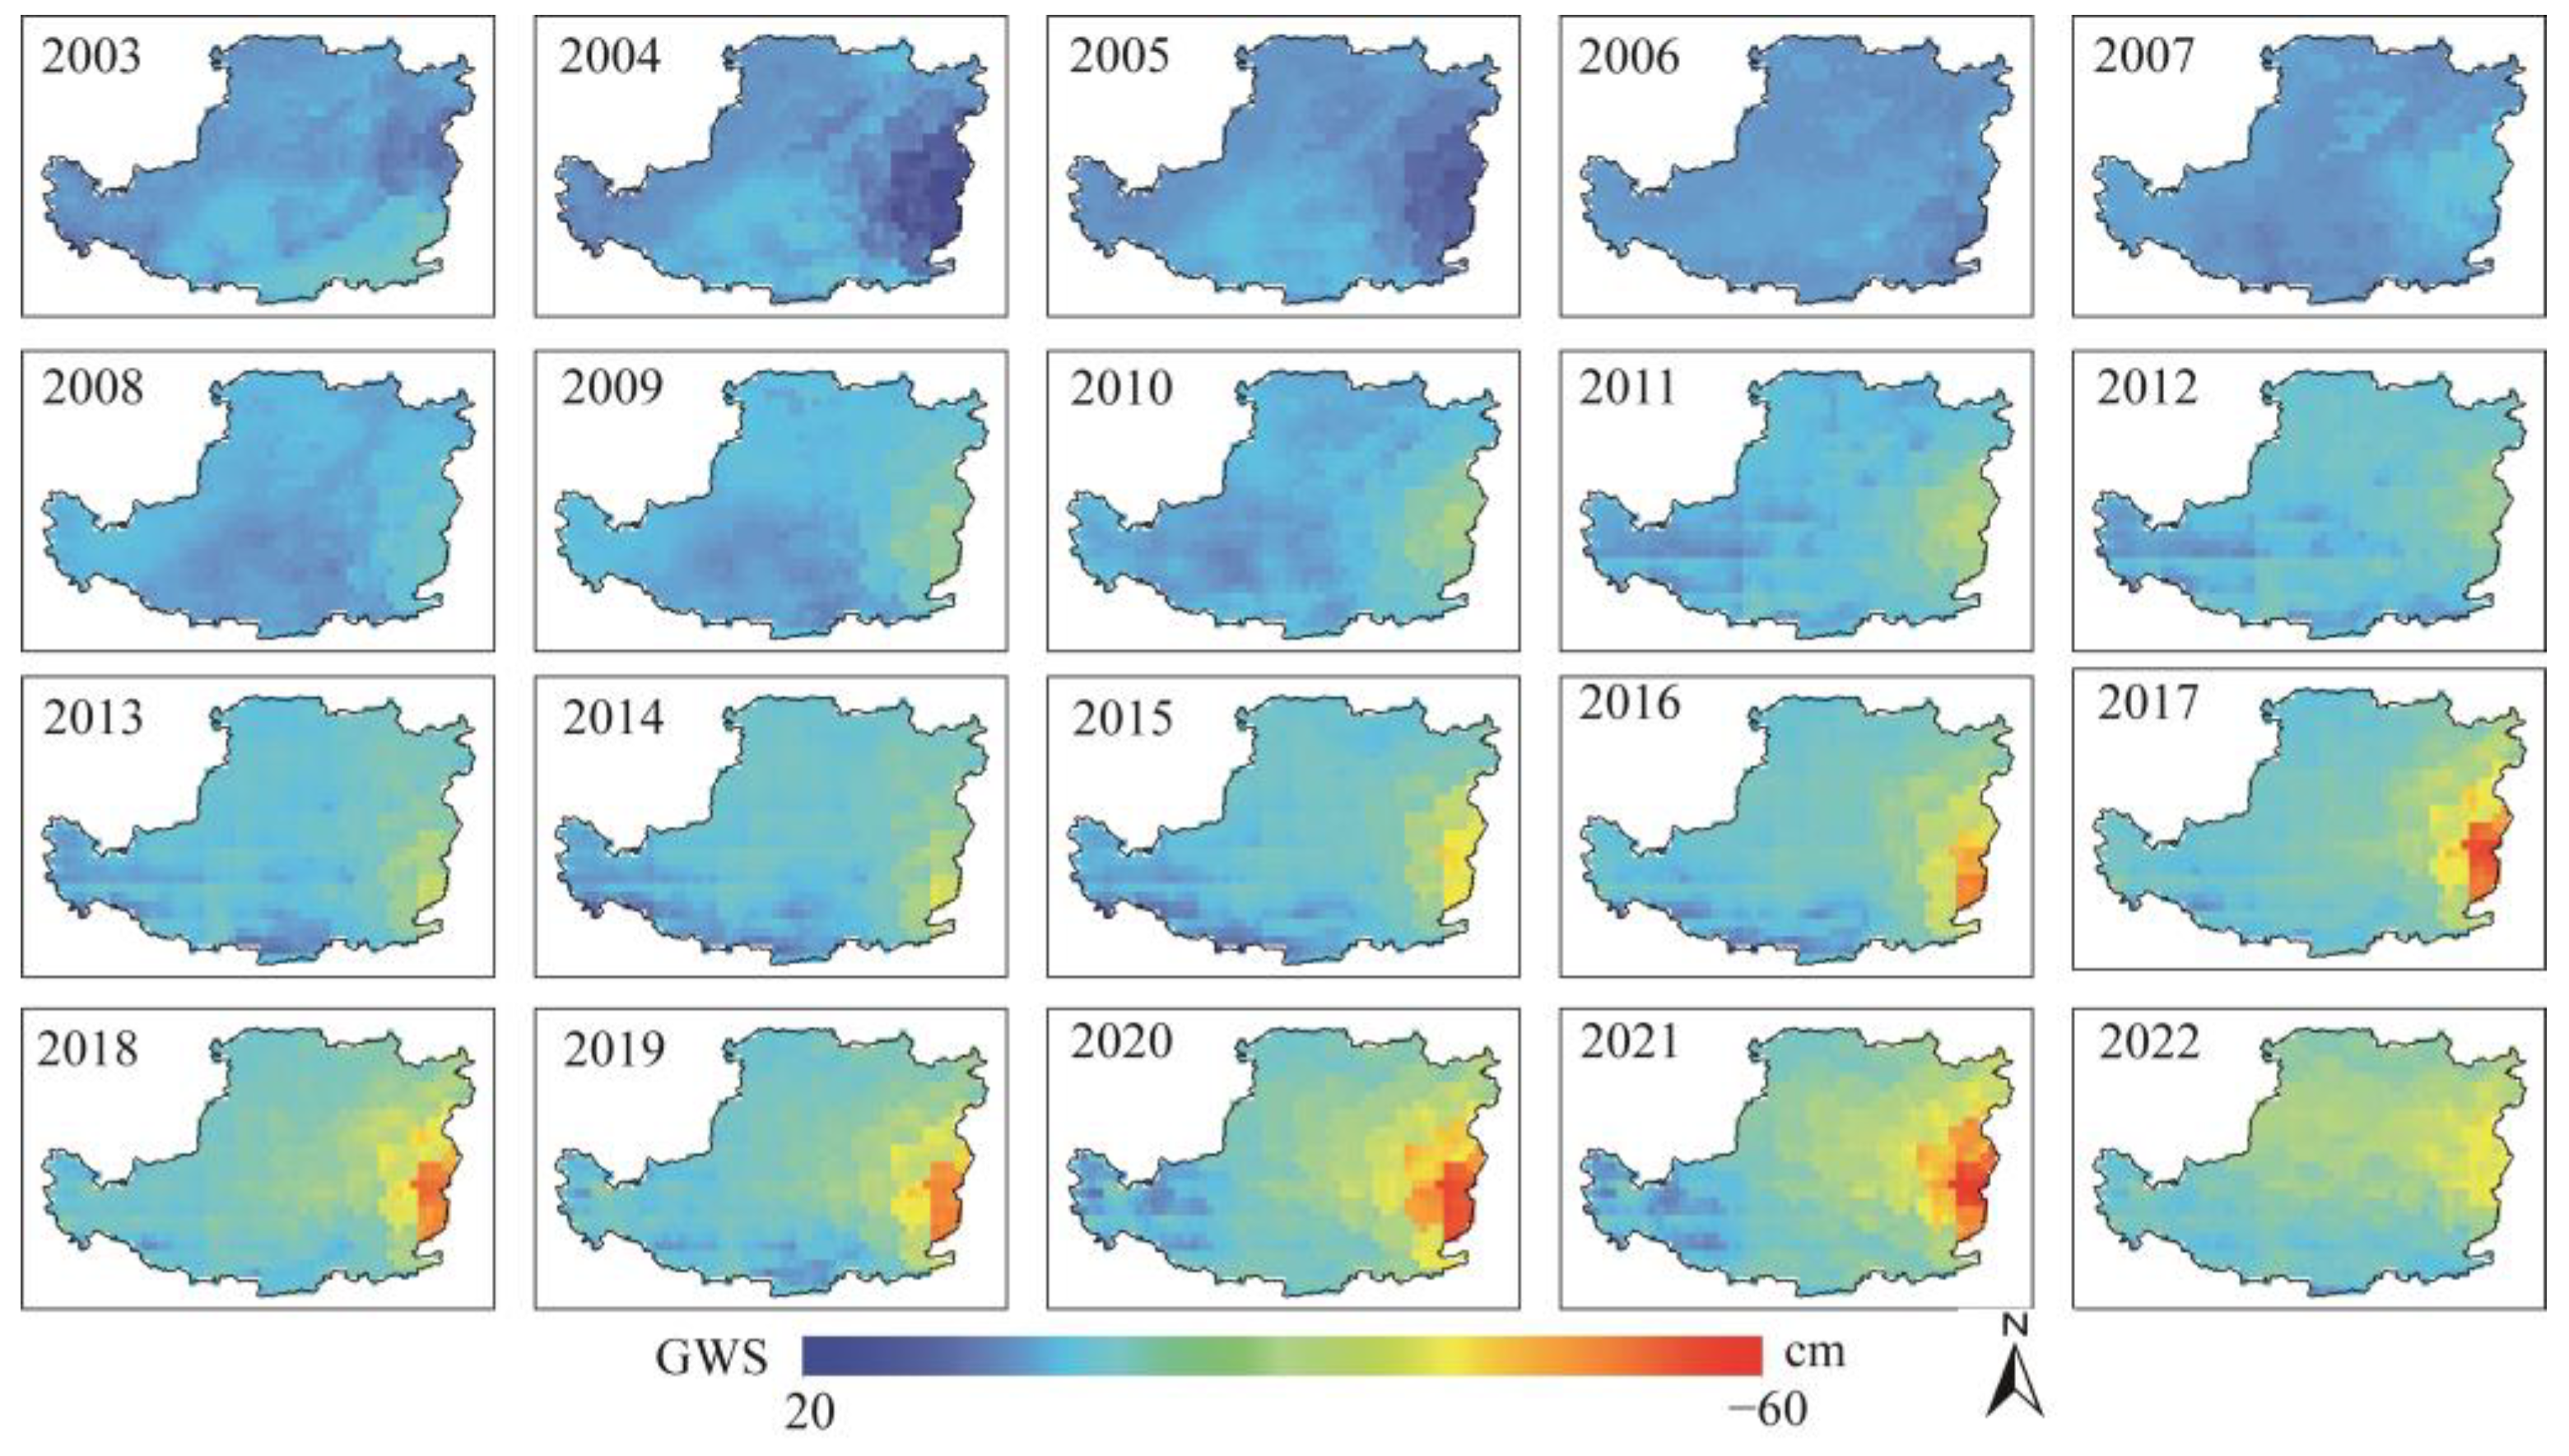
Spatially, the eastern Loess Plateau is a hotspot for groundwater depletion, with storage declining at a rate of approximately −10.6 ± 7.54 mm/yr, which is higher than the overall average (−6.9 mm/yr), and 150% of the overall rate of decline in the Loess Plateau.
(3)
An assessment of groundwater sustainability using the reliability-resilience-vulnerability (RRV) framework reveals that groundwater in the Loess Plateau is at critically unsustainable levels. Although there was a slight recovery in the sustainability index between 2003 and 2006, the index has consistently deteriorated since 2006 (the Sustainability Index classification has remained extremely unsustainable). Groundwater sustainability is relatively better in the western part of the Plateau compared to the central and eastern regions.
(4)
Climatic factors such as precipitation, evaporation, and runoff show no significant correlation with changes in GWS in the Loess Plateau. In contrast, human activities, particularly increased water consumption and forest expansion, are the dominant drivers of GWS decline, collectively accounting for 95.8% of the reduction observed.

Author Contributions

J.L.: Conceptualization, Methodology, Software, Writing—original draft; J.M.: Supervision, Funding acquisition, Writing—review and editing. All authors have read and agreed to the published version of the manuscript.

Funding

This study was supported by the Gansu Provincial Water Conservancy Scientific Research and Technology Promotion Program (Numbers: 22GSLK054, 22GSLK057) and Water Resources Department Project of Water Resources Evolution and Regulation in the Jinghe River basin under Changing Environment.

Data Availability Statement

The GRACE data used in this study are openly available at https://www2.csr.utexas.edu/grace/RL06_mascons.html (accessed on 26 April 2023). The GLDAS data can be accessed from https://disc.gsfc.nasa.gov/datasets/GLDAS_NOAH025_M_2.1/summary (accessed on 16 May 2023). Groundwater monitoring well data are documented in the China Geological Environment Monitoring Groundwater Level Yearbook and are available at https://www.ngac.cn (accessed on 4 September 2024). Land use data are available at https://zenodo.org/records/8176941 (accessed on 6 April 2024). ERA5-Land data can be accessed at https://cds.climate.copernicus.eu/datasets (accessed on 22 June 2024).

Acknowledgments

We thank Ruixi Yang for her assistance in data organization and visualization. We also extend our gratitude to the editor and anonymous reviewers for their meticulous and constructive feedback, which greatly improved the quality of this manuscript.

Conflicts of Interest

The authors declare no conflicts of interest.

References

  1. Zhao, K.Y.; Fang, Z.H.; Li, J.W.; He, C.Y. Spatial-temporal variations of groundwater storage in China: A multiscale analysis based on GRACE data. Resour. Conserv. Recycl. 2023, 197, 107088. [Google Scholar] [CrossRef]
  2. Asoka, A.; Gleeson, T.; Wada, Y.; Mishra, V. Relative contribution of monsoon precipitation and pumping to changes in groundwater storage in India. Nat. Geosci. 2017, 10, 109–117. [Google Scholar] [CrossRef]
  3. Zhao, A.Z.; Xiang, K.Z.; Zhang, A.B.; Zhang, X.R. Spatial-temporal evolution of meteorological and groundwater droughts and their relationship in the North China Plain. J. Hydrol. 2022, 610, 127903. [Google Scholar] [CrossRef]
  4. Han, Z.M.; Huang, S.Z.; Huang, Q.; Leng, G.Y.; Wang, H.; Bai, Q.J.; Zhao, J.; Ma, L.; Wang, L.; Du, M. Propagation dynamics from meteorological to groundwater drought and their possible influence factors. J. Hydrol. 2019, 578, 124102. [Google Scholar] [CrossRef]
  5. Kahil, M.T.; Dinar, A.; Albiac, J. Cooperative water management and ecosystem protection under scarcity and drought in arid and semiarid regions. Water Resour. Econ. 2016, 13, 60–74. [Google Scholar] [CrossRef]
  6. Thomas, E.; Wilson, D.; Kathuni, S.; Libey, A.; Chintalapati, P.; Coyle, J. A contribution to drought resilience in East Africa through groundwater pump monitoring informed by in-situ instrumentation, remote sensing and ensemble machine learning. Sci. Total Environ. 2021, 780, 146486. [Google Scholar] [CrossRef]
  7. Famiglietti, J.S. The global groundwater crisis. Nat. Clim. Chang. 2014, 4, 945–948. [Google Scholar] [CrossRef]
  8. Yifru, B.A.; Lee, S.; Bak, S.; Bae, J.H.; Shin, H.; Lim, K.J. Estimating exploitable groundwater for agricultural use under environmental flow constraints using an integrated SWAT-MODFLOW model. Agric. Water Manag. 2024, 303, 109024. [Google Scholar] [CrossRef]
  9. Qu, W.; Zhang, P.F.; Chen, P.A.; Li, J.Y.; Gao, Y. Spatiotemporal Variations and Sustainability Characteristics of Groundwater Storage in North China from 2002 to 2022 Revealed by GRACE/GRACE Follow-On and Multiple Hydrologic Data. Remote Sens. 2024, 16, 1176. [Google Scholar] [CrossRef]
  10. Cao, L.; Liu, X.Q.; Zhu, P.C.; Wang, L.F. The Distribution and Evolution of Groundwater Level Depths and Groundwater Sustainability in the Hexi Corridor over the Last Five Years. Sustainability 2024, 16, 2527. [Google Scholar] [CrossRef]
  11. Bera, A.; Baranval, N.K.; Kumar, R.; Pal, S.K. Groundwater drought risk assessment in the semi-arid Kansai river basin, West Bengal, India using SWAT and machine learning models. Groundw. Sustain. Dev. 2024, 26, 101254. [Google Scholar] [CrossRef]
  12. Arshad, A.; Mirchi, A.; Samimi, M.; Ahmad, B. Combining downscaled-GRACE data with SWAT to improve the estimation of groundwater storage and depletion variations in the Irrigated Indus Basin (IIB). Sci. Total Environ. 2022, 838, 156044. [Google Scholar] [CrossRef] [PubMed]
  13. Jasechko, S.; Perrone, D. Global groundwater wells at risk of running dry. Science 2021, 372, 418–421. [Google Scholar] [CrossRef]
  14. Huang, J.; Cao, L.H.; Yu, F.R.; Liu, X.B.; Wang, L. Groundwater Drought and Cycles in Xuchang City, China. Front. Earth Sci. 2021, 9, 736305. [Google Scholar] [CrossRef]
  15. Jin, Z.; Guo, L.; Fan, B.H.; Lin, H.; Yu, Y.L.; Zheng, H.; Chu, G.C.; Zhang, J.; Hopkins, I. Effects of afforestation on soil and ambient air temperature in a pair of catchments on the Chinese Loess Plateau. CATENA 2019, 175, 356–366. [Google Scholar] [CrossRef]
  16. Thomas, B.F.; Famiglietti, J.S.; Landerer, F.W.; Wiese, D.N.; Molotch, N.P.; Argus, D.F. GRACE Groundwater Drought Index: Evaluation of California Central Valley groundwater drought. Remote Sens. Environ. 2017, 198, 384–392. [Google Scholar] [CrossRef]
  17. Chen, J.L.; Wilson, C.R.; Tapley, B.D.; Scanlon, B.; Güntner, A. Long-term groundwater storage change in Victoria, Australia from satellite gravity and in situ observations. Glob. Planet. Chang. 2016, 139, 56–65. [Google Scholar] [CrossRef]
  18. Li, B.L.; Rodell, M.; Kumar, S.; Beaudoing, H.K.; Getirana, A.; Zaitchik, B.F.; de Goncalves, L.G.; Cossetin, C.; Bhanja, S.; Mukherjee, A.; et al. Global GRACE Data Assimilation for Groundwater and Drought Monitoring: Advances and Challenges. Water Resour. Res. 2019, 55, 7564–7586. [Google Scholar] [CrossRef]
  19. Scanlon, B.R.; Zhang, Z.; Save, H.; Sun, A.Y.; Schmied, H.M.; van Beek, L.P.H.; Wiese, D.N.; Wada, Y.; Long, D.; Reedy, R.C.; et al. Global models underestimate large decadal declining and rising water storage trends relative to GRACE satellite data. Proc. Natl. Acad. Sci. USA 2018, 115, E1080–E1089. [Google Scholar] [CrossRef]
  20. Liu, M.Z.; Pei, H.W.; Shen, Y.J. Evaluating dynamics of GRACE groundwater and its drought potential in Taihang Mountain Region, China. J. Hydrol. 2022, 612, 128156. [Google Scholar] [CrossRef]
  21. Zhao, J.; Li, G.; Zhu, Z.Y.; Hao, Y.H.; Hao, H.Q.; Yao, J.Q.; Bao, T.; Liu, Q.; Yeh, T.C.J. Analysis of the spatiotemporal variation of groundwater storage in Ordos Basin based on GRACE gravity satellite data. J. Hydrol. 2024, 632, 130931. [Google Scholar] [CrossRef]
  22. Amiri, V.; Ali, S.; Sohrabi, N. Estimating the spatio-temporal assessment of GRACE/GRACE-FO derived groundwater storage depletion and validation with in-situ water quality data (Yazd province, central Iran). J. Hydrol. 2023, 620, 129416. [Google Scholar] [CrossRef]
  23. Pokhrel, Y.; Felfelani, F.; Satoh, Y.; Boulange, J.; Burek, P.; Gädeke, A.; Gerten, D.; Gosling, S.N.; Grillakis, M.; Gudmundsson, L.; et al. Global terrestrial water storage and drought severity under climate change. Nat. Clim. Chang. 2021, 11, 226–233. [Google Scholar] [CrossRef]
  24. Wada, Y.; Bierkens, M.F.; De Roo, A.; Dirmeyer, P.A.; Famiglietti, J.S.; Hanasaki, N.; Konar, M.; Liu, J.; Schmied, H.M.; Oki, T.J.H.; et al. Human–water interface in hydrological modelling: Current status and future directions. Hydrol. Earth Syst. Sci. 2017, 21, 4169–4193. [Google Scholar] [CrossRef]
  25. Rodell, M.; Velicogna, I.; Famiglietti, J.S. Satellite-based estimates of groundwater depletion in India. Nature 2009, 460, 999–1002. [Google Scholar] [CrossRef]
  26. Xu, N.; Lu, H.; Li, W.; Gong, P. Natural lakes dominate global water storage variability. Sci. Bull. 2024, 69, 1016–1019. [Google Scholar] [CrossRef]
  27. Zhang, C.; Chen, P.; Zhu, C.C.; Lu, J.R.; Zhang, Y.C.; Yang, X.Y.; Wu, M.Y. Assessment of natural and anthropogenic impacts on terrestrial water storage in the Loess Plateau based on different types of GRACE/GRACE-FO solutions. J. Mt. Sci. 2024, 21, 2173–2192. [Google Scholar] [CrossRef]
  28. Cai, Y.; Zhang, F.; Duan, P.; Jim, C.Y.; Chan, N.W.; Shi, J.; Liu, C.; Wang, J.; Bahtebay, J.; Ma, X. Vegetation cover changes in China induced by ecological restoration-protection projects and land-use changes from 2000 to 2020. CATENA 2022, 217, 106530. [Google Scholar] [CrossRef]
  29. Wen, X.; Zhen, L. Soil erosion control practices in the Chinese Loess Plateau: A systematic review. Environ. Dev. 2020, 34, 100493. [Google Scholar] [CrossRef]
  30. Cao, S.; Zhang, J.; Chen, L.; Zhao, T. Ecosystem water imbalances created during ecological restoration by afforestation in China, and lessons for other developing countries. J. Environ. Manag. 2016, 183, 843–849. [Google Scholar] [CrossRef]
  31. Ramjeawon, M.; Demlie, M.; Toucher, M. Analyses of groundwater storage change using GRACE satellite data in the Usutu-Mhlatuze drainage region, north-eastern South Africa. J. Hydrol.-Reg. Stud. 2022, 42, 101118. [Google Scholar] [CrossRef]
  32. Wei, L.Y.; Jiang, S.H.; Ren, L.L.; Tan, H.B.; Ta, W.Q.; Liu, Y.; Yang, X.L.; Zhang, L.Q.; Duan, Z. Spatiotemporal changes of terrestrial water storage and possible causes in the closed Qaidam Basin, China using GRACE and GRACE Follow-On data. J. Hydrol. 2021, 598, 126274. [Google Scholar] [CrossRef]
  33. Zhong, Y.L.; Zhong, M.; Feng, W.; Zhang, Z.Z.; Shen, Y.C.; Wu, D.C. Groundwater depletion in the West Liaohe River Basin, China and its implications revealed by GRACE and in situ measurements. Remote Sens. 2018, 10, 493. [Google Scholar] [CrossRef]
  34. Mo, X.; Wu, J.J.; Wang, Q.; Zhou, H. Variations in water storage in China over recent decades from GRACE observations and GLDAS. Nat. Hazards Earth Syst. Sci. 2016, 16, 469–482. [Google Scholar] [CrossRef]
  35. Yan, X.; Sun, J.E.; Huang, Y.A.; Xia, Y.; Wang, Z.S.; Li, Z. Detecting and attributing the changes in baseflow in China’s Loess Plateau. J. Hydrol. 2023, 617, 128957. [Google Scholar] [CrossRef]
  36. Li, P.; Chen, J.; Zhao, G.; Holden, J.; Liu, B.; Chan, F.K.S.; Hu, J.; Wu, P.; Mu, X. Determining the drivers and rates of soil erosion on the Loess Plateau since 1901. Sci. Total Environ. 2022, 823, 153674. [Google Scholar] [CrossRef]
  37. Yu, Y.; Zhao, W.; Martinez-Murillo, J.F.; Pereira, P. Loess Plateau: From degradation to restoration. Sci. Total Environ. 2020, 738, 140206. [Google Scholar] [CrossRef]
  38. Han, Z.M.; Huang, Q.; Huang, S.Z.; Leng, G.Y.; Bai, Q.J.; Liang, H.; Wang, L.; Zhao, J.; Fang, W. Spatial-temporal dynamics of agricultural drought in the Loess Plateau under a changing environment: Characteristics and potential influencing factors. Agric. Water Manag. 2021, 244, 106540. [Google Scholar] [CrossRef]
  39. Abbott, B.W.; Bishop, K.; Zarnetske, J.P.; Minaudo, C.; Chapin, F.S.; Krause, S.; Hannah, D.M.; Conner, L.; Ellison, D.; Godsey, S.E.; et al. Human domination of the global water cycle absent from depictions and perceptions. Nat. Geosci. 2019, 12, 533–540. [Google Scholar] [CrossRef]
  40. Yin, J.; He, F.; Xiong, Y.J.; Qiu, G.Y. Effects of land use/land cover and climate changes on surface runoff in a semi-humid and semi-arid transition zone in northwest China. Hydrol. Earth Syst. Sci. 2017, 21, 183–196. [Google Scholar] [CrossRef]
  41. Wang, F.; Wang, Z.; Yang, H.; Di, D.; Zhao, Y.; Liang, Q.J.J.o.H. Utilizing GRACE-based groundwater drought index for drought characterization and teleconnection factors analysis in the North China Plain. J. Hydrol. 2020, 585, 124849. [Google Scholar] [CrossRef]
  42. Yi, S.; Sneeuw, N. Filling the Data Gaps Within GRACE Missions Using Singular Spectrum Analysis. J. Geophys. Res.-Solid Earth 2021, 126, e2020JB021227. [Google Scholar] [CrossRef]
  43. Xie, J.; Xu, Y.-P.; Wang, Y.; Gu, H.; Wang, F.; Pan, S. Influences of climatic variability and human activities on terrestrial water storage variations across the Yellow River basin in the recent decade. J. Hydrol. 2019, 579, 124218. [Google Scholar] [CrossRef]
  44. Yang, J.; Huang, X. The 30 m annual land cover dataset and its dynamics in China from 1990 to 2019. Earth Syst. Sci. Data 2021, 13, 3907–3925. [Google Scholar] [CrossRef]
  45. Praveen, B.; Talukdar, S.; Shahfahad; Mahato, S.; Mondal, J.; Sharma, P.; Islam, A.M.T.; Rahman, A. Analyzing trend and forecasting of rainfall changes in India using non-parametrical and machine learning approaches. Sci. Rep. 2020, 10, 10342. [Google Scholar] [CrossRef]
  46. Ahmad, I.; Zhang, F.; Tayyab, M.; Anjum, M.N.; Zaman, M.; Liu, J.G.; Farid, H.U.; Saddique, Q. Spatiotemporal analysis of precipitation variability in annual, seasonal and extreme values over upper Indus River basin. Atmos. Res. 2018, 213, 346–360. [Google Scholar] [CrossRef]
  47. Loucks, D.P. Quantifying trends in system sustainability. Hydrol. Sci. J. 1997, 42, 513–530. [Google Scholar] [CrossRef]
  48. Feng, W.; Zhong, M.; Lemoine, J.M.; Biancale, R.; Hsu, H.T.; Xia, J. Evaluation of groundwater depletion in North China using the Gravity Recovery and Climate Experiment (GRACE) data and ground-based measurements. Water Resour. Res. 2013, 49, 2110–2118. [Google Scholar] [CrossRef]
  49. Ashraf, S.; Ali, M.; Shrestha, S.; Hafeez, M.A.; Moiz, A.; Sheikh, Z.A. Impacts of climate and land-use change on groundwater recharge in the semi-arid lower Ravi River basin, Pakistan. Groundw. Sustain. Dev. 2022, 17, 100743. [Google Scholar] [CrossRef]
  50. Yin, Z.; Xu, Y.; Zhu, X.; Zhao, J.; Yang, Y.; Li, J. Variations of groundwater storage in different basins of China over recent decades. J. Hydrol. 2021, 598, 126282. [Google Scholar] [CrossRef]
  51. Riedel, T.; Weber, T.K. The influence of global change on Europe’s water cycle and groundwater recharge. Hydrogeol. J. 2020, 28, 1939–1959. [Google Scholar] [CrossRef]
  52. Chen, X.; Jiang, J.; Lei, T.; Yue, C. GRACE satellite monitoring and driving factors analysis of groundwater storage under high-intensity coal mining conditions: A case study of Ordos, northern Shaanxi and Shanxi, China. Hydrogeol. J. 2020, 28, 673–686. [Google Scholar] [CrossRef]
  53. Adhikari, R.K.; Mohanasundaram, S.; Shrestha, S. Impacts of land-use changes on the groundwater recharge in the Ho Chi Minh city, Vietnam. Environ. Res. 2020, 185, 109440. [Google Scholar] [CrossRef] [PubMed]
  54. Huang, T.M.; Pang, Z.H. Estimating groundwater recharge following land-use change using chloride mass balance of soil profiles: A case study at Guyuan and Xifeng in the Loess Plateau of China. Hydrogeol. J. 2011, 19, 177–186. [Google Scholar] [CrossRef]
  55. Chen, P.Y.; Ma, X.Y.; Ma, J.Z.; Zeng, H.T.; Huang, Q.M.; Wang, Y.Y.; Zhou, Y.; Zhang, L. Discrepancy and estimates of groundwater recharge under different land use types on the Loess Plateau. J. Hydrol. Reg. Stud 2024, 53, 101793. [Google Scholar] [CrossRef]
  56. Zhang, Z.D.; Huang, M.B.; Zhao, X.F.; Wu, L.H. Adjustments of leaf traits and whole plant leaf area for balancing water supply and demand in Robinia pseudoacacia under different precipitation conditions on the Loess Plateau. Agric. For. Meteorol. 2019, 279, 107733. [Google Scholar] [CrossRef]
  57. Jia, X.X.; Wang, Y.Q.; Shao, M.A.; Luo, Y.; Zhang, C.C. Estimating regional losses of soil water due to the conversion of agricultural land to forest in China’s Loess Plateau. Ecohydrology 2017, 10, e1851. [Google Scholar] [CrossRef]
  58. Zhang, Q.; Lv, X.; Yu, X.; Ni, Y.; Ma, L.; Liu, Z. Species and spatial differences in vegetation rainfall interception capacity: A synthesis and meta-analysis in China. CATENA 2022, 213, 106223. [Google Scholar] [CrossRef]
  59. Zhong, L.H.; Hua, L.J.; Yao, Y.; Feng, J.M. Interdecadal aridity variations in Central Asia during 1950-2016 regulated by oceanic conditions under the background of global warming. Clim. Dyn. 2021, 56, 3665–3686. [Google Scholar] [CrossRef]
  60. Zhang, Q.; Yang, J.H.; Wang, W.; Ma, P.L.; Lu, G.Y.; Liu, X.Y.; Yu, H.P.; Fang, F. Climatic Warming and Humidification in the Arid Region of Northwest China: Multi-Scale Characteristics and Impacts on Ecological Vegetation. J. Meteorolog. Res. 2021, 35, 113–127. [Google Scholar] [CrossRef]
  61. Wang, Q.; Zhai, P.-M.; Qin, D.-H. New perspectives on ‘warming–wetting’ trend in Xinjiang, China. Adv. Clim. Chang. Res. 2020, 11, 252–260. [Google Scholar] [CrossRef]
  62. Li, M.X.; Ma, Z.G. Decadal changes in summer precipitation over arid northwest China and associated atmospheric circulations. Int. J. Climatol. 2018, 38, 4496–4508. [Google Scholar] [CrossRef]
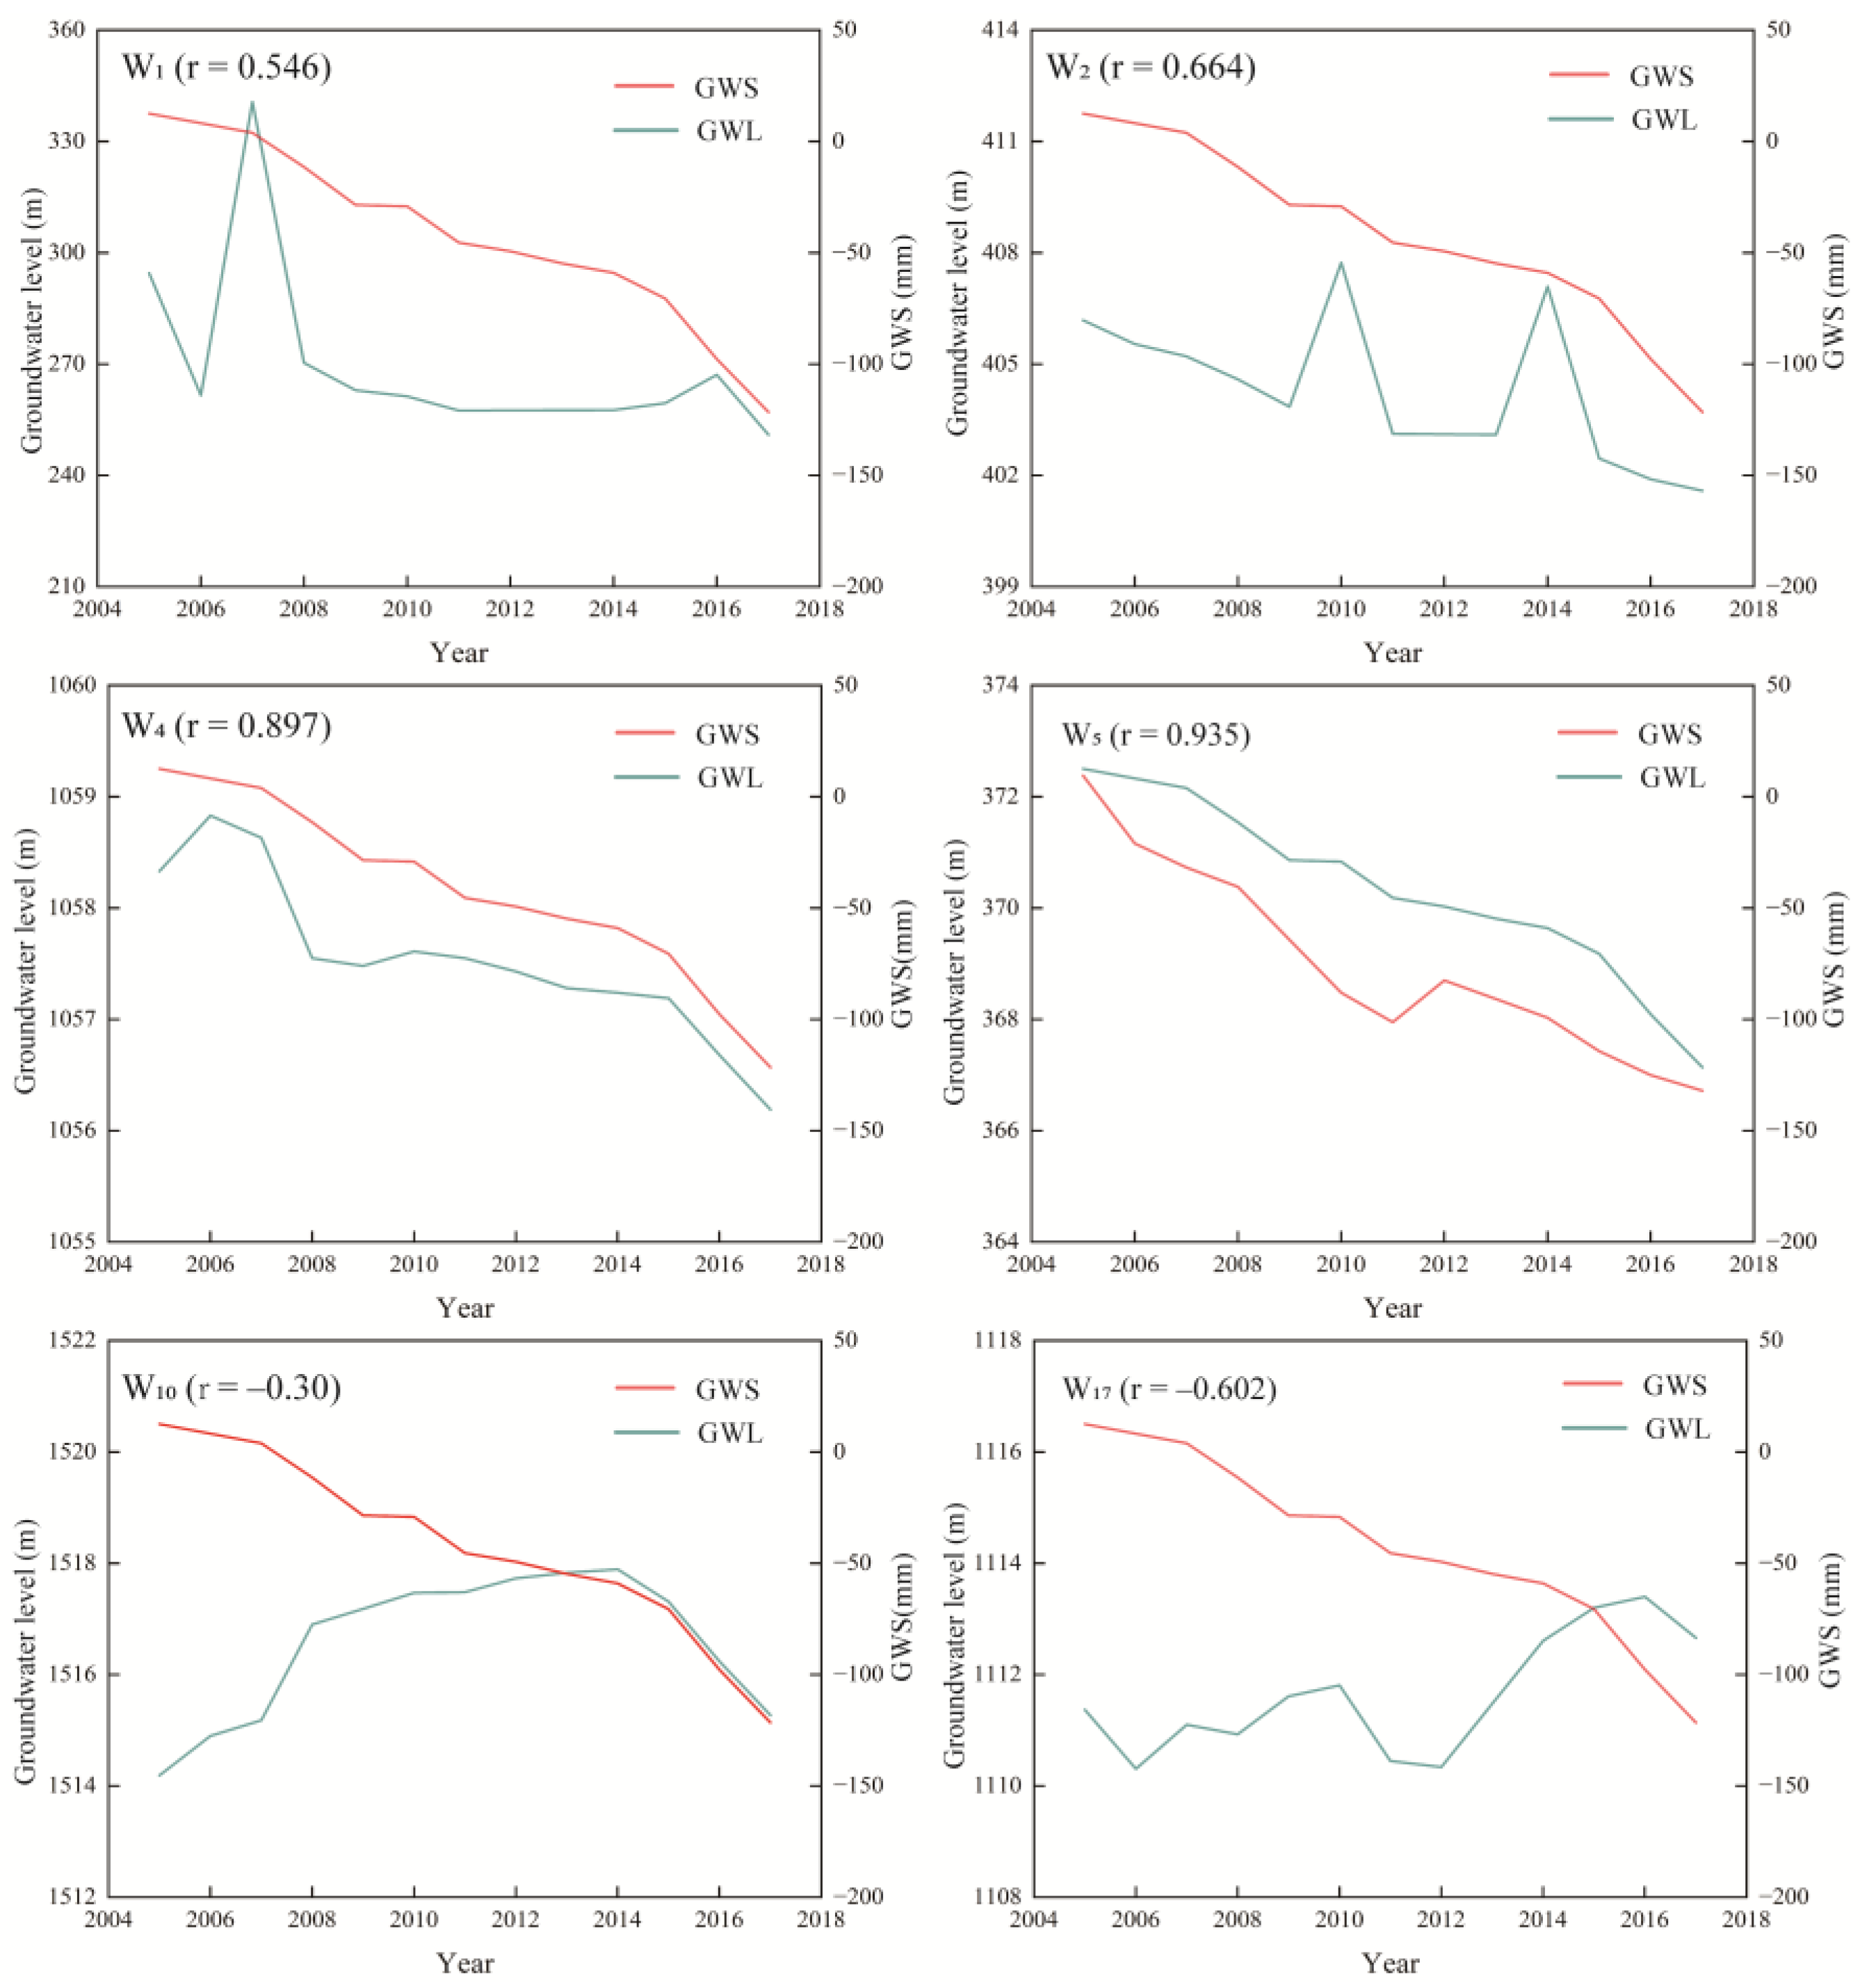
Figure 1. Location of the Loess Plateau in China: (a) DEM; (b) precipitation; (c) surface runoff; (d) evaporation; (e) land cover types.
Remotesensing 16 04375 g001
Figure 2. Comparison of groundwater level changes in typical monitoring wells with GWS evolution trends.
Remotesensing 16 04375 g002
Figure 3. Interannual variation in GWS in the Loess Plateau.
Remotesensing 16 04375 g003
Figure 4. Average monthly GWS in the Loess Plateau from 2003 to 2022.
Remotesensing 16 04375 g004
Figure 5. Annual average GWS in the Loess Plateau for the period 2003 to 2022.
Remotesensing 16 04375 g005
Figure 6. Seasonal variation in GWS in the Loess Plateau.
Remotesensing 16 04375 g006
Figure 7. Spatial and temporal characterization of groundwater storage sustainability in the Loess Plateau: (a) spatial characterization of sustainability; (b) spatial characterization of reliability; (c) spatial characterization of resilience; (d) spatial characterization of vulnerability; (e) temporal characterization of sustainability, reliability, resilience, and vulnerability.
Remotesensing 16 04375 g007
Figure 8. Land cover changes in the Loess Plateau.
Remotesensing 16 04375 g008
Figure 9. Correlation between GWS and influencing factors (PRE: precipitation; EVA: evaporation; SR: surface runoff; CS: water consumption; CM: coal mining; FOR: forest; CL: cropland; GL: grassland; IMP: impervious surfaces; BAR: barren land).
Remotesensing 16 04375 g009
Figure 10. Interannual variation in influencing factors.
Remotesensing 16 04375 g010
Table 1. Correlation between measured groundwater level data and GRACE estimates.
WellsLocationElevation (m)Monitoring Depth (m)TypeCorrelation (r)
W1Yuncheng346.7392.20–194.00confined aquifer0.546
W2Linfen447.8257.28–187.00confined aquifer0.664
W3Changzhi934.610.00–160.00confined aquifer0.789
W4Shuozhou1096.40.00–439.94confined aquifer0.897
W5Xian383.1515.00–40.00unconfined aquifer0.935
W6Xian409.2612.00–16.00unconfined aquifer−0.175
W7Xianyang392.8226.00–32.00confined aquifer0.128
W8Xianyang559.0010.00–28.00unconfined aquifer0.737
W9Weinan338.7730.00–45.00unconfined aquifer0.537
W10Lanzhou1523.397.03–94.80unconfined aquifer−0.30
W11Lanzhou1529.269.21–100.80unconfined aquifer0.587
W12Tianshui1209.673.28–7.00unconfined aquifer0.93
W13Dingxi1665.5824.06–45.00unconfined aquifer0.578
W14Qingyang1399.430.00–46.54unconfined aquifer0.949
W15Qingyang1381.150.00–47.00unconfined aquifer−0.869
W16Yinchuan1109.540.00–90.00confined aquifer0.863
W17Yinchuan1120.520.00–45.00confined aquifer−0.602
W18Baotou1025.52154.04–180.59confined aquifer−0.632
W19Baotou 1062.6610.00–40.05unconfined aquifer0.117
W20Xining2506.9412.58–53.00unconfined aquifer0.875
W21Xining2480.491.82–27.30unconfined aquifer0.891
Disclaimer/Publisher’s Note: The statements, opinions and data contained in all publications are solely those of the individual author(s) and contributor(s) and not of MDPI and/or the editor(s). MDPI and/or the editor(s) disclaim responsibility for any injury to people or property resulting from any ideas, methods, instructions or products referred to in the content.

