Article

Quantifying Night Sky Brightness as a Stressor for Coastal Ecosystems in Moreton Bay, Queensland

1
The Department of Geography, The Hebrew University of Jerusalem, Mt Scopus, Jerusalem 91905, Israel
2
The Earth Observation Research Centre, School of the Environment, The University of Queensland, St Lucia, QLD 4072, Australia
3
The Biodiversity Research Group, Centre for Biodiversity and Conservation Science, School of the Environment, The University of Queensland, St Lucia, QLD 4072, Australia
*
Author to whom correspondence should be addressed.
Remote Sens. 2024, 16(20), 3828; https://doi.org/10.3390/rs16203828
Submission received: 29 August 2024 / Revised: 28 September 2024 / Accepted: 29 September 2024 / Published: 15 October 2024
(This article belongs to the Special Issue Nighttime Light Remote Sensing Products for Urban Applications)

Abstract

:
Growing light pollution is increasingly studied in terrestrial environments. However, research on night lights in coastal ecosystems is limited. We aimed to complement spaceborne remote sensing with ground-based hemispheric photos to quantify the exposure of coastal habitats to light pollution. We used a calibrated DSLR Canon camera with a fisheye lens to photograph the night sky in 24 sites in the rapidly developing area of Moreton Bay, Queensland, Australia, extracting multiple brightness metrics. We then examined the use of the LANcubeV2 photometer and night-time satellite data from SDGSAT-1 for coastal areas. We found that the skies were darker in less urbanized areas and on islands compared with the mainland. Sky brightness near the zenith was correlated with satellite observations only at a coarse spatial scale. When examining light pollution horizontally above the horizon (60–80° degrees below the zenith), we found that the seaward direction was brighter than the landward direction in most sites due to urban glow on the seaward side. These findings emphasize the importance of ground measurements of light pollution alongside satellite imagery. In order to reduce the exposure of coastal ecosystems to light pollution, actions need to go beyond sites with conservation importance and extend to adjacent urban areas.

1. Introduction

Coastal ecosystems are important regions for both humans and wildlife, serving as ecotones that connect terrestrial and marine habitats [1]. In Australia, more than 80% of the human population lives along the coasts [2], and thus, these ecosystems are highly threatened by multiple anthropogenic stressors, including artificial night lights [3,4]. Night lights create ‘ecological light pollution’, defined as artificial light changing an ecosystem’s light and darkness patterns [5]. In more natural coastal habitats, the landward horizon is often darker than the seaward horizon due to ocean-reflected starlight and moonlight. However, terrestrial light sources often create the opposite effect, with the landward horizon being brighter. This can adversely affect wildlife, such as disorientating sea turtle hatchlings navigating to the ocean [6] and altering migratory shorebirds’ routes to avoid landing in lit areas [7]. Ecological light pollution has been widely studied across terrestrial environments [8,9], yet coastal habitats are often overlooked, and research focused on night lights in coastal areas is limited [10,11]. It was shown that over 50% of the coasts in Europe and more than 30% of the coasts in Asia are subject to the effects of light pollution [12]. While coastal ecosystems host unique land–sea ecological processes and interactions [1], their exclusion in many night light studies limits our understanding of how light pollution affects these ecotonal systems.
Urbanization pressures in coastal areas both damage, fragment and reduce the size and quality of coastal habitats and increase light pollution in remnant habitats [13]. In addition, it has been noted that the use of satellite images for quantifying ecological light pollution is limited because they mostly measure light emitted (or reflected) upward during clear sky conditions [12]. Moreover, the impact of ‘skyglow’—the increase in sky brightness by water molecules and dust particles scattering artificial light [14]—is understudied since research often focuses on pollution from direct light sources. South-east Queensland is a region of Australia undergoing rapid human population growth [15], so night lights are expected to increase further, particularly with the Olympic Games coming to Brisbane in 2032. This will further impact the coastal habitats of Moreton Bay, one of the largest estuarine bays in Australia, a unique ecosystem that contains many important marine ecosystems [16].
Light pollution studies have implemented a variety of spaceborne [17,18] and ground-based [19,20] remote sensing techniques, each having its advantages and limitations. Satellite imagery can be used to map artificial lights at large spatial and temporal scales but mostly measures light emitted or reflected upward. This is less relevant to many species that perceive light emitted or reflected horizontally [18]. Furthermore, satellite images of night lights usually have coarse spatial resolution and miss smaller isolated light sources. While night-time light images from UAVs [21] or high-altitude balloons [22] can provide higher spatial resolution imagery than spaceborne night-time imagery, they also present overhead imagery which is mostly looking down, which may be relevant for avian species but is less so for ground-dwelling species. Ground-based remote sensing, while not covering large areas, can be more ecologically relevant and may better represent the light to which different species are exposed [18]. Therefore, it is useful to complement the two approaches when quantifying local light pollution, something that is not often done across coastal ecosystems (but see, for example, [23]). A promising technique for quantifying light pollution is using a DLSR camera with fisheye lens to measure hemi-spherical night sky brightness [19,24]. The ground photos can then be calibrated and analyzed using the commercial software “Sky Quality Camera” (SQC) [Euromix, Ljubljana, Slovenia], which is calibrated by standard stars [25]; however, the SQC is proprietary, and its calibration process is not openly available [26]. Another available tool for processing hemispheric DSLR photos is the free software “DiCaLum” [27], also allowing us to obtain quantitative night sky brightness information for assessing ecological light pollution [28]. Night sky camera photos have been increasing in ecological research [19,29] since this method is relatively easy to implement locally across times, seasons and locations and gathers a large amount of night sky data and information [20].
Using Moreton Bay as a case study, we aimed to quantify artificial light around coastal areas to determine which sites were most exposed to light pollution. We address research gaps on coastal light pollution and consolidate the importance of combining spaceborne and ground-based remote sensing.
Our objectives were the following:
  • Examine differences in sky brightness between urban and undeveloped coastal habitats between the Australian mainland and islands within Moreton Bay;
  • Compare the sky brightness between the landward horizon and the seaward horizon;
  • Complement three remote sensing techniques, including satellite imagery, hemispheric photographs and ground photometers, allowing a comprehensive study of light pollution.
We expected that the seaward horizon would be darker than the landward horizon due to terrestrial urban light sources. We also hypothesized that night-time brightness, as measured using ground photos and satellite images, would be better correlated at coarser spatial scales.

2. Materials and Methods

2.1. Study Locations

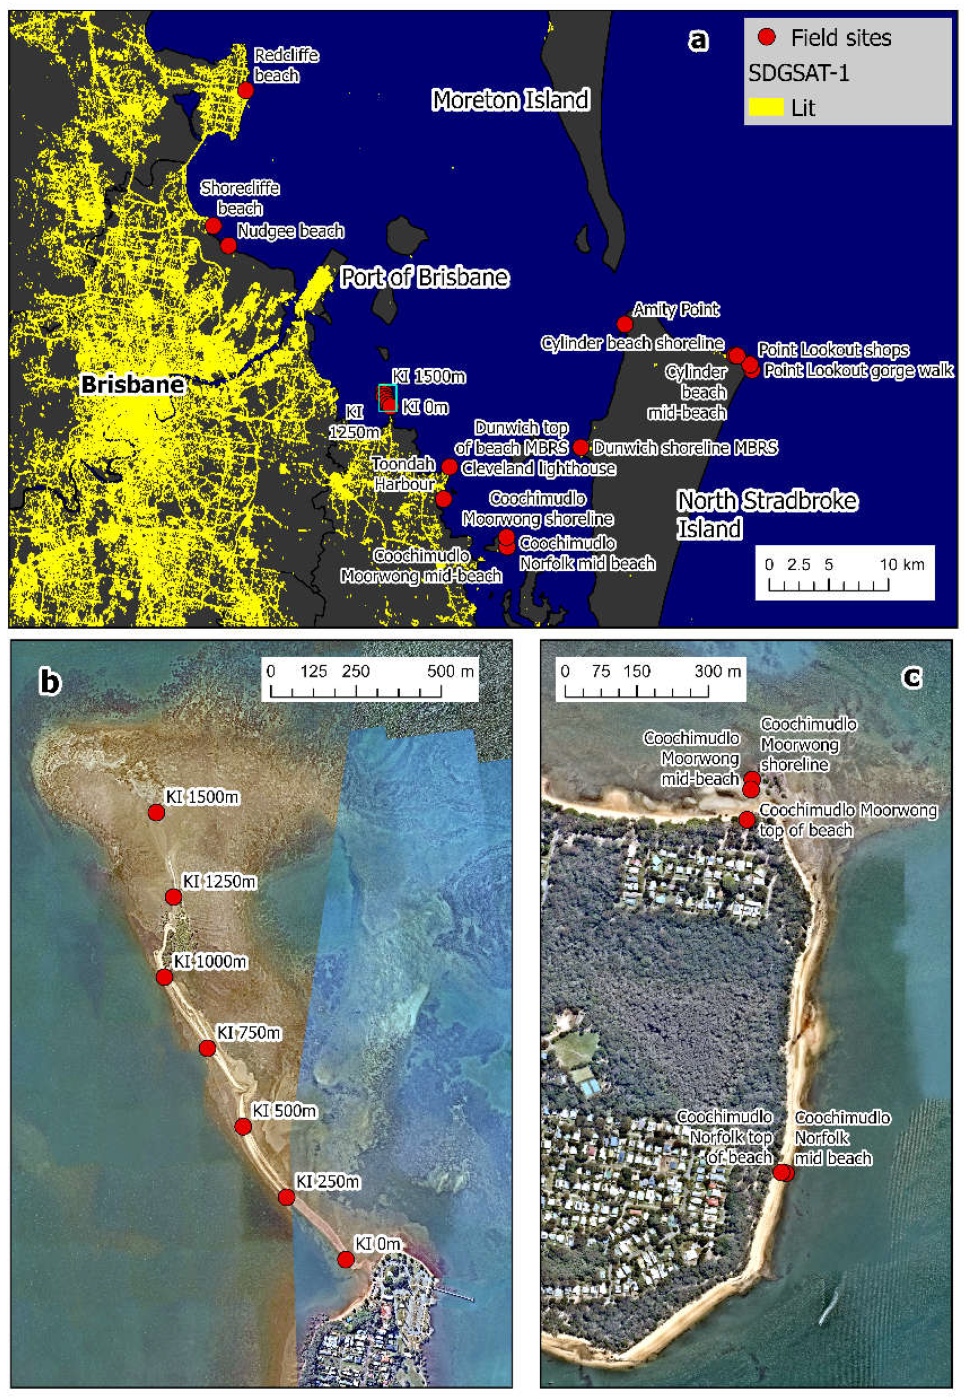
Moreton Bay was chosen for this case study (Figure 1), being the most populated and a fast-growing region of Queensland, Australia [30]. It covers around ~23,000 sq km [30], and its coastline encompasses a diversity of night light intensities. To represent light pollution on islands of different sizes and urbanization levels, we chose King Island, Kutchi-mudlo Island (Coochimudlo) and Minjerribah (North Stradbroke Island). King Island is a small, uninhabited island connected by a sandbank from Wellington Point in Brisbane that is only accessible by walking at low tide (see Figure 2). Coochimudlo is 5 sq km in size holding a small population (Figure 2), and Minjerribah is the largest island at 275 sq km with three towns: Point Lookout, Amity and Dunwich. We compared sites of varying urban development along the mainland’s coast: Toondah Harbour (an uninhabited tidal flat) and Cleveland (a built-up area of shops, a small port and a lighthouse) on the south side and Nudgee Beach (a natural beach area near a small suburb), Shorncliffe and Redcliffe (urbanized beach areas) on the north side of the bay (Figure 1 and Figure 2).

2.2. Field Work

2.2.1. Night Light Measurement Equipment

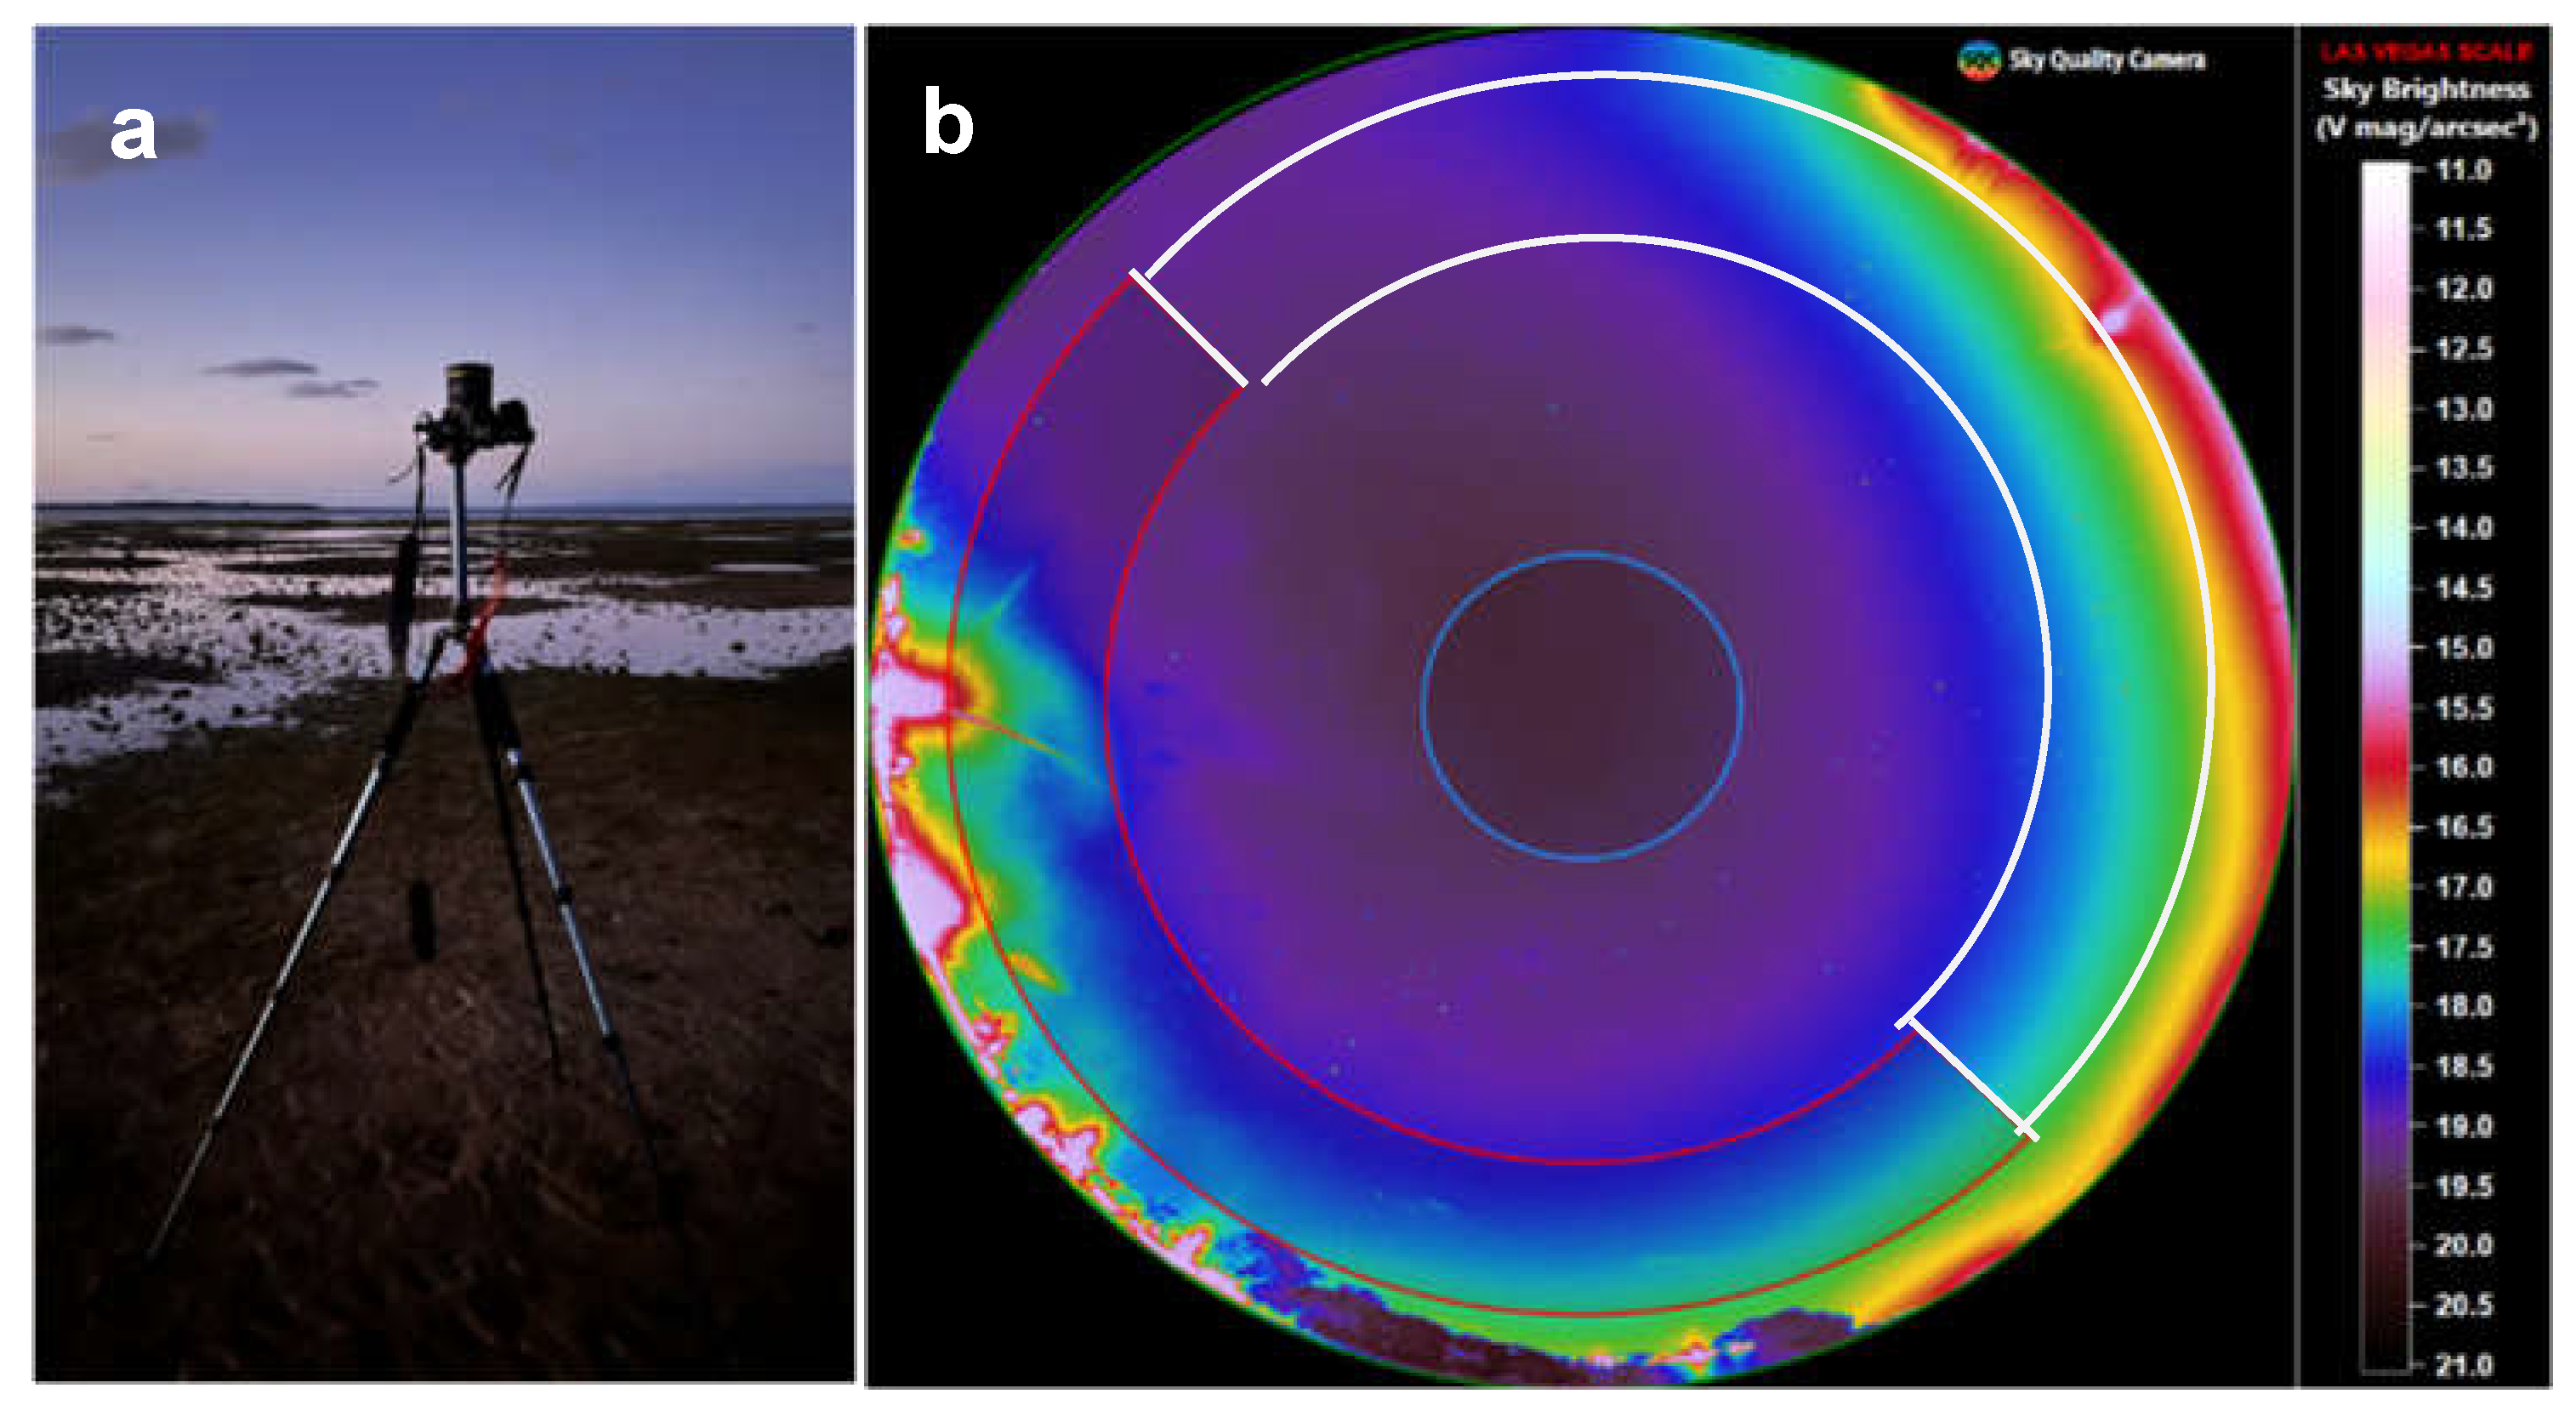
We used a Canon 6D EOS DSLR camera and Sigma 8 mm EX DG circular fisheye lens (purchased in Jerusalem, Israel), set up on a tripod approximately 1.5 m off the ground, to acquire hemispheric night-time light images (Figure 3). We used a Canon TC-80N3 remote controller to time the exposure. In addition, we used a LANcubeV2 photometer [31] (manufactured in Sherbrooke, QC, Canada) to conduct multispectral and multidirectional measurements of night lights, from which we derived lux (lumen/m2) measurements of illuminance (i.e., the total visible light as perceived by humans).

2.2.2. Sampling Sites

Altogether, we acquired ground night-time photos in 26 sites (Figure 1). For King Island, we took photos every 250 m across a 1500 m transect running from Wellington Point to 500 m past King Island at low tide (Figure 2b). In Minjerribah (North Stradbroke Islands), measurements were made at the Point Lookout gorge walk, the Point Lookout shops, and Cylinder Beach, which faces toward the Pacific, and Amity Point, a town facing toward the mainland. A transect was conducted at Cylinder Beach, with measurements at the shoreline, mid and top of the beach. Two transects were conducted at Coochimudlo: Moorwong Beach, with measurements at the shoreline and the top of the beach, and the same at Norfolk Beach. Both beaches faced away from the mainland. On the south side of Brisbane, photos were taken on the tidal flat of Toondah Harbour and at the Cleveland lighthouse. On the north side, photos were taken at Nudgee Beach, Redcliffe Beach and Shorncliffe Beach (Figure 1 and Figure 2).
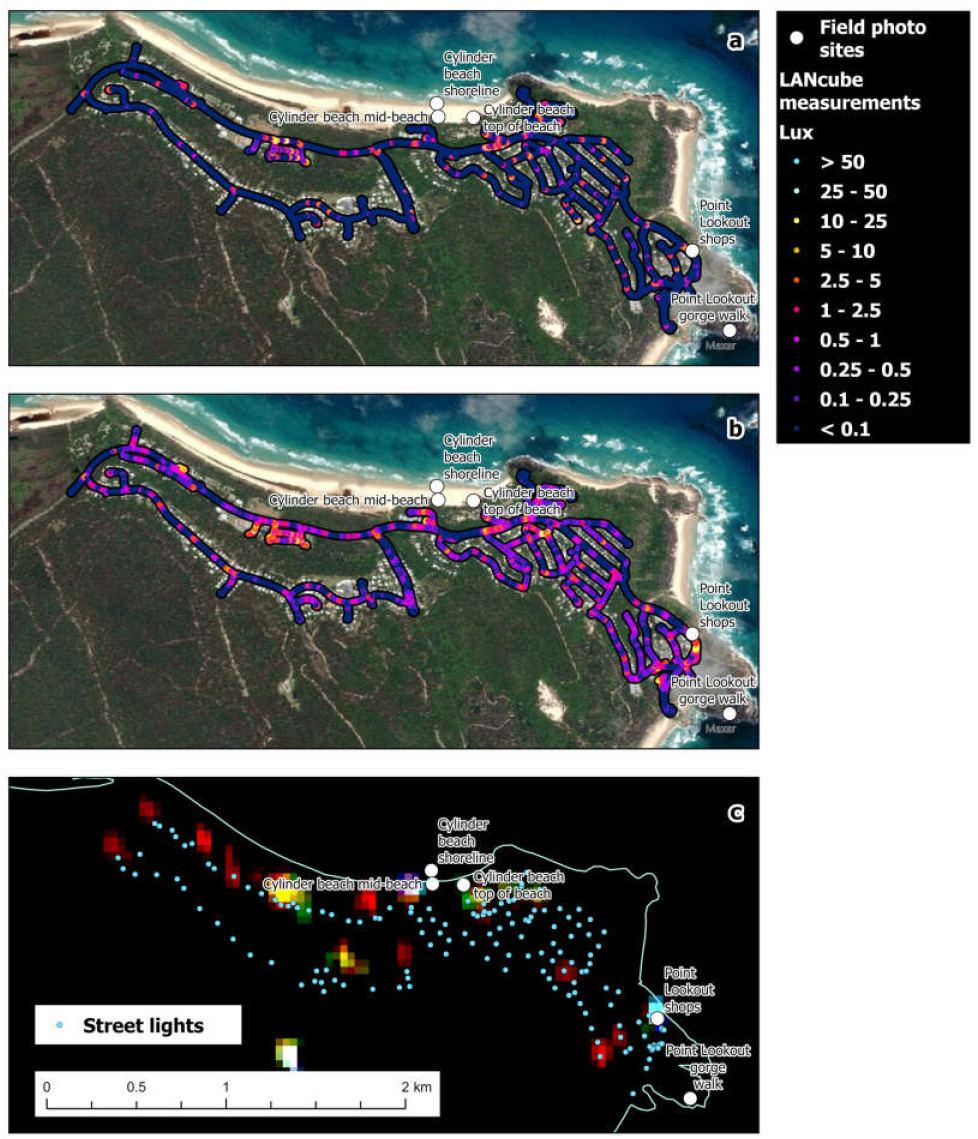
We conducted mobile measurements with the LANcubeV2 photometer (which was mounted on the roof of a car) on the evening of 23 July 2023, between 20:10 and 21:20, when the moon was 25% full and was only between 20° and 5° above the horizon—hence moonlight had a contribution of less than 0.2 lux to our measurements. The measurements covered almost all of the streets in the town of Point Lookout, North Stradbroke Island, where five of our sites were located.

2.2.3. Sampling Sessions of the Camera

Fieldwork was conducted between 8 and 15 April 2024 under a new or crescent moon to ensure it did not impact sky brightness. Most of the photos were taken between 19:00 and 20:30 p.m., after astronomical twilight had ended. Photos were taken upward, facing the night sky at different exposure times to find the image with the best signal-to-noise ratio. The camera was calibrated to ISO 1600 and Aperture f/3.5 following SQC guidelines. The majority of sites were cloud-free at the time of photography (24 out of 26), and these were the sites we used for statistical analysis. Out of the 24 sites, 12 were located on the mainland (i.e., sites on or connected to the mainland during low tide), and the other 12 sites were located on islands in Moreton Bay.

2.2.4. Image Processing and Analysis

We used the Sky Quality Camera (SQC) software (version 1.9.5) to process the photos and derive sky brightness values in units of magnitude (Vmag/arcsec2). Magnitude units, originally conceived by the ancient Greek astronomer Hipparchos, refer to the brightness of the stars. The brightest star was assigned a magnitude of 1, and the faintest star, as perceived by the naked eye, was assigned a magnitude of 6. Therefore, units of magnitude per squared arcsecond of the sky are inversely related to luminance units of candela/m2 [20]. We calculated the average sky brightness at a radius of 20° around the zenith (Figure 3) (zenith representing the direction above a particular location). We also compiled sky brightness values for all zenith and azimuth angles. We calculated the average sky brightness for the section facing landward (180° wide) and the opposing seaward section (180° wide) between zenith angles of 60–80°, as these zenith angles represent the hypothetical cone of acceptance (COA) of sea turtles, which is limited to 10–30° vertically above the horizon and 180° horizontally wide [19,32].

2.3. Spatial Analysis

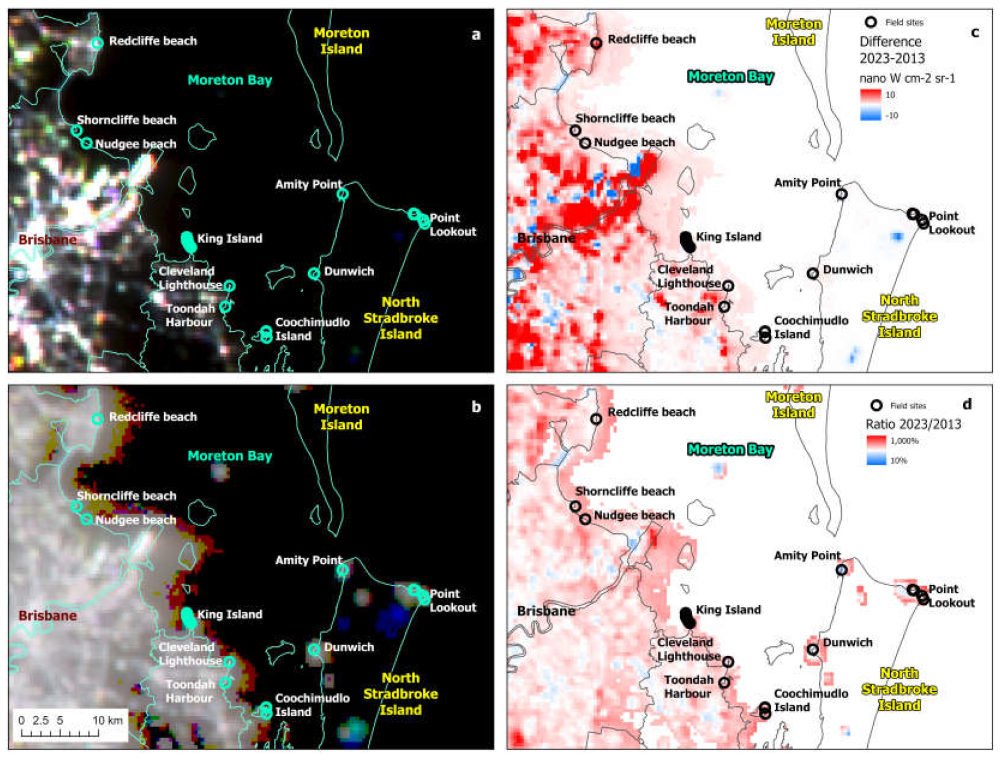
We used three sources of spaceborne data to map light pollution. The first included the Glimmer night-time sensor onboard the SDGSAT-1 satellite, using a cloud-free satellite image of Moreton Bay (9 October 2023) at a spatial resolution of 40 m [33] (available from https://www.sdgsat.ac.cn/, accessed 7 June 2024). The second source included the New World Atlas of Artificial Sky Brightness, available at a spatial resolution of 1 km [17]. The third source included annual mosaics of VIIRS/DNB [34] from the year 2013, 2018 and 2023 to visualize temporal changes in night-time brightness (images available from https://payneinstitute.mines.edu/eog-2/viirs/; accessed 1 October 2024). We calibrated the DN values of the SDGSAT-1 into radiance using the gain and offset values provided in the calibration file of the satellite and summed the radiance values of the three bands to calculate the overall night-time radiance per pixel. We also created a binary image of lit areas based on the same SDGSAT-1 image, where the DN value of the red band was greater than 1. We calculated the average SDGSAT-1 radiance and sky brightness from the New Atlas around each field site for the following radius sizes: 500, 1000, 1500, 2000, 2500, 5000 and 10,000 m. We also calculated the percent lit area (based on the SDGSAT-1 image), percent land area (mainland and islands) and percent mainland area around each field site location within 5000 m. We processed the LANcubeV2 photometer data as described in [35]. To calculate the population size within 5000 m from the field sites, we used the Australian Bureau of Statistics Australian human population grid from the year 2022 (1 km grid cells, available from https://www.arcgis.com/home/item.html?id=82423473f78c4a9d9a6258ba0f560359, accessed 26 August 2024).

2.4. Statistical Analysis

We used XLStat 2019.3.2 for the statistical analysis. We calculated Spearman’s rank correlation coefficient between all variables.

3. Results

3.1. Night Sky Brightness Measurements

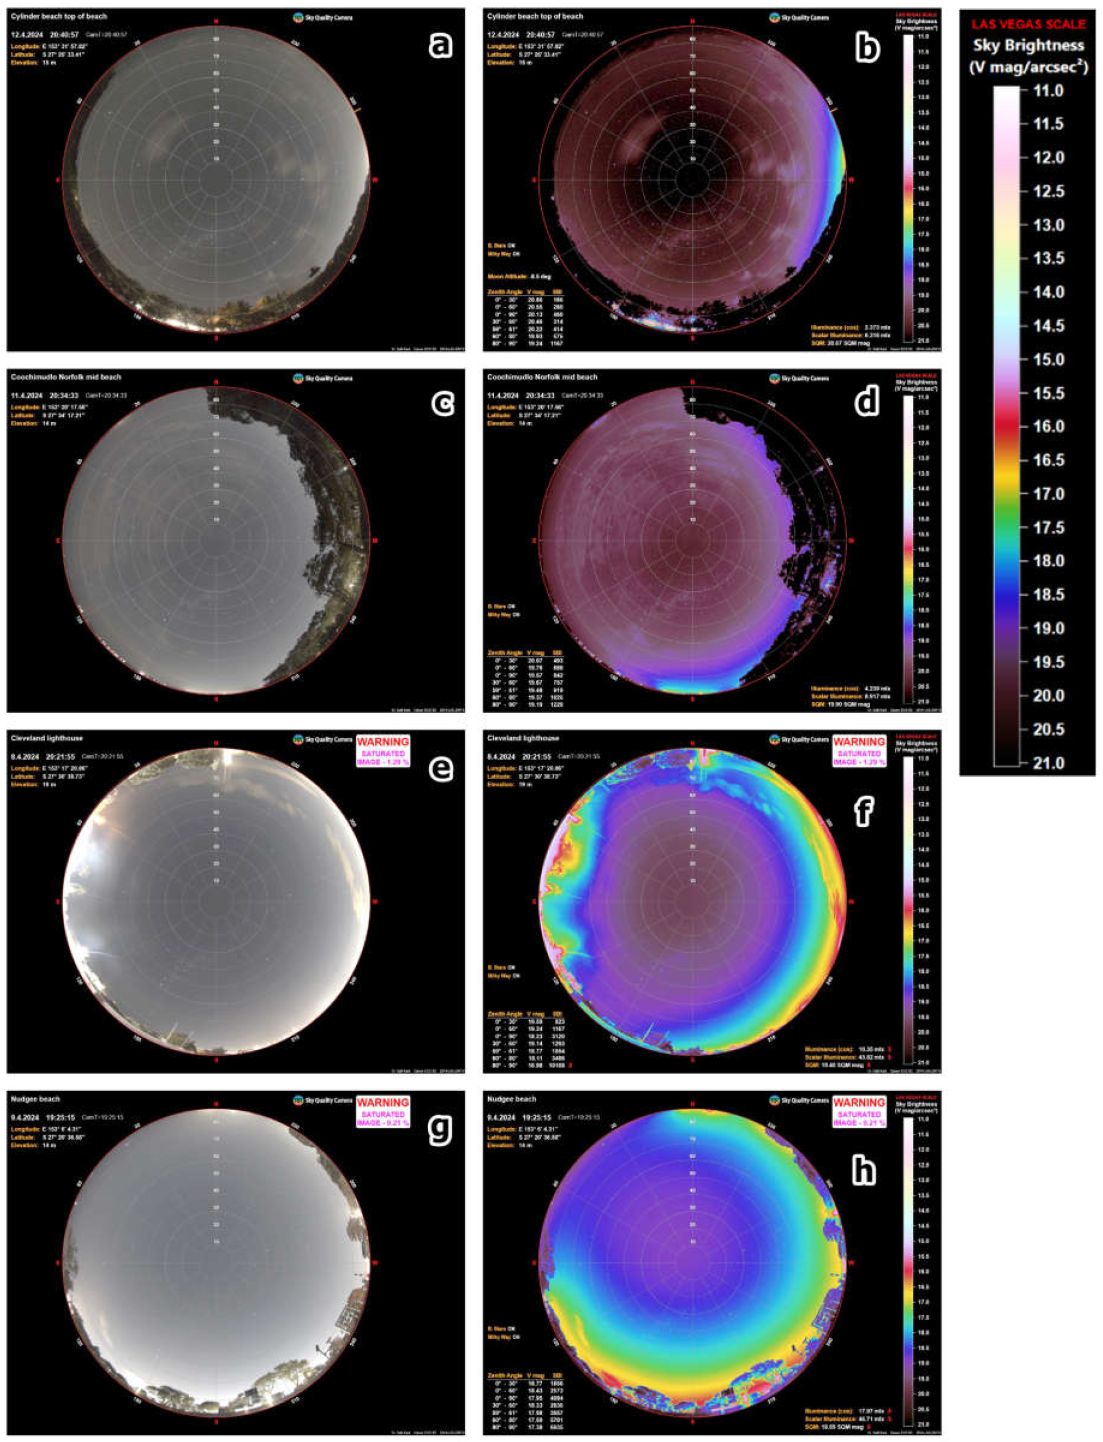
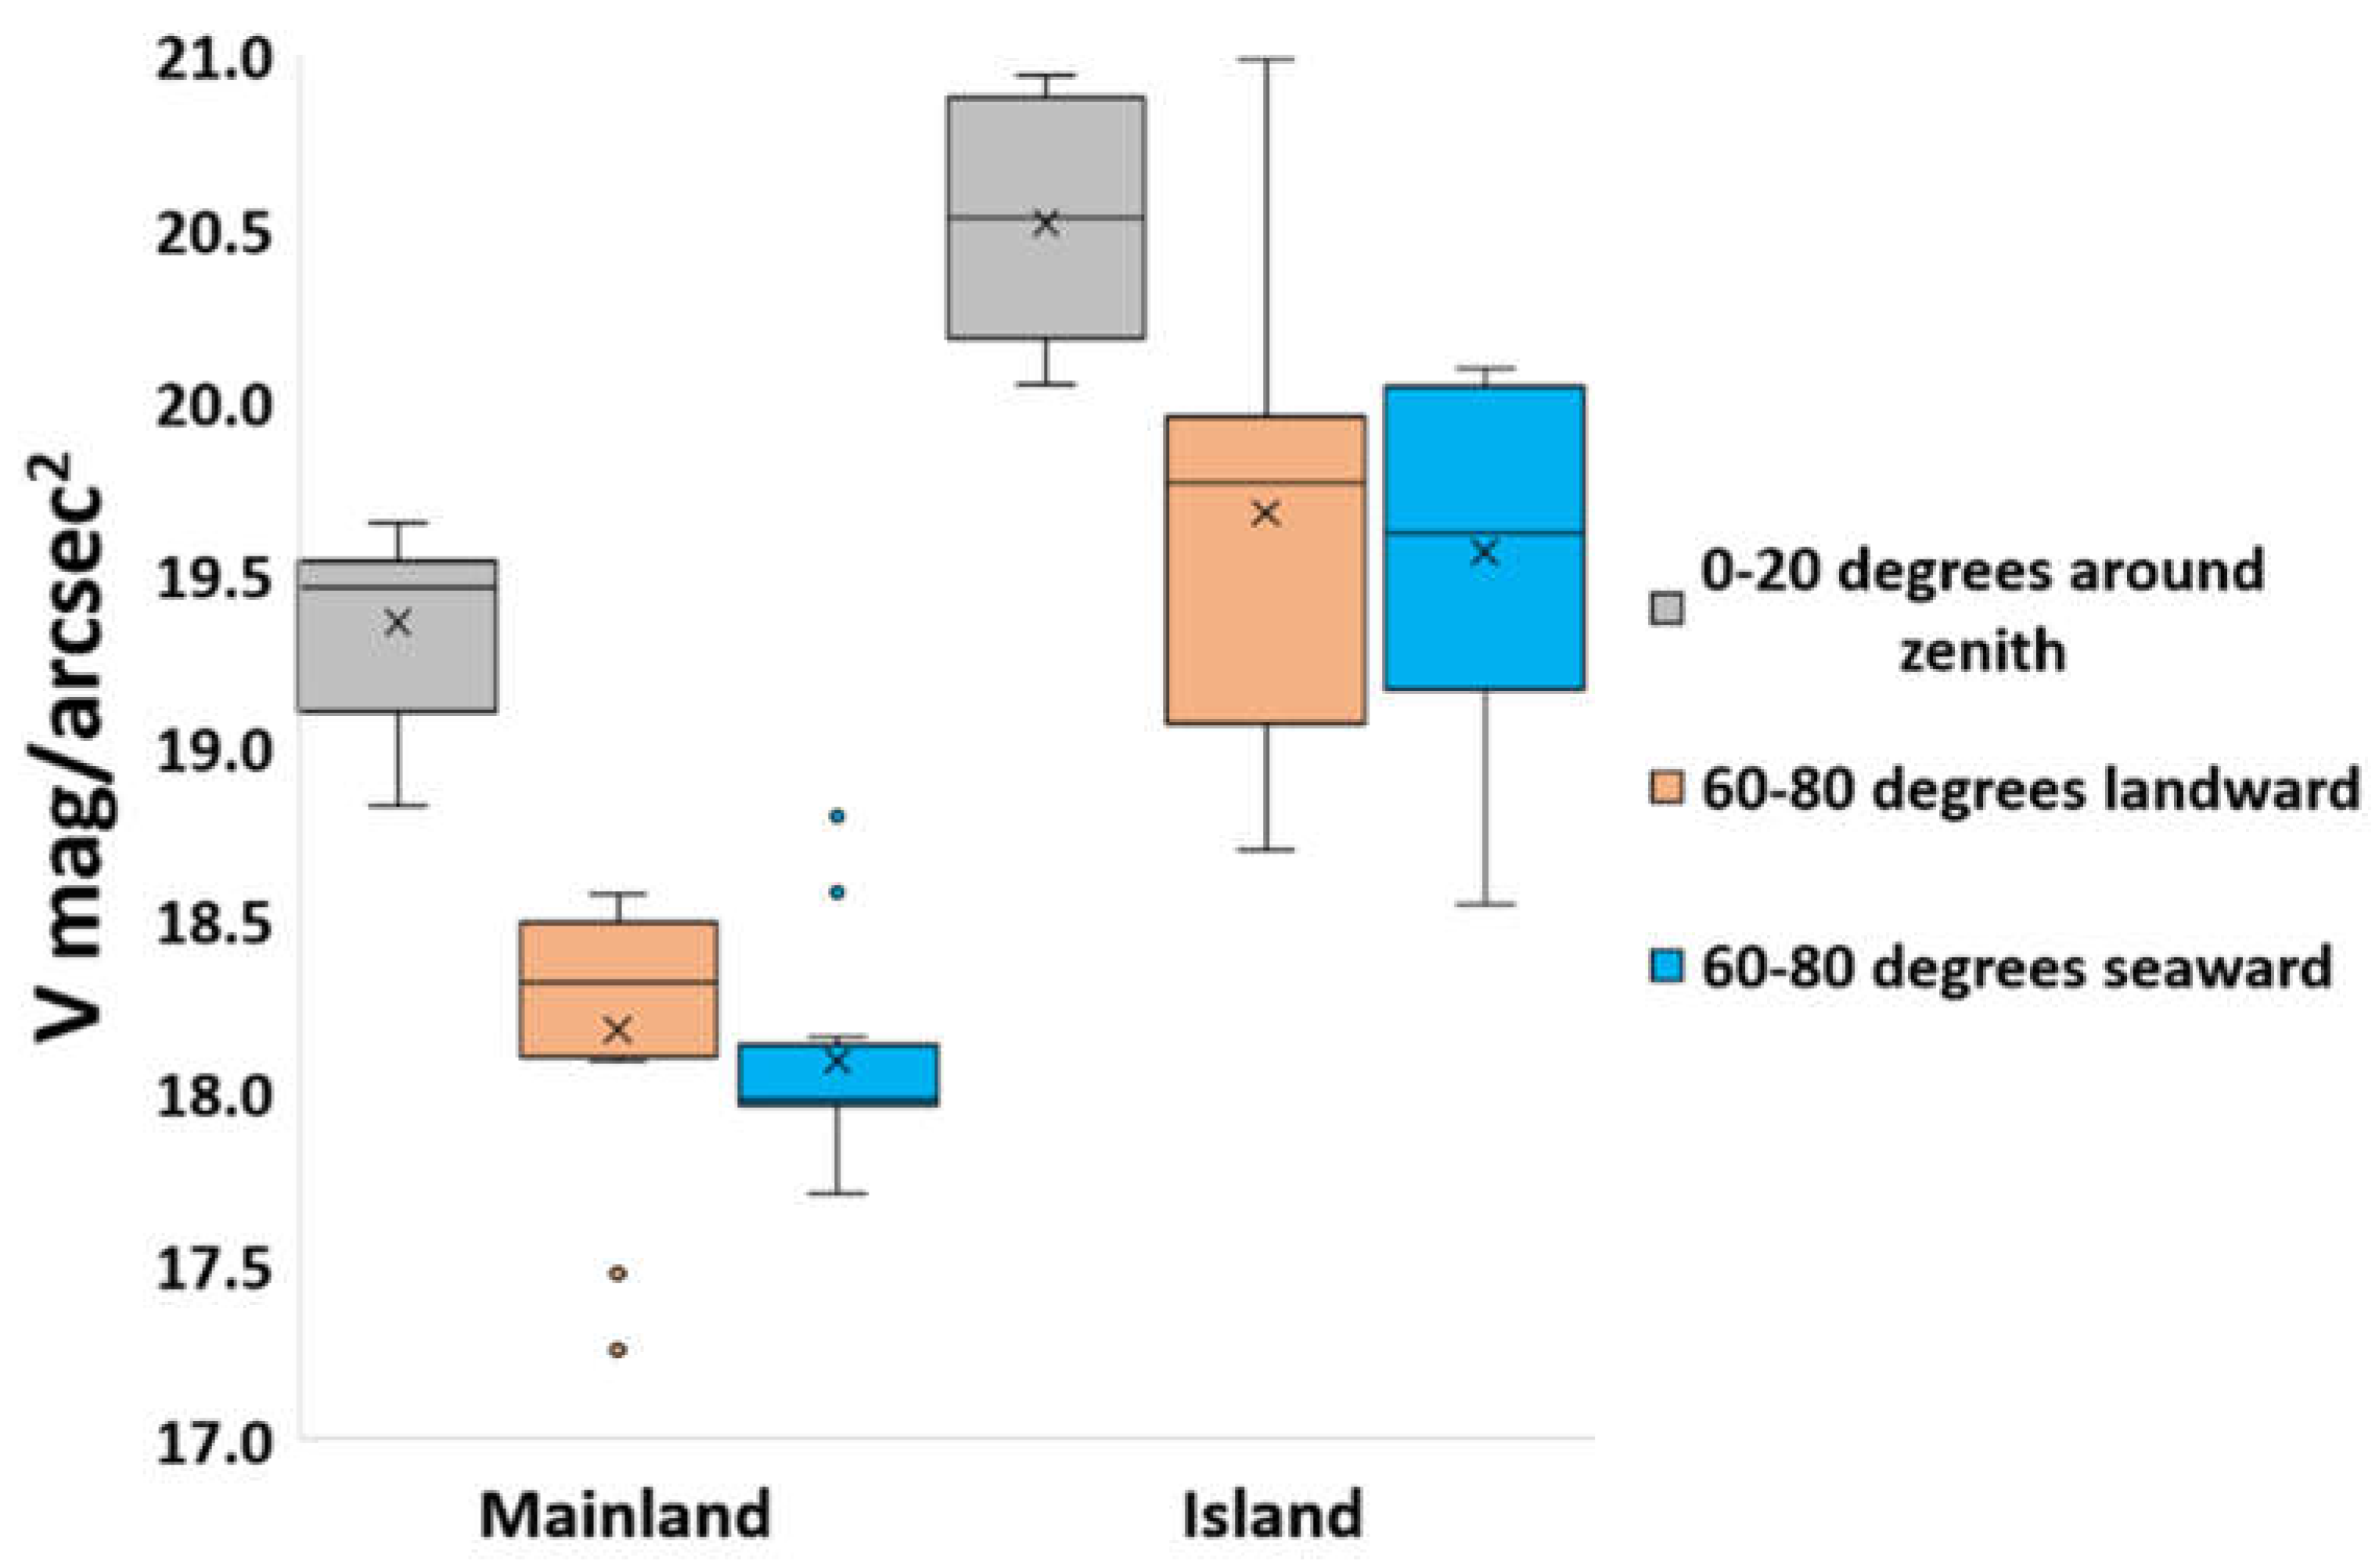
Our night-time measurements ranged from relatively dark sites (the darkest sampled site being on Cylinder Beach, North Stradbroke Island) to relatively bright sites (the brightest being Nudgee Beach) (Figure 4 and Figure 5). We found a clear distinction between measurements conducted on the mainland and measurements conducted on the islands of Moreton Bay. All mainland measurements had brighter skies (20 degrees around the zenith) than the islands’ measurements: brighter than 19.7 magnitude per square arcsecond (V mag/arcsec2) on the mainland sites and darker than 20 V mag/arcsec2 on the island sites (Figure 5). The mainland and island sites also differed in the horizontal night sky brightness (between 60 and 80 degrees from the zenith), which was always brighter than near the zenith, with higher brightness values (lower magnitudes) measured on the mainland sites (in both directions, toward the sea and toward the land) than on the island sites (Figure 6). On the mainland sites, the brightness values toward the land were usually lower (darker) than toward the sea (in 9 of the 12 sites; Figure 6), and on the island sites, in 7 of the 12 sites, the land side was darker than the seaside.

3.2. Statistical Correlations

Examining the correlation between the sky brightness at the zenith (between 0 and 20 degrees) and the SDGSAT-1 night-time radiance (summed over its three bands), we found that the correlation became stronger as we increased the focal area over which we averaged the SDGSAT-1 values, and that beyond a buffer area of 5 km (where the correlation coefficient was −0.87), correlation coefficients did not increase significantly (no correlation was found at a buffer of 500 m). We, therefore, focused our statistical analysis at a spatial scale of about 5 km.
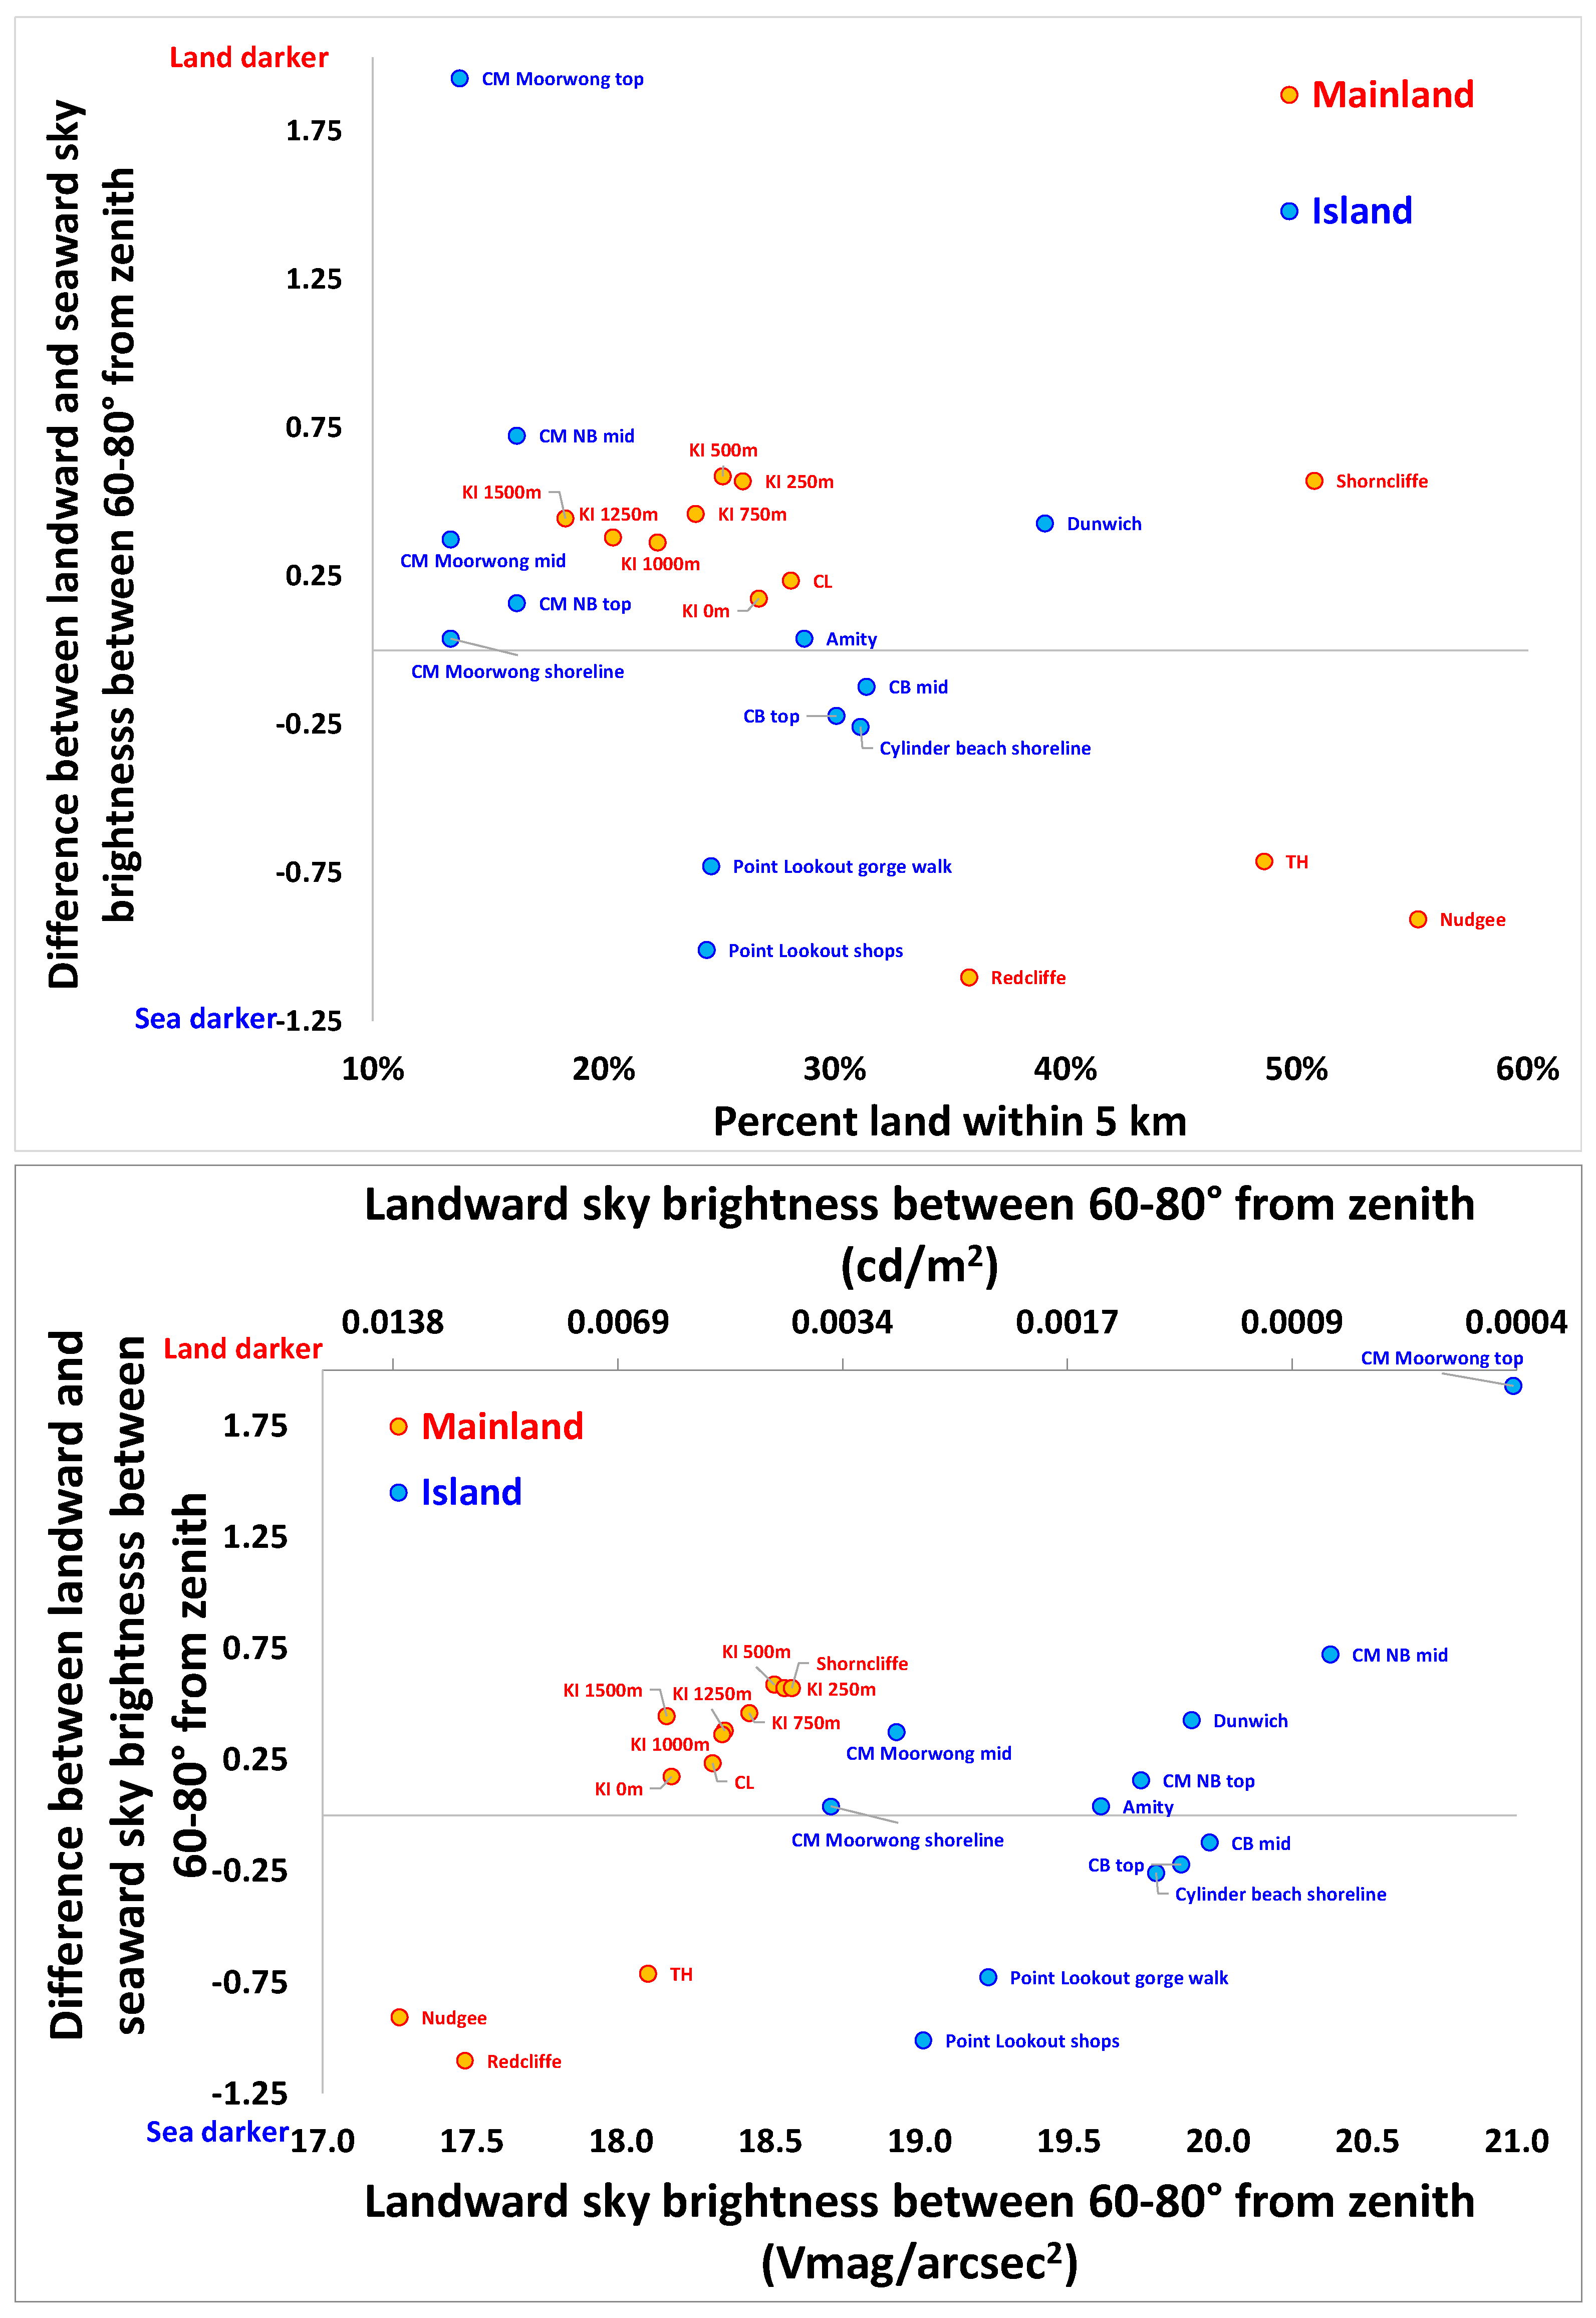
Sky brightness, as measured by the camera near the zenith or 10–30° above the horizon (either seaward or landward), was significantly correlated with sky brightness, as modeled by the New Atlas of Sky Brightness [17] and with SDGSAT-1 radiance values when averaged over an area with a radius of 5 km (Table 1). The brightness from the ground photo measurements was also significantly correlated with the percentage area of the mainland within 5 km around a site but not with the percentage area of land (mainland + islands) within 5 km around a site (Table 1). While population and night lights were strongly correlated, both variables as well as percentage land area, were not correlated with the differences between measurements of sky brightness toward the land and toward the sea (Figure 7, Table 1).

3.3. LANcube Measurements

Point Lookout was found to be a relatively dark sky-friendly small town with relatively few streetlights. The measurements in the upward direction with the S1 sensor of the LANcubeV2 (representing streetlights) showed that some streets often had a spacing of more than 100 m between adjacent streetlights (Figure 8a,c) and less than 14% of the measurements had lux values above 1 (the reported minimum light level detected by the LAN3V2 was estimated to be at the order of 0.015 lux; [31]. When summing the lux values in the horizontal directions to the left and the right (light also representing commercial and residential windows), larger sections were found to be lit at night (Figure 8b), and 27% of the measurements had lux values above 1. However, on the SDGSAT-1 image, most of the streets appeared to be dark (Figure 8c).

4. Discussion

Our findings confirmed that sky brightness was lower (i.e., higher magnitude values) on the island sites than on the mainland, and in populated areas (Greater Brisbane area, located on the mainland) than in sparsely populated areas (the islands of Moreton Bay), in accordance with associations between population and lit area reported in the scientific literature [36,37]. We also found that, as expected, resampling the medium spatial resolution SDGSAT-1 night-time image to coarser spatial resolutions resulted in stronger correlations with sky brightness, as measured by the DSLR camera. This finding also corresponds with previous studies showing that when using high-medium spatial resolution sources of night-time imagery, their correlation with other variables is better after resampling them to lower spatial resolutions [38]—this is both because at higher spatial resolutions, night-time images appear to be ‘darker’ and because sky glow is generated from both near and far (several km) sources of artificial lights [8,39]. This can be observed on VIIRS/DNB imagery, with the extending of night lights from the coastal areas of Brisbane out to the waters of Moreton Bay, even beyond 5 km, e.g., in the area of the Port of Brisbane (south-east of Nudgee Beach; Figure 9b).
When comparing the sky brightness toward the land and toward the sea between 10–30° above the horizon, we found that in most cases, the landward side was darker. This was contrary to our expectations that because artificial light sources are mostly terrestrial, the landward side would be brighter. Several factors can be the cause for this: (1) we conducted our measurements on the beach, and often there were obstructions (e.g., trees) between the beach and the streets and houses behind the beach (e.g., the site of Coochimudlo Island, Norfolk Beach mid beach, Figure 4c,d); (2) several of the sites were located on west-facing beaches within Moreton Bay (on islands or on the mainland), and thus, their seaward side was facing Greater Brisbane and its associated sky glow (e.g., the Cleveland Lighthouse site, Figure 4e,f). Within Moreton Bay, night-time light levels were found to have increased in the past decade (between 2013 and 2023), across almost all the coastal areas of the mainland, and even in offshore areas near the coast, probably due to atmospheric scattering (Figure 9). Previous studies have shown that skyglow increases night sky brightness above natural habitats many km away from the source [40,41]. This is of particular concern for a tidal flat like Toondah Harbor, a Ramsar-listed wetland since 1993, which hosts the critically endangered Eastern Curlew [42]. Large amounts of light pollution from skyglow may cause them to avoid this important resting area after a long migration [42].
In this study, we focused on a specific area, the Moreton Bay, which is also an important site for migratory shorebirds. Animal migration incorporates large spatial scales, and light pollution has impacts across scales (macro > regional > local) [43]. It has been found that migratory birds are especially susceptible to the effects of light pollution during their migration phase [44]. Coarse spatial resolution sensors such as VIIRS/DNB can be used for assessing macro-scale light pollution levels, whereas to assess the exposure to light pollution at local sites that birds (for example) use to feed and rest on the migration, multispectral and multidirectional measurements, such as the ones we used here, can be applied. Multidirectional ground measurements can better indicate the possible exposure of sensitive species (based on their visual cone of acceptance). Within key stopover sites for migratory birds and key nesting sites, multidirectional measurements should be performed to identify sources of light pollution so that they can be mitigated [45]. Such measurements can and should be expanded to be conducted at sea, from ships and other marine structures [46] to better understand the exposure to light pollution for migratory animals as they approach more urban areas.
In remote islands, where nearly all light sources are on land, such as Heron Island in the Great Barrier Reef [19] or cases of a ‘simple’ straight shoreline facing an ocean (e.g., the sites of Point Lookout on North Stradbroke Island/Minjerribah), the seaward side can be expected to devoid of artificial light sources. However, where the coastline is complex, e.g., within a bay with multiple islands, the seaward side of the beach may face inhabited, lit areas (as with some of our sites). Urban night lights can easily overcome the brightness created by reflected moon and starlight, which is worrying for species such as sea turtles that rely on visual cues for orientation [47,48,49]. A previous study found 62% of loggerhead turtles failed to reach the sea on the Woongara coast, Australia, since they instead moved toward artificial light sources [47]. With even remote islands experiencing this imbalance, increasing coastal urbanization is a cause for alarm, and we should act to restore the natural state in locations inhabiting vulnerable species. Such situations emphasize the need to manage light sources kms away from a protected area to reduce sky glow and light pollution affecting coastal ecosystems. A study in the Mediterranean Sea found only 49 non-light-polluted islands, and light pollution was heavily correlated with population density [50]. The land connected King Island was exposed to brighter skies despite being uninhabited and containing no artificial light sources. Due to its small size and proximity to the mainland, it has multiple sides that are exposed to light pollution (see Figure 1 and Figure 2). This suggests that island urbanization level, size and geomorphology contribute to the extent of light pollution exposure.
The differences in sky brightness above the horizon between the landward and seaward sides were not correlated with the other variables we used, based on percent land area, metrics of night lights from the SDGSAT-1 or percent population (all within 5 km of the measurement sites). Differentiating between the landward and skyward brightness above the horizon is important to understand the impacts of artificial lights on the behavior of coastal species, such as sea turtles, whose hatchlings navigate their way to the sea from their nest after hatching, attracted to light sources [51]. Even when the seaward side is brighter than the landward side (e.g., due to artificial lights on the seaward side of the beach), if the landward side is not dark, sea turtle hatchlings can still be attracted toward the landward side instead of navigating their way to the sea. Hence, in examining how ‘natural’ a coastal site is, one should examine not only whether the site itself has artificial lights; one should also inspect both sky brightness near the zenith, the sky brightness toward the land and toward the sea over the horizon, and not just the differences between the two sides. Amongst the sites included in our study area, the two most ‘natural’ ones (when compared to Heron Island on the Great Barrier Reef, where light pollution is minimal; [19]) were two of the sites located on Coochimudlo Island, where the landward sky brightness magnitude values were darker than 20 Vmag/arcsec2, and the seaward side was brighter than the landward side (Figure 7).
The spatial resolution of VIIRS was too coarse for mapping night lights in coastal areas in detail (Figure 9), and as demonstrated here, the SDGSAT-1 is not sensitive enough to low levels of artificial lights, which are common in many residential streets in Australia (Figure 8; [35]). While modeling is an option to better understand the exposure to light pollution [52,53], this often requires high-resolution Lidar mapping (to model obstructions to light), which is not available for many coastal areas, and a full inventory of artificial lights. Although street light inventories are becoming available, they only represent part of the sources of artificial lights [54], and as we demonstrated for Point Lookout, where exposure to artificial lights was greater horizontally (i.e., when including light from windows) than when only measuring upward (representing streetlights; compare Figure 8a,b). Given that full inventories of all light sources (including private light sources) are unlikely to be achieved in the near future, multidirectional ground measurements (e.g., using hemispheric all-sky images or measurements using a photometer such as the LANcube [20,35,55]) are essential to realistically represent the exposure of species and ecosystems to light pollution.
In addition to quantifying night-time brightness levels, the multispectral sensors we used (SDGSAT-1, DSLR camera with a fisheye lens and the LANcube photometer) can be used to distinguish between lighting types, such as high-pressure sodium and LED [35,56,57,58]. Given that species vary in their sensitivity to different lighting types based on their spectral emission [59,60], future studies of light pollution in coastal areas should make use of multispectral sensors.
This study contributes to the highly needed literature examining light pollution across coastal ecosystems. We found that coastlines on the mainland or facing the mainland in Moreton Bay were most exposed to light pollution from both direct and indirect light sources, while more remote islands sheltered from the mainland were less exposed. Terrestrial night lights have often prevented the seaward horizon from being devoid of artificial light sources. We complemented photographic sampling with satellite imagery, confirming the effectiveness of using both remote sensing tools when studying light pollution in ecological contexts. Our research, alongside future work, can improve knowledge of light pollution across coastal ecosystems and allow for better conservation and management decisions regarding light pollution mitigation.

5. Conclusions

With the growing need to mitigate light pollution in key biodiversity sites near urbanizing coastal areas, ground measurements are a key tool to quantify night-time brightness, which often cannot be measured from space-borne sensors, as in the case of light emitted horizontally. This study has demonstrated that with new multispectral and multidirectional ground sensors, better assessment of light pollution sources and its levels can be ascertained to create a more complete picture of light pollution.

Author Contributions

Conceptualization, N.L. and S.K.; data curation, R.M.C.; formal analysis, N.L. and R.M.C.; funding acquisition, S.K.; investigation, N.L., R.M.C. and S.K.; methodology, N.L.; project administration and support, S.K.; resources, N.L. and S.K.; supervision, N.L. and S.K.; validation, N.L.; visualization, N.L.; writing—original draft, N.L. and R.M.C.; writing—review and editing, N.L., R.M.C. and S.K. All authors have read and agreed to the published version of the manuscript.

Funding

This research was partly supported by the University of Queensland Moreton Bay Research Station Sibelco Australia Pty Ltd. Student Grant for travel purposes for R.C. The LANcubeV2 photometer was purchased via an Israel Science Foundation Grant ISF 303/21.

Data Availability Statement

The data measurements in the field collected in this study are available on request from the corresponding author, so that people will better understand how to use them. The satellite imagery of SDGSAT-1 can be requested from China’s International Research Center of Big Data for Sustainable Development Goals.

Acknowledgments

We thank Quandamooka Yoolooburrabee Aboriginal Corporation (QYAC) for giving us permission to conduct research on Quandamooka Country and our volunteers Mahli Coles, Olivia Binfield and Tia Nicholls. We would like to thank the International Research Center of Big Data for Sustainable Development Goals (CBAS) for providing access to SDGSAT-1 imagery. We thank Energy Queensland for providing us with a GIS layer of streetlights.

Conflicts of Interest

The authors declare no conflicts of interest. The funders had no role in the design of the study; in the collection, analyses, or interpretation of data; in the writing of the manuscript; or in the decision to publish the results.

References

  1. Costanza, R.; d’Arge, R.; De Groot, R.; Farber, S.; Grasso, M.; Hannon, B.; Limburg, K.; Naeem, S.; O’Neill, R.V.; Paruelo, J.; et al. The Value of the World’s Ecosystem Services and Natural Capital. Nature 1997, 387, 253–260. [Google Scholar] [CrossRef]
  2. Kamrowski, R.; Limpus, C.; Moloney, J.; Hamann, M. Coastal Light Pollution and Marine Turtles: Assessing the Magnitude of the Problem. Endang. Species. Res. 2012, 19, 85–98. [Google Scholar] [CrossRef]
  3. Marangoni, L.F.B.; Davies, T.; Smyth, T.; Rodríguez, A.; Hamann, M.; Duarte, C.; Pendoley, K.; Berge, J.; Maggi, E.; Levy, O. Impacts of Artificial Light at Night in Marine Ecosystems—A Review. Glob. Chang Biol. 2022, 28, 5346–5367. [Google Scholar] [CrossRef] [PubMed]
  4. Allan, H.; Levin, N.; Kark, S. Quantifying and Mapping the Human Footprint across Earth’s Coastal Areas. Ocean Coast. Manag. 2023, 236, 106476. [Google Scholar] [CrossRef]
  5. Verheijen, F.J. Photopollution: Artificial Light Optic Spatial Control Systems Fail to Cope with. Incidents, Causation, Remedies. Exp. Biol. 1985, 44, 1–18. [Google Scholar] [PubMed]
  6. Yen, C.-H.; Chan, Y.-T.; Peng, Y.-C.; Chang, K.-H.; Cheng, I.-J. The Effect of Light Pollution on the Sea Finding Behavior of Green Turtle Hatchlings on Lanyu Island, Taiwan. Zool. Stud. 2023. [Google Scholar] [CrossRef]
  7. Adams, C.A.; Fernández-Juricic, E.; Bayne, E.M.; St. Clair, C.C. Effects of Artificial Light on Bird Movement and Distribution: A Systematic Map. Environ. Evid. 2021, 10, 37. [Google Scholar] [CrossRef]
  8. Jechow, A.; Kyba, C.C.M.; Hölker, F. Mapping the Brightness and Color of Urban to Rural Skyglow with All-Sky Photometry. J. Quant. Spectrosc. Radiat. Transf. 2020, 250, 106988. [Google Scholar] [CrossRef]
  9. Vaz, S.; Manes, S.; Gama-Maia, D.; Silveira, L.; Mattos, G.; Paiva, P.C.; Figueiredo, M.; Lorini, M.L. Light Pollution Is the Fastest Growing Potential Threat to Firefly Conservation in the Atlantic Forest Hotspot. Insect Conserv. Divers. 2021, 14, 211–224. [Google Scholar] [CrossRef]
  10. Bolton, D.; Mayer-Pinto, M.; Clark, G.F.; Dafforn, K.A.; Brassil, W.A.; Becker, A.; Johnston, E.L. Coastal Urban Lighting Has Ecological Consequences for Multiple Trophic Levels under the Sea. Sci. Total Environ. 2017, 576, 1–9. [Google Scholar] [CrossRef]
  11. Lynn, K.D.; Quijón, P.A. Casting a Light on the Shoreline: The Influence of Light Pollution on Intertidal Settings. Front. Ecol. Evol. 2022, 10, 980776. [Google Scholar] [CrossRef]
  12. Davies, T.W.; Duffy, J.P.; Bennie, J.; Gaston, K.J. The Nature, Extent, and Ecological Implications of Marine Light Pollution. Front. Ecol. Environ. 2014, 12, 347–355. [Google Scholar] [CrossRef]
  13. Aguilera, M.A.; González, M.G. Urban Infrastructure Expansion and Artificial Light Pollution Degrade Coastal Ecosystems, Increasing Natural-to-Urban Structural Connectivity. Landsc. Urban Plan. 2023, 229, 104609. [Google Scholar] [CrossRef]
  14. Gaston, K.J.; Davies, T.W.; Bennie, J.; Hopkins, J. REVIEW: Reducing the Ecological Consequences of Night-time Light Pollution: Options and Developments. J. Appl. Ecol. 2012, 49, 1256–1266. [Google Scholar] [CrossRef]
  15. Roiko, A.; Mangoyana, R.B.; McFallan, S.; Carter, R.W.B.; Oliver, J.; Smith, T.F. Socio-Economic Trends and Climate Change Adaptation: The Case of South East Queensland. Australas. J. Environ. Manag. 2012, 19, 35–50. [Google Scholar] [CrossRef]
  16. McPhee, D.P. Environmental History and Ecology of Moreton Bay; CSIRO Publishing: Clayton, VIC, Australia, 2017; ISBN 978-1-4863-0721-0. [Google Scholar]
  17. Falchi, F.; Cinzano, P.; Duriscoe, D.; Kyba, C.C.M.; Elvidge, C.D.; Baugh, K.; Portnov, B.A.; Rybnikova, N.A.; Furgoni, R. The New World Atlas of Artificial Night Sky Brightness. Sci. Adv. 2016, 2, e1600377. [Google Scholar] [CrossRef]
  18. Levin, N.; Kyba, C.C.M.; Zhang, Q.; Sánchez de Miguel, A.; Román, M.O.; Li, X.; Portnov, B.A.; Molthan, A.L.; Jechow, A.; Miller, S.D.; et al. Remote Sensing of Night Lights: A Review and an Outlook for the Future. Remote Sens. Environ. 2020, 237, 111443. [Google Scholar] [CrossRef]
  19. Vandersteen, J.; Kark, S.; Sorrell, K.; Levin, N. Quantifying the Impact of Light Pollution on Sea Turtle Nesting Using Ground-Based Imagery. Remote Sens. 2020, 12, 1785. [Google Scholar] [CrossRef]
  20. Hänel, A.; Posch, T.; Ribas, S.J.; Aubé, M.; Duriscoe, D.; Jechow, A.; Kollath, Z.; Lolkema, D.E.; Moore, C.; Schmidt, N.; et al. Measuring Night Sky Brightness: Methods and Challenges. J. Quant. Spectrosc. Radiat. Transf. 2018, 205, 278–290. [Google Scholar] [CrossRef]
  21. Li, X.; Levin, N.; Xie, J.; Li, D. Monitoring Hourly Night-Time Light by an Unmanned Aerial Vehicle and Its Implications to Satellite Remote Sensing. Remote Sens. Environ. 2020, 247, 111942. [Google Scholar] [CrossRef]
  22. Aubé, M.; Simoneau, A.; Kolláth, Z. HABLAN: Multispectral and Multiangular Remote Sensing of Artificial Light at Night from High Altitude Balloons. J. Quant. Spectrosc. Radiat. Transf. 2023, 306, 108606. [Google Scholar] [CrossRef]
  23. Pendoley, K.; Kamrowski, R.L. Sea-Finding in Marine Turtle Hatchlings: What Is an Appropriate Exclusion Zone to Limit Disruptive Impacts of Industrial Light at Night? J. Nat. Conserv. 2016, 30, 1–11. [Google Scholar] [CrossRef]
  24. Jechow, A.; Kolláth, Z.; Ribas, S.J.; Spoelstra, H.; Hölker, F.; Kyba, C.C.M. Imaging and Mapping the Impact of Clouds on Skyglow with All-Sky Photometry. Sci Rep 2017, 7, 6741. [Google Scholar] [CrossRef]
  25. Kolláth, Z.; Cool, A.; Jechow, A.; Kolláth, K.; Száz, D.; Tong, K.P. Introducing the Dark Sky Unit for Multi-Spectral Measurement of the Night Sky Quality with Commercial Digital Cameras. J. Quant. Spectrosc. Radiat. Transf. 2020, 253, 107162. [Google Scholar] [CrossRef]
  26. Hung, L.-W.; White, J.; Joyce, D.; Anderson, S.J.; Banet, B. Fisheye Night Sky Imager: A Calibrated Tool to Measure Night Sky Brightness. PASP 2024, 136, 085002. [Google Scholar] [CrossRef]
  27. Kolláth, Z.; Dömény, A. Night Sky Quality Monitoring in Existing and Planned Dark Sky Parks by Digital Cameras. arXiv 2017, arXiv:1705.09594. [Google Scholar] [CrossRef]
  28. Jechow, A.; Kyba, C.C.M.; Hölker, F. Beyond All-Sky: Assessing Ecological Light Pollution Using Multi-Spectral Full-Sphere Fisheye Lens Imaging. J. Imaging 2019, 5, 46. [Google Scholar] [CrossRef]
  29. Kolláth, Z.; Száz, D.; Kolláth, K.; Tong, K.P. Light Pollution Monitoring and Sky Colours. J. Imaging 2020, 6, 104. [Google Scholar] [CrossRef]
  30. Moreton Bay Quandamooka & Catchment: Past, Present and Future; Tibbetts, I.R.; Rothlisberg, P.C.; Neil, D.T.; Homburg, T.A.; Brewer, D.T.; Arthington, A.H. (Eds.) The Moreton Bay Foundation: Brisbane, Queensland, 2019; ISBN 978-0-648-66900-5. [Google Scholar]
  31. Aubé, M.; Marseille, C.; Farkouh, A.; Dufour, A.; Simoneau, A.; Zamorano, J.; Roby, J.; Tapia, C. Mapping the Melatonin Suppression, Star Light and Induced Photosynthesis Indices with the LANcube. Remote Sens. 2020, 12, 3954. [Google Scholar] [CrossRef]
  32. Verheijen, F.J.; Wildschut, J.T. The Photic Orientation of Hatchling Sea Turtles during Water Finding Behaviour. Neth. J. Sea Res. 1973, 7, 53–67. [Google Scholar] [CrossRef]
  33. Guo, B.; Hu, D.; Zheng, Q. Potentiality of SDGSAT-1 Glimmer Imagery to Investigate the Spatial Variability in Nighttime Lights. Int. J. Appl. Earth Obs. Geoinf. 2023, 119, 103313. [Google Scholar] [CrossRef]
  34. Elvidge, C.D.; Zhizhin, M.; Ghosh, T.; Hsu, F.-C.; Taneja, J. Annual Time Series of Global VIIRS Nighttime Lights Derived from Monthly Averages: 2012 to 2019. Remote Sens. 2021, 13, 922. [Google Scholar] [CrossRef]
  35. Levin, N. Quantifying the Variability of Ground Light Sources and Their Relationships with Spaceborne Observations of Night Lights Using Multidirectional and Multispectral Measurements. Sensors 2023, 23, 8237. [Google Scholar] [CrossRef]
  36. Elvidge, C.D.; Baugh, K.E.; Kihn, E.A.; Kroehl, H.W.; Davis, E.R.; Davis, C.W. Relation between Satellite Observed Visible-near Infrared Emissions, Population, Economic Activity and Electric Power Consumption. Int. J. Remote Sens. 1997, 18, 1373–1379. [Google Scholar] [CrossRef]
  37. Levin, N.; Zhang, Q. A Global Analysis of Factors Controlling VIIRS Nighttime Light Levels from Densely Populated Areas. Remote Sens. Environ. 2017, 190, 366–382. [Google Scholar] [CrossRef]
  38. Katz, Y.; Levin, N. Quantifying Urban Light Pollution — A Comparison between Field Measurements and EROS-B Imagery. Remote Sens. Environ. 2016, 177, 65–77. [Google Scholar] [CrossRef]
  39. Barentine, J.C. Methods for Assessment and Monitoring of Light Pollution around Ecologically Sensitive Sites. J. Imaging 2019, 5, 54. [Google Scholar] [CrossRef]
  40. Duriscoe, D.; Luginbuhl, C.; Elvidge, C. The Relation of Outdoor Lighting Characteristics to Sky Glow from Distant Cities. Light. Res. Technol. 2014, 46, 35–49. [Google Scholar] [CrossRef]
  41. Kyba, C.C.M.; Hölker, F. Do Artificially Illuminated Skies Affect Biodiversity in Nocturnal Landscapes? Landsc. Ecol 2013, 28, 1637–1640. [Google Scholar] [CrossRef]
  42. Barry, K.; Suliman, S. Imagining Multispecies Mobility Justice. Aust. Geogr. 2023, 54, 561–571. [Google Scholar] [CrossRef]
  43. Burt, C.S.; Kelly, J.F.; Trankina, G.E.; Silva, C.L.; Khalighifar, A.; Jenkins-Smith, H.C.; Fox, A.S.; Fristrup, K.M.; Horton, K.G. The Effects of Light Pollution on Migratory Animal Behavior. Trends Ecol. Evol. 2023, 38, 355–368. [Google Scholar] [CrossRef]
  44. Cabrera-Cruz, S.A.; Smolinsky, J.A.; Buler, J.J. Light Pollution Is Greatest within Migration Passage Areas for Nocturnally-Migrating Birds around the World. Sci. Rep. 2018, 8, 3261. [Google Scholar] [CrossRef]
  45. Silva, E.; Marco, A.; Da Graça, J.; Pérez, H.; Abella, E.; Patino-Martinez, J.; Martins, S.; Almeida, C. Light Pollution Affects Nesting Behavior of Loggerhead Turtles and Predation Risk of Nests and Hatchlings. J. Photochem. Photobiol. B: Biol. 2017, 173, 240–249. [Google Scholar] [CrossRef] [PubMed]
  46. Ges, X.; Bará, S.; García-Gil, M.; Zamorano, J.; Ribas, S.J.; Masana, E. Light Pollution Offshore: Zenithal Sky Glow Measurements in the Mediterranean Coastal Waters. J. Quant. Spectrosc. Radiat. Transf. 2018, 210, 91–100. [Google Scholar] [CrossRef]
  47. Berry, M.; Booth, D.T.; Limpus, C.J. Artificial Lighting and Disrupted Sea-Finding Behaviour in Hatchling Loggerhead Turtles (Caretta Caretta) on the Woongarra Coast, South-East Queensland, Australia. Aust. J. Zool. 2013, 61, 137. [Google Scholar] [CrossRef]
  48. Lohmann, K.J.; Lohmann, C.M.F. Orientation and Open-Sea Navigation in Sea Turtles. J. Exp. Biol. 1996, 199, 73–81. [Google Scholar] [CrossRef]
  49. Limpus, C.; Kamrowski, R.L. Ocean-Finding in Marine Turtles: The Importance of Low Horizon Elevation as an Orientation Cue. Behaviour 2013, 150, 863–893. [Google Scholar] [CrossRef]
  50. Peregrym, M.; Pénzesné Kónya, E.; Savchenko, M. How Are the Mediterranean Islands Polluted by Artificial Light at Night? Ocean Coast. Manag. 2020, 198, 105365. [Google Scholar] [CrossRef]
  51. Thums, M.; Whiting, S.D.; Reisser, J.; Pendoley, K.L.; Pattiaratchi, C.B.; Proietti, M.; Hetzel, Y.; Fisher, R.; Meekan, M.G. Artificial Light on Water Attracts Turtle Hatchlings during Their near Shore Transit. R. Soc. Open Sci. 2016, 3, 160142. [Google Scholar] [CrossRef]
  52. Bennie, J.; Davies, T.W.; Inger, R.; Gaston, K.J. Mapping Artificial Lightscapes for Ecological Studies. Methods Ecol. Evol. 2014, 5, 534–540. [Google Scholar] [CrossRef]
  53. Verutes, G.M.; Huang, C.; Estrella, R.R.; Loyd, K. Exploring Scenarios of Light Pollution from Coastal Development Reaching Sea Turtle Nesting Beaches near Cabo Pulmo, Mexico. Glob. Ecol. Conserv. 2014, 2, 170–180. [Google Scholar] [CrossRef]
  54. Kyba, C.; Ruby, A.; Kuechly, H.; Kinzey, B.; Miller, N.; Sanders, J.; Barentine, J.; Kleinodt, R.; Espey, B. Direct Measurement of the Contribution of Street Lighting to Satellite Observations of Nighttime Light Emissions from Urban Areas. Light. Res. Technol. 2021, 53, 189–211. [Google Scholar] [CrossRef]
  55. Aube, M.; Houle, J.-P. Estimating Lighting Device Inventories with the LANcube v2 Multiangular Radiometer: Estimating Lighting Device Inventories. IJSL 2023, 25, 10–23. [Google Scholar] [CrossRef]
  56. Lv, Z.; Guo, H.; Zhang, L.; Liang, D.; Zhu, Q.; Liu, X.; Zhou, H.; Liu, Y.; Gou, Y.; Dou, X.; et al. Urban Public Lighting Classification Method and Analysis of Energy and Environmental Effects Based on SDGSAT-1 Glimmer Imager Data. Appl. Energy 2024, 355, 122355. [Google Scholar] [CrossRef]
  57. Wallner, S. Usage of Vertical Fisheye-Images to Quantify Urban Light Pollution on Small Scales and the Impact of LED Conversion. J. Imaging 2019, 5, 86. [Google Scholar] [CrossRef]
  58. Yin, Z.; Chen, F.; Dou, C.; Wu, M.; Niu, Z.; Wang, L.; Xu, S. Identification of Illumination Source Types Using Nighttime Light Images from SDGSAT-1. Int. J. Digit. Earth 2024, 17, 2297013. [Google Scholar] [CrossRef]
  59. Davies, T.W.; Bennie, J.; Inger, R.; De Ibarra, N.H.; Gaston, K.J. Artificial Light Pollution: Are Shifting Spectral Signatures Changing the Balance of Species Interactions? Glob. Change Biol. 2013, 19, 1417–1423. [Google Scholar] [CrossRef]
  60. Longcore, T.; Rodríguez, A.; Witherington, B.; Penniman, J.F.; Herf, L.; Herf, M. Rapid Assessment of Lamp Spectrum to Quantify Ecological Effects of Light at Night. J. Exp. Zool Pt A 2018, 329, 511–521. [Google Scholar] [CrossRef]
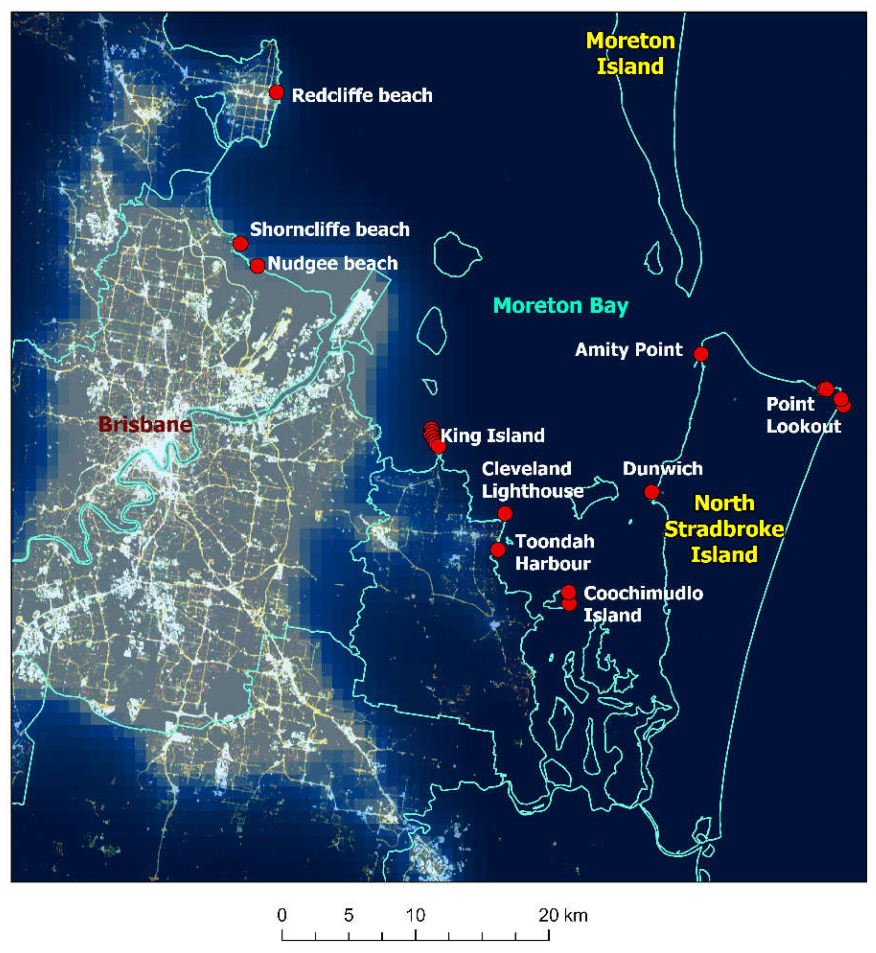
Figure 1. The study area and the field sites: SDGSAT-1 night light image (9 October 2023), overlaid by sky brightness as modeled by Falchi et al. [17].
Remotesensing 16 03828 g001
Figure 2. The study areas and the field sites: (a) binary map of lit areas (in yellow) based on the red band of SDGSAT-1; (b) zoom-in on the land bridge between Wellington Point and King Island during low tide, aerial photo acquired on 11 August 2023; (c) zoom-in on Coochimudlo Island sites during low tide, aerial photo acquired on 19 September 2022. Both aerial photos were downloaded from the website https://apps.nearmap.com/maps/ (accessed on 27 August 2024).
Remotesensing 16 03828 g002
Figure 3. (a) The set-up of the camera on a tripod at low tide near King Island; (b) a processed sky-brightness image acquired at low tide near King Island (0 m from the mainland beach), showing the area between 0 and 20 degrees around the zenith, and the 180-degree-wide sector between 60 and 80 degrees from the zenith (toward the land, shown in red) that we used. A similar sector (shown in white) was used for the opposite side, toward the sea.
Remotesensing 16 03828 g003
Figure 4. Four of the field sites, from the darkest at the top to the brightest at the bottom. The left column shows the visible range photo, and the right column shows the sky brightness. The sites shown are Cylinder Beach on North Stradbroke Island (Minjerribah) (a,b), Coochimudlo Island Norfolk mid beach (c,d), Cleveland Lighthouse (mainland; e,f) and Nudgee Beach (mainland; g,h).
Remotesensing 16 03828 g004
Figure 5. The magnitude at the field sites, as measured by the DSLR camera and processed by the SQC software, between 0 and 20 degrees around the zenith. KI stands for King Island (which is connected to the mainland at low tide), and the meters represent the distance from the coastline (measurements were taken at low tide); Coochi stands for Coochimudlo Island, PL stands for Point Lookout on North Stradbroke Island (Minjerribah) and CB stands for Cylinder Beach on North Stradbroke Island. The 12 sites on the right side were island sites; the 12 sites on the left were mainland sites. Higher magnitude values represent darker skies.
Remotesensing 16 03828 g005
Figure 6. Average magnitude derived from the field photos between 0 and 20 degrees around the zenith and between 60 and 80 degrees around the zenith landward and seaward for the mainland and the island field sites. Higher magnitude values represent darker skies.
Remotesensing 16 03828 g006
Figure 7. The difference between landward and seaward sky brightness (in units of Vmag/arcsec2) between 60 and 80° from the zenith as a function of percent land area within 5 km of the measurement sites (top figure) and as a function of landward sky brightness (bottom figure).
Remotesensing 16 03828 g007
Figure 8. Point Lookout, North Stradbroke Island. Lux values of measurements conducted upward (a) and sideways (right and left; b) using a LANcubeV2 photometer. The bottom figure (c) shows a SDGSAT-1 color night-time lights image (spatial resolution of 40 m) overlaid by the locations of streetlights (from Energy Queensland).
Remotesensing 16 03828 g008
Figure 9. Changes in night-time brightness in the Moreton Bay area based on VIIRS/DNB annual mosaics: (a) false color composite of the years 2023 (red), 2018 (green) and 2013 (blue); (b) false color composite of the years 2023 (red), 2018 (green) and 2013 (blue) after logarithmic transformation; (c) the difference in night-time brightness values of 2023 and 2013; (d) the ratio between the night-time brightness values of 2023 and 2013.
Remotesensing 16 03828 g009
Table 1. Spearman rank’s correlation coefficient matrix between some of the variables (n = 24). The asterisks stand for the statistical significance of the correlation: * p < 0.05; *** p < 0.001.
12345678910111213
1: Sky brightness 0–20° around zenith −0.076−0.869 ***−0.868 ***−0.906 ***0.102−0.874 ***−0.949 ***−0.857 ***0.814 ***0.824 ***−0.208−0.217
2: % land within 5 km−0.076 0.2720.2490.0250.702 ***0.2540.1680.242−0.2330.162−0.395−0.411 *
3: % mainland within 5 km−0.869 ***0.272 0.985 ***0.832 ***0.0730.975 ***0.904 ***0.959 ***−0.774 ***−0.676 ***0.1690.162
4: % lit SDGSAT pixels within 5 km−0.868 ***0.2490.985 *** 0.822 ***0.1020.968 ***0.886 ***0.966 ***−0.773 ***−0.644 ***0.1190.117
5: % lit SDGSAT pixels within 10 km−0.906 ***0.0250.832 ***0.822 *** −0.2620.836 ***0.901 ***0.794 ***−0.743 ***−0.846 ***0.3130.320
6: SDGSAT-1 500 m0.1020.702 ***0.0730.102−0.262 0.022−0.0330.138−0.1060.262−0.411 *−0.421 *
7: SDGSAT-1 5 km−0.874 ***0.2540.975 ***0.968 ***0.836 ***0.022 0.890 ***0.941 ***−0.758 ***−0.686 ***0.1810.179
8: Atlas sky brightness 5 km−0.949 ***0.1680.904 ***0.886 ***0.901 ***−0.0330.890 *** 0.892 ***−0.750 ***−0.800 ***0.2920.290
9: Population 5 km−0.857 ***0.2420.959 ***0.966 ***0.794 ***0.1380.941 ***0.892 *** −0.748 ***−0.678 ***0.2020.198
10: Sky brightness 60–80° landward0.814 ***−0.233−0.774 ***−0.773 ***−0.743 ***−0.106−0.758 ***−0.750 ***−0.748 *** 0.699 ***0.2170.219
11: Sky brightness 60–80° seaward0.824 ***0.162−0.676 ***−0.644 ***−0.846 ***0.262−0.686 ***−0.800 ***−0.678 ***0.699 *** −0.494 *−0.497 *
12: difference in average magnitude 60–80° (land − sea)−0.208−0.3950.1690.1190.313−0.411 *0.1810.2920.2020.217−0.494 * 0.997 ***
13: ratio of magnitudes (land/sea)−0.217−0.411 *0.1620.1170.320−0.421 *0.1790.2900.1980.219−0.497 *0.997 ***
Disclaimer/Publisher’s Note: The statements, opinions and data contained in all publications are solely those of the individual author(s) and contributor(s) and not of MDPI and/or the editor(s). MDPI and/or the editor(s) disclaim responsibility for any injury to people or property resulting from any ideas, methods, instructions or products referred to in the content.