Article

TSAE-UNet: A Novel Network for Multi-Scene and Multi-Temporal Water Body Detection Based on Spatiotemporal Feature Extraction

by
Shuai Wang
1,
Yu Chen
1,2,*,
Yafei Yuan
1,
Xinlong Chen
1,
Jinze Tian
1,
Xiaolong Tian
1 and
Huibin Cheng
1
1
School of Environment Science and Spatial Informatics, China University of Mining and Technology (CUMT), Xuzhou 221116, China
2
Key Laboratory of Geographic Information Science (Ministry of Education), East China Normal University, Shanghai 200241, China
*
Author to whom correspondence should be addressed.
Remote Sens. 2024, 16(20), 3829; https://doi.org/10.3390/rs16203829
Submission received: 21 August 2024 / Revised: 12 October 2024 / Accepted: 13 October 2024 / Published: 15 October 2024

Abstract

:
The application of remote sensing technology in water body detection has become increasingly widespread, offering significant value for environmental monitoring, hydrological research, and disaster early warning. However, the existing methods face challenges in multi-scene and multi-temporal water body detection, including the diverse variations in water body shapes and sizes that complicate detection; the complexity of land cover types, which easily leads to false positives and missed detections; the high cost of acquiring high-resolution images, limiting long-term applications; and the lack of effective handling of multi-temporal data, making it difficult to capture the dynamic changes in water bodies. To address these challenges, this study proposes a novel network for multi-scene and multi-temporal water body detection based on spatiotemporal feature extraction, named TSAE-UNet. TSAE-UNet integrates convolutional neural networks (CNN), depthwise separable convolutions, ConvLSTM, and attention mechanisms, significantly improving the accuracy and robustness of water body detection by capturing multi-scale features and establishing long-term dependencies. The Otsu method was employed to quickly process Sentinel-1A and Sentinel-2 images, generating a high-quality training dataset. In the first experiment, five rectangular areas of approximately 37.5 km2 each were selected to validate the water body detection performance of the TSAE-UNet model across different scenes. The second experiment focused on Jining City, Shandong Province, China, analyzing the monthly water body changes from 2020 to 2022 and the quarterly changes in 2022. The experimental results demonstrate that TSAE-UNet excels in multi-scene and long-term water body detection, achieving a precision of 0.989, a recall of 0.983, an F1 score of 0.986, and an IoU of 0.974, significantly outperforming FCN, PSPNet, DeepLabV3+, ADCNN, and MECNet.

Graphical Abstract

1. Introduction

Accurately capturing the spatiotemporal changes in water bodies is crucial for managing water resources’ dynamics, responding to water-related disasters, and monitoring the impacts of climate change in a timely manner [1,2,3,4,5]. Therefore, analyzing the spatiotemporal distribution patterns and evolution of water bodies is of great significance.
Currently, with the continuous development and deployment of Earth observation systems, remote sensing technology has become a vital tool for multi-temporal water body detection due to its advantages of all-weather, all-time capabilities and extensive coverage [6,7]. At present, the commonly used remote sensing images mainly include optical imagery and SAR imagery. Optical imagery, with its rich spectral information, clear geometric structures, and texture features—especially high-resolution remote sensing imagery—is widely used in tasks such as object recognition [8] and change detection [9]. Traditional methods for water body detection based on optical remote sensing mainly include the water index method and image classification method [10]. The water index method involves constructing a water index model based on spectral bands and manually selecting a threshold between water and non-water areas based on empirical values to achieve water body detection. As early as 1996, Gao et al. [11] proposed the normalized difference water index (NDWI), using the green and near-infrared bands. However, the NDWI is significantly affected by buildings’ shadows, making it difficult to achieve satisfactory detection results in urban areas. Subsequently, various water indices emerged, such as the modified NDWI (MNDWI) [12,13], enhanced MNDWI (E-MNDWI) [14], and automated water extraction index (AWEI) [15]. Although the water index method is simple and fast, the water body detection results obtained using this method are often unsatisfactory due to the spectral similarity between water and low-reflectance objects, as well as the spectral variability of water bodies themselves. Additionally, the water index method requires the determination of an appropriate threshold, and selecting the most suitable threshold for extracting water bodies remains a major challenge [16]. Moreover, considering the cost issues and practical needs, the current high-resolution optical imagery often only includes the red, green, blue, and near-infrared bands, which limits the application of the water index method. The image classification method detects water bodies on the basis of remote sensing spectral information, texture, and geometric edge features, using classifiers from machine learning. Common classifiers primarily include decision trees [17], support vector machines [18], and random forests [19]. The image classification method can achieve better water body detection results than the water index method. However, it requires manually construction of the features of water and non-water areas for the classifier to recognize, and these manually constructed features often have subjectivity and a limited scope of applicability. In summary, traditional methods for water body detection based on optical imagery face the following challenges. (1) The shape and size of water bodies can change due to natural environmental factors and human activities, leading to spatial diversity in water body regions, which increases the difficulty of water body extraction and segmentation. (2) “Same spectrum, different objects” is a major challenge in the interpretation of optical remote sensing imagery. Shadows cast by tall objects have similar spectral characteristics to water bodies in imagery, and the presence of floating vegetation or sediment on the water surface affects reflectance, increasing the risk of false negatives or false positives. (3) The cost of acquiring high-resolution imagery is high. These challenges hinder the widespread application of traditional methods in multi-scene and multi-temporal water body detection.
The application of SAR imagery in the field of water body detection began relatively late, but it has rapidly developed in recent years due to its unique advantage of seeing through clouds and fog, and has been widely used in water body detection [20]. Currently, the methods for water body extraction using SAR imagery primarily include grayscale threshold segmentation, DEM-based filtering, and texture information methods based on the gray-level co-occurrence matrix [21]. Cao et al. [22] used a threshold-based method with ASAR as the data source to achieve water body detection. Hong et al. [23] combined SAR, optical imagery, and DEM data to improve the accuracy of water body information extraction. Klemenja et al. [24] combined morphological filtering and supervised classification to automatically select samples for training, achieving water body detection across multiple scenes. However, the use of morphological filtering can result in unsmooth water body edges due to the presence of morphological structuring elements, leading to lower detection accuracy. Lyu et al. [25] combined the gray-level co-occurrence matrix with the SVM method for water body extraction, effectively reducing the impact of the terrain. However, the gray-level co-occurrence matrix method involves high computational complexity, and a significant amount of texture information is lost during the grayscale quantization process. Additionally, selection of the optimal window size for extracting texture information requires extensive manual tuning. In summary, while SAR imagery can provide valuable information for water body detection in shallow water and shadowed areas, its low spatial resolution and high noise levels make it difficult to accurately and effectively extract water bodies. Additionally, the existing methods are constrained by challenges such as threshold selection, high computational complexity, and low accuracy, making them unsuitable for multi-temporal water body detection.
With the advancement of artificial intelligence and hardware–software technologies, deep learning has been widely applied in fields such as object detection, image classification, and natural language processing due to its powerful representation capabilities [26,27,28,29,30,31], and it also offers potential for multi-scene and multi-temporal water body detection [32,33,34]. For multi-scene water body detection, Long et al. [28] first proposed the fully convolutional network (FCN), after which FCN and its variants (such as FCN8s and UNet) have achieved great success in water body detection tasks [33,34,35]. However, these methods primarily rely on semantic information for image segmentation and often overlook the intrinsic characteristics of water bodies, leading to lower detection accuracy. To enhance the diversity of water body features and semantic information, Zhang et al. [36] proposed a network called MECNet, which integrates multi-feature extraction and combination modules, enabling water body detection across different backgrounds. Parajuli et al. [37] proposed an attention-dense convolutional network (ADCNN) using Sentinel-2 data, which effectively extracted water bodies. However, in complex scenes, ADCNN tends to overestimate the water body detection results. Research on multi-temporal water body detection is relatively limited. For instance, Guo [38] employed a PCNN-based image fusion method combined with the UNet network to detect changes in water bodies in Ningxiang, China, in June 2017. However, the simplistic sampling method of UNet makes it challenging to capture changes in small water bodies. Yang [39] constructed the CNN_LSTM and Convolution Seq2Seq models to perform a multi-temporal analysis of the water bodies in the area between the Qiala Reservoir and Daxihai Reservoir in Yuli County, Xinjiang, China, achieving specific results. However, the dataset used was manually labeled, which is time-consuming and highly subjective. As a result, the model’s training performance was heavily influenced by the training set, leading to biases in the multi-temporal water body detection results. Although most models can achieve good detection results in multi-scene settings, they do not perform as well in long-term water body detection. Therefore, constructing a multi-modal integrated model for multi-scene and multi-temporal water body detection remains a key challenge and is a hot topic in current research. Additionally, efficiently obtaining a sufficient amount of high-quality training datasets is also a major challenge in deep learning-based water body detection tasks.
To address the limitations of the existing methods, such as their inability to effectively adapt to varying environmental conditions across different scenes and time periods, as well as the challenge of acquiring sufficient and diverse high-quality training data, this study proposes a spatiotemporal scale-based water body detection model called TSAE-UNet. TSAE-UNet integrates convolutional neural networks (CNN) [40,41], depthwise separable convolutions [42], ConvLSTM [43], and attention mechanisms [44] to enhance the accuracy and robustness of water body detection by capturing multi-scale spatiotemporal features and establishing long-range dependencies. The model generates multi-scale feature maps using dual-stream parallel branches and enhances feature representation capabilities through lightweight attention modules and sub-pixel upsampling modules. Temporal sequence analysis is employed to capture the spatiotemporal patterns of water body changes, effectively addressing the diversity of complex environmental scenes and land cover types. Additionally, to ensure efficient model training, a rapid training dataset generation method based on Otsu [45,46] is used, integrating the advantages of both active and passive remote sensing data.
The structure of this paper is as follows. Section 2 introduces the training dataset’s construction method and the architecture of the TSAE-UNet model, Section 3 presents the experiments on multi-scene water body detection, Section 4 covers the experiments on multi-temporal water body detection, Section 5 is the discussion section, and Section 6 concludes the study with a summary of the findings.

2. Methods

2.1. Dataset Construction Method

To overcome the dependency on high-resolution remote sensing data for water body detection and to enhance the practicality and generalizability of the TSAE-UNet model in real-world applications, this study utilized open-source medium-resolution Sentinel-1A and Sentinel-2 remote sensing data to create a dataset for training the TSAE-UNet model. Among these, Sentinel-1A effectively compensates for the data loss caused by cloud interference in optical imagery, while Sentinel-2 provides optical data, which helps to accurately distinguish between different land cover types and improves the precision of water body detection. The specific dataset creation method was as follows.
Randomly selected Sentinel-2 imagery data from 2020 to 2022 were obtained using the Google Earth engine (GEE, https://earthengine.google.com, accessed on 7 June 2024), and MNDWI and E-MNDWI were calculated. The formulas are as follows
M N D W I = ( ρ G R E E N ρ S W I R 1 ) ( ρ G R E E N + ρ S W I R 1 ) = ( B 03 B 11 ) ( B 03 + B 11 )
E M N D W I = ( ρ G R E E N ρ S W I R 1 ρ S W I R 2 ) ( ρ G R E E N + ρ S W I R 1 + ρ S W I R 2 ) = ( B 03 B 11 B 12 ) ( B 03 + B 11 + B 12 )
where B 03 ρ G R E E N represents the green band of Sentinel-2, B 11 ρ S W I R 1 represents the shortwave infrared band 1 of Sentinel-2, and B 12 ρ S W I R 2 represents the shortwave infrared band 2 of Sentinel-2.
At the same time, Sentinel-1 VV (vertical-transmit and vertical-receive polarization mode) and VH (vertical-transmit and horizontal-receive polarization mode) data for the corresponding dates and spatial ranges were also obtained through GEE.
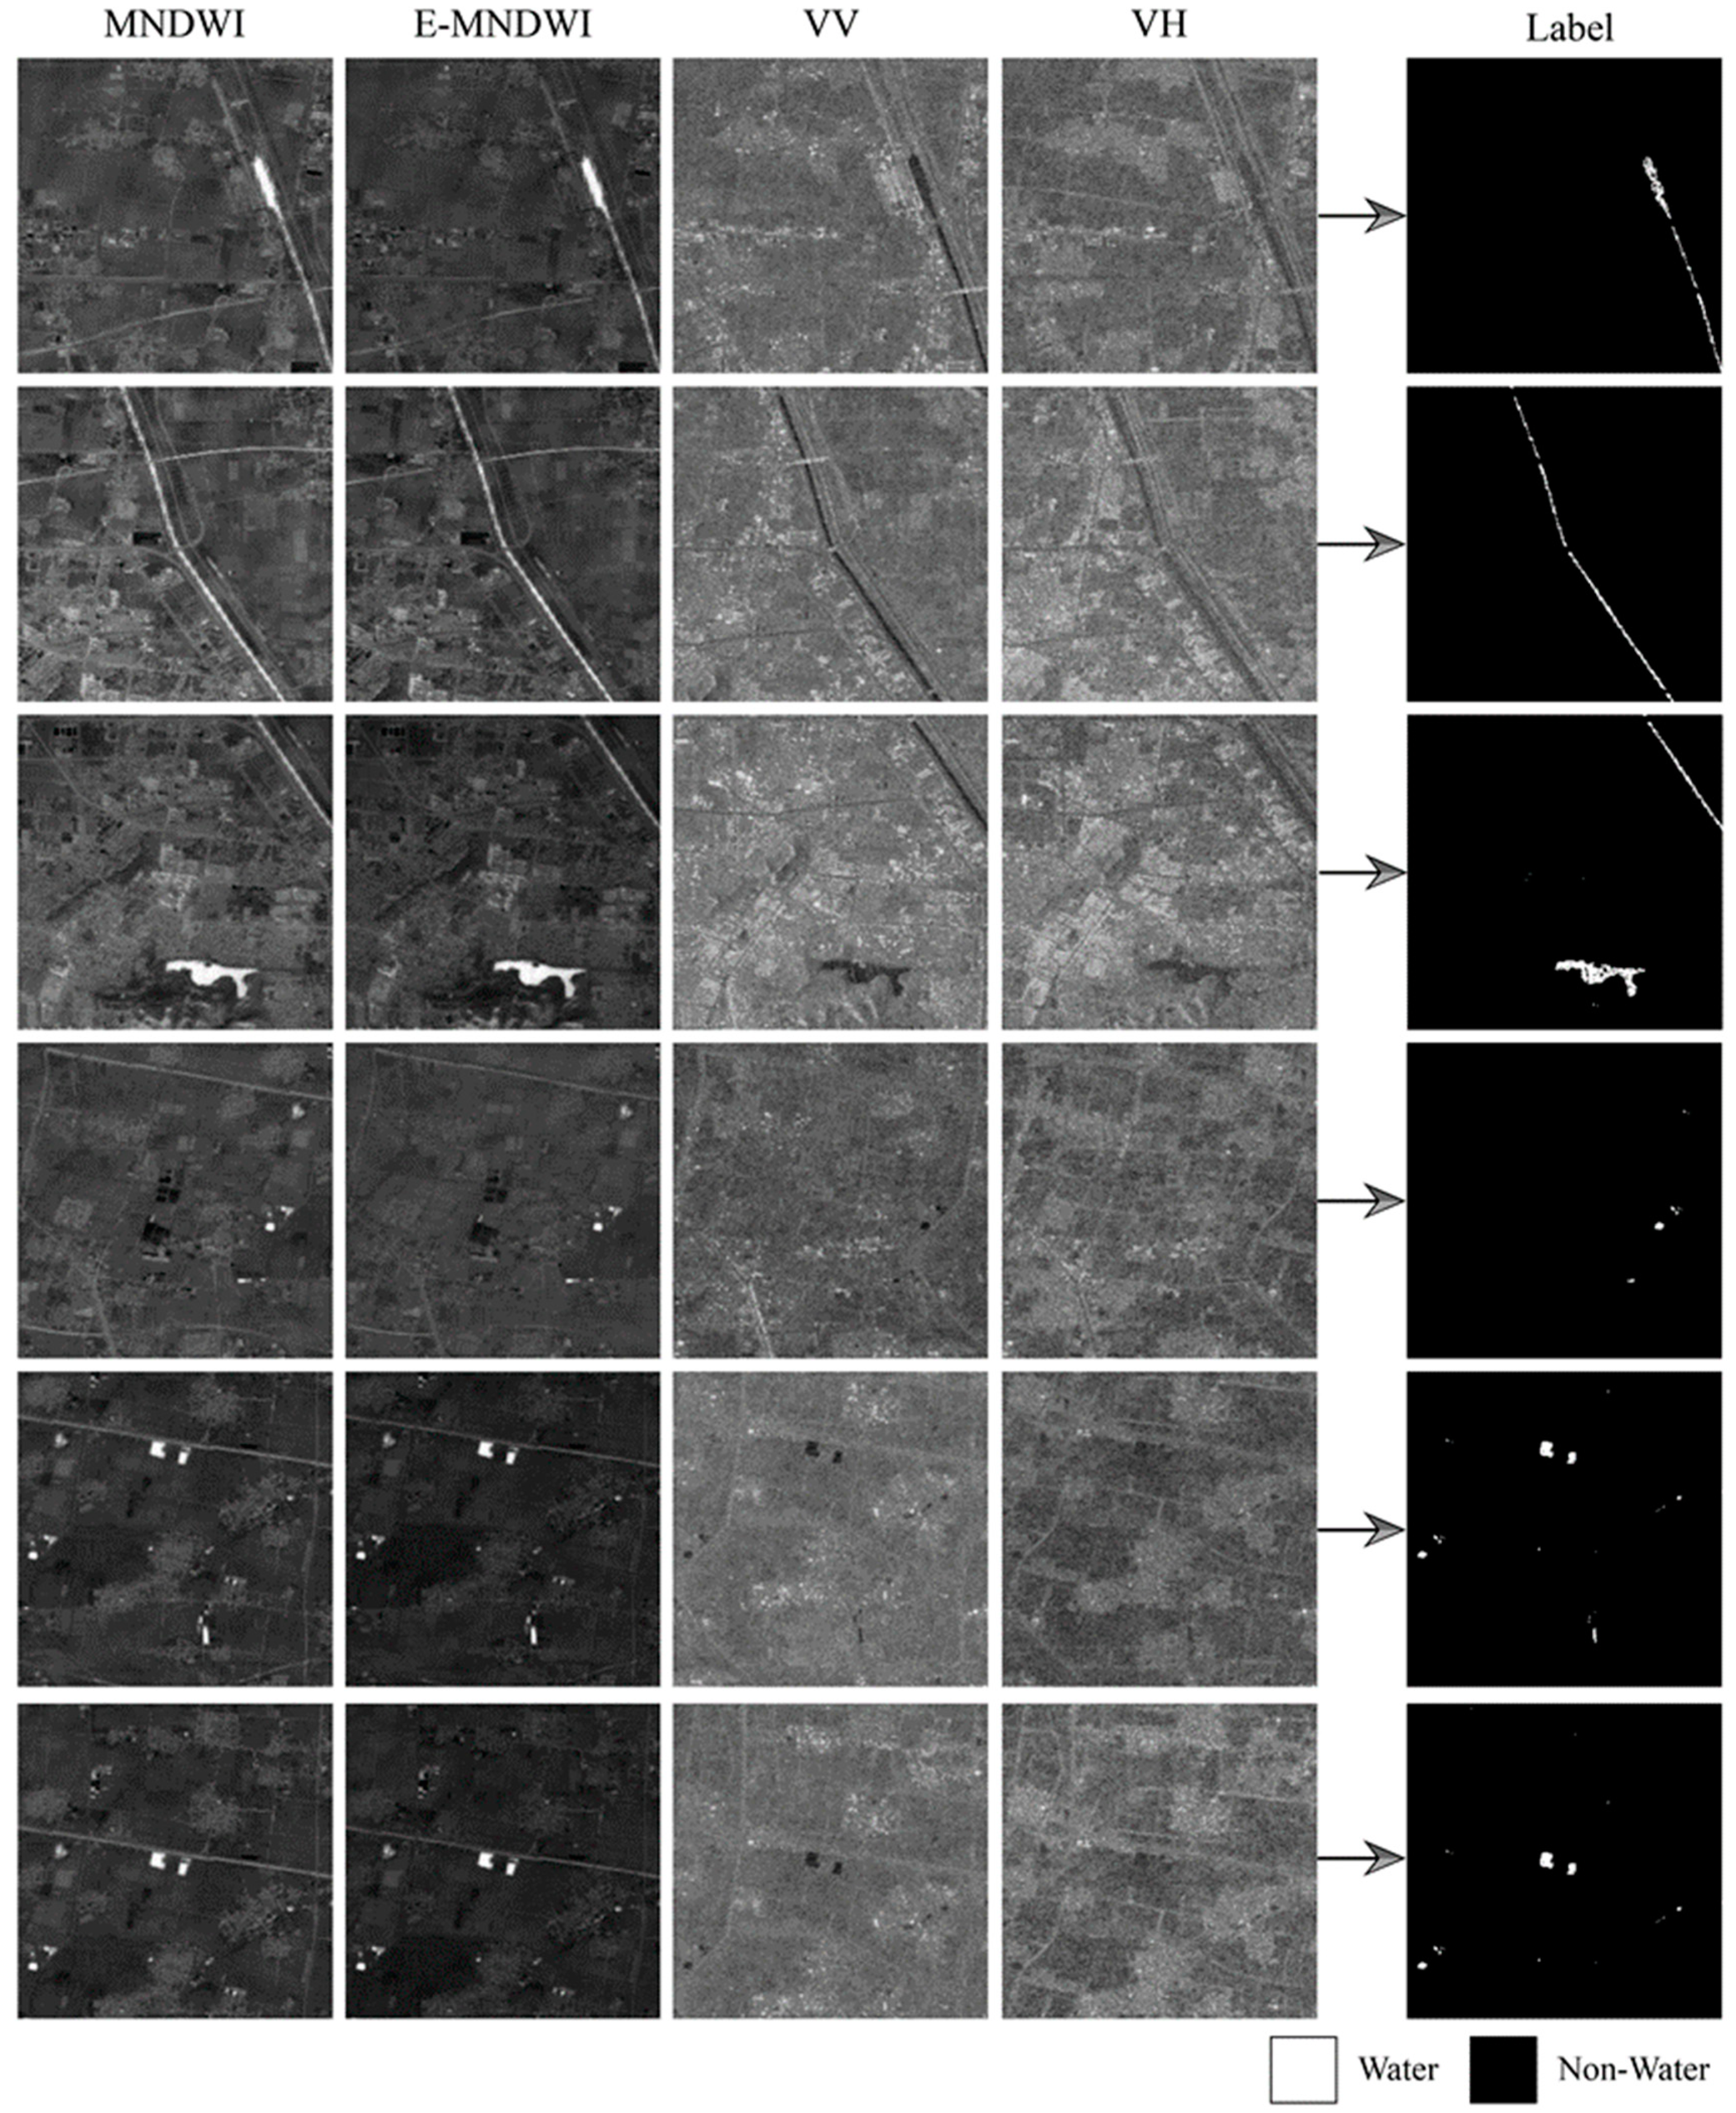
Next, the MNDWI, E-MNDWI, VV, and VH images were cropped into 256 × 256 pixel image patches. Before applying further processing, any missing or infinite values in the datasets were replaced with zeros and marked accordingly to ensure consistency and alignment across the different data sources and to prevent these data points from being mistakenly treated as valid values during the subsequent analysis. The Otsu thresholding method was then applied to each image patch to perform threshold segmentation on the MNDWI, E-MNDWI, VV, and VH data. The Otsu method automatically determined the optimal segmentation threshold by maximizing the between-class variance, thereby dividing the data into water and non-water regions. After completing the threshold segmentation for each index, the segmentation results were overlaid and fused to generate the final water body detection label data. Specifically, the segmentation results of MNDWI and E-MNDWI were first subjected to a logical AND operation to ensure that a pixel was marked as a water body only when both indices indicated a water body region. Subsequently, this result was further fused with the segmentation results of VV and VH using a logical AND operation to obtain the final label data. In total, 10,000 pairs of training samples were obtained for this experiment, as shown in Figure 1.

2.2. TSAE-UNet Architecture

2.2.1. Overview

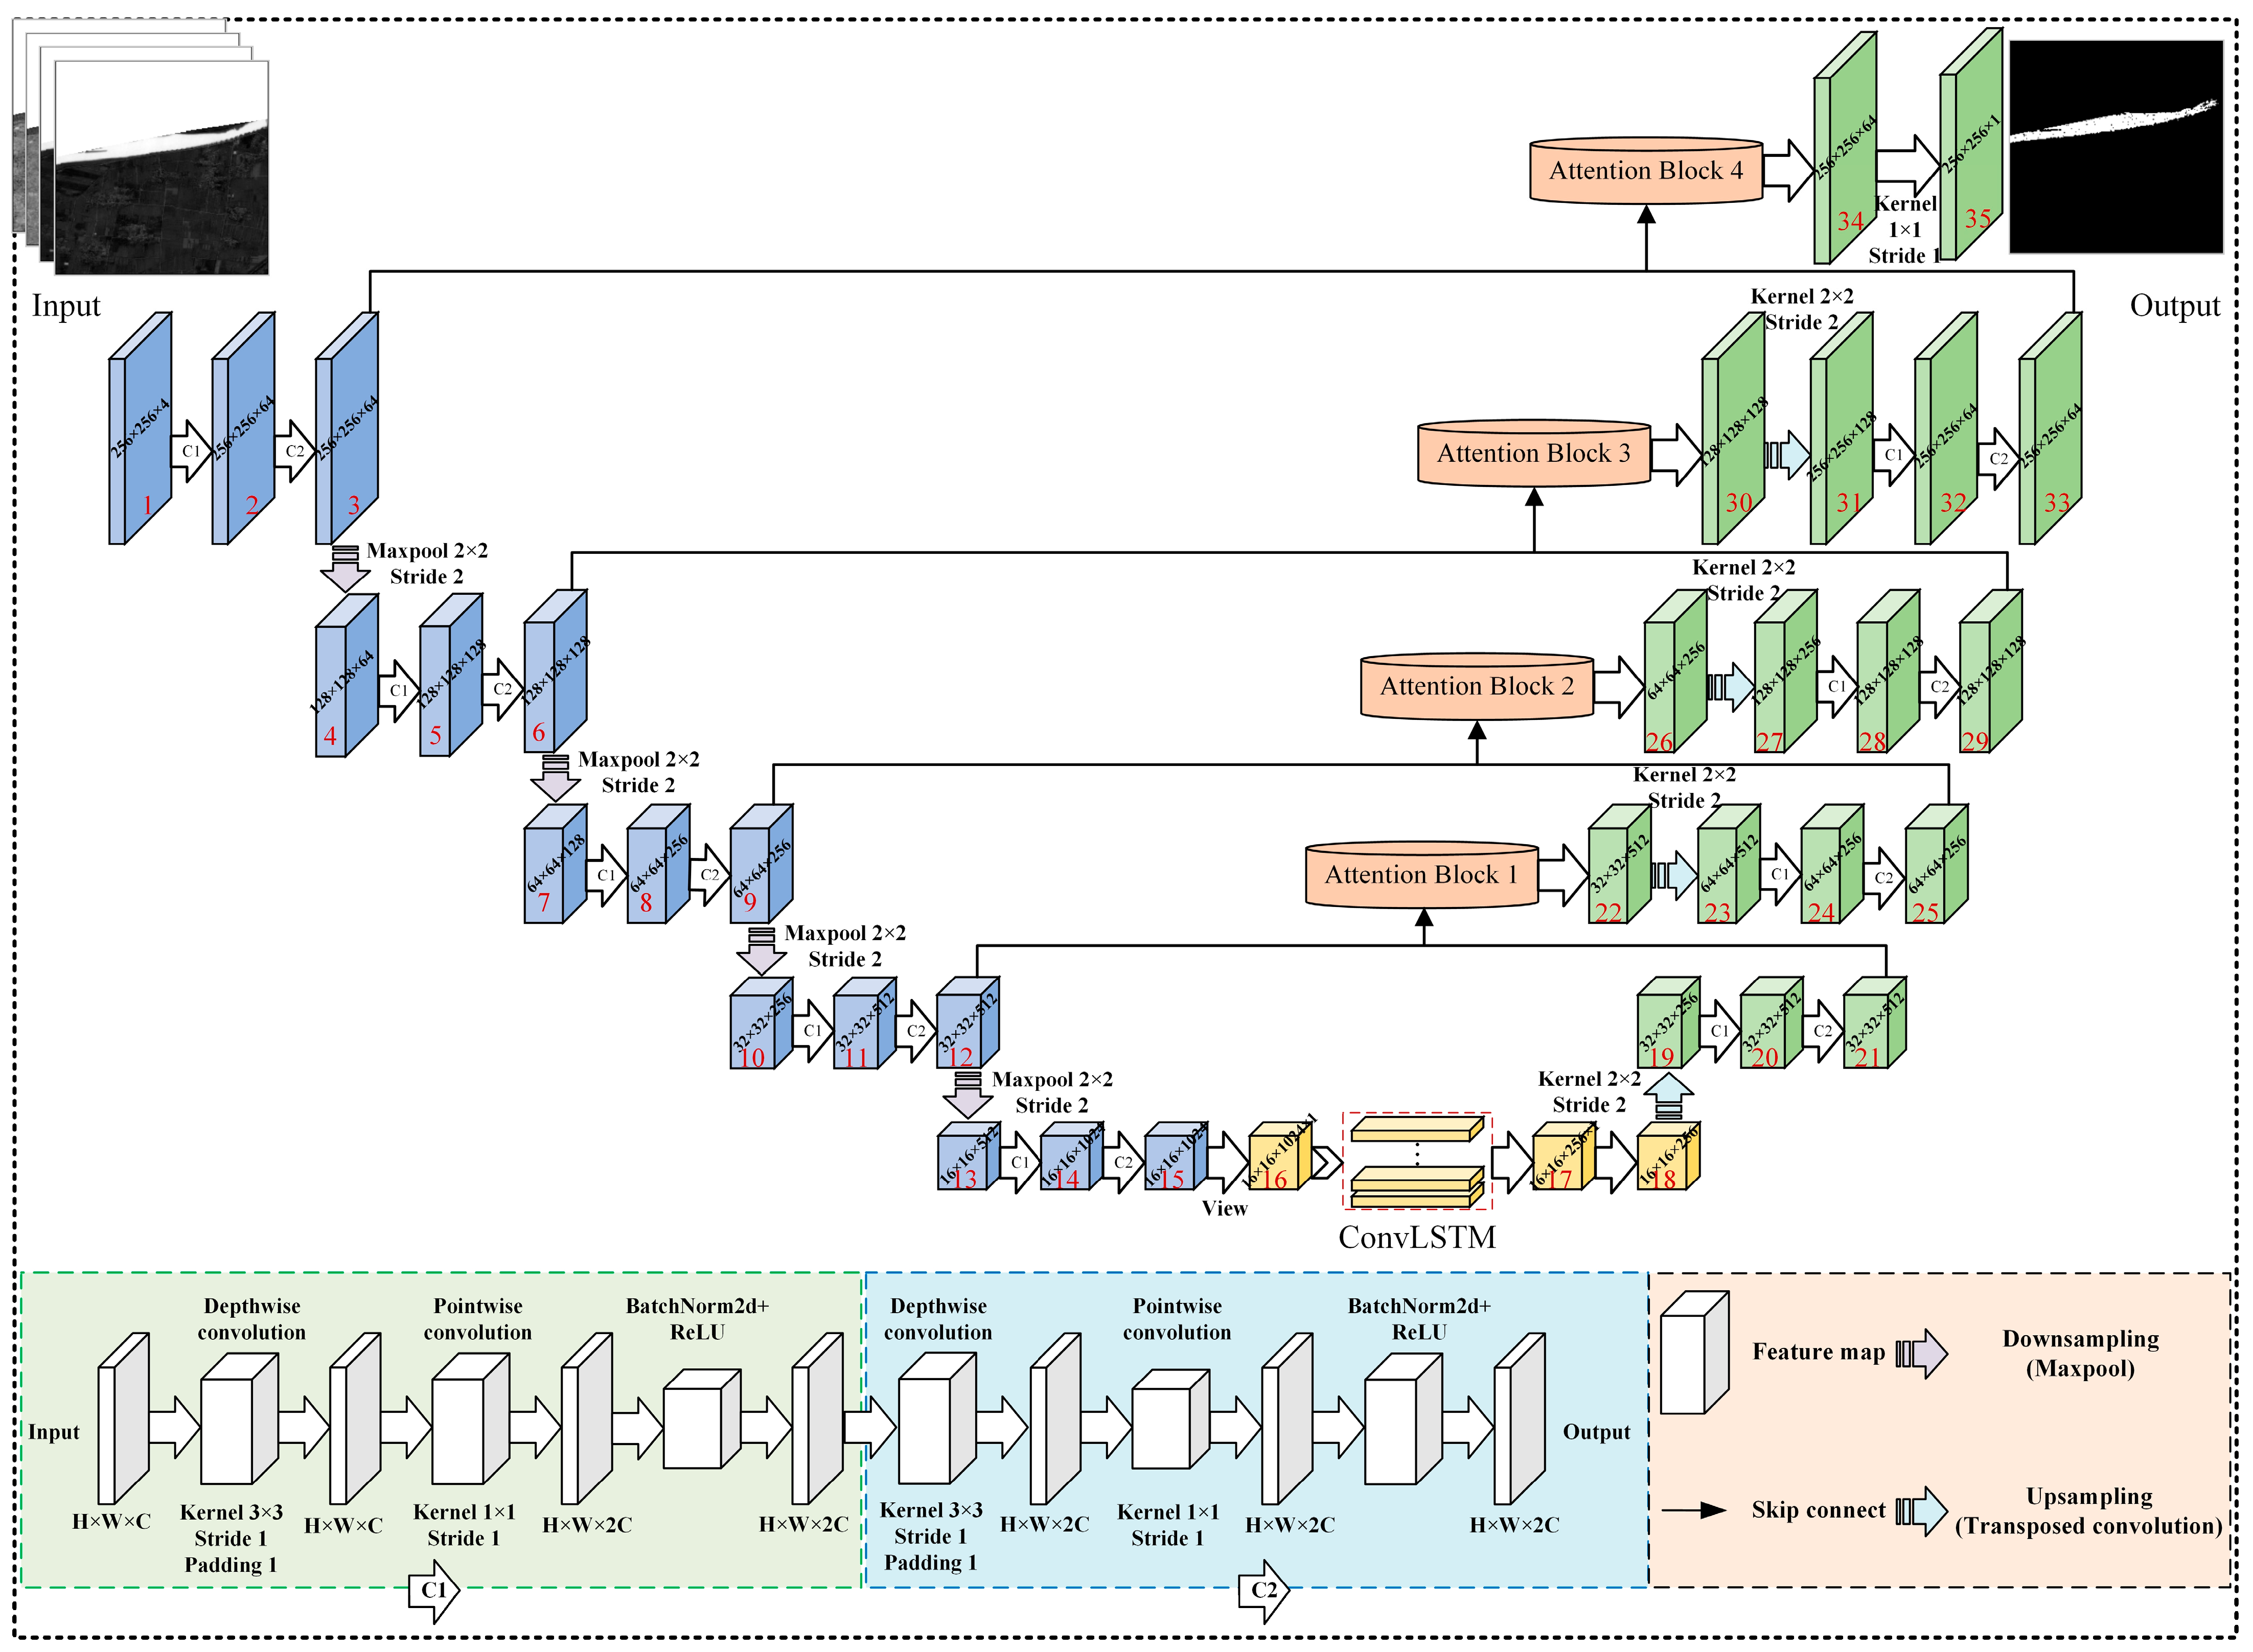
The architecture of TSAE-UNet includes an encoder, a decoder, skip connections, and several innovative modules. As shown in Figure 2, the encoder consists of five stages of depthwise separable convolution layers, with each stage extracting rich spatial features at different scales. The first stage includes three convolutional layers with a kernel size of 3 and padding of 1, and the number of output channels is 64, 128, 256, 512, and 1024, respectively. The downsampling process is achieved through max pooling, progressively reducing the feature map size to extract multi-scale features. In the decoder, transposed convolutions are used for upsampling, and the feature maps at each stage are fused with the corresponding feature maps from the encoder through skip connections. The skip connections embed a lightweight attention mechanism module, which enhances the feature representation of key areas by adjusting the importance of feature maps while suppressing background noise. The attention mechanism module consists of three convolutional layers and a sigmoid activation function, effectively capturing and highlighting the salient features of water bodies.
TSAE-UNet also integrates a ConvLSTM module, which combines convolutional operations with LSTM networks to handle time-series data and capture the spatiotemporal patterns of water body changes. ConvLSTM consists of multiple ConvLSTM units, with each unit receiving the output from the previous time step and the input from the current time step. Through a series of gating mechanisms (such as the input gate, forget gate, and output gate), it updates the hidden state and cell state, thereby establishing long-term dependencies along the temporal dimension.

2.2.2. Depthwise Separable Convolution Layers

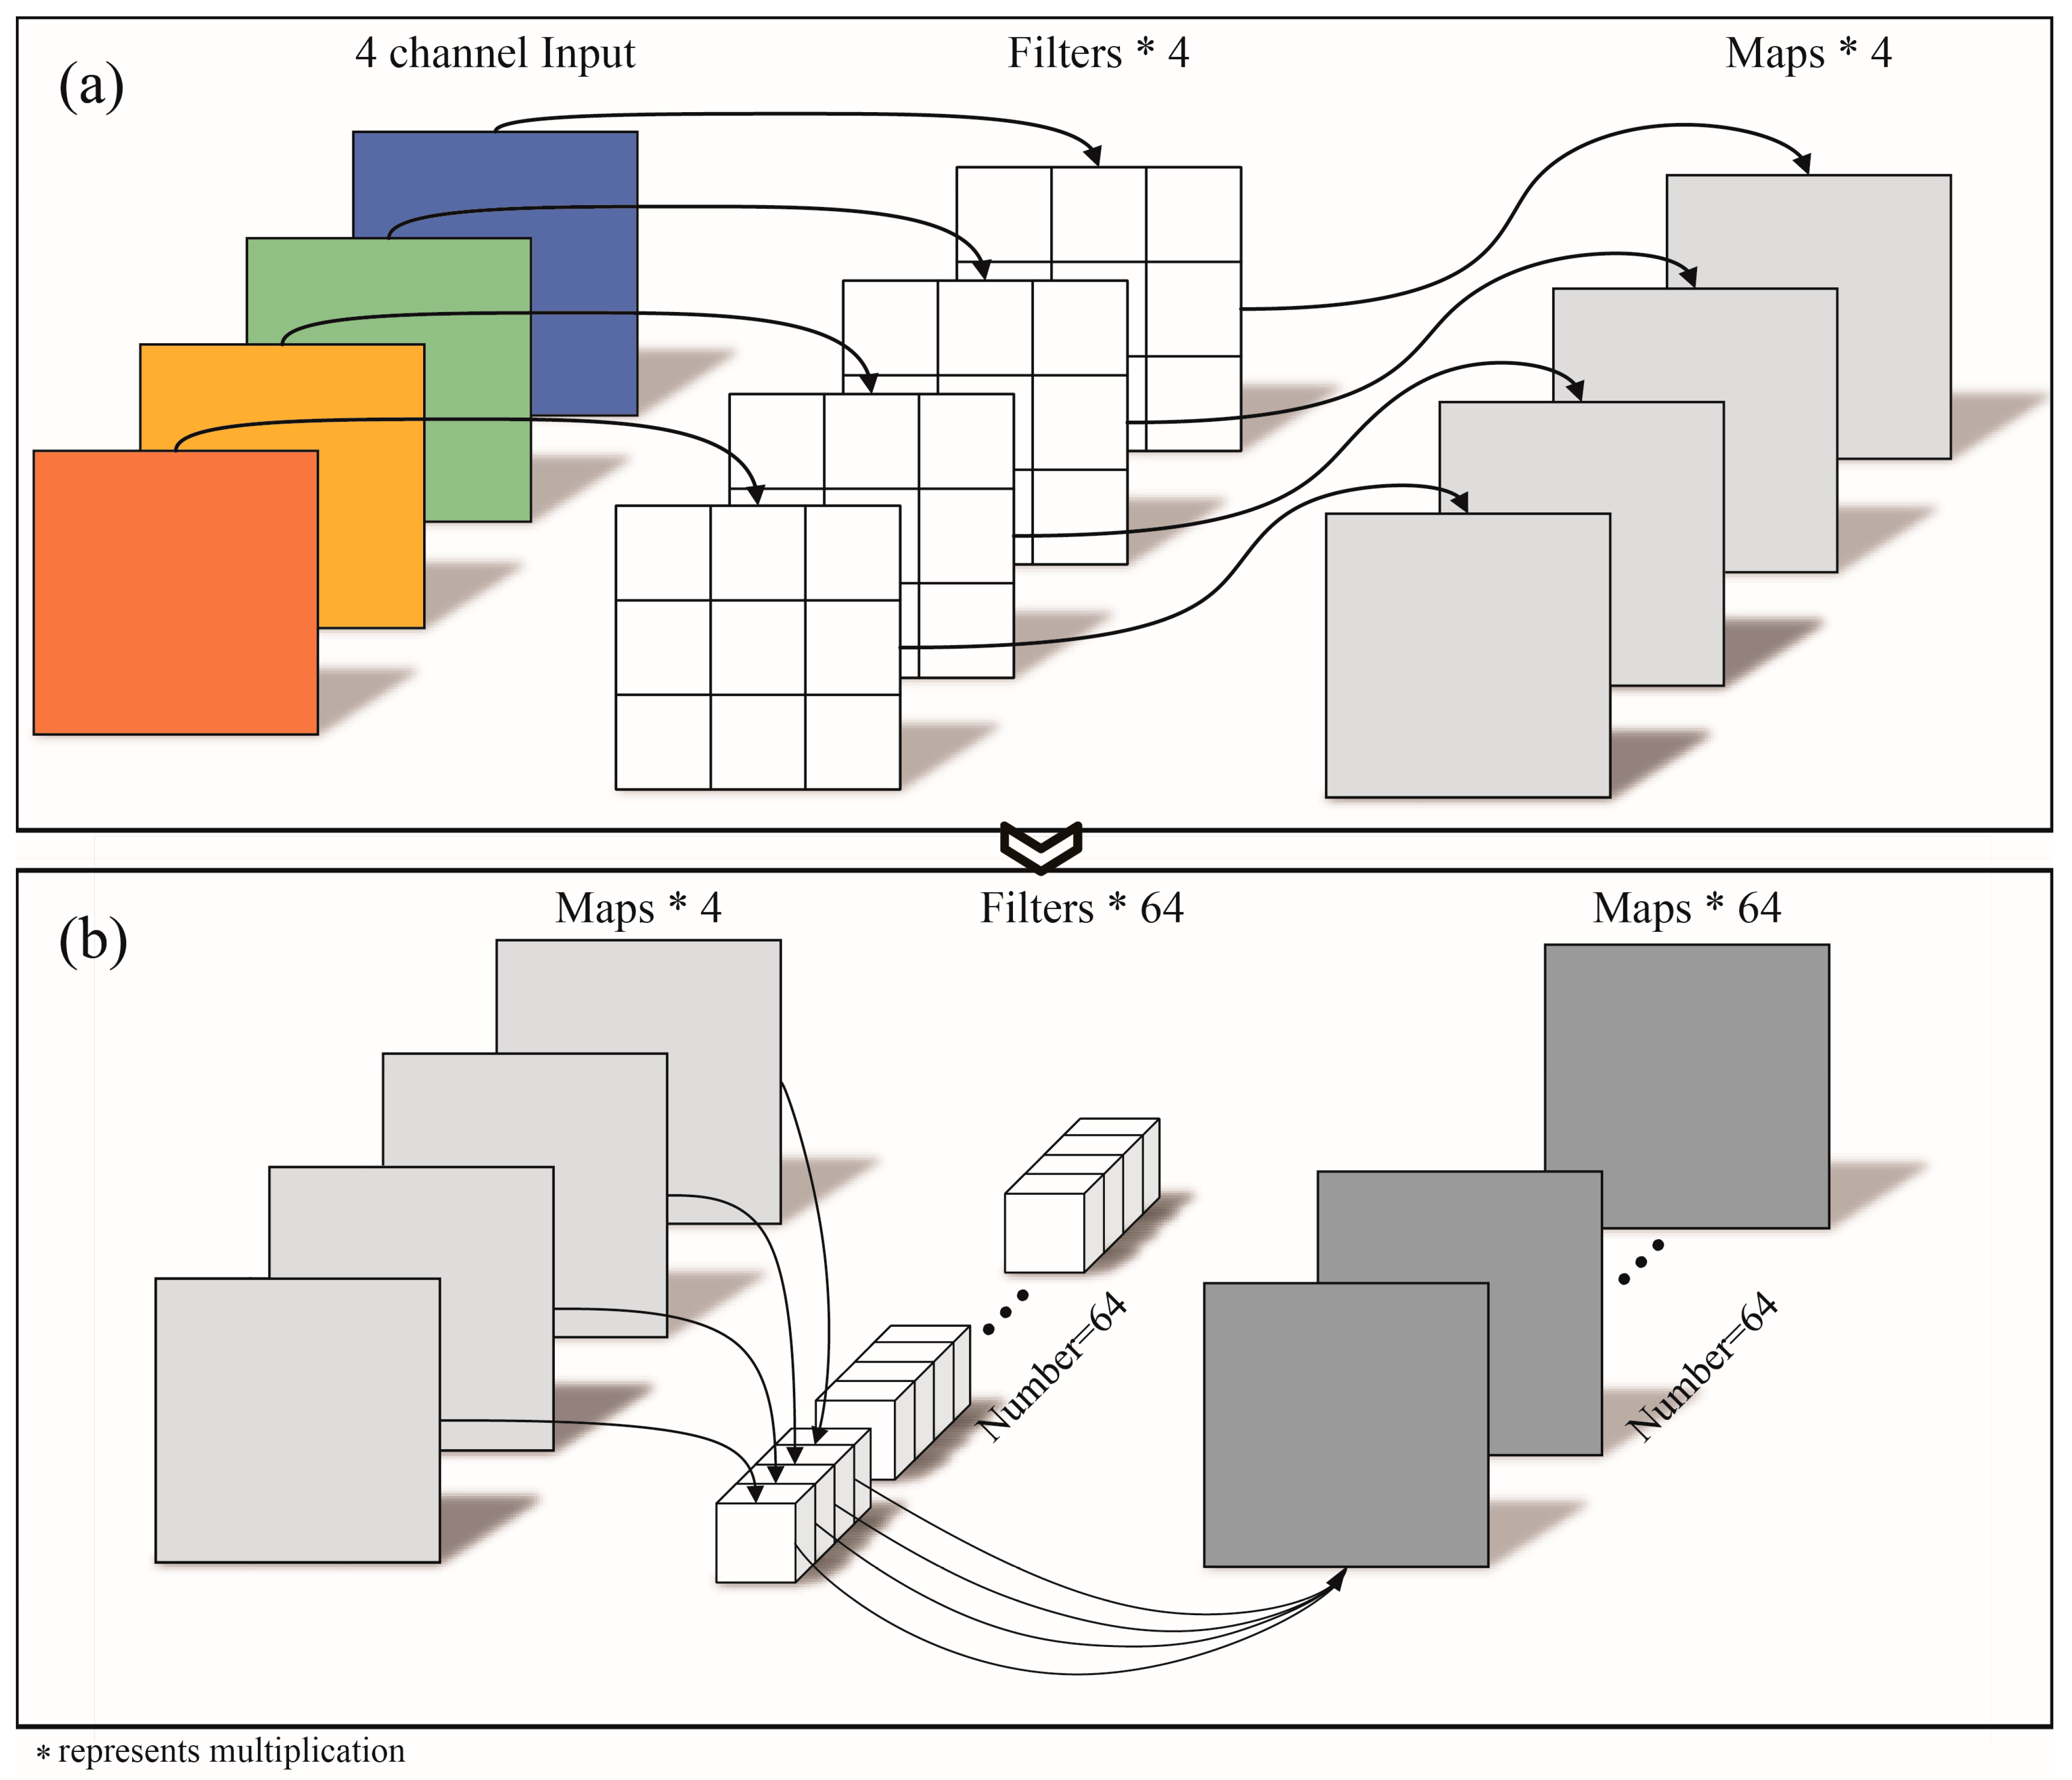
Depthwise separable convolutions are used in TSAE-UNet to construct the encoder, reducing the number of parameters and computational complexity. They help the model learn more efficient feature representations, which is particularly useful when handling large-scale remote sensing data and ensuring real-time water body detection performance. This convolutional layer is composed of a depthwise convolution (Figure 3a) and a pointwise convolution (Figure 3b), which perform convolution operations along the spatial and channel dimensions, respectively. Depthwise convolution performs convolution operations separately on each input channel, while pointwise convolution linearly combines all channels by applying a 1 × 1 convolution to integrate the feature maps obtained from the depthwise convolution.
The advantage of depthwise separable convolution lies in its ability to significantly reduce the computational complexity of convolutional operations. The computational cost of standard convolution operations is proportional to the number of input channels, output channels, and the size of the convolutional kernel. Depthwise separable convolution splits this process into two steps, thereby reducing the computational complexity to one-ninth of the original. Specifically, the computational cost of standard convolution is O D k · D k · M · D f · D f , where D k is the size of the convolutional kernel, M is the number of input channels, N is the number of output channels, and D f is the spatial dimension of the feature map. In contrast, the computational cost of depthwise separable convolution is O D k · D k · M · D f · D f + O M · N · D f · D f . Additionally, the reduced number of parameters and reduced computational cost help prevent model overfitting and improve the generalization capability.

2.2.3. Attention Mechanism

Skip connections preserve high-resolution spatial information by directly passing the feature maps from the encoder layers to the corresponding decoder layers. However, untreated skip connections may introduce irrelevant noise and redundant information, which can affect the model’s performance. The attention mechanism module in TSAE-UNet (Figure 4) is embedded within the skip connections, aiming to adjust the importance of feature maps, enhance the feature representation of key areas, and suppress background noise. The attention mechanism highlights salient features by calculating the weighted sum of the input feature maps and consists of two main components: channel attention and spatial attention. Channel attention captures the importance of each channel through global average pooling and global max pooling operations, and then weights them using a fully connected layer. Spatial attention captures the importance of features at each position through max pooling and average pooling, and then weights them using a convolutional layer. This design helps reduce the interference from irrelevant features and enhances the detection of key water body areas. The formula is as follows
ψ = σ ( W g g + W x x ) y = x · ψ
where W g and W x are the convolution weights and σ is the sigmoid activation function.

2.2.4. ConvLSTM Modules

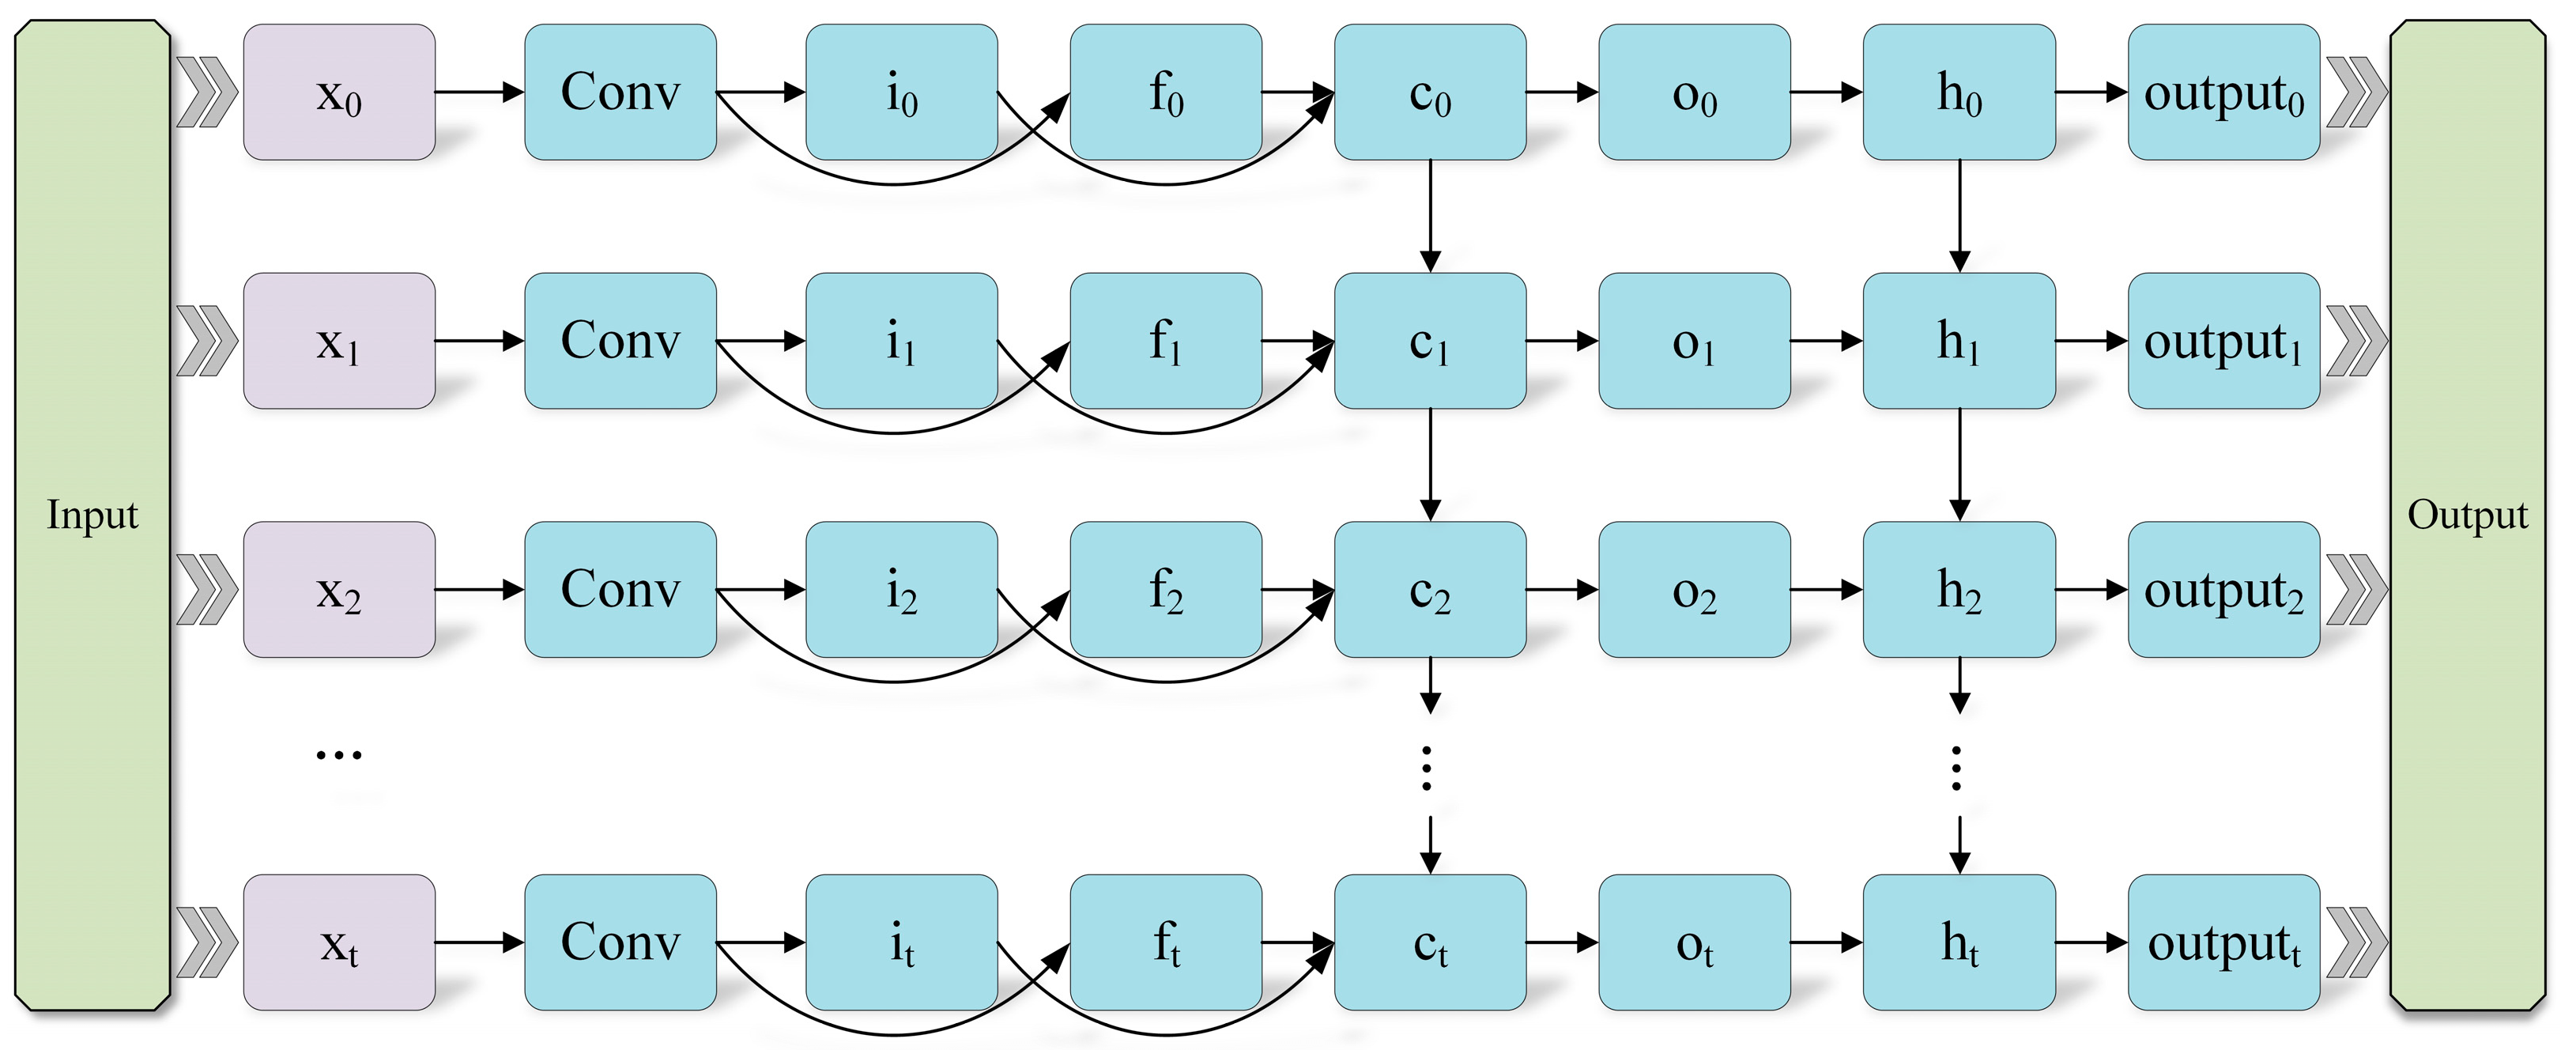
The ConvLSTM module (Figure 5) combines convolutional operations with LSTM networks to handle time-series data and capture the spatiotemporal patterns of water body changes. ConvLSTM consists of multiple ConvLSTM units, with each unit receiving the output from the previous time step and the input from the current time step. Through a series of gating mechanisms (such as the input gate, forget gate, and output gate), it updates the hidden state and cell state, thereby establishing long-term dependencies along the temporal dimension. The specific calculation formulas are as follows
i t = σ ( W i h t 1 , x t + b i ) f t = σ ( W f h t 1 , x t + b f ) c t = f t c t 1 + i t tanh W c h t 1 , x t + b c o t = σ W o h t 1 , x t + b o h t = o t tanh c t
where i t is the input gate, f t is the forget gate, o t is the output gate, c t is the cell state, h t is the hidden state, W represents the weights, b represents the biases, and denotes the Hadamard product.
The advantage of ConvLSTM lies in its ability to capture both spatial and temporal features simultaneously. In water body detection tasks, the spatial distribution and temporal changes in water bodies are two key factors. By combining convolutional operations with LSTM networks, ConvLSTM can effectively capture the dynamic change patterns of water bodies. This ensures that the model can not only detect the current state of water bodies but also track their evolution over time, making it particularly valuable for monitoring gradual changes or responding to sudden environmental shifts.

2.3. Training Strategy

The TSAE-UNet model was trained on a computer equipped with an i9-10980XE CPU, RTX 3090 GPU, and 128 GB of RAM. The BCEWithLogitsLoss function is effective for handling classification problems, especially binary classification, and was therefore selected as the loss function for the model. The calculation formula is as follows
L ( Y , Y ) = 1 N i = 1 N Y i · log ( σ ( Y i ) ) + ( 1 Y i ) · log ( 1 σ ( Y i ) ) Y = T S A E U N e t ( X ) σ ( Y i ) = 1 1 + e Y i
where L Y i , Y is the loss term; N is the number of samples in each batch used for model training; Y i is the target label of the i th training sample, with a value of 0 or 1; Y i is the model output for the i th sample; σ Y i is the sigmoid activation function; and X is the input sample.
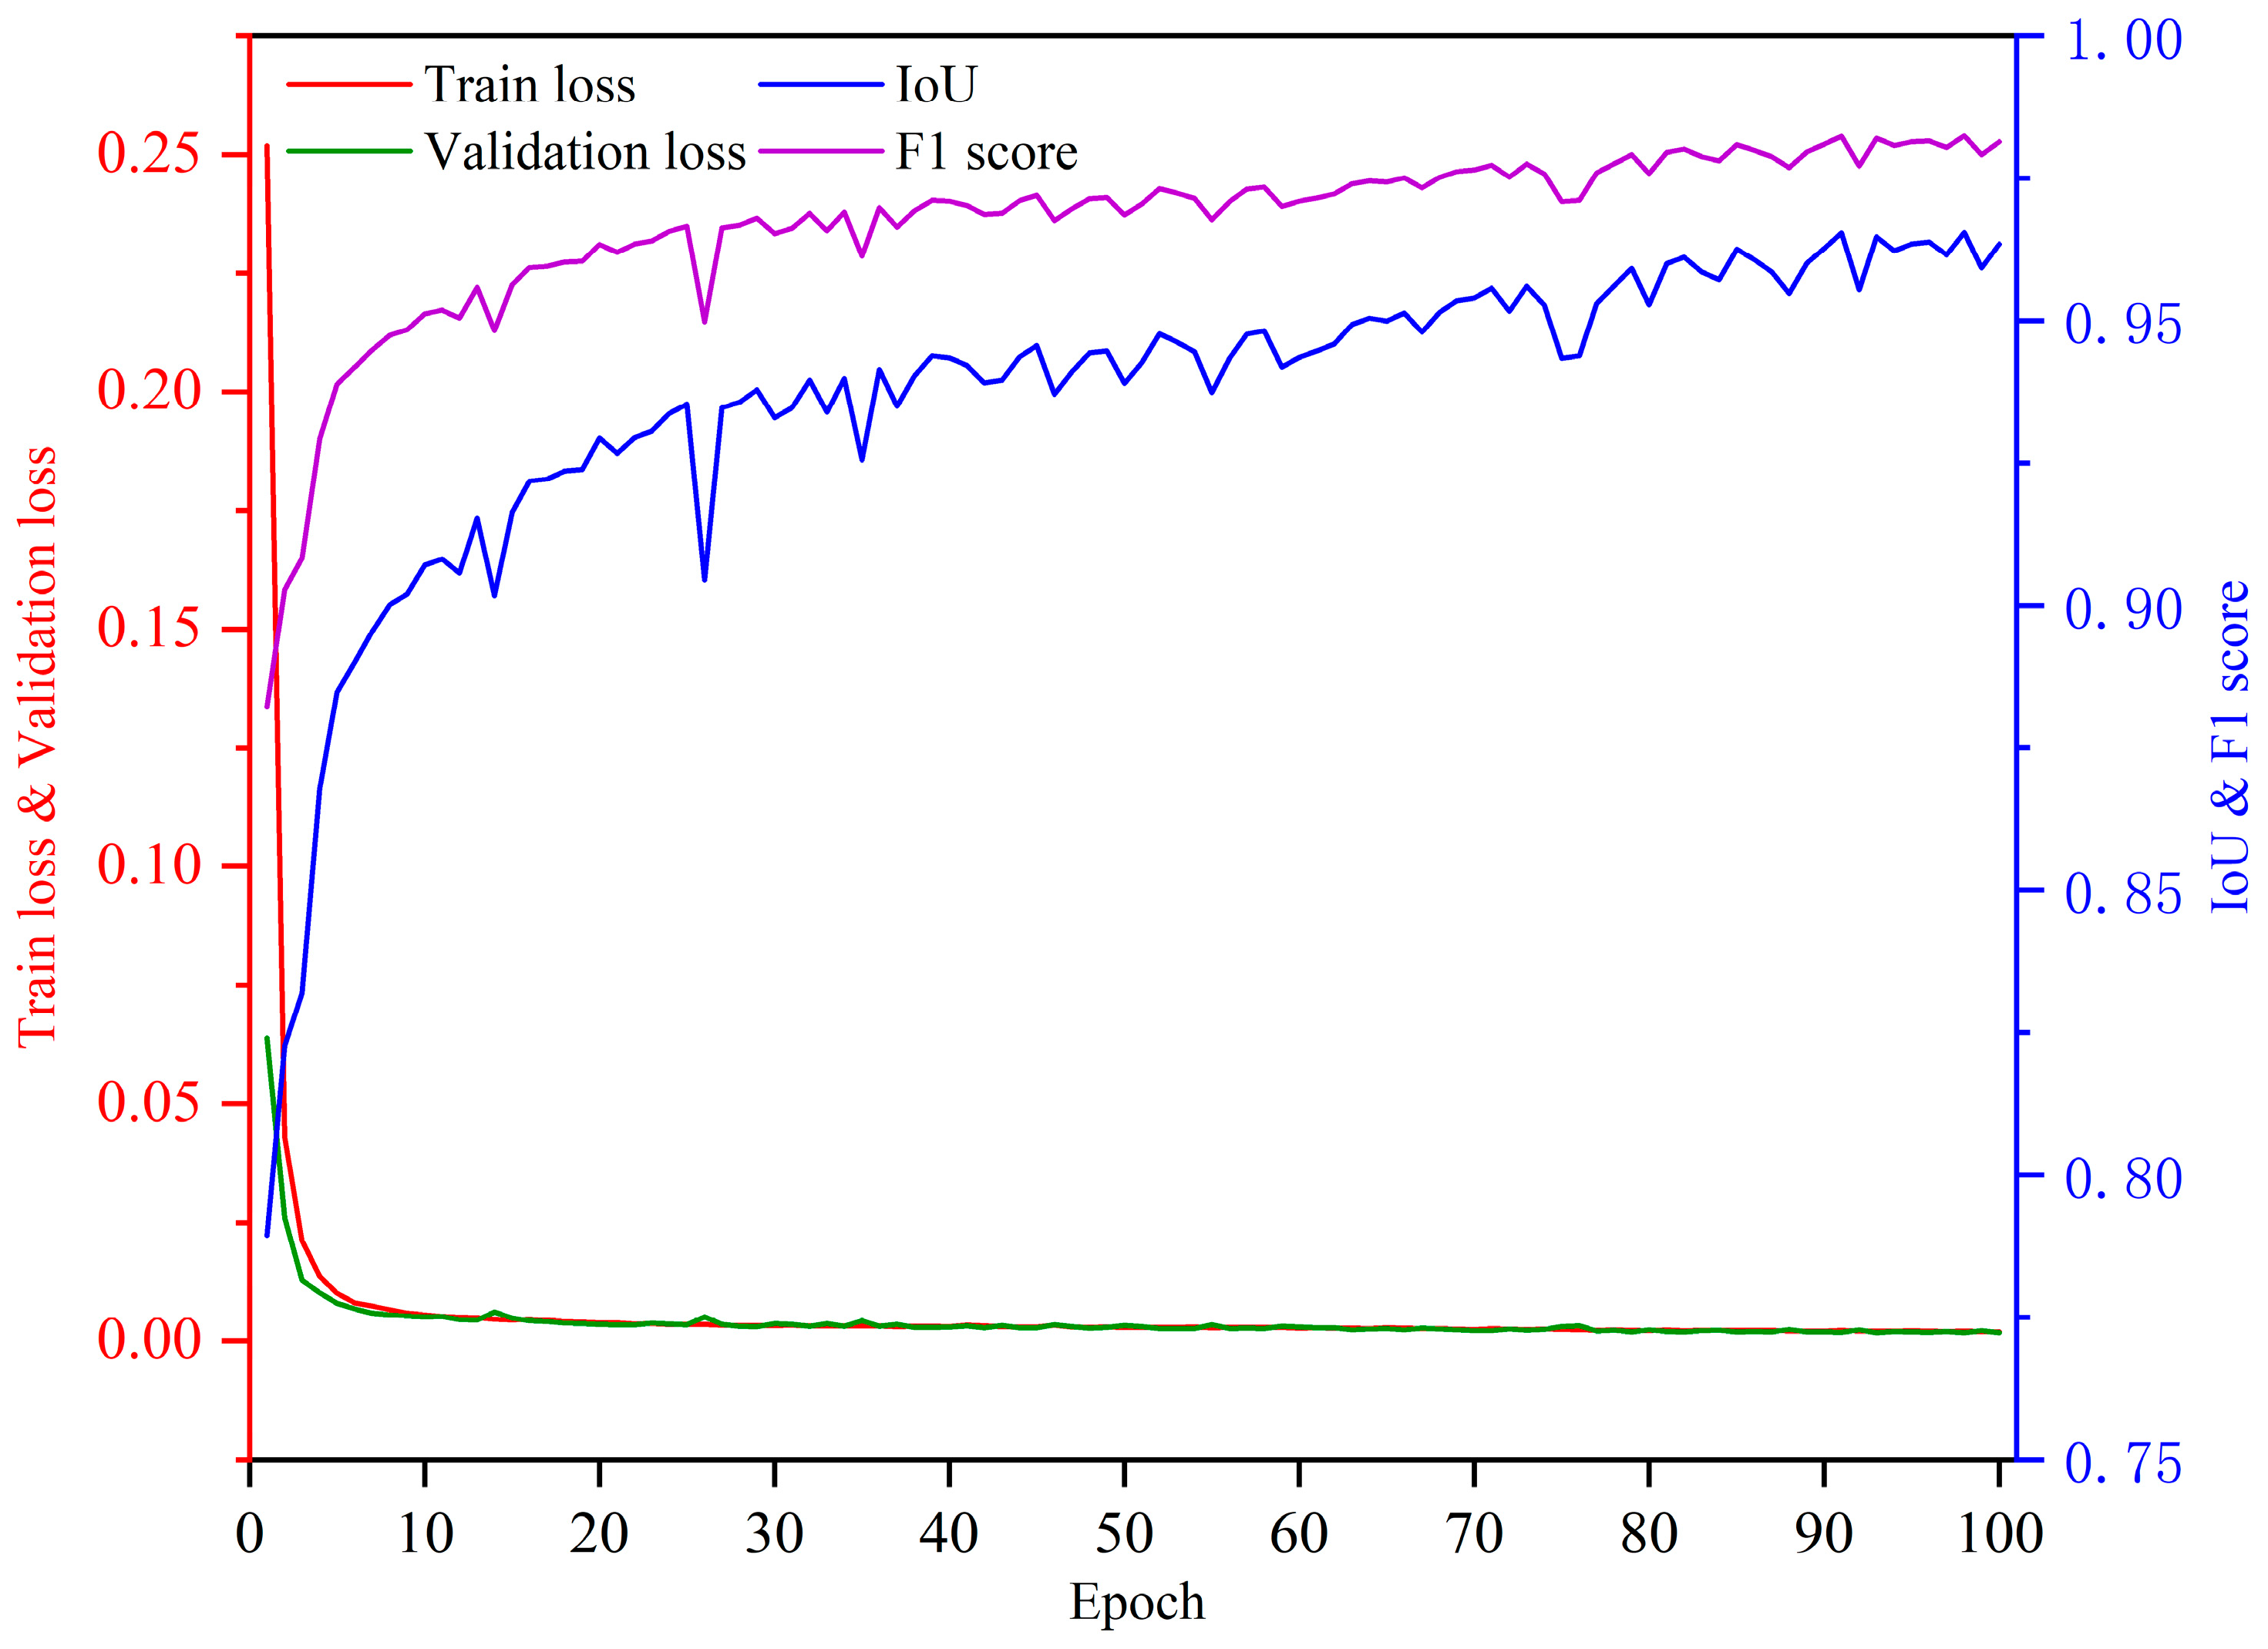
The Adam optimizer [47] was used for optimization, with a batch size of 4, training for 100 epochs, and a learning rate set to 0.0001. A learning rate scheduler was used to dynamically adjust the learning rate on the basis of the validation loss. Specifically, the strategy was to reduce the learning rate by half after 10 epochs if the validation loss did not decrease. The model training results are shown in Figure 6. As the number of epochs increased, the train loss and validation loss decreased initially and then approached zero, with an average training loss of 0.006 and an average validation loss of 0.004. The IoU and F1 score increased initially and then stabilized, with an average IoU of 0.974 and an average F1 score of 0.986. In summary, the TSAE-UNet model demonstrated excellent overall performance during training.

2.4. Accuracy Assessment

The performance of the TSAE-UNet model in water body detection was evaluated using the following metrics: user’s accuracy (precision), producer’s accuracy (recall), overall accuracy, Kappa coefficient, and Pearson’s correlation coefficient (R). The formulas for these metrics are as follows
P r e c i s i o n = T P T P + F P
R e c a l l = T P T P + F N
O v e r a l l _ a c c u r a c y = T P + T N T P + T N + F P + F N
K = p 0 p e 1 p e
where p r e c i s i o n represents the user’s accuracy; R e c a l l represents the producer’s accuracy; O v e r a l l _ a c c u r a c y represents the overall accuracy; K represents the Kappa coefficient; T P (true positive) represents the number of correctly predicted water body pixels; F P (false positive) represents the number of incorrectly predicted water body pixels; T N (true negative) represents the number of correctly predicted non-water body pixels; F N (false negative) represents the number of incorrectly predicted non-water body pixels; p 0 represents the observed agreement, which is the proportion of observed true agreement; and p e represents expected agreement, which is the proportion of expected random agreement.
R = i = 1 n ( X i X ) · ( Y i Y ) i = 1 n ( X i X ) 2 · i = 1 n ( Y i Y ) 2
where R represents Pearson’s correlation coefficient; X i and Y i represent the initial values of the two variables; X and Y represent the mean values of the two variables, respectively; and n represents the number of initial values.

3. Multi-Scene Water Body Detection Experiment

3.1. Overview of the Study Area for Experiment 1

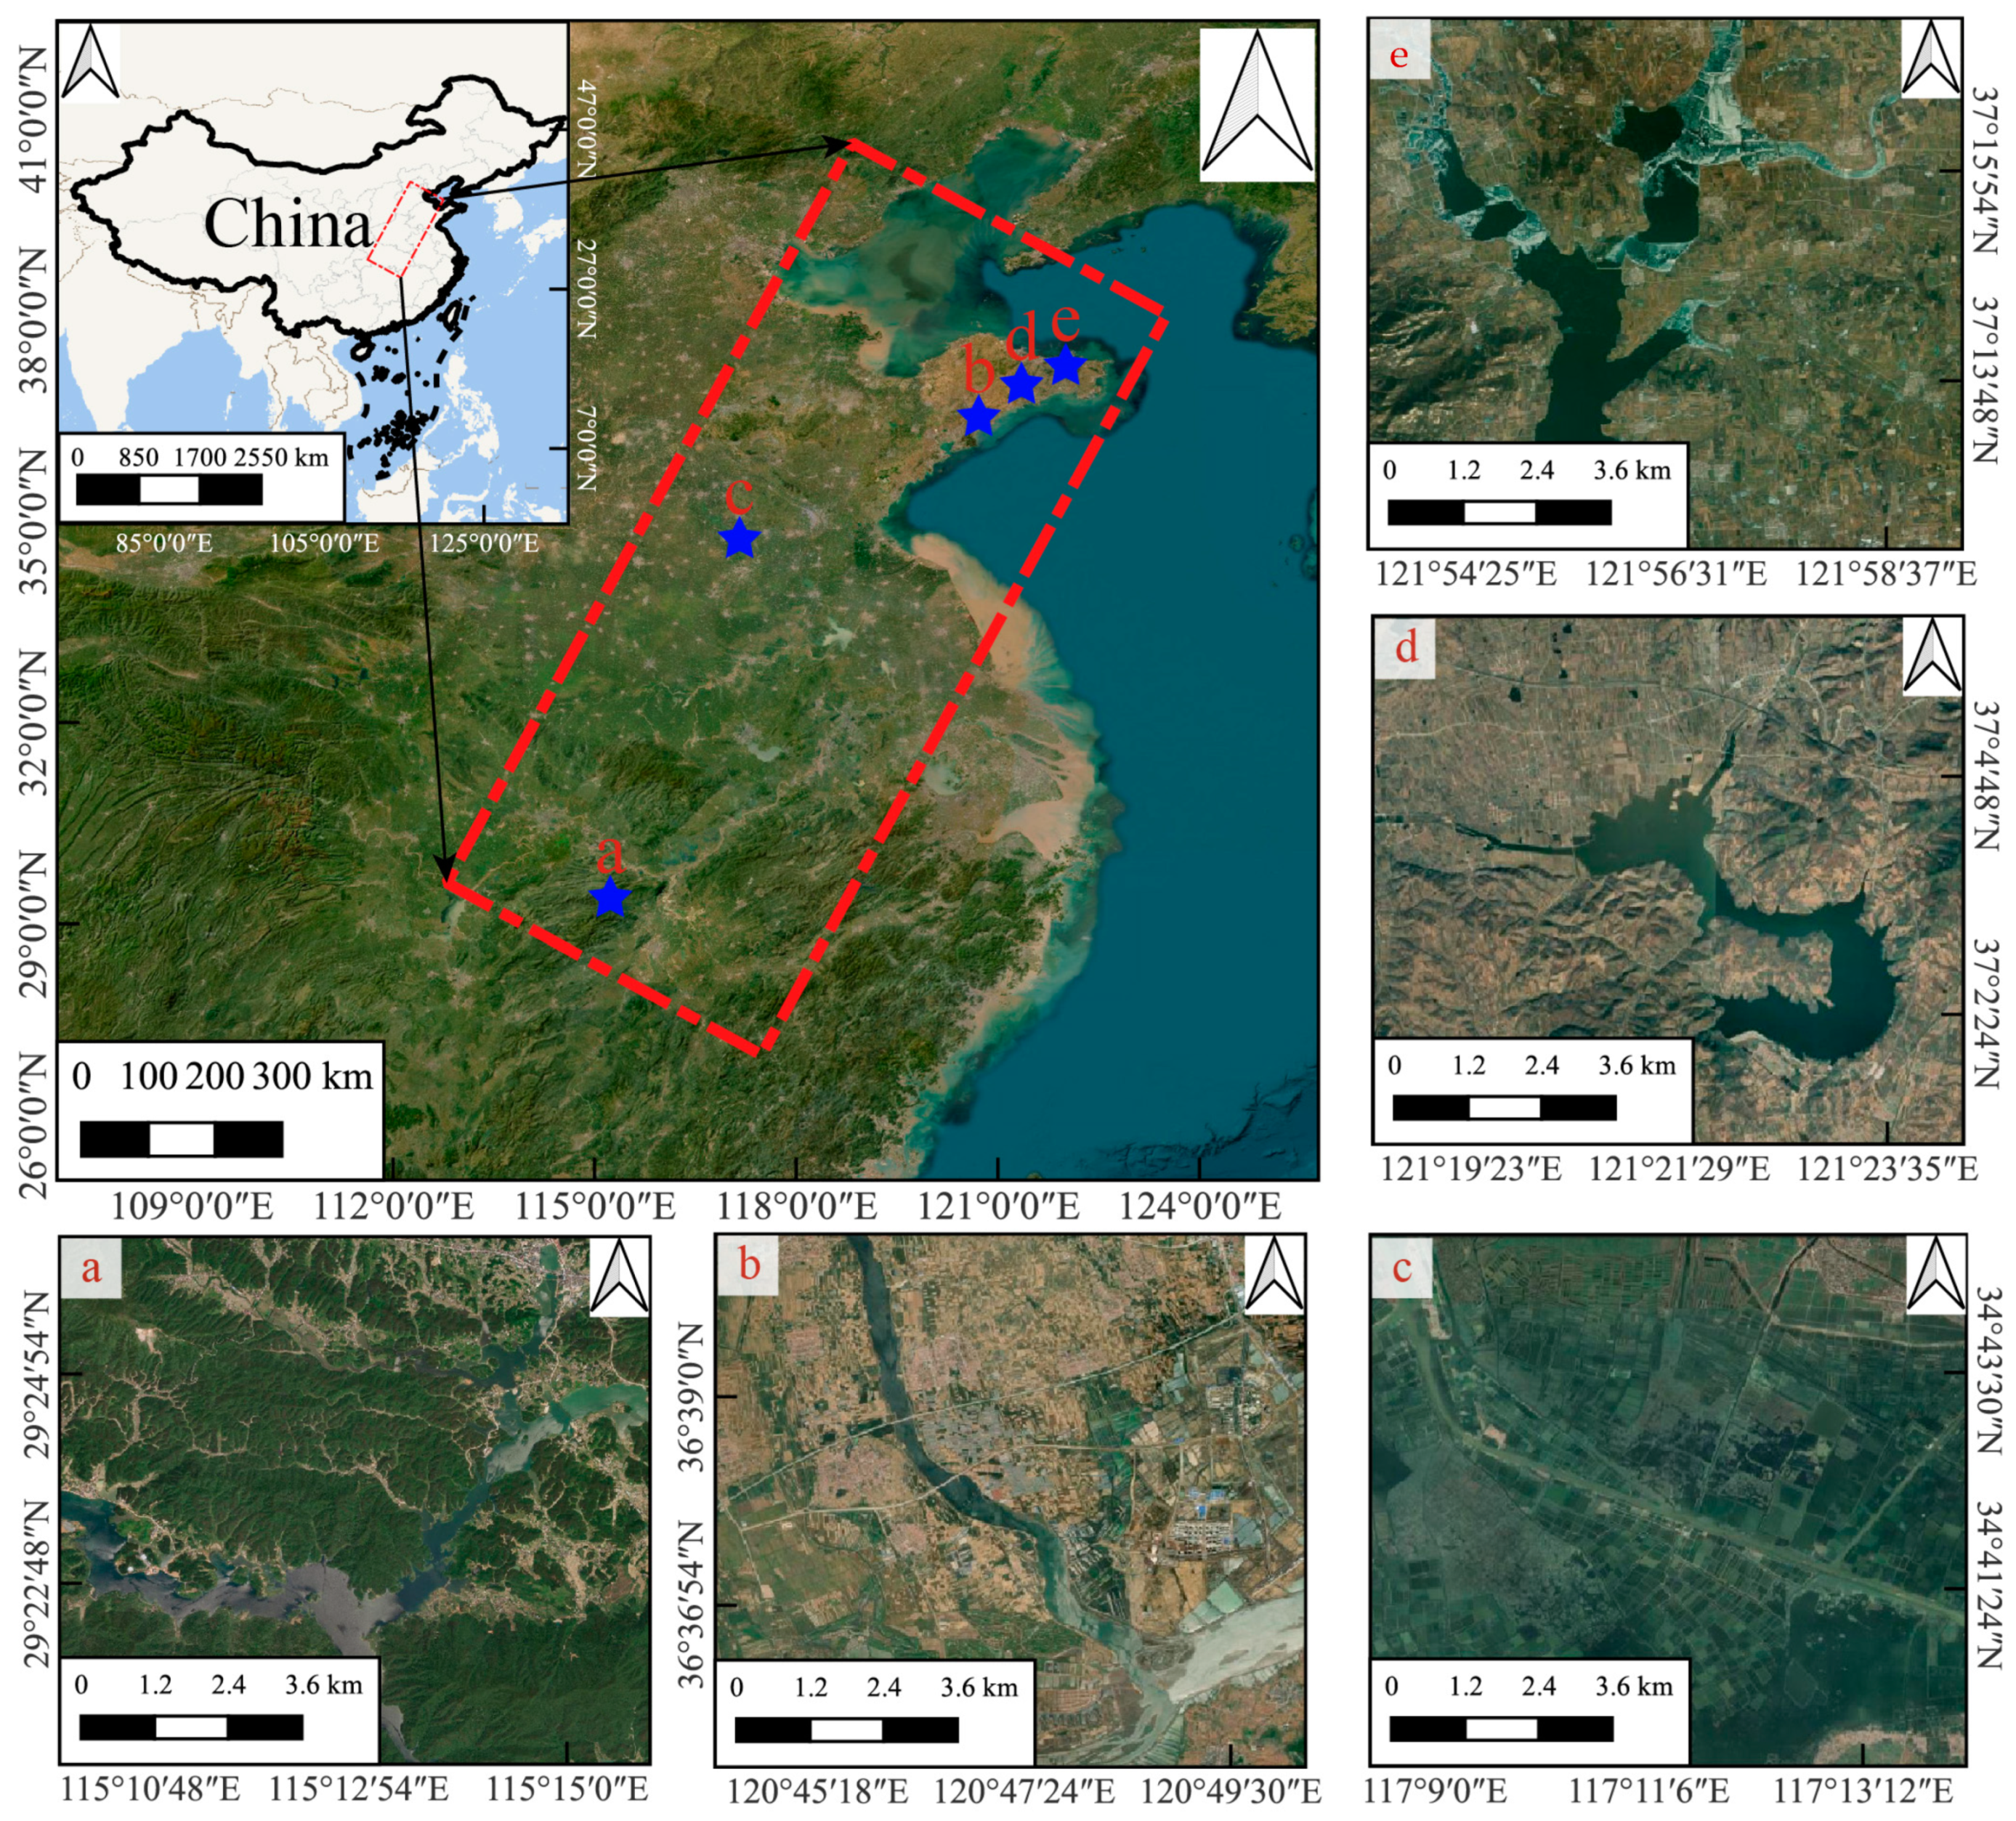
Several typical water body regions across mainland China were selected (Figure 7). These regions encompass water bodies of various sizes, characteristics, and environmental backgrounds, providing broad representativeness. These regions specifically include mountainous water bodies, urban water bodies, wetlands and lakes, water bodies under heavy cloud cover, and agricultural irrigation areas. The selection of these regions helped to evaluate the generalization ability and detection accuracy of the TSAE-UNet model under different environmental conditions.

3.2. Data Used for Experiment 1

The data used in this study were sourced from the Sentinel-1A and Sentinel-2 satellites. The study areas were selected online through GEE, consisting of rectangular regions covering approximately 37.5 km2. The corresponding Sentinel-2 imagery was obtained, and the MNDWI and E-MNDWI were calculated using the B3, B11, and B12 bands. Additionally, the corresponding Sentinel-1 VV and VH data were acquired.

3.3. Results and Analysis for Experiment 1

To comprehensively evaluate the performance of the proposed TSAE-UNet model, we compared it with several state-of-the-art models, including FCN, PSPNet [48], DeepLabV3+ [49], ADCNN, and MECNet. All models were trained using the same training dataset and training parameters, and the average precision, average recall, average F1 score, and average IoU metrics were recorded during the training process. As shown in Table 1, TSAE-UNet performed exceptionally well across all four metrics, surpassing all other comparison models. MECNet’s performance was the closest to TSAE-UNet, followed by ADCNN, PSPNet, and DeepLabV3+, with FCN showing relatively poorer performance. The time and RAM required for training one epoch of each model are shown in Table 2.
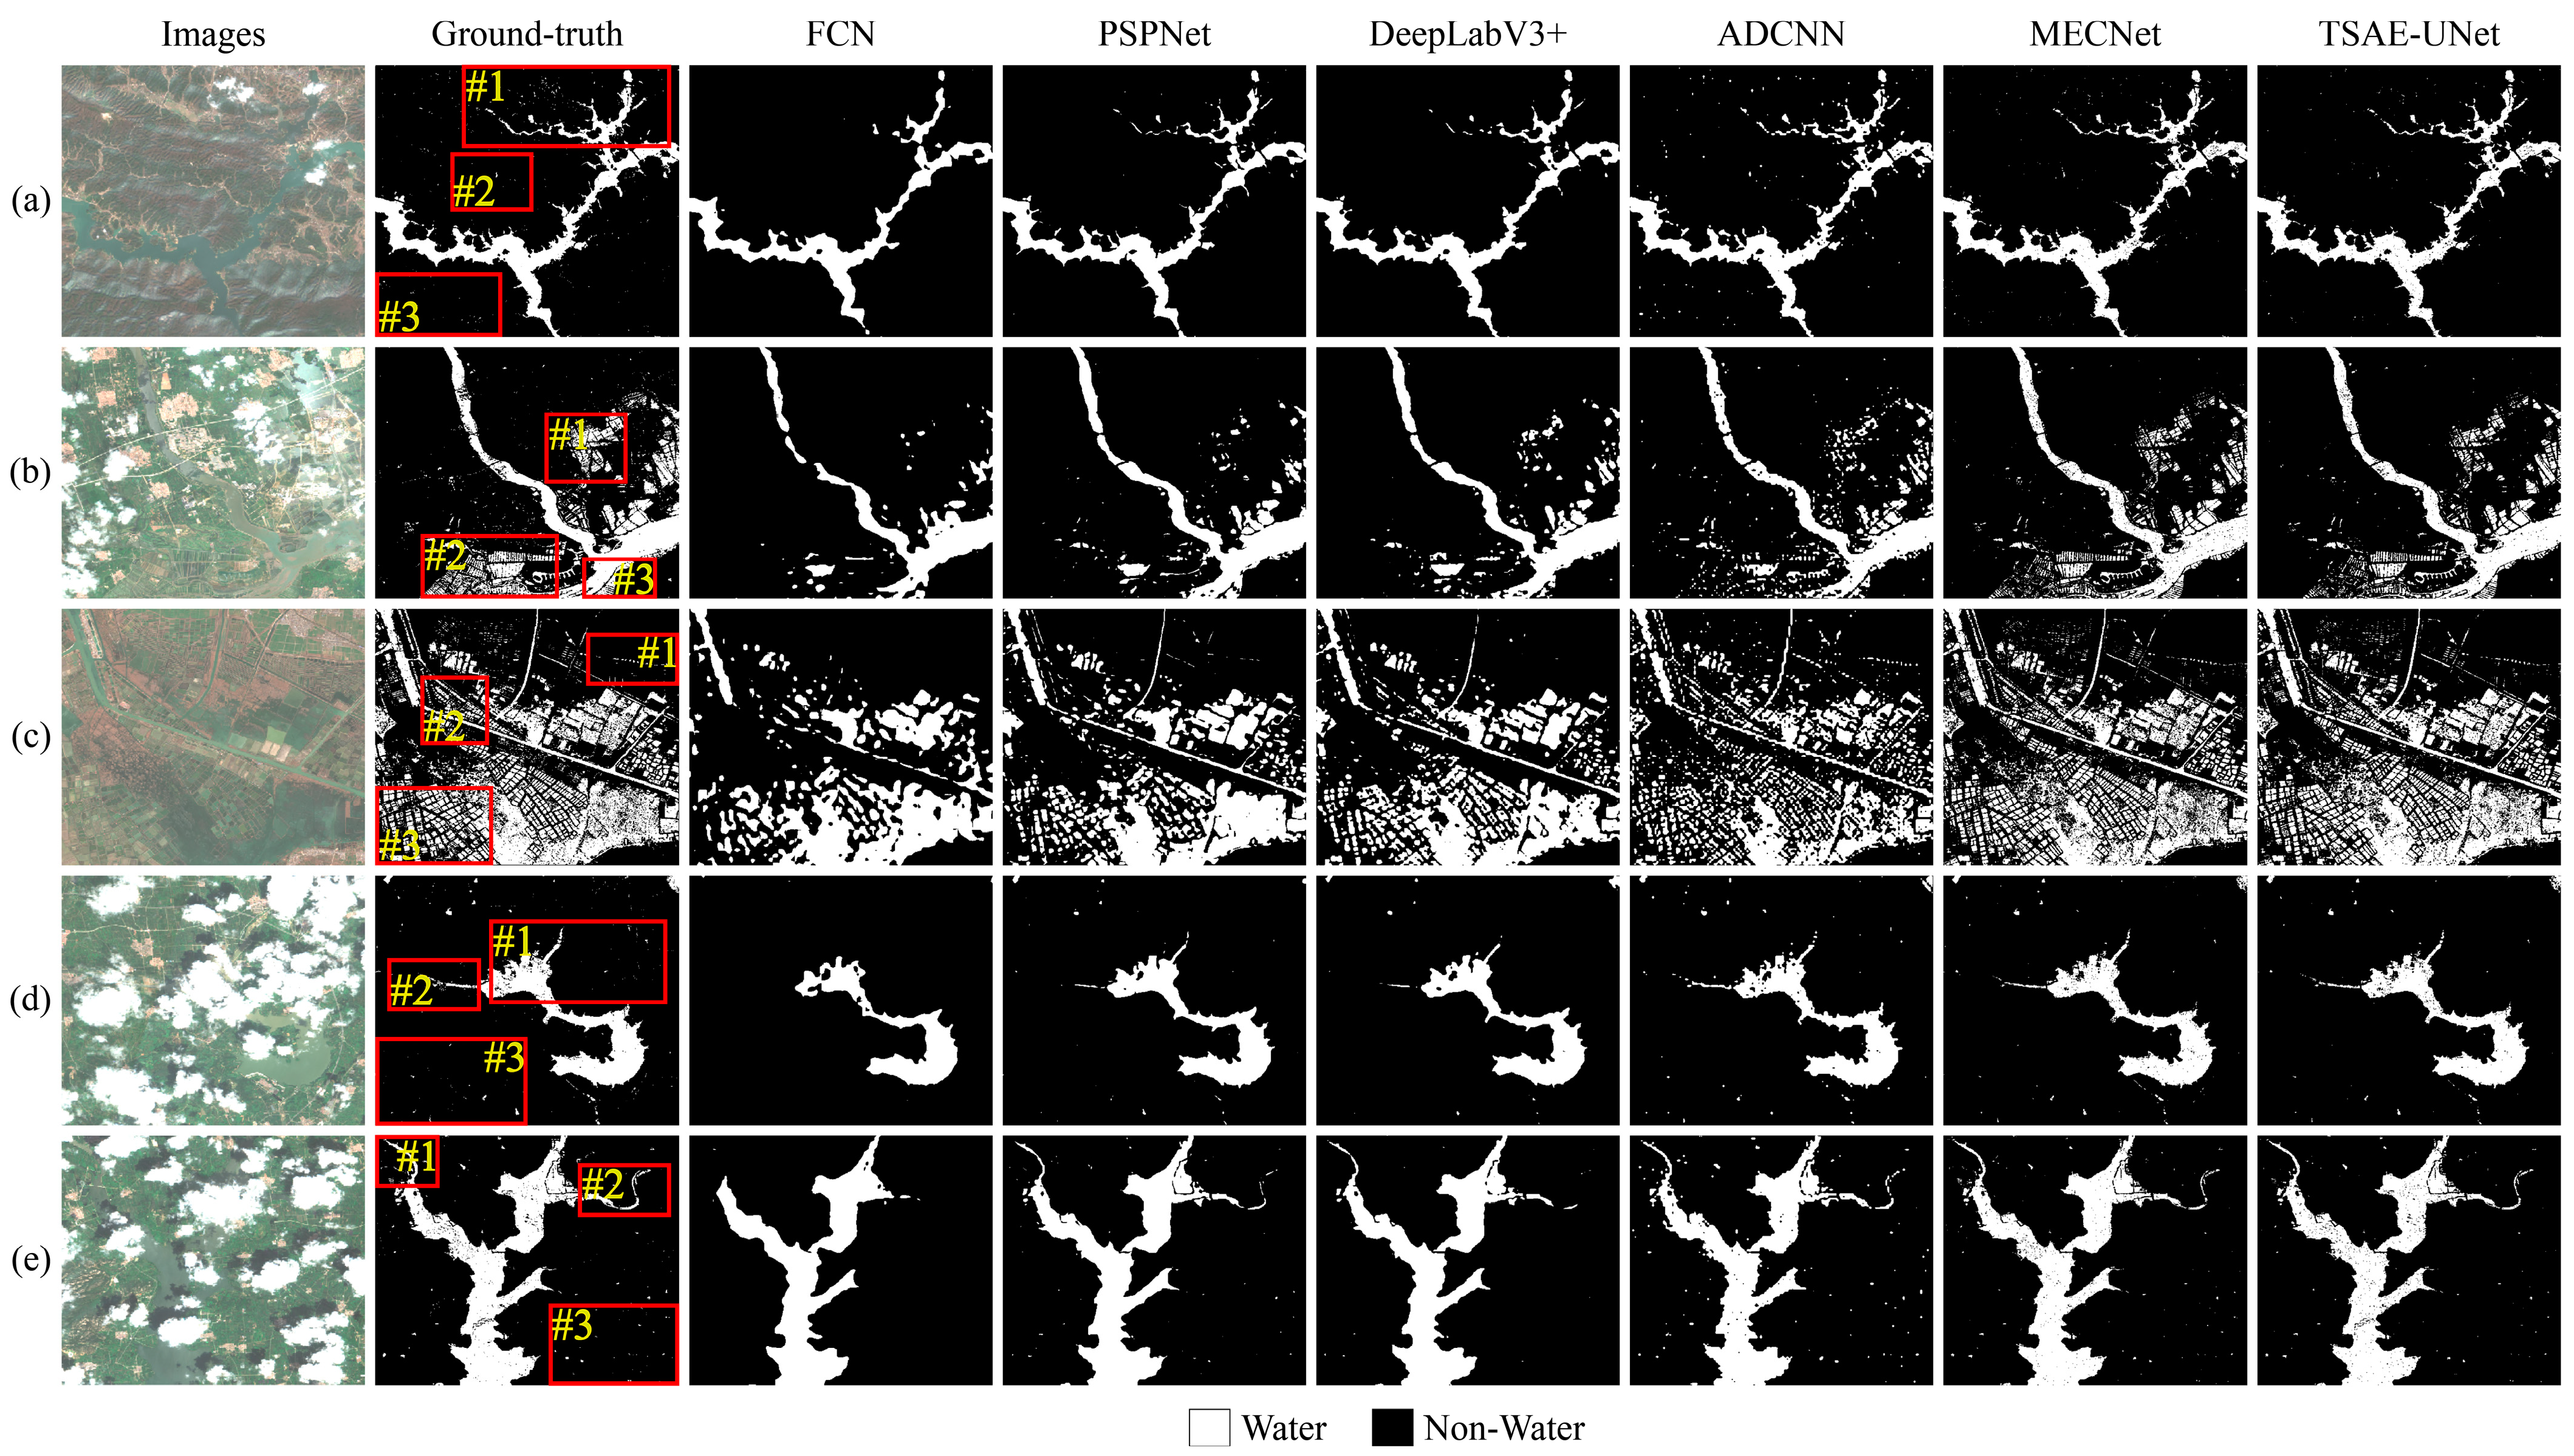
The water body detection results of the six methods are shown in Figure 8. Overall, they exhibited a high degree of consistency, but all showed varying degrees of false negatives or false positives.
As shown in Figure 8a, the water body is located between tall mountains, where the variation in the solar altitude angle significantly affected water body detection due to the presence of mountain shadows. In Region 1, FCN showed significant false negatives; in Region 2, FCN, PSPNet, and DeepLabV3+ all exhibited false negatives, while ADCNN mistakenly identified mountain shadows as water bodies, resulting in false positives; in Region 3, all methods had varying degrees of false negatives, with FCN, PSPNet, and DeepLabV3+ completely missing the water body, and ADCNN showing a high degree of false positives. In contrast, MECNet and TSAE-UNet exhibited relatively stable performance overall. In terms of the accuracy evaluation metrics (Table 3 (a)), TSAE-UNet outperformed the other five methods in all four metrics: precision (99.82%), recall (98.91%), overall accuracy (98.86%), and Kappa (0.94). Specifically, TSAE-UNet’s precision was 0.02% to 0.65% higher than FCN, PSPNet, DeepLabV3+, ADCNN, and MECNet; its recall was 0.28% to 1.41% higher than FCN, PSPNet, DeepLabV3+, and ADCNN, and only 0.06% lower than MECNet; its overall accuracy was 0.62% to 1.50% higher than FCN, PSPNet, DeepLabV3+, and ADCNN, and equal to MECNet; and its Kappa was 0.01 to 0.09 higher than FCN, PSPNet, DeepLabV3+, ADCNN, and MECNet.
As shown in Figure 8b, the selected area includes farmland, hills, and light cloud cover. In Regions 1 and 2, FCN, PSPNet, DeepLabV3+, and ADCNN all exhibited false negatives, particularly in Region 2, which is primarily a farmland area. In Region 3, all six methods exhibited false negatives. However, for MECNet and TSAE-UNet, the false negatives were relatively minor and primarily occurred in small central areas. In terms of the accuracy evaluation metrics, TSAE-UNet outperformed the other five methods in all four metrics: precision (99.17%), recall (96.01%), overall accuracy (95.88%), and Kappa (0.84). Specifically, Table 3 (b) shows that TSAE-UNet’s precision was 0.09% to 5.22% higher than FCN, PSPNet, DeepLabV3+, ADCNN, and MECNet; its recall was 2.26% to 5.08% higher; its overall accuracy was 0.22% to 4.86% higher; and its Kappa was 0.01 to 0.23 higher than these models.
As shown in Figure 8c, the selected area includes building complexes and farmland, with objects such as floating vegetation present in the water bodies. In Region 1, FCN and DeepLabV3+ completely missed the detection, while PSPNet showed partial false negatives; in Region 2, FCN, PSPNet, and DeepLabV3+ failed to detect the water body, with ADCNN and MECNet also showing false negatives; in Region 3, the segmentation accuracy of FCN, PSPNet, and DeepLabV3+ was relatively low, especially for FCN. In terms of the accuracy evaluation metrics, TSAE-UNet outperformed the other five methods in all four metrics: precision (93.43%), recall (94.16%), overall accuracy (91.49%), and Kappa (0.80). Specifically, Table 3 (c) shows that TSAE-UNet’s precision was 0.17% to 2.00% higher than FCN, PSPNet, DeepLabV3+, ADCNN, and MECNet, though it was 0.52% lower than MECNet; its recall was 1.42% to 10.19% higher; its overall accuracy was 0.72% to 9.41% higher; and its Kappa was 0.02 to 0.24 higher than these models.
As shown in Figure 8d, the selected area is largely covered by clouds, with significant surface vegetation. In Regions 1 and 2, FCN completely failed to detect the water body, PSPNet and DeepLabV3+ showed significant false negatives, ADCNN exhibited minor false negatives and false positives in Region 1, while MECNet and TSAE-UNet showed minor false negatives in Region 2. In terms of the accuracy evaluation metrics (Table 3 (d)), TSAE-UNet outperformed the other five methods in all four metrics: precision (99.84%), recall (99.13%), overall accuracy (99.05%), and Kappa (0.94). Specifically, TSAE-UNet’s precision was 0.03% to 0.40% higher than FCN, PSPNet, DeepLabV3+, ADCNN, and MECNet; its recall was 0.06% to 1.43% higher; its overall accuracy was 0.13% to 1.37% higher; and its Kappa was 0.01 to 0.11 higher than these models.
As shown in Figure 8e, Region 1 is heavily covered by clouds, where FCN exhibited severe false negatives; in Regions 2 and 3, both FCN and DeepLabV3+ showed significant false negatives, PSPNet and MECNet lacked handling of the details, and ADCNN showed large areas of false positives for water bodies, while TSAE-UNet maintained stable overall performance. In terms of the accuracy evaluation metrics (Table 3 (e)), TSAE-UNet outperformed the other five methods in all four metrics: precision (99.60%), recall (99.05%), overall accuracy (98.86%), and Kappa (0.96). Specifically, TSAE-UNet’s precision was 0.24% to 1.01% higher than FCN, PSPNet, DeepLabV3+, ADCNN, and MECNet; its recall was 0.14% to 1.51% higher; its overall accuracy was 0.07% to 1.69% higher; and its Kappa was 0.01 to 0.07 higher than these models.
In summary, TSAE-UNet demonstrated higher detection accuracy and stability across different scenarios, followed closely by MECNet. ADCNN, PSPNet, and DeepLabV3+, which performed moderately, while FCN showed relatively poor performance.

4. Multi-Temporal Water Body Detection Experiment

4.1. Overview of the Study Area for Experiment 2

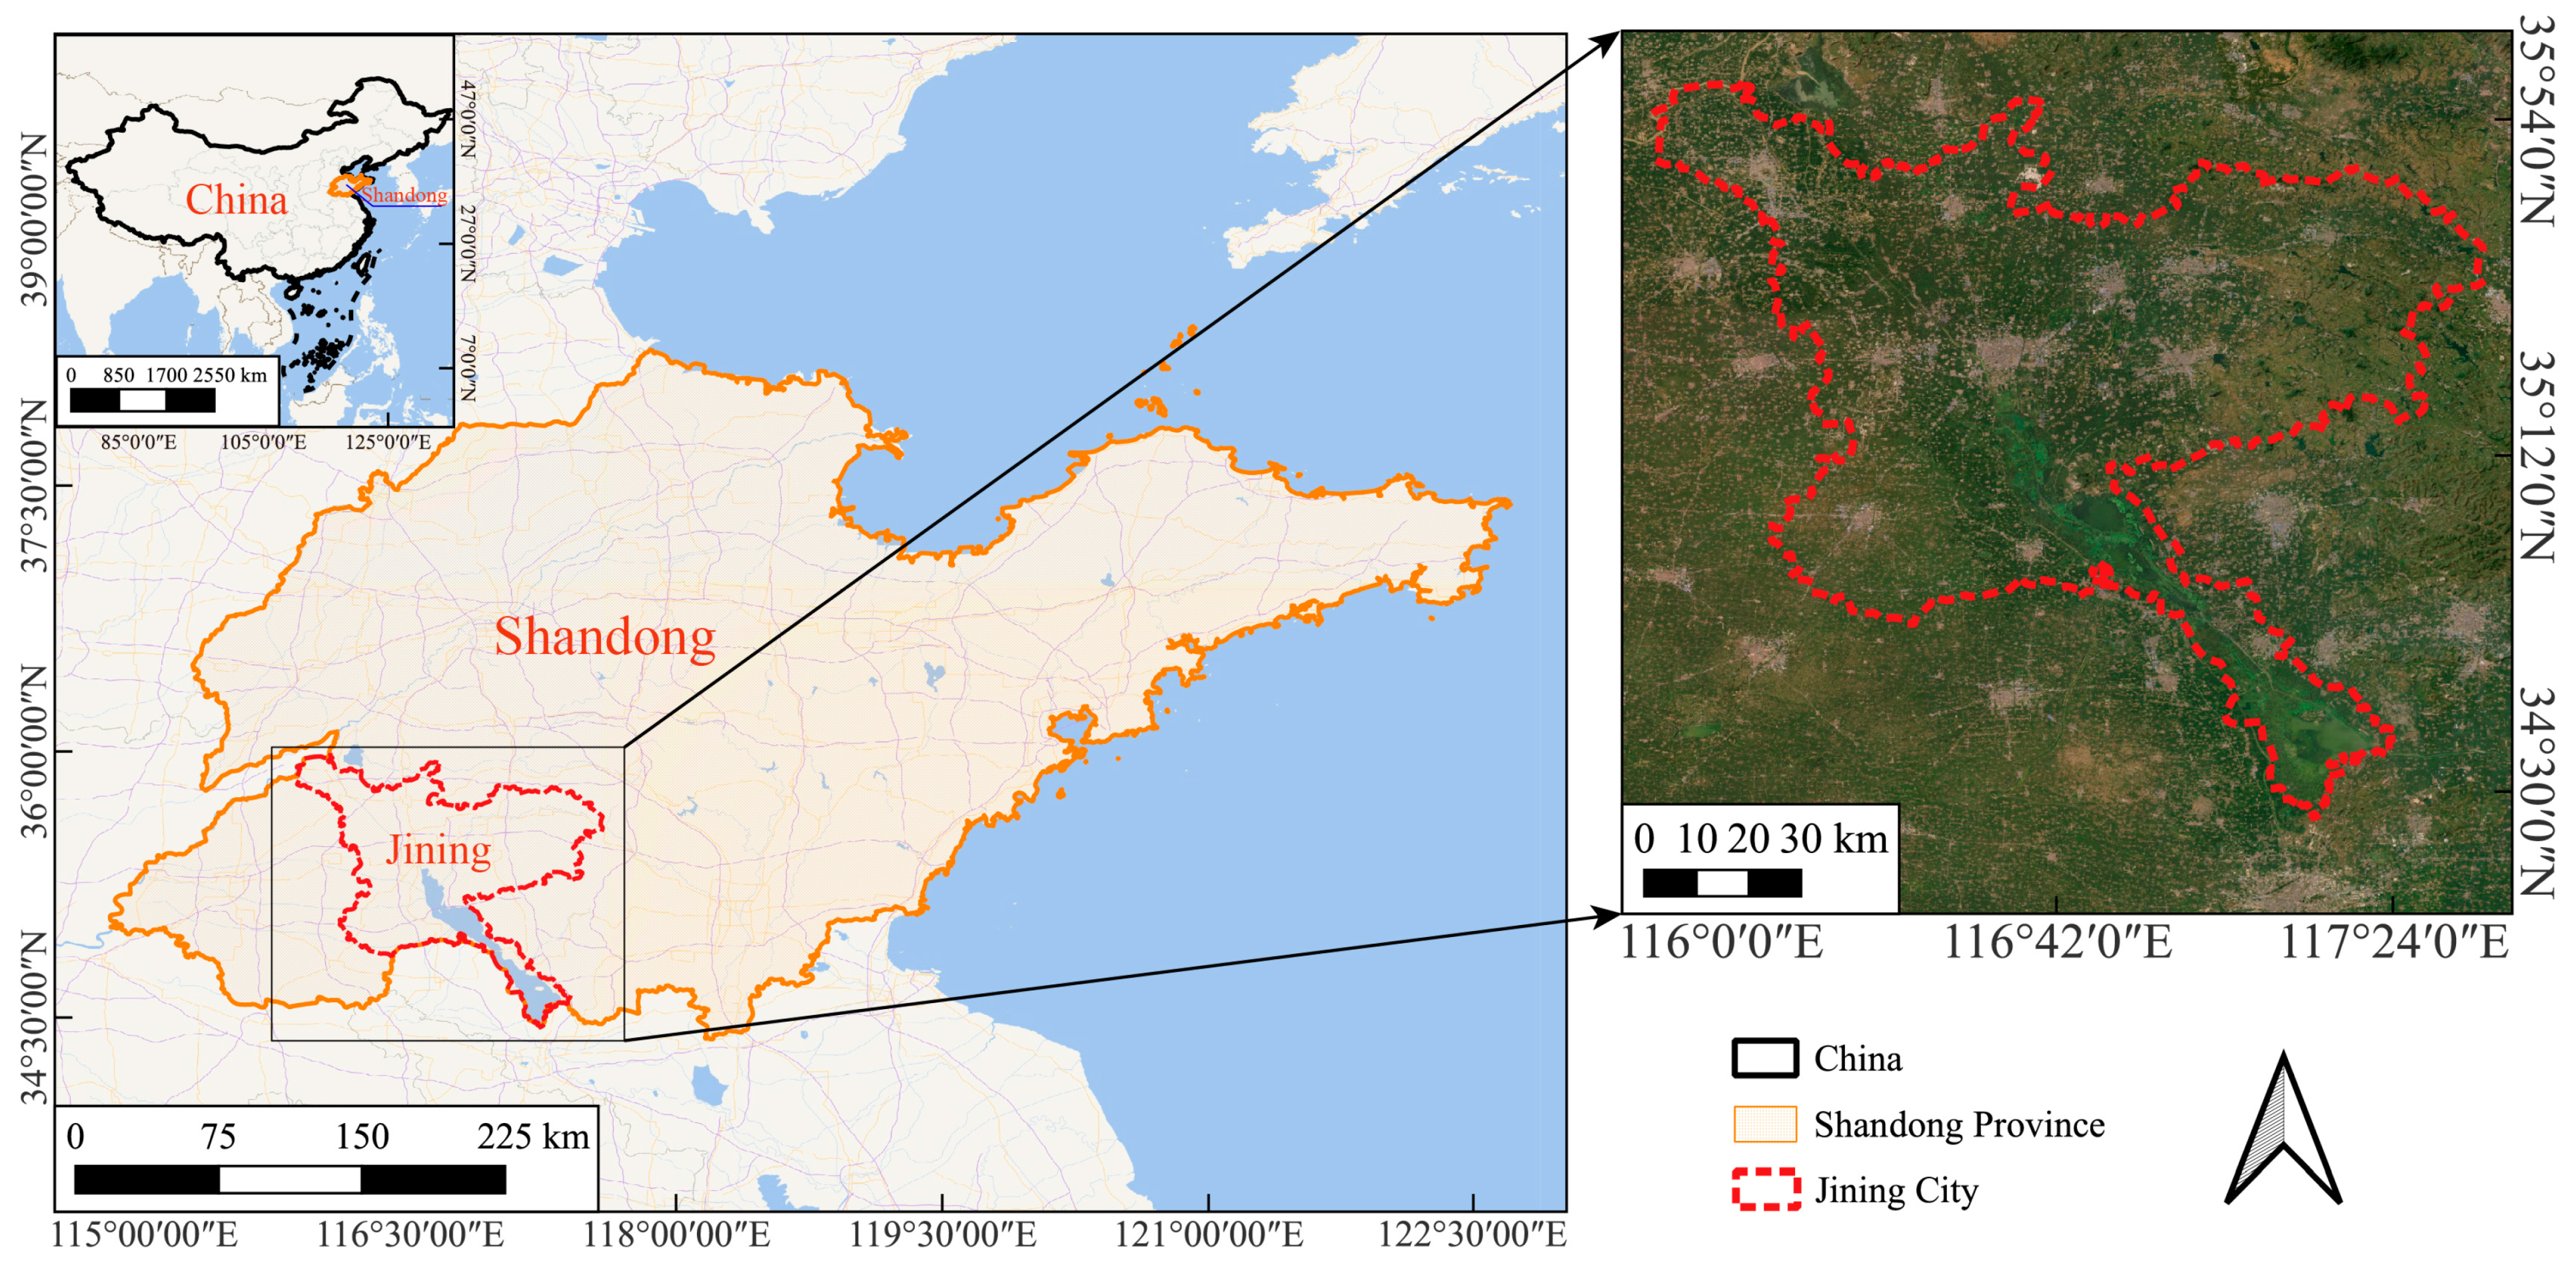
In this section, Jining City, Shandong Province, China, was selected as the study area (Figure 9) for conducting a multi-temporal water body detection experiment. Jining City is located in the Nansi Lake basin and features a typical northern lake and wetland ecosystem. In this experiment, the changes in water bodies in Jining City across different seasons and years were analyzed to evaluate the application of the TSAE-UNet model in long-term time series analysis, thereby validating its stability and accuracy in complex scenarios.

4.2. Data Used for Experiment 2

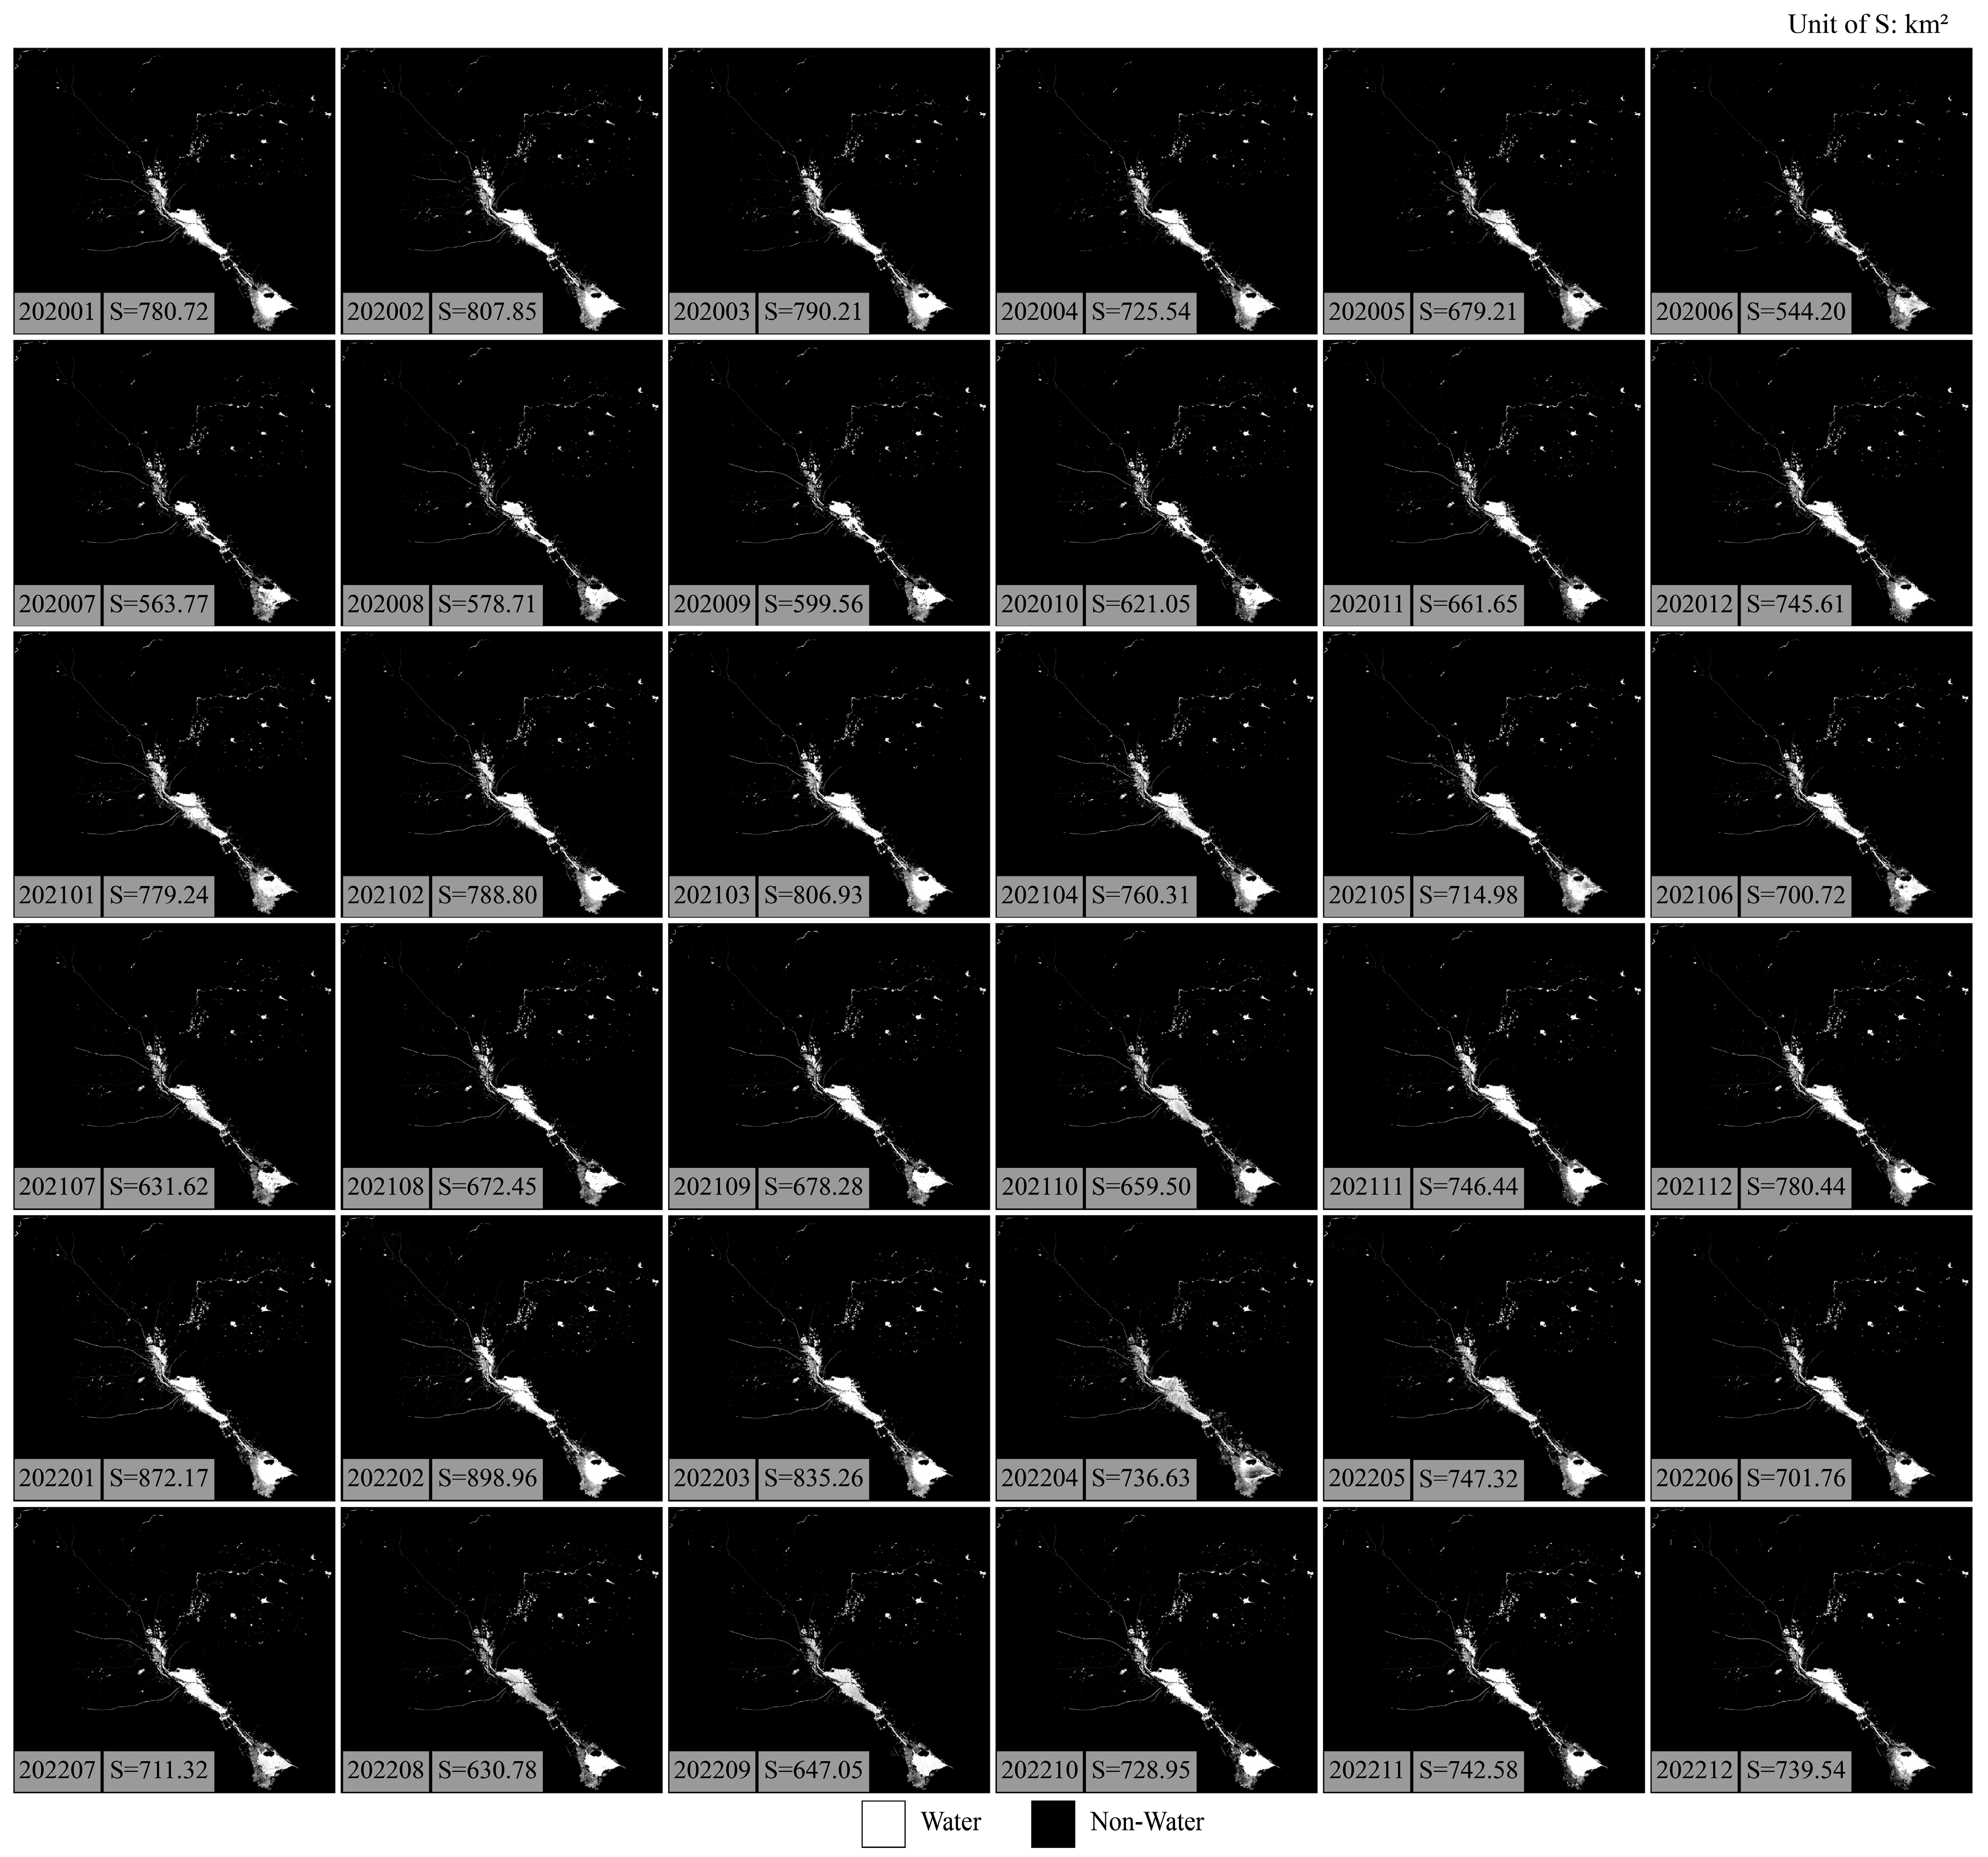
Sentinel-1A and Sentinel-2 data covering Jining City from 2020 to 2022 were selected, with the MNDWI and E-MNDWI calculated monthly, along with the corresponding VV and VH data. Covering the entire area of Jining City requires four scenes of Sentinel-2 imagery and two scenes of Sentinel-1A imagery. For this experiment, in total, 48 scenes of Sentinel-2 imagery and 24 scenes of Sentinel-1A VV and VH data were needed.

4.3. Results and Analysis for Experiment 2

In this section, large-scale and long-term water body detection was conducted for Jining City. First, the monthly water bodies in Jining City from 2020 to 2022 were detected, and the results were compared with those of five other methods (FCN, PSPNet, DeepLabV3+, ADCNN, and MECNet). Second, a detailed analysis of the water body detection results for each quarter of 2022 in Jining City was performed, and these results were compared with the other five methods, with an accuracy evaluation conducted using a confusion matrix.

4.3.1. Monthly Water Body Detection Results

Figure 10 shows the results of monthly water body detection using the TSAE-UNet model and presents the statistical changes in the water body area. Overall, the water body area in lakes and large rivers remained relatively stable, while smaller water bodies showed significant variations in area due to seasonal influences.
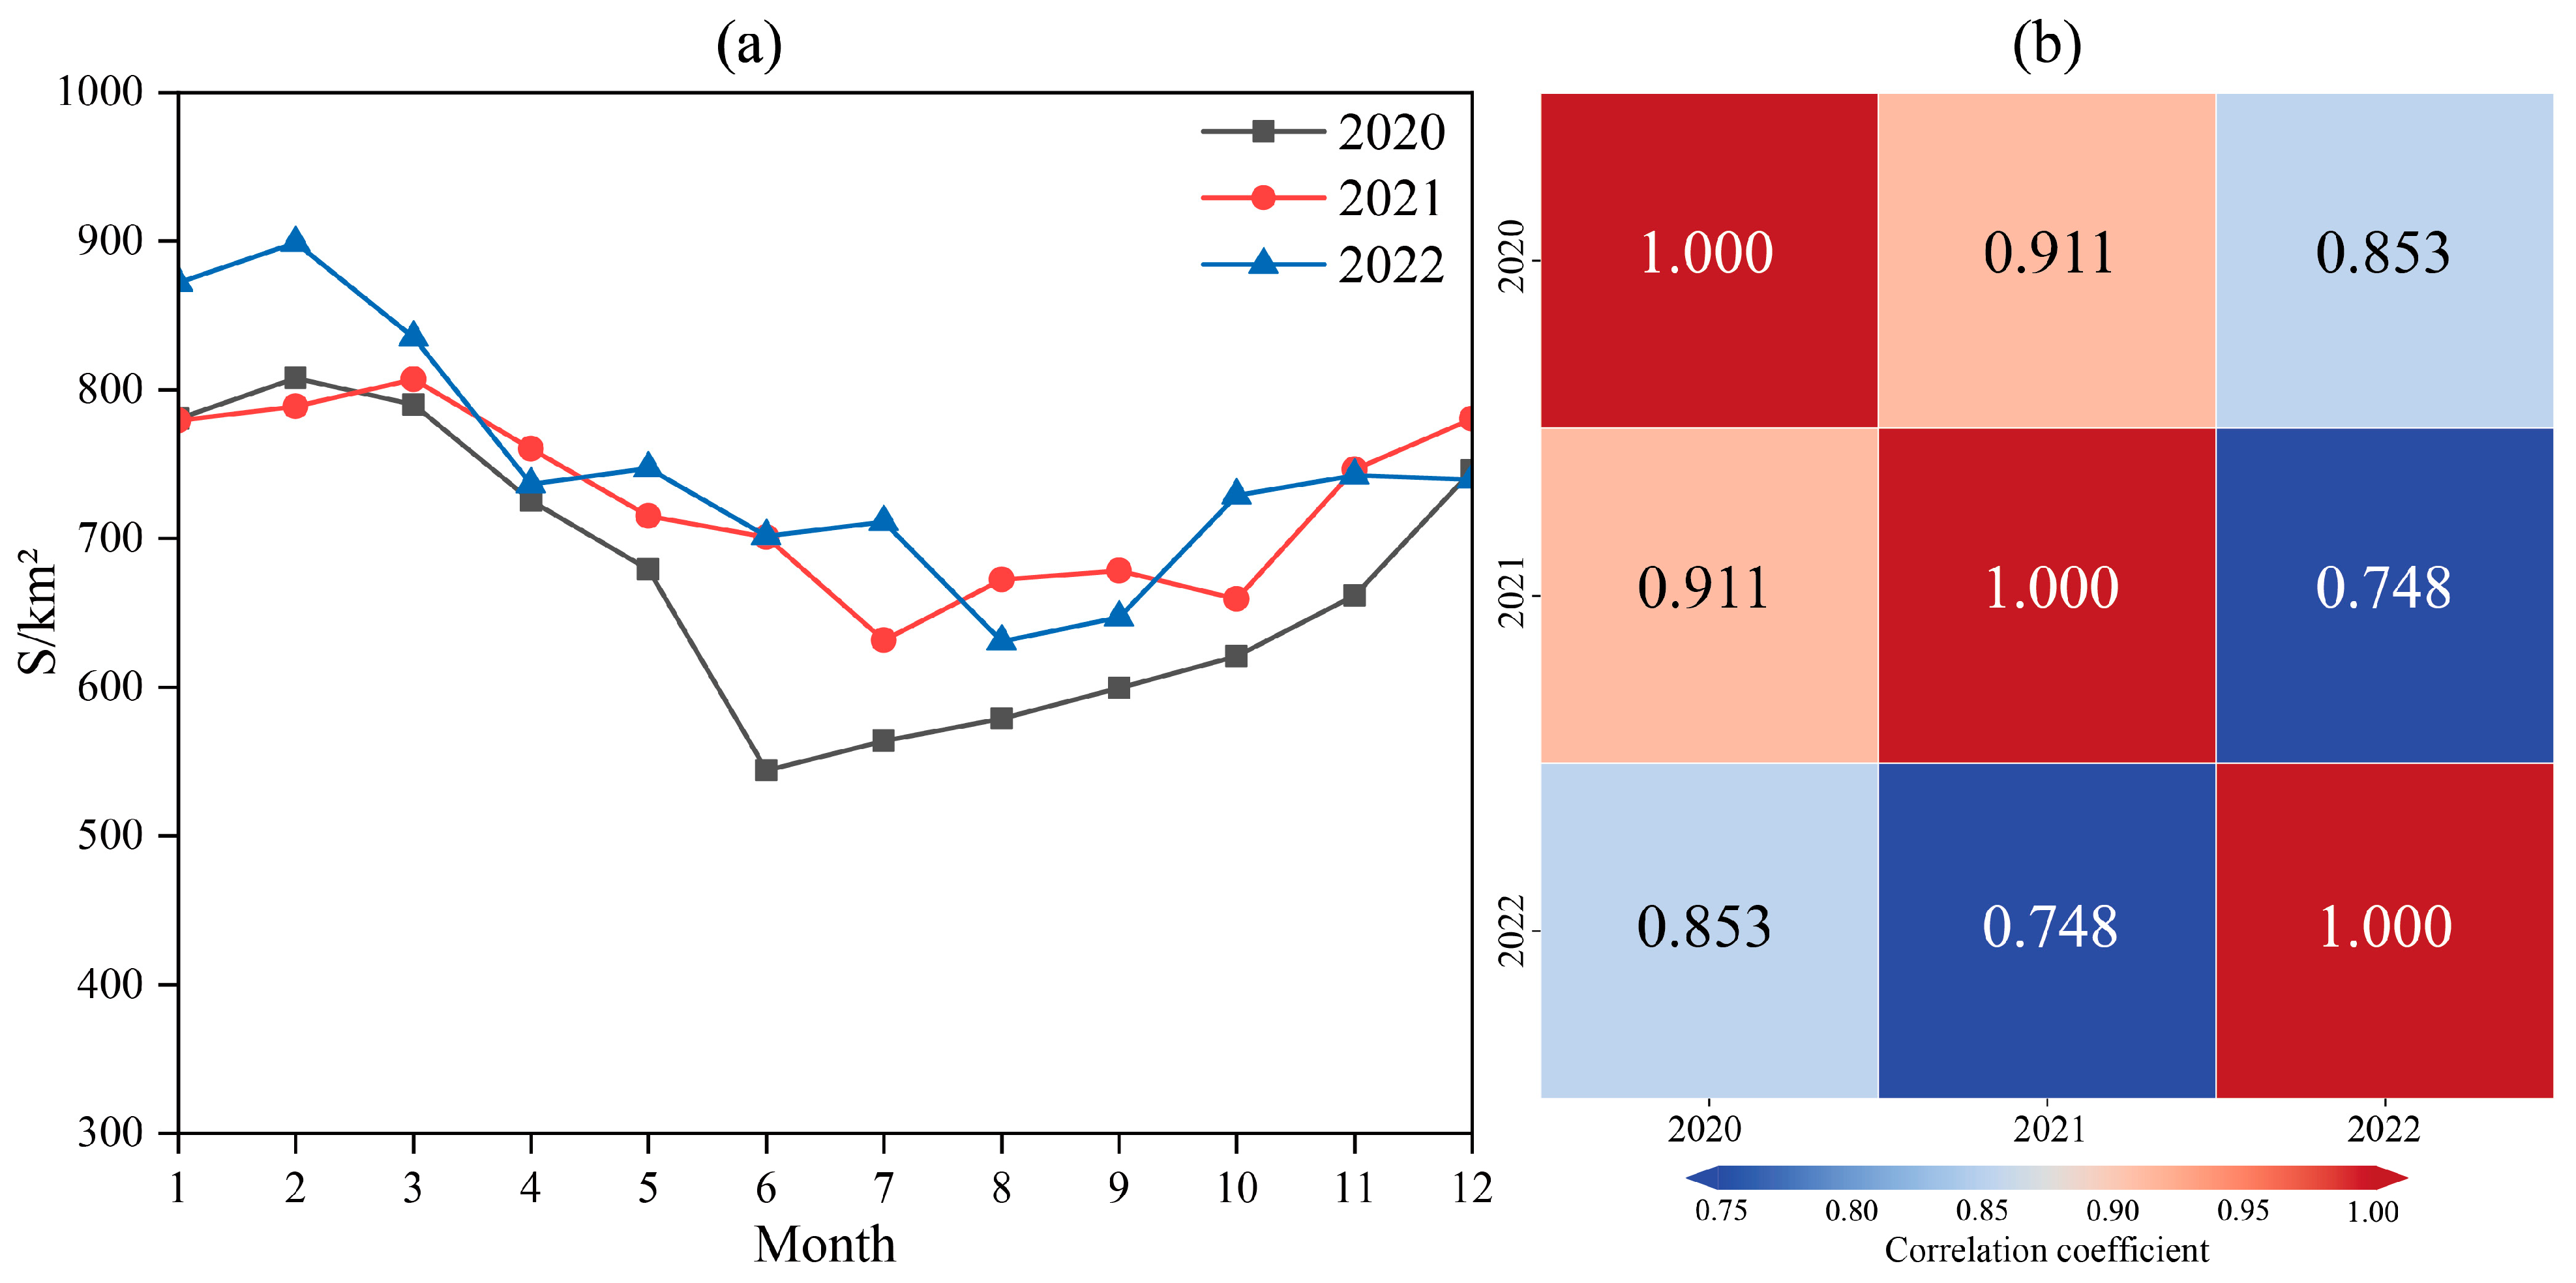
To further validate the accuracy of the TSAE-UNet model’s detection, this study plotted the curves of monthly water body area (S) variation for 2020, 2021, and 2022, as shown in Figure 11a. It can be observed that the water body variation curves over the three years were highly consistent, indicating that the TSAE-UNet model demonstrated good consistency across different years. Figure 11b presents the correlation analysis of changes in water body area over the three years. Specifically, the correlation coefficient between 2020 and 2021 was as high as 0.911; between 2020 and 2022, it was 0.852; and between 2021 and 2022, it was 0.749.
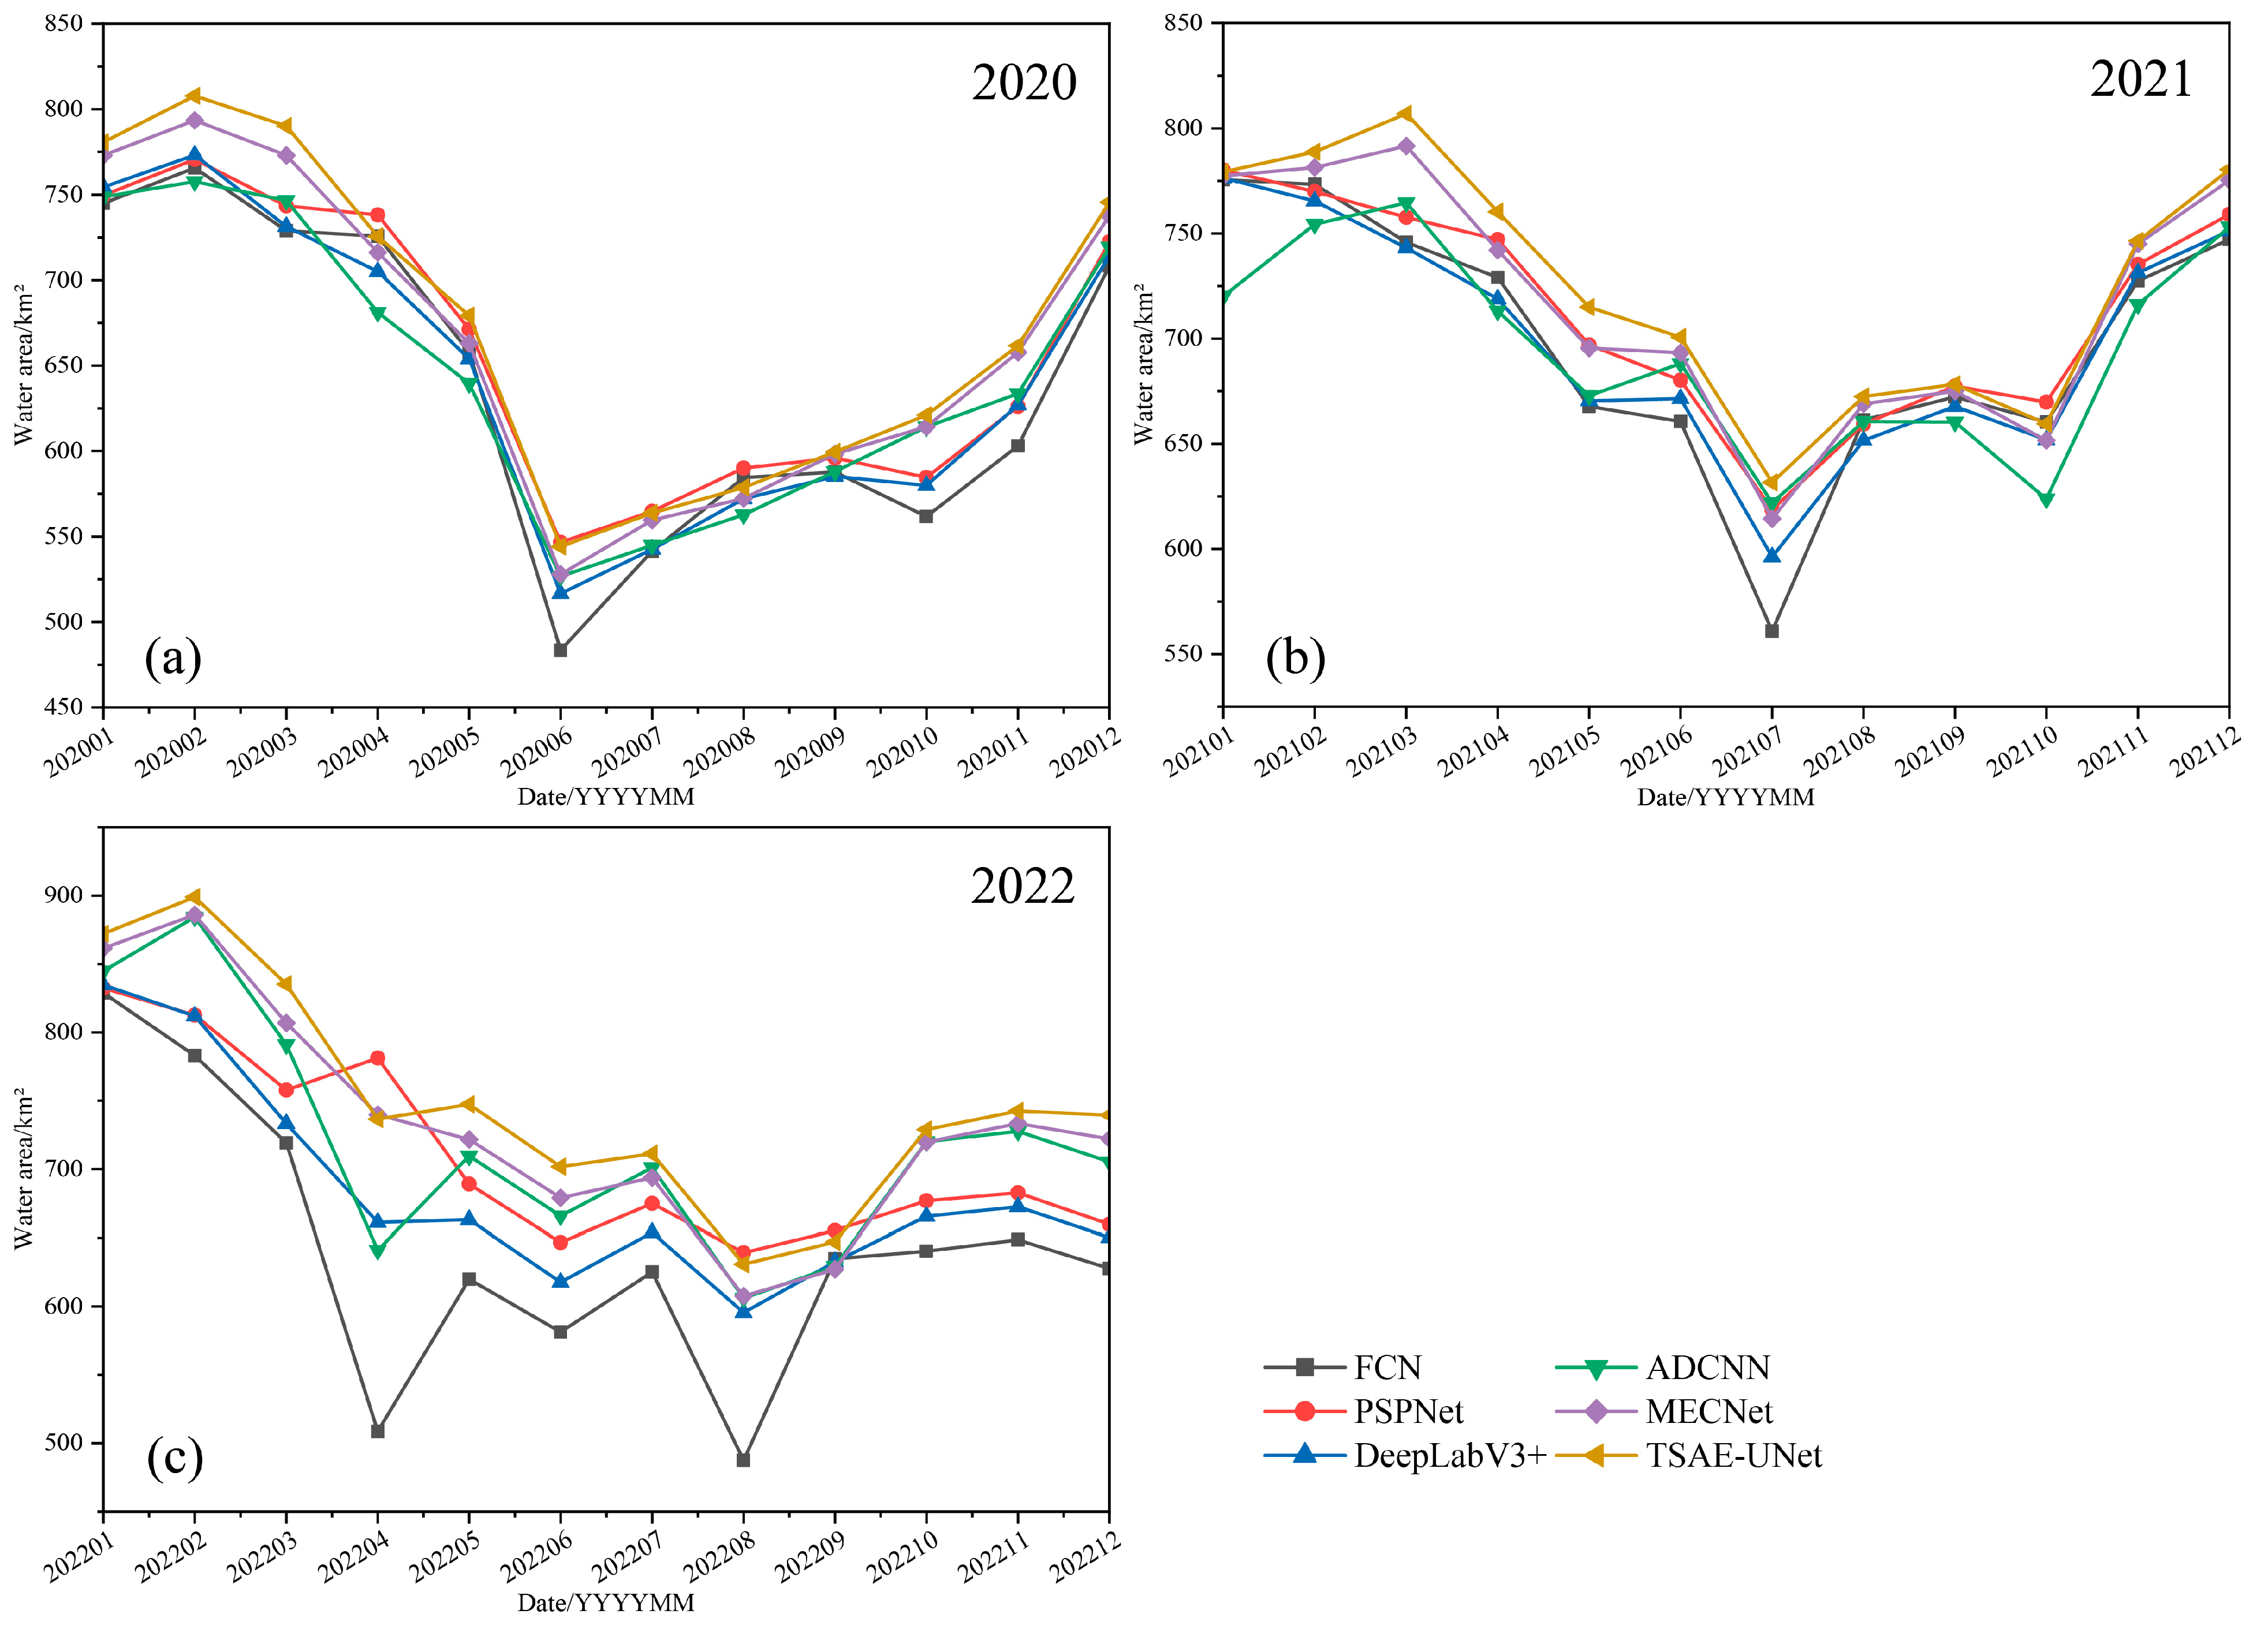
To comprehensively evaluate the performance of the TSAE-UNet model, the monthly water body area detection results for 2020, 2021, and 2022 were compared with the results of five other methods, and annual line charts were plotted, as shown in Figure 12. In the charts of water body area variation trends for 2020, 2021, and 2022, the detection results of all methods showed a high degree of consistency in the overall trend. This indicated that all methods were able to capture roughly the same patterns of change in macro-level variations in water body area.
Specifically, in the chart of variations in water body area for 2020 (Figure 12a), FCN showed significant fluctuations in the summer months (June and July), which may have been due to detection errors caused by large changes in the water body area. PSPNet and DeepLabV3+ exhibited good consistency in most months but showed some deviation in December. The detection results of ADCNN and MECNet were stable throughout the year. In contrast, TSAE-UNet demonstrated high stability and accuracy across the entire year, accurately capturing the monthly changes in water body area. In the chart of variations in water body area for 2021 (Figure 12b), FCN showed significant fluctuations in the winter months (January and December), indicating that its detection performance was affected under conditions of low temperature and snow cover. PSPNet and DeepLabV3+ showed stable detection results in most months but exhibited some deviation in April and May. ADCNN showed stable performance in most months but exhibited slight fluctuations in July and August. MECNet performed well in most months. TSAE-UNet demonstrated excellent performance throughout the year, maintaining high detection accuracy even under summer and winter conditions. In the chart of variations in water body area for 2022 (Figure 12c), FCN showed significant fluctuations in the spring months (March and April), possibly due to changes in the water body area caused by snowmelt in the spring. PSPNet and DeepLabV3+ exhibited a generally consistent trend in most months but showed some deviation in December. The detection results of ADCNN and MECNet were stable in most months. In contrast, TSAE-UNet demonstrated higher stability and accuracy throughout the entire year.
To further quantify the consistency of the detection results among the different methods, the correlation coefficients of water body areas for 2020, 2021, and 2022 were calculated for each method (Table 4). In the absence of major geological disasters and extreme weather events, it can be assumed that the trends in water body variation in the same area are generally consistent from year to year. The correlation coefficient measures the linear relationship between two variables, reflecting the degree of consistency among different methods in detecting changes in water body area. The correlation coefficients of changes in water body area between different years using TSAE-UNet were higher than those of other methods. The correlation coefficient between 2020 and 2021 using TSAE-UNet was 0.911, which was 0.024 to 0.100 higher than that of FCN, PSPNet, DeepLabV3+, ADCNN, and MECNet. For the correlation coefficient between 2020 and 2022, TSAE-UNet achieved 0.852, which was 0.004 to 0.341 higher than that of the other methods. For the correlation coefficient between 2021 and 2022, TSAE-UNet had 0.749, 0.015 to 0.227 higher than that of FCN, PSPNet, DeepLabV3+, ADCNN, and MECNet.
The analysis above shows that the TSAE-UNet model exhibited higher stability and accuracy in multi-temporal water body detection tasks. In particular, it achieved the highest correlation between detection results across different years, especially in terms of seasonal and interannual variations. In contrast, other methods exhibited certain fluctuations and errors in some months and conditions. This indicates that TSAE-UNet has better robustness and adaptability in diverse environments, allowing it to more accurately reflect the seasonal and interannual variations in water body area.

4.3.2. Seasonal Water Body Detection Results for 2022

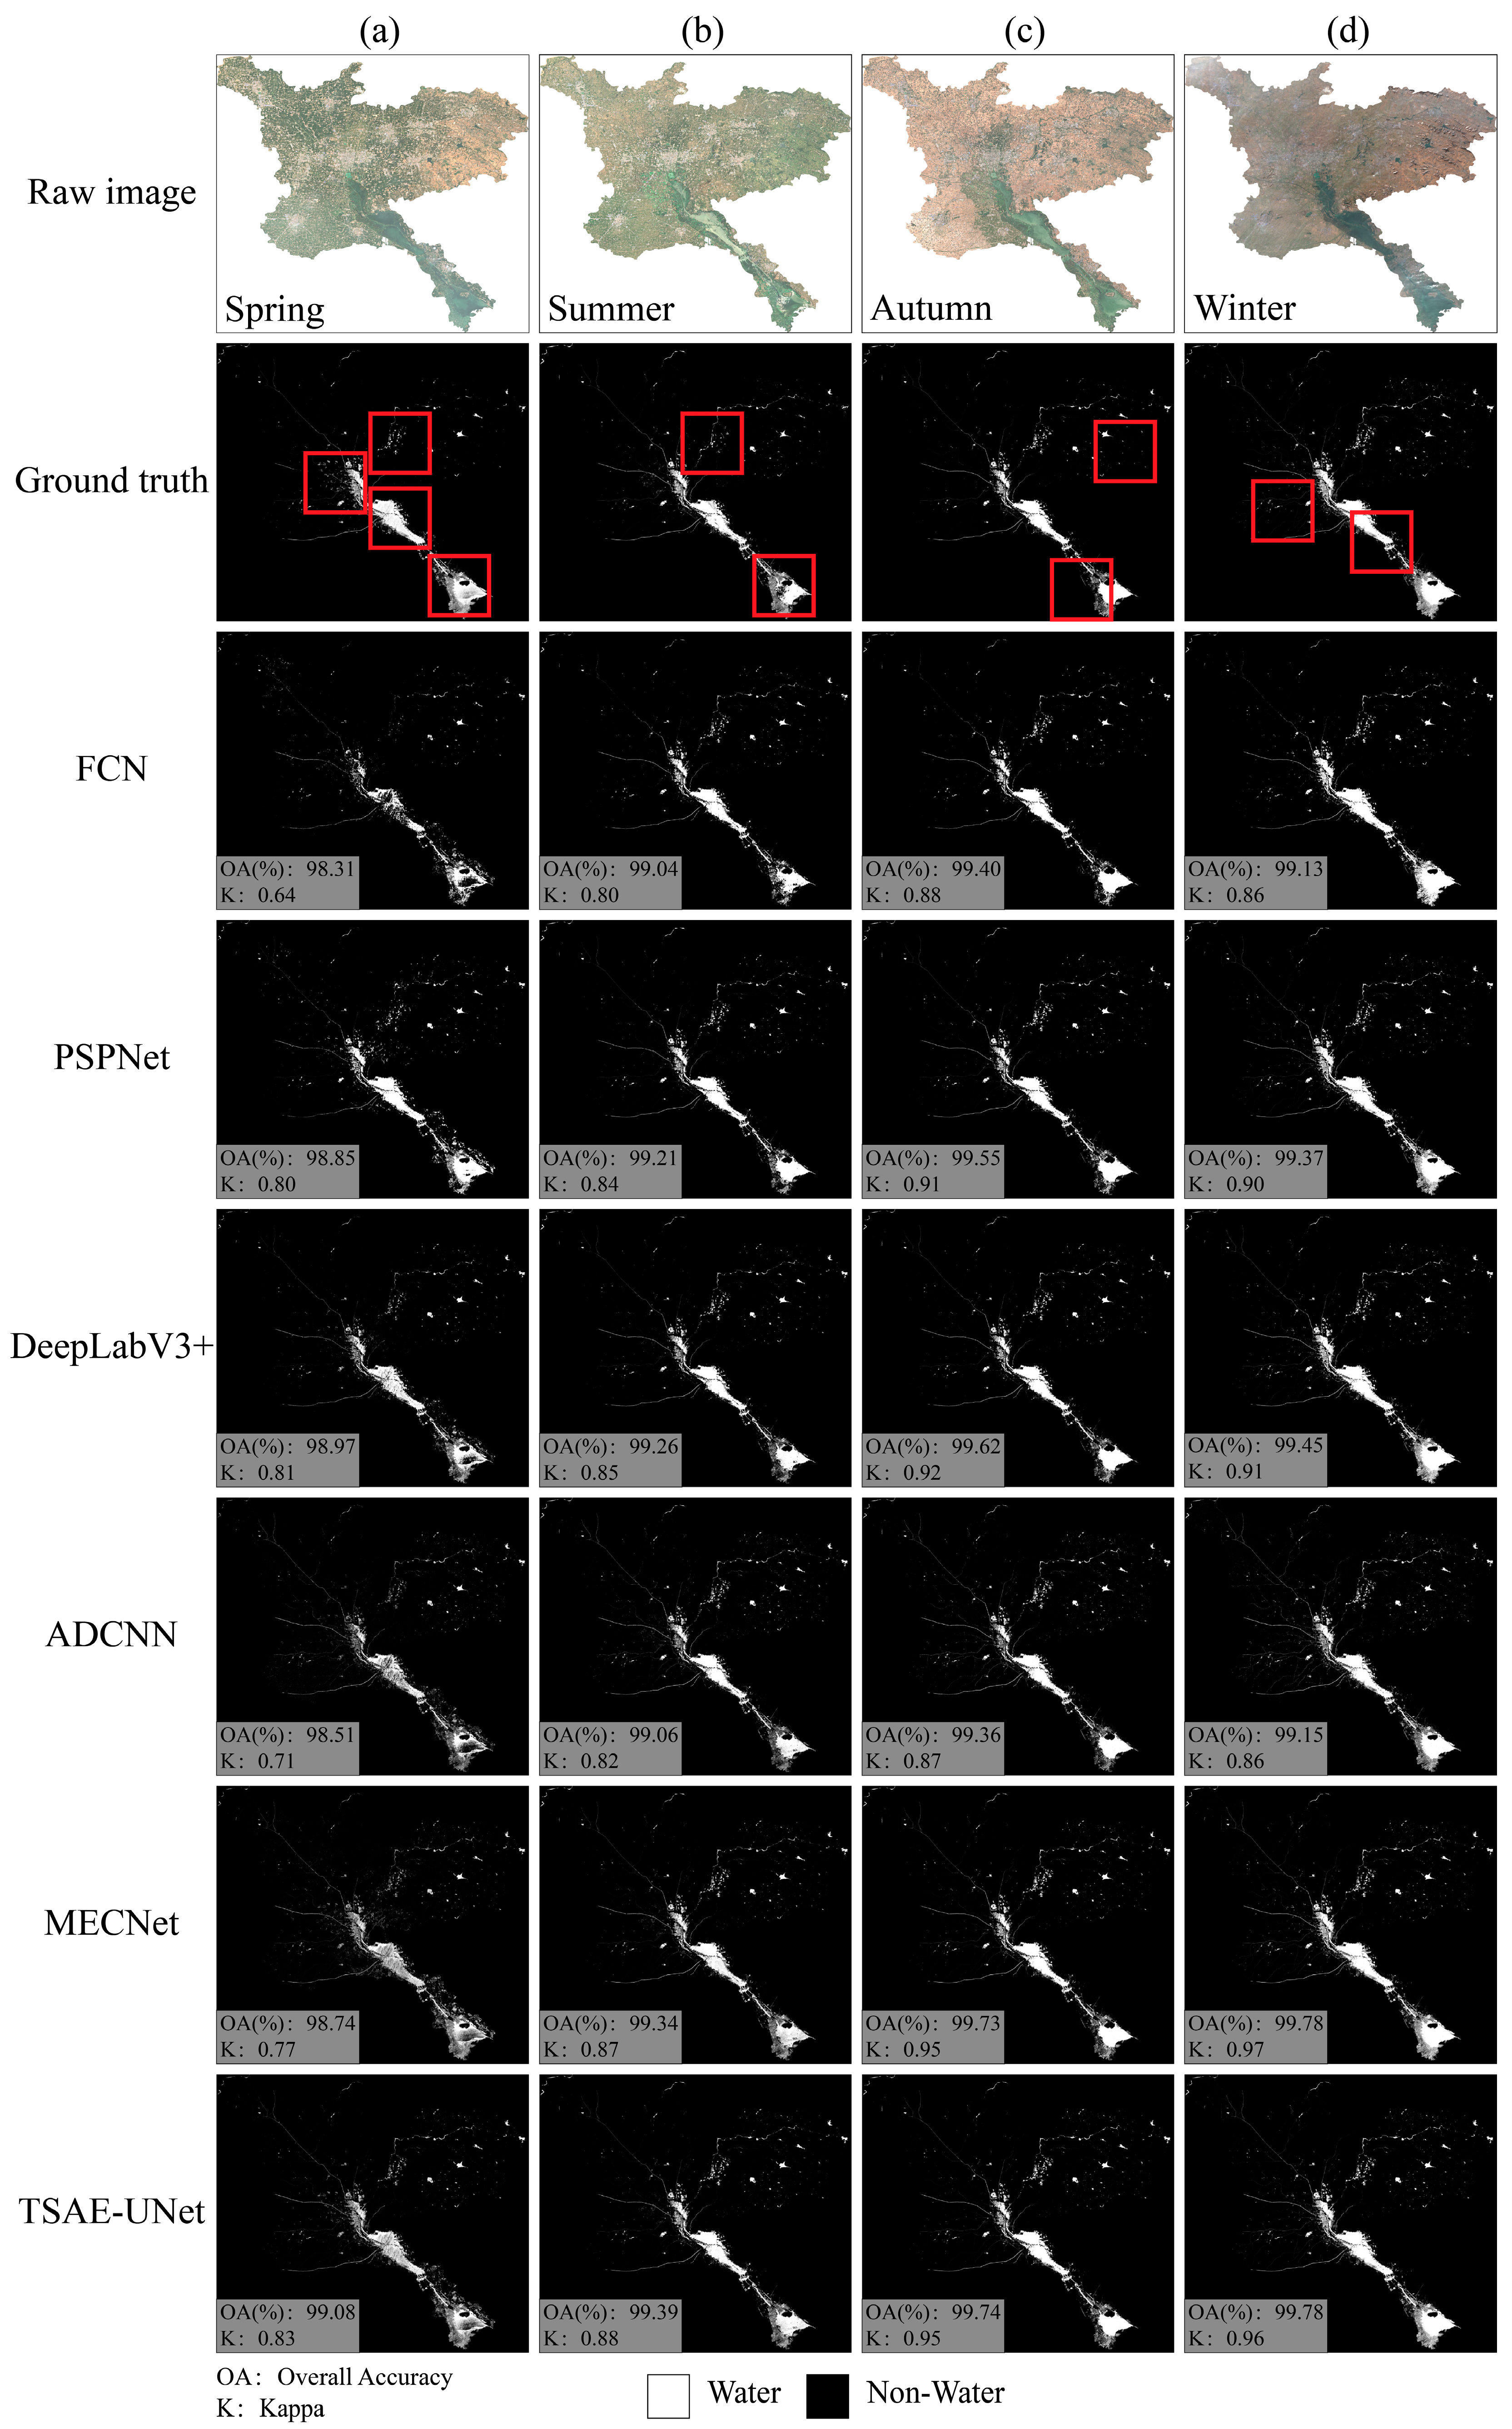
In this section, we present the results of water body detection in Jining City for the four quarters of 2022 using TSAE-UNet and five other methods (FCN, PSPNet, DeepLabV3+, ADCNN, and MECNet). Additionally, accuracy evaluation was performed for each quarter using a confusion matrix for all six methods.
In the first quarter of 2022 (as shown in Figure 13a), the water body detection results from all six methods indicate that each method could effectively identify the major water bodies in Jining City. FCN exhibited significant false negatives in some areas, while PSPNet and DeepLabV3+ showed slightly insufficient detail handling. ADCNN’s detection results showed some false positives. MECNet performed well in most areas but was slightly less effective in some complex terrains. Overall, TSAE-UNet’s detection results were relatively comprehensive, with fewer false positives and false negatives. Its overall accuracy reached 99.08%, with a Kappa value of 0.83, as detailed in Table 5.
In the second quarter of 2022 (as shown in Figure 13b), the detection results indicate that the water body area detected by TSAE-UNet was more consistent with the actual data. FCN and DeepLabV3+ exhibited higher false positive rates in the detection of smaller water bodies, while PSPNet and ADCNN showed some false negatives in certain areas during detection. MECNet’s detection results were good, but there were some shortcomings in handling certain boundary areas. In contrast, TSAE-UNet showed higher consistency and accuracy in most areas, with an overall accuracy of 99.39% and a Kappa value of 0.88, as detailed in Table 6.
In the third quarter of 2022 (as shown in Figure 13c), FCN, PSPNet, and DeepLabV3+ performed poorly in detecting small water bodies, with a high number of false positives. In farmland areas, all six methods showed deficiencies in handling the boundary regions between water and non-water areas. However, TSAE-UNet and MECNet were better at distinguishing between water bodies and other land cover types, exhibiting relatively stable overall performance. TSAE-UNet achieved an overall accuracy of 99.74% and a Kappa value of 0.95, as detailed in Table 7.
In the fourth quarter of 2022 (as shown in Figure 13d), the overall water body detection results of all methods were generally good, but there were some shortcomings in handling the details. TSAE-UNet handled the details relatively well, achieving an overall accuracy of 99.78% and a Kappa value of 0.96, as detailed in Table 8.

5. Discussion

5.1. Analysis of the Applicability and Limitations of the TSAE-UNet Model

The TSAE-UNet model demonstrated strong applicability in multi-scene and multi-temporal water body detection tasks. By integrating ConvLSTM layers and attention mechanisms, the model effectively captured and leveraged the dynamic changes in water bodies in the spatiotemporal dimensions, making it adaptable to various environmental conditions. This was particularly evident in areas where water bodies’ boundaries changed significantly over time. This design allowed the model to maintain high detection accuracy even when processing large-scale medium-resolution remote sensing data, highlighting its practical utility.
However, TSAE-UNet also has some limitations. First, since medium-resolution data (e.g., Sentinel-1A and Sentinel-2) were used, the model may struggle to accurately identify smaller or narrower water bodies due to insufficient image resolution. Additionally, in complex terrain or scenes with diverse land cover, the model’s performance may be somewhat affected, primarily due to the resolution limitations of the input data, which restrict the model’s ability to handle fine-grained features. To overcome these limitations, future work will involve incorporating high-resolution remote sensing data and applying multi-resolution data fusion strategies, aiming to enable the model to capture details more accurately in complex scenarios.

5.2. Global Application Potential and Key Challenges of the TSAE-UNet Model

Although the TSAE-UNet model designed in this study has so far only been tested on water body detection experiments in typical regions of China, yielding promising results, its architectural design provides a solid foundation for global water body detection tasks. The integration of spatiotemporal feature extraction and attention mechanisms gives this model the potential for broader application worldwide. However, the significant geographical and climatic differences across the globe present a challenge. The current model was primarily trained on data from China, which may limit its generalization capability in regions with vastly different climate and terrain characteristics, such as tropical rainforests, deserts, or polar areas. In these regions, the model may not fully adapt to the varying environmental conditions, potentially affecting the accuracy of water body detection.
Additionally, obtaining Sentinel satellite data of sufficient quality may be challenging in certain special regions. For example, in polar areas or tropical regions with persistent cloud cover, acquiring Sentinel data can be difficult, directly limiting the scope of application of the TSAE-UNet model. If high-quality remote sensing data cannot be obtained, the model’s detection performance will be significantly affected, posing a practical challenge to its global applicability.
Addressing the key challenges of dataset expansion and data acquisition in specific regions would give the TSAE-UNet model the potential to play a more extensive and significant role in global water body detection and environmental monitoring.
In addition, when applying the TSAE-UNet model to larger areas, several strategies can be considered to improve efficiency and scalability. These include parallelization and optimization of the model to enhance computational efficiency, a multi-resolution approach to process large and small areas with varying levels of detail, and incremental learning with region-based processing, allowing the model to adapt to diverse geographical conditions without the need for complete retraining. Implementing these strategies would enable a more effective application of the model to large-scale water body detection tasks across different regions.

5.3. Impact of Environmental Factors on Water Body Detection Results

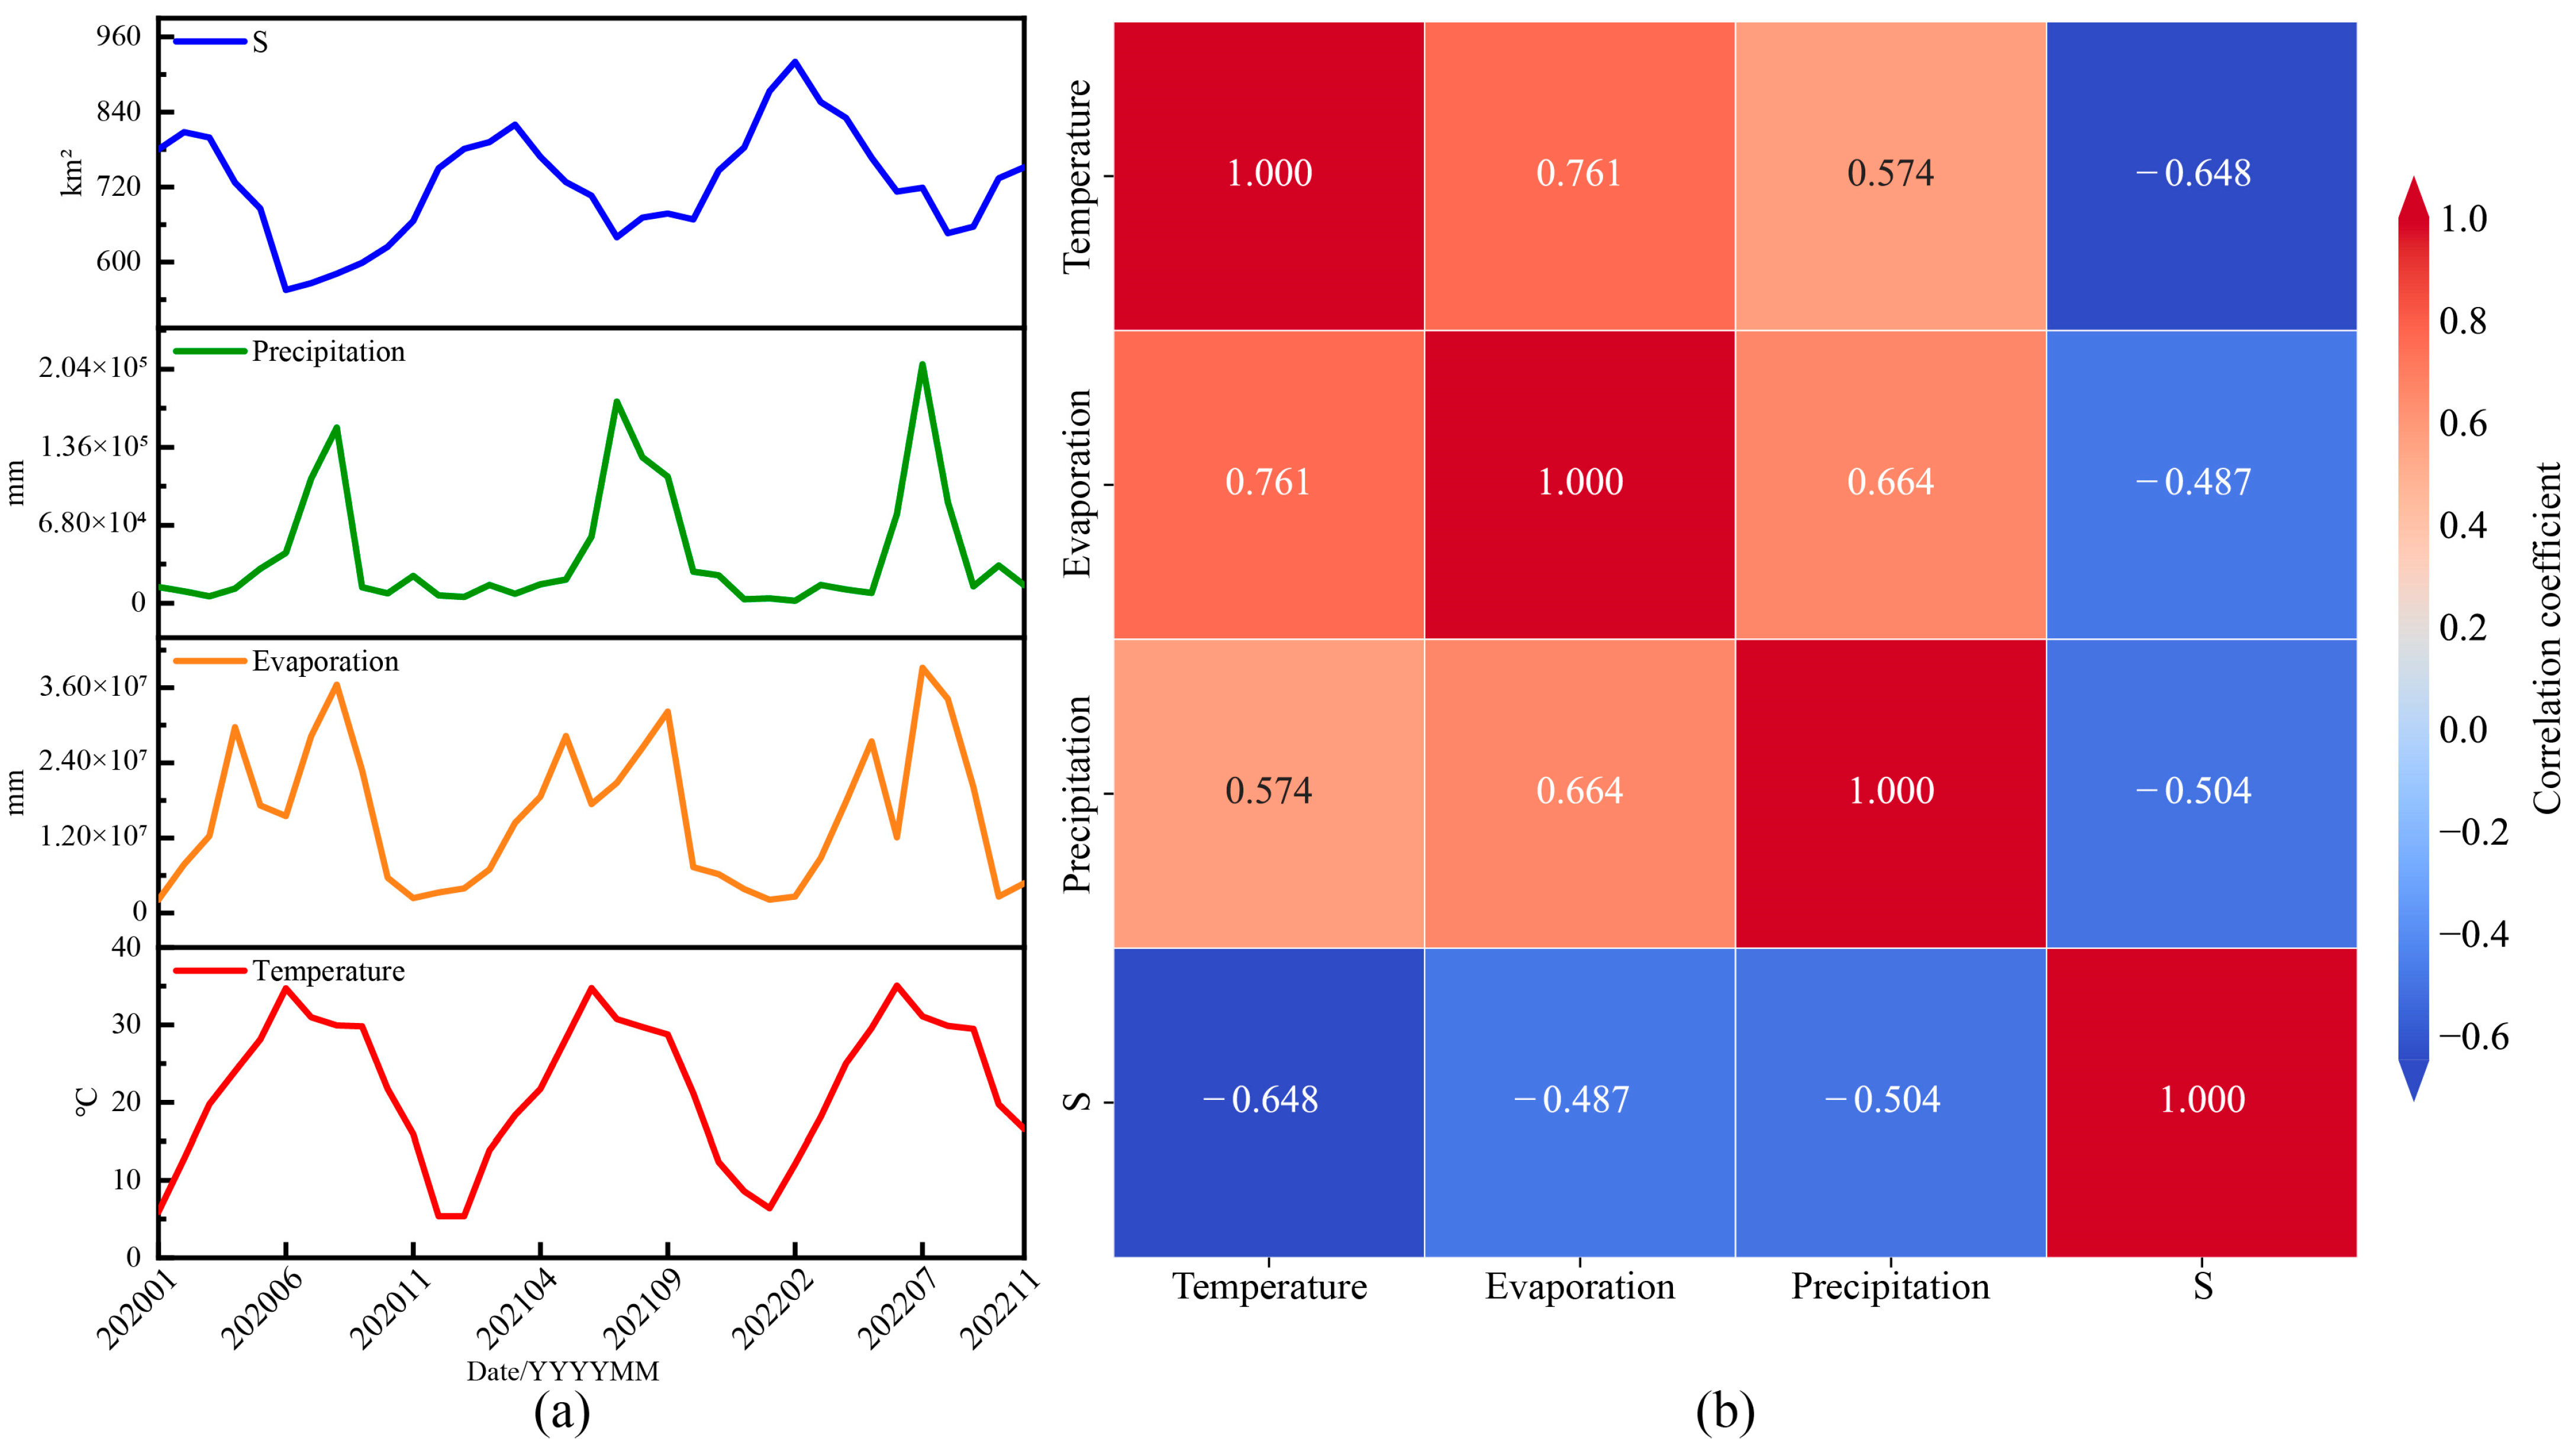
In the process of water body detection, environmental factors such as temperature, evaporation, and precipitation can affect the accuracy of the detection results. To evaluate the impact of these factors on water body detection, this study selected the water body area as the primary evaluation metric. In this section, we explore the influence of environmental factors, including temperature, evaporation, and precipitation, on the water body detection results. The data sources used included publicly available datasets such as MODIS, CHIRPS, and Landsat-8, with resolutions of 1 km, 0.05 degrees, and 30 m, respectively. Due to the lack of MODIS data for December 2022, the analysis focused on the environmental changes in Jining City from January 2020 to November 2022 and their impact on water body area.
We analyzed the average temperature, total evaporation, total precipitation, and water body area from January 2020 to November 2022, and plotted the time series (Figure 14a) and correlation heatmap (Figure 14b). The results showed a significant correlation between water body area and these environmental factors. Specifically, temperature was significantly negatively correlated with water body area, with a correlation coefficient of −0.648, indicating that as the temperature increased, the water body area tended to decrease. Evaporation was also negatively correlated with water body area, with a correlation coefficient of −0.487, further supporting the hypothesis that increased temperature leads to increased evaporation, thereby reducing the water body area. The correlation coefficient between precipitation and water body area was −0.504; although increased precipitation may replenish water bodies, the area did not significantly increase due to higher surface runoff and evaporation rates.
These analytical results indicate that environmental factors have a significant impact on water body detection results. Therefore, understanding and accounting for these environmental changes is crucial for improving the accuracy of the detection results in long-term water body monitoring. To address these challenges, the TSAE-UNet model and related models could, in the future, attempt to integrate environmental variables as inputs to enhance their ability to adapt to dynamic changes in water bodies. Additionally, adaptive fine-tuning of the model in regions with different climatic characteristics could improve its adaptability and robustness under various environmental conditions. Furthermore, improving the data processing methods, such as applying more advanced cloud removal algorithms and image enhancement techniques, would also help ensure the quality of input data, thereby enhancing the model’s detection performance in changing environments.

6. Conclusions

In this study, compared with the FCN, PSPNet, DeepLabV3+, ADCNN, and MECNet models, the performance of the TSAE-UNet model was evaluated to detect the long-term trends of water bodies in different environments. The main conclusions are as follows.
In multi-scene water body detection, TSAE-UNet performed excellently in urban areas, farmlands, and complex terrains. Compared with the other models, TSAE-UNet significantly reduced false positives and false negatives, demonstrating higher detection accuracy. In all tested scenarios, TSAE-UNet outperformed in precision, recall, overall accuracy, and Kappa metrics, with an overall accuracy ranging from 91.49% to 99.05%, which was 0.13% to 16.97% higher than other methods, and Kappa values ranging from 0.80 to 0.94, which was 0.01 to 0.38 higher than other methods.
In the multi-temporal water body detection for Jining City from 2020 to 2022, TSAE-UNet demonstrated high consistency and accuracy in the monthly detection results. Over the three years of detection data, the water body area detected by TSAE-UNet had the highest correlation coefficients between years, at 0.911, 0.852, and 0.749, indicating its superior performance in long-term monitoring tasks. Additionally, during the quarterly water body detection for Jining City in 2022, TSAE-UNet achieved an overall accuracy of 99.08% to 99.78%, which was 0.05% to 1.47% higher than other methods, and Kappa values of 0.83 to 0.96, which were 0.01 to 0.32 higher than other methods.
Additionally, we explored the relationship between environmental factors such as temperature, evaporation, and precipitation, and changes in water body area in Jining City from 2020 to 2022. Correlation analysis revealed a significant negative correlation between temperature and water body area, with a correlation coefficient of −0.648; the correlation coefficient between evaporation and water body area was −0.487; and the correlation coefficient between precipitation and water body area was −0.504.
In summary, the TSAE-UNet model performs excellently in diverse scenarios and long-term monitoring tasks, demonstrating high accuracy and consistency, making it an effective tool for supporting water resource management and environmental monitoring.
Author Contributions

Conceptualization, S.W. and Y.C.; methodology, S.W.; validation, S.W., Y.C., Y.Y. and X.C.; formal analysis, S.W., Y.C., Y.Y. and J.T.; investigation, S.W. and Y.Y.; writing—original draft preparation, S.W.; writing—review and editing, S.W., Y.C., X.T. and H.C.; visualization, S.W.; supervision, Y.C.; project administration, Y.C.; funding acquisition, Y.C. All authors have read and agreed to the published version of the manuscript.

Funding

This study was supported in part by the National Natural Science Foundation of China (Grant number 42171312), the basic research program of Xuzhou (Grant number KC23049), and the Open Fund of Key Laboratory of Geographic Information Science (Ministry of Education), East China Normal University (grant number: KLGIS2023A02).

Data Availability Statement

The Sentinel-1A and Sentinel-2 data used in the paper can be downloaded directly from https://browser.dataspace.copernicus.eu/ (accessed on 7 June 2024).

Conflicts of Interest

The authors declare no conflicts of interest.

References

  1. Fernandez-Beltran, R.; Pla, F.; Plaza, A. Endmember extraction from hyperspectral imagery based on probabilistic tensor moments. IEEE Geosci. Remote Sens. Lett. 2020, 17, 2120–2124. [Google Scholar] [CrossRef]
  2. Huang, G.; Shen, Z.; Mardin, R. Overview of urban planning and water-related disaster management. In Urban Planning and Water-Related Disaster Management; Springer: Cham, Switzerland, 2019; pp. 1–10. [Google Scholar]
  3. Weiss, M.; Jacob, F.; Duveiller, G. Remote sensing for agricultural applications: A meta-review. Remote Sens. Environ. 2020, 236, 111402. [Google Scholar] [CrossRef]
  4. Li, M.; Ma, Z. Soil moisture drought detection and multi-temporal variability across China. Sci. China Earth Sci. 2015, 58, 1798–1813. [Google Scholar] [CrossRef]
  5. Garrick, D.E.; Hall, J.W.; Dobson, A.; Damania, R.; Grafton, R.Q.; Hope, R.; Hepburn, C.; Bark, R.; Boltz, F.; De Stefano, L. Valuing water for sustainable development. Science 2017, 358, 1003–1005. [Google Scholar] [CrossRef] [PubMed]
  6. Kumar, S.; Imen, S.; Sridharan, V.K.; Gupta, A.; McDonald, W.; Ramirez-Avila, J.J.; Abdul-Aziz, O.I.; Talchabhadel, R.; Gao, H.; Quinn, N.W. Perceived barriers and advances in integrating earth observations with water resources modeling. Remote Sens. Appl. Soc. Environ. 2024, 33, 101119. [Google Scholar] [CrossRef]
  7. Chaminé, H.I.; Pereira, A.J.; Teodoro, A.C.; Teixeira, J. Remote sensing and GIS applications in earth and environmental systems sciences. SN Appl. Sci. 2021, 3, 870. [Google Scholar] [CrossRef]
  8. Zhang, W.; Jiao, L.; Li, Y.; Huang, Z.; Wang, H. Laplacian feature pyramid network for object detection in VHR optical remote sensing images. IEEE Trans. Geosci. Remote Sens. 2021, 60, 1–14. [Google Scholar] [CrossRef]
  9. Li, Q.; Zhong, R.; Du, X.; Du, Y. TransUNetCD: A hybrid transformer network for change detection in optical remote-sensing images. IEEE Trans. Geosci. Remote Sens. 2022, 60, 5622519. [Google Scholar] [CrossRef]
  10. Liu, B.; Du, S.; Bai, L.; Ouyang, S.; Wang, H.; Zhang, X. Water extraction from optical high-resolution remote sensing imagery: A multi-scale feature extraction network with contrastive learning. GIScience Remote Sens. 2023, 60, 2166396. [Google Scholar] [CrossRef]
  11. Gao, B. NDWI—A normalized difference water index for remote sensing of vegetation liquid water from space. Remote Sens. Environ. 1996, 58, 257–266. [Google Scholar] [CrossRef]
  12. Xu, H. Modification of normalised difference water index (NDWI) to enhance open water features in remotely sensed imagery. Int. J. Remote Sens. 2006, 27, 3025–3033. [Google Scholar] [CrossRef]
  13. Xu, H. A study on information extraction of water body with the modified normalized difference water index (MNDWI). J. Remote Sens. 2005, 9, 589–595. [Google Scholar] [CrossRef]
  14. Li, X.; Zhou, J. Research on surface subsidence information extraction method based on high phreatic coal mining area. Coal Sci. Technol. 2020, 48, 105–112. [Google Scholar] [CrossRef]
  15. Feyisa, G.L.; Meilby, H.; Fensholt, R.; Proud, S.R. Automated water extraction index: A new technique for surface water mapping using Landsat imagery. Remote Sens. Environ. 2014, 140, 23–35. [Google Scholar] [CrossRef]
  16. Yang, J.; Du, X. An enhanced water index in extracting water bodies from Landsat TM imagery. Ann. Gis. 2017, 23, 141–148. [Google Scholar] [CrossRef]
  17. Fu, J.; Wang, J.; Li, J. Study on the automatic extraction of water body from TM image using decision tree algorithm. In Proceedings of the International Symposium on Photoelectronic Detection and Imaging 2007: Related Technologies and Applications, Beijing, China, 19 February 2008; Volume 6625, p. 662502. [Google Scholar] [CrossRef]
  18. Nandi, I.; Srivastava, P.K.; Shah, K. Floodplain mapping through support vector machine and optical/infrared images from Landsat 8 OLI/TIRS sensors: Case study from Varanasi. Water Resour. Manag. 2017, 31, 1157–1171. [Google Scholar] [CrossRef]
  19. Qinglin, C.; Mingquan, W.; Yongjian, H. Water information extraction in Shanghai by integrating random forest model and six water indices. Bull. Surv. Mapp. 2022, 2, 106–109. [Google Scholar] [CrossRef]
  20. Guo, Z.; Wu, L.; Huang, Y.; Guo, Z.; Zhao, J.; Li, N. Water-body segmentation for SAR images: Past, current, and future. Remote Sens. 2022, 14, 1752. [Google Scholar] [CrossRef]
  21. Su, L.; Li, Z.; Gao, F.; Yu, M. A review of remote sensing image water extraction. Remote Sens. Land Resour. 2021, 33, 9–19. [Google Scholar] [CrossRef]
  22. Cao, Y.; Liu, C. Application of EnviSat ASAR data in hydrological monitoring. Geogr. Geo-Inf. Sci. 2006, 22, 13. [Google Scholar] [CrossRef]
  23. Hong, S.; Jang, H.; Kim, N.; Sohn, H. Water area extraction using RADARSAT SAR imagery combined with landsat imagery and terrain information. Sensors 2015, 15, 6652–6667. [Google Scholar] [CrossRef] [PubMed]
  24. Klemenjak, S.; Waske, B.; Valero, S.; Chanussot, J. Automatic detection of rivers in high-resolution SAR data. IEEE J. Sel. Top. Appl. Earth Observ. Remote Sens. 2012, 5, 1364–1372. [Google Scholar] [CrossRef]
  25. Lv, W.; Yu, Q.; Yu, W. Water extraction in SAR images using GLCM and support vector machine. In Proceedings of the IEEE 10th International Conference on Signal Processing Proceedings, Beijing, China, 24–28 October 2010; pp. 740–743. [Google Scholar] [CrossRef]
  26. Yu, Z.; Feng, C.; Liu, M.; Ramalingam, S. Casenet: Deep category-aware semantic edge detection. In Proceedings of the IEEE Conference on Computer Vision and Pattern Recognition (CVPR), Honolulu, HI, USA, 21–26 July 2017; pp. 5964–5973. [Google Scholar] [CrossRef]
  27. Bertasius, G.; Shi, J.; Torresani, L. Deepedge: A multi-scale bifurcated deep network for top-down contour detection. In Proceedings of the IEEE Conference on Computer Vision and Pattern Recognition (CVPR), Boston, MA, USA, 7–12 June 2015; pp. 4380–4389. [Google Scholar] [CrossRef]
  28. Shelhamer, E.; Long, J.; Darrell, T. Fully convolutional networks for semantic segmentation. IEEE Trans. Pattern Anal. Mach. Intell. 2017, 39, 640–651. [Google Scholar] [CrossRef]
  29. Xie, S.; Tu, Z. Holistically-nested edge detection. In Proceedings of the IEEE International Conference on Computer Vision (ICCV), Santiago, Chile, 7–13 December 2015; pp. 1395–1403. [Google Scholar] [CrossRef]
  30. Lin, G.; Milan, A.; Shen, C.; Reid, I. Refinenet: Multi-path refinement networks for high-resolution semantic segmentation. In Proceedings of the IEEE Conference on Computer Vision and Pattern Recognition (CVPR), Honolulu, HI, USA, 21–26 July 2017; pp. 1925–1934. [Google Scholar] [CrossRef]
  31. Ronneberger, O.; Fischer, P.; Brox, T. U-net: Convolutional networks for biomedical image segmentation. In Proceedings of the Medical Image Computing and Computer-Assisted Intervention–MICCAI 2015: 18th International Conference, Munich, Germany, 5–9 October 2015; Springer International Publishing: Cham, Switzerland, 2015; pp. 234–241. [Google Scholar] [CrossRef]
  32. Miao, Z.; Fu, K.; Sun, H.; Sun, X.; Yan, M. Automatic water-body segmentation from high-resolution satellite images via deep networks. IEEE Geosci. Remote Sens. Lett. 2018, 15, 602–606. [Google Scholar] [CrossRef]
  33. Li, L.; Yan, Z.; Shen, Q.; Cheng, G.; Gao, L.; Zhang, B. Water body extraction from very high spatial resolution remote sensing data based on fully convolutional networks. Remote Sens. 2019, 11, 1162. [Google Scholar] [CrossRef]
  34. Feng, W.; Sui, H.; Huang, W.; Xu, C.; An, K. Water body extraction from very high-resolution remote sensing imagery using deep U-Net and a superpixel-based conditional random field model. IEEE Geosci. Remote Sens. Lett. 2018, 16, 618–622. [Google Scholar] [CrossRef]
  35. Li, R.; Liu, W.; Yang, L.; Sun, S.; Hu, W.; Zhang, F.; Li, W. DeepUNet: A deep fully convolutional network for pixel-level sea-land segmentation. IEEE J. Sel. Top. Appl. Earth Observ. Remote Sens. 2018, 11, 3954–3962. [Google Scholar] [CrossRef]
  36. Zhang, Z.; Lu, M.; Ji, S.; Yu, H.; Nie, C. Rich CNN features for water-body segmentation from very high resolution aerial and satellite imagery. Remote Sens. 2021, 13, 1912. [Google Scholar] [CrossRef]
  37. Parajuli, J.; Fernandez-Beltran, R.; Kang, J.; Pla, F. Attentional dense convolutional neural network for water body extraction from sentinel-2 images. IEEE J. Sel. Top. Appl. Earth Observ. Remote Sens. 2022, 15, 6804–6816. [Google Scholar] [CrossRef]
  38. Guo, X. Water Change Detection Based on Pixel-Level Fusion of Optical and SAR Image. Master’s Thesis, China University of Mining and Technology, Xuzhou, China, 2019. [Google Scholar]
  39. Yang, Q. Research on Remote Sensing Image Water Body Extraction and Change Detection Model Based on Deep Learning. Master’s Thesis, Shihezi University, Shihezi, China, 2021. [Google Scholar] [CrossRef]
  40. LeCun, Y.; Boser, B.; Denker, J.S.; Henderson, D.; Howard, R.E.; Hubbard, W.; Jackel, L.D. Backpropagation applied to handwritten zip code recognition. Neural Comput. 1989, 1, 541–551. [Google Scholar] [CrossRef]
  41. LeCun, Y.; Bottou, L.; Bengio, Y.; Haffner, P. Gradient-based learning applied to document recognition. Proc. IEEE 1998, 86, 2278–2324. [Google Scholar] [CrossRef]
  42. Chollet, F. Xception: Deep learning with depthwise separable convolutions. In Proceedings of the IEEE Conference on Computer Vision and Pattern Recognition (CVPR), Honolulu, HI, USA, 21–26 July 2017; pp. 1251–1258. [Google Scholar] [CrossRef]
  43. Shi, X.; Chen, Z.; Wang, H.; Yeung, D.; Wong, W.; Woo, W. Convolutional LSTM network: A machine learning approach for precipitation nowcasting. arXiv 2015, arXiv:1506.04214. [Google Scholar]
  44. Mnih, V.; Heess, N.; Graves, A. Recurrent models of visual attention. arXiv 2014, arXiv:1406.6247. [Google Scholar]
  45. Ostu, N. A threshold selection method from gray-level histograms. IEEE Trans. Syst. Man Cybern. 1979, 9, 62. [Google Scholar] [CrossRef]
  46. Dong, Y.X. Review of otsu segmentation algorithm. Adv. Mater. Res. 2014, 989–994, 1959–1961. [Google Scholar] [CrossRef]
  47. Kingma, D.P.; Ba, J. Adam: A method for stochastic optimization. arXiv 2014, arXiv:1412.6980. [Google Scholar] [CrossRef]
  48. Zhao, H.; Shi, J.; Qi, X.; Wang, X.; Jia, J. Pyramid scene parsing network. In Proceedings of the IEEE Conference on Computer Vision and Pattern Recognition (CVPR), Honolulu, HI, USA, 21–26 July 2017; pp. 2881–2890. [Google Scholar] [CrossRef]
  49. Chen, L.; Zhu, Y.; Papandreou, G.; Schroff, F.; Adam, H. Encoder-decoder with atrous separable convolution for semantic image segmentation. In Proceedings of the European Conference on Computer Vision (ECCV), Munich, Germany, 8–14 September 2018; pp. 801–818. [Google Scholar] [CrossRef]
Figure 1. Training dataset.
Remotesensing 16 03829 g001
Figure 2. The architecture of the TSAE-UNet model.
Remotesensing 16 03829 g002
Figure 3. Operation mechanism of the depthwise separable convolution layer (illustrated with an input layer as an example): (a) depthwise convolution module; (b) pointwise convolution module.
Remotesensing 16 03829 g003
Figure 4. Attention mechanism module.
Remotesensing 16 03829 g004
Figure 5. ConvLSTM module.
Remotesensing 16 03829 g005
Figure 6. Training performance of the TSAE-UNet model.
Remotesensing 16 03829 g006
Figure 7. Overview of the study areas.
Remotesensing 16 03829 g007
Figure 8. Detection results of various methods in multi-scene water body detection. (ae) show the results of water body detection using six methods in different scenarios.
Remotesensing 16 03829 g008
Figure 9. Overview of the study area.
Remotesensing 16 03829 g009
Figure 10. Monthly water body detection results for Jining City from 2020 to 2022 using TSAE-UNet.
Remotesensing 16 03829 g010
Figure 11. Comparison of TSAE-UNet’s water body area detection results for Jining City from 2020 to 2022. (a) Trends of changes in water body area detected by TSAE-UNet over three years. (b) Correlation heatmap of water body area across different years.
Remotesensing 16 03829 g011
Figure 12. Curves of variations in water body area detected by various methods. (a) Curve of variation in water body area for Jining City in 2020. (b) Curve of variation in water body area for 2021. (c) Curve of variation in water body area for 2022.
Remotesensing 16 03829 g012
Figure 13. Water body detection results for the four quarters of 2022 in Jining City using six methods. (a) Detection results for the first quarter (spring). (b) Detection results for the second quarter (summer). (c) Detection results for the third quarter (autumn). (d) Detection results for the fourth quarter (winter).
Remotesensing 16 03829 g013
Figure 14. Environmental factors and water body area analysis in Jining City from January 2020 to November 2022. (a) Time series variation curves of monthly water body area (S), precipitation, evaporation, and temperature. (b) Heatmap of correlation coefficients between water body area (S), precipitation, evaporation, and temperature.
Remotesensing 16 03829 g014
Table 1. Performance comparison of different models during training.
MethodsBackbonePrecisionRecallF1 ScoreIoU
FCNFCN8s0.8860.7310.8000.667
PSPNetresnet1010.9340.8360.8790.789
DeepLabV3+resnet1010.9190.8230.8640.768
ADCNN-0.9410.8460.8910.803
MECNet-0.9650.9690.9670.936
TSAE-UNet-0.9890.9830.9860.974
Table 2. The average time required for training one epoch of various models and the computational resources needed.
MethodsExecution Time (s)RAM Usage (GB)
FCN316.336.39
PSPNet399.746.45
DeepLabV3+303.786.40
ADCNN303.246.62
MECNet414.106.38
TSAE-UNet326.196.40
Table 3. Accuracy assessment results of different methods. (a)–(e) correspond to the accuracy results of water body detection by different methods in five scenarios in Figure 8.
MethodsPROK PROK PROK
(a)FCN99.6097.5097.360.85(b)99.0890.9391.020.61(c)91.4383.9782.080.56
PSPNet99.7198.3498.240.9098.8792.6892.570.6992.6686.7285.170.64
DeepLabV3+99.8098.0798.070.8999.0193.0493.020.7193.2687.8286.450.67
ADCNN99.1798.6398.020.8998.2993.7593.130.7393.0786.6385.330.64
MECNet99.7798.9798.060.9393.9592.7495.660.8393.9592.7490.770.78
TSAE-UNet99.8298.9198.860.9499.1796.0195.880.8493.4394.1691.490.80
(d)FCN99.8197.7097.680.83(e)99.1197.5497.170.89
PSPNet99.7098.7898.610.9199.1598.7698.240.93
DeepLabV3+99.7798.6998.580.9099.3498.3198.020.93
ADCNN99.4498.9698.530.9098.5998.8797.880.92
MECNet99.7699.0798.920.9399.3699.1998.790.95
TSAE-UNet99.8499.1399.050.9499.6099.0598.860.96
Note: P, R, O, and K stand for precision, recall, overall accuracy, and Kappa, respectively. All units are in (%). The values in bold represent the maximum value in the corresponding column.
Table 4. Correlation coefficients of water body areas detected by six methods in Jining City for 2020, 2021, and 2022.
MethodsR2020–2021R2020–2022R2021–2022
FCN0.8170.5110.522
PSPNet0.9020.8230.734
DeepLabV3+0.8780.7830.707
ADCNN0.8110.7460.543
MECNet0.8870.8480.729
TSAE-UNet0.9110.8520.749
The values in bold represent the maximum value in the corresponding column.
Table 5. Accuracy evaluation of water body detection results for the first quarter (spring) of 2022 in Jining City using six methods.
Confusion MatrixMethodsReal DataUA (%)MethodsReal DataUA (%)
WaterNon-WaterWaterNon-Water
Predicted resultsWaterFCN79,416,855289,69099.64PSPNet79,217,950488,59599.39
Non-Water1,100,9591,286,27653.88455,4751,931,76080.92
PA (%)98.6381.62 99.4379.81
OA (%)98.31K0.6498.85K0.80
Predicted resultsWaterDeepLabV3+79,452,750253,79599.68ADCNN79,297,215409,33099.49
Non-Water592,8001,794,43575.1781,2951,576,94066.06
PA (%)99.2687.61 98.9979.39
OA (%)98.97K0.8198.51K0.71
Predicted resultsWaterMECNet79,236,793469,75299.41TSAE-UNet79,396,551309,99499.61
Non-Water564,8211,822,41476.34441,8761,945,35981.49
PA (%)99.2979.51 99.4586.26
OA (%)98.74K0.7799.08K0.83
Note: UA, PA, OA, and K stand for user accuracy, producer accuracy, overall accuracy, and Kappa, respectively.
Table 6. Accuracy evaluation of water body detection results for the second quarter (summer) of 2022 in Jining City using six methods.
Confusion MatrixMethodsReal DataUA (%)MethodsReal DataUA (%)
WaterNon-WaterWaterNon-Water
Predicted resultsWaterFCN79,653,494283,32599.65PSPNet79,644,539292,28099.63
Non-Water503,3951,653,56676.66357,9821,798,97983.40
PA (%)99.3785.37 99.5586.02
OA (%)99.04K0.8099.21K
Predicted resultsWaterDeepLabV3+79,697,370239,44999.70ADCNN79,544,669392,15099.51
Non-Water370,4411,786,52082.83377,0741,779,88782.52
PA (%)99.5488.18 99.5381.95
OA (%)99.26K0.8599.06K
Predicted resultsWaterMECNet79,670,956265,86399.67TSAE-UNet79,676,365260,45499.68
Non-Water273,5191,883,44287.32239,7371,917,22488.89
PA (%)99.6687.63 99.5388.04
OA (%)99.34K0.8799.06K0.88
Note: UA, PA, OA, and K stand for user accuracy, producer accuracy, overall accuracy, and Kappa, respectively.
Table 7. Accuracy evaluation of water body detection results for the third quarter (autumn) of 2022 in Jining City using six methods.
Confusion MatrixMethodsReal DataUA (%)MethodsReal DataUA (%)
WaterNon-WaterWaterNon-Water
Predicted resultsWaterFCN79,803,807187,58499.77PSPNet79,810,198181,19399.77
Non-Water306,1431,796,24685.44186,5601,915,82991.26
PA (%)99.6290.54 99.7691.36
OA (%)99.40K0.8899.55K0.91
Predicted resultsWaterDeepLabV3+79,853,610137,78199.83ADCNN79,666,099325,29299.59
Non-Water178,1971,924,19291.52196,9301,905,45990.63
PA (%)99.7893.32 99.7585.42
OA (%)99.62K0.9299.36K0.87
Predicted resultsWaterMECNet79,818,201173,19099.78TSAE-UNet79,820,221171,17099.79
Non-Water45,5022,056,88797.8441,6002,060,78998.02
PA (%)99.9492.23 99.9592.23
OA (%)99.73K0.9599.74K0.95
Note: UA, PA, OA, and K stand for user accuracy, producer accuracy, overall accuracy, and Kappa, respectively.
Table 8. Accuracy evaluation of water body detection results for the fourth quarter (winter) of 2022 in Jining City using six methods.
Confusion MatrixMethodsReal DataUA (%)MethodsReal DataUA (%)
WaterNon-WaterWaterNon-Water
Predicted resultsWaterFCN79,117,126302,58899.62PSPNet79,208,484211,23099.73
Non-Water408,9882,265,07884.71306,5952,367,47188.53
PA (%)99.4988.22 99.6191.81
OA (%)99.13K0.8699.37K0.90
Predicted resultsWaterDeepLabV3+79,239,303180,41199.77ADCNN79,100,998318,71699.60
Non-Water268,5982,405,46889.96375,3922,298,67485.96
PA (%)99.6693.02 99.5387.82
OA (%)99.45K0.9199.15K0.86
Predicted resultsWaterMECNet79,333,69386,02199.89TSAE-UNet79,330,99688,71899.89
Non-Water91,0932,582,97396.5993,2822,580,78496.51
PA (%)99.8996.78 99.8896.51
OA (%)99.78K0.9799.78K0.96
Note: UA, PA, OA, and K stand for user accuracy, producer accuracy, overall accuracy, and Kappa, respectively.
Disclaimer/Publisher’s Note: The statements, opinions and data contained in all publications are solely those of the individual author(s) and contributor(s) and not of MDPI and/or the editor(s). MDPI and/or the editor(s) disclaim responsibility for any injury to people or property resulting from any ideas, methods, instructions or products referred to in the content.