Article

Infrared Image Generation Based on Visual State Space and Contrastive Learning

by
Bing Li
1,†,
Decao Ma
1,†,
Fang He
1,*,
Zhili Zhang
1,
Daqiao Zhang
1 and
Shaopeng Li
1,2
1
Xi’an Research Institute of High Technology, Xi’an 710025, China
2
Department of Automation, Tsinghua University, Beijing 100084, China
*
Author to whom correspondence should be addressed.
These authors contributed equally to this work.
Remote Sens. 2024, 16(20), 3817; https://doi.org/10.3390/rs16203817
Submission received: 6 August 2024 / Revised: 28 September 2024 / Accepted: 12 October 2024 / Published: 14 October 2024

Abstract

:
The preparation of infrared reference images is of great significance for improving the accuracy and precision of infrared imaging guidance. However, collecting infrared data on-site is difficult and time-consuming. Fortunately, the infrared images can be obtained from the corresponding visible-light images to enrich the infrared data. To this end, this present work proposes an image translation algorithm that converts visible-light images to infrared images. This algorithm, named V2IGAN, is founded on the visual state space attention module and multi-scale feature contrastive learning loss. Firstly, we introduce a visual state space attention module designed to sharpen the generative network’s focus on critical regions within visible-light images. This enhancement not only improves feature extraction but also bolsters the generator’s capacity to accurately model features, ultimately enhancing the quality of generated images. Furthermore, the method incorporates a multi-scale feature contrastive learning loss function, which serves to bolster the robustness of the model and refine the detail of the generated images. Experimental results show that the V2IGAN method outperforms existing typical infrared image generation techniques in both subjective visual assessments and objective metric evaluations. This suggests that the V2IGAN method is adept at enhancing the feature representation in images, refining the details of the generated infrared images, and yielding reliable, high-quality results.

1. Introduction

Due to the limitations of application backgrounds and support capabilities, the reference images in infrared imaging guidance are usually visible-light images, while the real-time images are infrared images. The imaging mechanisms of infrared and visible-light images are different, leading to significant feature differences between them, which, in turn, increases the difficulty of scene matching in infrared imaging guidance [1]. Using infrared image simulation technology to generate the infrared characteristics of scenes in the required environment can not only effectively reduce the cost of obtaining infrared data, but also help to generate infrared data that are difficult to obtain in field tests under many natural environmental and scene conditions [2]. In addition to enriching infrared data, the method of converting visible-light images to infrared images can also be used to address the issues related to heterogeneous image matching and the integration of heterogeneous images. The generated infrared data can be applied to various fields such as aviation [3], navigation [4,5,6,7,8], meteorology [9,10,11,12], geology [13,14,15,16], and agriculture [17,18,19,20], providing basic and reliable data for tasks such as detection [21,22,23,24,25], classification [26,27,28,29], positioning [30,31,32,33], recognition [34,35,36,37], and tracking [38,39,40].
The current research on infrared mainly focuses on the mid-wavelength and long-wavelength ranges because the energy radiated from the ground is primarily concentrated in the mid-infrared and far-infrared spectral bands. Currently, the mainstream infrared image simulation technologies can be divided into two major categories: one is based on infrared characteristic modeling image simulation technology [41], and the other is based on deep learning infrared image simulation technology [2]. The former is based on the establishment of mathematical models related to the infrared characteristics of the scene and displays the infrared simulation effect of the scene through computer simulation. The latter uses deep learning algorithms to train a large number of visible-light scenes and their infrared characteristic effects, obtaining a mapping model between the visible-light and infrared images of the scene. Then, the infrared characteristics of the visible-light scene can be generated according to this model and displayed in the form of an image.
Infrared simulation technology based on infrared characteristic modeling can generate high-quality target infrared textures. However, these methods have limitations in generating infrared characteristics of target scenes in the presence of disturbances such as smoke and shadows, and in batch processing of data. They also exhibit lower levels of automation. Deep learning plays a significant role in feature extraction and mapping fitting, providing effective means to improve the quality of the generated images. Deep generative models are an important component in deep learning-based image generation, with Generative Adversarial Networks (GANs) [42] demonstrating superior performance in image transformation compared to other generative models.
Based on generative adversarial networks, the translation from visible-light to infrared images can be categorized into paired and unpaired types according to the data type. The visible-light image to infrared image conversion methods based on the Pix2Pix [43] framework are used for paired data, such as ThermalGAN [44], LayerGAN [45], InfraGAN [46], IR-GAN [47], and TMGAN [48]. ThermalGAN [44] and LayerGAN [45] generate infrared images through multimodal data generation. ThermalGAN generates infrared images in two steps: first, it generates the target’s average-temperature infrared image using visible-light images and temperature vectors, and then it generates a more refined infrared image using the target’s average-temperature infrared image and visible-light images. LayerGAN includes two methods for generating infrared images. One method uses temperature vectors, semantic segmentation images, and thermal segmentation images to generate infrared images. The other method uses visible-light images, semantic segmentation images, and thermal segmentation images to generate infrared images. Although these two works are of great significance for pedestrian re-identification tasks based on infrared images, they have high data requirements and require multimodal data. InfraGAN [46] and IR-GAN [47] address the issue of edge distortion in the generated infrared images by constructing new generative networks and loss functions to strengthen the constraints on the edge information of the generated infrared images. However, they do not delve deeply into the feature mapping relationship between visible-light images and infrared images.
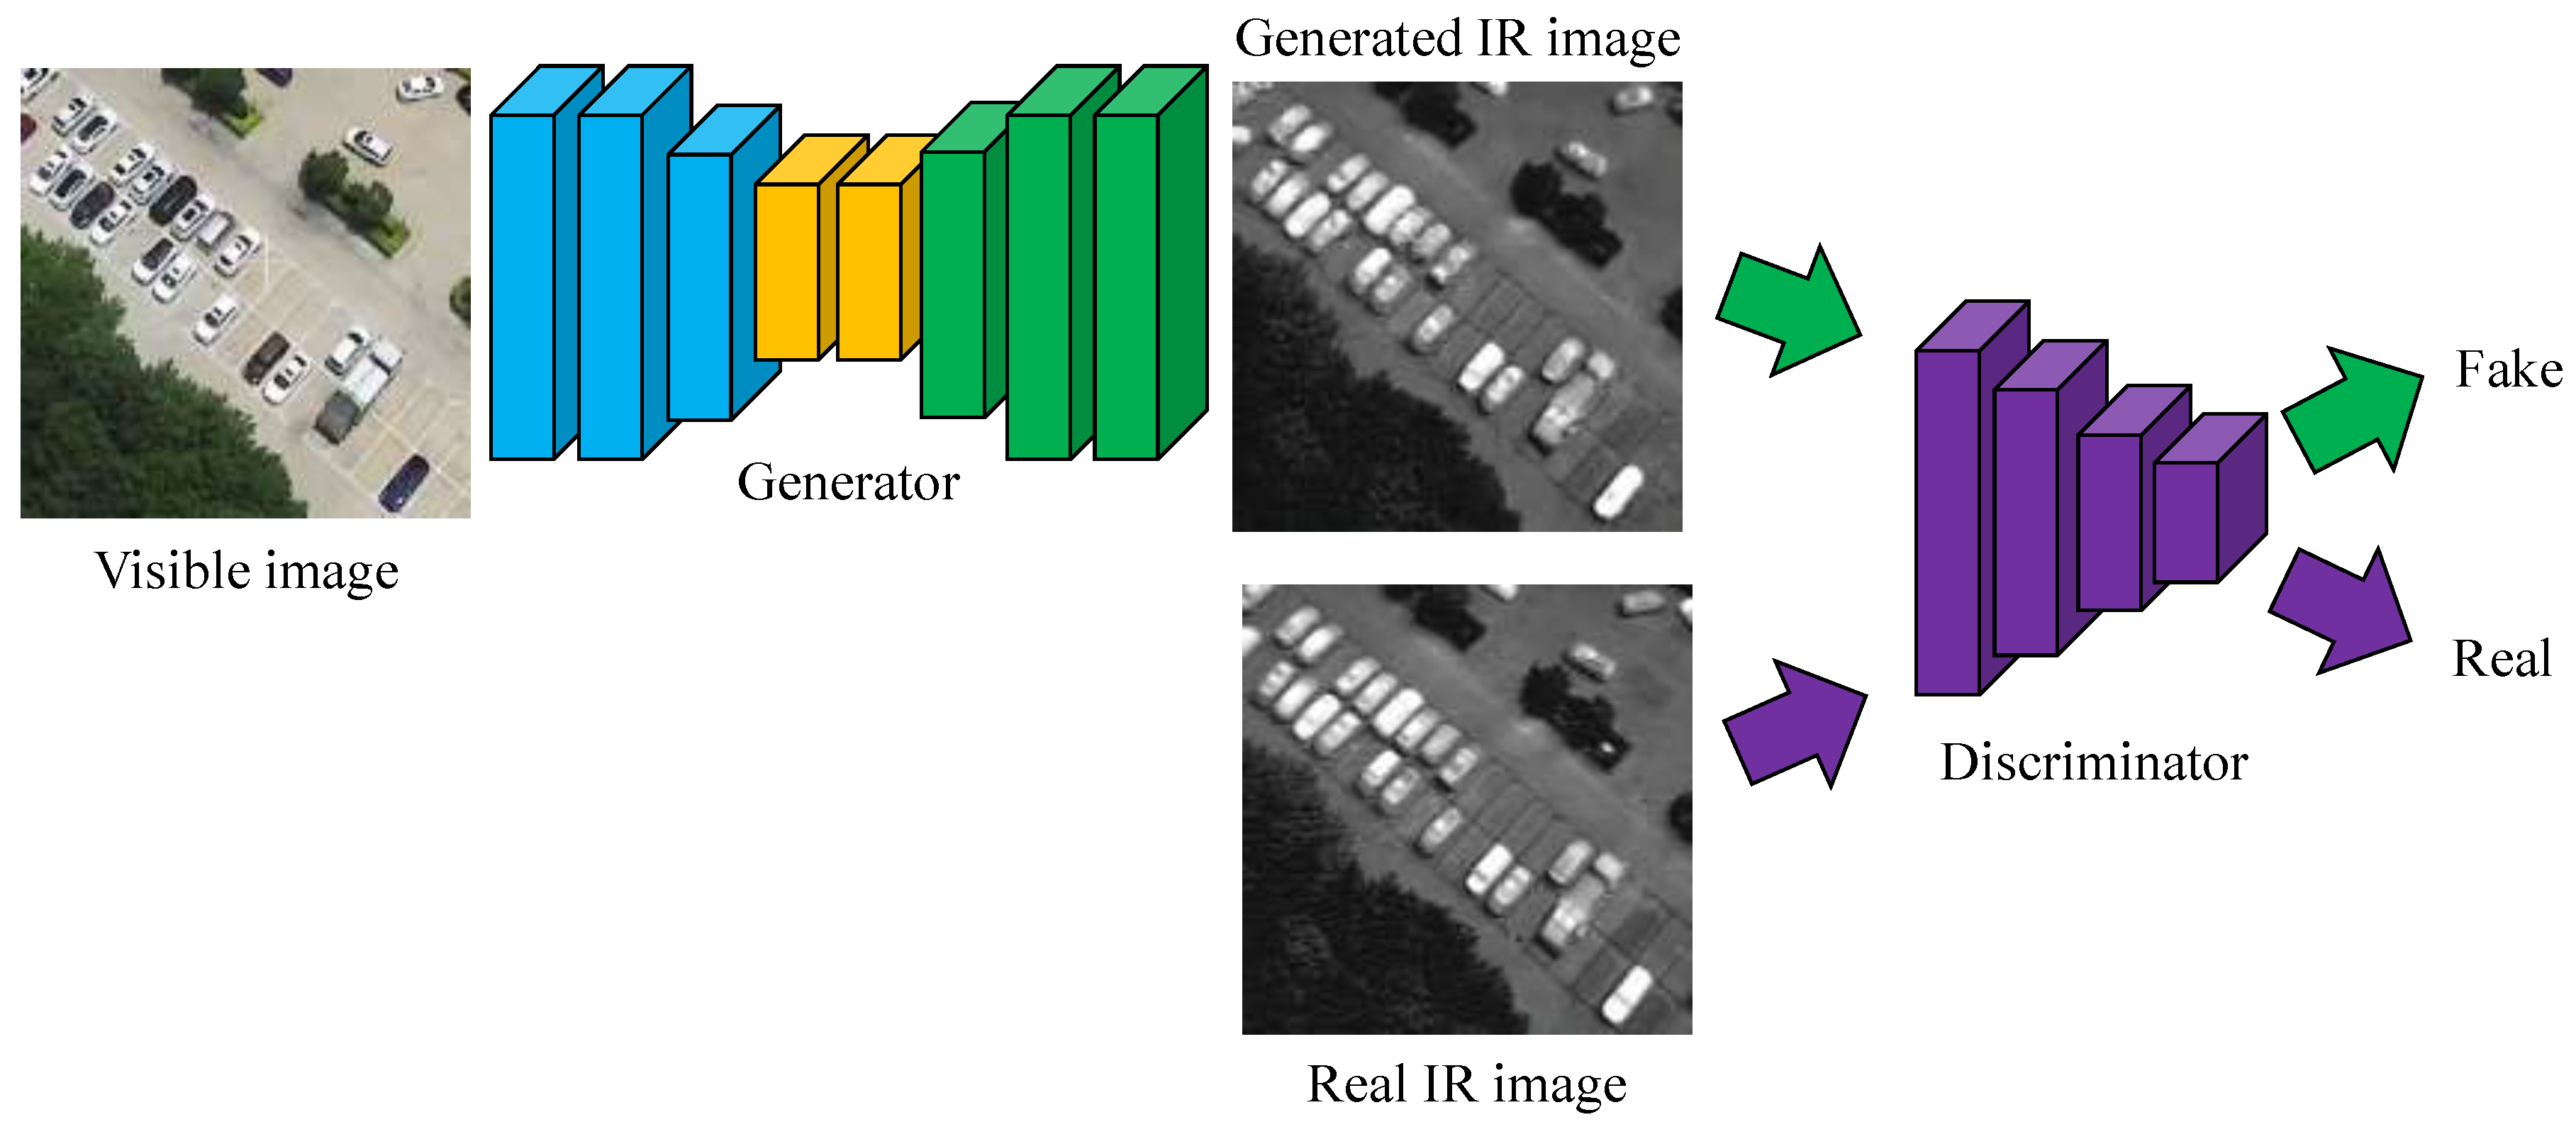
Based on the CycleGAN [49] framework, visible-light-to-infrared image conversion models are used for unpaired data. Examples include SIR-GAN [50], DAGAN [51], and CVIIT [52]. SIR-GAN [50] takes traditional infrared simulation data as input to obtain infrared images with rich texture information. DAGAN [51] uses a novel dual-attention mechanism for the automatic prediction of flashovers in compartment fires using visible-light-image-to-infrared translation. CVIIT [52] introduced a contrastive loss to ensure the consistency of content between the generated image and the source image, which can enhance the quality of image conversion under conditions of diminished illumination. The Edge-guided Multi-domain RGB-to-TIR image Translation algorithm (EMRT) [53] preserves more detail in the infrared image by constraining the consistency of edge information between the generated image and the source image. Although these methods have relaxed the requirements for data, they generally produce inferior infrared image results compared to paired methods. Therefore, the focus of this paper is on the translation of visible-light images to infrared images for paired data. Paired visible-light and infrared images capture the same ground objects, yet their different imaging mechanisms result in distinct data characteristics for these objects. Consequently, establishing an accurate feature mapping relationship is crucial for improving the quality of the infrared-generated images. A typical process of visible-light-image-to-infrared-image translation is shown in Figure 1.
Although Generative Adversarial Networks (GANs) have shown success in converting visible-light images to infrared images, they still have some shortcomings. The main issues include the distinct imaging mechanisms of visible-light and infrared images, which result in reduced accuracy in feature mapping by GANs, leading to suboptimal fitting effects. Furthermore, the generated infrared images suffer from issues such as poor texture consistency and detail loss.
To address the aforementioned challenges, this work proposes a method for generating infrared images from visible light, named V2IGAN, which is based on visual state space and multi-scale feature contrast learning. Utilizing the conditional generative adversarial network (CGAN) [54] framework, V2IGAN incorporates a visual state space attention module into its generative network. The module establishes feature mappings between visible-light and infrared images using a state-space model, emphasizing key regions in the visible-light images. Furthermore, V2IGAN employs a multi-scale feature contrast learning loss to ensure consistency across scales in the generated infrared images, thereby reducing the loss of detail. Notably, this strategy leverages the discriminator’s attention maps to enhance learning for challenging samples. The visual state space attention module and multi-scale feature contrast learning loss synergize to enhance the production of high-quality infrared images.
The main contributions are as follows:
  • A visual state space attention module is introduced into V2IGAN to focus the generative network on key areas within visible-light images effectively.
  • A multi-scale feature contrast learning function is considered in the present method to ensure semantic consistency between the generated and target images effectively.
  • Experiments conducted on large benchmark datasets across various scenarios demonstrate that V2IGAN is capable of producing high-quality, reliable infrared images.
The rest of this article is organized as follows. Section 2 briefly reviews the related work. In Section 3, the methodology of the proposed method, V2IGAN, is described in detail. The experiments and results are presented in Section 4, and Section 5 presents the discussion and analysis. Concluding remarks are given in Section 6.

2. Related Work

2.1. Generative Adversarial Networks

The basic idea of Generative Adversarial Networks (GANs) [42] is to set up a zero-sum game between two players, i.e., the generator and the discriminator. The generator creates samples that are intended to come from the same distribution as the training data. The discriminator examines samples to determine whether they are real or fake. The discriminator learns using supervised learning techniques, dividing inputs into two classes (real or fake). The generator is trained to fool the discriminator.
To overcome the limitation of original GANs in generating images with specific attributes, Mirza et al. [54] proposed the concept of Conditional Generative Adversarial Networks (CGANs). CGANs provide precise control over image generation by incorporating conditional variables. In recent years, methods based on the CGAN architecture have achieved significant advancements in enhancing image quality and diversity [8,55], improving user interactivity, and boosting model performance. The latest research encompasses not only sample-based transformation methods, language-driven models, and techniques for generating realistic images from abstract sketches but also includes in-depth explorations of the principles of CGAN algorithms [56,57], systematic developments in GAN architecture, and studies on stability and scalability in large-scale training. This work introduces visible-light images as conditional information to constrain and control the generation of corresponding infrared images.

2.2. Visible-to-Infrared Image Translation Based on CGAN

The process of Image-to-Image (I2I) translation [43], based on Conditional Generative Adversarial Networks (CGANs), can facilitate the transformation of images from the source domain (i.e., visible-light image) to the target domain (i.e., infrared image) by training a sophisticated deep learning model. Common models such as ThermalGAN [44], Pix2Pix-MRFFF [58], InfraGAN [46], and IR-GAN [47] are adept at converting visible-light images into their infrared counterparts. The superior performance of these models is largely based on the following three keys.
Network Architecture Enhancements: The integration of ResNet [59], UNet [60], and attention mechanisms into the network architecture significantly boosts the performance of the generative networks. For instance, EPSANet [36] incorporates an efficient pyramid squeeze attention module aimed at extracting multi-scale spatial information at a more granular level and developing a long-range channel dependency.
Adversarial Network Utilization: The deployment of adversarial networks with the refined image perception capabilities, such as the PatchGAN [61], MultiPatchGAN [62], and UNetGAN [63] models, further enhances the quality of the generated infrared images.
Stabilization Techniques: For the stabilization of the training process, models such as the Least Squares GAN (LSGAN) [64] and Wasserstein GAN (WGAN) [65] have been proposed to provide more stable and less mode-collapse-prone training dynamics.
In terms of loss functions, these models typically integrate traditional L1 and GAN losses with advanced loss functions specifically designed to enhance the edge information in infrared images. This includes the application of the structural similarity index measure (SSIM) loss [46] and gradient vector loss [47], both of which are aimed at improving the sharpness and definition of edges in the generated images. In conclusion, the translation from visible-light images to infrared images is a complex and multifaceted challenge in the field of computer vision, necessitating an in-depth analysis of the relationship between the two types of images.

2.3. Contrastive Learning

Contrastive learning has demonstrated strong advantages in state-of-the-art unsupervised visual representation learning tasks by learning a mapping function that continuously “pulls closer” the distances with related samples and “pushes away” the distances from other samples. These related samples are called positive samples, and other samples are called negative samples [66,67]. In contrastive learning methods, the approach to constructing positive and negative samples correctly is crucial. Recently, some studies have explored the application of contrastive learning in image translation [68,69].
TUNIT [70] uses a contrastive loss to simultaneously separate image domains and transform the input image to the target domain. DivCo, on the other hand, uses a contrastive loss to properly constrain the positive and negative relationships between specified generated images in the latent space. CUT [71] employs a noise-contrastive estimation framework to maximize the mutual information between input and output, thereby improving the performance of unsupervised image transformation models. To further leverage contrastive learning, DCLGAN [72] extends the unidirectional mapping to bidirectional mapping, performing better in learning embeddings. EnCo [73] requires only a set of encoders and decoders, and the target images do not need to be re-encoded to overcome the issue of blurred infrared images generated by existing algorithms. This study employs contrastive learning in infrared image generation to enhance the fine-grained details of the generated infrared images.

3. Proposed Method

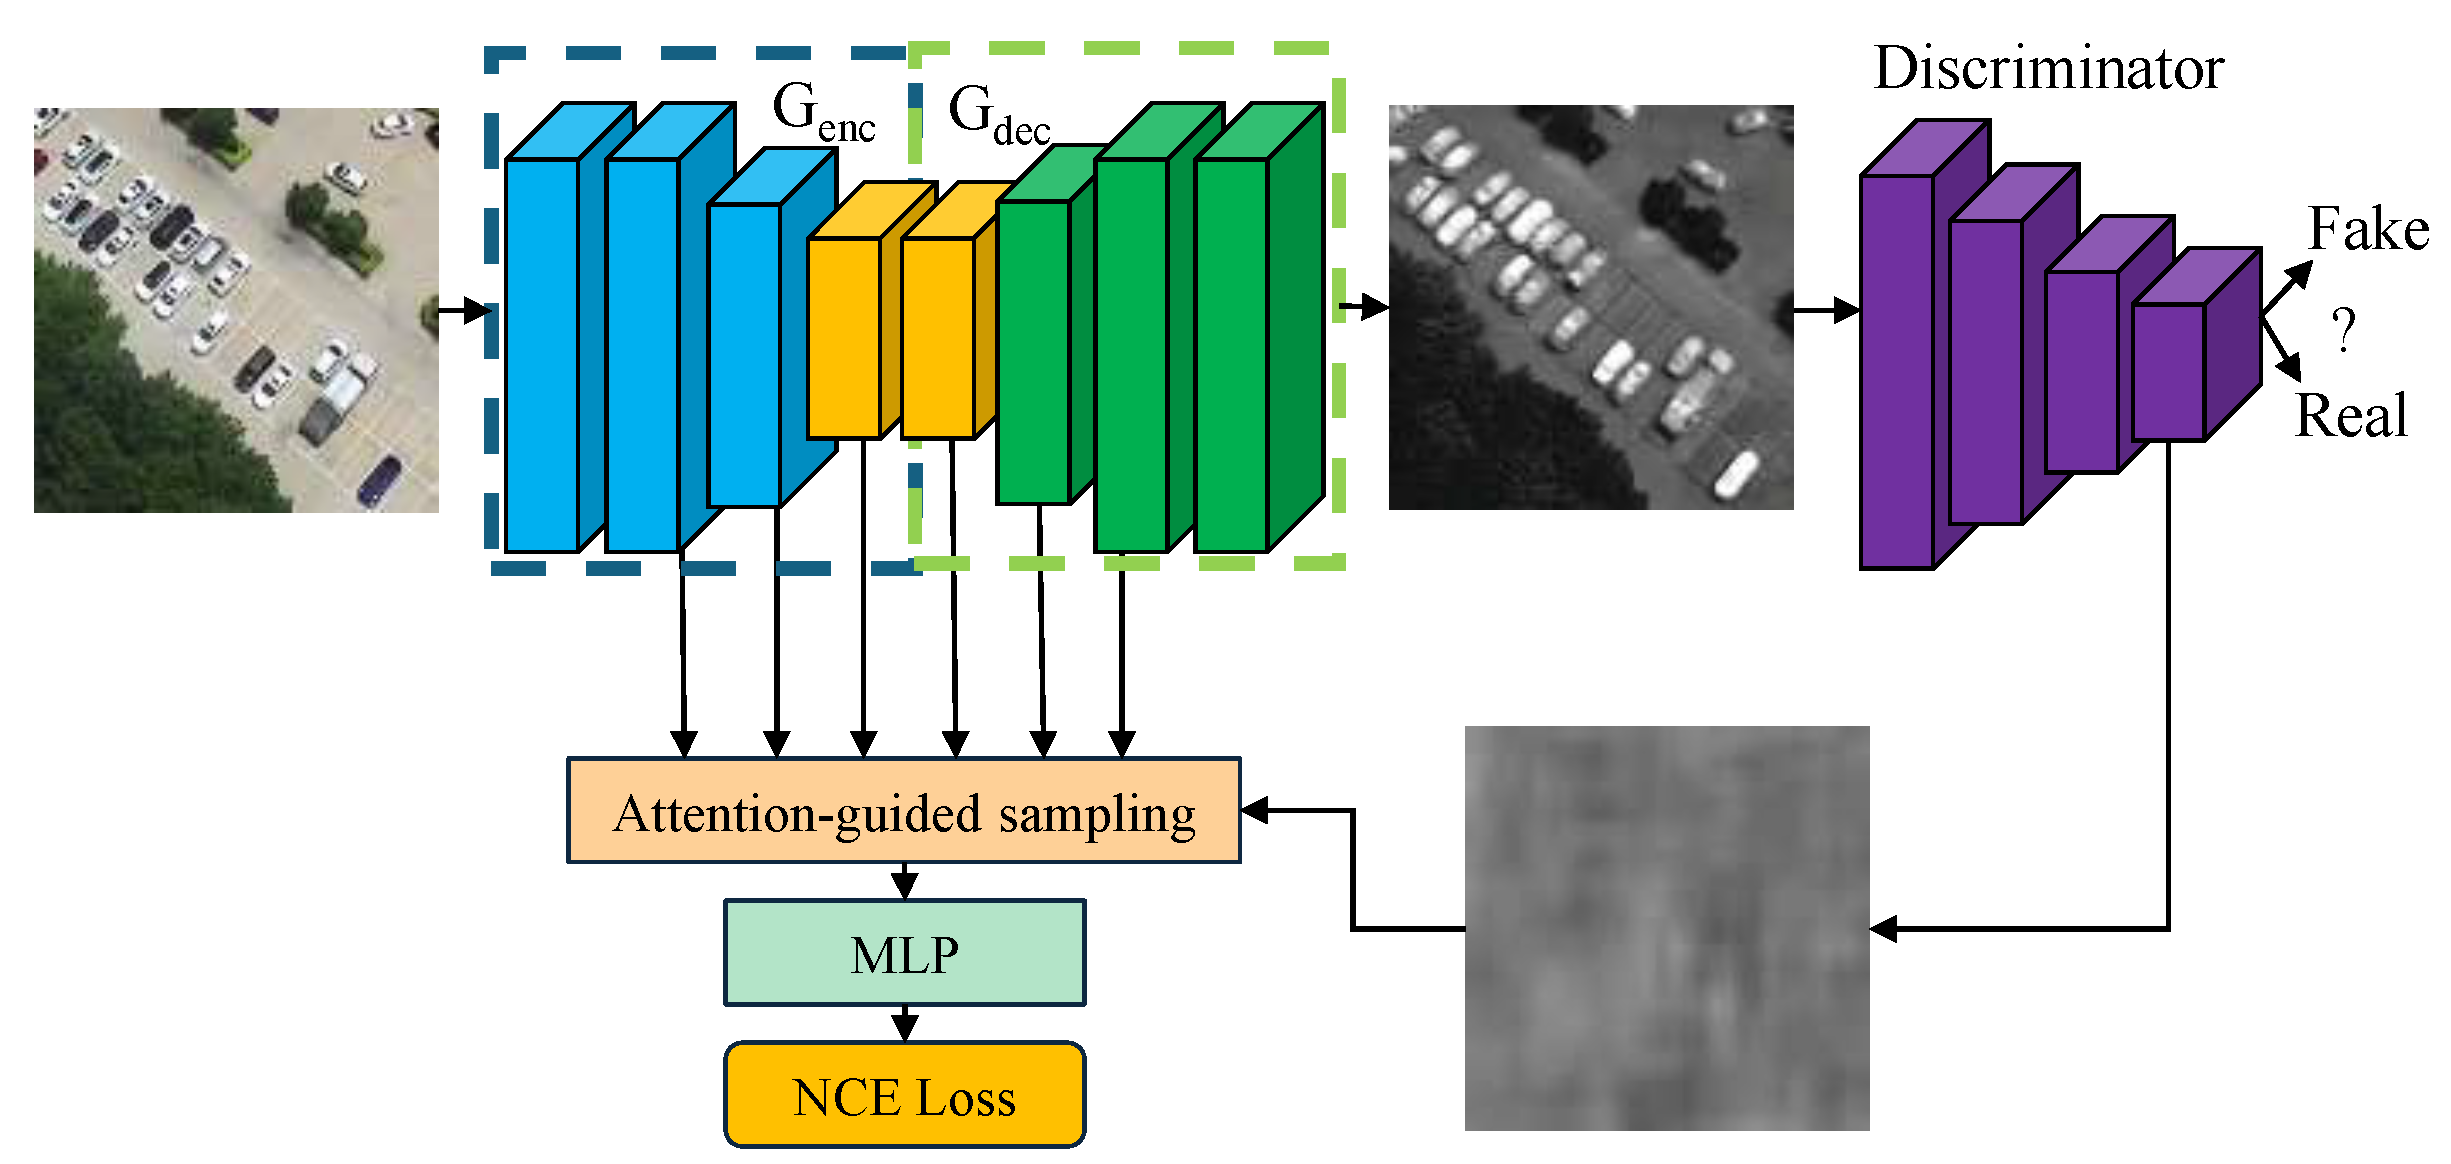
The V2IGAN algorithm architecture proposed in this work mainly consists of a generator network, translating visible-light images into infrared images, and a discriminator network designed to distinguish between real infrared images and generated infrared images. Figure 2 illustrates the framework flowchart of the V2IGAN algorithm. The generator network features an encoder–decoder architecture, while the discriminator network is structured around the PatchGAN model. Furthermore, the V2IGAN algorithm incorporates a visual state space attention module and employs a multi-scale feature contrast learning loss.

3.1. Proposed Network Architecture

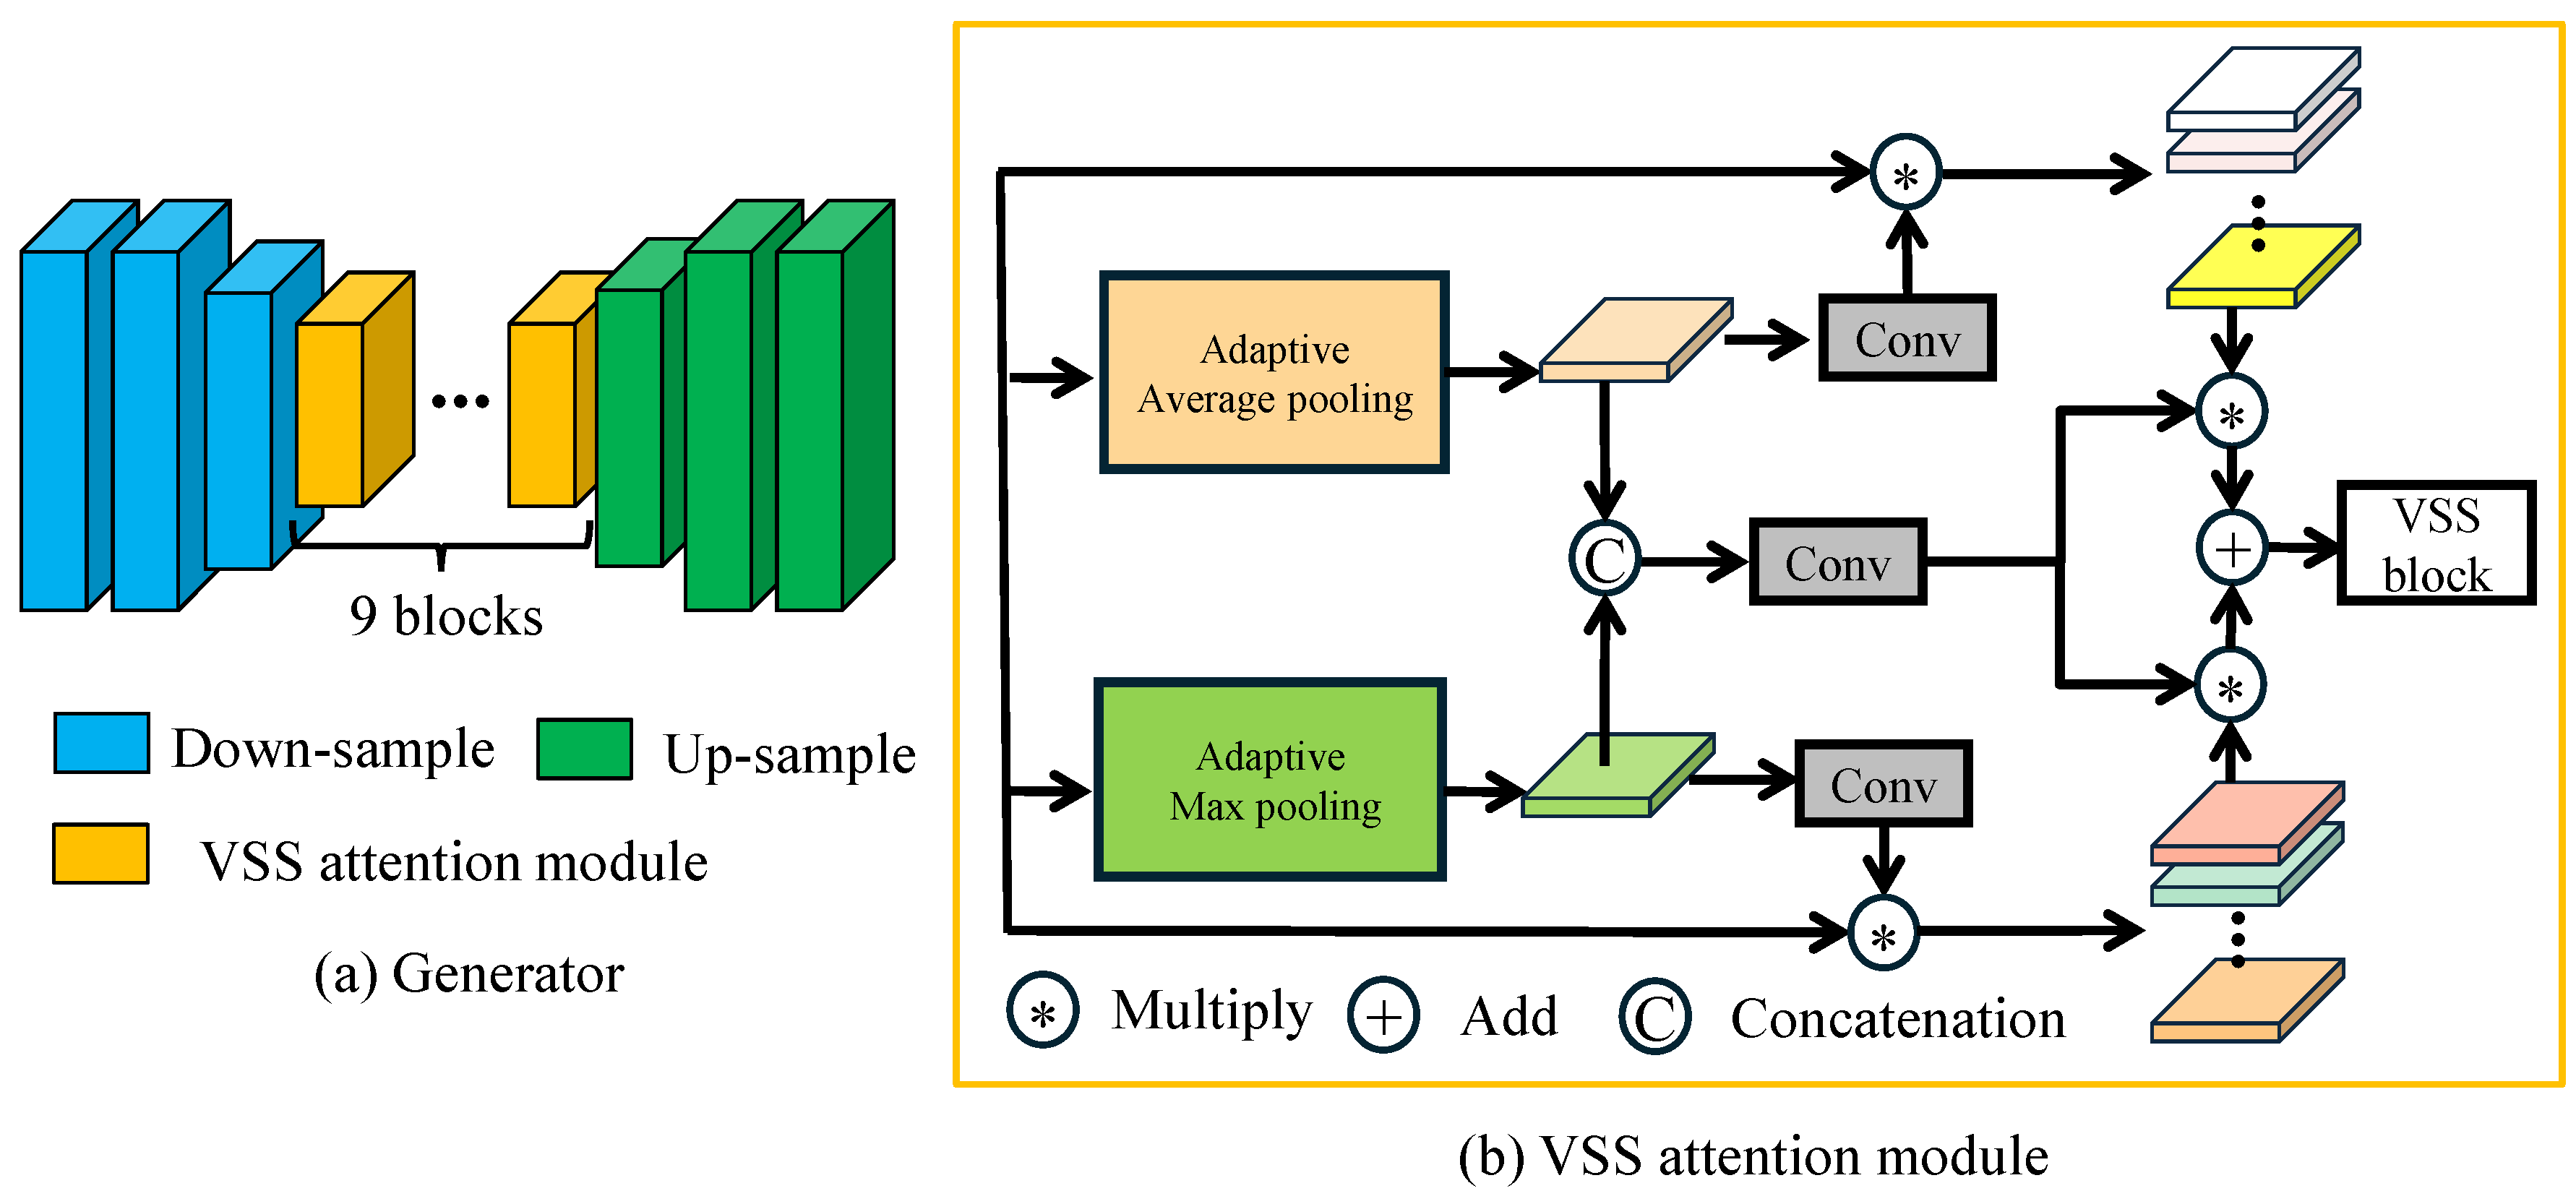
Generator: Infrared and visible-light images have distinct imaging mechanisms, leading to significant differences in texture and edge features. These differences elevate the challenge of translating visible-light images into infrared images. The Visual State Space (VSS) block capitalizes on the strengths of State Space Models (SSMs) in visual data processing. It features a global perceptual field, input-dependent weighting parameters, and a linear computational complexity, which effectively extracts features from visible-light images. Compared to the attention mechanism based on Transformer, the VSS module has a higher computational efficiency and requires less hardware infrastructure. The performance of the VSS module on multiple visual tasks, such as image classification, object detection, and semantic segmentation, has demonstrated its superiority. Building upon the performance advantages of the VSS block, this work presents a VSS attention module, depicted in Figure 3b. This module refines the generative network’s focus on key regions within the visible-light image, thereby fortifying the feature extraction effectiveness. Consequently, it improves the model’s capacity to accurately model feature relationships.
The generator of the V2IGAN algorithm, as illustrated in Figure 3a, comprises three parts: a down-sampling module, a VSS attention module, and an up-sampling module. The operation of the generator can be described as follows. The input visible-light image x initially undergoes two successive down-sampling operations, diminishing the image size while simultaneously augmenting the number of channels, thereby capturing the essential features of the visible-light image. The VSS attention module then refines these features to accentuate the features of interest within the visible-light image. Finally, through two sequential up-sampling stages, the image size is progressively enlarged, and the number of channels is correspondingly reduced, ultimately resulting in the reconstruction of the image into an infrared image y ^ .
Discriminator: V2IGAN employs a discriminator constructed by PatchGAN. The Markovian discriminator is a type of discriminative model composed of convolutional layers, with the output being a matrix of size N × N , and the average value of this matrix is taken as the output for true/false. Since each value in the output matrix corresponds to a receptive field in the original image, that is, a receptive field corresponds to a regional block (patch) in the original image, GANs with this structure are also known as PatchGAN [61].
Taking an image with a size of 256 × 256 as an example, conventional GANs map the 256 × 256 image to a single scalar output, representing “true” or “false”. However, this does not easily reflect the local features of the image. In contrast, PatchGAN maps the 256 × 256 image to a matrix of size N × N , where each N × N represents whether the regional block in the image is true or false. PatchGAN achieves the extraction and representation of local image features, allowing for the model to pay more attention to the detailed information of the image, which is conducive to generating higher-quality images.

3.2. VSS Attention Module

The visible-light image is first down-sampled to obtain f x . The input of the VSS attention module is then processed through adaptive average pooling and adaptive max pooling to obtain A v g ( f x ) and M a x ( f x ) , respectively. After the convolution process, these are respectively multiplied by the original input to obtain f x C o n v ( A v g ( f x ) ) and f x C o n v ( M a x ( f x ) ) , respectively. The results are then multiplied by the concatenated features C o n v ( C a t ( A v g ( f x ) a n d M a x ( f x ) ) ) after convolution and added to the input VSS block. The final output of the VSS attention module is V S S ( C o n v ( C a t ( A v g ( f x ) , M a x ( f x ) ) ) f x C o n v ( A v g ( f x ) ) + C o n v ( C a t ( A v g ( f x ) , M a x ( f x ) ) ) f x C o n v   ( M a x ( f x ) ) ) .
The VSS attention module includes a crucial component called the VSS block. The VSS block, derived from the VMamba [74], represents a pivotal component of the generative network, as illustrated in Figure 4. After undergoing the layer normalization process, input data are bifurcated into two pathways. In the side pathway, input data are processed by a linear layer followed by a block with the SiLU activation function. In the main pathway, input data are first processed by a linear layer, a depthwise separable convolution block, and a SiLU-activation-function block, and then directed by the 2D-Selective-Scan (SS2D) module for enhanced feature extraction. Next, layer normalization is performed on the extracted features, which are then merged with the side pathway’s results through pixel-wise multiplication. Finally, the features are mixed using a linear layer, and the output features are combined with the input through a residual connection to form the output of the VSS block.
The 2D selective scan (SS2D) consists of three parts, i.e., the scanning expansion operation, selective scan space state sequential model (S6), and the scanning fusion operation, as illustrated in Figure 5. As depicted in the figure, the scanning expansion operation unfolds an input image from the top-left to the bottom-right, from the bottom-right to the top-left, from the top-right to the bottom-left, and from the bottom-left to the top-right into sequences along four different directions. These sequences are processed by the S6 block for feature extraction, ensuring a thorough scan of information from all four directions, capturing a variety of features. Subsequently, as shown in Figure 5, the scanning fusion operation sums and merges the sequences from the four directions, restoring the output image to the same size as that of the input. The specific operation can be described as follows. Given the input feature s, the output feature s o of SS2D can be represented as follows:
s d = e x p a n d ( s , d ) ,
s d ¯ = S 6 ( s d ) ,
s o = m e r g e ( s d 1 ¯ , s d 2 ¯ , s d 3 ¯ , s d 4 ¯ ) ,
where d D = 1 , 2 , 3 , 4 are four different scanning directions. e x p a n d ( · ) and m e r g e ( · ) correspond to the scan expansion as depicted in Figure 5 and scan merging as depicted in Figure 5. Refer to ref [74] for further details about S6. The pseudo-code for S6 is presented in Algorithm 1.
Algorithm 1 Pseudo-code for S6 in SS2D.
  • Input:  s d , the input feature
  • Params:  A , the nn . Parameter
  •                  D , the nn . Parameter
  • Operator:  L i n e r ( · ) , the linear projection layer
  • Output:  s d ¯ , the output featurer
  •  
  • Δ , B , C = L i n e r ( s d ) , L i n e r ( s d ) , L i n e r ( s d )
  • A ¯ = e x p ( Δ A )
  • B ¯ = ( Δ A ) 1 ( e x p ( Δ A ) I ) · Δ B
  • h t = A ¯ h t 1 + B ¯ s d t
  • s d t ¯ = C h t 1 + D s d t
  • s d ¯ = [ s d 1 ¯ , s d 2 ¯ , , s d t ¯ , , s d L ¯ ]
  • return   s d ¯

3.3. Multi-Scale Feature Contrastive Learning

To enhance the fine-grained features of the generated images, this study introduces a contrastive learning-based strategy, as shown in Figure 6. Compared with the CUT [71] and DCLGAN [72], the proposed approach requires only one set of encoders and decoders and does not necessitate re-encoding of the images. Consequently, it demands fewer training resources.
The proposed algorithm features a generative network composed of an encoder and a decoder, with each having L stages. The input x of the encoder is represented by h 0 . After passing through the encoder, a series of encoded features of varying sizes are obtained, represented by h l 1 L = G e n c l h l 1 1 l . These encoded features are then input into the decoder, which generates a corresponding series of decoded features, expressed as h l L + 1 2 L = G d e c l h l 1 L + 1 2 L . It is important to note that the outputs from the corresponding layers in both the encoder and decoder are of equivalent dimensions. Specifically, h l and h 2 L 1 have the same size, and they can be represented by ( h l , h l ¯ ) , which signifies a pair of encoding and decoding features with identical dimensions.
As shown in Figure 6, for any pair of encoding–decoding features ( h l , h l ¯ ) , a query vector is sampled from the output feature map’s position of the decoder’s l ¯ stage, and positive samples are sampled from the corresponding positions of the encoder and from N negative samples from other locations of the encoder. Then, using a two-layer multilayer perceptron (MLP) with a shared linear layer, the query vector, positive samples, and negative samples are transformed into a K-dimensional embedding space, and vectors q , k + R K and k R K are obtained, respectively. To avoid the collapse of the contrastive learning mode, vectors q , k + R K and k R K are mapped into a unit hypersphere using the L2 normalization. Contrastive learning focuses on putting the query vector closer to the positive samples but further away from the negative samples in the embedding space, which represents a classification problem of ( N + 1 ) classes. Therefore, a cross-entropy function is used for calculation in this study. This function indicates the probability of selecting a negative sample as a positive sample, and it is defined as follows:
l C L ( q , k + , k ) = log exp ( q · k + / τ ) exp ( q · k + / τ ) + k = 1 N exp ( q · k / τ ) ,
where · denotes the dot product of vectors; τ is a temperature coefficient used to scale the distance between the query vector and the positive and negative samples. The temperature coefficient determines the degree to which the contrastive loss focuses on difficult negative samples. A higher temperature coefficient means that the model will not pay too much attention to more challenging negative samples; conversely, a lower temperature coefficient means that the model will pay more attention to difficult negative samples that have a high similarity with the sample, giving them a larger gradient to separate them from positive samples. Based on the CUT [71], DCLGAN [72], and CVIIT [52] algorithms, we set τ to 0.07.
Expanding its application to multi-scale features ( h l , h l ¯ ) can be expressed as follows:
C L ( G , H , X ) = E x X l L s S l l q l , s , k l ¯ , s + , k l ¯ , s .
Contrastive learning-based methods typically employ a random negative sampling scheme, which, to some extent, neglects the focus on difficult samples. The discriminator’s attention map for generated images represents the quality of the generated image regions, thereby providing the location of difficult samples. Based on the discriminator’s attention map, the generative network’s focus on key areas is enhanced.

3.4. Loss Function

V2IGAN is divided into two versions suitable for paired data (V2IGAN-P) and unpaired data (V2IGAN-U). The V2IGAN-P algorithm employs L1 loss, contrastive learning loss, and LSGAN loss. The V2IGAN-U algorithm incorporates identity loss, contrastive learning loss, and LSGAN loss, with the identity loss being used to stabilize the network training. Their definitions are as follows:
L 1 = | | y G ( x ) | | 1 ,
i d = | | y G ( y ) | | 1 ,
C G A N ( G , D ) = E y Y [ ( D ( y ) ) 2 ] + E x X [ ( 1 D ( G ( x ) ) ) 2 ] ,
L V 2 I G A N P = λ 1 C G A N ( G , D ) + λ 2 L 1 + λ 3 C L ,
L V 2 I G A N U = ψ 1 C G A N ( G , D ) + ψ 2 i d + ψ 3 C L ,
where L V 2 I G A N P and L V 2 I G A N U are the total loss; i d denotes identity loss; C G A N ( G , D ) is the loss of the CGAN; L 1 denotes the L1 loss; C L is the contrastive learning loss; E ( · ) denotes the expected operation; x X , and the subscript denotes data obtained from a visible light image; y Y , and the subscript denotes data obtained from the corresponding real infrared image; y represents the label information obtained from the real infrared image; D ( y ) is the probability that the discriminator can accurately determine whether real data are real; G ( x ) indicates a target-domain image (i.e., an infrared image) generated based on the source-domain image (i.e., a visible-light image); D ( G ( x ) ) is the probability that the discriminator can accurately judge whether the generated data are true; finally, λ 1 , λ 2 , and  λ 3 are the weights of the LSGAN, L1, and contrastive learning losses in V2IGAN-P, respectively. ψ 1 , ψ 2 , and  ψ 3 are the weights of the LSGAN, identity, and contrastive learning losses in V2IGAN-U, respectively.
The V2IGAN-P algorithm is shown in Algorithm 2.
Algorithm 2 Pseudo code of V2IGAN-P algorithm.
  • Input: Visible-light image x X , Real infrared image y Y , Iterations: Iter, the number of iterations for the discriminator is k D , and the number of iterations for the generator is k G ;
  • Output: Generated infrared image G ( x ) ;
  •   Initialize G and D model parameters
  •   for all  i = 1 , 2 , , I t e r  do
  •    for all  j = 1 , 2 , , K D  do
  •     Sampling a sample x from the data distribution X ;
  •     Sampling a sample y from the data distribution Y ;
  •     Update D by Equation (8)
  •    end for
  •    for all  k = 1 , 2 , , K G  do
  •     Sampling a sample x from the data distribution X ;
  •     Generated infrared image y ^ = G ( x ) ;
  •     Calculate L1 loss by Equation (6);
  •     Calculate contrastive learning loss by Equation (5);
  •     Update G by Equation (10);
  •    end for
  •   end for

4. Experimental Results

This section describes the metrics and datasets used in this study and presents the experimental results. All experiments were conducted using an Intel Core i9-10980XE CPU running @ 3 GHz on an Nvidia RTX 3090 GPU.

4.1. Datasets

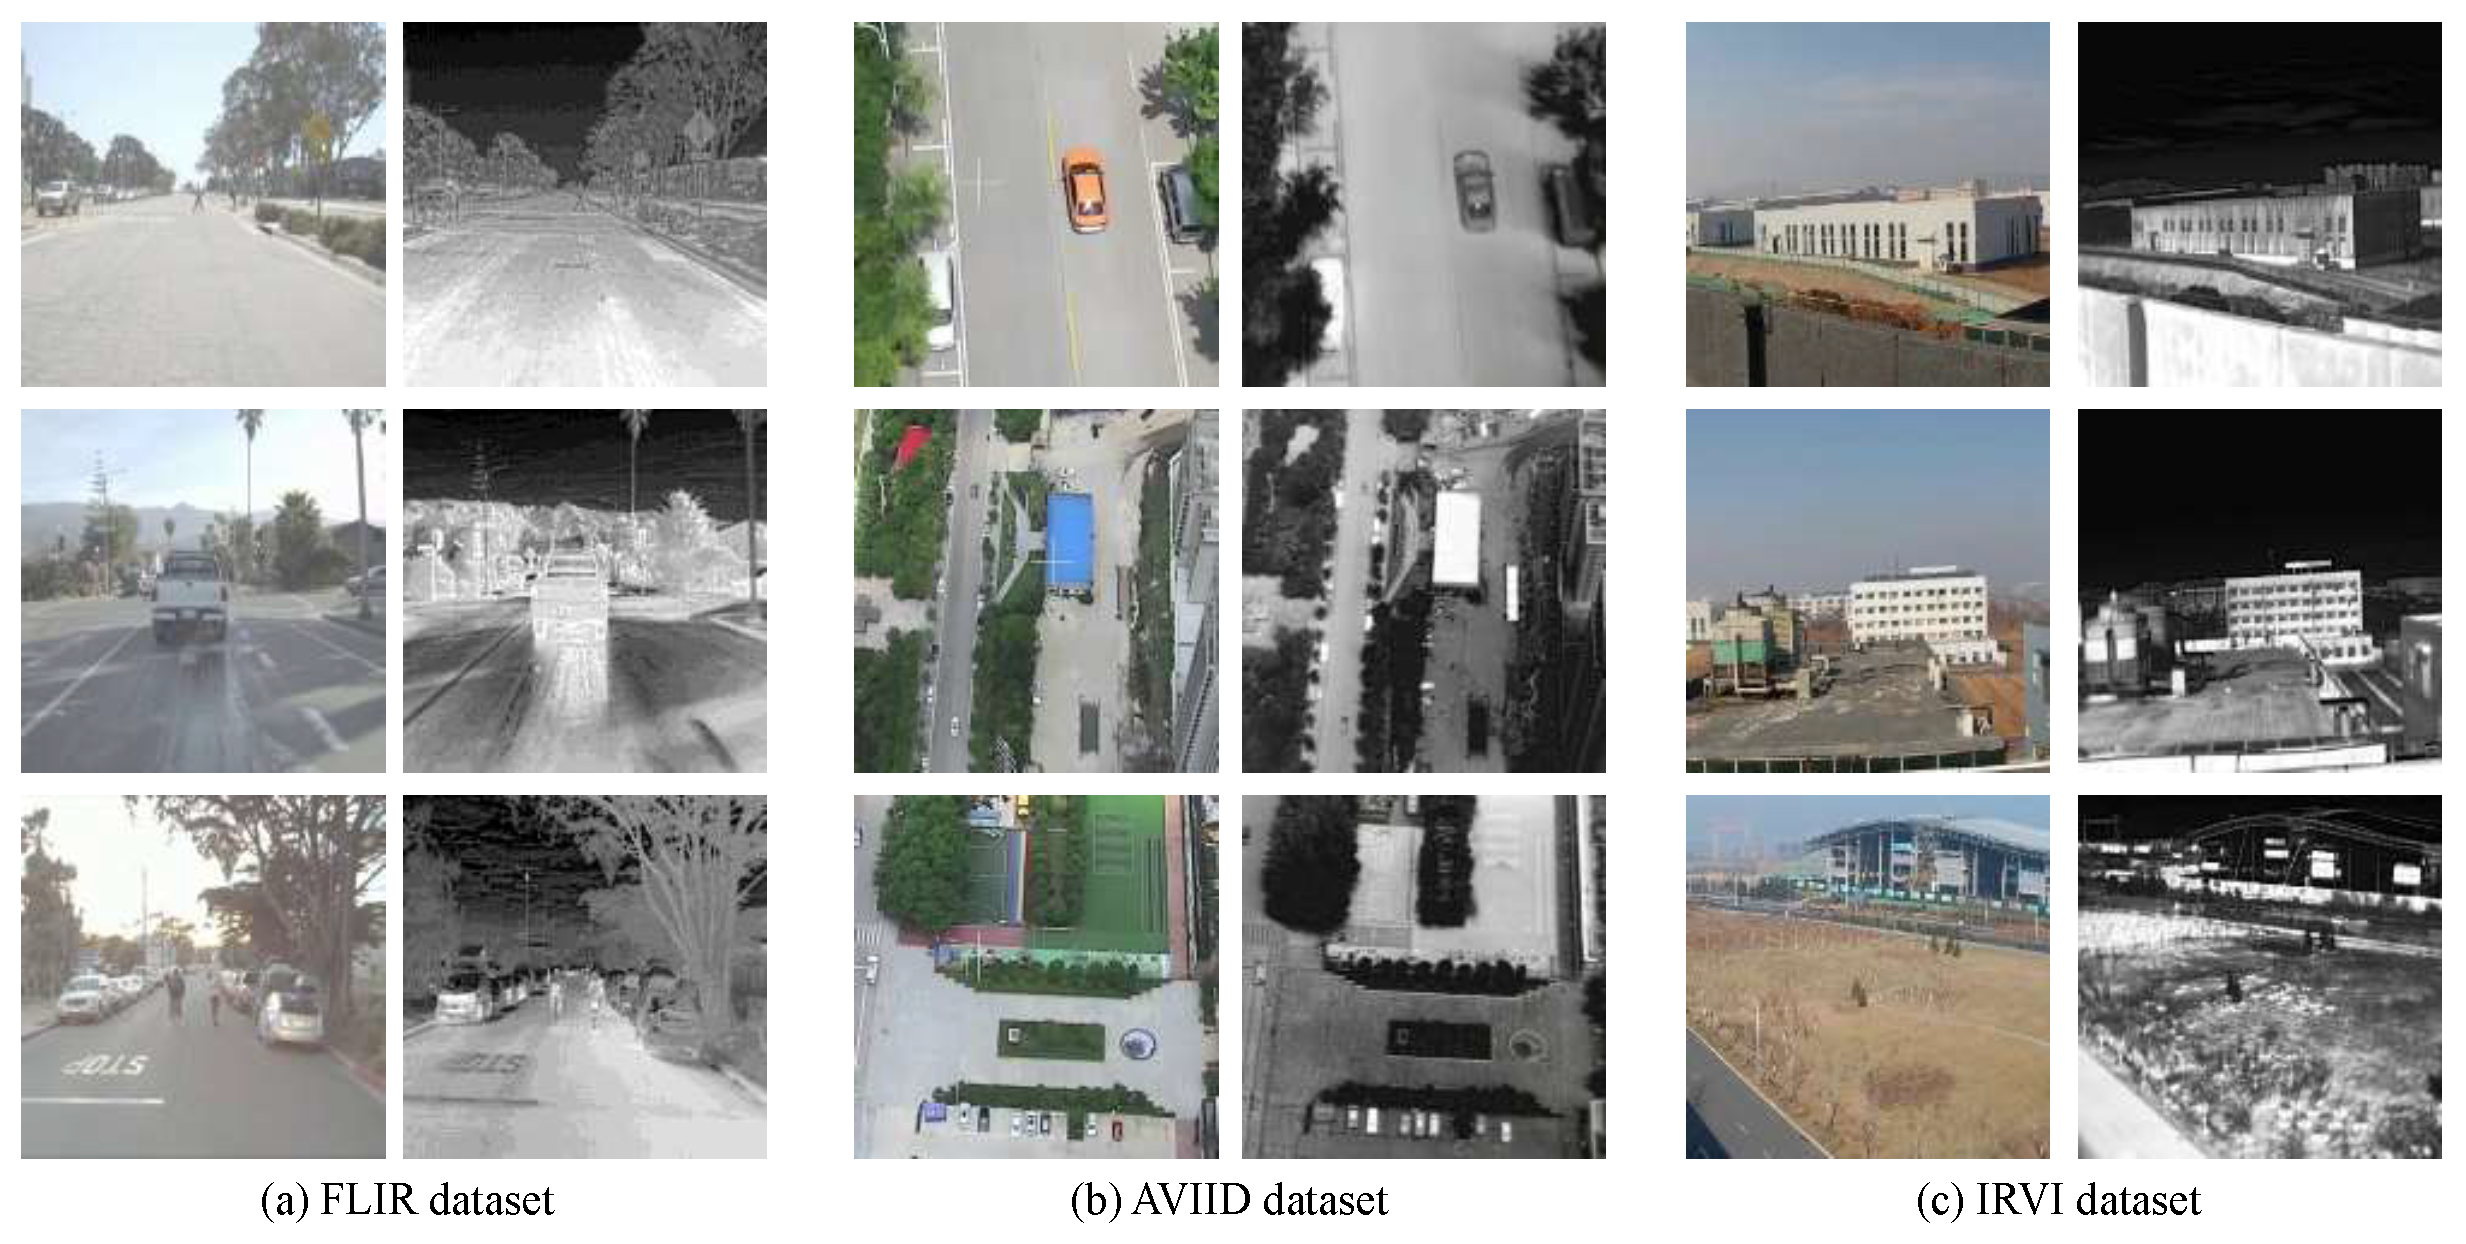
The FLIR dataset, which was published in 2018, was used for experimental verification in this study. This dataset includes images taken on streets and highways, with infrared wavelengths being long-wave. It should be noted that 9620 pairs of IR–visible-light images from the original FLIR dataset were misaligned; therefore, we performed experiments using the aligned FLIR dataset published by Zhang et al. [75]. The image data were selected and aligned from the original FLIR dataset, totaling 5142 pairs of images; 4118 image pairs were used for training, and 1024 image pairs were used for testing. The images with the black bars were cropped and scaled to the size of 256 × 256. The FLIR dataset was used to verify the authenticity of the infrared image generation of the algorithm presented in this paper in the field of autonomous driving. Some samples of the FLIR dataset are shown in Figure 7a.
The Aerial Visible-to-Infrared Image Dataset (AVIID) [76] is a dataset specifically designed for the task of translating aerial visible light images into infrared images. This dataset was created by researchers from Northwestern Polytechnical University, and it consists of over 3000 pairs of matched visible-light and long-wave infrared images. This dataset provides researchers with a valuable data resource for assessing and improving the performance of algorithms for visible-to-infrared image translation in the aerial domain. For experiments, this study selected the most complex subset of the dataset denoted by AVIID-3. Compared with AVIID-1 and AVIID-2, this dataset contains more types of vehicles and numerous targets of multiple densities, viewpoints, and scales. In addition, AVIID-3 was collected in various scenarios with more complicated backgrounds, including roads, bridges across rivers, parking lots, and streets of residential communities. Therefore, this dataset is more challenging for aerial visible-to-infrared image translation and can be better used to evaluate the performance of different methods. During the experimental process, all images were resized to the dimension of 256 × 256 pixels, with 1024 pairs used for training and 256 pairs for testing. The AVIID dataset was used to verify the authenticity of the infrared image generation of the algorithm presented in this paper in the field of UAV remote sensing. Some samples of the AVIID dataset are shown in Figure 7b.
The IRVI dataset is a dataset designed for infrared-to-visible-light video translation tasks. It contains continuous video clips of traffic and surveillance scenes collected using long-wave infrared cameras, covering low-light conditions and suitable for the fields of autonomous driving and security, with a resolution of 256 × 256. It is aimed at improving the visual signal effect under night or adverse weather conditions. We selected the surveillance scenes from it for the visible-light-to-infrared image translation task. To reduce the redundancy of the target scene images, a total of 1016 pairs of images were used for training, and 255 pairs of images were used for testing. The IRVI dataset was used to verify the performance of the algorithm in the field of surveillance security. Some samples of the IRVI dataset are shown in Figure 7c.

4.2. Implementation Details

The improvements of the V2IGAN-P and V2IGAN-U methods are based on the Pix2Pix and CUT frameworks, respectively. All experiments were conducted using the publicly available source codes and datasets for training and testing in the same experimental environment to provide a fair comparison. It is worth noting that the ThermalGAN algorithm only uses visible light as input. The Adam optimizer was selected, and β 1 and β 2 were set to 0.5 and 0.999, respectively. A total of 200 training epochs were performed to ensure model convergence. The learning rates of the generative and adversarial networks were set to 0.0002 and 0.000002, respectively. In the first 100 epochs, the learning rates were fixed, and then, they decreased linearly to zero. All networks were trained from scratch with random initialization. The experimental parameters for V2IGAN-P were set according to the IR-GAN [47] algorithm as follows: λ 1 = 1, λ 2 = 100, and λ 3 = 10. The experimental parameters for V2IGAN-U were set according to the CVIIT [52] algorithm as follows: ψ 1 = 1, ψ 2 = 10, and ψ 3 = 10.

4.3. Image Quality Evaluation Metrics

Image quality assessment was conducted using a set of established metrics, each of which was used to evaluate different aspects of image fidelity and perceptual quality. The five metrics used in this study included the following:
  • (1) Peak signal-to-noise ratio (PSNR) [77]: This is a traditional measure that quantifies the maximum possible signal-to-noise ratio of an image, and it has often been used to assess the quality of reconstructed and compressed images.
    The PSNR is expressed as follows:
    P S N R ( I , S ) = 10 l o g ( 2 n 1 ) 2 M S E ( I , S ) ,
    where
    M S E ( I , S ) = 1 M N x = 1 M y = 1 N ( I ( x , y ) S ( x , y ) ) 2 ,
    where I is a real IR image, S is a simulated IR image, and M and N are the height and width of the images, respectively.
  • (2) Structural Similarity Index Measure (SSIM): This is a perceptual image quality metric that compares local patterns of pixel intensities to evaluate the similarity between two images.
    The SSIM can be defined as
    S S I M ( I , S ) = 2 μ I μ S + C 1 μ I 2 + μ S 2 + C 1 2 σ I σ S + C 2 σ I 2 + σ S 2 + C 2 σ I S + C 3 σ I σ S + C 3 = 2 μ I μ S + C 1 μ I 2 + μ S 2 + C 1 σ I S + C 3 σ I 2 + σ S 2 + C 2 ,
    where C 1 = ( 0.01 L ) 2 , C 2 = ( 0.03 L ) 2 , and C 3 = C 2 / 2 are parameters used to ensure the stability of a partition; μ I and μ S are the respective means of I and S; σ I and σ S are their respective standard deviations; σ I S is the covariance of I and S; and L is the range of image pixels.
  • (3) Multi-Scale Structural Similarity Index Measure (MS-SSIM) [78]: This metric represents an extension of the SSIM that operates on multiple scales, providing a more comprehensive assessment of image quality by capturing both local and global changes.
    The MS-SSIM is defined as
    M S S S I M ( I , S ) = [ l M ( I , S ) ] α M j = 0 M [ c j ( I , S ) ] β j [ s j ( I , S ) ] γ j ,
    where l M ( I , S ) , c j ( I , S ) , and s j ( I , S ) are the brightness, contrast, and structural similarity, respectively; and α M , β j , and γ j are weight coefficients for l M ( I , S ) , c j ( I , S ) , and s j ( I , S ) , respectively. To simplify parameter selection, α j = β j = γ j , j = 1 M γ j = 1 , and M = 5 .
  • (4) Learned Perceptual Image Patch Similarity (LPIPS) [79]: This is a recently developed metric that leverages deep learning to measure the perceptual difference between image patches. It has been proposed to provide a closer correlation with human perception of image quality.
    The LPIPS is calculated as
    L P I P S ( I , S ) = l L 1 H l W l H l , W l [ f l ( I ) H l , W l f l ( S ) H l , W l ] 2 ω 1 .
    To calculate this, comparative features were obtained from a convolutional neural network-based backbone and pretrained on ImageNet (the AlexNet network model was used in the experiment).
  • (5) Fréchet Inception Distance (FID) [80]: This metric is derived from the field of machine learning, and it measures the distance between two statistical distributions of features extracted by the Inception-V3 Network, providing insight into the quality of generated images in a generative model.
    The FID is calculated as
    F I D ( I , S ) = | | μ I μ S | | 2 + T r ( σ I + σ S 2 σ I σ S ) ,
    where μ I and μ S are the respective mean vectors of the real and generative data distributions, with covariance matrices of σ I and σ S , respective; T r is the trace of the matrix; and | | · | | is the binary norm of the vector.
The five selected metrics could collectively provide a multidimensional evaluation of image quality, encompassing both pixel-level accuracy and higher-level perceptual attributes.

4.4. Simulation Evaluation of Infrared Image Generation Quality

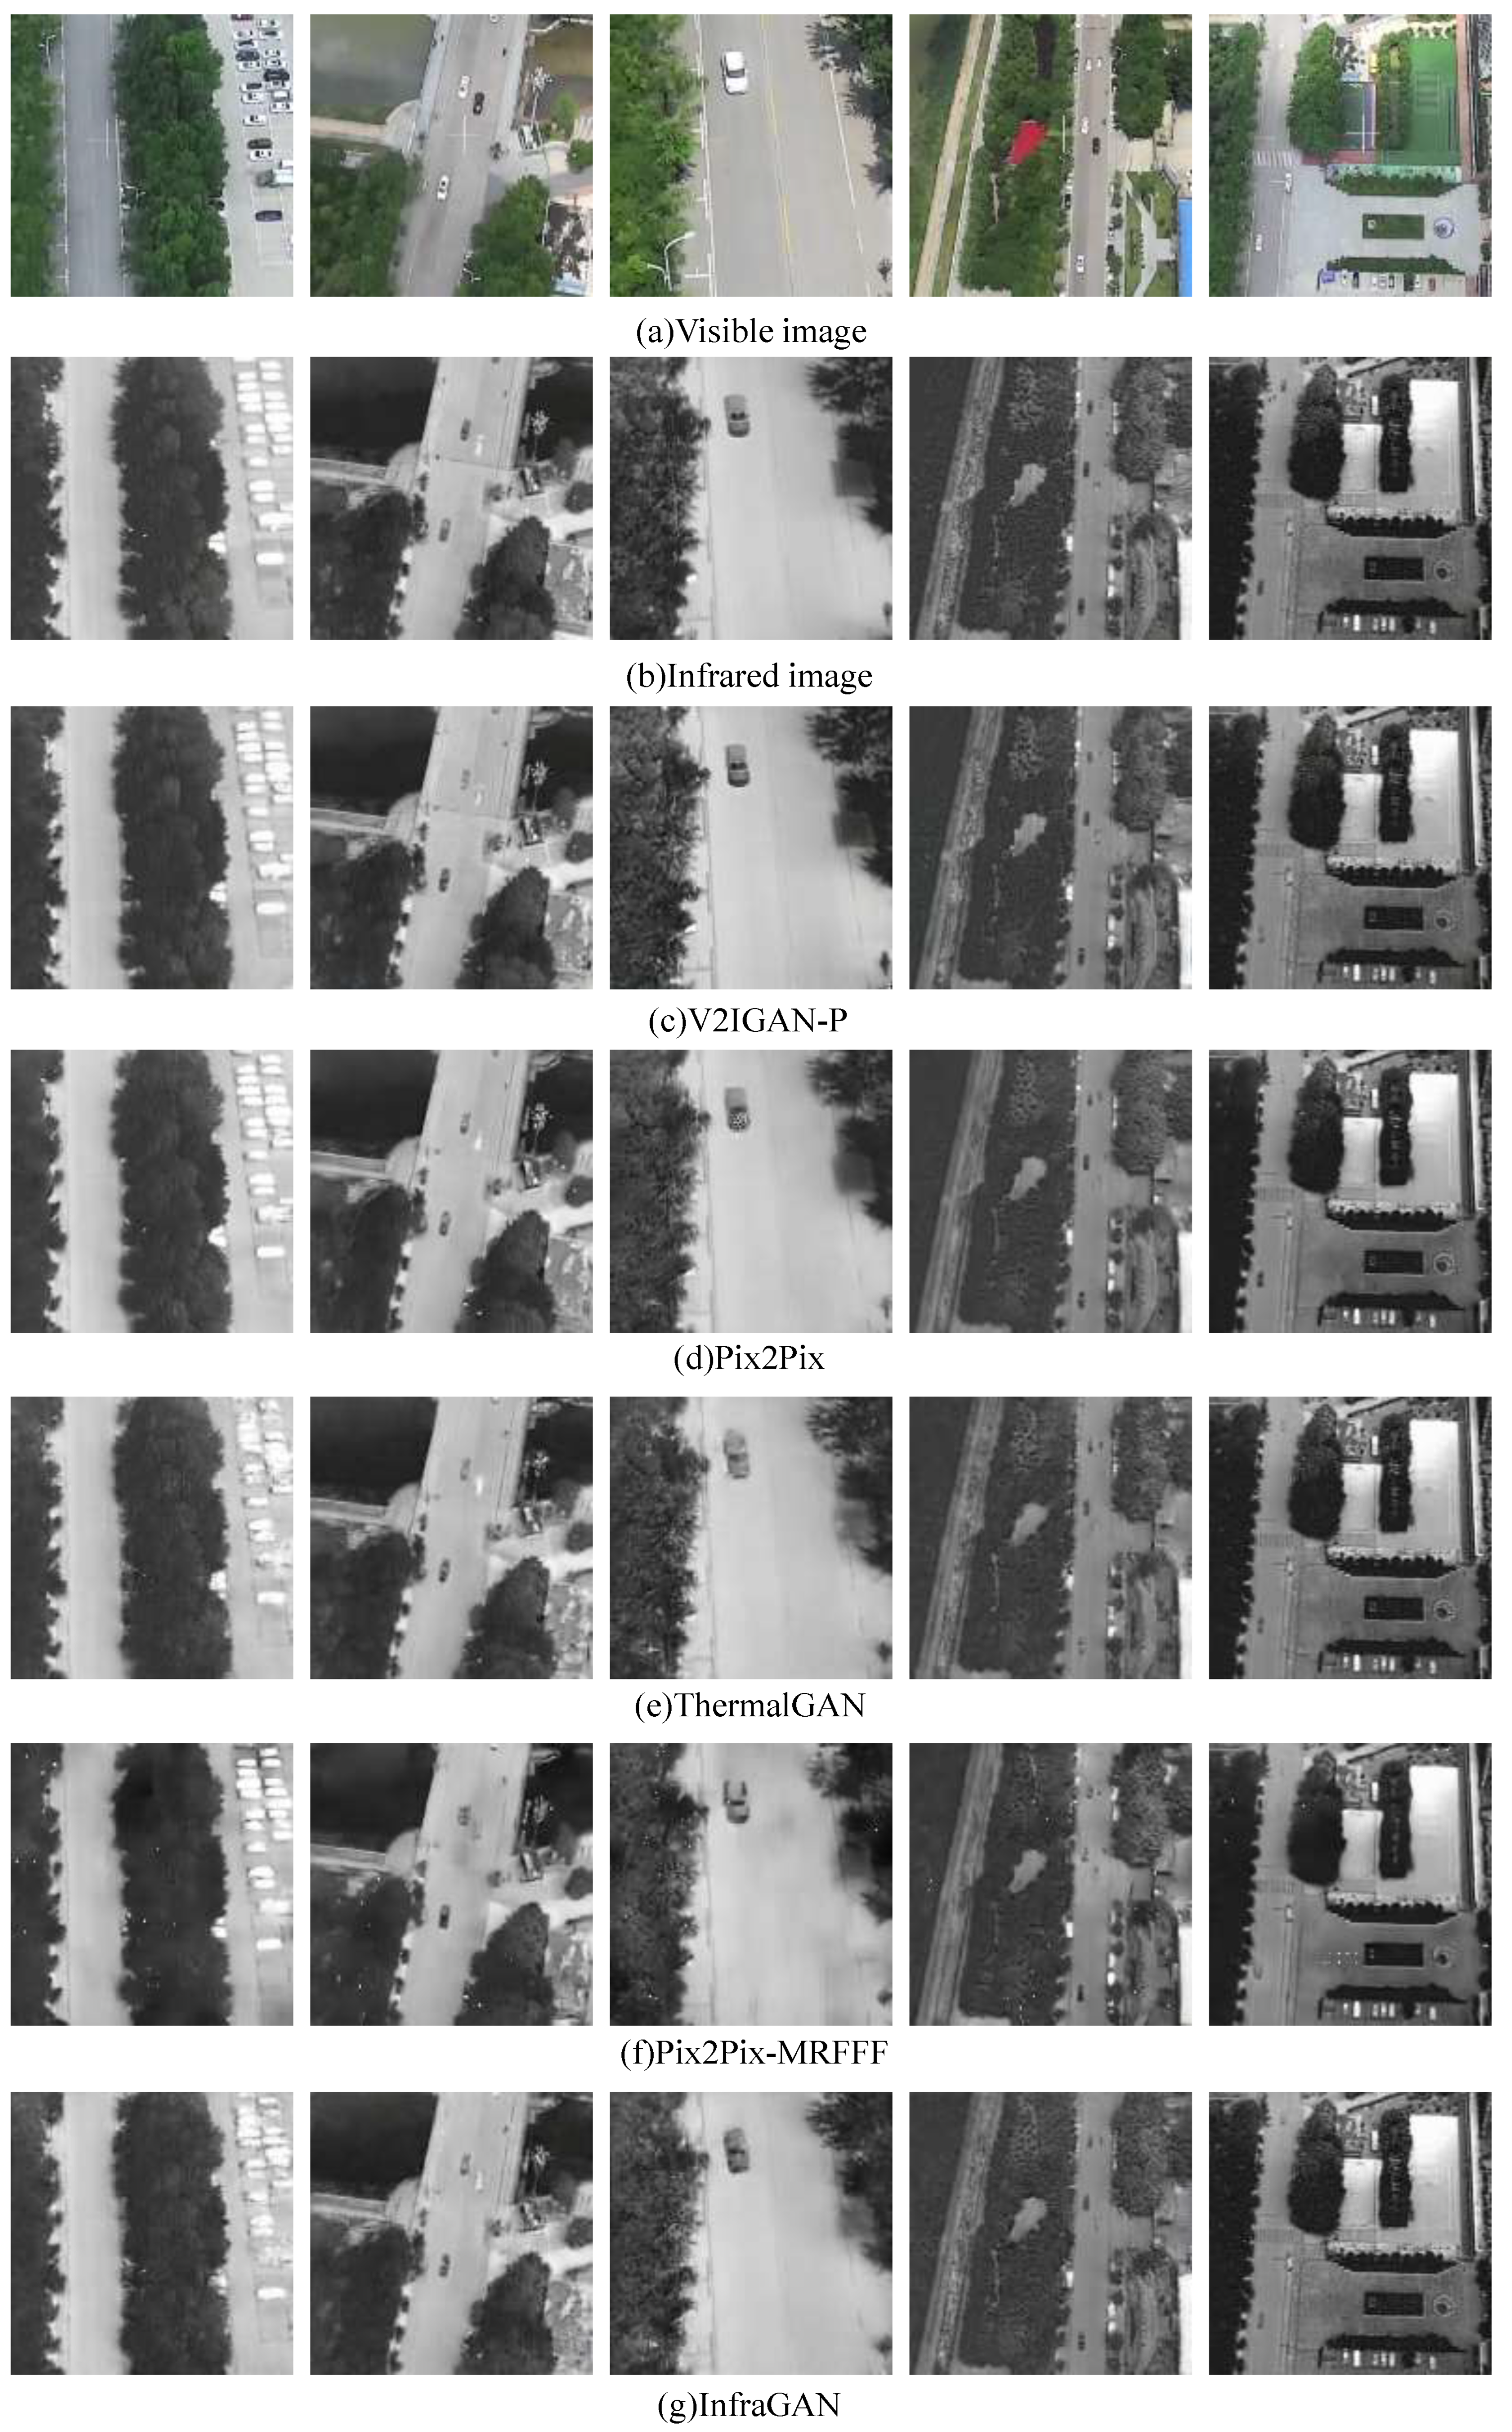
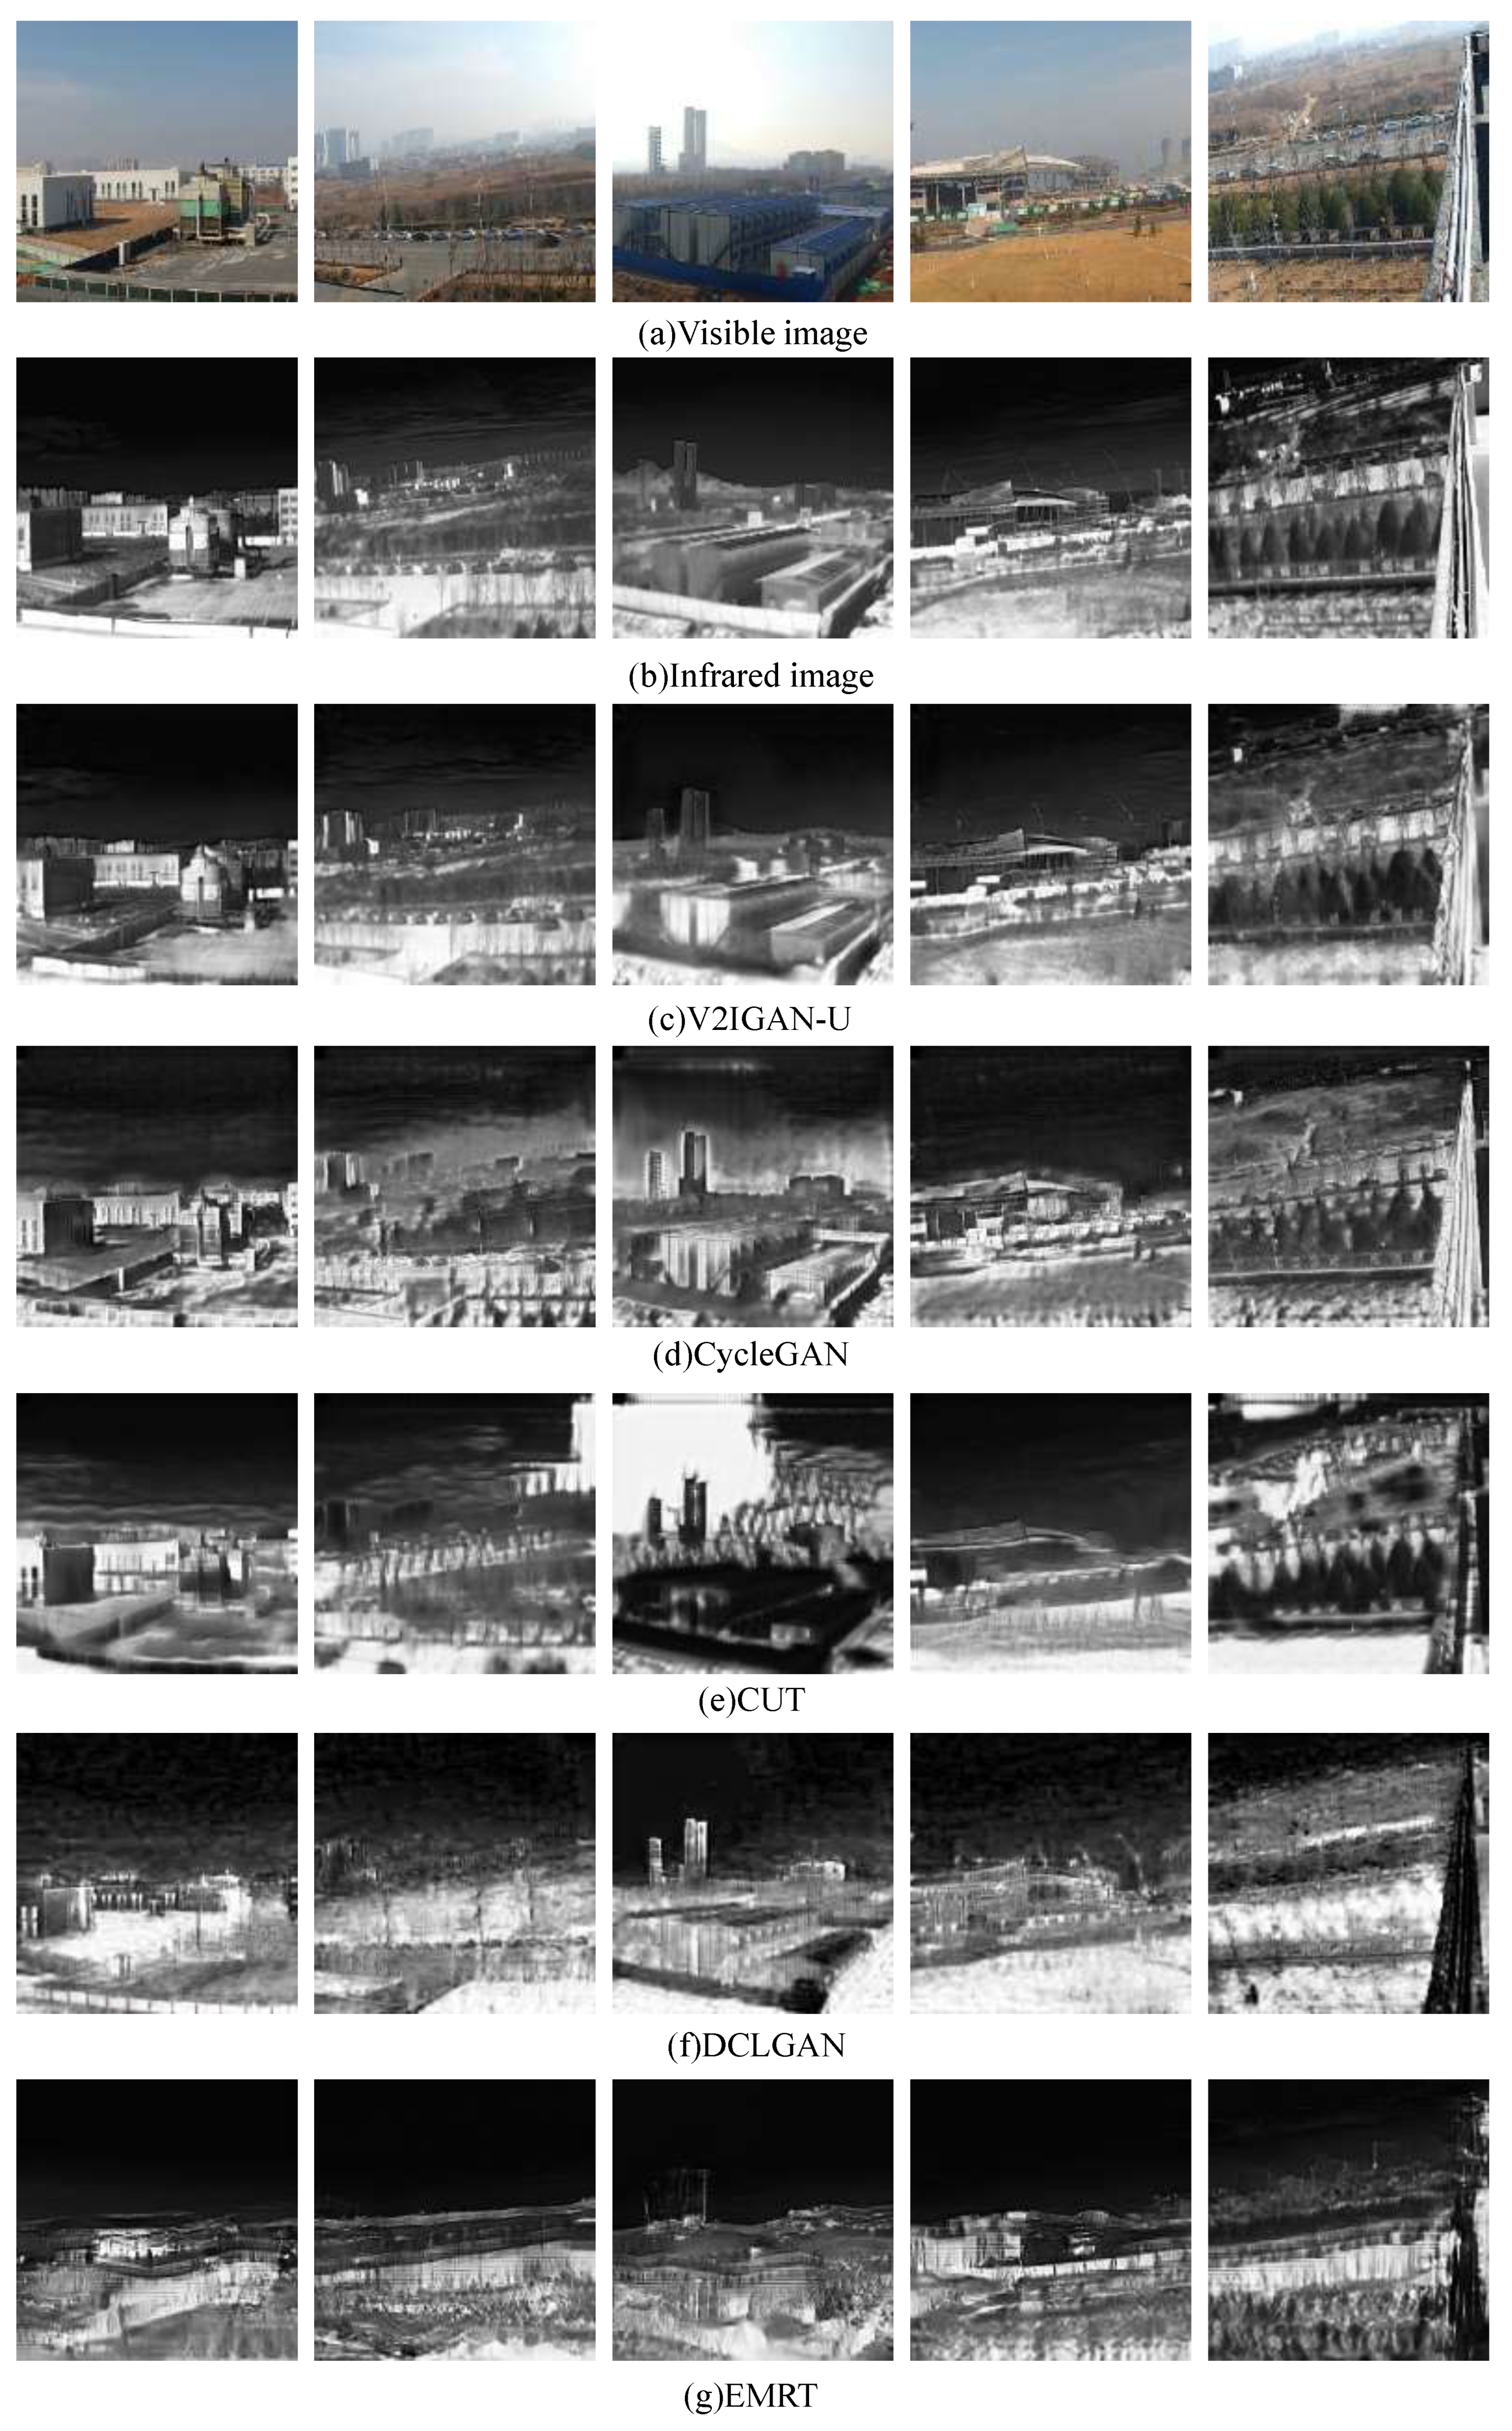
Figure 8, Figure 9 and Figure 10 show the examples of infrared images generated on three datasets. The results obtained on the FLIR dataset are presented in Figure 8. It can be seen that the infrared images generated by V2IGAN-P retain more detailed information than those obtained by Pix2Pix, ThermalGAN, and Pix2Pix-MRFFF. In addition, compared with the infrared images generated by ThermalGAN, Pix2Pix-MRFFF, and InfraGAN, the images created by the proposed method exhibit clearer texture information and more realistic gray-scale details. However, all algorithms perform poorly on the FLIR dataset, which could be attributed to the significant variations in the light and shadow in the visible-light images from the FLIR dataset. The results on the AVIID dataset are presented in Figure 9, where it can be seen that the proposed algorithm could generate a clearer outline of the infrared image than the other methods. The infrared images generated by the algorithm in this paper retain more detailed information and distinct contour information for small targets. Integrating the results from Figure 8 and Figure 9, it is evident that the Pix2Pix algorithm experiences severe loss of detail in the generated infrared images, which is attributed to the limited capability of the generative network. The ThermalGAN and Pix2Pix-MRFF algorithms improved the generative network based on the UNet architecture; however, the lack of constraints on the edge structure of the generated images leads to edge distortion in the infrared images. InfraGAN enhanced the constraint on the edge information of the generated images by introducing the SSIM loss, but the discrimination added by the UNet architecture increases the training burden. The results of the IRVI dataset are presented in Figure 10. The V2IGAN-U method generated infrared images with clearer edges and richer textures compared to other unpaired algorithms. However, the infrared images generated by other algorithms had disordered textures, and there were noticeable errors in the expression of infrared features. The algorithm presented in this paper enhanced the generative network’s capabilities by incorporating the visual state space structure, and the introduction of the contrastive learning loss strengthened the network’s perception of fine-grained details in the images, resulting in the best visual outcomes on both datasets. We also conducted a quantitative evaluation of the proposed V2IGAN method to analyze its performance.
The results in Table 1 indicate that the metrics in the figure are the average results of the test set, and the proposed algorithm achieved the best results in all five metrics. In the table, an upward arrow indicates that the larger the metric, the better the image quality, while a downward arrow indicates that the smaller the metric, the better the image quality. Boldface fonts represent the best values obtained. This suggests that the proposed algorithm is highly competitive in the generation of infrared images. V2IGAN-P achieved a PSNR value of 23.0628 and an SSIM value of 0.6417 on the FLIR dataset. Compared to the results of Pix2Pix and ThermalGAN, the SSIM was improved by approximately 3% and 2%, respectively, and the MS-SSIM was improved by about 6% and 3%, respectively. The larger increase in MS-SSIM compared to SSIM indicates that the algorithm has a good generation effect on the fine-grained details of the image. The LPIPS and FID values were 0.2636 and 122.9724, respectively, indicating that the infrared data generated by the algorithm on the FLIR dataset had a high degree of realism. On the AVIID dataset, V2IGAN-P achieved a PSNR value of 28.0679 and an SSIM value of 0.8376. Compared to the results of Pix2Pix and ThermalGAN, the SSIM was improved by approximately 4% and 8%, respectively, and the MS-SSIM was improved by about 5% and 9%, respectively. The LPIPS and FID values were 0.1211 and 71.0606, respectively, indicating that the infrared data generated by the algorithm on the AVIID dataset had a high degree of realism. On the IRVI dataset, V2IGAN-U achieved a PSNR value of 14.9734 and an SSIM value of 0.3876. Comparing the results of the V2IGAN-U and V2IGAN-P algorithms, it can be observed that the results on unpaired data are relatively poorer than those on paired data. Additionally, the table displays the training and inference times of the model. The training and inference times of the V2IGAN model are acceptable.
Based on the results of both subjective visual assessment and objective metric evaluation, the proposed algorithm demonstrated the best performance on both the FLIR, AVIID, and IRVI datasets.

4.5. Ablation Study

Next, ablation experiments were conducted on the AVIID dataset to verify the effectiveness of combining the visual state space and contrastive learning loss. The ResNet_9 block was used as a baseline generation network, and the PatchGAN model was employed as an adversarial network. The loss functions included the LSGAN and L1 losses. Similarly, the five metrics were used to evaluate the quality of image generation. In this context, “baseline” refers to the Pix2Pix algorithm.
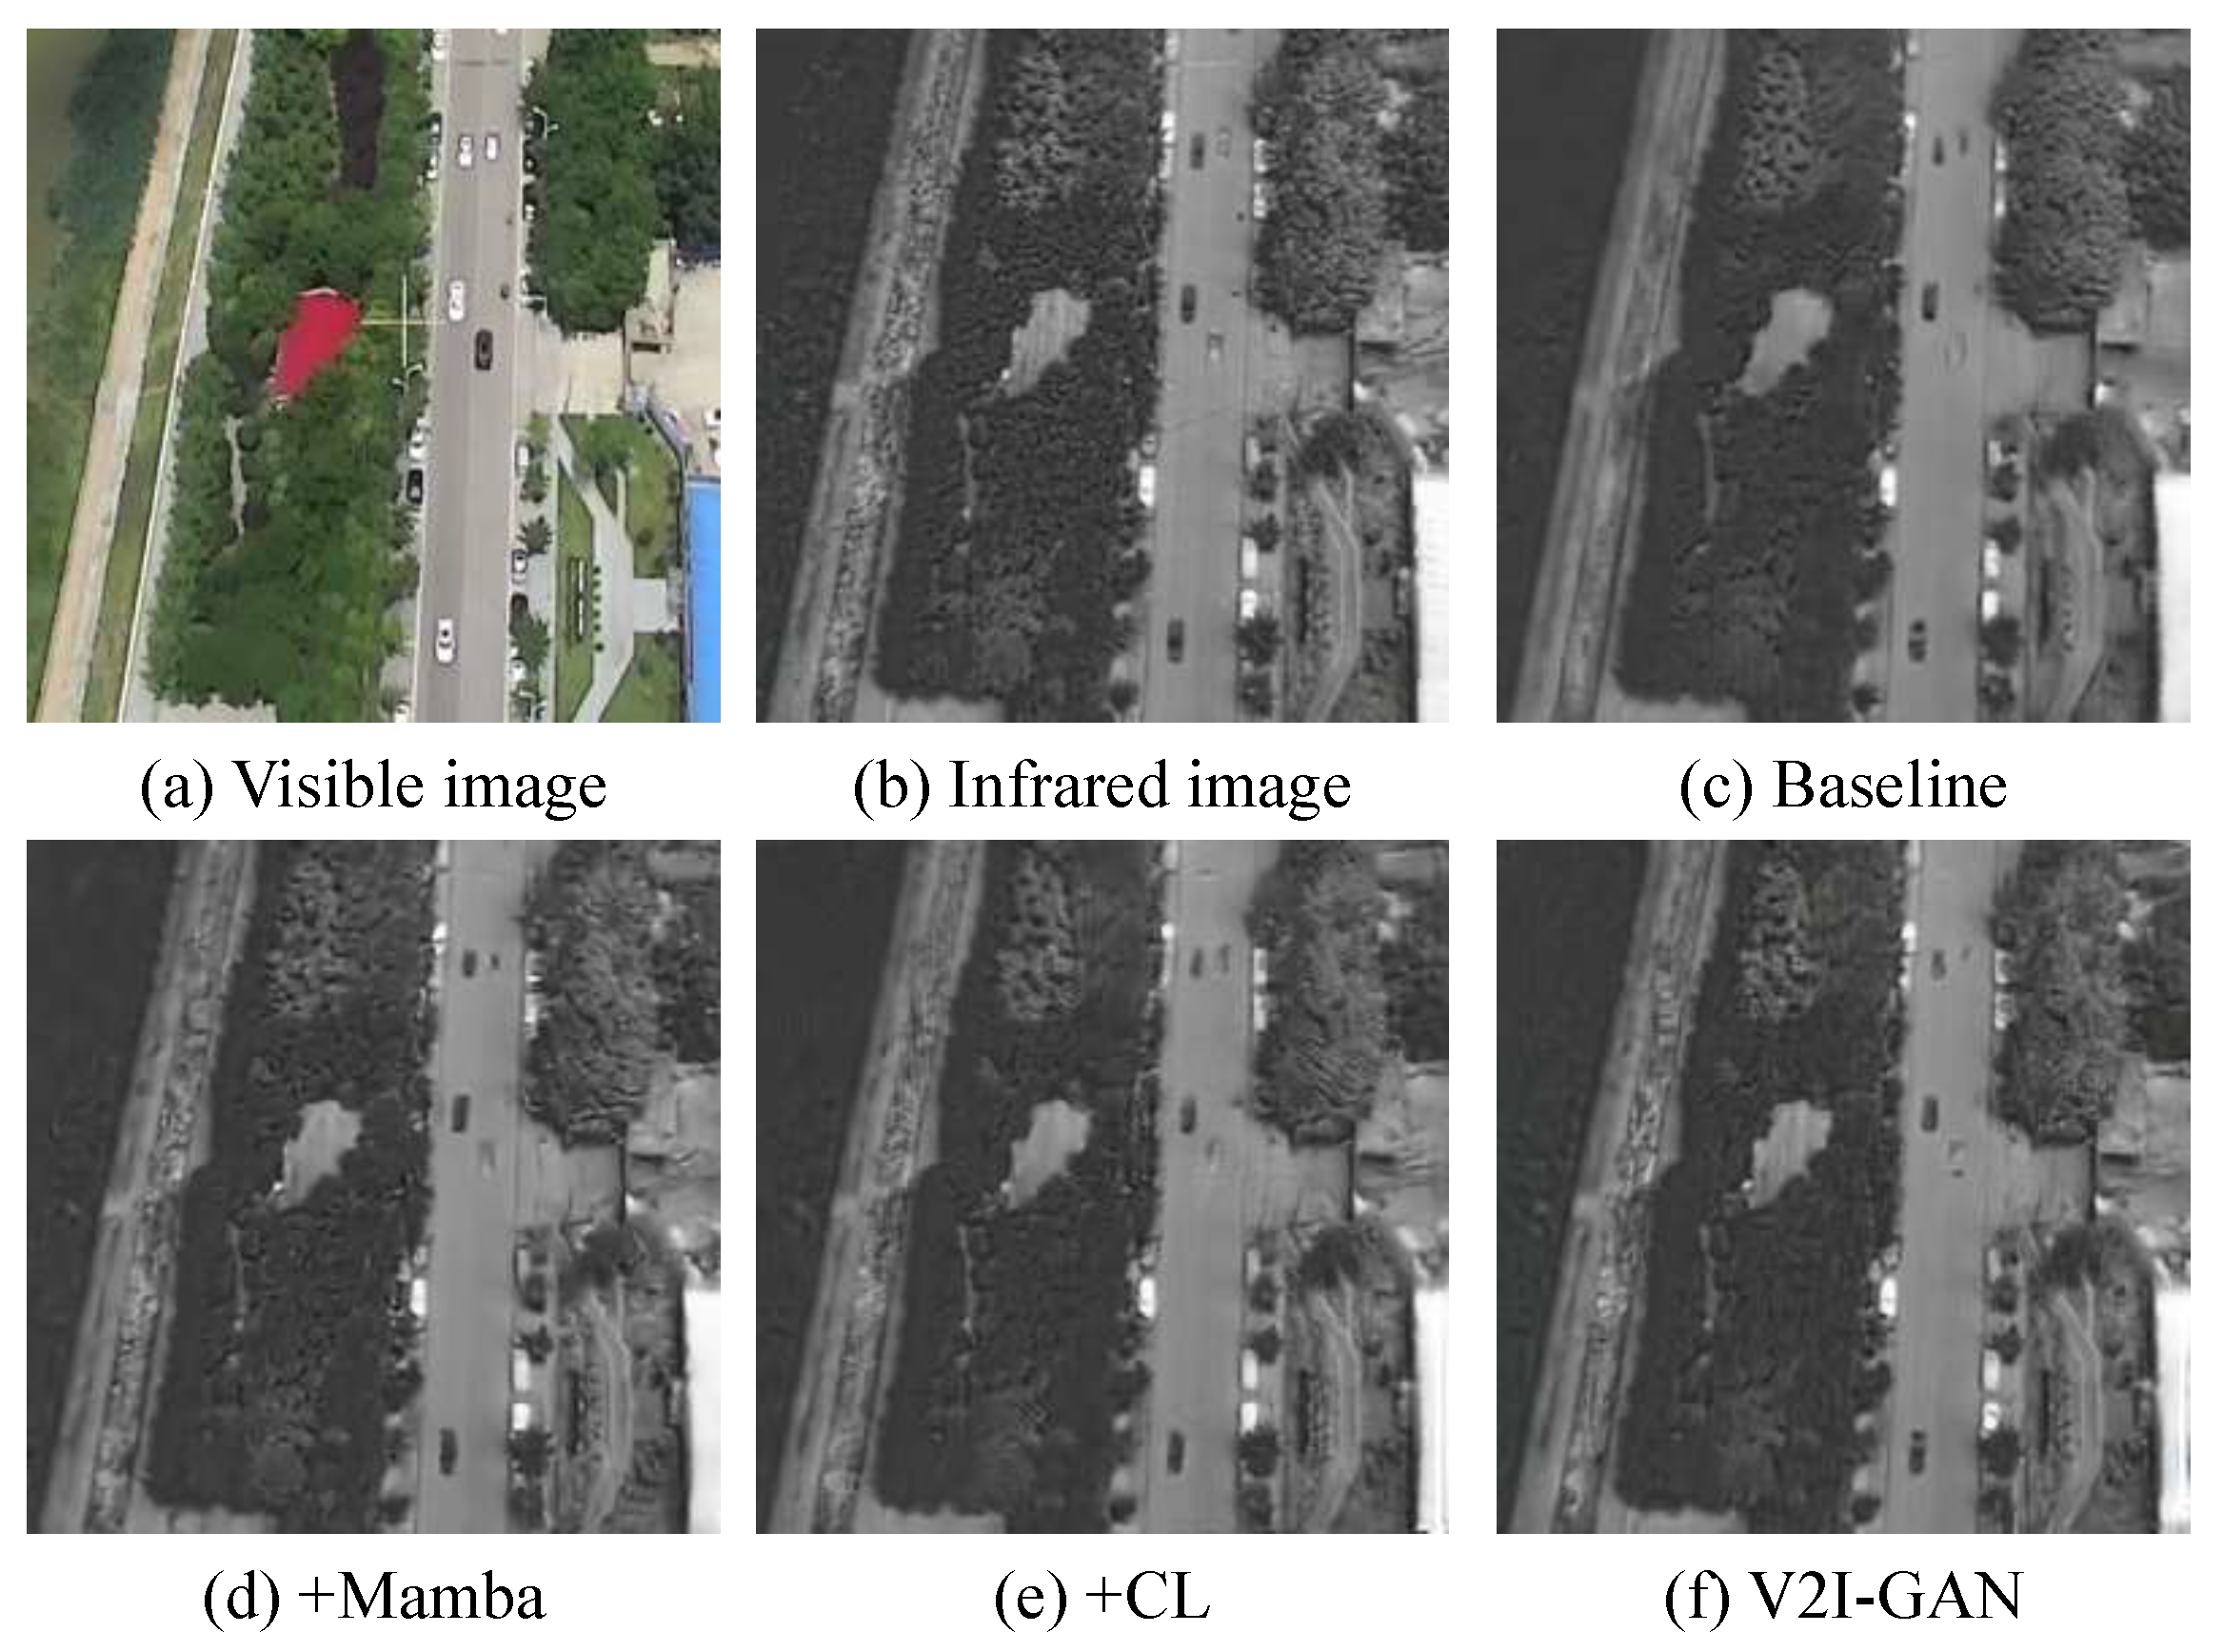
Figure 11 presents a specific example of image generation. From Figure 11c, it can be observed that the image generated by the baseline suffers from severe detail loss and is relatively blurry. As shown in Figure 11d, after incorporating the visual state space attention module, it is noticeable that the details of the generated infrared image are largely preserved. As depicted in Figure 11e, when only the contrastive learning loss is added, it is evident that an infrared image with richer details is generated, but there is a phenomenon of texture loss. As illustrated in Figure 11f, the infrared image generated by our method, compared to the Baseline result, has clearer textures and richer details.
As shown in Table 2, the addition of the visual state space and contrastive learning loss improved the five indicators to different extents. When both strategies were added simultaneously, the proposed method achieved the best results on the AVIID dataset. This indicated that both the visual state space attention module and the contrastive learning loss were effective. When only the visual state space attention module was added, the results in the table show that the SSIM and MS-SSIM values increased by about 2% and 3%, respectively. When only the contrastive learning loss was added, the SSIM and MS-SSIM values increased by about 0.5% and 2%, respectively. It can be observed that the improvement in the MS-SSIM indicator is greater than the improvement in the SSIM indicator, indicating that the generation effect on multiple scales of the image was enhanced. When both strategies were employed, it was found that compared to the baseline results, the SSIM indicator improved by about 4%, and the MS-SSIM indicator improved by about 5%, indicating that the addition of the visual state space attention module and the contrastive learning loss complement each other, achieving the best indicator results.

5. Discussion

In this study, we observe that the VSS attention module and the contrastive learning loss play important roles. The VSS attention module, which processes information selectively, encourages the generative network to pay more attention to the important features of visible-light images. As shown in Table 1, the addition of the VSS attention module improved all five metrics. Similarly, the contrastive learning loss, through the construction of positive and negative sample pairs, enhanced the feature representation of the images, thus improving the details of the generated images. As shown in Table 1, after the introduction of the contrastive learning loss, the improvement in the MS-SSIM metric was larger than that in the SSIM metric, indicating that contrastive learning effectively improved the fine granularity of the images.
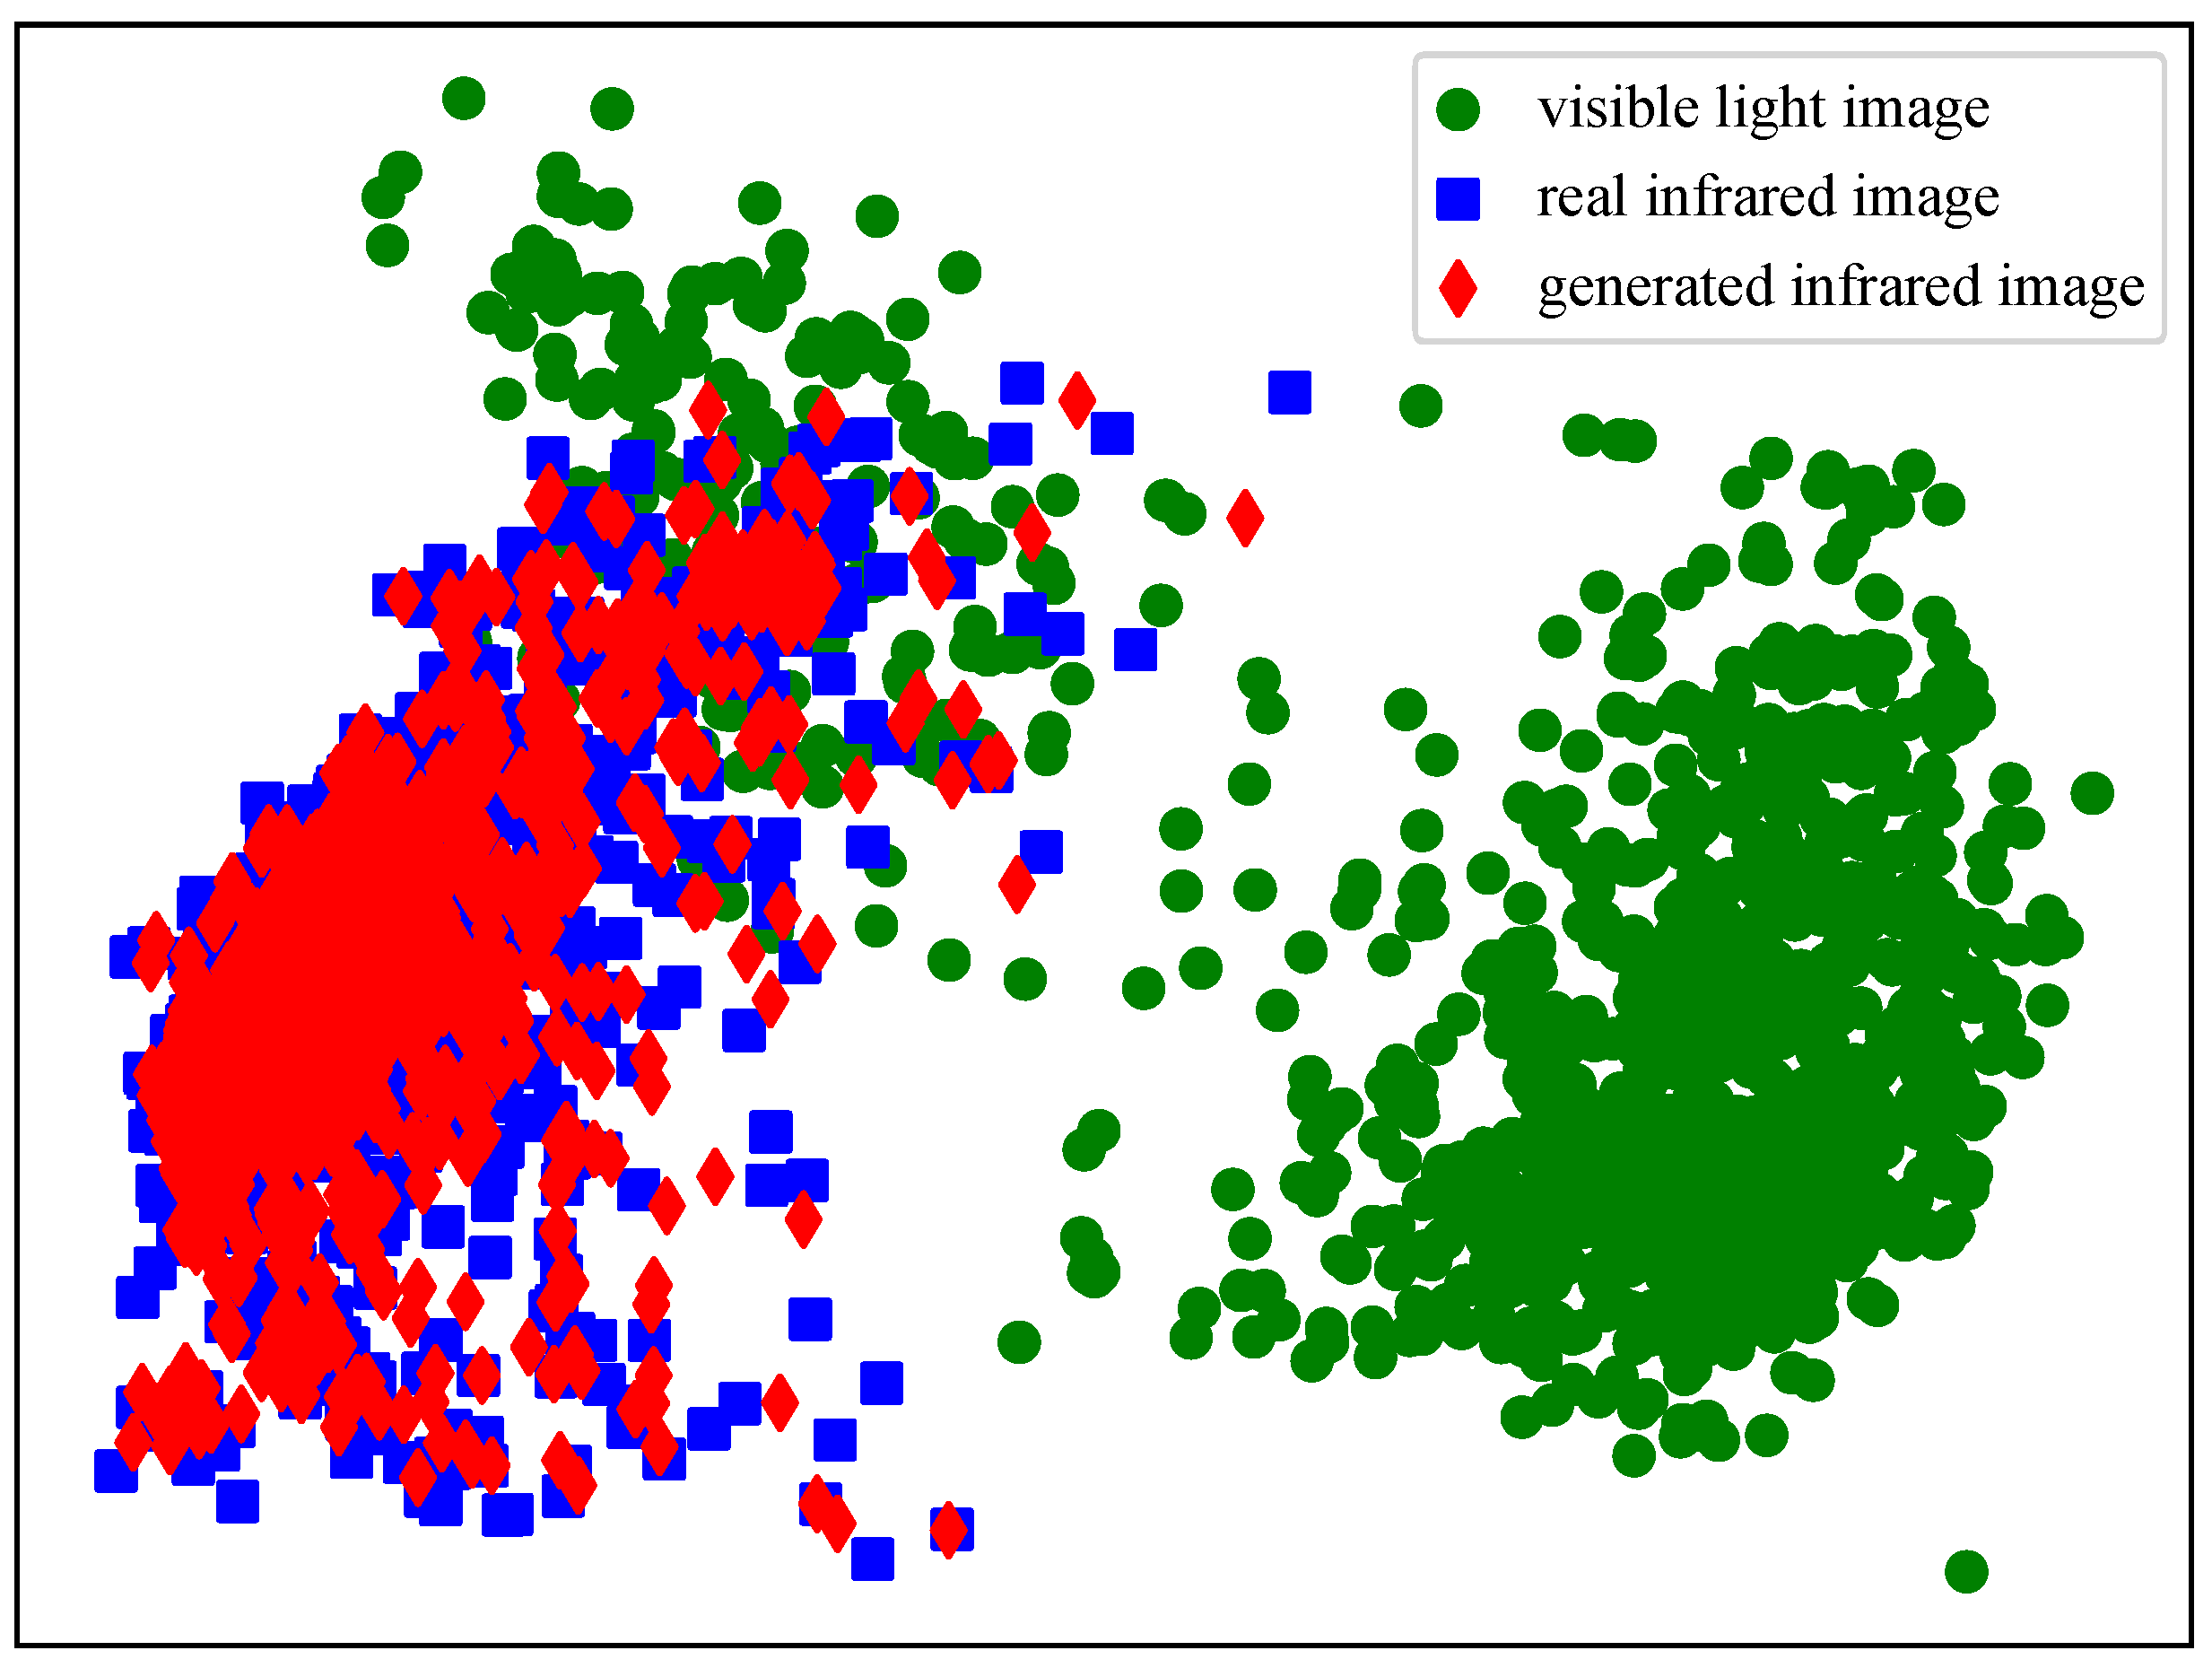
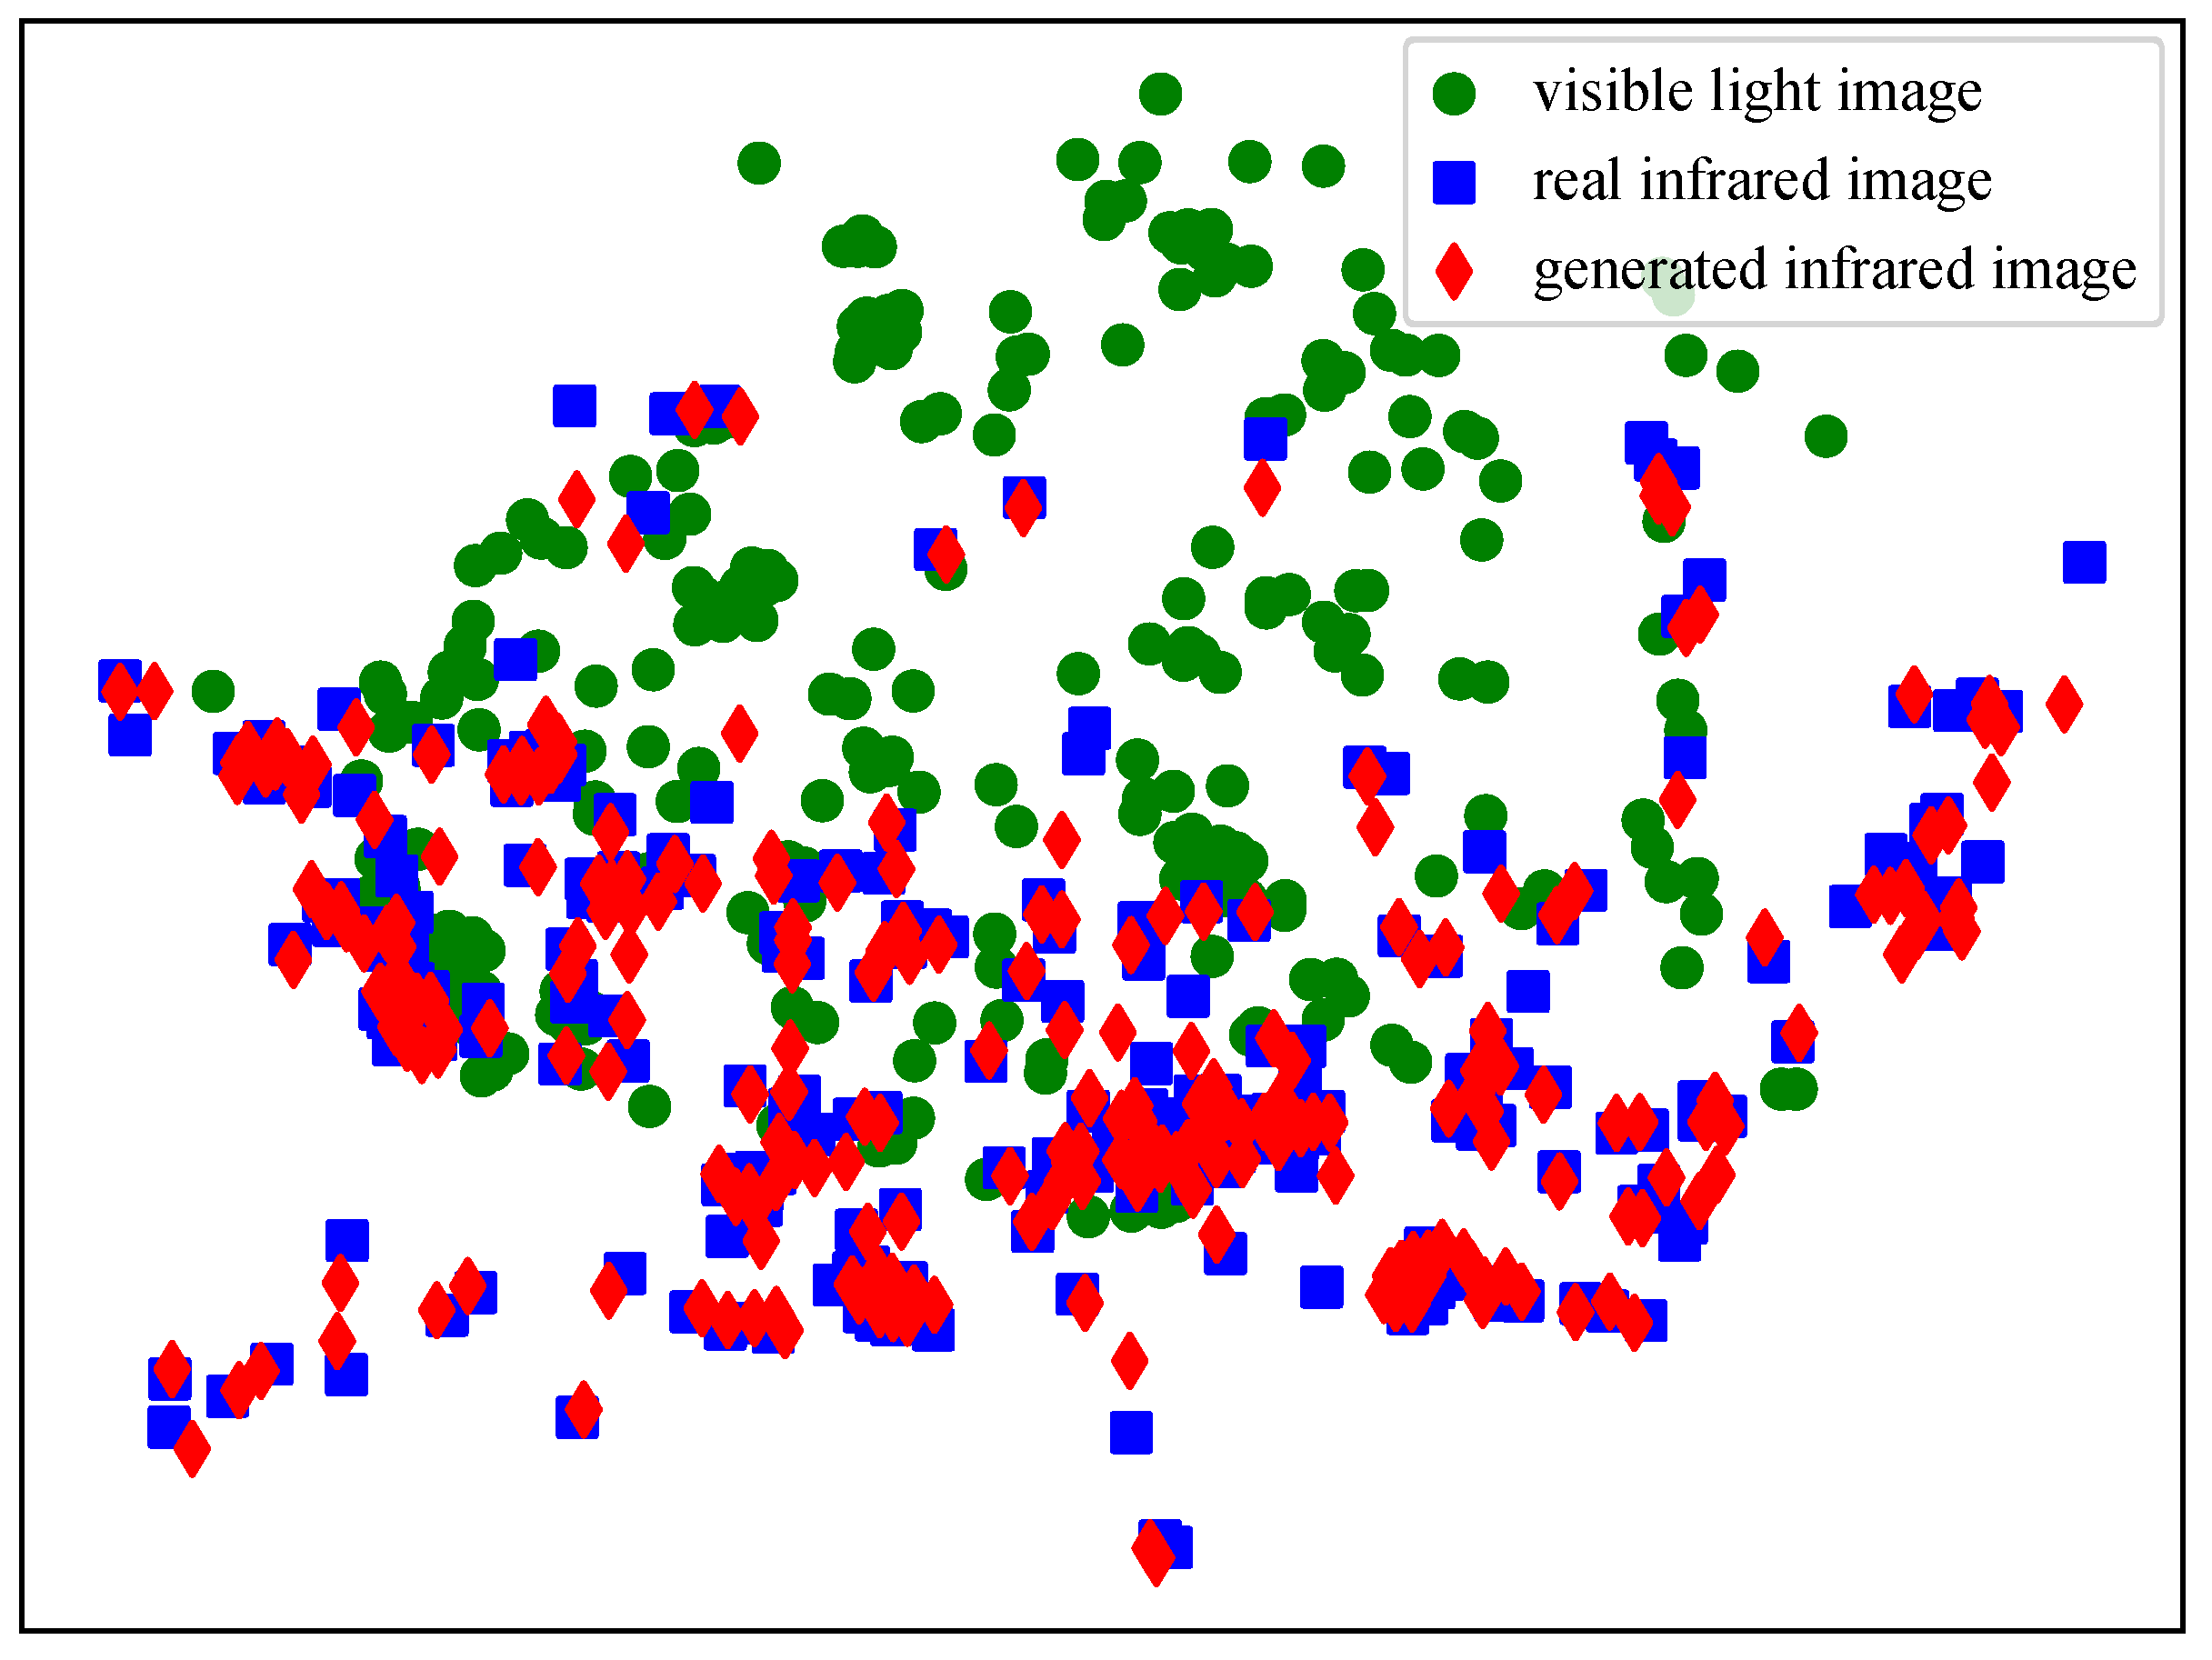
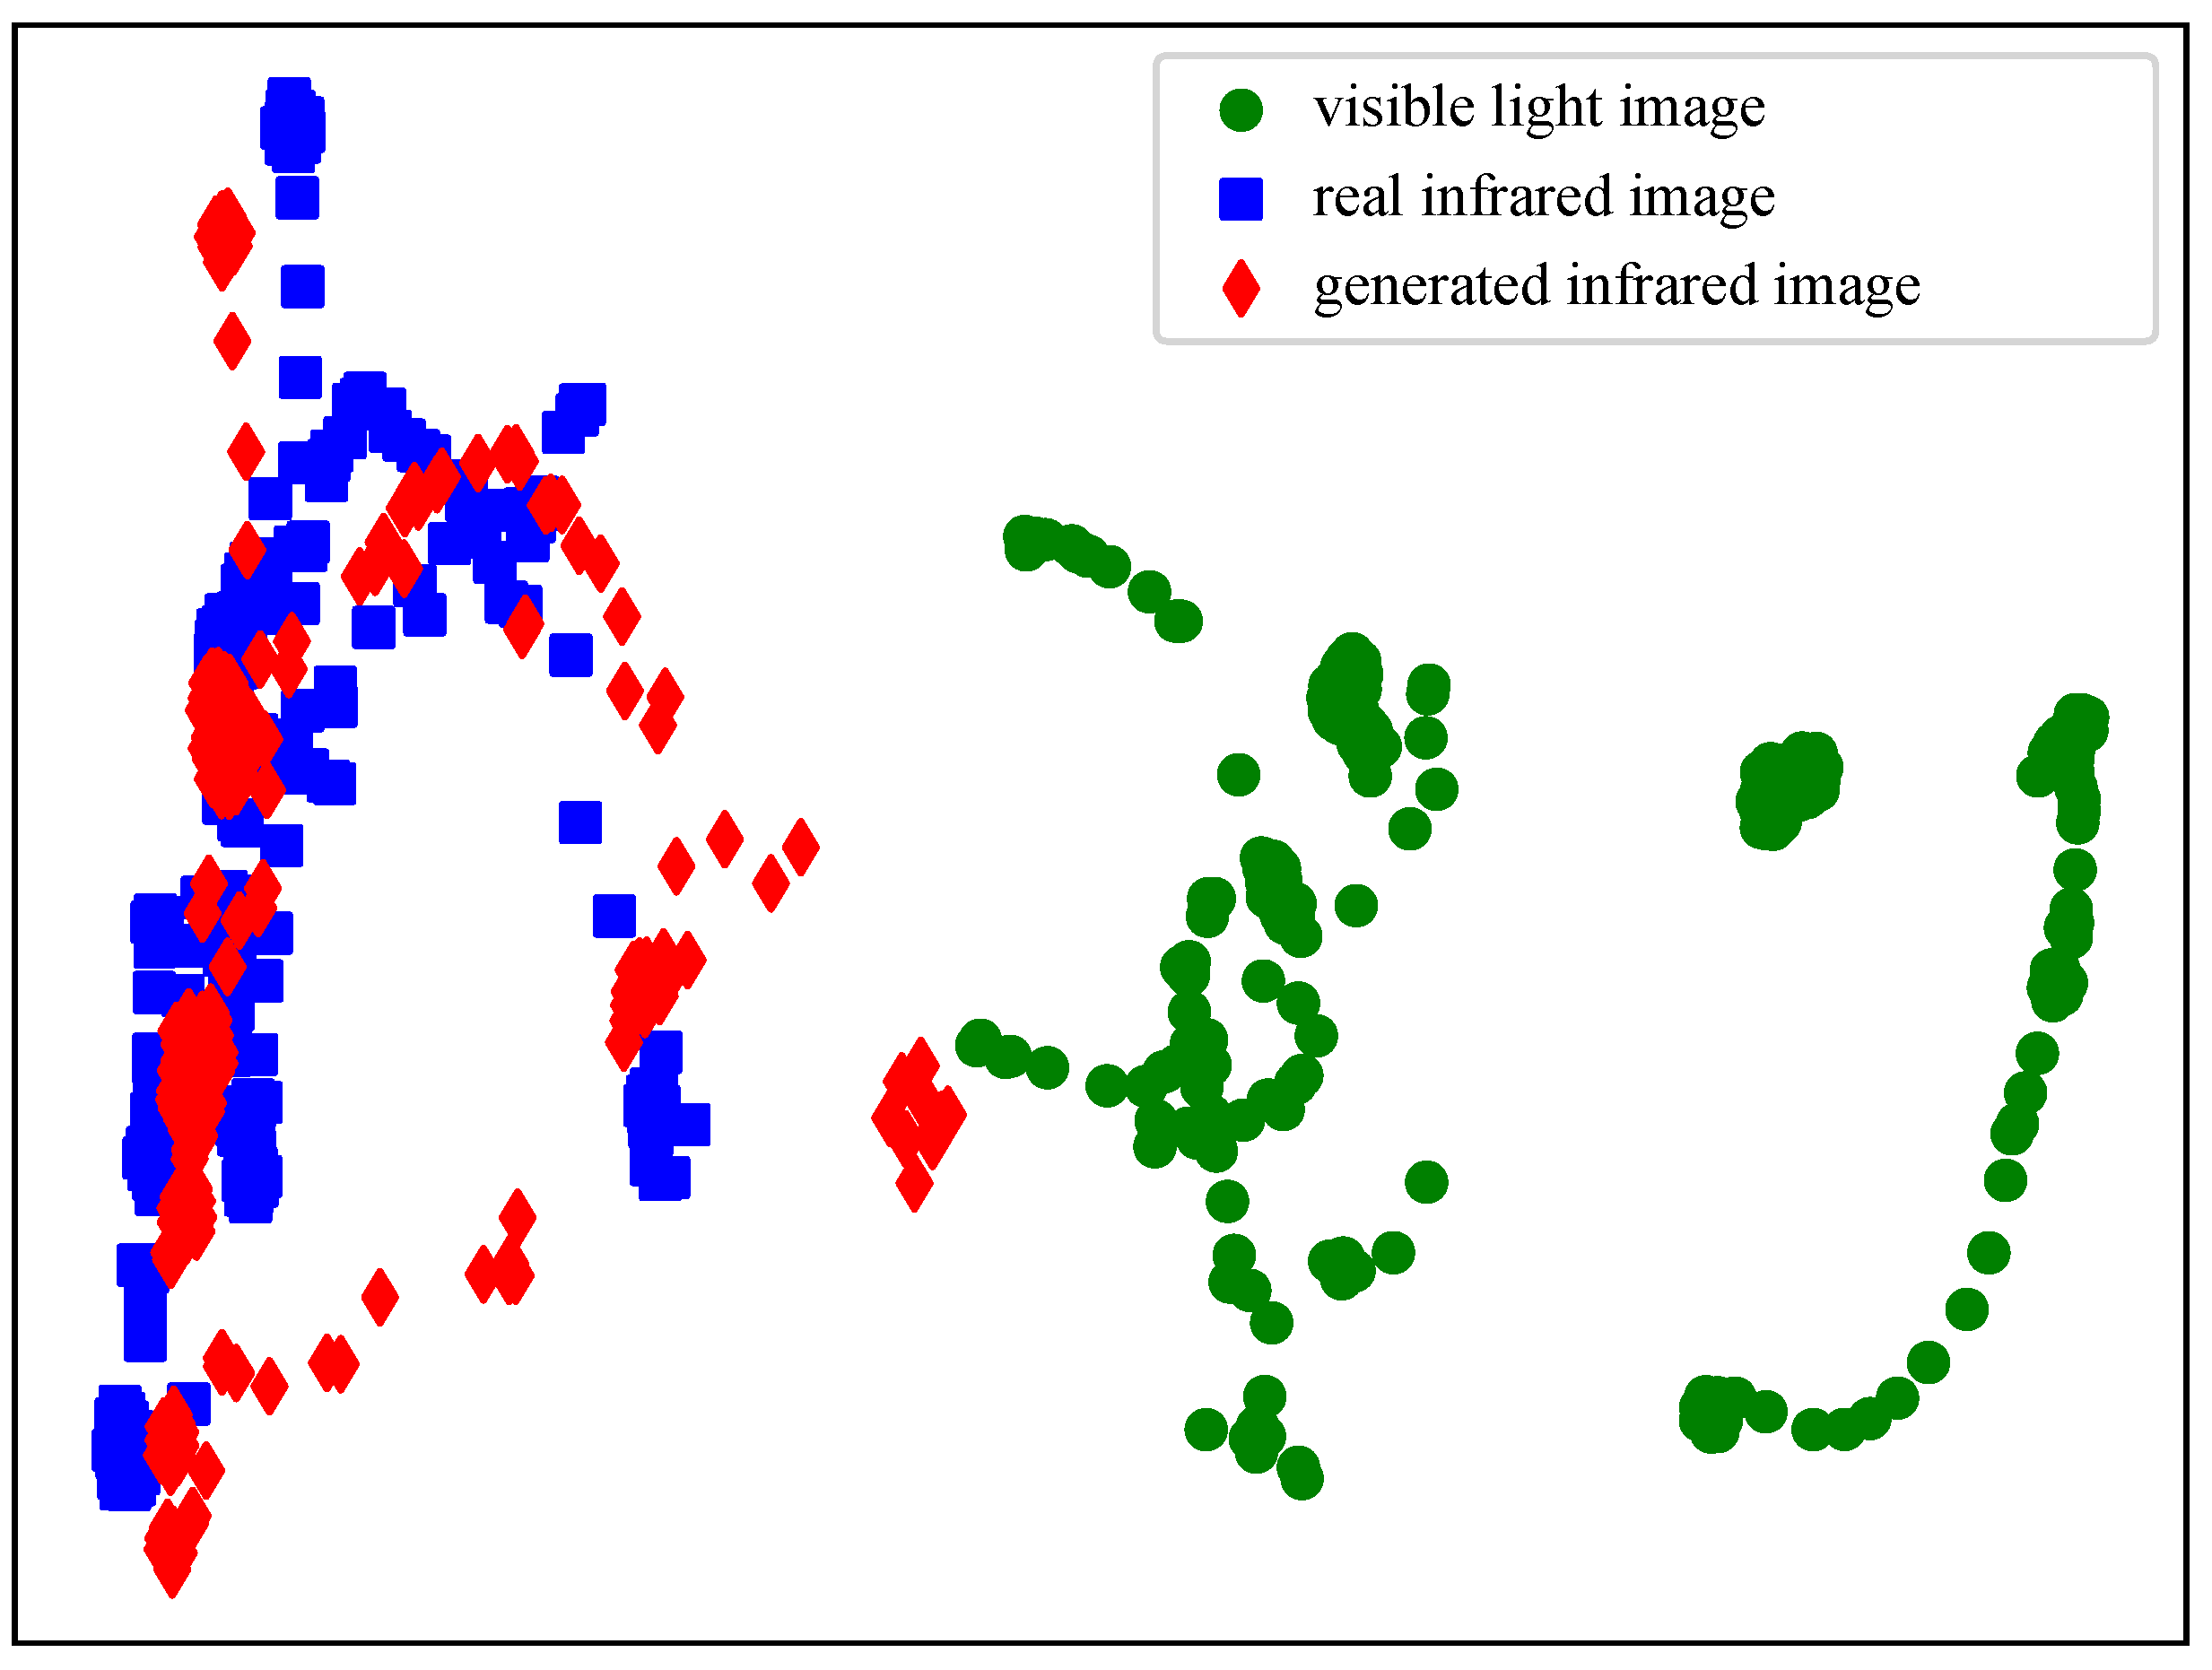
To further demonstrate that the infrared images generated by the proposed method conformed to the distribution of real infrared images, t-distributed Stochastic Neighbor Embedding (t-SNE) [81] technology was utilized to visualize the feature distributions of visible-light images, real infrared images, and the infrared images generated by the V2IGAN method. t-SNE is a type of nonlinear dimensionality reduction technique primarily used for effectively mapping high-dimensional datasets into two or three-dimensional spaces for visualization. It optimizes the embedding in a lower-dimensional space by preserving the relationships of proximity between similar sample points in the higher-dimensional space, making it particularly adept at revealing the local structural features of the data. The greater the overlap in the t-SNE visualization results between two data distributions, the more similar the two datasets are. The feature visualization results on three datasets are shown in Figure 12, Figure 13 and Figure 14, where we use points of different colors and shapes to represent different feature domains. The visualization of features indicates that the feature distribution of the infrared images generated by our method is highly similar to that of the real infrared images, with a large overlap in the areas. The infrared images generated by our method in the fields of autonomous driving, low-altitude space, and surveillance security have similar distributions to the real infrared images, indicating that our method is viable for expanding infrared data.

6. Conclusions

In this work, a novel visible-to-infrared image translation algorithm, named V2IGAN, is proposed based on the VSS attention module and multi-scale feature contrastive learning loss. Firstly, this paper introduces a VSS attention module that strengthens the generative network’s focus on key areas within visible-light images, thereby enhancing both feature extraction and the network’s capacity for image generation. Following that, a multi-scale feature contrastive learning loss function is introduced to align the paired features of images, which refines the fine details of the image generation process. Experimental results on three published datasets demonstrate that the V2IGAN algorithm for converting visible-light to infrared images can produce reliable and high-quality infrared images. Also note that the V2IGAN-P algorithm requires paired data. However, paired training data may not be available for many tasks. This paper further extends the V2IGAN algorithm to generate infrared images without the need for paired visible-light images. However, the generation results from unpaired data are inferior to those from paired data, and the next step will focus on enhancing the algorithm’s performance on unpaired data.

Author Contributions

Conceptualization, B.L., D.M. and F.H.; methodology, B.L. and D.M.; software, B.L. and D.M.; validation, D.M., F.H. and D.Z.; formal analysis, F.H. and Z.Z.; investigation, B.L., D.M. and F.H.; resources, D.M., F.H. and Z.Z.; data curation, B.L., D.M., F.H. and S.L.; writing—original draft preparation, B.L., D.M. and Z.Z.; writing—review and editing, B.L., D.M. and D.Z.; visualization, B.L., D.M. and D.Z.; supervision, D.M. and D.Z.; project administration, B.L., D.M. and S.L.; funding acquisition, B.L. and S.L. All authors have read and agreed to the published version of the manuscript.

Funding

This research was funded by two grants from the National Natural Science Foundation of China (No. 42301458 and 62103432), two grants from the China Postdoctoral Science Foundation (No. 2023M744301 and 2022M721841), and the Young Talent Fund of the University Association for Science and Technology in Shannxi, China (No. 2021108 and No. 20230712).

Data Availability Statement

The code and data used in the manuscript are as follows: Pix2Pix: https://github.com/junyanz/pytorch-CycleGAN-and-pix2pix accessed on 4 January 2019; ThermalGAN: https://github.com/vlkniaz/ThermalGAN accessed on 5 April 2020; Pix2Pix-MRFFF: https://github.com/ylhua/Pix2pix-MRFFF accessed on 20 April 2024; InfraGAN: https://github.com/makifozkanoglu/InfraGAN accessed on 5 May 2024; Dataset: Data address; FLIR dataset: https://github.com/zhanghengdev/CFR accessed on 8 May 2024; AVIID dataset: https://github.com/silver-hzh/Averial-visible-to-infrared-image-translation accessed on 18 May 2024.

Conflicts of Interest

The authors declare that they have no known competing financial interests or personal relationships that could have appeared to influence the work reported in this paper.

References

  1. Wu, D.; Wang, Y.; Wang, H.; Wang, F.; Gao, G. DCFNet: Infrared and Visible Image Fusion Network Based on Discrete Wavelet Transform and Convolutional Neural Network. Sensors 2024, 24, 4065. [Google Scholar] [CrossRef] [PubMed]
  2. Jia, R.; Chen, X.; Li, T.; Cui, J. V2T-GAN: Three-Level Refined Light-Weight GAN with Cascaded Guidance for Visible-to-Thermal Translation. Sensors 2022, 22, 2119. [Google Scholar] [CrossRef] [PubMed]
  3. Chen, D.; Zhang, X.; Zhang, G.; Zhang, Y.; Li, X. Infrared Thermography and Its Applications in Aircraft Non-destructive Testing. In Proceedings of the 2016 International Conference on Identification, Information and Knowledge in the Internet of Things (IIKI), Beijing, China, 20–21 October 2016; pp. 374–379. [Google Scholar] [CrossRef]
  4. Patel, I.; Kulkarni, M.; Mehendale, N. Review of sensor-driven assistive device technologies for enhancing navigation for the visually impaired. Multimed. Tools Appl. 2023, 83, 52171–52195. [Google Scholar] [CrossRef]
  5. Gao, Z.; Zhang, Y.; Wang, S. Lightweight Small Ship Detection Algorithm Combined with Infrared Characteristic Analysis for Autonomous Navigation. J. Mar. Sci. Eng. 2023, 11, 1114. [Google Scholar] [CrossRef]
  6. Malhotra, S.; Halabi, O.; Dakua, S.P.; Padhan, J.; Paul, S.; Palliyali, W. Augmented Reality in Surgical Navigation: A Review of Evaluation and Validation Metrics. Appl. Sci. 2023, 13, 1629. [Google Scholar] [CrossRef]
  7. Arafat, M.Y.; Alam, M.M.; Moh, S. Vision-Based Navigation Techniques for Unmanned Aerial Vehicles: Review and Challenges. Drones 2023, 7, 89. [Google Scholar] [CrossRef]
  8. Yang, S.; Sun, M.; Lou, X.; Yang, H.; Zhou, H. An Unpaired Thermal Infrared Image Translation Method Using GMA-CycleGAN. Remote Sens. 2023, 15, 663. [Google Scholar] [CrossRef]
  9. Zhang, Q.; Smith, W.; Shao, M. The Potential of Monitoring Carbon Dioxide Emission in a Geostationary View with the GIIRS Meteorological Hyperspectral Infrared Sounder. Remote Sens. 2023, 15, 886. [Google Scholar] [CrossRef]
  10. Fernández, J.I.P.; Georgiev, C.G. Evolution of Meteosat Solar and Infrared Spectra (2004–2022) and Related Atmospheric and Earth Surface Physical Properties. Atmosphere 2023, 14, 1354. [Google Scholar] [CrossRef]
  11. Xie, M.; Gu, M.; Hu, Y.; Huang, P.; Zhang, C.; Yang, T.; Yang, C. A Study on the Retrieval of Ozone Profiles Using FY-3D/HIRAS Infrared Hyperspectral Data. Remote Sens. 2023, 15, 1009. [Google Scholar] [CrossRef]
  12. Feng, C.; Yin, W.; He, S.; He, M.; Li, X. Evaluation of SST Data Products from Multi-Source Satellite Infrared Sensors in the Bohai-Yellow-East China Sea. Remote Sens. 2023, 15, 2493. [Google Scholar] [CrossRef]
  13. Torres Gil, L.K.; Valdelamar Martínez, D.; Saba, M. The Widespread Use of Remote Sensing in Asbestos, Vegetation, Oil and Gas, and Geology Applications. Atmosphere 2023, 14, 172. [Google Scholar] [CrossRef]
  14. Rotem, A.; Vidal, A.; Pfaff, K.; Tenorio, L.; Chung, M.; Tharalson, E.; Monecke, T. Interpretation of Hyperspectral Shortwave Infrared Core Scanning Data Using SEM-Based Automated Mineralogy: A Machine Learning Approach. Geosciences 2023, 13, 192. [Google Scholar] [CrossRef]
  15. Li, X.; Jiang, G.; Tang, X.; Zuo, Y.; Hu, S.; Zhang, C.; Wang, Y.; Wang, Y.; Zheng, L. Detecting Geothermal Anomalies Using Multi-Temporal Thermal Infrared Remote Sensing Data in the Damxung–Yangbajain Basin, Qinghai–Tibet Plateau. Remote Sens. 2023, 15, 4473. [Google Scholar] [CrossRef]
  16. Hamedianfar, A.; Laakso, K.; Middleton, M.; Törmänen, T.; Köykkä, J.; Torppa, J. Leveraging High-Resolution Long-Wave Infrared Hyperspectral Laboratory Imaging Data for Mineral Identification Using Machine Learning Methods. Remote Sens. 2023, 15, 4806. [Google Scholar] [CrossRef]
  17. Ma, W.; Wang, K.; Li, J.; Yang, S.X.; Li, J.; Song, L.; Li, Q. Infrared and Visible Image Fusion Technology and Application: A Review. Sensors 2023, 23, 599. [Google Scholar] [CrossRef]
  18. Cheng, C.; Fu, J.; Su, H.; Ren, L. Recent Advancements in Agriculture Robots: Benefits and Challenges. Machines 2023, 11, 48. [Google Scholar] [CrossRef]
  19. Albahar, M. A Survey on Deep Learning and Its Impact on Agriculture: Challenges and Opportunities. Agriculture 2023, 13, 540. [Google Scholar] [CrossRef]
  20. Xu, X.; Du, C.; Ma, F.; Qiu, Z.; Zhou, J. A Framework for High-Resolution Mapping of Soil Organic Matter (SOM) by the Integration of Fourier Mid-Infrared Attenuation Total Reflectance Spectroscopy (FTIR-ATR), Sentinel-2 Images, and DEM Derivatives. Remote Sens. 2023, 15, 1072. [Google Scholar] [CrossRef]
  21. Zhao, M.; Li, W.; Li, L.; Hu, J.; Ma, P.; Tao, R. Single-frame infrared small-target detection: A survey. IEEE Geosci. Remote Sens. Mag. 2022, 10, 87–119. [Google Scholar] [CrossRef]
  22. Bao, C.; Cao, J.; Hao, Q.; Cheng, Y.; Ning, Y.; Zhao, T. Dual-YOLO Architecture from Infrared and Visible Images for Object Detection. Sensors 2023, 23, 2934. [Google Scholar] [CrossRef] [PubMed]
  23. Zhao, X.; Xia, Y.; Zhang, W.; Zheng, C.; Zhang, Z. YOLO-ViT-Based Method for Unmanned Aerial Vehicle Infrared Vehicle Target Detection. Remote Sens. 2023, 15, 3778. [Google Scholar] [CrossRef]
  24. Wang, Y.; Wang, B.; Huo, L.; Fan, Y. GT-YOLO: Nearshore Infrared Ship Detection Based on Infrared Images. J. Mar. Sci. Eng. 2024, 12, 213. [Google Scholar] [CrossRef]
  25. Chen, Y.; Wang, H.; Pang, Y.; Han, J.; Mou, E.; Cao, E. RETRACTED: An Infrared Small Target Detection Method Based on a Weighted Human Visual Comparison Mechanism for Safety Monitoring. Remote Sens. 2023, 15, 2922. [Google Scholar] [CrossRef]
  26. Seo, H.; Raut, A.D.; Chen, C.; Zhang, C. Multi-Label Classification and Automatic Damage Detection of Masonry Heritage Building through CNN Analysis of Infrared Thermal Imaging. Remote Sens. 2023, 15, 2517. [Google Scholar] [CrossRef]
  27. Chehreh, B.; Moutinho, A.; Viegas, C. Latest Trends on Tree Classification and Segmentation Using UAV Data—A Review of Agroforestry Applications. Remote Sens. 2023, 15, 2263. [Google Scholar] [CrossRef]
  28. Bu, C.; Liu, T.; Wang, T.; Zhang, H.; Sfarra, S. A CNN-Architecture-Based Photovoltaic Cell Fault Classification Method Using Thermographic Images. Energies 2023, 16, 3749. [Google Scholar] [CrossRef]
  29. Ghali, R.; Akhloufi, M.A. Deep Learning Approaches for Wildland Fires Remote Sensing: Classification, Detection, and Segmentation. Remote Sens. 2023, 15, 1821. [Google Scholar] [CrossRef]
  30. Huang, J.; Junginger, S.; Liu, H.; Thurow, K. Indoor Positioning Systems of Mobile Robots: A Review. Robotics 2023, 12, 47. [Google Scholar] [CrossRef]
  31. Yang, X.; Xie, J.; Liu, R.; Mo, F.; Zeng, J. Centroid Extraction of Laser Spots Captured by Infrared Detectors Combining Laser Footprint Images and Detector Observation Data. Remote Sens. 2023, 15, 2129. [Google Scholar] [CrossRef]
  32. Qi, L.; Liu, Y.; Yu, Y.; Chen, L.; Chen, R. Current Status and Future Trends of Meter-Level Indoor Positioning Technology: A Review. Remote Sens. 2024, 16, 398. [Google Scholar] [CrossRef]
  33. Guo, Y.; Zhou, Y.; Yang, F. AGCosPlace: A UAV Visual Positioning Algorithm Based on Transformer. Drones 2023, 7, 498. [Google Scholar] [CrossRef]
  34. Wang, Y.; Cao, L.; Su, K.; Dai, D.; Li, N.; Wu, D. Infrared Moving Small Target Detection Based on Space–Time Combination in Complex Scenes. Remote Sens. 2023, 15, 5380. [Google Scholar] [CrossRef]
  35. Wei, G.; Chen, H.; Lin, E.; Hu, X.; Xie, H.; Cui, Y.; Luo, Y. Identification of Water Layer Presence in Paddy Fields Using UAV-Based Visible and Thermal Infrared Imagery. Agronomy 2023, 13, 1932. [Google Scholar] [CrossRef]
  36. Ma, J.; Guo, H.; Rong, S.; Feng, J.; He, B. Infrared Dim and Small Target Detection Based on Background Prediction. Remote Sens. 2023, 15, 3749. [Google Scholar] [CrossRef]
  37. Niu, K.; Wang, C.; Xu, J.; Yang, C.; Zhou, X.; Yang, X. An Improved YOLOv5s-Seg Detection and Segmentation Model for the Accurate Identification of Forest Fires Based on UAV Infrared Image. Remote Sens. 2023, 15, 4694. [Google Scholar] [CrossRef]
  38. Xie, X.; Xi, J.; Yang, X.; Lu, R.; Xia, W. STFTrack: Spatio-Temporal-Focused Siamese Network for Infrared UAV Tracking. Drones 2023, 7, 296. [Google Scholar] [CrossRef]
  39. Xue, Y.; Zhang, J.; Lin, Z.; Li, C.; Huo, B.; Zhang, Y. SiamCAF: Complementary Attention Fusion-Based Siamese Network for RGBT Tracking. Remote Sens. 2023, 15, 3252. [Google Scholar] [CrossRef]
  40. Dang, C.; Li, Z.; Hao, C.; Xiao, Q. Infrared Small Marine Target Detection Based on Spatiotemporal Dynamics Analysis. Remote Sens. 2023, 15, 1258. [Google Scholar] [CrossRef]
  41. Yang, M.; Li, M.; Yi, Y.; Yang, Y.; Wang, Y.; Lu, Y. Infrared simulation of ship target on the sea based on OGRE. Laser Infrared 2017, 47, 53–57. [Google Scholar]
  42. Goodfellow, I.; Pouget-Abadie, J.; Mirza, M.; Xu, B.; Warde-Farley, D.; Ozair, S.; Courville, A.; Bengio, Y. Generative adversarial networks. Commun. ACM 2020, 63, 139–144. [Google Scholar] [CrossRef]
  43. Isola, P.; Zhu, J.Y.; Zhou, T.; Efros, A.A. Image-to-Image Translation with Conditional Adversarial Networks. In Proceedings of the 2017 IEEE Conference on Computer Vision and Pattern Recognition (CVPR), Honolulu, HI, USA, 21–26 July 2017; pp. 5967–5976. [Google Scholar] [CrossRef]
  44. Kniaz, V.V.; Knyaz, V.A.; Hladůvka, J.; Kropatsch, W.G.; Mizginov, V. ThermalGAN: Multimodal Color-to-Thermal Image Translation for Person Re-identification in Multispectral Dataset. In Computer Vision—ECCV 2018 Workshops; Leal-Taixé, L., Roth, S., Eds.; Springer: Cham, Switzerland, 2019; pp. 606–624. [Google Scholar]
  45. Mizginov, V.; Kniaz, V.; Fomin, N. A method for synthesizing thermal images using GAN multi-layered approach. Int. Arch. Photogramm. Remote Sens. Spat. Inf. Sci. 2021, 44, 155–162. [Google Scholar] [CrossRef]
  46. Özkanoğlu, M.A.; Ozer, S. InfraGAN: A GAN architecture to transfer visible images to infrared domain. Pattern Recognit. Lett. 2022, 155, 69–76. [Google Scholar] [CrossRef]
  47. Ma, D.; Xian, Y.; Li, B.; Li, S.; Zhang, D. Visible-to-infrared image translation based on an improved CGAN. Vis. Comput. 2023, 40, 1289–1298. [Google Scholar] [CrossRef]
  48. Ma, D.; Li, S.; Su, J.; Xian, Y.; Zhang, T. Visible-to-Infrared Image Translation for Matching Tasks. IEEE J. Sel. Top. Appl. Earth Obs. Remote Sens. 2024, 18, 1–16. [Google Scholar] [CrossRef]
  49. Zhu, J.Y.; Park, T.; Isola, P.; Efros, A.A. Unpaired Image-to-Image Translation Using Cycle-Consistent Adversarial Networks. In Proceedings of the 2017 IEEE International Conference on Computer Vision (ICCV), Venice, Italy, 22–29 October 2017; pp. 2242–2251. [Google Scholar] [CrossRef]
  50. Zhang, R.; Mu, C.; Xu, M.; Xu, L.; Shi, Q.; Wang, J. Synthetic IR image refinement using adversarial learning with bidirectional mappings. IEEE Access 2019, 7, 153734–153750. [Google Scholar] [CrossRef]
  51. Li, Y.; Ko, Y.; Lee, W. RGB image-based hybrid model for automatic prediction of flashover in compartment fires. Fire Saf. J. 2022, 132, 103629. [Google Scholar] [CrossRef]
  52. Liu, H.; Ma, L. Infrared Image Generation Algorithm Based on GAN and contrastive learning. In Proceedings of the 2022 International Conference on Artificial Intelligence and Computer Information Technology (AICIT), Yichang, China, 16–18 September 2022; pp. 1–4. [Google Scholar]
  53. Lee, D.G.; Jeon, M.H.; Cho, Y.; Kim, A. Edge-guided multi-domain rgb-to-tir image translation for training vision tasks with challenging labels. In Proceedings of the 2023 IEEE International Conference on Robotics and Automation (ICRA), London, UK, 29 May–2 June 2023; pp. 8291–8298. [Google Scholar]
  54. Mirza, M.; Osindero, S. Conditional generative adversarial nets. arXiv 2014, arXiv:1411.1784. [Google Scholar]
  55. Sommervold, O.; Gazzea, M.; Arghandeh, R. A Survey on SAR and Optical Satellite Image Registration. Remote Sens. 2023, 15, 850. [Google Scholar] [CrossRef]
  56. Wang, Z.; Nie, F.; Zhang, C.; Wang, R.; Li, X. Worst-Case Discriminative Feature Learning via Max-Min Ratio Analysis. IEEE Trans. Pattern Anal. Mach. Intell. 2024, 46, 641–658. [Google Scholar] [CrossRef]
  57. Wang, Z.; Yuan, Y.; Wang, R.; Nie, F.; Huang, Q.; Li, X. Pseudo-Label Guided Structural Discriminative Subspace Learning for Unsupervised Feature Selection. IEEE Trans. Neural Netw. Learn. Syst. 2023, 18, 1–15. [Google Scholar] [CrossRef] [PubMed]
  58. Ma, Y.; Hua, Y.; Zuo, Z. Infrared Image Generation By Pix2pix Based on Multi-receptive Field Feature Fusion. In Proceedings of the 2021 International Conference on Control, Automation and Information Sciences (ICCAIS), Xi’an, China, 14–17 October 2021; pp. 1029–1036. [Google Scholar] [CrossRef]
  59. Wu, Z.; Shen, C.; Van Den Hengel, A. Wider or deeper: Revisiting the resnet model for visual recognition. Pattern Recognit. 2019, 90, 119–133. [Google Scholar] [CrossRef]
  60. Li, X.; Chen, H.; Qi, X.; Dou, Q.; Fu, C.W.; Heng, P.A. H-DenseUNet: Hybrid densely connected UNet for liver and tumor segmentation from CT volumes. IEEE Trans. Med Imaging 2018, 37, 2663–2674. [Google Scholar] [CrossRef] [PubMed]
  61. Li, C.; Wand, M. Precomputed Real-Time Texture Synthesis with Markovian Generative Adversarial Networks. In Computer Vision—ECCV 2016; Leibe, B., Matas, J., Sebe, N., Welling, M., Eds.; Springer: Cham, Switzerland, 2016; pp. 702–716. [Google Scholar]
  62. Wang, T.C.; Liu, M.Y.; Zhu, J.Y.; Tao, A.; Kautz, J.; Catanzaro, B. High-resolution image synthesis and semantic manipulation with conditional gans. In Proceedings of the IEEE Conference on Computer Vision and Pattern Recognition, Salt Lake City, UT, USA, 18–23 June 2018; pp. 8798–8807. [Google Scholar]
  63. Schönfeld, E.; Schiele, B.; Khoreva, A. A U-Net Based Discriminator for Generative Adversarial Networks. In Proceedings of the 2020 IEEE/CVF Conference on Computer Vision and Pattern Recognition (CVPR), Seattle, WA, USA, 13–19 June 2020; pp. 8204–8213. [Google Scholar] [CrossRef]
  64. Mao, X.; Li, Q.; Xie, H.; Lau, R.Y.; Wang, Z.; Paul Smolley, S. Least squares generative adversarial networks. In Proceedings of the IEEE International Conference on Computer Vision, Venice, Italy, 22–29 October 2017; pp. 2794–2802. [Google Scholar]
  65. Arjovsky, M.; Chintala, S.; Bottou, L. Wasserstein generative adversarial networks. In Proceedings of the International Conference on Machine Learning. PMLR, Sydney, Australia, 6–11 August 2017; pp. 214–223. [Google Scholar]
  66. Chen, T.; Kornblith, S.; Norouzi, M.; Hinton, G. A simple framework for contrastive learning of visual representations. In Proceedings of the International Conference on Machine Learning. PMLR, Virtual, 13–18 July 2020; pp. 1597–1607. [Google Scholar]
  67. Xu, R.; Samat, A.; Zhu, E.; Li, E.; Li, W. Unsupervised Domain Adaptation with Contrastive Learning-Based Discriminative Feature Augmentation for RS Image Classification. Remote Sens. 2024, 16, 1974. [Google Scholar] [CrossRef]
  68. Xiao, H.; Yao, W.; Chen, H.; Cheng, L.; Li, B.; Ren, L. SCDA: A Style and Content Domain Adaptive Semantic Segmentation Method for Remote Sensing Images. Remote Sens. 2023, 15, 4668. [Google Scholar] [CrossRef]
  69. Mahara, A.; Rishe, N. Multispectral Band-Aware Generation of Satellite Images across Domains Using Generative Adversarial Networks and Contrastive Learning. Remote Sens. 2024, 16, 1154. [Google Scholar] [CrossRef]
  70. Baek, K.; Choi, Y.; Uh, Y.; Yoo, J.; Shim, H. Rethinking the truly unsupervised image-to-image translation. In Proceedings of the IEEE/CVF International Conference on Computer Vision, Montreal, QC, Canada, 10–17 October 2021; pp. 14154–14163. [Google Scholar]
  71. Park, T.; Efros, A.A.; Zhang, R.; Zhu, J.Y. Contrastive learning for unpaired image-to-image translation. In Proceedings of the Computer Vision—ECCV 2020: 16th European Conference, Glasgow, UK, 23–28 August 2020; Proceedings, Part IX 16. Springer: Berlin/Heidelberg, Germany, 2020; pp. 319–345. [Google Scholar]
  72. Han, J.; Shoeiby, M.; Petersson, L.; Armin, M.A. Dual contrastive learning for unsupervised image-to-image translation. In Proceedings of the IEEE/CVF Conference on Computer Vision and Pattern Recognition, Nashville, TN, USA, 20–25 June 2021; pp. 746–755. [Google Scholar]
  73. Cai, X.; Zhu, Y.; Miao, D.; Fu, L.; Yao, Y. Constraining multi-scale pairwise features between encoder and decoder using contrastive learning for unpaired image-to-image translation. arXiv 2022, arXiv:2211.10867. [Google Scholar]
  74. Liu, Y.; Tian, Y.; Zhao, Y.; Yu, H.; Xie, L.; Wang, Y.; Ye, Q.; Liu, Y. Vmamba: Visual state space model. arXiv 2024, arXiv:2401.10166. [Google Scholar]
  75. Zhang, H.; Fromont, E.; Lefevre, S.; Avignon, B. Multispectral fusion for object detection with cyclic fuse-and-refine blocks. In Proceedings of the 2020 IEEE International Conference on Image Processing (ICIP), Abu Dhabi, United Arab Emirates, 25–28 October 2020; pp. 276–280. [Google Scholar]
  76. Han, Z.; Zhang, Z.; Zhang, S.; Zhang, G.; Mei, S. Aerial visible-to-infrared image translation: Dataset, evaluation, and baseline. J. Remote Sens. 2023, 3, 0096. [Google Scholar] [CrossRef]
  77. Hore, A.; Ziou, D. Image quality metrics: PSNR vs. SSIM. In Proceedings of the 2010 20th International Conference on Pattern Recognition, Istanbul, Turkey, 23–26 August 2010; pp. 2366–2369. [Google Scholar]
  78. Wang, Z.; Simoncelli, E.; Bovik, A. Multiscale structural similarity for image quality assessment. In Proceedings of the The Thrity-Seventh Asilomar Conference on Signals, Systems & Computers, Pacific Grove, CA, USA, 9–12 November 2003; Volume 2, pp. 1398–1402. [Google Scholar] [CrossRef]
  79. Zhang, R.; Isola, P.; Efros, A.A.; Shechtman, E.; Wang, O. The unreasonable effectiveness of deep features as a perceptual metric. In Proceedings of the IEEE Conference on Computer Vision and Pattern Recognition, Salt Lake City, UT, USA, 18–23 June 2018; pp. 586–595. [Google Scholar]
  80. Heusel, M.; Ramsauer, H.; Unterthiner, T.; Nessler, B.; Hochreiter, S. Gans trained by a two time-scale update rule converge to a local nash equilibrium. Adv. Neural Inf. Process. Syst. 2017, 30, 6629–6640. [Google Scholar]
  81. Van der Maaten, L.; Hinton, G. Visualizing data using t-SNE. J. Mach. Learn. Res. 2008, 9, 2579–2605. [Google Scholar]
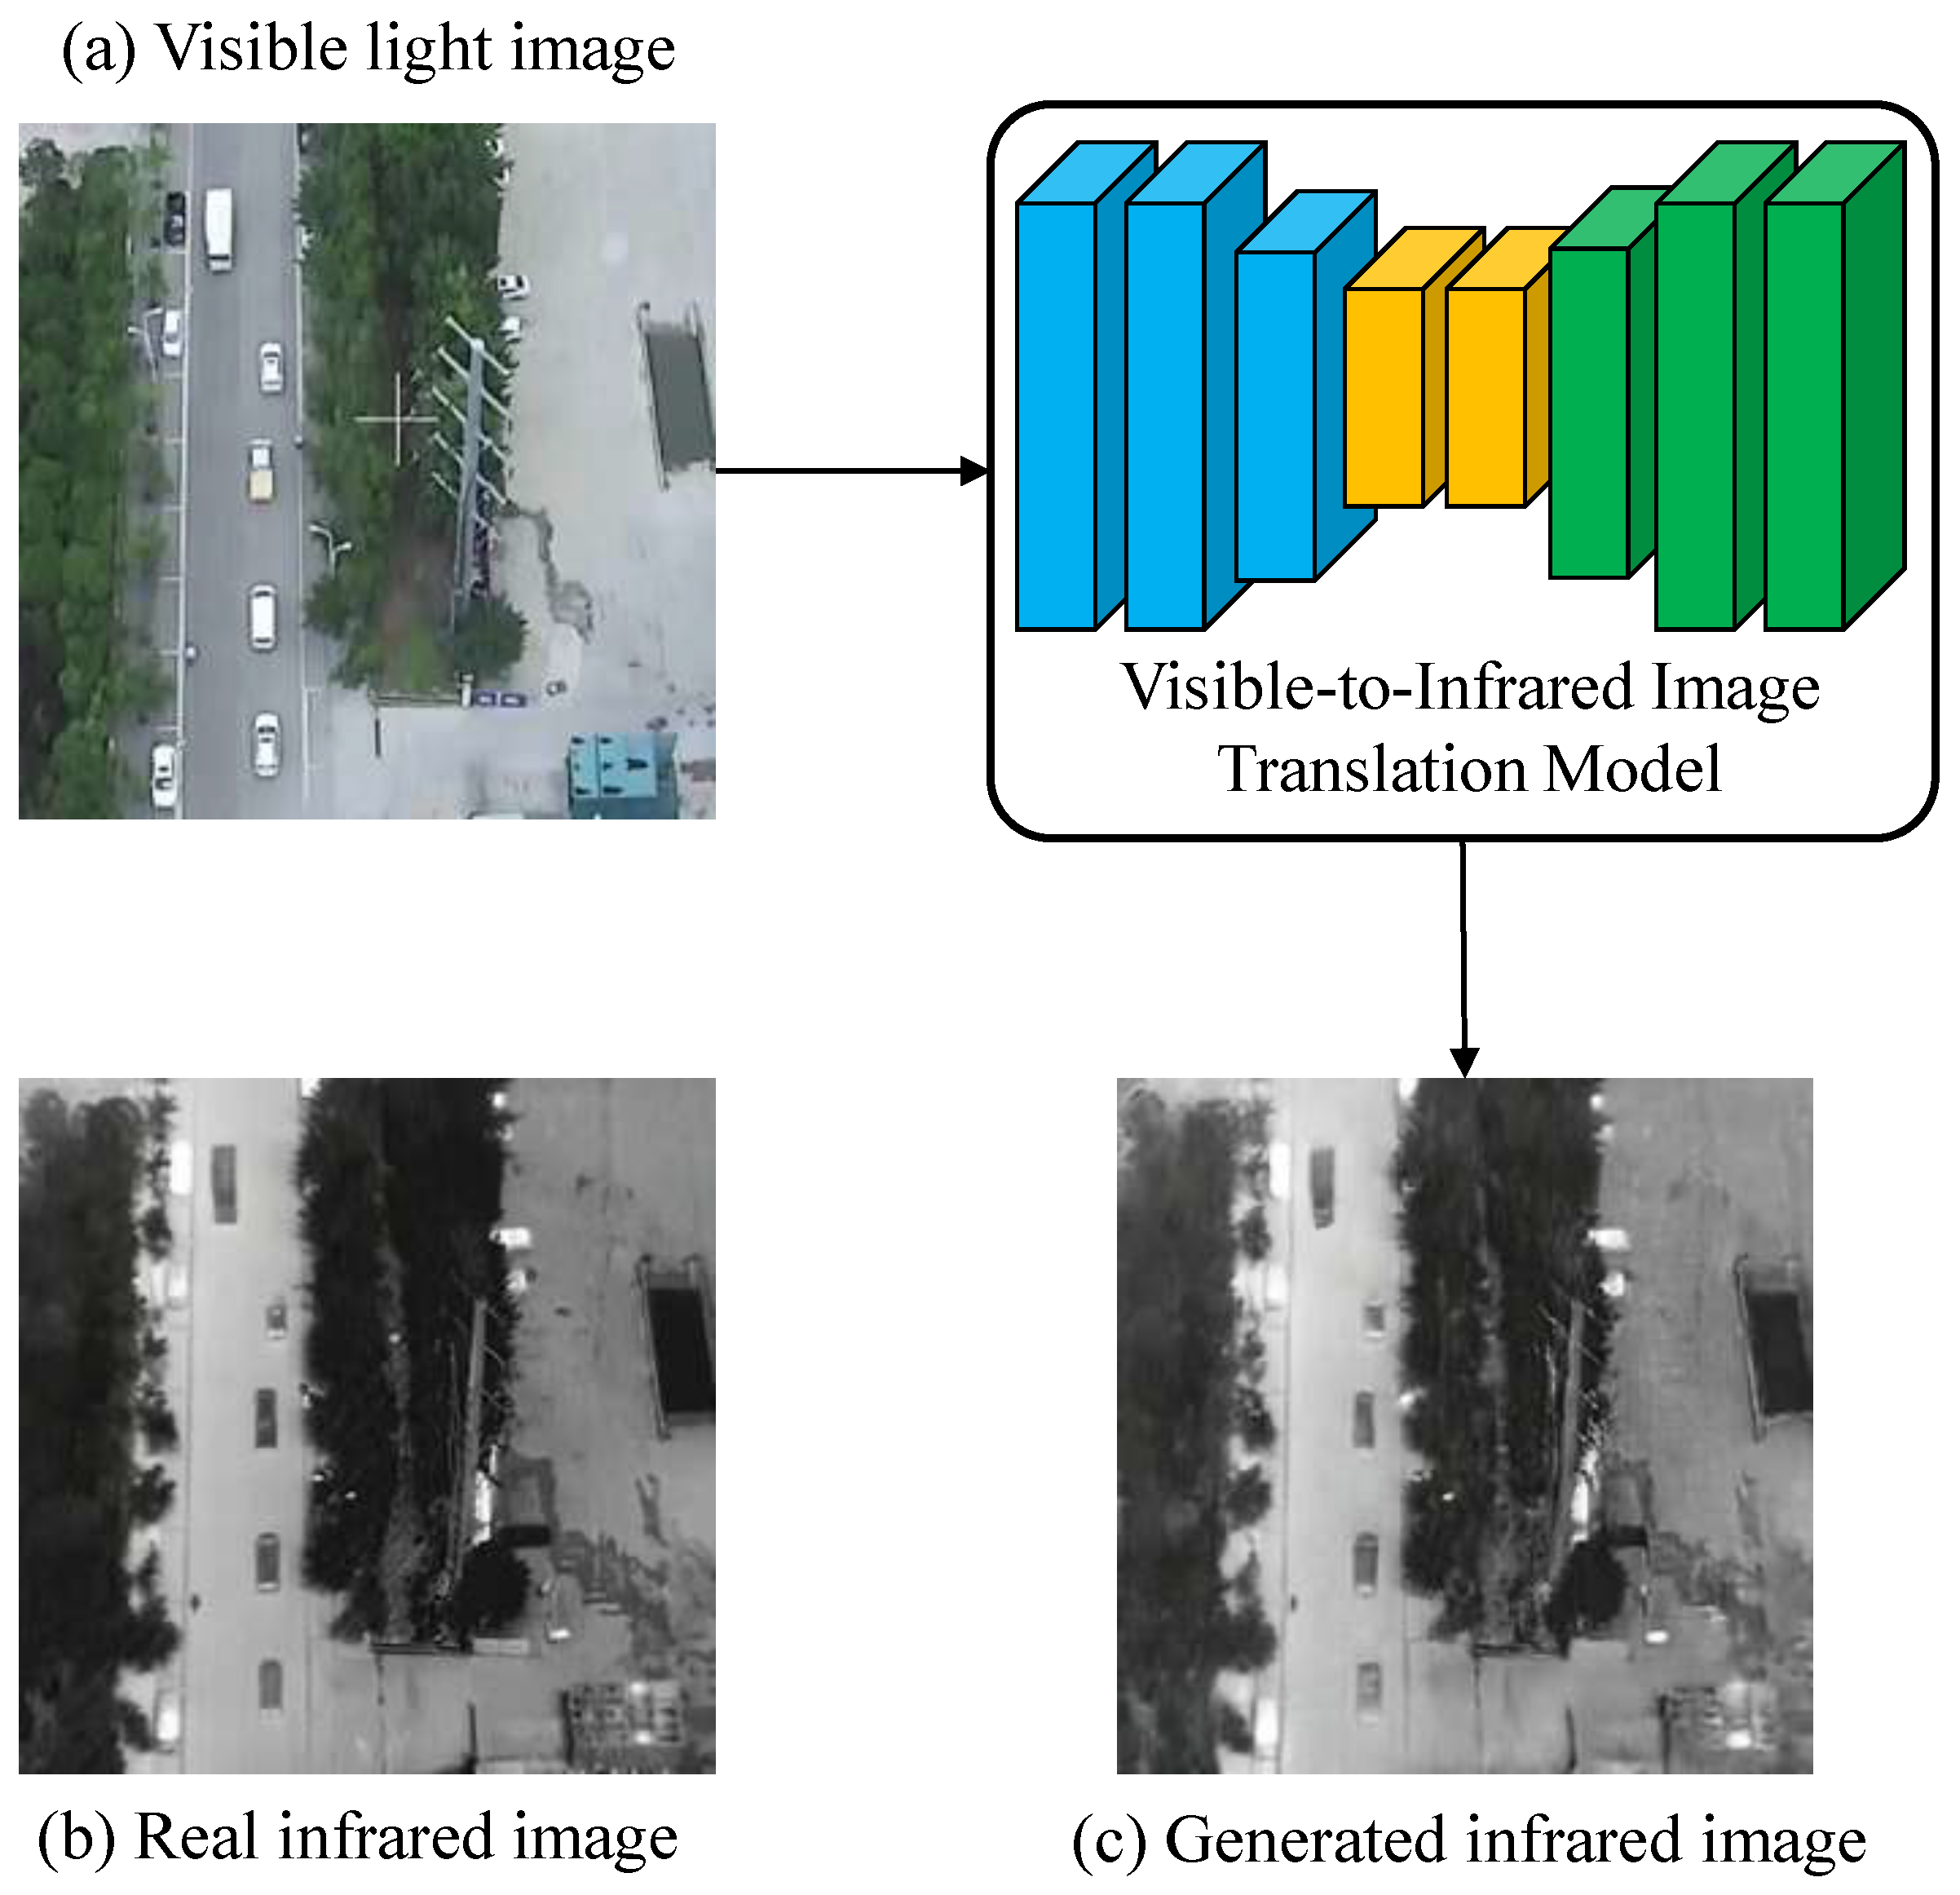
Figure 1. Visible-to-Infrared Image Translation Process.
Remotesensing 16 03817 g001
Figure 2. The framework flowchart of V2IGAN algorithm.
Remotesensing 16 03817 g002
Figure 3. The generator structure of V2IGAN.
Remotesensing 16 03817 g003
Figure 4. The structure of the VSS block.
Remotesensing 16 03817 g004
Figure 5. SS2D schematic diagram.
Remotesensing 16 03817 g005
Figure 6. Contrastive learning.
Remotesensing 16 03817 g006
Figure 7. Three datasets’ image samples.
Remotesensing 16 03817 g007
Figure 8. Examples of infrared images generated by different methods on the FLIR dataset.
Remotesensing 16 03817 g008
Figure 9. Examples of infrared images generated by different methods on the AVIID dataset.
Remotesensing 16 03817 g009
Figure 10. Examples of infrared images generated by different methods on the IRVI dataset.
Remotesensing 16 03817 g010
Figure 11. Ablation experiment results on the AVIID dataset.
Remotesensing 16 03817 g011
Figure 12. T-SNE visualization comparison on FLIR dataset.
Remotesensing 16 03817 g012
Figure 13. T-SNE visualization comparison on AVIID dataset.
Remotesensing 16 03817 g013
Figure 14. T-SNE visualization comparison on IRVI dataset.
Remotesensing 16 03817 g014
Table 1. Infrared image generation quality evaluation results and training inference time consumption.
FLIR  PSNR ↑    SSIM ↑    MS-SSIM ↑    LPIPS ↓    FID ↓  Training Time (h)Inference Time (s)
Pix2Pix22.15290.61630.51400.3312138.88288.940.16
ThermalGAN22.47350.62870.54750.2746139.26426.980.17
Pix2Pix-MRFFF21.86220.61580.52810.3216126.75357.920.15
InfraGAN22.19610.63040.54110.3043136.130925.720.17
V2IGAN-P23.06280.64170.57260.2636122.972466.330.19
AVIIDPSNR ↑SSIM ↑MS-SSIM ↑LPIPS ↓FID ↓Training Time (h)Inference Time (s)
Pix2Pix26.64640.79230.81430.1844110.90602.050.16
ThermalGAN25.14610.75200.77750.182299.39571.610.17
Pix2Pix-MRFFF23.09390.69720.68170.4106172.57633.270.15
InfraGAN24.94150.76030.54110.181596.58615.710.17
V2IGAN-P28.06790.83760.86770.121171.060616.560.19
IRVIPSNR ↑SSIM ↑MS-SSIM ↑LPIPS ↓FID ↓Training Time (h)Inference Time (s)
CycleGAN12.91920.26340.13680.4268185.88687.760.16
CUT10.69410.26030.10980.5013175.61237.160.16
DCLGAN11.31220.26680.02970.5051208.387411.030.16
EMRT11.09060.26350.04110.5006188.997016.530.24
V2IGAN-U14.97340.38760.23720.3031136.458316.150.19
In the table, an upward arrow indicates that the larger the metric, the better the image quality, while a downward arrow indicates that the smaller the metric, the better the image quality. Boldface fonts represent the best values obtained.
Table 2. The results of the ablation experiments conducted on the AVIID dataset.
AVIIDPSNR ↑SSIM ↑MS-SSIM ↑LPIPS ↓FID ↓
baseline26.64640.79230.81430.1844110.9060
+VSS27.03060.81730.84890.143581.7944
+ C L 27.01970.79640.83560.133980.3518
V2IGAN28.06790.83760.86770.121171.0606
In the table, an upward arrow indicates that the larger the metric, the better the image quality, while a downward arrow indicates that the smaller the metric, the better the image quality. Boldface fonts represent the best values obtained.
Disclaimer/Publisher’s Note: The statements, opinions and data contained in all publications are solely those of the individual author(s) and contributor(s) and not of MDPI and/or the editor(s). MDPI and/or the editor(s) disclaim responsibility for any injury to people or property resulting from any ideas, methods, instructions or products referred to in the content.