Abstract
Accurate coffee plant counting is a crucial metric for yield estimation and a key component of precision agriculture. While multispectral UAV technology provides more accurate crop growth data, the varying spectral characteristics of coffee plants across different phenological stages complicate automatic plant counting. This study compared the performance of mainstream YOLO models for coffee detection and segmentation, identifying YOLOv9 as the best-performing model, with it achieving high precision in both detection (P = 89.3%, mAP50 = 94.6%) and segmentation performance (P = 88.9%, mAP50 = 94.8%). Furthermore, we studied various spectral combinations from UAV data and found that RGB was most effective during the flowering stage, while RGN (Red, Green, Near-infrared) was more suitable for non-flowering periods. Based on these findings, we proposed an innovative dual-channel non-maximum suppression method (dual-channel NMS), which merges YOLOv9 detection results from both RGB and RGN data, leveraging the strengths of each spectral combination to enhance detection accuracy and achieving a final counting accuracy of 98.4%. This study highlights the importance of integrating UAV multispectral technology with deep learning for coffee detection and offers new insights for the implementation of precision agriculture.
1. Introduction
Coffee, recognized as one of the three major beverage crops globally [1], is cultivated and consumed extensively around the world [2]. In recent years, China has experienced rapid economic growth and rising living standards, leading to a significant shift in coffee consumption from a niche market predominantly enjoyed by the elite to a more widespread demographic. This transition reflects a growing trend toward mass consumption and diversification within the coffee market [3]. According to statistics, the domestic coffee market in China is growing at an annual rate of 15%, and it is expected to reach a market size of CNY 217.1 billion (about USD 30.8 billion) by 2025 [4]. This rapidly growing market demand offers significant development potential for the coffee industry and unprecedented opportunities for production regions.
Yunnan Province, as China’s most important coffee-producing region, is particularly renowned for its small-grain coffee from the Baoshan area. The coffee planting area in Baoshan has steadily expanded, reaching 8610 hectares in 2022, with an annual output of 20,000 tons and a total industry output value exceeding CNY 3.7 billion (about USD 524 million), making it an essential production area for high-quality coffee in China [5].
Despite Yunnan Province’s significant role in China’s coffee industry—accounting for more than 98% of the nation’s coffee planting area and production [6]—the region still faces challenges such as insufficient technological support, limited variety of coffee plants, and low resilience to risks. These issues have, to some extent, hindered the further development of Yunnan’s coffee industry. Therefore, enhancing the technological content of the coffee industry, optimizing planting and processing techniques, and increasing the added value at each stage of the industrial chain have become key to promoting the high-quality development of Yunnan’s coffee industry.
One critical aspect of improving the coffee industry is estimating coffee yields. Due to the unique mountainous coffee-growing environment in the Baoshan area of Yunnan, coffee farmers find it challenging to accurately estimate coffee yields, which affects their income. Research teams have discovered that the biennial cycle of coffee production in this area can be easily identified, and within the same planting area and growth cycle there is little difference in coffee yields. Therefore, the key factor affecting coffee yield lies in the number of coffee trees per unit area. To estimate coffee yield more accurately, it is essential to precisely count the number of coffee trees in the planting area.
Traditional crop counting is typically conducted manually, which is a labor-intensive, time-consuming, and expensive task, especially in steeply sloped mountainous areas like Baoshan in Yunnan. Current technologies, such as the Internet of Things (IoT) and Artificial Intelligence (AI), and their applications, can be fully integrated into the agricultural sector to ensure long-term agricultural productivity [7]. These technologies have the potential to enhance global food security by reducing crop yield gaps, minimizing food waste, and addressing issues of inefficient resource use [7]. Additionally, computer vision offers a new, non-destructive method for estimating crop yields [8]. During crop monitoring, the ideal images are orthophotos [9], which can be obtained primarily through satellite remote sensing and UAV remote sensing. Low-altitude UAVs, due to their lower flight height, can capture higher spatial resolution images and are not affected by cloud cover [10]. As a result, UAVs are garnering increasing attention in the field of crop monitoring.
UAVs have the capability to capture images across various time intervals, and when equipped with different sensors they can also acquire spectral data that reflect various aspects of crop growth [11,12,13,14]. These spectral indices allow for the calculation of vegetation indices, with each index highlighting specific aspects of plant health [15], thereby enhancing the monitoring of crop development. Different spectral bands provide unique insights into crop conditions. For instance, the Near-infrared (NIR) band reveals photosynthetic capacity and water content, both of which are indicators of plant health [16], making it a valuable tool for assessing plant vitality. The Red edge (RE) band, which tracks changes in chlorophyll absorption, can indicate various phenological stages of crops [17]. By combining data from different bands, it is possible to gather more comprehensive information about crop growth than what is achievable with standard RGB imagery.
With the rapid advancement of Artificial Intelligence in image processing, estimating crop counts using imagery has become feasible, significantly improving the accuracy of crop count estimation [18]. Artificial Intelligence is already widely used in various agricultural monitoring tasks, such as pest and disease identification, and yield estimation [19]. Deep learning, which requires large datasets to train models for optimal monitoring performance [20], benefits greatly from the use of UAVs, as they can easily capture vast amounts of data anytime and anywhere [21]. As a result, the integration of computer vision and deep learning in agricultural monitoring has garnered increasing attention and is poised to become a primary method for agricultural monitoring in the future.
The key challenge in coffee monitoring is distinguishing coffee plants from other intercropped crops, such as macadamia nuts and mangoes. The fundamental issue in counting coffee plants lies in accurate detection. Target detection methods can be divided into two categories: anchor-based and anchor-free methods [22]. In multi-object detection tasks, anchor-based algorithms utilize a pre-defined set of anchor boxes to cover a wider range of possible target locations and sizes, thereby improving detection accuracy and recall rates [23,24]. Anchor-based methods, which are more common, can be further classified into single-stage and two-stage approaches [25]. Single-stage methods directly perform object detection without explicitly proposing regions of interest (RoIs). These methods divide the image into grids and predict the presence of objects and their bounding box coordinates in each grid cell. Representative works include the YOLO (You Only Look Once) series, SSD (Single Shot MultiBox Detector), and RetinaNet, among others [26]. The YOLO framework stands out for its balance between accuracy and speed, making it a reliable choice for rapid object identification in images. YOLO employs a regression-based approach to directly predict the output for detected objects, resulting in probability values for the target [27].
The popular object detection algorithm YOLO, combined with multispectral UAV technology, offers new insights for modern agricultural monitoring and production.
2. Materials and Methods
2.1. Overview of the Research Area
The study area (Figure 1) is located at Xinzai Farm, situated in Xinzai Village, in the southwest of Longyang District, Baoshan City, Yunnan Province. The farm spans an area of 5.36 square kilometers, with an elevation of 700 m above sea level. The geographic coordinates of the area place it within a region that experiences an average annual temperature of 21.5 °C and an average annual rainfall of 850 mm. The primary coffee variety grown here is Catimor (the variety studied in this research), with a smaller proportion of Typica also cultivated.
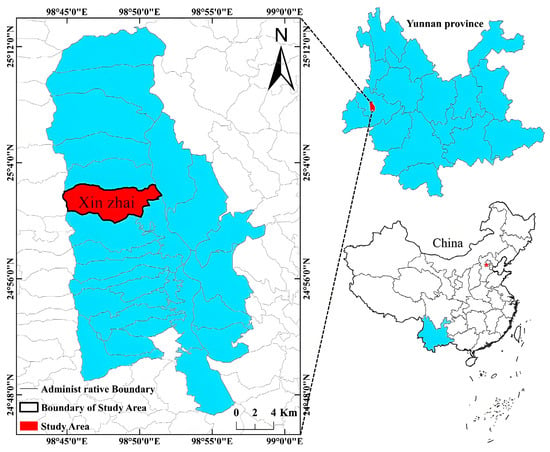
Figure 1.
Administrative map of the study area.
2.2. Data and Preprocessing
2.2.1. Equipment
The research team utilized a DJI MAVIC 3M multispectral UAV, sourced from DJI Technology Co., Ltd., Shenzhen, China, capable of capturing data across several spectral bands: Green (G) at 560 nm ± 16 nm, Red (R) at 650 nm ± 16 nm, Red edge (Re) at 730 nm ± 16 nm, Near-infrared (Nir) at 860 nm ± 26 nm, and a full-color (RGB) band at 380–780 nm. The altitude of flight missions ranged between 30 and 100 m, with a 70% front overlap, using an orthographic imaging approach.
The hardware configuration for this study was as follows: the CPU used was an Intel(R) Core(TM) i9-14900KF at 3.20 GHz (Intel Corporation, Santa Clara, CA, USA), with 64 GB of memory, and the GPU was an NVIDIA GeForce RTX 4090 with 24 GB of computational capacity (NVIDIA Corporation, Santa Clara, CA, USA).
2.2.2. Data Collection
Data collection was conducted four times, in April 2023, December 2023, January 2024, and April 2024, during different phenological stages of coffee plants in the study area. This allowed us to capture images of the coffee plants during flowering, growth, fruit maturation, and post-harvest stages. For each time, 20 flight paths were set, covering a total area of 1.83 square kilometers.
2.2.3. Data Preprocessing
The UAV data collected were stitched using Pix4Dmapper software (version 4.5), resulting in 15 mosaic images of sample plots (Figure 2).
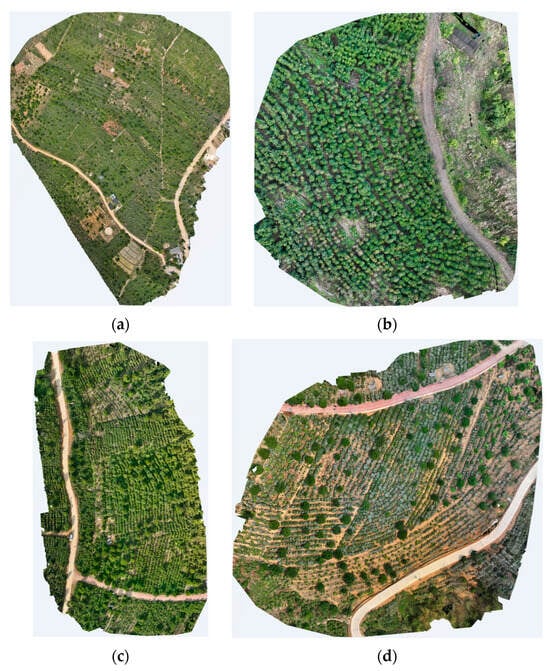
Figure 2.
Stitched Images of Coffee at Different Phenological Stages: (a) Taken in April 2023, representing the late flowering stage; (b) Taken in December 2023, representing the coffee bean maturation stage; (c) Taken in January 2024, representing the post-harvest stage; (d) Taken in April 2024, representing the full flowering stage.
To enhance the robustness and generalizability of the model, the following criteria for data selection were applied:
- Mosaic images from areas with a complex terrain and various land features were selected. These included roads, buildings, macadamia trees, mango trees, and coffee trees of different ages;
- Different sample plot images for each phenological stage were selected, effectively avoiding the issue of having the same number of coffee plants across different phenological stages in the same experimental area.
Ultimately, six mosaic images as experimental data were selected for further processing. Since the YOLO model requires input images to be 640 × 640 pixels [28,29], we cropped the images accordingly. The cropped images were selected based on the following criteria:
- Images that were clear and free from flight disturbances;
- Images rich in terrain and land feature information, including various tree species such as mango, macadamia, and young coffee seedlings;
- Images where coffee tree canopies exhibited overlap.
After filtering, 245 highly representative images were obtained, with a total of 4308 coffee trees. Of these, 1887 were non-flowering coffee trees, and 2421 were flowering coffee trees. Since the number and quality of coffee flowers significantly impact yield and quality, the selection of flowering coffee trees was intentionally increased for the subsequent analysis of coffee yield and quality.
For model training, the dataset was divided into an 80:20 ratio [30], with 80% allocated for training and 20% for validation. The training set contained 3492 coffee trees, including 1552 non-flowering and 1940 flowering trees. The validation set contained 816 coffee trees, with 335 non-flowering and 481 flowering trees labeled.
2.2.4. Spectral Combinations
Since the YOLO model requires a three-channel input, and the multispectral images obtained from the UAV contain five bands, different spectral bands need to be combined into sets of three to meet YOLO’s input requirements. When selecting the YOLO model, standard RGB images typically employed in YOLO were used. For coffee plant counting, all spectral combinations were compared to determine the optimal spectral combination for accurately counting coffee plants (Table 1).

Table 1.
UAV Band Combinations and Their Descriptions.
2.3. Methods
2.3.1. YOLOs
“You Only Look Once” (YOLO) is an object detection framework that uses a single convolutional neural network (CNN) to predict bounding boxes and class probabilities directly from full images in a single pass. It is widely known for its speed and accuracy. The architecture divides the image into a grid and assigns bounding boxes to detect objects within each grid cell.
Up to now, YOLO has evolved from YOLOv1 to YOLOv10 (with the source code for YOLOv10 yet to be released). Among the most widely used versions are YOLOv5 [31], YOLOv7 [32], and YOLOv8 [33,34]. This study compares the structural differences between these commonly used YOLO versions and the latest YOLOv9 [35], using RGB spectral data from UAV imagery to assess their performance in coffee plant detection.
Starting from YOLOv3 [36], the YOLO architecture is divided into three parts: backbone, neck, and head.
- Backbone: This is a convolutional neural network responsible for extracting key multi-scale features from the image. Shallow features, such as edges and textures, are extracted in the early stages of the network, while deeper layers capture high-level features like objects and semantics. YOLOv5 uses a variant of CSPNet (Channel-wise Spatial Pyramid Network) as its backbone [37], making the network lighter and optimizing inference speed. YOLOv7 employs an improved Efficient Layer Aggregation Network (ELAN) as its backbone [38], enhancing feature extraction through a more efficient layer aggregation mechanism. YOLOv8 utilizes a similar backbone to YOLOv5 but with an improved CSPLayer [39], thereby enhancing feature representation capabilities.
- Neck: Positioned between the backbone and head, the neck is responsible for feature fusion and enhancement. It extracts multi-scale features to detect objects of varying sizes, making it ideal for identifying coffee trees of different ages. YOLOv5’s neck retains the Path Aggregation Network (PAN) structure, similar to YOLOv4 [40], but with lightweight improvements to optimize the speed of feature fusion. YOLOv7 enhances the model’s ability to perceive multi-scale objects, maintaining a focus on small targets during feature aggregation. YOLOv7 strikes a better balance between efficiency and accuracy [41]. YOLOv8 employs the PANet structure, allowing for both top–down and bottom–up feature fusion [42], increasing the receptive field and enriching semantic information.
- Head: The head is the final part of the network, responsible for predicting the object’s class, location, and confidence score based on the multi-scale features provided by the neck. YOLOv5 and YOLOv7 optimized the detection head to be more efficient while retaining high accuracy [43,44]. YOLOv8 introduced a new decoupled head structure that separates classification and regression tasks [45], improving the model’s flexibility and stability.
YOLOv9 (Figure 3) focuses on solving the issue of information loss (the “information bottleneck”) caused by various downscaling operations during the feedforward process in YOLOv7 [46]. YOLOv9 introduces two novel techniques: Programmable Gradient Information (PGI) and General Efficient Layer Aggregation Network (GELAN). These innovations not only resolve the information bottleneck but also push the boundaries of object detection accuracy and efficiency.
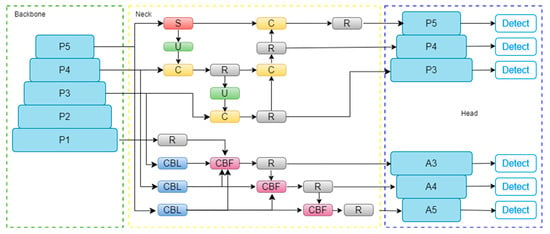
Figure 3.
The framework of YOLOv9.
In Figure 3, the backbone layer operates as follows: P1 refers to the input image after two convolution operations; P2 indicates that P1 has been processed by the RepNCSPELAN4 module. P3 is the result of applying a convolution operation and RepNCSPELAN4 to P2; similarly, P4 represents P3 processed with convolution and RepNCSPELAN4, and P5 indicates that P4 has undergone the same processing.
In the neck layer of Figure 3, R represents the RepNCSPELAN4 structure, CBL stands for CBLinear, CBF for CBFuse, C denotes concatenation (Concat), U for Upsample, and S represents the SPPELAN structure.
In the head layer of Figure 3, P3 refers to the output of the neck layer’s P3 used as the primary input, while P4 and P5 represent the outputs of P4 and P5 in the neck layer, respectively. Likewise, A3 refers to the neck layer’s P3 output used as the primary input, with A4 and A5 corresponding to P4 and P5. However, the processing of A3, A4, and A5 in the head layer differs from that of P3, P4, and P5 in the neck layer.
2.3.2. Dual-Channel NMS
Non-maximum suppression (NMS) [47] is an important post-processing step used in the YOLO object detection framework [48]. Its primary purpose is to filter out redundant or overlapping bounding boxes, ensuring that each detected object is represented by a single, high-quality bounding box.
When processing multispectral data, YOLO can only accept three-channel inputs. Therefore, different spectral bands were combined and fed separately into the YOLO model for detection. It was observed that different spectral combinations during various phenological stages had a significant impact on YOLO’s detection performance. Specifically, RGB imagery was more effective for detecting growth stage images, while RGN imagery was better suited for detecting flowering stage images. Building on the strong performance of traditional NMS in YOLO, a dual-channel non-maximum suppression (dual-channel NMS) method is proposed to further enhance detection accuracy.
Dual-channel non-maximum suppression refers to the process of combining object detection results from YOLO across two different spectral combinations: RGB and RGN. By feeding the detection outputs from both channels into the NMS algorithm, redundant bounding boxes are removed, and overlapping detections are merged (Figure 4).

Figure 4.
The framework of dual-channel NMS.
This method enhances the accuracy of coffee plant detection by ensuring more precise identification of individual coffee plants, leveraging the complementary information from both spectral combinations.
2.3.3. Workflow
The entire workflow of this study is illustrated in Figure 5. First, the RGB spectral composite images from the multispectral dataset captured by UAVs were fed into mainstream YOLO models for comparative analysis of coffee recognition performance, identifying the model that achieved the best results. Next, the multispectral data obtained from UAVs were combined to generate multiple sets of three-channel data, which were then input into the optimal YOLO model for the recognition and segmentation of coffee plants. A comparison of the recognition and segmentation performance across different spectral combinations revealed that RGB and RGN emerged as the two best combinations, each exhibiting distinct advantages. Finally, the segmentation results from both the RGB and RGN combinations were merged using the dual-channel non-maximum suppression method proposed in this study, leading to more accurate statistics of plant counts.

Figure 5.
The workflow of this study.
2.4. Metrics
In this study, three common evaluation metrics were employed: recall (R), precision (P), and mean average precision (mAP). Additionally, for the evaluation of coffee plant counting, the crucial counting accuracy (CA) metric was used.
Recall refers to the proportion of true positive samples that the model successfully predicts as positive out of all actual positive samples, which is computed using Formula (1). It measures the model’s ability to identify positive instances. A high recall value indicates that the model has a low rate of missing relevant objects and is effective at capturing most of the positive instances.
where TP represents true positives, and FN represents false negatives.
Precision refers to the proportion of true positive samples out of all samples predicted as positive by the model, as shown in Formula (2). It measures the accuracy of the model’s positive predictions. A high precision value indicates a low probability of mistakenly identifying background or non-target objects as positive targets.
where TP represents true positives, and FP represents false positives.
When calculating the mean average precision (mAP), both the mAP50 and mAP50–95 were used.
mAP50 is the average precision calculated for each class at an IoU (Intersection over Union) threshold of 0.5 [49]. IoU measures the overlap between the predicted bounding box and the ground truth box, defined as the area of intersection divided by the area of union of both boxes. For a prediction to be considered correct, the predicted bounding box must overlap with the ground truth box by more than 50%. mAP50 is a relatively lenient metric and is often used for initial model evaluation.
mAP50–95 averages the mAP values at IoU thresholds ranging from 0.50 to 0.95 in increments of 0.05. This is a stricter and more comprehensive metric, assessing the model’s performance across various IoU thresholds. It provides a more reliable evaluation, especially for detecting small objects, such as coffee seedlings.
Additionally, for evaluating the coffee plant counting results, the counting accuracy metric was used. This metric is straightforward, direct, and highly persuasive, which is computed using Formula (3):
where Cnp represents the correctly detected number of coffee plants, and Tnp represents the total number of detected plants.
3. Results
3.1. Models and Parameters
Currently, the mainstream YOLO models for object detection include YOLOv5, YOLOv7, YOLOv8, and YOLOv9, each with different strengths in detection tasks. For example, YOLOv8 is more lightweight, while YOLOv9 is better suited for detecting small objects. Unlike crops such as rice or tobacco, coffee tree cultivation is more complex. The environment includes non-agricultural features such as roads and buildings, as well as intercropped trees like mango and macadamia. Additionally, coffee plantations often contain trees of varying ages within the same plot.
To ensure the rigor of the experiments and considering that the creators of each YOLO version primarily used RGB images for model validation, which provide richer visual information, this study also selected high-resolution RGB images captured by UAV as its validation data. These images were input into different YOLO models for prediction, and their performance was analyzed and compared to determine the optimal model.
After multiple trials, it was observed that for the coffee dataset, the maximum number of training epochs was 811 for YOLOv5m, the minimum was 152 for YOLOv8m, and YOLOv9 required 500 epochs, with an average of 333.17 epochs. Since the models automatically stop training upon convergence and save the best results, the epoch value was set to 1000 for consistency. In addition to the epoch setting, key parameters such as batch size and workers were also consistent across all models (Table 2).

Table 2.
Parameter for models.
3.2. Optimal Model
When selecting the model, this study did not divide the coffee dataset by phenological stages; in other words, the dataset contained a mix of growth, flowering, and fruiting stages to make the model more generalizable. However, to facilitate future research, the coffee plants were categorized during the annotation process into flowering and non-flowering groups. Flowering coffee plants were labeled with red bounding boxes, while non-flowering coffee plants were labeled with blue bounding boxes. Experimental comparisons were conducted across different models in terms of both coffee detection and segmentation.
When comparing the coffee detection performance, varying results were observed across different models (Table 3).

Table 3.
Coffee Detection Performance of Different YOLO Models.
We selected 12 models from YOLOv5 to YOLOv9 for experimentation. The highest precision was achieved by YOLOv9 at 89.30%, while the lowest was YOLOv5m at 84.40%. The highest recall was attained by YOLOv7 at 92.20%, with the lowest being YOLOv8x at 86.00%. In terms of mAP50, YOLOv9 achieved the highest score of 94.60%, while YOLOv8x had the lowest at 93.00%. For mAP50–95, YOLOv9 again performed the best with a score of 64.60%, while YOLOv5m had the lowest at 63.80%. Overall, YOLOv9 demonstrated the best comprehensive performance.
Similarly, when comparing coffee segmentation results, it was found that different models exhibited varying performances. Additionally, there was no direct correspondence between coffee detection and segmentation performance (Table 4).

Table 4.
Coffee Segmentation Performance of Different YOLO Models.
Using the same approach as in coffee detection, we selected 12 models from YOLOv5 to YOLOv9 to perform single-plant segmentation on the detected coffee plants. The highest precision was achieved by YOLOv9 at 88.90%, while the lowest was YOLOv5m at 84.60%. The highest recall was achieved by YOLOv7 at 92.30%, with the lowest being YOLOv8x at 85.50%. For mAP50, both YOLOv9 and YOLOv8l achieved the highest score of 94.80%, while YOLOv5l had the lowest at 92.30%. For mAP50–95, YOLOv8s performed the best with 61.10%, and YOLOv5n the lowest at 54.30%. Thus, YOLOv9 demonstrated the best overall performance.
In conclusion, based on both detection and segmentation results, YOLOv9 exhibits the best and most stable overall performance. It is particularly effective in recognizing coffee plants at different growth stages (Figure 6) and segmenting individual coffee plants (Figure 7).
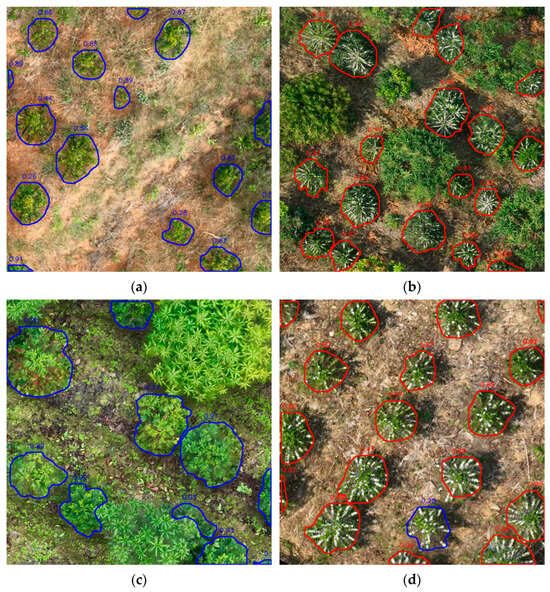
Figure 6.
YOLOv9 Detection of Coffee Plants at Different Phenological Stages: (a) Coffee seedlings, roughly 12 months old, alongside weeds; (b) Flowering coffee, about 3 years old, with intercropped plants; (c) Fruiting coffee, around 4 years old, with intercropped plants; (d) Flowering coffee, approximately 3 years old, misclassified as non-flowering.
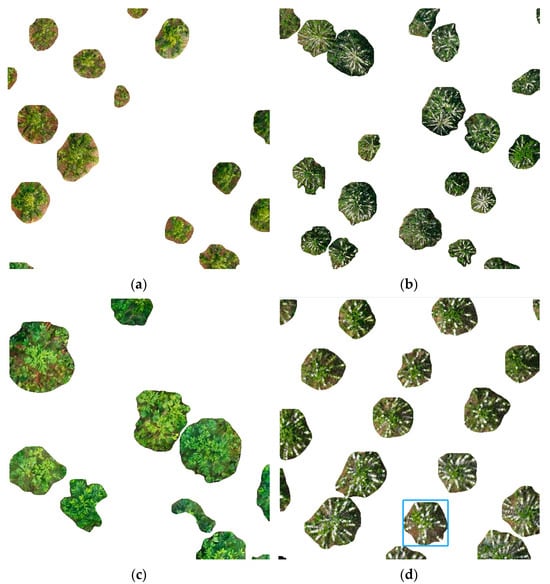
Figure 7.
YOLOv9 Segmentation of Coffee Plants at Different Phenological Stages: (a) Segmentation results for the seedling stage; (b) Segmentation results for the flowering stage; (c) Segmentation results for the fruiting stage; (d) Segmentation results for the flowering stage.
Figure 6 shows the identification of coffee plants at different phenological stages. The results demonstrate that the YOLOv9 model effectively detects coffee plants across various stages with minimal interference from other vegetation. However, misclassification can occur during the flowering stage, as seen in Figure 6d, where the bounding box for flowering coffee, which should be red, is mistakenly labeled as blue (indicating non-flowering coffee), and the model assigns it a low confidence score of only 0.28.
Figure 7 presents the segmentation results following the identification of coffee plants in Figure 6. It is clear that the YOLOv9 model performs well in segmenting individual coffee plants across various phenological stages, largely due to the accuracy of prior detection.
However, identification errors can occur during this process. For instance, in Figure 7d the coffee plant within the blue bounding box is misidentified as non-flowering, while manual observation confirms that it is actually in a flowering state. Therefore, during the coffee flowering phenological stage, if manual checks are not conducted and only the model is used for the automatic segmentation and counting of flowering coffee plants, missed detections may occur. This highlights the potential errors when using a single spectral combination for classifying coffee at different phenological stages and counting the plants. Consequently, this study employs a dual-channel non-maximum suppression method in subsequent experiments to address this issue.
3.3. Optimal Spectral Band Combination
As discussed in Section 3.2, the YOLOv9 model is better suited for coffee detection and single-plant segmentation, with varying effectiveness across different phenological stages. To accurately identify coffee plants at different stages, various multispectral band combinations from UAV data were tested using the YOLOv9 model. The goal was to identify the optimal spectral combination that could accurately detect coffee plants in all phenological stages.
For this purpose, the coffee dataset was categorized into flowering, non-flowering, and mixed data, applied all spectral combinations, and then tested their performance in coffee detection and single-plant segmentation using the YOLOv9 model (Table 5, Table 6 and Table 7).

Table 5.
Performance Comparison of Different Band Combinations on Mixed Data Using YOLOv9.

Table 6.
Performance Comparison of Different Band Combinations on Flowering Data Using YOLOv9.

Table 7.
Performance Comparison of Different Band Combinations on Non-flowering Data Using YOLOv9.
When the mixed dataset was input into the YOLOv9 model (Table 5), the spectral combination with the highest detection precision was RGB, achieving 89.30%, while the lowest was RNRe at 85.70%. The highest recall was achieved by G3 at 89.00%, and the lowest by R3 at 82.80%. For mAP50, RGN performed the best at 94.70%, while N3 was the lowest at 90.60%. For mAP50–95, RGN was the highest at 65.30%, while R3 was the lowest at 59.40%. In terms of single-plant counting, the highest precision was achieved by RGN at 89.20%, while RNRe had the lowest at 85.60%. The highest recall was achieved by G3 at 89.20%, and the lowest by R3 at 83.30%. For mAP50, RGB had the highest score of 94.80%, while N3 was the lowest at 91.20%. For mAP50–95, RGN performed the best at 61.40%, while R3 had the lowest at 56.70%. Overall, RGN proved to be the slightly superior spectral combination.
Next, the flowering dataset was tested with the YOLOv9 model (Table 6). The results showed that for both coffee detection and single-plant segmentation in the flowering dataset, the RGB combination outperformed other spectral combinations, with N3 performing the worst. The RGN combination did not show any significant advantages.
Finally, the non-flowering dataset was tested with the YOLOv9 model (Table 7). For coffee detection, the highest precision was achieved by RGN at 88.80%, and the lowest by Re3 at 88.30%. The highest recall was achieved by RGRe at 89.30%, while the lowest was R3 at 77.90%. For mAP50, RGN achieved the highest score at 93.90%, while R3 had the lowest at 87.80%. Both RGN and NGRe achieved the highest mAP50–95 scores at 65.00%, with R3 having the lowest at 55.70%. In single-plant counting, RGN again had the highest precision at 89.10%, while RNRe had the lowest at 82.80%. The highest recall was achieved by RGRe at 90.10%, while R3 had the lowest at 79.00%. For mAP50, RGN had the highest score at 94.00%, while R3 had the lowest at 89.30%. NGRe had the highest mAP50–95 at 62.40%, while R3 had the lowest at 54.30%. Overall, RGN clearly outperformed the other spectral combinations, while R3 performed the worst. RGB did not show significant advantages or disadvantages.
In conclusion, different spectral combinations exhibit varying effectiveness for different phenological stages of coffee plants. The RGB combination is most effective for detecting flowering coffee, while the RGN combination is more effective for detecting non-flowering coffee.
To visually compare the RGB and RGN spectral combinations, the precision–recall (PR) curves were plotted to illustrate their performance in coffee detection (Figure 8). In the PR curve, the horizontal axis represents the recall, while the vertical axis represents the precision. Generally, as recall increases, precision tends to decrease, and vice versa. The PR curve reflects this trade-off. The closer the curve is to the top-right corner, the better the model is at maintaining both high precision and high recall, indicating more accurate predictions. Conversely, curves closer to the bottom-left corner suggest that the model struggles to balance precision and recall, resulting in less accurate predictions.
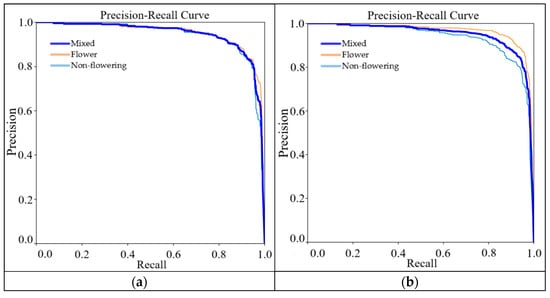
Figure 8.
PR Curve: (a) RGN spectral combination; (b) RGB spectral combination.
It is clear from the curves that the RGN combination exhibits greater stability across different tasks, with minimal performance variation in coffee detection at various phenological stages. In contrast, the RGB combination shows less stability, with more significant performance fluctuations. The RGB combination performs best for detecting flowering coffee, even surpassing RGN in this specific task. Therefore, from a performance standpoint, the two spectral combinations demonstrate different strengths in different detection tasks.
3.4. Coffee Counting
From the experiments above, it was found that different spectral combinations produce varying performances in coffee detection and single-plant segmentation. There are several reasons for this. First, during detection coffee trees with low confidence scores are discarded. Second, large coffee canopies may lead to duplicated detections (Figure 9). Additionally, missed detections can occur, all of which directly affect the accuracy of coffee plant counting.
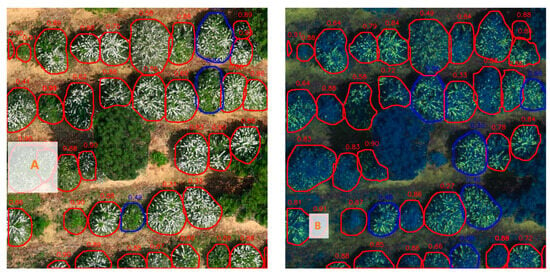
Figure 9.
Detection Results of Different Spectral Combinations: (A) RGB spectral combination; (B) RGN spectral combination.
In Figure 9, blue boxes represent detection errors, with generally low confidence scores, meaning these would be discarded during segmentation. In Region A of Figure 9A, one coffee tree was detected as two, with a smaller box inside a larger one. In Region B of Figure 9B, an area was missed entirely by the RGB spectral combination. These issues contribute to inaccurate plant counting.
To accurately count coffee plants, the dual-channel non-maximum suppression method, described in Section 2.3.2, was proposed. This method merges the detection results from both the RGN and RGB spectral combinations and applies non-maximum suppression (NMS) to retain more accurate detections. However, after combining the two channels, overlapping bounding boxes may appear (Figure 10), similar to Region A in Figure 9A.
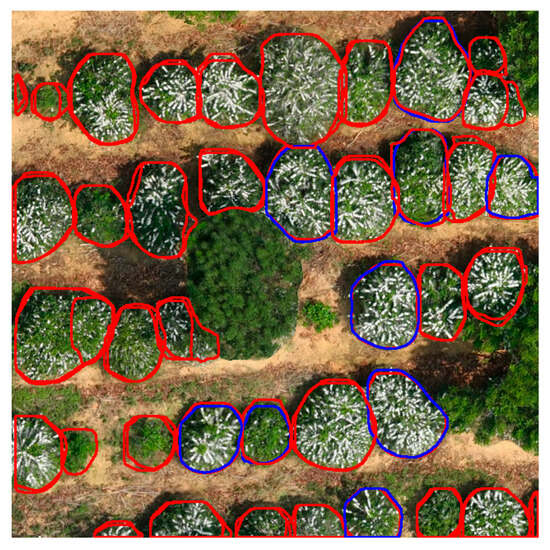
Figure 10.
Overlapping Bounding Boxes After Dual-channel Merging.
To correctly handle overlapping boxes in various cases, multiple experiments were conducted, and the following rule was established: if the overlap area between two boxes exceeds 80% of one box’s area or is less than 50% of the other box’s area, it is considered a duplicate detection, and only the larger box is retained (Figure 11). Experimental results demonstrated that this method is effective.
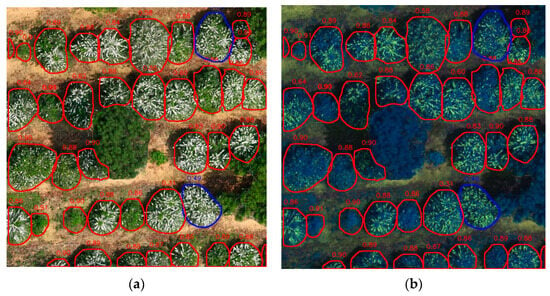
Figure 11.
Results After Dual-channel NMS for Different Spectral Combinations: (a) RGB spectral combination; (b) RGN spectral combination.
As shown in Figure 11, after applying dual-channel non-maximum suppression, the results from RGB and RGN images are consistent, with a significant reduction in erroneous detections. However, two coffee trees were still missed.
Finally, coffee plant counting was performed using the results obtained after applying dual-channel non-maximum suppression, and these counts were compared with the plant counts from the unprocessed RGB and RGN combinations (Table 8).

Table 8.
Coffee Plant Counting Across Different Phenological Stages.
As shown in Table 8, the dual-channel non-maximum suppression method proposed in this study achieved an accuracy of 97.70% on the flowering dataset. Although the accuracy on the non-flowering dataset was 99.20%, only 0.2% lower than the highest result of 99.40%, the accuracy on the mixed dataset reached 98.40%, surpassing the other spectral combinations. In fact, the model’s performance on the mixed dataset is of greater interest as it enhances the model’s generalizability.
4. Discussion
The primary objective of this study is to develop a robust model capable of accurately counting coffee plants at different phenological stages, which is essential for yield estimation. This model is particularly significant for Yunnan, where coffee is cultivated on steep, complex terrains and often intercropped with other plants. The integration of UAV multispectral data for plant counting presents a valuable approach for enhancing coffee detection efficiency, thereby providing a solid technical foundation for future automated harvesting.
Overall, the findings lead to several key conclusions that enrich the understanding of crop plant counting: (a) The experiments demonstrate the exceptional performance of the YOLOv9 model in coffee plant counting. Compared to other mainstream YOLO models, YOLOv9 consistently excels across all phenological stages and under complex intercropping conditions. This adaptability underscores the model’s robustness and reliability, making it a valuable asset for coffee plant counting in diverse environments. (b) This research highlights the significant positive impact of multispectral features on model performance. By evaluating various spectral combinations, two critical combinations—RGB and RGN—were identified as essential for enhancing model accuracy in coffee plant counting. (c) The proposed dual-channel non-maximum suppression method allows for the effective utilization of the two most important spectral combinations, substantially improving counting accuracy.
In terms of model selection, while various YOLO variants excel in object detection, this study focused on the unique growth environments and phenological characteristics of coffee. YOLOv9 ultimately demonstrated the best overall performance, offering a balance between accuracy and efficiency. However, the authors recognize that YOLOv9 may not represent the pinnacle of performance. During the writing of this paper, newer versions like YOLOv10 and YOLOv11 were released, which offer improvements in both lightweight design and efficiency. Future research should consider evaluating these models for further optimization.
Regarding the choice of multispectral imagery, the results indicate that multi-band combinations significantly outperform single-band data (e.g., G3, N3, R3, and Re3) in distinguishing coffee from other crops. Traditional RGB bands remain vital, especially during the flowering stage, whereas RGN imagery proves more effective during non-flowering periods. This effectiveness is attributed to the distinctive white color of coffee flowers, facilitating their identification in RGB images. The Near-infrared (NIR) band in the RGN combination provides valuable insights into chlorophyll content and leaf moisture [50], assisting in differentiating non-flowering coffee plants from other crops. Previous studies have largely focused on single three-channel spectral combinations, but this research highlights that different spectral combinations are suited to different phenological stages, offering a new perspective for future crop detection studies.
The dual-channel non-maximum suppression method capitalizes on the strengths of different spectral combinations in coffee detection. Traditional YOLO models are limited to three-channel inputs, restricting the effective use of multispectral data that capture various growth characteristics across different bands. If only three spectral bands are employed, critical information related to crop growth may be overlooked. Moreover, fixed spectral combinations can only represent crop features at specific phenological stages. By merging the most informative spectral combinations—RGB and RGN—the model’s performance in detecting, segmenting, and counting coffee plants is significantly enhanced.
To enable comparison with other studies, precision (P), recall (R), average precision (AP), and counting accuracy (CA) were used as performance metrics. These ratio-based metrics enable meaningful cross-study comparisons. The most relevant and recent studies were selected for comparison with the findings of this research (Table 9).

Table 9.
Comparison with other studies.
In terms of plant counting accuracy, the proposed method may lead to further improvements in the procedures used by other approaches.
For instance, the method proposed by Lucas Santos Santana (2023) [51] focused on counting coffee plants of various age groups across different sample plots. For consistency in comparison, the best results from different age groups were averaged. Since their study utilized only RGB images of 3-month-old and 6-month-old coffee plants, which do not flower, non-flowering coffee data were also employed for comparison. While the performance metrics in this study surpass those reported by Lucas Santos Santana (2023) [51], this research primarily addresses different phenological stages and has not yet focused specifically on seedlings. Coffee seedlings, due to their smaller height and diameter, are more challenging to distinguish from other shrubs. However, the method presented here represents a significant advancement over the metrics established in the earlier work.
Hong Lin’s study (2023) [26] investigated tobacco plant counting using multispectral data. Although the crops differ, the methodologies share similarities. As with the previous comparison, the best results from their sample plots were averaged for evaluation. Since the tobacco plants in their study were in the non-flowering stage, non-flowering coffee data were also used for comparison. While Hong Lin’s (2023) [26] study reported higher precision and recall, this approach achieved a higher average precision. It is important to recognize that the cultivation of tobacco and coffee occurs under vastly different conditions. Tobacco is typically grown without the complexity of intercropping, and strict standards for plant and row spacing in tobacco cultivation differ from the more flexible practices in coffee farming. These factors illustrate the greater difficulty in accurately counting coffee plants, indicating that the method proposed may contribute to improvements in the techniques described in their research.
5. Conclusions
This study presents a novel approach for coffee plant counting using multispectral data captured by UAVs. The key objectives and outcomes of this study are as follows: (a) We compared the performance of several mainstream YOLO models for coffee detection and segmentation tasks, and identified YOLOv9 as the most effective model, with it achieving high precision in both detection (P = 89.3%, mAP50 = 94.6%) and segmentation (P = 88.9%, mAP50 = 94.8%). YOLOv9 consistently outperformed other models in terms of accuracy and reliability. (b) We evaluated different combinations of multispectral data to determine their effectiveness for coffee detection across various phenological stages. We found that RGB performed best during the flowering stage, while RGN was more suitable for non-flowering periods, indicating that different spectral combinations cater to different growth stages. (c) We proposed and employed an innovative dual-channel non-maximum suppression (NMS) method, which merges detection results from both RGB and RGN spectral data. This method successfully leveraged the strengths of each spectral combination, leading to a significant improvement in detection accuracy, with the final coffee plant counting accuracy reaching 98.4%.
In conclusion, the integration of UAV multispectral data with advanced deep learning models such as YOLOv9 provides a powerful tool for enhancing coffee yield estimation. This method offers significant potential for improving not only coffee plant detection and counting but also a range of crop monitoring tasks, thereby contributing to sustainable and efficient agricultural practices. Future research will focus on further refining the technology to optimize yield estimation and ensure broader applications in precision agriculture.
Author Contributions
Conceptualization, C.Z.; methodology, X.W.(Xiaojun Wei); software, F.C.; validation, C.L.; formal analysis, Z.Q.; writing—original draft preparation, X.W. (Xiaorui Wang); funding acquisition, C.Z. All authors have read and agreed to the published version of the manuscript.
Funding
This research was funded by the National Natural Science Foundation of China (32160405); the Joint Special Project for Agriculture of Yunnan Province, China (202301BD070001-238,202301BD070001-008); and the Department of Education Scientific Research Fund of Yunnan Province, China (2023J0698).
Data Availability Statement
The data used in this research are collected and labeled by ourselves. We will publish all the codes and datasets in this study after the article is accepted https://github.com/legend2588/Coffee-plant-counting.git (accessed on 14 September 2024).
Conflicts of Interest
The authors declare no conflicts of interest.
References
- Gaspar, S.; Ramos, F. Caffeine: Consumption and Health Effects. In Encyclopedia of Food and Health, 1st ed.; Caballero, B., Finglas, P.M., Toldrá, F., Eds.; Academic Press: 2016; pp. 573–578.
- Chéron-Bessou, C.; Acosta-Alba, I.; Boissy, J.; Payen, S.; Rigal, C.; Setiawan, A.A.R.; Sevenster, M.; Tran, T.; Azapagic, A. Unravelling life cycle impacts of coffee: Why do results differ so much among studies? Sustain. Prod. Consum. 2024, 47, 251–266. [Google Scholar] [CrossRef]
- Zhu, T. Research on the Current Situation and Development of China’s Coffee Market. Adv. Econ. Manag. Political Sci. 2023, 54, 197–202. [Google Scholar]
- China Industry Research Institute. Annual Research and Consultation Report of Panorama Survey and Investment Strategy on China Industry; China Industry Research Institute: Shenzhen, China, 2023; Report No. 1875749. (In Chinese) [Google Scholar]
- Yunnan Statistics Bureau. 2023 Yunnan Statistical Yearbook; Yunnan Statistics Bureau: Yunnan, China, 2023. (In Chinese) [Google Scholar]
- Li, W.; Zhao, G.; Yan, H.; Wang, C. A Research Report on Yunnan Specialty Coffee Production. Trop. Agric. Sci. 2024, 47, 31–40. (In Chinese) [Google Scholar]
- Alahmad, T.; Neményi, M.; Nyéki, A. Applying IoT Sensors and Big Data to Improve Precision Crop Production: A Review. Agronomy 2023, 13, 2603. [Google Scholar] [CrossRef]
- Xu, D.; Chen, J.; Li, B.; Ma, J. Improving Lettuce Fresh Weight Estimation Accuracy through RGB-D Fusion. Agronomy 2023, 13, 2617. [Google Scholar] [CrossRef]
- Zhang, Y.; Zhao, D.; Liu, H.; Huang, X.; Deng, J.; Jia, R.; He, X.; Tahir, M.N.; Lan, Y. Research hotspots and frontiers in agricultural multispectral technology: Bibliometrics and scientometrics analysis of the Web of Science. Front. Plant Sci. 2022, 13, 955340. [Google Scholar] [CrossRef]
- Ivezić, A.; Trudić, B.; Stamenković, Z.; Kuzmanović, B.; Perić, S.; Ivošević, B.; Budēn, M.; Petrović, K. Drone-Related Agrotechnologies for Precise Plant Protection inWestern Balkans: Applications, Possibilities, and Legal Framework Limitations. Agronomy 2023, 13, 2615. [Google Scholar] [CrossRef]
- Sishodia, R.P.; Ray, R.L.; Singh, S.K. Applications of Remote Sensing in Precision Agriculture: A Review. Remote Sens. 2020, 12, 3136. [Google Scholar] [CrossRef]
- Jiménez-Brenes, F.M.; López-Granados, F.; Torres-Sánchez, J.; Peña, J.M.; Ramírez, P.; Castillejo-González, I.L.; de Castro, A.I. Automatic UAV-based detection of Cynodon dactylon for site-specific vineyard management. PLoS ONE 2019, 14, e0218132. [Google Scholar] [CrossRef]
- Osco, L.P.; dos de Arruda, M.S.; Marcato Junior, J.; da Silva, N.B.; Ramos, A.P.M.; Moryia, É.A.S.; Imai, N.N.; Pereira, D.R.; Creste, J.E.; Matsubara, E.T.; et al. A convolutional neural network approach for counting and geolocating citrus-trees in UAV multispectral imagery. ISPRS J. Photogramm. Remote Sens. 2020, 160, 97–106. [Google Scholar] [CrossRef]
- Bai, X.; Liu, P.; Cao, Z.; Lu, H.; Xiong, H.; Yang, A.; Yao, J. Rice plant counting, locating, and sizing method based on high-throughput UAV RGB images. Plant Phenomics 2023, 5, 0020. [Google Scholar] [CrossRef] [PubMed]
- Barata, R.; Ferraz, G.; Bento, N.; Soares, D.; Santana, L.; Marin, D.; Mattos, D.; Schwerz, F.; Rossi, G.; Conti, L.; et al. Evaluation of Coffee Plants Transplanted to an Area with Surface and Deep Liming Based on multispectral Indices Acquired Using Unmanned Aerial Vehicles. Agronomy 2023, 13, 2623. [Google Scholar] [CrossRef]
- Zeng, L.; Wardlow, B.D.; Xiang, D.; Hu, S.; Li, D. A review of vegetation phenological metrics extraction using time-series, multispectral satellite data. Remote Sens. Environ. 2020, 237, 111511. [Google Scholar] [CrossRef]
- Boegh, E.; Soegaard, H.; Broge, N.; Hasager, C.; Jensen, N.; Schelde, K.; Thomsen, A. Airborne multispectral data for quantifying leaf area index, nitrogen concentration, and photosynthetic efficiency in agriculture. Remote Sens. Environ. 2002, 81, 179–193. [Google Scholar] [CrossRef]
- Lin, H.; Tse, R.; Tang, S.K.; Qiang, Z.P.; Pau, G. The Positive Effect of Attention Module in Few-Shot Learning for Plant Disease Recognition. In Proceedings of the 2022 5th International Conference on Pattern Recognition and Artificial Intelligence (PRAI), Chengdu, China, 19–21 August 2022; IEEE: New York, NY, USA, 2022; pp. 114–120. [Google Scholar]
- Wang, X.; Zhang, C.; Qiang, Z.; Xu, W.; Fan, J. A New Forest Growing Stock Volume Estimation Model Based on AdaBoost and Random Forest Model. Forests 2024, 15, 260. [Google Scholar] [CrossRef]
- Alkhaldi, N.A.; Alabdulathim, R.E. Optimizing Glaucoma Diagnosis with Deep Learning-Based Segmentation and Classification of Retinal Images. Appl. Sci. 2024, 14, 7795. [Google Scholar] [CrossRef]
- Bouachir, W.; Ihou, K.E.; Gueziri, H.E.; Bouguila, N.; Belanger, N. Computer vision system for automatic counting of planting microsites using UAV imagery. IEEE Access 2019, 7, 82491–82500. [Google Scholar] [CrossRef]
- Buzzy, M.; Thesma, V.; Davoodi, M.; Mohammadpour Velni, J. Real-Time Plant Leaf Counting Using Deep Object Detection Networks. Sensors 2020, 20, 6896. [Google Scholar] [CrossRef]
- Zhang, S.; Chi, C.; Yao, Y.; Lei, Z.; Li, S.Z. Bridging the Gap Between Anchor-based and Anchor-free Detection via Adaptive Training Sample Selection. In Proceedings of the IEEE/CVF Conference on Computer Vision and Pattern Recognition, Virtual, 16–18 June 2020; pp. 9759–9768. [Google Scholar]
- Think Autonomous. Finally Understand Anchor Boxes in Object Detection (2D and 3D). Available online: https://www.thinkautonomous.ai/blog/anchor-boxes/ (accessed on 6 October 2024).
- Jiang, T.; Yu, Q.; Zhong, Y.; Shao, M. PlantSR: Super-Resolution Improves Object Detection in Plant Images. J. Imaging 2024, 10, 137. [Google Scholar] [CrossRef]
- Lin, H.; Chen, Z.; Qiang, Z.; Tang, S.-K.; Liu, L.; Pau, G. Automated Counting of Tobacco Plants Using Multispectral UAV Data. Agronomy 2023, 13, 2861. [Google Scholar] [CrossRef]
- Chandra, N.; Vaidya, H. Automated detection of landslide events from multi-source remote sensing imagery: Performance evaluation and analysis of yolo algorithms. J. Earth Syst. Sci. 2024, 133, 1–17. [Google Scholar] [CrossRef]
- Redmon, J.; Farhadi, A. YOLO9000: Better, Faster, Stronger. In Proceedings of the IEEE Conference on Computer Vision and Pattern Recognition, Honolulu, HI, USA, 21–26 July 2017; pp. 278–282. [Google Scholar]
- Wang, N.; Cao, H.; Huang, X.; Ding, M. Rapeseed Flower Counting Method Based on GhP2-YOLO and StrongSORT Algorithm. Plants 2024, 13, 2388. [Google Scholar] [CrossRef]
- Hastie, T.; Tibshirani, R.; Friedman, J.H. The Elements of Statistical Learning: Data Mining, Inference, and Prediction, 2nd ed.; Springer: New York, NY, USA, 2009; pp. 347–369. [Google Scholar]
- Feng, S.; Qian, H.; Wang, H.; Wang, W. Real-time object detection method based on yolov5 and efficient mobile network. J. Real-Time Image Process. 2024, 21, 56. [Google Scholar] [CrossRef]
- Bai, Y.; Yu, J.; Yang, S.; Ning, J. An improved yolo algorithm for detecting flowers and fruits on strawberry seedlings. Biosyst. Eng. 2024, 237, 1–12. [Google Scholar] [CrossRef]
- Guan, H.; Deng, H.; Ma, X.; Zhang, T.; Zhang, Y.; Zhu, T.; Zhou, H.; Gu, Z.; Lu, Y. A corn canopy organs detection method based on improved DBi-YOLOv8 network. Eur. J. Agron. 2024, 154, 127076. [Google Scholar] [CrossRef]
- Xu, D.; Xiong, H.; Liao, Y.; Wang, H.; Yuan, Z.; Yin, H. EMA-YOLO: A Novel Target-Detection Algorithm for Immature Yellow Peach Based on YOLOv8. Sensors 2024, 24, 3783. [Google Scholar] [CrossRef]
- Wang, C.; Yeh, I.; Liao, H. Yolov9: Learning what you want to learn using programmable gradient information. arXiv 2024, arXiv:2402.13616. [Google Scholar]
- Badgujar, C.; Poulose, A.; Gan, H. Agricultural object detection with You Only Look Once (YOLO) Algorithm: A bibliometric and systematic literature review. Comput. Electron. Agric. 2024, 223, 109090. [Google Scholar] [CrossRef]
- Zhan, W.; Sun, C.; Wang, M.; She, J.; Zhang, Y.; Zhang, Z.; Sun, Y. An improved Yolov5 real-time detection method for small objects captured by UAV. Soft Comput. 2022, 26, 361–373. [Google Scholar] [CrossRef]
- Li, S.; Tao, T.; Zhang, Y.; Li, M.; Qu, H. YOLO v7-CS: A YOLO v7-based model for lightweight bayberry target detection count. Agronomy 2023, 13, 2952. [Google Scholar] [CrossRef]
- Terven, J.; Córdova-Esparza, D.-M.; Romero-González, J.-A. A Comprehensive Review of YOLO Architectures in Computer Vision: From YOLOv1 to YOLOv8 and YOLO-NAS. Mach. Learn. Knowl. Extr. 2023, 5, 1680–1716. [Google Scholar] [CrossRef]
- Wu, W.; Liu, H.; Li, L.; Long, Y.; Wang, X.; Wang, Z.; Chang, Y. Application of local fully Convolutional Neural Network combined with YOLOv5 algorithm in small target detection of remote sensing image. PLoS ONE 2021, 16, e0259283. [Google Scholar] [CrossRef]
- Wu, D.; Jiang, S.; Zhao, E.; Liu, Y.; Zhu, H.; Wang, W.; Wang, R. Detection of Camellia oleifera fruit in complex scenes by using YOLOv7 and data augmentation. Appl. Sci. 2022, 12, 11318. [Google Scholar] [CrossRef]
- Wang, G.; Chen, Y.; An, P.; Hong, H.; Hu, J.; Huang, T. UAV-YOLOv8: A small-object-detection model based on improved YOLOv8 for UAV aerial photography scenarios. Sensors 2023, 23, 7190. [Google Scholar] [CrossRef]
- Ashraf, A.H.; Imran, M.; Qahtani, A.M.; Alsufyani, A.; Almutiry, O.; Mahmood, A.; Attique, M.; Habib, M. Weapons detection for security and video surveillance using CNN and YOLO-v5s. CMC-Comput. Mater. Contin. 2022, 70, 2761–2775. [Google Scholar]
- Zhao, L.; Zhu, M. MS-YOLOv7: YOLOv7 based on multi-scale for object detection on UAV aerial photography. Drones 2023, 7, 188. [Google Scholar] [CrossRef]
- Contributors, M. YOLOv8 by MMYOLO. 2023. Available online: https://github.com/open-mmlab/mmyolo/tree/main/configs/yolov8 (accessed on 10 March 2024).
- Chien, C.T.; Ju, R.Y.; Chou, K.Y.; Chiang, J.S. YOLOv9 for fracture detection in pediatric wrist trauma X-ray images. Electronics Lett. 2024, 60, e13248. [Google Scholar] [CrossRef]
- Neubeck, A.; Van Gool, L. Efficient Non-Maximum Suppression. In Proceedings of the 18th International Conference on Pattern Recognition (ICPR’06), Hong Kong, China, 20–24 August 2006. [Google Scholar]
- Zaghari, N.; Fathy, M.; Jameii, S.; Shahverdy, M. The improvement in obstacle detection in autonomous vehicles using YOLO non-maximum suppression fuzzy algorithm. J. Supercomput. 2021, 77, 13421–13446. [Google Scholar] [CrossRef]
- Zhang, Y.F.; Ren, W.; Zhang, Z.; Jia, Z.; Wang, L.; Tan, T. Focal and efficient IOU loss for accurate bounding box regression. Neurocomputing 2022, 506, 146–157. [Google Scholar] [CrossRef]
- Candiago, S.; Remondino, F.; De Giglio, M.; Dubbini, M.; Gattelli, M. Evaluating Multispectral Images and Vegetation Indices for Precision Farming Applications from UAV Images. Remote Sens. 2015, 7, 4026–4047. [Google Scholar] [CrossRef]
- Santana, L.S.; Ferraz, G.A.e.S.; Santos, G.H.R.d.; Bento, N.L.; Faria, R.d.O. Identification and Counting of Coffee Trees Based on Convolutional Neural Network Applied to RGB Images Obtained by RPA. Sustainability 2023, 15, 820. [Google Scholar] [CrossRef]
Disclaimer/Publisher’s Note: The statements, opinions and data contained in all publications are solely those of the individual author(s) and contributor(s) and not of MDPI and/or the editor(s). MDPI and/or the editor(s) disclaim responsibility for any injury to people or property resulting from any ideas, methods, instructions or products referred to in the content. |
© 2024 by the authors. Licensee MDPI, Basel, Switzerland. This article is an open access article distributed under the terms and conditions of the Creative Commons Attribution (CC BY) license (https://creativecommons.org/licenses/by/4.0/).