Abstract
Since the 1970s, extensive halite extraction in Maceió, Brazil, has resulted in significant geological risks, including ground collapses, sinkholes, and infrastructure damage. These risks became particularly evident in 2018, following an earthquake, which prompted the cessation of mining activities in 2019. This study investigates subsidence deformation resulting from these mining operations, focusing on the collapse of Mine 18 on 10 December 2023. We utilized the Quasi-Persistent Scatterer Interferometric Synthetic Aperture Radar (QPS-InSAR) technique to analyze a dataset of 145 Sentinel-1A images acquired between June 2019 and April 2024. Our approach enabled the analysis of cumulative displacement, the loss of amplitude stability, the evolution of amplitude time series, and the amplitude change matrix of targets near Mine 18. The study introduces an innovative QPS-InSAR approach that integrates phase and amplitude information using amplitude time series to assess the lifecycle of radar scattering targets throughout the monitoring period. This method allows for effective change detection following sudden events, enabling the identification of affected areas. Our findings indicate a maximum cumulative displacement of −1750 mm, with significant amplitude changes detected between late November and early December 2023, coinciding with the mine collapse. This research provides a comprehensive assessment of deformation trends and ground stability in the affected mining areas, providing valuable insights for future monitoring and risk mitigation efforts.
1. Introduction
Salt mining is a long-standing socioeconomic activity centered on extracting salt from underground sedimentary rock deposits. These rocks are formed through the precipitation of salts from evaporating saline water, primarily consisting of halite (NaCl), which is processed into various products like caustic soda and polyvinyl chloride [1,2]. Due to the significant depth and chemical characteristics of halite deposits, extraction is often performed using a solution mining method. This technique involves fluids to dissolve the mineral, allowing it to be extracted in liquid form and later recovered [3]. Ground collapse induced by the dissolution of salt mine caverns is a prevalent issue in the salt industry. This phenomenon poses significant geological risks, such as sinkholes, landslides, and infrastructure damage, resulting in extensive and often unpredictable long-term consequences [4]. Such occurrences have been documented in various regions, including China [5], Romania [6], France [7], and recently in Brazil (Maceió).
Since the 1970s, the Mundaú Lagoon area in Maceió has been a major site for rock salt extraction with 35 wells located in the neighborhoods of Mutange, Pinheiro, and Bebedouro. This extensive mining activity has generated significant geological hazards for the local population with observable structural damage such as cracks in buildings, fissures in streets, and ground depressions in these densely populated neighborhoods, which include a diverse socioeconomic demographic [8]. The risks from these mining activities became particularly evident following the 2018 earthquake, which prompted the cessation of mining operations in 2019. However, the full extent of the geological risks was underscored by the collapse of Mine 18 on 10 December 2023. This incident highlighted the severe subsidence deformation occurring in the region, necessitating a detailed analysis to understand and mitigate future risks [8,9,10,11,12].
In recent years, remote sensing technologies have become increasingly important for monitoring mines, providing a viable alternative to traditional geotechnical measurements [13]. Interferometric Synthetic Aperture Radar (InSAR) has proven to be a valuable tool independent of weather conditions with various important applications for monitoring the Earth’s surface. This technology is widely used in environmental monitoring, infrastructure monitoring, natural disaster management, glacier monitoring, topographic mapping, irrigation management, volcano monitoring, and soil deformation monitoring, which are sometimes caused by human activities such as mining [14,15,16]. InSAR relies on the phase information recorded in a Synthetic Aperture Radar (SAR) image. By comparing the phase acquired at different times, InSAR can detect changes in the distance between the sensor and the target. The phase difference between two SAR images allows for the precise measurement of surface displacement or deformation [17,18,19,20,21]. Multi-temporal InSAR (MT-InSAR) techniques enable the measurement and continuous monitoring of displacement and its temporal evolution with millimetric precision [22]. Central to these observations are Persistent Scatterers (PSs), which are pixels with high phase stability and temporal coherence throughout the entire time series [23]. Persistent Scatterer Interferometry (PSI) is a specialized method designed to identify stable scattering characteristics within a series of SAR images, enhancing the accuracy of deformation monitoring. PSI is particularly advantageous for monitoring urban subsidence, as it leverages the high density of PS points provided by buildings, infrastructure, and roads [23,24]. Despite InSAR being independent of weather conditions, it is necessary to account for the atmospheric contribution to the signal phase. The signal phase has a geometric, topographic, and atmospheric contribution, which is a phase component attributed to the displacement of the scatterer in the line-of-sight (LOS) direction, and the phase noise due to the scattering background and other noise terms. The geometric contribution is associated with the satellite’s orbit and can be mitigated by utilizing precise orbits of Sentinel-1A which were used in the analysis together with the digital elevation model (DEM) to simulate and remove the topographic phase component. The atmosphere has spatially and temporally variable refractive indices, causing significant phase variations. Atmospheric conditions such as water vapor and clouds can cause phase delays and distortions [25,26]. For small areas, the atmospheric delay has a decorrelation length of several hundred meters; i.e., it can be assumed that for small areas, the atmosphere can be neglected [27].
Several studies have been conducted in Maceió to understand the causes and trends of deformation before and after the 2018 event. The Brazilian Geological Service explored four potential causes of subsidence [8]: (1) geotechnical characteristics of the region’s soils and land use in the neighborhood; (2) underground salt mines; (3) active tectonic structures; and (4) excessive underground water exploitation. The persistent scatterer pairs (PSPs) [28] technique was applied to 60 ascending SLC images of the COSMO-SkyMed satellite taken between April 2016 and December 2018 to analyze the subsidence phenomenon. The findings revealed a 40 cm subsidence in radial deformation centered in the mining area with maximum intensity reached at the beginning of 2018 and a decrease in acceleration in the second half of the year [29]. The report concluded that in portions of the Pinheiro, Mutange, and Bebedouro neighborhoods, cavity destabilization caused by rock salt extraction is ongoing, resulting in salt movement, subsidence, and brittle deformations on the surface, such as cracks in the ground and buildings [8,29].
Euillades et al. [9] studied the subsequent crustal deformation process estimating the mean velocity of deformation using 81 Sentinel-1 SAR images from April 2014 to May 2019 and the Small Baseline Subsets (SBASs) time series technique. They found localized subsidence and deformation in the Mutange, Pinheiro, and Levada neighborhoods along the Mundaú Lagoon coast with increasing deformation rates between 2015 and 2019. Another key finding was a cumulative 100 mm deformation in the Levada neighborhood, starting between January and October 2016.
Vassileva et al. [10] presented a 16-year history of spatial–temporal subsidence evolution in Maceió, applying the SBAS technique to a time series from 2004 to 2020 using images from ENVISAT, ALOS-1, ALOS-2, and Sentinel-1. This study also employed 2D geomechanical simulation and 3D geophysical source inversion to evaluate the fundamental cause of the subsidence pattern. The main findings included a pattern of slow displacement acceleration with rates increasing from approximately 100 mm/year (2007–2008), to 120 mm/year (2010–2011), reaching 270 mm/year by 2017. The maximum cumulative subsidence near the coast of Lagoon Mundaú was 2000 mm. These results highlighted ongoing subsidence in the region up to 2020.
Hartwig et al. [12] compiled 160 Sentinel-1 images related to the subsidence process in Maceió, revealing maximum subsidence rates of −220 mm/year for the PSI technique and −207 mm/year for SBAS with a cumulative displacement of −100 mm between 2016 and 2020. Alves et al. [11] applied the PSI technique to 21 Sentinel-1A SAR images from 2017 to 2018 to investigate ground deformation before and after the 2018 earthquake, and they applied it to 22 Sentinel-1A SAR images acquired between 2021 and 2022 to assess ongoing subsidence in the area. The results showed a reduction in displacement amplitude from −32.3 mm/year in 2017–2018 to −24.09 mm/year in 2021–2022, suggesting that while the subsidence rate had slowed, the region continued to experience deformation. The study also noted ongoing subsidence in the Levada neighborhood, which appears to be affected by the reactivation of geological faults in the region despite being somewhat distant from the mining site. These faults may have been triggered by accelerated ground movement near the mines. While multiple studies have examined subsidence phenomena up until 2022, no previous research has specifically analyzed the 2023 subsidence event. Therefore, this work addresses a significant gap in the literature by focusing on the events surrounding the collapse of Mine 18 in December 2023, providing new insights into the most recent subsidence activity in the area.
In this study, we advance the understanding of subsidence deformation in Maceió by focusing on a more recent and significant geological event—the collapse of Mine 18 in December 2023. Unlike previous studies that primarily analyzed subsidence trends up to 2022, our research extends the temporal scope by utilizing the Quasi-Persistent Scatterer Interferometric Synthetic Aperture Radar (QPS-InSAR) technique on a dataset comprising 145 Sentinel-1A images from June 2019 to April 2024. This approach enables us to capture the cumulative displacement and amplitude variations with unprecedented detail, particularly in the period surrounding the mine collapse. By applying the QPS-InSAR technique, we improve the detection and analysis of partially coherent targets, which has been a challenging aspect of subsidence monitoring. Consequently, our study provides insights into the ongoing subsidence processes but also sets an emphasis on analyzing the amplitude both before and after the collapse of Mine 18 as well as a new benchmark for future monitoring and risk mitigation strategies in similar geologically vulnerable regions.
This article is organized as follows: Section 2 provides a detailed background on the geological history of the study area. Section 3 describes the InSAR data and methodologies employed in this study. Section 4 presents the main findings, including PSI analysis, QPS-InSAR analysis, comparison between the PSI and QPS-InSAR approach, and amplitude analysis. In Section 5, we discuss and summarize the results. Finally, conclusions are presented in Section 6.
2. Study Area
The study focuses on Maceió, located in northeast Brazil, which is around 9.64°S latitude and 35.74°W longitude (Figure 1). Positioned between the Mundaú Lagoon to the east and the Atlantic Ocean to the west, Maceió is currently facing one of Brazil’s most significant environmental crises. According to the Brazilian Institute of Geography and Statistics, Maceió comprises 50 neighborhoods and spans 509,320 km2 with a population of approximately 957,916 inhabitants.
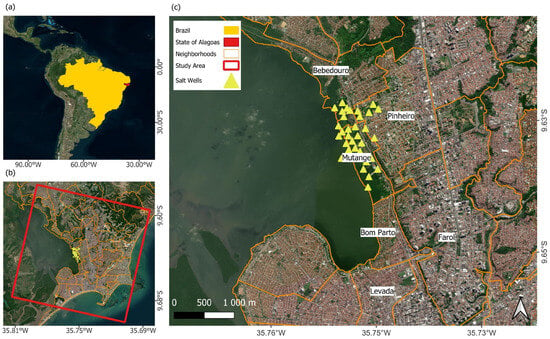
Figure 1.
Overview of the study area. (a) Location of the state of Alagoas; (b) area of interest demarcated by the red polygon; (c) border of the neighborhoods, with the marking of the neighborhoods closest to the mining complex, and location of the mines (yellow triangle). Image background: Bing Aerial Map.
Geologically, the city is part of the Sergipe-Alagoas Sedimentary Basin, which is situated along the continental margin between the states of Sergipe and Alagoas. This basin covers 13,000 km2 onshore and 40,000 km2 offshore and is primarily composed of sedimentary rocks from the Paleozoic and Mesozoic eras [30]. The basin is structured into five supersequences: Paleozoic, Pre-Rift, Rift, Post-Rift, and Drift [31,32]. The rifting processes within the basin have created fault-bounded blocks, with significant evaporite deposits, particularly halite, found between the Rift and Post-Rift sequences in the Maceió Formation. These evaporites, consisting of salt layers up to 288 m thick, interbedded with siliciclastic and carbonate rocks, are located at depths exceeding 850 m [2,33].
Maceió city is situated on two distinct geomorphological units: an elevated area and the coastal plain. The elevated area ranges from 20 to 100 m above sea level, while the plain consists of fluvial and lagoonal deposits associated with the Mundaú Lagoon. The transition between these two geomorphological units is abrupt, and it is characterized by steep slopes and cliffs within the city [9]. The Pinheiro neighborhood has elevations that range between 42 and 55 m with some areas naturally prone to flooding. Mutange is located along the steep slopes of a cliff that runs parallel to the lagoon’s edge, extending into part of the fluviolagoon plain between the cliff’s base and the lagoon. Bebedouro lies northwest of Pinheiro and Mutange, and it is positioned between the plateau and the mangrove-covered fluviolagoon plain bordering the Mundaú Lagoon [2,8].
Evaporitic rocks are sedimentary formations created in evaporite basins by the precipitation of minerals from evaporating water, leading to the formation of salt crystals. Halite, primarily composed of sodium chloride (NaCl), is the dominant mineral in these rocks. Its production and extraction depend on several critical properties, including low porosity, low density, and high solubility. The most common method for extracting halite is solution mining, which involves drilling down to the halite layer, injecting warm water (60 °C) to dissolve the salt, and extracting the resulting brine (29 °C) using a pressure system. After extraction, wells must be filled with stabilizing materials to prevent ground instability [34,35,36,37].
In Maceió, halite was first discovered in 1941, although active mining operations only began in 1970 [34]. Currently, 35 halite mines operate in the Maceió metropolitan area with depths varying between 570 and 1073 m. These mines are clustered in the subsiding areas of Mutange, Pinheiro, and Bebedouro neighborhoods (Figure 2). In early 2018, the first signs of an impending catastrophe were reported by residents with cracks appearing in buildings and ground depressions forming. The alarm intensified after a magnitude 2.4 earthquake on March 3. Several public buildings, including a psychiatric hospital and a cemetery, were evacuated in the same year. Over 46,000 buildings were designated as being within risk zones, prompting the relocation of about 60,000 residents to safer areas. Since mining operations ceased in 2019, local civil defense and government agencies have been continuously monitoring the region to safeguard the population. The neighborhoods most affected by surface deformation include Pinheiro, Bom Parto, Mutange, Bebedouro, and Farol [8].
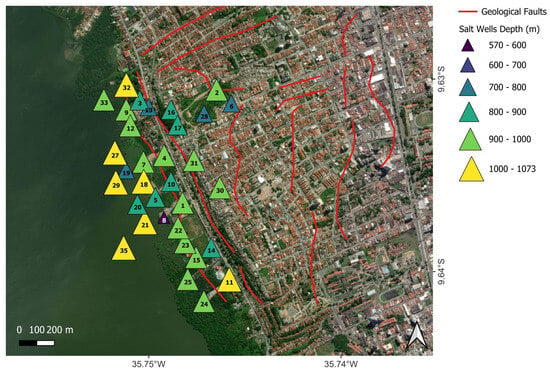
Figure 2.
Representation of the location and identification of halite wells (indicated by colored triangles) and geological faults (indicated by red lines) as identified in [8,29]. Each triangle is numbered by the identification number associated with the wells. The color and size of the triangles indicate the depth of each well: smaller, darker triangles represent shallower wells, while larger, yellow triangles indicate deeper wells. Mines 26 and 34 are excluded due to unknown depths. Image background: Bing Aerial Map.
The most recent incident occurred on 10 December 2023, when Mine 18, one of the 35 mines, collapsed. This mine, located on the waterfront of the Mundaú Lagoon, caused the sinking of five surrounding neighborhoods, according to local media reports. Due to the collapse and the topography of the region, the area is vulnerable to flooding, which may further aggravate the instability of the ground [8].
3. Materials and Methods
3.1. InSAR Data
The subsidence in Maceió was analyzed using 145 radar images acquired between June 2019 and April 2024 by Sentinel-1A satellite in Interferometric Wide Swath (IW) mode. The study utilized Single Look Complex (SLC) images from an ascending orbit with VV popularization, an incidence angle of 33.7825°, and a wavelength of 0.055466 m. The IW mode of the Sentinel-1 satellite provides a scene coverage of approximately 250 km2. This scene is divided into three sub-swaths with the study area located within the IW1 sub-swath. Figure 3 presents the time-baseline distribution and perpendicular baseline for the entire time series. The left chart illustrates secondary image pairs co-registered with the reference image using PSI methodology, while the right chart shows multi-reference image pairs, following the Quasi-PS InSAR methodology [38]. Both charts use a color scale to indicate coherence levels between interferometric pairs.

Figure 3.
The spatial and temporal baseline distribution and interferogram pairs used. In the first image (image on the left), all SAR images were spatially co-registered in the reference image acquired on 13 July 2021. In the second image (image on the right), each image is linked to other images throughout the time series having multi-references.
3.2. InSAR Methods
Our initial approach employed the traditional PSI technique, which was implemented using the SARPROZ software (version 4 July 2023) [39]. The data processing began with step (1): image importation, the application of precise orbital data, and selection of reference (13 July 2021) and secondary images. In this step, all secondary images were co-registered on a sampling grid based on the selected reference images.
Step (2) involved preliminary analysis, including the generation of a reflectivity map and the calculation of the Amplitude Stability Index (ASI). In this step, the Copernicus 30 DGED DEM was utilized, and the ground control point (GCP) was selected. The reflectivity map is calculated as the temporal average of the amplitude across all images in the time series for each pixel. The ASI measures amplitude consistency over time, by calculating both the standard deviation and the mean deviation of amplitude values [40,41].
Step (3) encompassed InSAR processing, focusing on the estimation of coherence and interferograms. Interferometric coherence () is calculated using the following equation:
where is computed over a window centered on each pixel (s, l). The term represents one or more geometrical phase terms that must be removed. A coherence value greater than 0.7 signifies a strong correlation between two images [42].
Step (4) in the MT-InSAR processing involves estimating the contribution of the Atmospheric Phase Screen (APS). Initially, a network of amplitude-stable points is identified using an ASI threshold of >0.7, yielding 8065 points. A redundant network, constructed using Delaunay triangulation, connects nearby points. By minimizing atmospheric phase variation between points, the APS is derived from phase residuals. After APS compensation, the ASI threshold is reduced to 0.6 to increase point density, and both linear velocity and height are estimated.
Upon analyzing the final linear velocity map (Figure 4), significant deformation was observed around the mine area, albeit with sparse point coverage, which was likely due to steep displacement gradients and the low coherence of PS targets. As a result, the main region of the mine did not display points on the deformation velocity map, although deformations were evident in the surrounding areas (Figure 4).
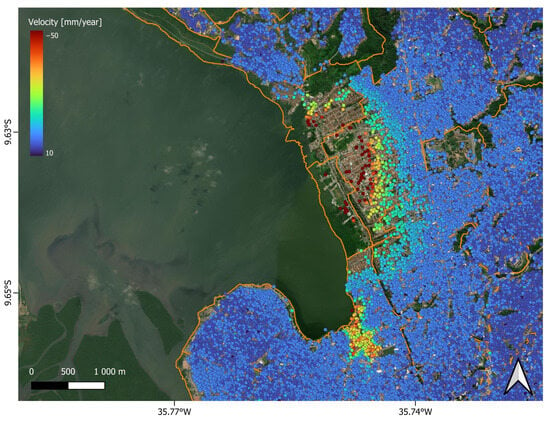
Figure 4.
LOS direction velocity (mm/year) map for each PS point obtained using the traditional PSI approach. Velocity values range from −50 to 10 mm/year, represented by a color scale from red to blue, where red indicates −50 mm/year and blue indicates 10 mm/year. Image background: Bing Aerial Map.
The original PSI method often in cases of high deformation rates, as it assumes a high level of temporal coherence throughout the monitoring period [43]. To address this, a more advanced technique, the Quasi-PS InSAR method, was employed [38,44]. This technique leverages multiple image connections and coherence weights (as shown in Figure 3, right) to estimate velocity and height for distributed targets [45]. The objective of these multiple connections is to utilize all coherent interferograms rather than relying on those generated solely by a single reference image. This approach increases the number of points by densifying the network of monitored targets through the adaptive selection of interferogram subsets [42]. Coherence weighting is also employed in parameter estimation, identifying interferograms with coherent targets, enabling the processing of lower coherence points [38,44,46,47].
Given the higher computational demands of this technique compared to the classical PSI method, we opted to use the “Small Area Processing” module available in SARPROZ for a more focused region. Sparse points with a reflectivity map threshold greater than 0.5 were selected. For the estimation of the velocity and height, coherence weights were applied to interferometric pairs, and the following periodogram was computed with the weight for each interferogram pair i and k [38]:
where the velocity and height of each target were estimated for the normal () and temporal baseline () of i-th and k-th image. The and were linking height to normal baseline and velocity to time. is equal to the number of interferograms, and the weights have values between 0 and 1.
The ability to measure deformation over a given PS depends on the smoothness of the deformation pattern and the density of PS points (higher density is preferable). For phenomena where deformation exceeds half of the radar wavelength per revisit period, SAR amplitude-based techniques complement the PS measurements [48,49,50]. The joint exploitation of both phase and amplitude data is essential, particularly for long-term datasets. Rapid changes exceeding half of the radar wavelength would remain undetected if only phase information is analyzed. Therefore, the analysis also incorporates amplitude time series to assess the lifecycle of radar scattering targets, enabling effective change detection after sudden events.
In our study area, amplitude time series and amplitude change matrices were used to monitor radar signal stability over time, particularly near the mining zones. The amplitude time series reflects the intensity of radar returns over the observation period, while the amplitude change matrix is computed for a window centered on a selected pixel, using the amplitude values of all image pairs, and this is given by the following equation [51,52,53]:
where we calculated the amplitude change of a small window area centered in a pixel and between two SAR images .
By analyzing the amplitude time series and amplitude change matrix, we can also estimate the specific time at which the radar return was lost, indicating the loss of amplitude stability.
4. Results
4.1. PSI Analysis
To analyze ground deformation in the Line-of-Sight (LOS) direction over Maceió, the PSI technique, widely used in urban monitoring, was first employed. The traditional PSI method produced a velocity map in mm/year, as shown in Figure 4. Positive deformation (movement toward the sensor) is indicated in blue, while negative deformation (movement away from the sensor) is shown in red. Due to significant deformation in the area and a loss of temporal coherence, no PS points could be observed in the region of interest. The velocity in the LOS direction ranged from −50 to 10 mm/year. A stable region gradually transitioned to instability as the mining area was approached. Deformation velocities were particularly notable in the Pinheiro, Levada, Bebedouro, and Bom Parto neighborhoods. In the Mutange neighborhood, where the majority of salt wells are located, only a few points were captured with velocities exceeding −50 mm/year.
4.2. QPS-InSAR Analysis
Due to pronounced deformation, coherence was lost between the reference image and those captured at greater temporal distances. The traditional PSI approach, which requires coherent points, failed to detect points in the Mutange neighborhood due to this lack of coherence. To address this, we applied the QPS-InSAR approach. By modifying the number of connections between SAR images and switching to a multi-reference approach, we increased the number of interferograms from 145 to 10,441, as illustrated in Figure 3.
Using the QPS-InSAR method, a total of 23,460 PS points were identified with a point density of 1303 points/km2. Figure 5 illustrates the cumulative displacement of each PS point obtained using the QPS-InSAR approach. A significant increase in point density (by 422%) was observed in the same area. The cumulative displacement of each PS point ranged from −1750 to 10 mm. Large deformations were detected in the Mutange, Pinheiro, Bebedouro, Bom Parto, and Levada neighborhoods. In the Mutange neighborhood, where the majority of salt wells are located, displacements ranged between −1750 and −100 mm. In Pinheiro, a larger area, evident deformation zones were observed with displacement decreasing as distance from the neighborhood center increased. Bebedouro exhibited similar patterns. Farol, Bom Parto, and Levada neighborhoods, being further from the mining zone, showed less pronounced deformation, although the Levada neighborhood still experienced cumulative displacements of up to −200 mm.
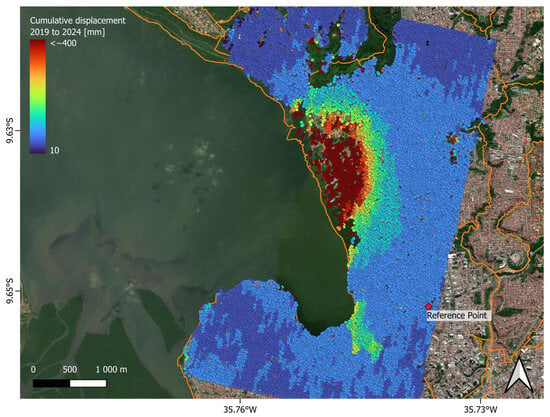
Figure 5.
Cumulative displacement (mm) of each PS point obtained using the QPS-InSAR approach from June 2019 to April 2024. Cumulative displacement values range from less than −400 to 10 mm, represented by a color scale from red to blue, where red indicates values less than −400 mm, which can reach up to −1750 mm, and blue indicating 10 mm. Image background: Bing Aerial Map.
The deformation at the mine site exhibited a radial pattern with higher displacement values near the center of the salt wells and a gradual decrease with distance. Figure 6 shows the cumulative displacement profile from the lagoon (segment A) to the furthest limit of the Pinheiro neighborhood (segment C). The line at segment B marks the boundary between the Mutange and Pinheiro neighborhoods. Deformation tends to approach zero as the distance from the lagoon and the mines increases. The profile from segment A to segment B is non-linear, which is likely due to the presence of several mines in this region, leading to varying deformation rates.
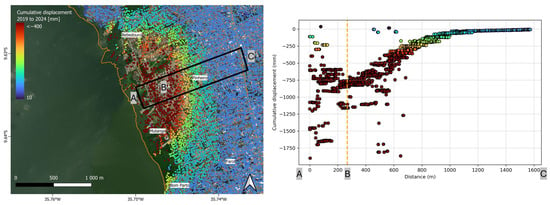
Figure 6.
InSAR cumulative displacement profile from the points within the black box. Segment A is located in the lagoon, segment B marks the boundary between the Muntage and Pinheiro neighborhoods, and segment C is located further from the mining area. Image background: Bing Aerial Map.
To understand how deformation is evolving at each mine, the PS point closest to each mine was selected. For mines 1, 2, 19, 20, 21, 26, 27, 29, 34, and 35, it was not possible to select a point, as some of these mines are located within the Mundaú Lagoon or had no nearby PS points. For the remaining mines, cumulative displacement graphs were plotted over the time series. Linear regression was applied to determine the equation of the line with the slope serving as an indicator of the cumulative displacement rate. Mines were then classified into four categories: very high, high, medium, and low displacement rates. Mines 25 and 33 exhibited very high cumulative displacement. Mines 8, 12, and 18 showed high cumulative displacement, while mines 11, 14, and 24 had the lowest rates. Figure 7 illustrates the time series for the closest point to each mine. Mine 18, for instance, recorded a cumulative displacement of approximately −1200 mm between June 2019 and April 2024. Mines 8, 25, and 33 recorded even greater displacement values at −1423 mm, −1586 mm, and −1718 mm, respectively. These findings suggest that mines 8, 25, and 33 may be at greater risk of collapse or significant deformation, requiring closer monitoring and potential preventive measures. A relationship between the location of mines and their deformation rates was evident with those located closer to the waterline (such as mines 33, 25, 12, 18, and 5) exhibiting greater cumulative displacement compared to those situated further from the lagoon.
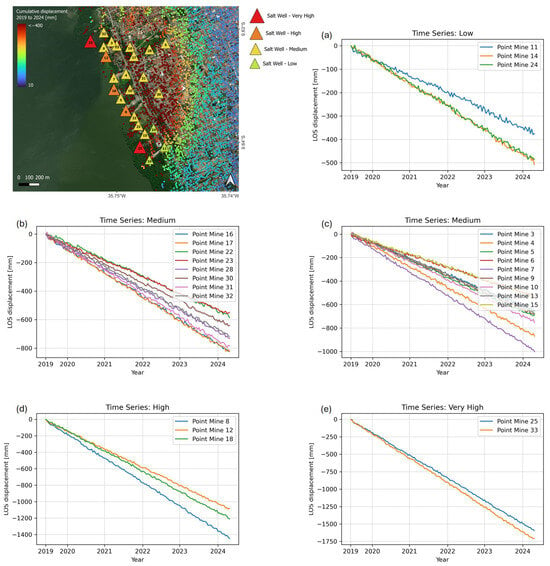
Figure 7.
Time series of the closest point to each mine identified by the number and categorized by deformation class: (a) low, (b,c) medium, (d) high, and (e) very high. Image background: Bing Aerial Map.
4.3. Comparison between the PSI and QSP-InSAR Approach
By analyzing the LOS velocity map obtained through the traditional PSI approach, subsidence was identified in the Levada neighborhood. To validate the QPS-InSAR approach, corresponding points from both the PS and QPS methods were selected, and their cumulative displacements were compared. Figure 8 presents an example of one of these points, where the time series of both methods show similar trends. The cumulative displacement values between June 2019 and April 2024 were also close, at −141.34 mm for the PS point and −139.51 mm for the QPS point. These results demonstrate the reliability and accuracy of the QPS-InSAR method, validating its application in areas where the traditional PS technique may not be effective.
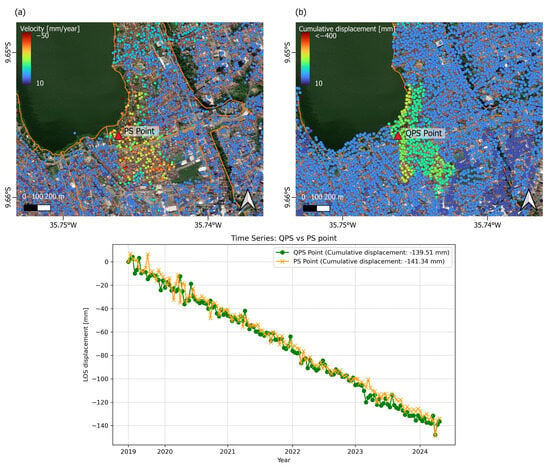
Figure 8.
(a) LOS direction velocity (mm/year) map for each PS point obtained using the traditional PSI approach. (b) Cumulative displacement (mm) of each PS point obtained with the QPS-InSAR approach from June 2019 to April 2024. Image background: Bing Aerial Map.
4.4. Amplitude Analysis
While the phase of the radar signal is useful for detecting deformation, rapid changes can go unnoticed. Therefore, we conducted a detailed deformation analysis for the area surrounding Mine 18 based on amplitude time series. Amplitude time series analysis provides a valuable tool for monitoring regions such as this, particularly during the collapse event of 10 December 2023. Figure 9 shows the spatial distribution of points near Mine 18, where significant deformation occurred, leading to the collapse. Points that lost reflected intensity in 2019 are shaded in blue, while those that lost reflectivity closer to 2024 are shaded in red, following a gradient scale. Analyzing these dates, we found that many points lost their electromagnetic signature near Mine 18 with 17 losing amplitude stability in 2023, 11 of which were in December, coinciding with the mine collapse on 10 December 2023. This clearly indicates that the collapse, at a depth of 1054 m, had a significant impact on the surrounding area.
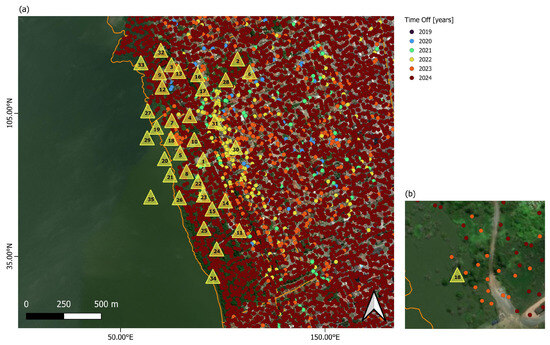
Figure 9.
Time off (years) of points in the mine area (a) and with emphasis on points close to Mine 18 (b). Image background: Bing Aerial Map.
In an amplitude time series, the intensity of the radar return for each pixel is continuously monitored over time, providing a consistent representation of amplitude variations. However, a more detailed spatial understanding of these variations can be achieved through the amplitude change matrix. To assess the impact of the December 2023 event, we selected two points near Mine 18. The first point (Figure 10a) shows a significant decrease in mean amplitude by late November 2023, which was approximately two weeks before the collapse. The amplitude change matrix (Figure 10b) shows notable amplitude changes shortly before and after the collapse. The second point (Figure 10c) recorded a time off on 6 December 2023, four days before the collapse, with a similar decrease in mean amplitude. The amplitude change matrix (Figure 10d) confirms these changes.
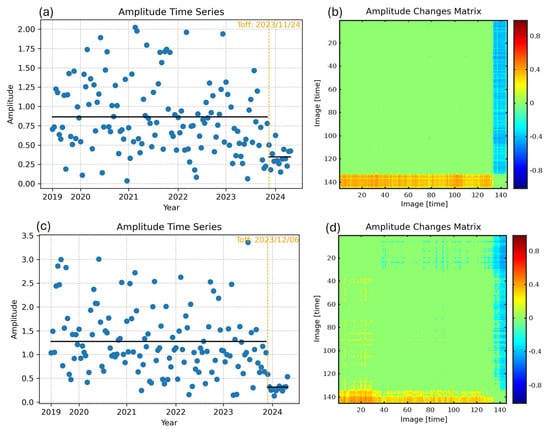
Figure 10.
Amplitude time series (a,c) and amplitude change matrix (b,d) from two points near Mine 18.
The cumulative displacement near Mine 18 reached up to −1200 mm between June 2019 and April 2024. Complementing this with amplitude analysis, a marked acceleration in deformation was observed in the months leading up to the collapse. Since mid-2023, points closest to Mine 18 had lost their electromagnetic signature, indicating increased subsidence and growing instability in the area. These results suggest that the collapse was likely preceded by significant changes underground, which were potentially exacerbated by water infiltration and halite dissolution. Continuous monitoring in subsidence-prone regions is critical, as rapid changes pose severe risks to infrastructure and nearby populations. By integrating deformation data with amplitude time series analysis, we correlated the loss of amplitude stability with surface changes, further confirming the progression of events. This comprehensive analysis of deformation near Mine 18 provides valuable insights into the precursors of collapse and offers broader implications for subsidence monitoring in similar geological environments.
5. Discussion
This study provides a comprehensive analysis of subsidence deformation in Maceió with a particular focus on the collapse of Mine 18 in December 2023. Our results indicate that while traditional PSI methods are effective in many scenarios, they encountered limitations in areas of severe deformation due to the loss of coherence. By contrast, the advanced QPS-InSAR technique provided valuable insights into subsidence processes, increasing the density of detectable points in heavily affected areas.
The findings reveal substantial radial deformation centered around the Mundaú Lagoon with cumulative displacements of up to −1750 mm recorded between June 2019 and April 2024. The study illustrates a continuous and accelerating trend in deformation, particularly in regions near the lagoon, where water infiltration likely exacerbates the dissolution of salt deposits, further intensifying subsidence. The deformation distribution observed aligns with the findings of Vassileva et al. [10], who applied the SBAS technique over a 16-year period and recorded maximum cumulative subsidence of approximately 200 cm near the lagoon. Our QPS-InSAR results closely match these values. Furthermore, this study identified significant subsidence in neighborhoods further from the main mining zones, such as Levada and Bom Parto, where displacements of approximately −200 mm were recorded. This phenomenon aligns with previous studies, such as Euillades et al. [9] who reported localized subsidence in the Mutange, Pinheiro, and Levada neighborhoods with 100 mm of cumulative deformation observed in Levada between 2016 and 2019. The presence of geological faults, which can propagate deformation effects over larger areas, likely explains this finding and suggests that subsidence risks in Maceió may be more widespread than previously thought.
The study offers new insights by capturing the post-collapse deformation dynamics of Mine 18, demonstrating how such events can abruptly increase subsidence risks in nearby areas. To assess the extent of the impact, amplitude time series were analyzed, identifying the moments when targets lost amplitude stability or intensity. A total of 30 points near Mine 18 were identified, 17 of which lost amplitude stability in 2023 with 11 of these occurring in December, just prior to the collapse—representing nearly 37% of the total. This highlights the value of amplitude analysis for detecting areas with steep displacements and significant coherence loss. The amplitude time series for selected pixels near Mine 18 indicated a reduction in mean amplitude from late November to early December 2023. This change was also reflected in the amplitude change matrix, where values fluctuated between 0.3 and 0.4 or −0.3 and −0.4.
The main contribution of this study is the detailed analysis of the deformation evolution linked to a major environmental problem in Alagoas, affecting thousands of residents. Through the QPS-InSAR technique, cumulative displacements from June 2019 to April 2023 were quantified, and points and moments when pixels lost temporal coherence were identified. This method not only improves the density of measurement points but also provides valuable insights into the chronology of instability events, making it essential for accurately monitoring deformation trends. The collapse of Mine 18, which occurred within the study’s timeframe, serves as a critical focal point for understanding the broader implications of mining-induced subsidence. The dramatic increase in deformation following the collapse suggests that such events can have immediate and far-reaching effects, accelerating subsidence and heightening the risk of secondary hazards, such as flooding, especially given the proximity to the Mundaú Lagoon. These findings underscore the need for enhanced risk management strategies in urban areas built over or near significant geological features like salt domes.
6. Conclusions
This study provides significant advancements in understanding subsidence dynamics in Maceió, particularly in relation to mining-induced deformations and the collapse of Mine 18 in December 2023. By employing the QPS-InSAR technique, we were able to overcome the limitations of traditional PSI methods and deliver a more detailed and accurate depiction of subsidence patterns over the critical period from June 2019 to April 2024. The results confirm ongoing and severe subsidence in the Mutange, Pinheiro, and Bebedouro neighborhoods with the highest cumulative displacements recorded near the Mundaú Lagoon. A closer examination of displacement data around each mine revealed a radial pattern with the most significant displacement occurring near the lagoon. Regarding the collapse of Mine 18, 30 points of interest were identified in its immediate vicinity, 11 of which lost amplitude stability in December 2023. The analysis of amplitude time series and the amplitude change matrix demonstrated a clear shift in mean amplitude between late November and early December 2023, serving as a precursor to the collapse.
New insights were also provided into the accelerated deformation observed post-Mine 18 collapse. The detection of significant subsidence in distant neighborhoods such as Levada and Bom Parto suggests that the effects of geological faults and mining activities are more extensive than previously documented. The application of QPS-InSAR demonstrates its efficacy in monitoring complex and severe subsidence scenarios, offering a valuable tool for urban planning and disaster mitigation in geologically vulnerable regions.
Given these findings, continuous monitoring and more robust geological assessments are critical for Maceió. Future research should focus on integrating QPS-InSAR data with ground-based measurements to refine subsidence models and improve predictive capabilities, ultimately contributing to safer urban environments in areas affected by subsidence.
Author Contributions
Conceptualization, A.C.T., M.B. and J.J.S.; methodology, A.C.T., M.B. and J.J.S.; software, A.C.T., M.B. and D.P.; validation, A.C.T., M.B. and J.J.S.; formal analysis, M.B. and A.C.T.; investigation, A.C.T. and M.B.; resources, J.J.S.; data curation, A.C.T. and M.B.; writing—original draft preparation, A.C.T.; writing—review and editing, A.C.T., M.B., D.P. and J.J.S.; visualization, A.C.T. and M.B.; supervision, D.P. and J.J.S.; project administration, J.J.S.; funding acquisition, J.J.S. All authors have read and agreed to the published version of the manuscript.
Funding
Ana Cláudia Teixeira acknowledges the financial support provided by national funds through the FCT—Portuguese Foundation for Science and Technology (PRT/BD/154871/2023). This research was supported by grant No. 024PU-4/2023, funded by the Cultural and Education Grant Agency of The Ministry of Education, Science, Research and Sport of the Slovak Republic (KEGA).
Data Availability Statement
Data will be made available on request.
Acknowledgments
Sentinel-1 data were provided by ESA under the free, full, and open data policy adopted for the Copernicus program. This study was support of ESA-MOST China Dragon-6 program (grant number 95369). Data were processed by SARPROZ© using MATLAB® and Google Maps™. During the preparation of this work, the authors used ChatGPT to enhance the clarity and polish the language of certain sections in the manuscript. After using these tools, the authors reviewed and edited the content as needed and take full responsibility for the content of the publication.
Conflicts of Interest
Author M.B. was employed by the company insar.sk Ltd. Author D.P. was employed by the company RASER Limited. The remaining authors declare that the research was conducted in the absence of any commercial or financial relationships that could be construed as a potential conflict of interest. The funders had no role in the design of the study; in the collection, analyses, or interpretation of data; in the writing of the manuscript; or in the decision to publish the results.
Abbreviations
The following abbreviations are used in this manuscript:
| APS | Atmospheric Phase Screen |
| ASI | Amplitude Stability Index |
| DEM | Digital Elevation Model |
| GCP | Ground Control Point |
| InSAR | Interferometric Synthetic Aperture Radar |
| IW | Interferometric Wide Swath |
| LOS | Line-of Sight |
| MT-InSAR | Multi-Temporal InSAR |
| PS | Persistent Scatterer |
| PSI | Persistent Scatterer Interferometry |
| QPS-InSAR | Quasi-PS InSAR |
| SAR | Synthetic Aperture Radar |
| SBAS | Small Baseline Subsets |
| SLC | Single Look Complex |
References
- Solari, L.; Montalti, R.; Barra, A.; Monserrat, O.; Bianchini, S.; Crosetto, M. Multi-temporal satellite interferometry for fast-motion detection: An application to salt solution mining. Remote Sens. 2020, 12, 3919. [Google Scholar] [CrossRef]
- Florencio, C.P. Geologia dos Evaporitos Paripueira na Sub-Bacia de Maceió, Alagoas Região do Brasil. Ph.D. Thesis, Universidae de São Paulo—Insituto de geociêNcias, São Paulo, Brazil, 2001. [Google Scholar]
- Zhang, G.; Wang, Z.; Zhang, K.; Li, Y.; Yu, W.; Chen, Y.; Zhang, H. Collapse mechanism of the overlying strata above a salt cavern by solution mining with double-well convection. Environ. Earth Sci. 2018, 77, 588. [Google Scholar] [CrossRef]
- Liu, W.; Bingwu, W.; Yinping, L.; Yl, W.; Chunhe, Y.; Jie, C. The collapse mechanism of water solution salt mine caverns and the comprehensive measures of protection, treatment and application. Int. J. Earth Sci. Eng. 2014, 7, 1295–1304. [Google Scholar]
- Zhang, G.; Wang, Z.; Wang, L.; Chen, Y.; Yu, W.; Ma, D.; Zhang, K. Mechanism of collapse sinkholes induced by solution mining of salt formations and measures for prediction and prevention. Bull. Eng. Geol. Environ. 2017, 78, 1401–1415. [Google Scholar] [CrossRef]
- Andrei, A. The Ocnele Mari salt mine collapsing sinkhole—A NATECH breakdown in the Romanian sub-carpathians. Carpathian J. Earth Environ. Sci. 2011, 6, 215–220. [Google Scholar]
- Contrucci, I.; Klein, E.; Cao, N.; Daupley, X.; Bigarré, P. Multi-parameter monitoring of a solution mining cavern collapse: First insight of precursors. Comptes Rendus. Géosci. 2011, 343, 1–10. [Google Scholar] [CrossRef]
- Serviço Geológico do Brasil—CPRM. Estudos Sobre a Instabilidade do Terreno nos Bairros Pinheiro, Mutange e Bebedouro, Maceió (AL)—Relatório Síntese dos Resultados nº1; Technical Report; Ministério de Minas e Energia, Secretaria de Geologia, Mineração e Transformação Mineral: Brasília, Brazil, 2019.
- Euillades, P.A.; Euillades, L.; Rosell, P.; Roa, Y.L.B. Subsidence in Maceio, Brazil, characterized by dinsar and inverse modeling. In Proceedings of the 2020 IEEE Latin American GRSS & ISPRS Remote Sensing Conference (LAGIRS), Santiago, Chile, 22–26 March 2020. [Google Scholar] [CrossRef]
- Vassileva, M.; Al-Halbouni, D.; Motagh, M.; Walter, T.R.; Dahm, T.; Wetzel, H. A decade-long silent ground subsidence hazard culminating in a metropolitan disaster in Maceió, Brazil. Sci. Rep. 2021, 11, 7704. [Google Scholar] [CrossRef]
- Alves, S.D.C.; Krueger, C.P.; Dalazoana, R.; Polidori, L. Employment of free packages for mt-insar approaches to verify the subsidence event over Maceió City, Brazil. Anuário Inst. GeociêNcias 2023, 46, 56709. [Google Scholar] [CrossRef]
- Hartwig, M.E.; Gama, F.F.; da Silva, J.L.; Jofré, G.C.; Mura, J.C. The significance of geological structures on the subsidence phenomenon at the maceió salt dissolution field (Brazil). Acta Geotech. 2023, 18, 5551–5573. [Google Scholar] [CrossRef]
- Taylor, K.; Ghuman, P.; McCardle, A. Operational mine monitoring with insar. In Proceedings of the First Asia Pacific Slope Stability in Mining Conference, Perth, Australia, 6–8 September 2016. [Google Scholar] [CrossRef]
- Colesanti, C.; Wasowski, J. Investigating landslides with space-borne Synthetic Aperture Radar (SAR) interferometry. Eng. Geol. 2006, 88, 173–199. [Google Scholar] [CrossRef]
- Czikhardt, R.; Papco, J.; Bakon, M.; Liscak, P.; Ondrejka, P.; Zlocha, M. Ground Stability Monitoring of Undermined and Landslide Prone Areas by Means of Sentinel-1 Multi-Temporal InSAR, Case Study from Slovakia. Geosciences 2017, 7, 87. [Google Scholar] [CrossRef]
- Lü, Z.; Zhang, J.; Zhang, Y.; Dzurisin, D. Monitoring and characterizing natural hazards with satellite insar imagery. Ann. GIS 2010, 16, 55–66. [Google Scholar] [CrossRef]
- Liu, J.; Ma, F.; Li, G.; Guo, J.; Yang, W.L.; Song, Y. Evolution assessment of mining subsidence characteristics using sbas and ps interferometry in sanshandao gold mine, china. Remote Sens. 2022, 14, 290. [Google Scholar] [CrossRef]
- Pukanska, K.; Bartos, K.; Bakon, M.; Papco, J.; Kubica, L.; Barlak, J.; Rovnak, M.; Ksenak, L.; Zelenakova, M.; Savchyn, I.; et al. Multi-sensor and multi-temporal approach in monitoring of deformation zone with permanent monitoring solution and management of environmental changes: A case study of solotvyno salt mine, Ukraine. Front. Earth Sci. 2023, 11, 1167672. [Google Scholar] [CrossRef]
- Eker, R.; Aydın, A.; Görüm, T. Tracking deformation velocity via psi and sbas as a sign of landslide failure: An open-pit mine-induced landslide in himmetoğlu (Bolu, Nw Turkey). Nat. Hazards 2024, 120, 7701–7724. [Google Scholar] [CrossRef]
- Molan, Y.E.; Lohman, R.B.; Pritchard, M.E. Ground displacements in ny using persistent scatterer interferometric synthetic aperture radar and comparison of x- and c-band data. Remote Sens. 2023, 15, 1815. [Google Scholar] [CrossRef]
- Wang, L.; Yang, L.; Wang, W.; Chen, B.; Sun, X. Monitoring mining activities using sentinel-1a insar coherence in open-pit coal mines. Remote Sens. 2021, 13, 4485. [Google Scholar] [CrossRef]
- Ferretti, A.; Monti-Guarnieri, A.; Prati, C.; Rocca, F.; Massonet, D. InSAR Principles—Guidelines for SAR Interferometry Processing and Interpretation. ESA Train. Man. 2007, 19. [Google Scholar]
- Hooper, A.; Segall, P.; Zebker, H.A. Persistent scatterer interferometric synthetic aperture radar for crustal deformation analysis, with application to volcán alcedo, Galápagos. J. Geophys. Res. Solid Earth 2007, 112. [Google Scholar] [CrossRef]
- Ferretti, A.; Prati, C.; Rocca, F. Permanent scatterers in SAR interferometry. IEEE Trans. Geosci. Remote Sens. 2001, 39, 8–20. [Google Scholar] [CrossRef]
- Barnhart, W.D.; Lohman, R.B. Characterizing and estimating noise in insar and insar time series with modis. Geochem. Geophys. Geosyst. 2013, 14, 4121–4132. [Google Scholar] [CrossRef]
- Sousa, J.J.; Hooper, A.; Hanssen, R.F.; Bastos, L.; Ruiz, A.M. Persistent scatterer insar: A comparison of methodologies based on a model of temporal deformation vs. spatial correlation selection criteria. Remote Sens. Environ. 2011, 115, 2652–2663. [Google Scholar] [CrossRef]
- Kampes, B.M. Radar Interferometry: Persistent Scatterer Technique; Springer: Dordrecht, The Netherlands, 2006. [Google Scholar]
- Costantini, E.; Falco, S.D.; Malvarosa, F.; Minati, F.; Trillo, F. Method of persistent scatterer pairs (psp) and high resolution sar interferometry. In Proceedings of the 2009 IEEE International Geoscience and Remote Sensing Symposium, Cape Town, South Africa, 12–17 July 2009. [Google Scholar] [CrossRef]
- Kuhlmann, L.; Chiba, B.; Moreira, D.; Jesus, D.; Moraes, J.; Maia, M.; Pfaltzgraff, P. Estudos Sobre a Instabilidade do Terreno nos Bairros Pinheiro, Mutange e Bebedouro, Maceió (AL)—Relatório Técnico: B. Leavantamento Interferométrico; Technical Report; Ministério de Minas e Energia, Secretaria de Geologia, Mineração e Transformação Mineral: Rio de Janeiro, Brazil, 2019.
- Serviço Geológico do Brasil—CPRM. Geologia, tectôNica e Recursos Minerais do Brasil: Texto, Mapas e SIG; Ministério de Minas e Energia—Secretaria de Minas e Metalurgia: Brasília, Brazil, 2003.
- Carneiro, C. Sal: Geologia e Tectônica. Exemplos nas Bacias Brasileiras. Terrae Didat. 2015, 4, 90. [Google Scholar] [CrossRef]
- Milani, E.; Araújo, L. Recursos Minerais Energéticos: Petróleo; Ministério de Minas e Energia—Secretaria de Minas e Metalurgia: Rio de Janeiro, Brazil, 2003.
- Freitas, V.; Silveira, R. Bacia de Sergipe-Alagoas—Terra; Technical report; Superintendência de Definição de Blocos: Rio de Janeiro, Brazil, 2017.
- Mendes, V.; Lima, M.; Morais, D.; Brito, M. Geologia e Recursos Minerais do Estado de Alagoas; Technical report; Ministério de Minas e Energia—Secretaria de Minas e Metalurgia: Recife, Brazil, 2017.
- Xing, X.; Zhang, T.; Zhu, J.; Shi, J.; Cai, J.; Zheng, G.; Lei, M. Quantitative prediction for deformation and brine extraction in salt solution mining based on water-solution kinetic (wsk) insar model. IEEE J. Sel. Top. Appl. Earth Obs. Remote Sens. 2024, 17, 7655–7673. [Google Scholar] [CrossRef]
- Martinez, J.P.; Johnson, K.M.; Neal, J. Sinkholes in evaporite rocks. Am. Sci. 1998, 86, 38. [Google Scholar] [CrossRef]
- Metwally, H.; Salman, S.; El-Shamy, A. A review on extraction processes of salts from different salt lakes and their environmental impact in industry. Lett. Appl. NanoBioSci. 2021, 11, 4016–4039. [Google Scholar] [CrossRef]
- Perissin, D.; Wang, T. Repeat-Pass SAR Interferometry With Partially Coherent Targets. IEEE Trans. Geosci. Remote Sens. 2012, 50, 271–280. [Google Scholar] [CrossRef]
- Perissin, D. SARproZ Software. Official Product Web Page. 2024. Available online: http://www.sarproz.com/ (accessed on 10 July 2024).
- Bakoň, M.; Papčo, J.; Perissin, D.; Sousa, J.J.; Lázecký, M. Multi-sensor insar deformation monitoring over urban area of Bratislava (Slovakia). Procedia Comput. Sci. 2016, 100, 1127–1134. [Google Scholar] [CrossRef][Green Version]
- Dang, V.K.; Nguyen, T.D.; Dao, N.H.; Duong, T.L.; Dinh, X.V.; Weber, C. Land subsidence induced by underground coal mining at quang ninh, vietnam: Persistent scatterer interferometric synthetic aperture radar observation using sentinel-1 data. Int. J. Remote Sens. 2021, 42, 3563–3582. [Google Scholar] [CrossRef]
- Perissin, D. Interferometric sar multitemporal processing: Techniques and applications. Remote Sens. Digit. Image Process. 2016, 20, 145–176. [Google Scholar] [CrossRef]
- Wegmuller, U.; Walter, D.; Spreckels, V. Nonuniform Ground Motion Monitoring With TerraSAR-X Persistent Scatterer Interferometry. IEEE Trans. Geosci. Remote Sens. 2010, 48, 895–904. [Google Scholar] [CrossRef]
- Gao, M.; Gong, H.; Li, X.; Chen, B.; Zhou, C.; Shi, M.; Lin, G.; Chen, Z.; Ni, Z.; Duan, G. Land subsidence and ground fissures in beijing capital international airport (bcia): Evidence from quasi-ps insar analysis. Remote Sens. 2019, 11, 1466. [Google Scholar] [CrossRef]
- Esfahany, S.S. Exploitation of Distributed Scatterers in Synthetic Aperture Radar Interferometry. Ph.D. Thesis, TU Delft, Delft, The Netherlands, 2017. [Google Scholar]
- Tao, L.; Zhang, H.; Wang, C.; Tang, Y. Ground Deformation Retrieval Using Quasi Coherent Targets DInSAR, With Application to Suburban Area of Tianjin, China. IEEE J. Sel. Top. Appl. Earth Obs. Remote Sens. 2012, 5, 867–873. [Google Scholar] [CrossRef]
- Perissin, D.; Wang, T. Time-Series InSAR Applications Over Urban Areas in China. IEEE J. Sel. Top. Appl. Earth Obs. Remote Sens. 2011, 4, 92–100. [Google Scholar] [CrossRef]
- Kim, J.; Kim, D.; Kim, S.; Won, J.; Moon, W.M. Monitoring of Urban land surface subsidence using PSInSAR. Geosci. J. 2007, 11, 59–73. [Google Scholar] [CrossRef]
- Crosetto, M.; Monserrat, O.; Cuevas-González, M.; Devanthéry, N.; Crippa, B. Persistent Scatterer Interferometry: A review. ISPRS J. Photogramm. Remote Sens. 2016, 115, 78–89. [Google Scholar] [CrossRef]
- Casu, F.; Manconi, A.; Pepe, A.; Lanari, R. Deformation Time-Series Generation in Areas Characterized by Large Displacement Dynamics: The SAR Amplitude Pixel-Offset SBAS Technique. IEEE Trans. Geosci. Remote Sens. 2011, 49, 2752–2763. [Google Scholar] [CrossRef]
- Ling, L.; Perissin, D.; Qin, Y. Change detection with spaceborne insar technique in Hong Kong. In Proceedings of the 2013 IEEE International Geoscience and Remote Sensing Symposium—IGARSS, Melbourne, VIC, Australia, 21–26 July 2013. [Google Scholar] [CrossRef]
- Lê, T.T.; Froger, J.; Baghdadi, N.; Minh, D.H.T. Volcanic eruption monitoring using coherence change detection matrix. In Proceedings of the IGARSS 2020—2020 IEEE International Geoscience and Remote Sensing Symposium, Waikoloa, HI, USA, 26 September–2 October 2020. [Google Scholar] [CrossRef]
- Lê, T.T.; Froger, J.; Hrysiewicz, A.; Paris, R. Coherence change analysis for multipass insar images based on the change detection matrix. In Proceedings of the IGARSS 2019—2019 IEEE International Geoscience and Remote Sensing Symposium, Yokohama, Japan, 28 July–2 August 2019. [Google Scholar] [CrossRef]
Disclaimer/Publisher’s Note: The statements, opinions and data contained in all publications are solely those of the individual author(s) and contributor(s) and not of MDPI and/or the editor(s). MDPI and/or the editor(s) disclaim responsibility for any injury to people or property resulting from any ideas, methods, instructions or products referred to in the content. |
© 2024 by the authors. Licensee MDPI, Basel, Switzerland. This article is an open access article distributed under the terms and conditions of the Creative Commons Attribution (CC BY) license (https://creativecommons.org/licenses/by/4.0/).